bonner directors 2016 - national assessment of service and community engagement
TRANSCRIPT

National Assessment of Service and Community Engagement
Key NASCE Findings and Implications for Institutions of Higher Education
April A. Backus
Associate Director, NASCE
Siena College Research Institute
November 2016
Bonner Directors’ and Coordinators’

• Background/Development
• Methodology
• Findings
Agenda• Institutional Structures and Culture
• Case Study
• Institutional example

Siena Research Institute
Academically-situated public opinion polling institute in New York State
• 48 station call center
• Social, cultural, economic, and political surveys
• Quantitative & Qualitative Research

Belief that community engagement is essential to undergraduate education
Lack of substantive data on community engagement in higher education
Disconnect between institutional mission and civic action
Authors saw need for community engagement measurement
Quantitative analysis of student-reported service behavior/attitudes
NASCE Background
Don Levy, Ph.D.Director, Siena College Research Institute (SRI)
Mathew Johnson, Ph.D.Director, Brown University Swearer
Center for Public Service

Fostering learning that engages students, faculty, staff, alumni, and the greater community.
…strives to embody the vision and values of St. Francis of Assisi: faith in a personal and provident God, reverence for all creation, affirmation of the unique worth of each person, delight in diversity, appreciation for beauty, service with the poor and marginalized, a community where members work together in friendship and respect, and commitment to building a world that is more just, peaceable, and humane.
The university’s research, scholarship, and creative activities expand knowledge, contribute significantly to economic development, and help improve the quality of life in the local community, Georgia, the nation, and the world.
…students, faculty, and staff engage with local, state, regional, national, and international communities to improve those communities and the university.
emphasizes excellence in teaching, scholarship, research and community engagement responsive to the needs of the region and the state.
Mission Statements
Through research and community service, we actively seek to take advantage of and to improve the unique physical and human environment in which the College is located.
This mission is anchored by four cornerstones: excellence, equity, community and service.

• Web-based survey of undergraduates
NASCE Overview
• Current comparative dataset of more than 57,000+ students from 80+ institutions
• Measures the rate, frequency, and depth of student community engagement across 9 areas of human need.
• Assesses student perceptions of, motivations for, and obstacles to community service
• Identifies primary avenues through which students serve
• Gauges student attitudes towards institutional service promotion

Participating Colleges and Universities
Through Spring 2016 80+ distinct schools across 26 states
57,000+ undergraduates
800 - 32,000 undergraduates
Total n for study ͌
Institution Size Range
Institution Demographics16 public schools9 schools with over 10k undergrad14 religiously affiliated schools 28 Bonner Schools

Students individually take survey online and individual data is recorded by SRI.
Over the course of 12 days, 4 email invitations are sent in total. The first is sent to all students; follow-ups are sent to non-respondents.
NASCE Methodology
SRI uses individual student email addresses to send survey invitations to all undergraduates.
Survey is customized to each school. Survey is voluntary, confidential, and anonymous.
Deliverables include Final Report, Data Frequencies, Data Cross Tabulations and raw data file without individual identifiers.

1. “DO YOU SERVE?”
Please consider the community service in which you have or are engaged. Remember, by community service we mean the following: any activity, including internships and work study, in which you participate with the goal of providing,
generating and/or sustaining help for individuals and groups who have unmet human needs in areas like shelter, health, nutrition, education, and opportunity.
Do you engage in community service here at XYZ?
NASCE Instrument - Rate

Homelessness Hunger/Nutrition Religious service
Environmental
Health/Fitness Civic Participation
Youth Elder Care Economic Opportunity
“In which of the following types of service have you participated while here at XYZ?”
NASCE Instrument – 9 Areas of Need
“IN WHICH AREAS?”

NASCE Instrument - Frequency
For each of the community service activity types that you checked, how often would you say you did that type of service? Would you say….
Once or twice a year
Several times during the year
About once a month
Several times a month
About once a week
More than once a week
2. “HOW OFTEN DO YOU SERVE?”
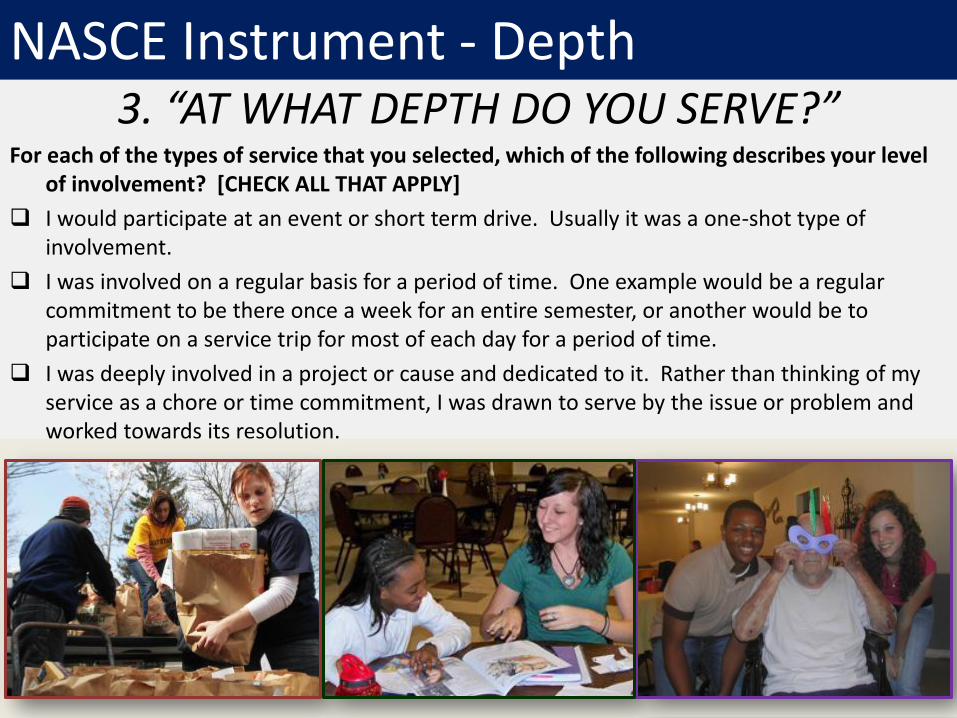
3. “AT WHAT DEPTH DO YOU SERVE?”For each of the types of service that you selected, which of the following describes your level
of involvement? [CHECK ALL THAT APPLY]
I would participate at an event or short term drive. Usually it was a one-shot type of involvement.
I was involved on a regular basis for a period of time. One example would be a regular commitment to be there once a week for an entire semester, or another would be to participate on a service trip for most of each day for a period of time.
I was deeply involved in a project or cause and dedicated to it. Rather than thinking of my service as a chore or time commitment, I was drawn to serve by the issue or problem and worked towards its resolution.
NASCE Instrument - Depth

The NASCE computes the POP Score by assigning values
to those students who perform service in each area:
• Engaged in any of the nine areas. o Yes (1)o No (0)
• Frequency. o Once or twice a year (1)o Several times a year or once a month (2)o Several times a month (3)o Weekly or more (4)
• Depth. o An event or drive; one-shot (1)o Regular basis for a period of time or a service trip (2)o Deeply involved and dedicated to a project or cause (3).
Percent of the Possible (POP) Scores

Frequency1 2 3 4
Depth1 2 3
ServiceYes = 1No = 0
x
x
= POP Score
Max = 12(per area)
Computing the POP Score

An individual’s responses are multiplied to create area level individual scores ranging from 0-12. These totals are summed across the institution and divided by the maximum score.
(Service * Frequency * max(Depth))n*12
The area level scores are averaged to create the institutional percent of the possible. Both institutional and area scores are then normalized with .33 equaling a POP Score of 100.
POP Score Formula

POP Score Scale
41+
Pervasive
• Pervasive: Service and culture are synonymous. Most students are engaged in service at meaningful levels of depth and frequency across the 9 need areas. Service is engrained in the student experience.
31-40
Integrated
• Integrated: Service is a focal point of your institution's culture. Students serve frequently and deeply across several areas of need, and maintain substantive connections with service programs campus-wide.
21-30
Established
• Established: Service is a significant component of your culture, but potential for greater contribution exists. Full integration of community engagement requires campus-wide reflection and a greater commitment to deep service.
11-20
Evolving
• Evolving: Service is prevalent but uneven. Variations in student participation, frequency, and depth between the 9 areas present opportunities for improvement. Data and the POP scores identify areas of opportunity.
0-10
Emerging
• Emerging: Service is not a main component of your culture, only taking place intermittently. Service is performed at low levels, primarily taking the form of "one-shot" activities. To enhance service contribution, data points the way.
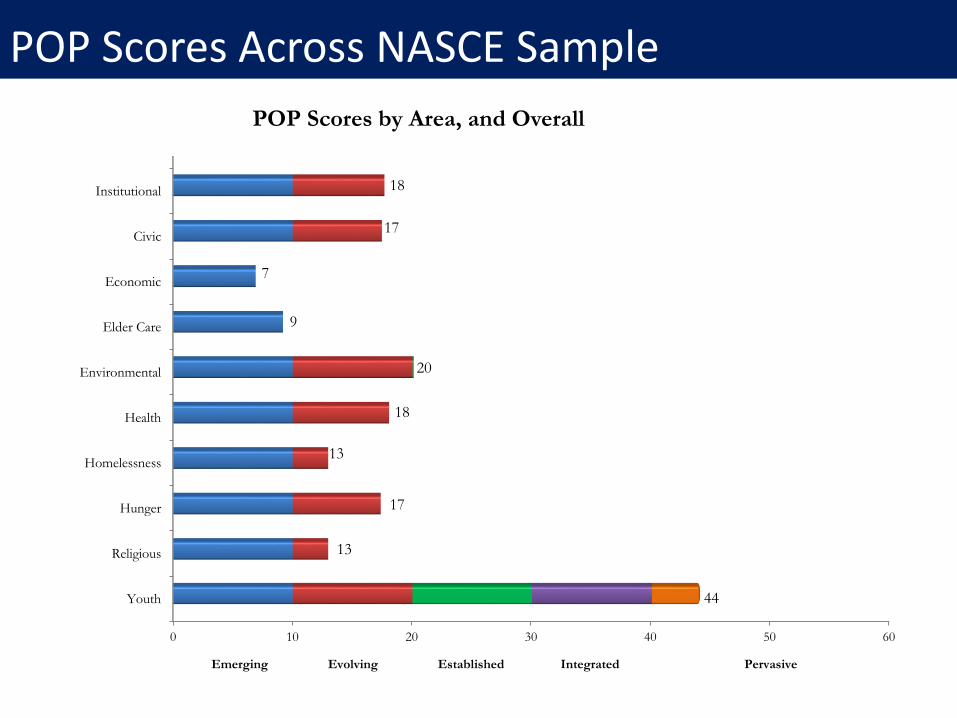
POP Scores Across NASCE Sample
0 10 20 30 40 50 60
Institutional
Civic
Economic
Elder Care
Environmental
Health
Homelessness
Hunger
Religious
Youth
Emerging Evolving Established Integrated
POP Scores by Area, and Overall
17
9
18
13
17
13
44
18
20
7
Pervasive

Institutional POP Scores – Frequencies
0
5
10
15
20
25
30
35
40
45
Emerging (0-10) Evolving (11-20) Established (21-30) Integrated (31-40) Pervasive (41-100)
Fre
qu
en
cy
Institutional POP Score
Institutional POP Scores for all NASCE Schools
9%10%
42%
1%
38%

NASCE Sample – Overall
Yes52%
No48%
Do you participate in community service here at Xyz?
Civic11%
Elder Care6%
Health11%
Hunger11%
Religion8%
Youth28%
Econ4%
Total Service by Needs Area
Environment
17%
Homelessness 6%
0%
5%
10%
15%
20%
25%
30%
Lessthan 5
Between5-9
Between10-19
Between20-29
30 ormore
23%
17%
10%
4% 3%
How many hours per month do you engage in community service?
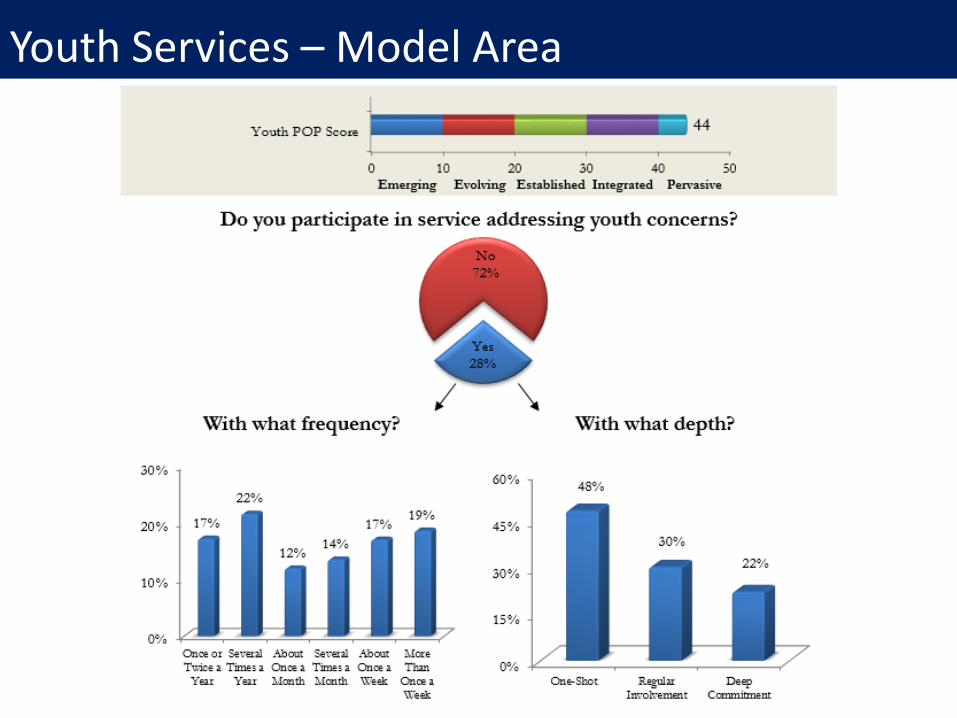
Youth POP Score/freq/depthYouth Services – Model Area

Homelessness – low freq/depthHomelessness – Low rate, frequency, and depth

Health – higher rateCivic Participation – Low rate & frequency, mid depth

Religious – Low rate, high frequency and mid depth

School Comparisons
Variables School A School B School C
Institutional POP 52 28 13
Hunger POP 60 26 13
Homelessness POP 41 25 8
Religious POP 26 7 8
Environmental POP 42 32 11
Civic POP 46 21 15
Health POP 38 35 25
Youth POP 151 66 18
Elder POP 9 9 5
Participated in Service In College 87% 67% 34%
Drop off From HighSchool 9 20 47
Structure/Culture
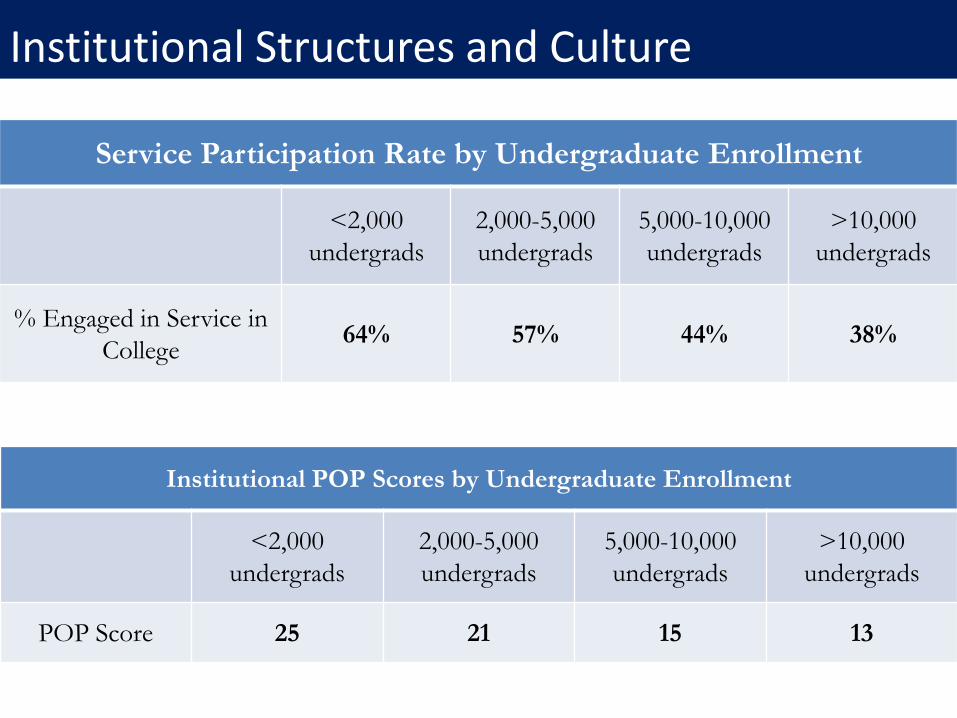
Service Participation Rate by Undergraduate Enrollment
<2,000
undergrads
2,000-5,000
undergrads
5,000-10,000
undergrads
>10,000
undergrads
% Engaged in Service in
College64% 57% 44% 38%
Institutional POP Scores by Undergraduate Enrollment
<2,000
undergrads
2,000-5,000
undergrads
5,000-10,000
undergrads
>10,000
undergrads
POP Score 25 21 15 13
Institutional Structures and Culture

Across the entire sample, 52% of college students participate in community service, a drop of 35 percentage points from high school.
CollegeHigh School
Institutional Structures and Culture
The percentage of students performing service and the institutional POP scores often decrease drastically from high school to college
Potential factors:
Less structure and organization
Decreased promotion of activities
Fewer requirements
Campus culture
Other activities, including studying and social events, take up more time
The total Institutional POP drops 18 points from high school to college

Structure/Culture
0% 10% 20% 30% 40% 50% 60% 70% 80% 90% 100%
I don't want to feel guilty
Because my friends do it
It is important to my faith
I have been required to
It is important to have on my record
I meet people through participating
I want to change the world
I want to gain experience/insight
It makes me feel good about myself
It is the right thing to do
I believe I can help people in need
Motivations for Service
Strongly Agree Agree
96%
95%
93%
92%
83%
82%
60%
59%
50%
76%
24%
Institutional Structures and Culture

Structure/CultureInstitutional Structures and Culture
0% 10% 20% 30% 40% 50% 60% 70% 80%
Previous bad experience- DoPrevious bad experience- Don't
Not interested- DoNot interested- Don't
It makes me uncomfortable- DoIt makes me uncomfortable- Don't
What I would like to do is not available- DoWhat I would like to do is not available- Don't
I'm too busy with friends- DoI'm too busy with friends- Don't
Lack of transportation- DoLack of transportation- Don't
Don't know what opportunities are available- DoDon't know what opportunities are available- Don't
I have to work- DoI have to work- Don't
Too busy with schoolwork- DoToo busy with schoolwork- Don't
Obstacles to Service
Strongly Agree Agree

Institutional Structures and Culture
0% 10% 20% 30% 40% 50% 60% 70% 80%
Campus Newspaper
Organizational Fair
Social Media like Facebook
Through a club
In a class
Flyers
Word of mouth
Campus emails
22%
31%
45%
53%
58%
64%
66%
71%
How have you heard about service opportunities available here at XYZ?

Strongly Agree20%
Agree52%
Disagree24%
Strongly Disagree
4%
I think the college does an appropriate job of informing students of all the ways they can be engaged in the community.
Strongly Agree27%
Agree56%
Disagree15% Strongly
Disagree2%
Overall, I would say that XYZpromotes community service among the student body.
Strongly Agree16%
Agree43%
Disagree35%
Strongly Disagree
6%
Overall, I am satisfied with my personal level of involvement in community service here at XYZ.
Yes50%
No50%
Over the past month, have you been asked by a fellow student, staff, or faculty member at your college to volunteer for any organization or cause in your community?
Institutional Service Promotion
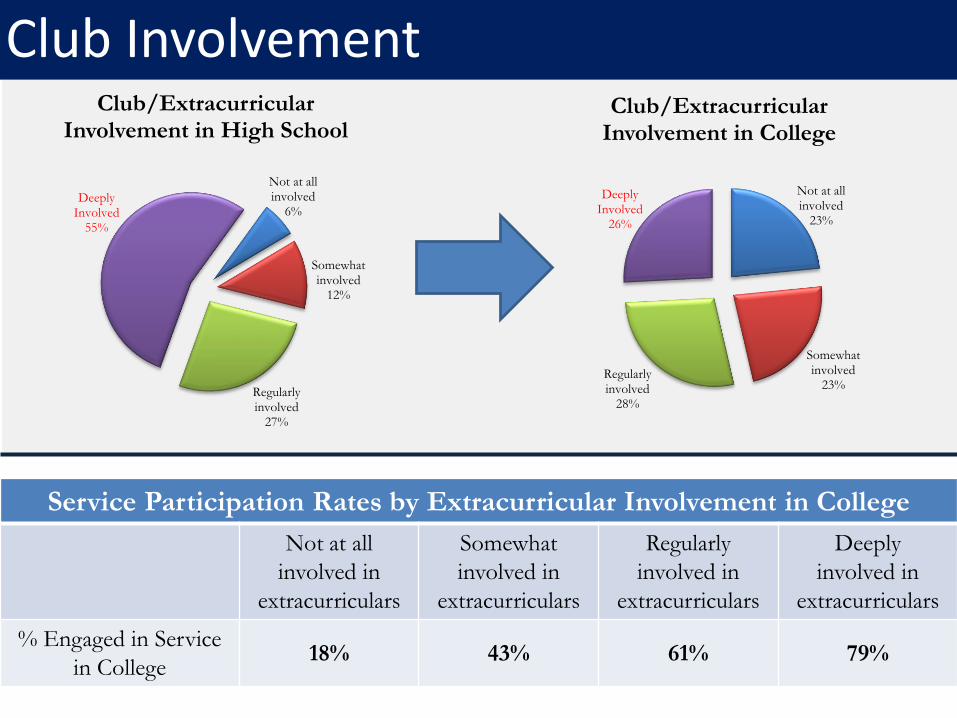
Club Involvement
Not at all involved
6%
Somewhat involved
12%
Regularly involved
27%
Deeply Involved
55%
Club/Extracurricular Involvement in High School
Not at all involved
23%
Somewhat involved
23%Regularly involved
28%
Deeply Involved
26%
Club/Extracurricular Involvement in College
Service Participation Rates by Extracurricular Involvement in College
Not at all
involved in
extracurriculars
Somewhat
involved in
extracurriculars
Regularly
involved in
extracurriculars
Deeply
involved in
extracurriculars
% Engaged in Service
in College18% 43% 61% 79%

Service-Learning
Yes31%
No69%
[Of those who serve] Have you participated in a service-learning course here at XYZ?
55%
24%
21%
[If took SL course] How many service learning courses have you taken?
1
2
3 or more
Which of the following components did your service-learning course include?(students who took more than one SL course were asked to base their responses on the one that was the most rewarding) Yes No
Intermittent community service project(s) that seemed to lack integration into the course's objectives 41% 59%
Organized community service that enhanced the meaning of course texts and lectures 74% 26%
A community-based research project in which you participated perhaps in collaboration with a
community partner to identify a community problem and work towards its resolution59% 41%
Adequate reflection time, that is, time to research, analyze, write about, and discuss the service projects
in order to better understand the service in terms of both its relationship to the community and to your
personal development
77% 23%

Faculty Survey – 3 Institutions 2015-2016Institution Example
% of Faculty/Staff/Administrators reporting service during their past 2 years at XYZ: 68%
% of Students at same institution reporting service at XYZ (NASCE data): 53%
23
32
18
13
30
13
30
20
25
26
0 10 20 30 40 50
Institutional
Civic
Economic
Elder Care
Environmental
Health
Homelessness
Hunger
Religious
Youth
Emerging Evolving Established Integrated Pervasive
Faculty/Staff/ Administrator POP Scores at Pilot Institution
(n=119)
0 10 20 30 40 50
Institutional
Civic
Economic
Elder Care
Environmental
Health
Homelessness
Hunger
Religious
Youth
Emerging Evolving Established Integrated Pervasive
Student POP Scores at Pilot Institution(n=318)
14
18
18
17
9
21
7
27
3
7

Using NASCE to Enhance Community Engagement
Developmental Pathway
NASCE Data
Strategic Plan
Move students along “service continuum”
Increase service involvement,
frequency, and depth

Institutional Case StudyFrom Disengaged to Engaged

2009 Data
HS Participation Rate: 93%College Participation Rate: 49%
POP Scores
Institutional: 14Civic: 14
Elder Care: 3Environmental: 9
Health: 21Homelessness: 14
Hunger: 10Religious: 9Youth: 32
Economic: --
2013 Data
HS Participation Rate: 93%College Participation Rate: 64%
POP Scores
Institutional: 26Civic: 28
Elder Care: 7Environmental: 17
Health: 30Homelessness: 26
Hunger: 25Religious: 15
Youth: 73Economic: 13
Institutional Case Study

• Established Central Engagement Office
• Developed Large Bonner Program
• Institutionalized Service-Learning– Community Engaged First-Year Seminar
– Certificate in Community Development
– Interdepartmental Collaborations
• Increased Service Programs/Opportunities
• Increased Service Staff/Administrators
Institutional Case StudyThe How and Why:

Institutional Case StudyIncrease in Participation Campus-WideStudents participating in service: 2009 2013
As part of a student group 33% 48%
As part of a course 14% 36%
In a service they sought by themselves 20% 30%
In service opportunities offered by other college entities
20% 34%
As a member of a sports team 11% 16%
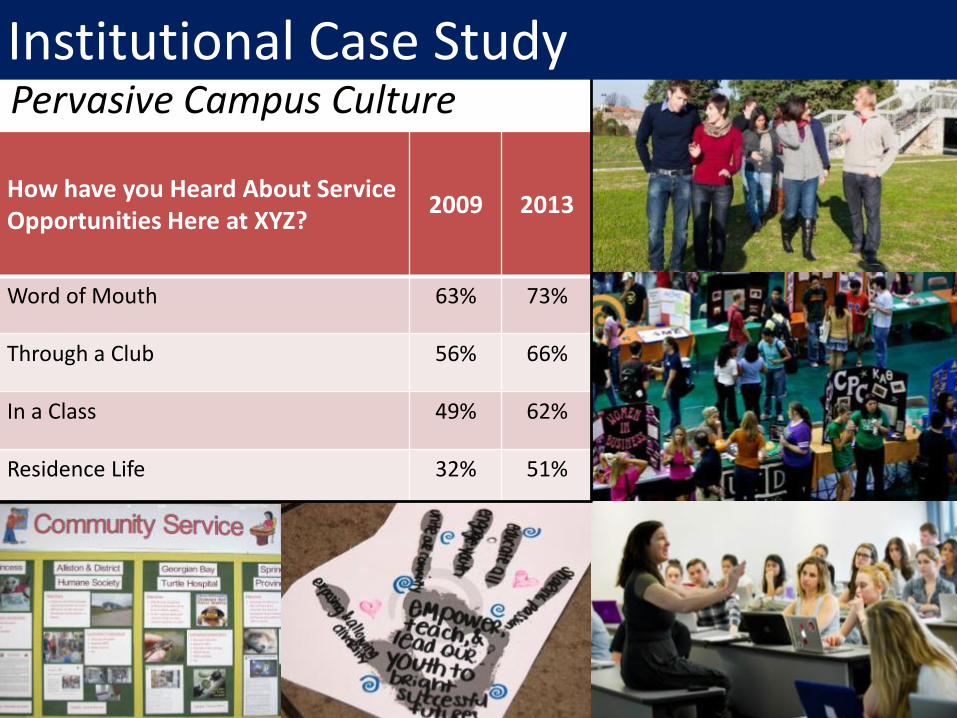
How have you Heard About Service Opportunities Here at XYZ?
2009 2013
Word of Mouth 63% 73%
Through a Club 56% 66%
In a Class 49% 62%
Residence Life 32% 51%
Pervasive Campus Culture
Institutional Case Study

Institutional Case StudyIncrease in Frequency and Depth
Of all students who serve: In the area of Youth:
Percentage serving more than 20 hours per month increased from 9% in 2009 to 29% in 2013.
Students serving 10 hours or less per month decreased from 75% in 2009 to 53% in 2013.
Percentage of students serving with a “deep commitment” increased from 26% in 2009 to 51% in 2013.
Students serving once a month or less decreased from 63% in 2009 to 37% in 2013

Results Recommendations - Action Items1. Develop and maintain institutional structures that engage
in and promote service among students. The data indicates that students are more likely to serve and continue service as part of an organized effort. Purchased the Service Umbrella to OrgSync to
provide a platform for students to search for volunteer opportunities, create volunteer opportunities, and log and reflect on community service hours. Students in 2013-14 logged 30,000 hours of service through OrgSync.
Partnered with Residential Life to train Resident Assistants on how to create programs focused around community engagement.
The Student Athletic Association now has an incentive program for each athletic team to participate in service projects.
The Greek Service Initiative has been created, which focuses on deepening the level of service in the Greek Community.
2. Students at Stetson report serving significantly more during secondary school. Programs to address and shorten the gap between High School and Collegiate service can help foster the culture of continuing service within Stetson’s campus. Developed a program during Hatter Saturday and
Orientation to get more students engaged in the community earlier during their time at Stetson and have increased marketing efforts around OrgSync.
CCE Staff presented in First Year Seminars educating students on how to incorporate service into their course work and every day life.
3. Service on college campuses is dominated by traditional “one-shot” events. By focusing on continuing service, Stetson can move away from a sporadic model of service. Encouraging frequent service with students integrated into community partners generates continuing partnerships. Significantly increased student service leadership
programs including Bonner, AmeriCorps, and Community Organizers.
Reduced the amount of Into the Streets events and has focused on marketing events that community partners are already doing.
Put more resources towards Youth programs, because we have a lot of students participating in service around that focus area.
4. Students report serving significantly more in their courses at Stetson than they did in High School. Enhancing community engaged learning on Stetson’s campus will get more students engaged in a deeper level of service. Distributed a survey amongst all faculty to assess
the current level of service learning that is taking place in courses at Stetson University.
Increased number of courses that count towards the Certificate of Community Engagement.
Applied and received the Florida Campus Compact STEM Service Learning Day Institute grant, providing training around service learning for faculty in the STEM field.
Stetson hosted training in the Summer for FSEM/JSEM Faculty to incorporate community engaged learning into their curriculum.
5. Utilize the ASCE Report and POP Scores to strategically impact service at Stetson Developed a Strategic Plan utilizing the data from
the ASCE to map out our strategic initiatives.
Introduction
In Spring 2010, the Center for Community Engagement undertook the Assessment of Service and Civic Engagement (ASCE) in order to better understand the student service on Stetson’s campus. 484 students participated in the survey, representing 22% of Stetson University’s total enrollment. Since the survey has taken place the Center for Community Engagement has moved forward with initiatives to increase students depth and frequency of service.
Implementation of Survey
The ASCE is run through The Siena College Research Institute (SRI) with support from the Corporation for National and Community Service Learn and Serve Program, the Bonner Foundation, and Stetson University.
Stetson University distributed three emails with a link to the web-based survey through the Stetson Announce Email System that went out to all students over a ten day period.
Previous research indicates that students who perform service are more likely to participate in surveys addressing service. The inclination to participate among students who serve implies an overestimation of service by the ASCE due to its reliance on voluntary participation.
Summary of ASCE Results
56% of Stetson University students report participating in some type of service while in college, a decline of 23% points from High School levels. Measured via the ASCE-unique POP score (POP combines service, frequency, and depth into one score), Stetson demonstrated high service addressing youth, moderate service addressing health, civic, and environmental issues, and low service focused throughout the other areas of service.
Students cite studying demands, other activities and jobs as the most significant obstacles to engaging in more service. Among those that do perform service, most say they serve because they believe they can help those in need and it makes them feel good about themselves. Overall, a majority of students (70%) are satisfied with their personal level of service and agree that the college promotes service (98%) and does a good job at informing the student body of opportunities (94%).
POP Scores are created by combining participation, frequency, and depth in service activities.
Students at Stetson perform service at a low-moderate rate. Overall, 56% are engaged in community service of some kind while 44% do no community service of any kind.
Stetson demonstrated high service addressing youth, moderate service addressing health, civic and environmental issues, and low service focused throughout the other four measured areas of service.
Stetson students are most engaged in service that benefits community youth and environmental concerns.
About 46% of Stetson’s service contribution is performed by 10% of Stetson’s student body.
Students that participated in service in high school said they did a good amount of service through individual projects and student organizations and very little through their courses.
Student groups and dedicated service organizations generate the highest rate of community participation.
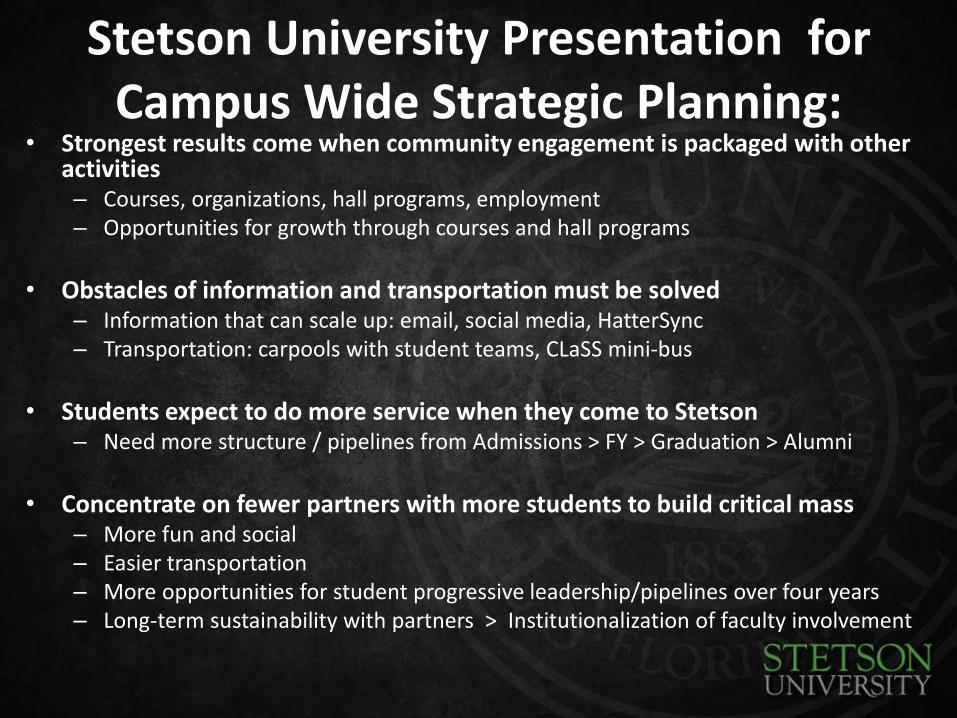
Stetson University Presentation for Campus Wide Strategic Planning:
• Strongest results come when community engagement is packaged with other activities– Courses, organizations, hall programs, employment– Opportunities for growth through courses and hall programs
• Obstacles of information and transportation must be solved– Information that can scale up: email, social media, HatterSync– Transportation: carpools with student teams, CLaSS mini-bus
• Students expect to do more service when they come to Stetson– Need more structure / pipelines from Admissions > FY > Graduation > Alumni
• Concentrate on fewer partners with more students to build critical mass– More fun and social– Easier transportation– More opportunities for student progressive leadership/pipelines over four years– Long-term sustainability with partners > Institutionalization of faculty involvement
NASCE Final Analysis
April A. BackusAssociate Director, NASCE
Siena College Research [email protected]
518-782-6997
www.siena.edu/sri/nasce
Thank You!