bofa ml plenary presentation q1 2012 vfinal
TRANSCRIPT

Telenet being fast, mobile, secure and free
Renaat Berckmoes, CFO
Bank of America Merrill Lynch –Global Telecom & Media Conference
London - May 30, 2012

Safe Harbor DisclaimerSafe Harbor Disclaimer
Safe Harbor Statement under the Private Securities Litigation Reform Act of 1995.
Various statements contained in this document constitute “forward-looking statements” as that term is definedunder the U.S. Private Securities Litigation Reform Act of 1995. Words like “believe,” “anticipate,” “should,”“intend,” “plan,” “will,” “expects,” “estimates,” “projects,” “positioned,” “strategy,” and similar expressionsidentify these forward-looking statements related to our financial and operational outlook, dividend policy andfuture growth prospects, which involve known and unknown risks, uncertainties and other factors that may causeg p p , , your actual results, performance or achievements or industry results to be materially different from thosecontemplated, projected, forecasted, estimated or budgeted whether expressed or implied, by these forward-looking statements. These factors include: potential adverse developments with respect to our liquidity or resultsof operations; potential adverse competitive, economic or regulatory developments; our significant debtpayments and other contractual commitments; our ability to fund and execute our business plan; our ability to
h ff d b d h fl h fgenerate cash sufficient to service our debt; interest rate and currency exchange rate fluctuations; the impact ofnew business opportunities requiring significant up-front investments; our ability to attract and retain customersand increase our overall market penetration; our ability to compete against other communications and contentdistribution businesses; our ability to maintain contracts that are critical to our operations; our ability to respondadequately to technological developments; our ability to develop and maintain back-up for our critical systems;our ability to continue to design networks install facilities obtain and maintain any required governmentalour ability to continue to design networks, install facilities, obtain and maintain any required governmentallicenses or approvals and finance construction and development, in a timely manner at reasonable costs and onsatisfactory terms and conditions; our ability to have an impact upon, or to respond effectively to, new ormodified laws or regulations, pending debt exchange transactions, our ability to make value-accretiveinvestments, and our ability to sustain or increase shareholder distributions in future periods. We assume noobligation to update these forward-looking statements contained herein to reflect actual results, changes ing p g , gassumptions or changes in factors affecting these statements.
Adjusted EBITDA and Free Cash Flow are non-GAAP measures as contemplated by the U.S. Securities andExchange Commission’s Regulation G. For related definitions and reconciliations, see the Investor Relationssection of the Liberty Global Inc website (http://www lgi com) Liberty Global Inc is our controlling
2
section of the Liberty Global, Inc. website (http://www.lgi.com). Liberty Global, Inc. is our controllingshareholder.

AgendaAgenda
Who we are1
Our strategy2
Q1 2012 highlights3
Future growth drivers4 Future growth drivers4
3

Our core beliefsOur core beliefs
Follow the customer not the cable
Attack yourself
4
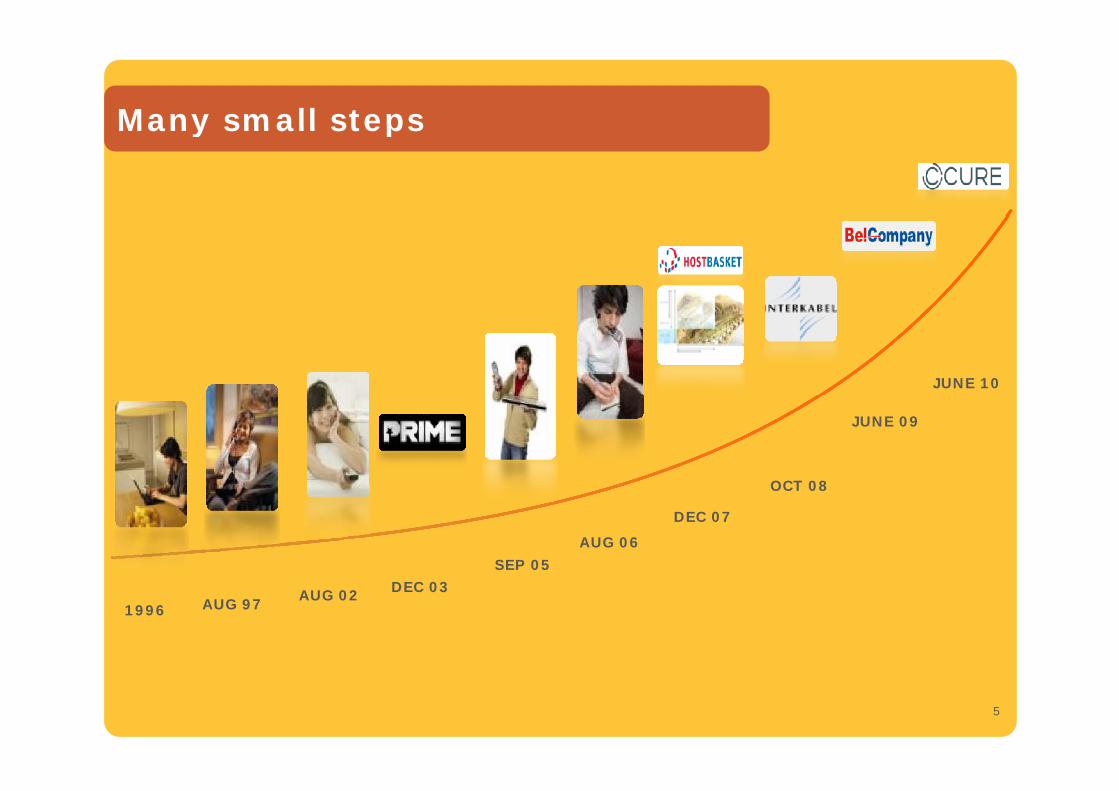
Many small stepsMany small steps
JUNE 10
OCT 08
JUNE 09
DEC 07
OCT 08
SEP 05AUG 06
AUG 971996DEC 03AUG 02
5

Active in a region with national gcharacteristics
+ 1/3rd of Brussels
Legacy Telenet NetworkInterkabel Network = acquired Oct 1, 2008
Flanders is a cohesive footprint Our franchise area covers 2.9 million Flanders is a cohesive footprint
… a focused, regional government
… a regional culture and language
Our franchise area covers 2.9 million households (61% of Belgium)
2.8 million homes passed with cable = 98% reach
… a regional media environment
… a strong and growing economy
… superior GDP per capita (23% above
98% reach
2.2 million unique customers= 77% cable penetration
In B2B we cover the whole of Belgium
6
p p p (EU average)
In B2B, we cover the whole of Belgium and Luxembourg

A strong national competitor gversus regional cable systems
Former telco incumbent is half state- Fragmented cable industry versus Former telco incumbent is half stateowned
>80% VDSL coverage
Fragmented cable industry versus nationwide DSL and mobile operators
All cable networks are adjacent
Numéricable active in part of Brussels Belgacom TV is top 3 IPTV platform
Fixed and mobile convergence
Numéricable active in part of Brussels (approx. 180,000 homes passed)
VOO active in Wallonia(approx 1 7 million homes passed)
More than 75% market share in B2B(approx. 1.7 million homes passed)
7

Leading the cable space in terms of g(multi-) product penetration
Digital TVDigital TV FixedTelephony
FixedTelephony
32% penetration
49% penetration
BroadbandInternet
BroadbandInternet Mobile
TelephonyMobile
Telephony47%
BasicCable TV
BasicCable TV
77% penetration
penetration
p
Penetration rates relate to total homes passed by the Telenet network 8

But still a challengerBut still a challenger
9

Cable networkCable network
our origin and destination
CABLE TVBROADBANDINTERNETDIGITAL
TV
FIXEDTELEPHONY
MOBILETELEPHONY
10

Beyond our network…Beyond our network…
Focus on:
Our products Our service Our brand
11

Constant innovationConstant innovation
InternetInternet Fibernet – 100 Mbps
Digital TVDigital TV Sporting, Search & Recommend, GUI
Fixed TelephonyFixed Telephony FreePhone Mobile
MobileMobile Subsidies, Homespots and innovative ff
MobileMobiletariffs
BusinessBusiness A-Desk12

Customer centricity
We measure our Customer Loyalty Score
Customer centricity
Satisfied?Satisfied? SalesSales
Recommend?Recommend? InstallationInstallation
Buy again?Buy again? ProductProduct
Brand?Brand? CareCareBrand?Brand?
Price?Price?
CareCare
BillingBillingPrice?Price? BillingBilling13

And reward accordingly
TOP-150
And reward accordingly
Customer Loyalty
TOP 150
15%
Managerial
Operational
gskills43%
Operational and financial performance
44%
CC
2007-2009 As of 2010
Customer satisfactionCustomer
satisfactionCustomer loyaltyCustomer loyalty
14

AgendaAgenda
Who we are1
Our strategy2
Q1 2012 highlights3
Future growth drivers4 Future growth drivers4
15

Delivering a superior service gexperience to our customers
A unique service experience360° Experience A unique service experiencefor our customers
TelevisionInternet
Speed leadershipthrough Fibernet
OTT market
TelevisionInternet
Platform
Richest experience & convergence
Bundles
Maximize ARPU perunique customer
16

Cable caters for unparalleled pservice experience
Bandwidth shared over all services
Bandwidth shared over all services
Maximum download speed
# Product – April 2012
1 Telenet Fibernet 100
2 Telenet Fibernet 60
Dedicated bandwidth per
Maximum download speed up to 30 Mbps 3 Telenet Fibernet
4 VOO A La Folie
5 Telenet Comfortnetservice
Maximum download speedup to 100 Mbps
6 VOO Passionément
7 EDPnet Newer & Faster
8 Dommel CityConnecty
9 Belgacom Favorite
10 Belgacom Intense
Video and multiple devices will make high broadband speeds relevant
Added value of cable = simultaneous services into the house
17
New devices (tablet PCs) will require ample streaming capacitySource: www.ispmonitor.be
The ISP Monitor Speed Test is an independent source for bandwidth speed comparison. The results shown above are a summary of the test results gathered by the users of the ISP Monitor software.

Deeper fiberization to retain speed leadership position
TODAY
Telenet Service Offering
~1,400homes/
node
Optical N d
Fiberloops
Node
2015
CMTSIP Backbone
~500homes/
nodeOptical Nodes
18FiberCoax HFC (Hybrid Fiber Coax Network)

Enhancing customer valueEnhancing customer value
Customer mix Q1 2012 (in %)
Customer mix Q1 2011 (in %)
ARPU per customer type (in €/month)(in %)
33%
(in %)
53.5
72.9type (in €/month)
+63%
35%
28%
37%40%
27%
33%44.8 12.8
Actual 1P 2P 3P
Single-play Dual-play Triple-playSingle-play Dual-play Triple-play
(in 000) (in €/month)Triple-play subscribers
+10%
(in 000)ARPU per unique customer
+10%
(in €/month)
735
806
40.644.8
19Q1 2011 Q1 2012 Q1 2011 Q1 2012

AgendaAgenda
Who we are1
Our strategy2
Q1 2012 highlights3
Future growth drivers4 Future growth drivers4
20
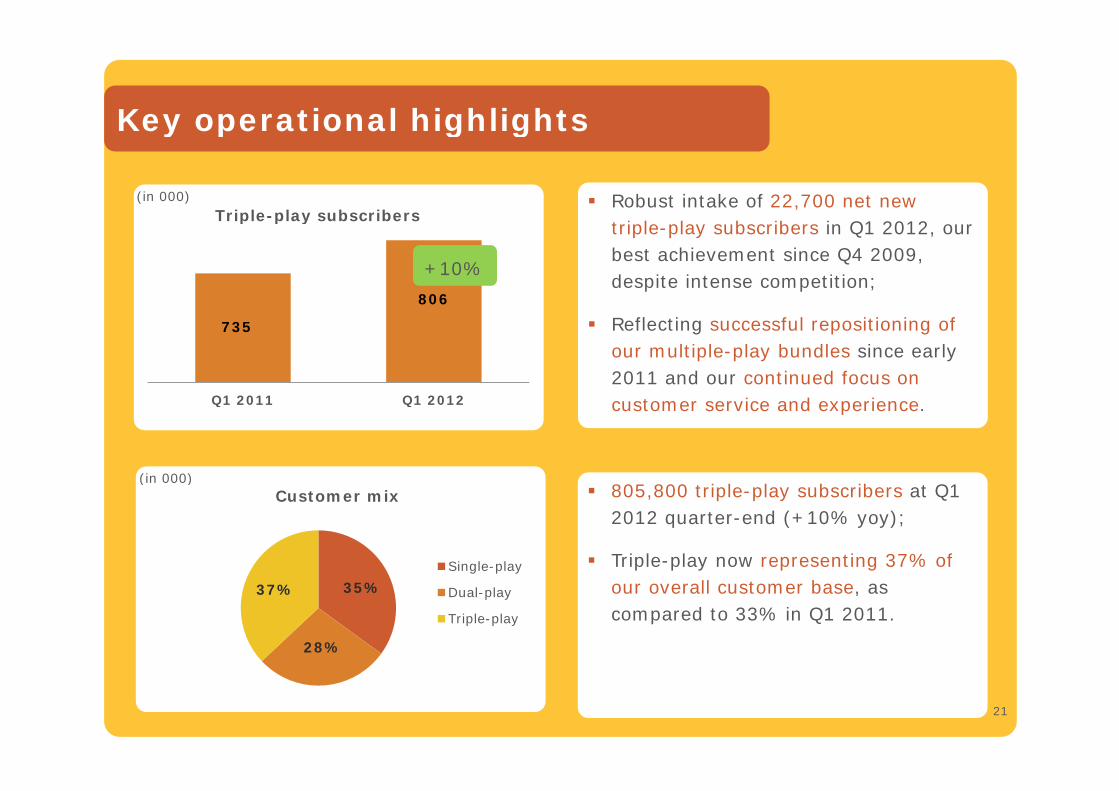
Key operational highlightsKey operational highlights
Triple-play subscribers(in 000) Robust intake of 22,700 net new
806
Triple-play subscribers
+10%
triple-play subscribers in Q1 2012, our best achievement since Q4 2009, despite intense competition;
735
Q1 2011 Q1 2012
Reflecting successful repositioning of our multiple-play bundles since early 2011 and our continued focus on
Q1 2011 Q1 2012
(in 000)805 800 t i l l b ib t Q1
customer service and experience.
Customer mix
Single-play
( ) 805,800 triple-play subscribers at Q1
2012 quarter-end (+10% yoy);
Triple-play now representing 37% of 35%
28%
37% Dual-play
Triple-play
our overall customer base, as compared to 33% in Q1 2011.
21

Key operational highlightsKey operational highlights
Digital TV subscribers (in 000) 45,400 net new subscribers to our
Digital TV subscribers
+14%
higher ARPU interactive digital TV platform;
This reflects attractive positioning of
1,2291,401
Q1 2011 Q1 2012
p gour product in terms of convenience and pricing;
64% of cable TV customers on digital;Q1 2011 Q1 2012
(in €/month)10% t €44 8 th b l t
64% of cable TV customers on digital;
ARPU per unique customer
+10%
( ) +10% yoy to €44.8, the absolute yoy
increase of €4.2 was our best result since Q4 2009;
40.644.8 Higher share of multiple-play, digital
TV, Fibernet subscribers in our overall customer base. Accretive contribution from Sporting Telenet and selective
22
Q1 2011 Q1 2012from Sporting Telenet and selective inflation-based price increases.

Key financial highlightsKey financial highlights
Revenue
% of revenue
(in €m) Revenue of €364.0 million, +10% yoy;
364 0
Revenue
+10%
Excluding revenue from the sale of handsets and set-top boxes, our underlying revenue was up 8% yoy;
331.6
364.0
Q1 2011 Q1 2012
y g p y y;
Our revenue growth rate will be higher in H1 2012 given contribution from selective price increases and Sporting Q1 2011 Q1 2012 selective price increases and Sporting Telenet since Q3 2011.
(in €m) Adjusted EBITDA up 11% yoy to Adjusted EBITDA
+11%
( ) Adjusted EBITDA up 11% yoy to €192.6 million, margin of 52.9%.
Excluding the release of certain prior b l d l
174.2
192.6year bonus accruals, our underlying Adjusted EBITDA grew 9% yoy;
As with our revenue, our Adjusted
2352.5% 52.9%
Q1 2011 Q1 2012 EBITDA growth rate will be higher in H1 2012.

Key financial highlightsKey financial highlights% of revenue
Accrued capital expenditures(in €m) Accrued capital expenditures of €78.6
78.6
Accrued capital expenditures
+39%
million, equivalent to 22% of revenue;
The yoy increase was driven by phasing of set-top rentals, higher
56.7
78.6
Q1 2011 Q1 2012
phasing of set top rentals, higher Fibernet migrations and accelerated spending on our node-splitting project Pulsar.
(in €m) F C h Fl f €55 0 illi
17.1% 21.6%
Q1 2011 Q1 2012
Free Cash Flow(in €m) Free Cash Flow of €55.0 million;
Impacted by final cash payment on the Belgian broadcasting rights for the
85.5
55.0
-36%current season and unfavorable working capital movements;
We expect the unfavorable trends in
24
Q1 2011 Q1 2012
pour working capital to unwind in the remainder of the year.

Accrued capital expendituresAccrued capital expendituresUp 39% yoy on higher set-top box rentals and Pulsar
Accrued capital (in €m)A d i l
17 9
Accrued capital expenditures
(in €m)
6
78.6
Accrued capital expenditures Q1 2012
19 9 20.2 13.6
20.117.9
17.956.726%
26%26%
23%
5.1 20.4
19.9
Q1 2011 Q1 2012
Set-top box Customer install
26%
Set-top box Customer install
77% scalable
Accrued capital expenditures of €78.6 million, or 22% of revenue;
pNetwork growth Other
pNetwork growth Other
Increase driven by higher set-box capital expenditures driven by robust digital TV net additions and ahead of analog channel reshuffling in April;
€16.2 million increase in network-related investments, reflecting the
25
, gaccelerated implementation of our node-splitting project Pulsar.

Debt profileDebt profile
L i (1)N t T t l D bt/EBITDA (*)
Net Total Debt/EBITDA leverage of 3.1x on March 31, 2012(in €m)
5
66.25x 6.0x
Leverage ratio (1)Net Total Debt/EBITDA (*)
L 3 5 4 5
Debt profile (committed)(in €m)
1
2
3
4
3.1x
Leverage target 3.5-4.5x
500300
400
431
799
158
0
1
Q1 09 Q3 09 Q1 10 Q3 10 Q1 11 Q3 11 Q1 12
Senior Credit Facility EBITDA Covenant
100300
175
2012 2013 2014 2015 2016 2017 2018 2019 2020 2021
TL M TL N TL O TL P TL Q TL R TL T Revolver
(in €m)
50 0
Availability of committed Senior Credit Facility
2,580.6158.0
74.050.0
DrawnRevolverTL Q2 (**)
(*) Calculated as per Senior Credit Facility definition, using net total debt, excluding subordinated shareholder loans, capitalized elements of indebtedness under the clientele and annuity fees and any other finance leases, divided by last two quarters’ annualized EBITDA.
(**) Available to be drawn on August 31, 2012.
TL R2 (**)
26

Timing of wholesale of cable services g
N lE
Court of appeal expected to rule on suspension in second half of June 2012
Not to scale
max 3weeks4 months (**) 6 months6 months
European Commission
notification RO and retail‐minus
negotiationsContract
negotiations
3weeks( )
Approval ofreference offer
ImplementationPreparation & submission draft
reference offer
15/4/201322/5/201231/1/20121/08/2011 1/09/2011 1/12/2012 21/12/20121/8/20121/6/2012
Court of Appeal :introduction of Possible
Annual review by VRM
(*) I i ld t b t d t T l t T l t ld i dditi l d dit l t d t t IT i t t
Possible suspension(*)
suspension and annulment
Possible annulment at the earliest
Launch date
27
(*) In case suspension would not be granted to Telenet, Telenet could incur additional accrued expenditures related to preparatory IT investmentsfor wholesale.
(**) Due to the delayed decision on the suspension , initially expected by 26/4/2012, the envisaged 4 months period for approval of the referenceoffer may be extended which could subsequently affect the start of the 6 months implementation timing.

AgendaAgenda
Who we are1
Our strategy2
Q1 2012 highlights3
Future growth drivers4 Future growth drivers4
28

Future growth drivers
1 2Broadband penetration TV subscribers
Future growth drivers
Inter-Inter- Digital Digital 95%
Flanders
+19%36%
TV subscribers
netnet TVTV80%
2011 2015 (Est)
64%
36% Digital
Analog
43
2011 2015 (Est)
Mobile SIMs per Business growth
B2BB2BM bilM bil
11%
Mobile SIMs per cable customer
Telenet Mobile
Business growthopportunities
Legacy business SmallBizzB2BB2BMobileMobile
89%
Mobile
Other mobile provider
HostingSecurity
Cloud Video services
Bizz
MLE
29
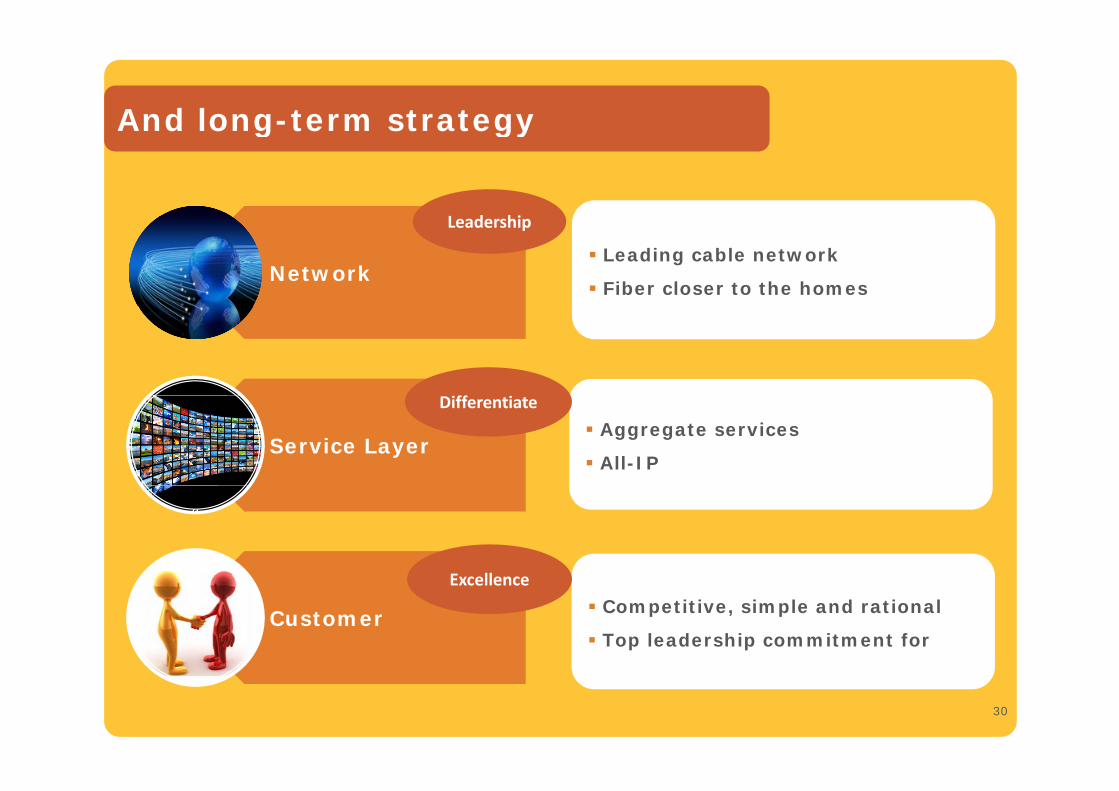
And long-term strategy
L d hi
And long term strategy
Network Leading cable network
Fiber closer to the homes
Leadership
ff
Service Layer Aggregate services
All-IP
Differentiate
E ll
Customer Competitive, simple and rational
Top leadership commitment for
Excellence
30

FY 2012 outlook reconfirmedFY 2012 outlook reconfirmedGrowth in H1 2012 will be higher relative to H2 2012
Revenue growth
FY 2012 outlook
5% – 6% More customers on multiple-play – more discounts Further digitalization of TV customer baseRevenue growth
dj d
(~€1,445m – €1,459m)
5% 6%
Growth from mobile and B2B More competition and potential economic impact
Further optimization of processesAdjusted EBITDA
growth5% – 6%
(~€760m – €767m)
Ongoing efficiency gains in fixed business operations to level off higher share of lower-margin mobile operations
Customer installations and set-top boxesAccrued
Capital Expenditures (1)22% – 23%
(~€318m – €335m)
Customer installations and set-top boxes Cruising speed of node splitting project execution IT preparatory investments for wholesale (if no
suspension)
S lid d t i bl F C h Fl ti
Free Cash Flow (2) Stable
Solid and sustainable Free Cash Flow generation despite higher cash payments for Belgian football rights and higher cash interest payments
Headroom for potential opportunistic refinancing operations
(1) Represents accrued capital expenditures. Accrued capital expenditures are defined as additions to property, equipment and intangible assets, including additions from capital leases and other financing arrangements, as reported in the Company’s statement of financial position on an accrued basis.
(2) Free Cash Flow is currently defined as net cash provided by the operating activities of Telenet’s continuing operations less purchases of property and equipment and purchases of intangibles of its continuing operations, each as reported in the Company’s consolidated statement of cash flows. The upfront annual cash payments related to the mobile spectrum will be reflected in Telenet’s cash flow used in financing activities and hence these payments will not affect Telenet’s Free Cash Flow as currently defined.
31

Shareholder remuneration outlineShareholder remuneration outline
Stable leverage target = recurring shareholder
CONCEPTUAL
Stable leverage target = recurring shareholder remuneration
Additionalleverage
Leverage ongrowingEBITDA
3.5x –4.5x
EBITDA growth
leverage EBITDA +
Free Cash Flowgeneration
=
EBITDA
RecurringFree Cash
Flow
Long-termshareholder
remuneration –in absence of in absence of
M&A
32In absence of M&A and/or significant changes in our business model.

Shareholder return FY 2012Shareholder return FY 2012
Shareholder Returns
Attractive 12% net yield at current trading levels
R l di id d
Shareholder Returns 2012
€1.00 per share Payment date: May 10, 2012Regular dividend€ 00 pe s a e
(~€113.6m total)(*)
h
Payment date: May 10, 2012 Record date: May 9, 2012 Ex date: May 7, 2012
Capital reduction€3.25 per share
(~€369.2m total)(*)
Payment date: August 31, 2012 Record date: August 30, 2012 Ex date: August 28, 2012
Share buy back €50.0m in total Execution in the course of 2012 On April 24, 2012, €24.2 million of the
Share Repurchase Program 2012 was executed
Total shareholder return 2012
In total ~€533m
(as compared to €509m in FY 2011)
(*) Based on 113.6 million outstanding shares as per April 25, 201233

ThankThankyouyou.
TelenetLiersesteenweg 42800 Mechelen Belgium
Vincent BruyneelSenior Vice President Strategy, Investor Relations and Corporate Communications
Rob GoyensDirector Investor Relationsand Strategic Planning2800 Mechelen, Belgium
investors.telenet.be
Relations and Corporate Communications + 32 (0)15 33 56 [email protected]
and Strategic Planning+ 32 (0)15 33 30 [email protected]