boeing: sustainability through aviation efficiency...boeing estimates that up to 40 per cent of the...
TRANSCRIPT

The work presented here is part of the ESG Investor Briefing Project, a collaboration between Global Compact LEAD and
the UN-supported Principles for Responsible Investment (PRI) to support companies in enhancing their communication of
how ESG strategies and performance translate into financial value. The content of this communication is based on a
Value Driver Model, which encourages companies to identify and discuss the financial impact of their sustainability
strategies. The forthcoming profile is part of a toolkit that includes a report, presentation slides, and a series of case
examples. It draws primarily upon publicly available information. Each case highlights the way the Value Driver Model
applies to the profiled company through the Model’s S/GPR metrics. For details on the S/GPR calculation, please see “The
Value Driver Model: A Tool for Communicating the Business Value of Sustainability”.
Boeing: Sustainability through aviation efficiency This case profiles how Boeing has applied the aspects of sustainability-advantaged growth
i, productivity
ii
and riskiii (S/GPR) in the Value Driver Model to its business.
Strategic Overview
Customer demand for increased efficiency
Airplane fleets are expected to double in size over the next 20 years. Less than a decade ago, the
primary driver of decisions to purchase aircrafts was speed. Today, among the top drivers is efficiency –
in terms of minimizing fuel and related emissions and cost. Total global fuel expenditure from aviation is
expected to reach USD 214 billion in 2013, up from less than USD 50 billion just ten years ago.iv As the
cost of fuel use grows in importance, Boeing stands to drive significant growth and future profitability
from continuing its focus on delivering fuel-efficient airplanes. Boeing’s backlog increased 27 per cent
since 2010, an increase greatly enhanced by Boeing’s newer fuel efficient designs, which is further
explored in the Growth section below.v The company hopes to leverage the current and future demand
for high efficiency aircraft.
Innovation needed for retiring fleets
Given that 87 per cent of the planes presently in service are forecast for retirement by 2032, plus the
expected expansion of the global fleet, advances such as new aircraft – which reduce fuel consumption
by up to 20 per centvi vii
– and Boeing’s sustainability-advantaged products have the potential to help
reduce the Green House Gas (GHG) footprint per passenger mile of air travel in the future.
Solutions needed to offset rising fuel cost
Boeing estimates that up to 40 per cent of the cost of one flight comes from fuel, so more fuel-efficient
planes benefit airlines, their passengers, and the environment.viii
For Boeing, sustainability strategy and
business strategy are integrated. Seeing the business opportunity in producing a new generation of
super-efficient aircraft required a long-term vision led from the top, the development of new
technologies and sourcing strategies, and the ability to manage new risks.
Anticipated Results
Sustainability-advantaged growth

As consumers seek lower-cost flights and regulators advance emissions standards, airlines and other
plane buyers will likely increasingly demand sustainability-advantaged solutions.
It is helpful to calculate the growing percentage of current and forecasted sustainability-advantaged
revenue at Boeing, even though the company does not separately calculate this figure.
First, 64 of Boeing’s 306 plane deliveries in 2013 are products of sustainability-advantaged designix,
equal to approximately 20 per cent of current deliveries. Looking forward, Boeing expects a long-term
demand over the next 20 years of 35,280 new airplanes, almost completely replacing the present fleet in
service, with 41 per cent of orders for advanced fuel-efficient designs.x On a forward-looking basis,
Boeing plans to at least double the proportion of planes delivered that utilise their advanced fuel
efficient design.
For example, in 2012, Boeing aimed to increase orders for one sustainability-advantaged model from
649 to 1,000xi. As of this writing, Boeing had over 1,400 orders in hand. This represents a much faster
new order growth rate for sustainability-advantaged aircraft than business overall. As further evidence
of the importance of Boeing’s sustainability-advantaged growth (S/G) going forward, roughly 50 per cent
of planes on order as of late 2012 came from developing markets.
Looking back, as of the end of 2005, the sustainability-advantaged value of Boeing’s backlog was 28.7
per cent, or USD 58 billion out of USD 202 billion, in the value of future orders, as driven by the start of
the 787 model experiencing initial sales success. As of June 2013, over seven years later, the value of its
more fuel-efficient backlog accounts for the majority of the overall total of almost USD 400 billion xii
.
This represents a growth rate of sustainability-advantaged orders over four times faster than overall
backlog value growth. As consumers continue to seek lower-cost flights, as airlines and other plane
buyers demand efficient planes, and while plane orders take years to fill, sustainability-advantaged sales
have every chance of driving future profit and revenue growth, while lowering the footprint of aviation.
Sustainability-driven productivity
Coupled with buyer demand, Boeing has advanced sustainability through design and industry
collaboration. As a result, sustainability-driven productivity (S/P) has grown. For example, the 787
benefits from lighter-weight construction materials consisting of 80 per cent composite by volume with
an emphasis on carbon fibre. Boeing also works in consortium with airline buyers. A forthcoming
efficient aircraft resulted from early work with eight major airlines, with each providing input into the
development cycle. The company has many other industry collaborations which will maximise the
recycling of parts from today’s fleet, which is to be largely retired over the next 20 years.
Furthermore, Boeing has worked with air traffic management systems and estimates that updating both
onboard and air traffic control software could reduce annual airline fuel consumption by 9 million
tonnes annually. While Boeing does not yet monetise savings from these efforts, the company will
reduce the cost and footprint of aviation going forward. Boeing works with United States and European
authorities to implement these strategies in what can be complicated regulatory and well-established air
traffic control environments. Consequently, Boeing anticipates the most potential for these strategies in
China and elsewhere in Asia where fleets and systems are newer. Whether through airplane design and
sales or systems such as these, Boeing uses S/P as a key driver. With USD 32 billion in development costs
as of 2011 for the 787 alone, Boeing is constantly accounting for industry forecasts as it plans its long-
term sustainable business strategy. xiii
Sustainability-related risk
In 2007, Boeing first isolated its largest categories of risk and as a result established five-year
environmental performance targets that aimed to cut energy use, GHG emissions, water intake and
hazardous-waste generation by one per cent on an absolute basis in its factories and offices while
growing its overall business.xiv
By 2012, the aforementioned one per cent reduction goals were all met.
Original revenue-adjusted goals of reducing GHG and hazardous waste by 25 per cent by 2012 were also
met, but missed on energy and water.xv
Looking ahead, the company remains committed to water
reduction, zero carbon and zero solid waste to landfill as the business continues to grow, plus zero
revenue-adjusted hazardous waste growth to 2017.
Boeing’s framework for continued progress includes considering environmental performance measures
throughout a product’s life cycle, starting with design and manufacturing and extending through in-
service use and end-of-service recycling and disposal, which it calls Design for Environment. This process
analyses and attempts to reduce the environmental footprint at each phase of a product’s life.
Since most of an aircraft’s lifetime GHG emissions occur in service, Boeing feels it is critical to design and
build products and systems with sustainable technologies to reduce the environmental footprint while
reducing cost. Boeing’s engineers look to make design decisions considering environmental performance
measures that:
• Reduce energy use
• Reduce carbon emissions
• Reduce water intake
• Reduce hazardous materials
• Reduce noise
• Increase the use of sustainable materials
Closing Observations
Boeing’s sustainability-advantaged revenue also generates value for Canadian communities where the
company manufactures aircraft parts. Years lapse between order and delivery of an airplane and Boeing
is bolstering local facilities to handle the increased orders. For instance, Boeing Winnipeg recently
announced increased production of 22 per cent due to increased orders for more fuel-efficient aircraft,
resulting in more local jobs and revenue in the local economy. The company estimates that the
Canadian economy receives the benefit of USD 1 billion of revenue from Boeing manufacturing – a trend
that should continue with projected production rates.
Boeing’s efforts to further its sustainable business practices have coincided with a positive equity
evaluation. After reaching less than USD 30 per share in 2009, prompting concerns over plane order

cancellations, Boeing’s share price has increased over the last five years.xvi
It most recently traded for a
five-year high of USD 108, over 300 per cent higher given the expectations of increased future growth.
Over the past five years, Boeing has outperformed the S&P 500 by roughly 250 per cent. By positioning
itself for a future with potential resource constraints and a developing world seeking increased aviation
by driving efficiency, Boeing is seeking maximum profit through sustainability efforts that drive down
costs while benefiting the overall footprint of aviation.
Through years of design, strategic planning, consulting with buyers and other external stakeholders,
Boeing has become a potential driver of future efficiency, growth and profit that has sustainability in
mind. Companies have the opportunity to learn from the progress Boeing has made.
Investors, in recognizing many companies are exploring the Value Driver Model for the first time, could
encourage businesses to provide high levels of transparency within a balanced context. The most
compelling information for investors is a clearly-explained process by company management on how
S/GPR has been determined and relevant metrics and targets have been defined. Absolute or non-
contextualised data will not help investors to understand companies’ value creation in the short and
long term.
Given the carbon-intensive footprint of aviation, Boeing stands as an example of how sustainability
progress can be made even in the face of economic growth.

The Dow Chemical Company: Restoring nature, protecting profit This case profiles how Dow has applied the aspects of sustainability-advantaged growth
xvii and
sustainability-driven productivityxviii
(S/GP) in the Value Driver Model to its business.
Strategic Overview
In 2006, the President, Chairman and CEO of Dow Chemical announced the company’s 2015
sustainability goals, which included achieving 10 per centxix
of the company’s sales from products that it
defines as highly-advantaged from sustainable chemistry. Dow has stated it believes that connecting
chemistry and innovation can generate new ways to solve challenges globally across four megatrends
deployed via a market-driven strategy:
Results
Sustainability-advantaged growth
In terms of its 2015 sustainability goals, Dow’s revenue from sustainability-advantaged products has
risen steadily to 7.1 per cent in 2012, from 4.8 per cent in 2011 and 1.7 per cent in 2007.xx
Given that the
company had very small overall revenue growth over the most recent period, its sustainability-
advantaged revenue growth (S/G) is sizeable at 67.1 times that most recently calculated.
Sustainability-driven productivity
On the productivity front, Dow estimates USD 9 billion in savingsxxi
from the sustainability goals it set in
1995, which had an investment of under USD 2 billion. As a result, the company saved USD 7 billion over
a 16-year period, equivalent to over USD 400 million a year.xxii
Given that its annualised operating
income has been just over USD 3 billion per year for last few yearsxxiii
, Dow has over 10 per cent savings
from sustainability-driven productivity gains (S/P).
Lessons Learned from Dow Chemical
Measuring its sustainability efforts
Dow’s 2015 sustainability goals were the second round of ten-year commitments the companyxxiv
made
in the area of sustainability and it remains to be seen how it will choose to extend its work going
forward. The company is considering deploying actions across specific themes.
• Agriculture
• Consumer lifestyles
• Energy
• Infrastructure and transportation
To measure its efforts in sustainable chemistry, Dow and its stakeholders developed a proprietary
Sustainable Chemistry Index (SCI)xxv
that looks at a lifecycle basis from “cradle-to-cradle” to determine
the impacts of its products both operationally and in use by consumers and others. The company has
applied this index within each of its hundreds of specific business units on a business value and
performance basis, highlighting opportunities to each business unit leader. For example, the SCI for
chlorine differs from the SCI for building materials and from the SCI for agricultural products.
Scoring for the SCI is made on a 40-point basis, looking at eight equally-weighted categories: five under
the category of opportunity and three under risk, with each scored between 0 and 5 (5 being the most
desirable).Each can be tracked in the following categoriesxxvi
:
Opportunity
• Renewable and recyclable content in products
• Resource abundance and management
• Lifecycle benefits of products
• Manufacturing efficiency (greenhouse gases, waste water, etc.)
• Social needs being met by products
Risk
• Manufacturing or transportation impacts
• Product applications
• Public policy and end of life issuesxxvii
No business unit has earned 40, nor 0, but Dow focuses on business units that qualify as highly-
advantaged as well as working to maintain the general performance of all units over time. In 2012, the
Sustainability Chemistry Index for the company was 22, an improvement over the previous year’s
21.8.xxviii
Embedding sustainability internally
Dow also assists new leaders as they become established within their business units, specifically within
the first 90 days of taking their posts. This includes a review with the Vice President of Sustainability and
Environmental Health and Safety to explain how sustainability is embedded in the overall business
strategy. Sometimes opportunities are clear and in other cases translation is necessary to put
environmental and social issues into economic terms that can be applied to business strategy.
Looking forward
Dow has additional sustainability-advantaged initiatives underway at present, including its multi-year
collaboration with The Nature Conservancy on valuing ecosystems servicesxxix
.
Closing Observations

Investors, in recognising that many companies are exploring the Value Driver Model for the first time,
could encourage businesses to provide high levels of transparency within a balanced context. The most
compelling information for investors is a clearly explained process by company management on how
S/GPR has been determined and relevant metrics and targets have been defined. Absolute or non-
contextualised data will not help investors to understand companies’ value creation in the short and
long term.
Dow’s progress across sustainability-advantaged growth, productivity and risk (S/GPR) was made
possible due to the time and effort it spent on measurement and embedding sustainability into its
strategy. Lessons learned from its years of work in this area and its efforts in building key partnerships to
help successfully implement strategies may be applicable in other company contexts as well. Dow’s
example provides insight on how sustainability strategies can be translated into additional bottom line
and societal benefit.

DuPont: Seeking solutions for a better planet
This case profiles how DuPont has applied the aspects of sustainability-advantaged growthxxx
,
productivityxxxi
and riskxxxii
(S/GPR) in the Value Driver Model to its business.
Strategic Overview
The E. I. du Pont de Nemours and Company, typically referred to as DuPont, has roots that go back as
early as 1800. The company is known mainly for its involvement in the late 1900s with fossil-fuel based
plastics and chemicals that propelled growth, but also placed a significant burden on the environment
through greenhouse gas (GHG) emissions and other health-related impacts from the production and use
of its products. Today DuPont has integrated sustainable business strategy with its overall business
strategy. DuPont is focusing on three strategic drivers of growth and profitability for the foreseeable
future:
• Solving the global challenges of ensuring food security for growing populations;
• Discovering new solutions to meet energy requirements;
• Protecting life through cleaner and safer chemistry and materials.
DuPont enables investors and others stakeholders to track its transformation through reporting its
sustainability-advantaged growth, productivity and risk (S/GPR) performance.
Results
DuPont’s most recent reports exhibit commitment to sustainability, showing key revenue growth from
sustainability-advantaged sourcesxxxiii
(or S/G) in addition to absolute reductions in GHG emissions and
total water use from its 2004 baseline, despite business expansion. While DuPont reports many
improvements, listed below are key metrics that correspond to the Value Drive Model’s growth,
productivity and risk categories.
Sustainability-advantaged growth
DuPont has reported two key sustainability-advantaged revenue growth metrics for 2007-2011:
• Revenue from products that reduce GHG emissions rose from USD 63 million in 2007xxxiv
to USD 1.9
billion in 2011 an increase of nearly 3100 per cent. xxxv
• Revenue from products based on non-depletable resourcesxxxvi
doubled from USD 5 billion to USD
10 billion on a revenue base of USD 33.6 billion in 2011 – an increase of 100 per cent.xxxvii
The fact that the sustainability quality of DuPont’s revenue (i.e. the absolute per cent of total revenue
defined as “sustainability-advantaged”) has shifted from 17 per cent to 30 per cent during this period
sends a signal that the strategy is successful. Computing an S/G rating (which divides the growth rate of
these new revenue categories by the growth of the overall business) produces a score of 5.5.xxxviii
This
means that growth from these new products has been more than five times faster than overall
growth.xxxix
Sustainability-driven productivity
For more than two decades, DuPont has been working to improve the resource efficiency of its business
operations. Over the 20-year period from 1990 to 2010, DuPont reported aggregate savings of
approximately USD 300 million per year from its energy-saving efforts. This equals a sustainability-
driven productivity figure (or S/P) of just over nine per cent of almost USD 3.3 billion operating income
in 2010.xl
This figure provides evidence of the value of sustainability to business savings.
Sustainability-related risk
DuPont’s sustainability-related risk (S/R) management reporting focuses on key factors that provide
insight into current and potential exposure. While DuPont provides a broad base of environmental,
social and corporate governance (ESG) data, its reports focus on the several critical variables that offer
evidence of its continuous improvement in sustainability-related risk management.
Three key metrics computed from its top-level data on water use, waste, toxicity and process assurance
help to provide understanding of DuPont’s potential near and intermediate-term revenue and brand

value at risk from sustainability-related issues:
• Stressed water intensity of revenue
Measured in billions of gallons (BG) used in areas designated as water-stressed per billion
dollars of revenue. Based on a comparison of 2007 to 2011, stressed water intensity
decreased by 14 per cent from .204 to .179 BG/billions of USD.xli
• Air carcinogen intensity of revenue
Measured in millions of pounds (MP) of air carcinogen emissions per billion dollars of
revenue. Based on a comparison of 2007 to 2011, air carcinogen intensity decreased by 45
per cent from .051 to .023 MP/billions of USD.xlii
• Environmental risk intensity of manufacturing facilities
Measures the percentage of manufacturing facilities not certified for environmental
performance management processes and systems under the ISO 14001 standard. Based on
a comparison of 2007 to 2011, the percentage of non-certified facilities declined from 62
per cent (n=93) to three per cent (n=5) – a decrease of 59 per cent.xliii
Taken together, these factors show an average reduction in key risks of 39 per cent, well above the 25
per cent (or 5 per cent per year) target.
These S/GPR metrics provide valuable assistance in assessing DuPont’s near and intermediate potential
to achieve value from its sustainability efforts:
S/G = 5.5x
S/P = +9 per cent
S/R = -39 per cent
Lessons Learned from DuPont

Early sustainability efforts
DuPont’s history regarding revenue categorisation of sustainability-advantaged products goes back to
1998 under the direction of then Chief Executive Officer Charles Holliday. At the time, he asked a
provocative question of DuPont’s sustainability efforts:
DuPont recognised that its future strength lay in innovating and creating new products that have the
potential to improve the quality of life around the world. Its leadership team inferred that future
customer demand and market forces would favour companies that could meet those needs with the
next generation of cost-effective solutions that solved key problems without ancillary risks or
unintended consequences to the environment or human health.
While some products already met the sustainability-advantaged criteria, management soon recognised
that sustainability concepts had to be brought into the research and development (R&D) process at the
earliest possible stage. Achieving this goal required developing metrics to assess the “sustainability
quality” of the current R&D spending and setting targets for the future.
In 2004, DuPont sold its textiles business, which followed the sale of oil and transportation subsidiary
Conoco in 1999 to what is now ConocoPhillips, and focused on a market-facing approach to
sustainability-advantaged products in 2006.xliv
Investing R&D spending in sustainability
Beyond reducing its operational footprint, DuPont emphasised how customers and consumers could
make more efficient use of its products, but it chose to focus first on R&D spending, which at this time
was around USD 1.7 billion per year.xlv
DuPont engaged its R&D community on how to maximise this
spending, and determined its future spending would be evenly divided between investments in a new
generation of sustainability-advantaged products and investments in the transformation of internal
production and operating processes to make them more resource-efficient.
“We are doing a good job of doing less bad. How
do we go about doing more good?”

Scaling up the transformation in R&D spending required DuPont to develop a categorisation system to
specify the range of sustainability-related advantages the company would pursue and to measure how
any given product or process rated on each dimension.
In 2006, DuPont engaged a sustainability consultancy to help develop a tool that would define the key
performance indicators (KPIs) and metrics required to measure potential new product benefits, and
quantify the amount of existing spending that qualified as sustainability-advantaged.xlvi
Rather than
implement that tool as a separately-managed software product as originally planned, the company
embedded these factors into its R&D planning processes, thereby integrating sustainability.
Further, DuPont performed cradle-to-gate analysis of upstream raw materials in potential new products
to ensure that savings achieved would not be borne by increased footprints further up the supply chain.
Defining sustainability-advantaged products
In at least one out of 10 sustainability categories listed below, DuPont went on to establish its own
standards for what qualifies as sustainability-advantaged products, targeting incremental savings of 40
per cent compared to the footprint of existing products in the marketplace that it sought to replace.xlvii
If
each product did not meet its target, it could still be included in the “sustainability-advantaged
portfolio” if it significantly outperformed the current product in at least one area and was at least
comparable in the other nine areas. In all cases, advantages reached double-digit percentages.
DuPont’s 10 categories of sustainability for R&D
considerations
• Climate change
• Energy use
• Pollution
• Material use
• Waste
• Disposal
• Ecosystems and biodiversity
• Water
• Toxicological risk
• Use of non-depletable resources

Sustainability-advantaged revenue and savings
In 2007, DuPont set a baseline of 2006 results across these 10 areas of sustainability-advantaged
measurements and valuations. It performed its first full analysis in 2008, from 2007 figures. The 2008
analysis classified USD 5.8 billion in sustainability-advantaged revenue with a focus on products that
reduce GHG emissions in comparison to the alternatives, as well as those products based on non-
depletable resources.xlviii
Towards achieving these measured savings, DuPont performed lifecycle analysis (LCA)xlix
to determine
how products help to reduce GHG emissions at customer level, and then quantified revenues that drove
reductions. DuPont developed its Environmentally Smart Assessment Tool (ESAT), which enables
tracking of all ten sustainability factors in the R&D process and “sustainability-advantaged” revenues.
DuPont disclosed savings of USD 6 billion from its energy- and resource-efficiency efforts from 1990
through to 2011l. While this figure has not been updated since 2011, the company believes that the
present-day savings are significantly higher and the next review is expected in the near term.
Communication
With respect to risk, DuPont has focused on comprehensively understanding its own footprint, as well as
that of its products and supply chain, while focusing on factors most relevant for its businesses, and
then communicating those from the top down. DuPont’s approach to focusing on its critical
sustainability-related risks has been to create a consensus view between company management and
knowledgeable stakeholders groups, particularly environmental non-governmental organizations.
DuPont’s reporting calls special attention to progress it has made in critical areas such as:
• Water and stressed-water use
• GHG emissions
• Toxicity
• Certification, specifically ISO 14000

DuPont’s open approach and sustained progress on reducing these key risks has garnered good
relationships with important stakeholder groups.
Closing Observations
Despite the lack of an external standard for overall categorisation of sustainability-advantaged revenues,
DuPont has faced little questioning or opposition from stakeholders regarding the validity and accuracy
of its approach. While some of DuPont’s individual products and businesses can make use of external
sustainability standards, its reported total is a product of its own framework. The company believes its
success results from its high level of transparency.
Investors, in recognising many companies are exploring the Value Driver Model for the first time, could
encourage businesses to provide high levels of transparency within a balanced context. The most
compelling information for investors is a clearly-explained process by company management on how
S/GPR has been determined and relevant metrics and targets have been defined. Absolute or non-
contextualised data will not help investors to understand companies’ value creation in the short and
long term.
Upon analysing DuPont’s progress through a sustainability lens, it is possible to uncover a revenue
growth strategy that is not immediately apparent when looking at growth overall. As DuPont continues
to make strategic moves to reposition the company – reflected in the recent announcement regarding
strategic options for their chemicals business – it will become even more crucial to clearly understand
this sustainable business strategy.
While businesses across various sectors will have different timeframes and potential for achieving
significant business benefits from sustainability strategy, DuPont’s experience is not atypical. Building
the capabilities to envision, analyse and execute on sustainability in a manner that delivers business

advantage requires considerable commitment and organisational learning. However, as this case
demonstrates, it can also be a source of very significant present and future value. An understanding of
the scope for value-creation and the capacity to plan and execute sustainability strategy is fundamental
to assess the company value curve. Applying the Value Driver Model to DuPont’s current and forecasted
goals gives stakeholders a solid understanding of value and gives the company an effective approach to
communicating the potential for sustainability-driven results.
Finally, the greatest potential for attracting market interest in sustainability strategy is in the early to
middle phases of recognition of a sustainability strategy’s business impacts – that is, when sustainability
is a differentiator. Early mover advantages for firms are likely to exist provided their sustainability
strategies are robust enough to take full advantage of upside opportunities as well as downside risk
mitigation. If this is the case, the next several years may well be the ideal time for companies to improve
their ability to capture benefits and communicate their strategies to the market.
Philips: Creating value through sustainability
This case profiles how Philips has applied the aspects of sustainability-advantaged growthli, productivity
lii
and riskliii
(S/GPR) in the Value Driver Model to its business.
Strategic Overview
At 122-years-old, Philips has a diversified global business with a history of building value through
communities, employees, products and services. For example, its EcoVision strategy, launched in 1998,
focuses on the environmental and social dimensions of the company’s operations and products, as well
as supply chain sustainability.liv
The strategy takes into account a full analysis of the company’s potential
scope of influence, relevance to society, reputational risks and how it compares to its peers in this
regard.
The company’s three key innovation areas identified as part of the EcoVision strategy include:
• Improving people’s lives
Improve 3 billion lives by 2025 primarily through healthcare-related wellbeing and green
products.
• Improving energy efficiency of Philips products
By 2015, a 50 per cent improvement for the average total product portfolio compared to 2009.
• Closing the materials loop
By 2015, double global collection of recycled product and materials, and use of recycled content
in products, compared to 2009.lv
Results
Philips tackles all three of the Value Driver Model factors: sustainability-oriented growth, productivity
and risk.
Sustainability-advantaged growth and productivity
Over the three years leading up to 2012, Phillips’ sustainability-advantaged growth (S/G) was 8.7x faster
than the overall growth of the company. The company also reported 45 per cent of overall revenue from
sustainability-advantaged products, which are differentiated from the existing marketplace.lvi
By
evolving its product line, the company aims to increase this to 50 per cent by 2015lvii
and is working
toward 100 per cent over the longer termlviii
. The company also has a keen focus on sustainability-driven
productivity and risk mitigation that seeks to maximise relevant savings for each of its businesses.
Philips has continuously placed focus on employee quality and the company has built schools for
employee families in the past. Presently, its business strategy concentrates on employee engagement
and retention, including engaging with employees on the company’s sustainability management. Philips
has found that employees are excited to see that successful implementation of the company’s goals
would result in not only an improved bottom line, but additionally a lower global environmental
footprint. The company has also found that some of its younger employees and research and
development (R&D) experts have chosen to work at the company due to its sustainability track record.
Lessons Learned from Philips
A shift in focus
After recently divesting from the consumer electronics business, Philips (formerly known as Philips
Electronics) now focuses on three areas: healthcare, consumer lifestyle and lighting. Philips’ strategy for
evolving its business is illustrated by trends in lighting as the company divests out of older, now-defunct
technologies such as filament bulbs, and shifts focus to the future of LED.lix
Philips recognises that
lighting accounts for roughly 19 per cent of the world’s carbon footprint, with LED having the potential
to create up to 80 per cent energy savings.lx This translates into a smaller footprint and reduced cost of
use. Further, the company is working on defining the social benefit of energy savings and the risk
management benefits for shareholders. Likewise, Philips was a serious player in early radio innovation
and it continues forward with EUR 2 billion devoted to green innovation-related R&D by 2015.lxi
EcoVision
In the late 1970s, the Philips board requested an environmental opportunities analysis of the company’s
operations, aiming at consuming a minimum of resources and reducing facility emissions. By launching
the EcoVision programme in 1998, the company started to examine its products. As a percentage of the
group total, green product sales rose to 45 per cent in 2012 up from 39 per cent in 2011. The company
has a goal of 50 per cent by 2015.lxii
Philips determines products qualify for the “green product” category
if they outperform predecessor or competitor products by 10 per cent or more in at least one of the
company’s green focal areas, such as energy efficiency, hazardous substances, waste and recyclability.lxiii
In addition to product sales, the EcoVision programme has also evolved to encompass goals involving,
among other things, improving lives through healthcare, supply chain sustainability, investments in
innovation, and efficiency, including in the company’s own operations.
Sustainability-related risk
Philips’ renewed focus on energy efficiency was derived from its understanding that 90-95 per cent of its
products’ energy intensity can be attributed to the use phaselxiv
and 97 per cent of products’ energy use
comes from lighting.lxv
The maximum potential of the company’s operational efficiencies from
sustainability is small in comparison with this much larger opportunity among lighting consumers
collectively. As a result, Philips uses lumen/watt to measure how it can best contribute to productivity
and aim towards specific targets in this area, while also attempting to quantify monetary savings on
energy during the use phase of its products. In addition to these efficiency efforts, Philips examines risk
categories. Early supply chain management efforts included establishing the Supplier Sustainability
Declaration Programme, which included audits and trainings, to outline what the company expects from
suppliers. By 2012, Philips had reached a 75 per cent supplier compliance rate with the programme. It
also looks at country-specific risk via an external provider that helped to identify three countries to

receive extra risk management focus. Philips reports on this and audits facilities there every three
years.lxvi
Further efforts
Going forward, the company continues to explore ways to reduce hazardous substances in its processes,
as well as closed loop recycling/reuse systems. Phillips has stated it is particularly intrigued by how its
products potentially fit into a circular economy concept.lxvii
Philips took a further step in 2012 and undertook a full sustainability audit, moving from limited to
reasonable assurance.lxviii
The company deploys a number of sustainability boards internally that involve
the heads of legal, healthcare management, strategy and markets along with other executive team
members. Phillips also engages with key investors and external stakeholders, such as Greenpeace, on an
active basis to receive useful feedback that helps shape the company’s thinking.
Closing Observations
Philips serves as an example of a generations-old company that is undertaking a lengthy transition
primarily focused on sustainability-advantaged products. The company feels it went to great lengths to
understand its impacts and prioritised innovation and efficiency efforts to shift the company’s business
activities for the benefit of both shareholders and all stakeholders. Other companies may benefit from
applying the sort of systems-thinking approach that Philips has used throughout its history regarding
positive employee relations, such as training and education, while keeping a firm view on what lies
ahead.
Investors, in recognising many companies are exploring the Value Driver Model for the first time, could
encourage businesses to provide high levels of transparency within a balanced context. The most
compelling information for investors is a clearly-explained process by company management on how
S/GPR has been determined and relevant metrics and targets have been defined. Absolute or non-
contextualised data will not help investors to understand companies’ value creation in the short and
long term.
Forward-looking companies that anticipate the needs and desires of future consumers and their own
employees are well-positioned to be suppliers of choice to the increasing categories of buyers interested
in purchasing goods from sustainable companies.
Praxair: Finding value through sustainable practices
This case profiles how Praxair has applied the aspects of sustainability-advantaged growthlxix
,
productivitylxx
and risklxxi
(S/GPR) in the Value Driver Model to its business.
Strategic Overview
Industrial gas company Praxair has used growth, productivity and risk management as key drivers of
sustainable value while delivering oxygen, nitrogen, argon, hydrogen and specialty gas products to the
market, while at the same time adhering to the company mission statement: “Making our planet more
productive”.
Through employee engagement, Praxair attempts to foster a culture that creates value for customers,
investors and the business itself. Praxair’s efforts to further its sustainable business practices have
coincided with a positive equity evaluation, with the company’s share pricelxxii
rising from under USD 50
per share during the period just after the 2008 financial crisis to near an all-time high of USD 121 at
present. Overall, Praxair’s share price has followed a positive twenty-year trajectory.
Results
Sustainability-driven productivity
Praxair has focused on a sustainability-driven productivity (S/P) standpoint, reporting USD 112 million in
what it calls “sustainable productivity” savings in 2012, up from USD 64 million in 2011 and USD 32
million in 2010. This constitutes a growth rate of over 300 per cent during the past two years.
Sustainability-advantaged growth
Praxair’s sustainability-advantaged growth (S/G) figure is 27 per cent of total revenue in 2012, targeting
30 per cent in 2015. Combined with its S/P figures and its risk management strategy, it is evident that
the company is seeking value through sustainability.

Source: Praxair
4% 5% 7% 6%
USD
4%
5%
7%
6%

Lessons Learned from Praxair
Praxair’s efforts in sustainability began in 2003 when it created it sustainability principles and a
sustainability report aimed at satisfying requests from external stakeholders and standardising its
responses to them. In 2010, the Chief Sustainability Officer led Praxair to broaden its culture of
productivity to include environmental elements as a means to provide maximum value to investors.
Page 3 of the company’s 2012 Sustainable Development report states: lxxiii
By 2012 sustainable productivity accounted for 25 per cent of USD 450 million in total productivity
savings and had achieved buy-in from the company’s productivity team.lxxiv
In the same year, the
company delivered over 1,750 projects that saved more than 300 million gallons of water, 800 million
kilowatts of electricity and approximately 500,000 metric tonnes (MT) of carbon dioxide equivalent
(CO2e).lxxv
Praxair has worked to make an operational link between productivity and sustainability that
directly benefits its ROC. Moreover, Praxair believes that use of corporate standards to measure and
report sustainable productivity has improved resource efficiency within its operations and supply chain.
Lower production costs have improved Praxair’s operational efficiency, which has helped increase
operating margin.
Praxair’s 2013 submission to the Carbon Disclosure Project (CDP)lxxvi
provides a detailed summary of the
related projects that it tracks, which have a payback period of one to three years:
• 30 projects providing permanent reduction in power consumption for lighting retrofits, HVAC
controls and building power needs. Combined, these projects avoided emission of 2,500 MT of
CO2e and saved USD 450,000.
• 625 projects providing permanent improvements to energy requirements for turbines,
compressors, fans and other primary process equipment, with improvements to heat transfer
efficiency and control equipment for process efficiency optimisation. Combined, these projects
avoided emission of 400,000 MT of CO2e and saved approximately USD 63 million.
“A slowing world economy has created challenges to business profitability.
Praxair’s productivity is key to continuing to achieve industry-leading
Return on Capital (ROC). One crucial contributor to Praxair’s ROC has been
the outstanding performance of its productivity organisation, which has for
several years achieved six to seven per cent savings off its cost stack.
Productivity savings often resulted in environmental benefits: reductions in
energy, fuel, water or waste. The question was – could environmental
actions bring financial savings and would there be other business
benefits?”
• 80 projects providing permanent reduction in gasoline and diesel fuel use, or increased fuel
efficiency, including route efficiency programmes, on-site tank size optimisation, trailer tank size
optimisation and truck modifications such as fairings and skirts for fuel efficiency. Combined,
these projects avoided emission of 4,000 MT of CO2e and saved over USD 3 million.
• 51 projects providing permanent process improvements for CO2 recovery, vent gas reductions,
and reduction of dry ice process losses. Combined, these projects avoided emission of 23,000
MT of CO2e and saved nearly USD 3 million.lxxvii
As a mature productivity organisation, two of Praxair’s challenges include:
• Maintaining idea flow over time as the most easily implementable projects get executed.
• Sustaining programme momentum and return on investment (ROI) as the administrative burden
increases over time.
To overcome these challenges, Praxair measures the percentage of projects that are replicated.
“Replication” refers to knowledge that can be leveraged globally: replicated projects are taken to scale
with reduced cycle times and higher rates of profitability, since the initial investment has been made
and staff members are free to complete additional projects. Praxair’s general productivity programme
replication rate is around 29 per cent of projects worldwide but the replication rate for sustainable
productivity projects is over 50 per cent.lxxviii
In other words, sustainable productivity projects are
regularly achieving a multiplying effect, feeding new ideas and adding value to Praxair’s productivity
programme – and to the business.
How has Praxair’s sustainable productivity achieved a high level of replication? One facilitator is the
focus on linking sustainable productivity to employees’ environmental and social engagement. Praxair
actively promotes its brand as helping to meet global and local challenges – making the planet more
productive. A range of communications and programmes aim to create a culture of social awareness and
environmental stewardship among employees at work, at home and in their communities. In return, the
company sees a direct connection to corporate value creation. Employee environmental programmes
such as Zero Waste and social programmes such as Community Engagement involve employees’ hearts
as well as minds, encouraging operational environmental initiatives while reinforcing the company’s
culture of safety and productivity. As a result, the company feels that employees increasingly want their
work to be connected to their environmental and social values.lxxix
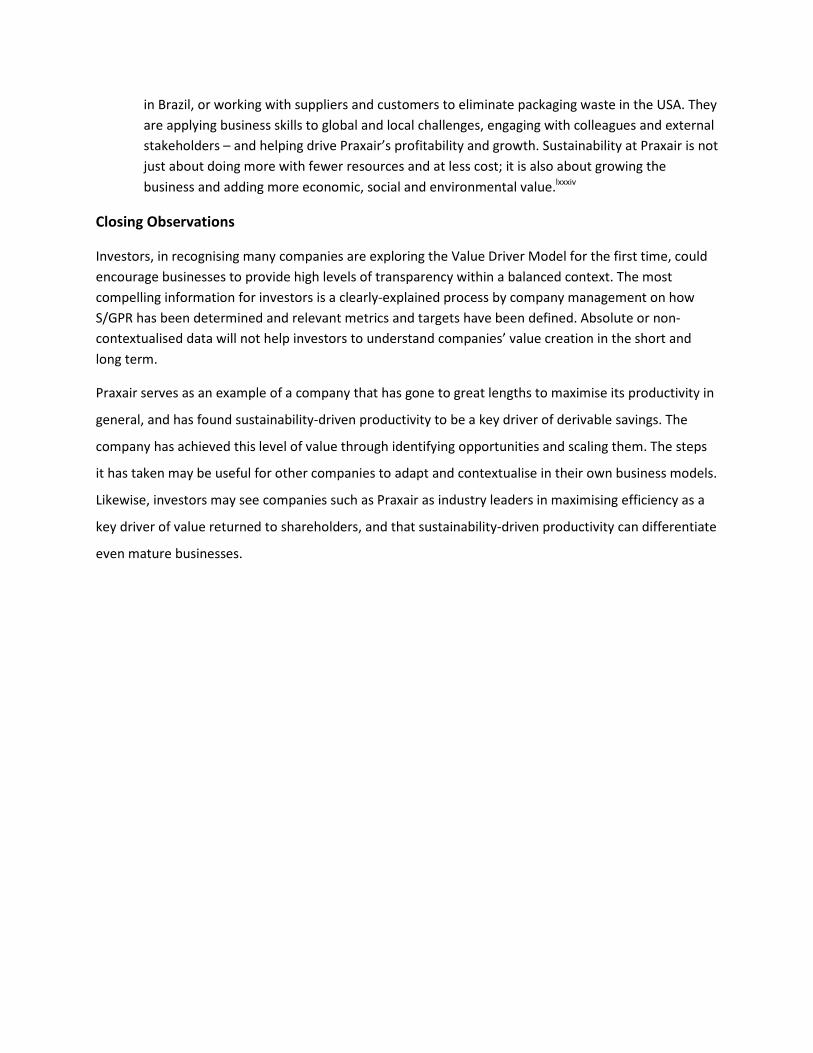
Sustainability-related risk
Higher levels of employee engagement mean that workers pay more attention, measurably lowering
operational risk. A values-driven culture and employee engagement also aid with retention. Praxair
reports that:lxxx
“Environmentally engaged employees enhance
resource efficiency and boost operating margin,
they learn better asset management and create an
environment that is safer and more engaged.
Overall, business and brand value is being
enhanced.”

From a risk perspective, Praxair highlights the following areas of highest concern to stakeholders:
• Integrity and ethics
• Health and safety
• Earnings growth and ROC
• Greenhouse gases and climate change/energy
• Compliance
• Community development efforts
By way of example, Praxair measures the benefit of its community development efforts. It reports that
community engagement activities benefit ten people for every Praxair employee – a 10x net social
benefit. Other risk trend attributes reported for 2012 includelxxxi
:
• Positive impact/attitude of recipients
91 per cent, up from 78 per cent in 2011
• Community projects where volunteers report direct positive impact on recipients’ quality of life
80 per cent, up from 73 per cent in 2011
• Number of beneficiaries affected
304,149, up from 140,000 in 2010
• Perceived management effectiveness
73 per cent, up from 58 per cent in 2011
• More positive employee outlook on Praxair
86 per cent, up from 71 per cent in 2011lxxxii
Praxair is deriving solid benefit from its environmental and social programmes. The company draws the
same connection between a sustainability-driven culture and business value as does a recent MIT
Sloanlxxxiii
paper.
Looking forward
Riva Krut, Chief Sustainability Officer at Praxair, echoes the company’s focus on value drivers such as
S/GPR:
Every day, Praxair employees are taking the initiative to solve environmental challenges, be it
designing our largest and most energy efficient air separation units in China, or recycling water
in Brazil, or working with suppliers and customers to eliminate packaging waste in the USA. They
are applying business skills to global and local challenges, engaging with colleagues and external
stakeholders – and helping drive Praxair’s profitability and growth. Sustainability at Praxair is not
just about doing more with fewer resources and at less cost; it is also about growing the
business and adding more economic, social and environmental value.lxxxiv
Closing Observations
Investors, in recognising many companies are exploring the Value Driver Model for the first time, could
encourage businesses to provide high levels of transparency within a balanced context. The most
compelling information for investors is a clearly-explained process by company management on how
S/GPR has been determined and relevant metrics and targets have been defined. Absolute or non-
contextualised data will not help investors to understand companies’ value creation in the short and
long term.
Praxair serves as an example of a company that has gone to great lengths to maximise its productivity in
general, and has found sustainability-driven productivity to be a key driver of derivable savings. The
company has achieved this level of value through identifying opportunities and scaling them. The steps
it has taken may be useful for other companies to adapt and contextualise in their own business models.
Likewise, investors may see companies such as Praxair as industry leaders in maximising efficiency as a
key driver of value returned to shareholders, and that sustainability-driven productivity can differentiate
even mature businesses.
Reckitt Benckiser: Focusing on sustainability through revenue
This case profiles how Reckitt Benckiser has applied the aspects of sustainability-advantaged growthlxxxv
and sustainability-related risk managementlxxxvi
(S/GR) in the Value Driver Model to its business.
Strategic Overview
Consumer goods company Reckitt Benckiser has a strong new focus on growing sales of products it
categorises as sustainability-advantaged, with a goal of 33 per cent of its net revenue from this category
by 2020.lxxxvii
This FTSE 100 index member is a provider of cleaning, healthcare and household products,
including brands such as Clearasil and Calgon. The company’s efforts to yield more sustainable
consumer products address the area of its business that is responsible for the majority of its footprint.
Results
By 2020 the company aims to reach a sustainability-advantaged growth (S/G) figure of well over 10x
current numbers if it achieves its 33 per cent goal. Achieving this target could translate into around GBP
4.5 billion of its overall GBP 14 billion expected revenue over the next seven years.lxxxviii
To meet its
ambitious 2020 sustainability-advantaged revenue target, Reckitt Benckiser must facilitate large growth
in this area. The company predicts that its overall business will grow slowly but steadily, between five to
six per cent.lxxxix
While Reckitt Benckiser has chosen to focus on sustainability-advantaged revenues more than
productivity savings, the company also places an emphasis on health, hygiene, water savings and
innovation – all of which are core to its business success and its ability to drive shared societal value.
With overall revenue of just over GBP 9.5 billion in 2012xc
, Reckitt Benckiser is just beginning to measure
revenue from sustainability-advantaged products.
Lessons Learned from Reckitt Benckiser
Reckitt Benckiser performed a complete lifecycle greenhouse gas programme in 2007 – known as
Carbon20 – which enabled the company to meet some of its 2020 environmental goals as early as
2011.xci
In addition, during 2011 the company appointed a new CEO with experience serving in a variety of
internal senior positions, such as research and development (R&D).xcii
This appointment kicked off a
business strategy planning process that looked at sustainability through trends affecting both business
and society, seeking to answer the question of how Reckitt Benckiser can best play a role in the future.
Sustainability-advantaged growth
Reckitt Benckiser believes sustainability-advantaged revenue increases are very relevant for company
valuation by investors and industry analysts. Therefore, the company is planning to develop specific
internal goals for its individual businesses, tracking their success and providing milestones. This would
also allow the company to manage the growth of this area.

The CEO’s business strategy planning process helped lead to the development of the company’s
Sustainable Innovation Calculatorxciii
, which derives from the Carbon20 calculator of 2009 and the
subsequent sustainability-advantaged revenue goals that will be reported from a 2012 baseline onward,
starting with the company’s 2013 sustainability report. The Sustainable Innovation Calculator is a
streamlined lifecycle analysis (LCA) tool that allows the company to quickly understand the carbon and
water impacts of potential products, both during R&D, operational and consumer use phases. The rules
and systems involved with the tool were developed with the company’s R&D experts in Excel and in
partnership with an external provider. Reckitt Benckiser is considering sharing this tool publicly.
As for potential sources of sustainability-advantaged revenue, Reckitt Benckiser has launched a new
partnership with Save the Childrenxciv
, focusing on the prevention of diarrhoea, an avoidable illness that
is the second largest cause of death globally for children under the age of five. For its part, Reckitt
Benckiser is developing new products to help confront this challenge in addition to providing global
marketing and expertise to this venture.
Sustainability-related risk
Reckitt’s overall goals on sustainability also include 33 per cent reductions of its own water impact and
carbon footprint, anticipating changes to come globally and spurring a retooling of product
production.xcv
For example, the company sees a need to reduce its water footprint in light of its estimate
that 64 per cent of the world’s population will live in areas of significant water shortage by 2025.xcvi
From a risk and opportunity perspective, the company’s materiality mapxcvii
shows carbon and water to
be two key areas of focus for the company, with most used during the manufacture of products and
their subsequent use. Hence, the company pushes R&D, and more sustainable product development
and sales. Reckitt Benckiser has sought to integrate sustainability into its thinking and purpose, featuring
an overall slogan of “Better Business”. As such, the company prioritises supply chain impacts, targeted
ingredient removal, manufacturing, and health and safety efforts.
Closing Observations
Companies in the consumer goods sector can learn from Reckitt Benckiser’s sharp focus on the footprint
of its products as a key area of potential improvement. End use of products can often be the majority of
the footprint of organisations in many sectors. Companies both large and small can consider such
strategies as a way of growing future revenue through attracting new customers wanting to purchase
from companies that are mindful of the environmental and societal impacts of the products they
actively sell.
Investors, in recognising many companies are exploring the Value Driver Model for the first time, could
encourage businesses to provide high levels of transparency within a balanced context. The most
compelling information for investors is a clearly-explained process by company management on how
S/GPR has been determined and relevant metrics and targets have been defined. Absolute or non-
contextualised data will not help investors to understand companies’ value creation in the short and
long term.

If sustainability-advantaged products continue to shape consumer purchase patterns, consumer goods
companies that get ahead of this trend could benefit. Reckitt Benckiser’s efforts to further its
sustainable business practices have coincided with an attractive equity evaluation. Its share price has
nearly doubled over the past five years.xcviii
Indeed, its performance during this period was twice as
good as the overall FTSE100’s performance.

Schneider Electric: Business as a barometer for the planet and society
This case profiles how Schneider Electric has applied the aspects of sustainability-advantaged growthxcix
,
productivityc and risk
ci (S/GPR) in the Value Driver Model to its business.
Overview
In 1836, brothers Adolphe and Eugene Schneider purchased mining and manufacturing operations near
Le Creusot, France. These would one day become the modern-day multinational company Schneider
Electric (SE).cii
The company now provides energy management services, building efficiency, solar energy
solutions and automation processes, offering potential for financial and environmental efficiency savings
globally.
Results
Sustainability-advantaged growth
SE already benefits from the dual trends of growing demand for the service it provides and its own
specific offerings in these areas, with its most recent reports exhibiting significant growth from
sustainability-advantaged revenue (S/G).ciii
The sustainability quality of revenue (i.e. the absolute per
cent of total revenue defined as “sustainability-advantaged”) has grown from 29.9 per cent in early 2011
to 63.3 per cent by the third quarter of 2013. This, plus the fact that the company’s share price
increased by 50 per cent during this periodciv
, could signal that the strategy has been beneficial for SE’s
stakeholders, not least its shareholders. Computing an S/G rating for SE (which divides the growth rate
of sustainability-advantaged revenue by the growth of the overall business) produces a score of 7.8. This
means that growth from sustainability-advantaged products has been faster than overall growth.cv
The company also focuses increasingly on sustainability-driven productivity (S/P) and deploys a Planet
and Society Barometer, which acts as an overarching, public-facing monitor of progress on the most
significant areas of risk management (S/R). It is accessible on the company’s websitecvi
and is featured
prominently in ongoing financial reporting.cvii
Lessons Learned from Schneider Electric
Creating a sustainability department
SE’s efforts to create value via sustainability date back at least 12 years, when its sustainability
department was first created in spite of what it saw as weak investor signals on the subject. It was also a
way of demonstrating SE’s commitment to sustainability, with a desire to create and measure itself
against specific key performance indicators (KPIs). SE was first selected for inclusion in the Dow Jones
Sustainability Index in 2002 and it launched its NEW2004 (New Energy World) initiativecviii
at the same

time. Energy efficiency solutions went on to make up 30 per cent of a EUR 18.3 billion business by
2008.cix
Tracking progress
SE began developing and maintaining its Planet and Society Barometer in 2005. It advanced SE’s
sustainable development goals of wasting less energy while practicing more environmentally-friendly
methods of industrial production and consumption.cx
Other aspects of the Barometer include helping
the poorest nations gain access to energy while assisting their economic development; areas which
could help garner future business for the company if successful. The Barometer has 14 aspects across
planet, profit and people, scored on a scale of one to 10. SE improved from a score of three in early 2009
to eight by 2011.cxi
Most recently, SE is performing at 6.38 in the face of its goal of eight by the end of
2014.cxii
According to its “Half-year 2013 Results” the company is progressing well towards several 2014
targets after the second quarter of 2013, as below.
Progress Associated
value driver Status of SE’s goal
Exceeded On
trackcxiii
75 per cent of product revenues gained from green
premium-designated products. This goal was adjusted up
from 67 per cent. After the second quarter of 2013, the
company measured itself at 67.3 per cent, up from 29.9 per
cent in the first quarter of 2011.
x
1 million households from the “‘bottom of the pyramid” ’
gain access to energy via SE solutions. This number stands at
over half a million after the second quarter of 2013.
x
Growth
10 per cent reduction of 2011-14 carbon dioxide emissions,
which SE aims to achieve through transportation mode
selection, supply chain and logistics optimisation, and freight
density, among other steps. The company has already
exceeded this target, reducing emissions by 29 per cent after
the second quarter of 2013.
x
10 per cent savings on energy consumption savings. SE is on
track to achieve this, with a 7.4 per cent reduction after the
second quarter of 2013.
x
Productivity

Score of 70 by 2014 relative to SE’s Employee Engagement
Index. It is currently on target for its anticipated goal, with a
most recent score of 57 after the second quarter of 2013.
x
30 per cent of women in key positions by the end of 2014,
up from 23 per cent when first measured, via identification
of high-potential employees in 2011. After the second
quarter of 2013, it stands at 26 per cent.
x
30,000 people at the “bottom of the pyramid” trained on
energy management. Its second quarter number in 2013
(21,000+ trained) exceeds the original goal of 10,000.
x
All industrial and logistics sites to become ISO 14001
certified within two years of acquisition or creation. This goal
increased from the previous target of two-thirds of
employees to be working in ISO 14001 certified facilities; a
goal it surpassed in 2011.
x
30 per cent reduction by 2014 in SE’s Medical Incident Rate;
an indicator of safety, workplace hazards and reduction of
injuries. After the second quarter of 2013, this stands at 43
per cent.
x
Risk
In addition, SE is pursuing goals in the following areas with varying degrees of progress:
• Percentage of annual growth gained by EcoXpert energy efficiency products and services
(directly correlated with the aforementioned S/G calculation).
• Number of employees who endorse SE as a “great place to work”.
• Days of training per employee per year.
• Percentage of commodity strategy suppliers who adhere to ISO 26000 guidance and the
Global Compact’s 10 principles.
• Number of training missions in communities over the first three years of Schneider Electric
Teachers, a new program created in 2012. cxiv
Sustainability-driven productivity
In addition to the aforementioned S/P gains, the company is now focused on turning its own operational
energy efficiency savings into a figure of tangible revenue saved for disclosure in its next annual report.
In light of its multiple lines of business, the company is also working on a sector breakdown to
determine how much companies in different sectors stand to save in monetary terms. SE’s own internal
efforts on productivity could drive further revenue for the business. As a result, an S/P figure should be
forthcoming which analysts and fund managers would be able to relate to savings benefiting the
company’s bottom line.
Sustainability-related risk
In addition to the aforementioned S/R gains, the company continues to actively measure and report on
its established Barometer via its website, while at the same time launching an internal water
management plan. The company acknowledges that though this is not as material in terms of future risk
to revenue as it might be for a beverage or similar company, it wishes to demonstrate that it is
conscious of the most significant global issues regarding sustainability and is acting accordingly. Hence,
on these issues it marks its progress through external ranking partners such as CDP, the Dow Jones
Sustainability Index and the Global 100 Most Sustainable Companies.
Closing Observations
This case shows how companies such as SE have been driving business success directly through
sustainability initiatives. It also demonstrates that concrete productivity savings can help drive further
revenue. In addition, establishing key metrics and areas of focus from a risk perspective as SE has done
through its Planet and Society Barometer, can provide maximum transparency for the benefit of both
internal and external stakeholders.
SE is an example of a company that integrates its thinking, strategy and reporting directly into business
terms. Investors, in recognising many companies are exploring the Value Driver Model for the first time,
could encourage businesses to provide high levels of transparency within a balanced context. The most
compelling information for investors is a clearly-explained process by company management on how
S/GPR has been determined and relevant metrics and targets have been defined. Absolute or non-
contextualized data will not help investors to understand companies’ value creation in the short and
long term.
SE’s efforts to further its sustainable business practices have coincided with an attractive equity
evaluation. In parallel to its progress in S/GPR terms, the company’s share price has increased from just
over EUR 10 per share in early 2009 to over EUR 61 per share in late 2013.
Swiss Re: Opportunity from Risk
This case profiles how Swiss Re has applied the aspects of sustainability-related risk
managementcxv
(S/R) in the Value Driver Model to its business.
Strategic Overview
Swiss Re, a 150-year-old company that is currently the second largest reinsurance firm globally, seeks to
differentiate itself by providing sophisticated advice to help businesses and governments understand
how they will need to adapt to the expected effects of climate change. Reinsurers are directly affected
by climate risks, as they insure the insurers of properties and facilities exposed to storms such as
Hurricane Sandy, which caused over USD 50 billion in damages in the northeast United States in 2012.cxvi
Anticipated Results
Swiss Re foresees the emergence of two types of reinsurers: lean reinsurers who perform simple
transactions, and more involved solutions providers. The company endeavours to be one of the latter,
and believes these more complex service offerings will help it financially outperform its peers. Indeed, if
the effects of climate change increase as is commonly predicted, companies such as Swiss Re are hoping
to be best positioned to capture significant revenue gains based on the experience they accumulate.
Lessons Learned from Swiss Re
Sustainability-related risk
Swiss Re has focused on sustainability for over 20 years, dating back to when it first reported on the
topic and identified climate change as an emerging risk for the insurance industry. As part of its ongoing
research efforts to identify emerging risks to society, Swiss Re found climate effects to be particularly
relevant for the reinsurance industry, which comprised the majority of its business. The company set up
its sustainability team in 1998. Climate change first became a topic of intense interest in the early 2000s
and Swiss Re entered the climate risk management business in 2005. The company worked to
simultaneously calculate the business impacts of environmental, social and governance factors. As the
company began to develop its sustainability risk framework, political risk was merged into the
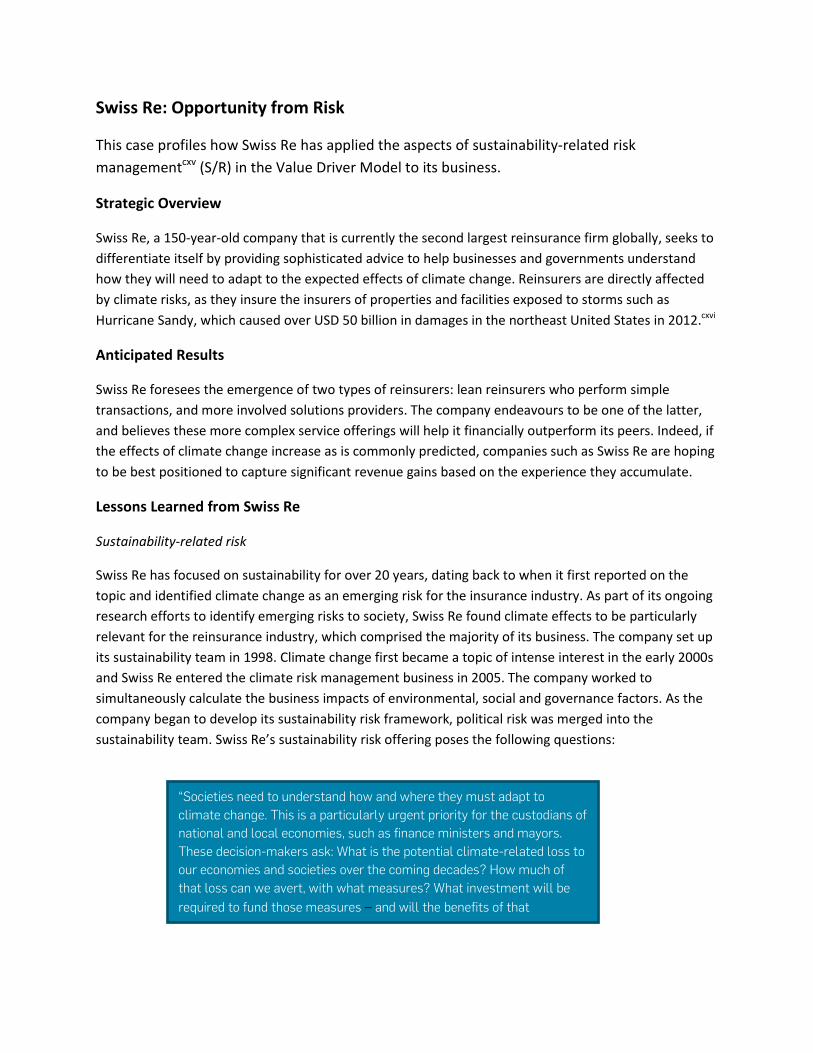
sustainability team. Swiss Re’s sustainability risk offering poses the following questions:
“Societies need to understand how and where they must adapt to
climate change. This is a particularly urgent priority for the custodians of
national and local economies, such as finance ministers and mayors.
These decision-makers ask: What is the potential climate-related loss to
our economies and societies over the coming decades? How much of
that loss can we avert, with what measures? What investment will be
required to fund those measures – and will the benefits of that
Swiss Re’s "Shaping Climate-Resilient Development" reportcxvii
intends to inform Governments of a
systematic approach to answering the above questions. Written by the company’s Economics of Climate
Adaptation (ECA) working groupcxviii
, the report identifies the potential impacts of climate on economies
and isolates actions to reduce impacts at lowest cost. The ECA methodology has been tested in diverse
locations globally, representing various climate hazards, economic impacts and development stages.
"Shaping Climate-Resilient Development" profiled several regions around the world and found that
climate patterns are already responsible for annualised losses of up to 12 per cent of GDP, likely to
increase to 19 per cent of GDP by 2030. At the same time, the report argued that specific, cost-effective
adaptation measures are able to prevent anywhere between 40 and 68 per cent of the expected
economic losses.cxix
Swiss Re’s risk framework establishes a goal of identifying potential risk now and in the future for a
particular region in a comprehensive risk management assessment. The framework ranks risks and
analyses them by category and affected economic sector in quantified, monetary terms. The framework
also uses scenario planning to prioritise potential actions, typically projecting three possible scenarios
until 2030 for each case. They develop an inventory of current and possible local adaptation measures,
and apply a cost-benefit analysis to each to assist in the development of regional planning.
When assessing risks that emerge across drought, floods, sea level rise and increasingly intense storms,
the framework uses three key inputs to calculate potential losses:
• Hazard
Using frequency and severity of scenarios of the most relevant hazards with maps showing
vulnerable public, residential, commercial or agricultural assets.
• Value
The risk to these same areas in monetary terms up until 2030.
• Vulnerability
Using vulnerability curves, which show the potential damage for each asset class by levels of
severity of the hazards above.
Swiss Re then applies a specific cost-benefit assessment to recommend steps and contribute to regional
assessments and plans.
Past efforts
Its most recent work in this area includes contributing to New York City’s post-Hurricane Sandy study
entitled “A Stronger, More Resilient New York,”cxx
aimed at not only rebuilding damaged communities,
but also increasing the resilience of the city’s infrastructure and buildings. This includes detailing
hundreds of steps in anticipation of another USD 90 billion in damages over the coming decades,
according to one developed scenario. While the reports make clear that the future effects of climate
change cannot be precisely known, Swiss Re has demonstrated how proactive risk management, that
can be productive for societies and economies, also benefits its own bottom line.
Closing Observations
Swiss Re serves as an example of a company that worked to find profitable business opportunities via
services that address one of its most material business operating risks. Scientists expect multiple
degrees of average temperature change, as reported recently by the IPCCcxxi
, and this will impact
businesses to varying degrees based on where they operate. As the imperative to adapt to climate
change effects increases, financial services organisations such as Swiss Re will be better positioned if
they anticipate this. A variety of approaches make sense depending on the area of financial services in
question, but impacts are almost certain to affect insurance, real estate, infrastructure, fixed income
and private and public equity.
Investors, in recognising many companies are exploring the Value Driver Model for the first time, could
encourage businesses to provide high levels of transparency within a balanced context. The most
compelling information for investors is a clearly-explained process by company management on how
S/GPR has been determined and relevant metrics and targets have been defined. Absolute or non-
contextualised data will not help investors to understand companies’ value creation in the short and
long term.
Swiss Re’s efforts to further its sustainable business practices have coincided with an attractive equity
evaluation. In parallel, Swiss Re’s share price has risen from USD 12 to USD 74 over the past four
years.cxxii
Andreas Spiegel, Head of Sustainability and Political Risk for Swiss Re, stated that:
“Knowledge-focused companies such as Swiss Re, providing services and not just reinsurance, have been
outperforming peers as a result of this approach.”cxxiii
i (S/G) Relative growth rate of sustainability-advantaged revenue to revenue overall. ii (S/P) Contribution to operating income from sustainability initiatives. iii
(S/R) Potential for risks to revenue and brand from key sustainability factors. iv "Airline Industry Stock Outlook - Aug. 2013." Yahoo Finance. 7 August 2013.
<http://finance.yahoo.com/news/airline-industry-stock-outlook-aug-170501027.html>. v “2011 Annual Report.” Boeing. 2013.
<http://www.boeing.com/assets/pdf/companyoffices/financial/finreports/annual/2012/annual_report.pdf>. vi “787 Dreamliner.” Boeing. 2013.
<http://www.boeing.com/boeing/commercial/787family/background.page>. vii
“737 Family.” Boeing. 2013. <http://www.boeing.com/boeing/commercial/737family/737max.page>. viii
“Fuel Cons Series.” Boeing. 2013. <http://www.boeing.com/commercial/aero>. ix For the purposes of this case study, sustainability-advantaged planes include those most recently designed to be 10 per cent or more fuel
efficient than their predecessors, such as the 737MAX. This calculation was performed by S3 from Boeing’s most recent backlog report. Boeing,
in general, attempts to increase efficiencies in their plane designs and via other technologies such as air traffic management software. x “Long-Term Market.” Boeing. 2013. <http://www.boeing.com/boeing/commercial/cmo>. xi "Boeing 737 MAX ups the ante in dogfight with A320neo." Aspire Aviation. 2013.
<http://www.aspireaviation.com/2012/07/20/boeing-737-max-ups-the-ante-in-dogfight-with-a320neo/>. xii S3 interpretation of Boeing’s most recent backlog and 20-year forecast. xiii
“2011 Annual Report.” (See fifth endnote). xiv
“The Boeing Company 2013 Environment Report.” Boeing. 2013.
<http://www.boeing.com/aboutus/environment/environment_report_13/2013_environment_report.pdf>.

xv “The Boeing Company 2013 Environment Report.” (See fifteenth endnote). xvi
Any share price movements come from a review of Yahoo Finance as interpreted by this research.
Additional Sources
Interview with Terry Mutter, Director Strategic Management and Environmental Health and Safety, and Joanna Pickup, Environmental
Communications, Boeing. 6 August 2013.
xvii (S/G) Relative growth rate of sustainability-advantaged revenue to revenue overall.
xviii (S/P) Contribution to operating income from sustainability initiatives.
xix North, Jeffrey. "Ecosystem Services and the Business Case for Nature: The Nature Conservancy - Dow Chemical Company Collaboration."
Dow. 3 April 2013.
<http://isites.harvard.edu/fs/docs/icb.topic1221938.files/Nature_Conservancy_Dow_Chemical_Company_Collaboration_Jeff_North.pdf>. xx
"2015 Sustainability Goals 2Q 2013 Update." Dow. 2013.
<http://www.dow.com/sustainability/pdf/38444-Q2SustainabilityReport2013.pdf>. xxi
"The Dow Sustainability Report." Dow. 2009. <http://www.dow.com/sustainability/pdf/GRI_updates_09022010.pdf>. xxii
“Dow’s Amazing $7 Billion Profit on Green” Fortune. 2011.
<http://tech.fortune.cnn.com/2011/04/05/dows-amazing-7-billion-profit-on-green/>. xxiii
"The Dow Chemical Company (DOW) Income Statement." Yahoo Finance. 2013.
<http://finance.yahoo.com/q/is?s=DOW+Income+Statement&annual>. xxiv
Interview with Mark Weick, Director of Sustainability Programs, Dow. August 2013. xxv
Sustainable Chemistry. Dow. 2013.
<http://www.dow.com/sustainability/goals/chemistry.htm>. xxvi
Interview with Mark Weick, Director of Sustainability Programs, Dow; August 2013. xxvii
Sustainable Chemistry. (See ninth endnote). xxviii
"2015 Sustainability Goals 2Q 2013 Update." (See fourth endnote). xxix
"Ecosystem Services and the Business Case for Nature: The Nature Conservancy - Dow Chemical Company Collaboration." (See first
footnote).
xxx
(S/G) Relative growth rate of sustainability-advantaged revenue to revenue overall. xxxi
(S/P) Contribution to operating income from sustainability initiatives. xxxii
(S/R) Potential for risks to revenue and brand from key sustainability factors xxxiii
For more on how DuPont defines sustainability-advantaged products, see the ‘How DuPont Did It’ section. These definitions typically vary by
company. xxxiv
“2010 Sustainability Report.” DuPont. 2010
<http://www2.dupont.com/Capstone/en_US/assets/downloads/DuPont_2010_Sustainability_Progress_Report.pdf> xxxv
"2012 Sustainability Report." DuPont. 2013.
<http://www.dupont.com/content/dam/assets/corporate-functions/our-approach/sustainability>
xxxvi Non-depletable resources are essential so that companies can grow or otherwise sustain their businesses indefinitely. For example, it will be
harder for companies to operate in regions of the world where fresh water is scarce, whereas this may not be a medium-term issue in other
geographical areas. xxxvii
"2012 Sustainability Report." (See sixth endnote).
xxxviii Calculation by S3, comparing sustainability-advantaged revenue growth versus overall revenue growth of the company from 2007 through
2011, using DuPont’s sustainability reports, particularly 2012. Note this calculation is pre-2013 sale of the DuPont’s performance coatings
business. xxxix
This and other thresholds presented here were deemed reasonable by the authors for the purposes of this analysis. They are illustrative and
could vary in different company contexts. xl “Dupont Annual Income Statement.” DuPont. 2013
<http://www.investors.dupont.com/phoenix.zhtml?c=73320&p=irol-fundIncomeA> xli
S3 Derived from DuPont’s sustainability reports, particularly 2011-2 sustainability progress reports.
<http://www2.dupont.com/Sustainability/en_US/DuPont_2011_Sustainability_Progress_Report.pdf> xlii
S3 Derived from DuPont’s sustainability reports, particularly 2011-2 sustainability progress reports.
<http://www2.dupont.com/Sustainability/en_US/DuPont_2011_Sustainability_Progress_Report.pdf> xliii
S3 Derived from DuPont’s sustainability reports, particularly 2011-2 sustainability progress reports.
<http://www2.dupont.com/Sustainability/en_US/DuPont_2011_Sustainability_Progress_Report.pdf>

xliv
"DuPont Company Textile Fabrics Department videotapes, photographs, slides and promotions." Hagley Museum and Library. 2013.
<http://www.dupont.com/content/dam/assets/corporathttp://findingaids.hagley.org/xtf/view?docId=ead/2011_320.xmle-functions/our-
approach/sustainability/performance-reporting/articles/documents/DuPont_2011> xlv
"2012 Global Reporting Initiave Report." DuPont. 2013.
<http://www.dupont.com/content/dam/assets/corporate-functions/our-approach/sustainability> xlvi
"DuPont." Green Order. 2013. <http://greenorder.com/dupont.html?CASE_STUDIES=§ion=CLIENTS+>. xlvii
"2011 Sustainability Report." DuPont. 2010. xlviii
Interview with Dawn Rittenhouse, Director of Sustainable Development, DuPoint. July 2013. xlix
Lifecycle analysis (LCA) work is usually performed at a detailed level on an individual product basis and as such can become costly if carried
out on thousands of individual products. Such analysis considers the upstream raw materials used in product creation, the processes used to
create them, and the use phase of end products as well as shipping, etc. Many companies do a “hotspotting” version of LCA, giving them a
sense of where the largest impacts are in both a relative and absolute sense, so that they can determine where to best focus their efficiency
efforts. There are also uncertainty factors to consider with any footprinting methodologies on products, facilities and companies as a whole. l "2011 Sustainability Report." DuPont. (See 18th endnote).
Additional resources
2008-10 DuPont sustainability reports
"The DuPont Company." Delaware Historical Society. 2009.
<http://www.hsd.org/DHE/DHE_what_industry_DuPont.htm>.
Interview with Dawn Rittenhouse, Director of Sustainable Development, DuPont. July 2013.
li (S/G) Relative growth rate of sustainability-advantaged revenue to revenue overall. lii
(S/P) Contribution to operating income from sustainability initiatives. liii
(S/R) Potential for risks to revenue and brand from key sustainability factors. liv
"EcoVision." Philips. 2013
. <http://www.philips.com/about/sustainability/ecovision/index.page>. lv "EcoVision." (See first endnote).
lvi "Integrated Annual Report." Philips. 2013. <http://www.philips.com/about/sustainability/integratedannualreport/index.page>.
lvii "Integrated Annual Report." (See third endnote).
lviii From Presentation, Henk de Bruin, SVP Sustainability Philips, Nomura SRI Conference May 2013
lix Light-emitting diodes (LEDs) are assembled into lamps for use in lighting fixtures which emit white or colored light. LED lamps have a long life
relative to incandescent and some fluorescent lamps, though at a higher initial expense. lx "Energy Efficiency: More Cities Look to LED Lights for Brighter Streets, Lower Energy Needs." E&E Publishing, LLC. 22 June 2012.
<http://www.eenews.net/stories/1059966304>. lxi
"Philips increases sales of Green Products to 39% of total sales and focuses on commitment to Green Innovation." Philips. 23 Feb. 2012.
<http://www.newscenter.philips.com/main/standard/news/press/2012/20120223_sustainability_report_2011.wpd#.UoUIH0oo4dk>. lxii
"Annual Report 2012." Philips. 2013.
<http://www.annualreport2012.philips.com/annual_report_2012/en/group_performance/environmental_performance/green_product_sales.a
spx>. lxiii
"Definitions and abbreviations." Philips. 2013.
<http://www.annualreport2012.philips.com/annual_report_2012/en/definitions_and_abbreviations.aspx>. lxiv
"Life-Cycle Assessment of Energy and Environmental Impacts of LED Lighting Products." U.S. Department of Energy. Feb. 2012.
<http://apps1.eere.energy.gov/buildings/publications/pdfs/ssl/2012_LED_Lifecycle_Report.pdf>. lxv
"Energy Efficiency." Philips. 2013. <http://www.philips.com/about/sustainability/oursustainabilityfocus/energyefficiency/>. lxvi
"Supplier indicators." Philips. 2013.
<http://www.annualreport2012.philips.com/annual_report_2012/en/sustainability_statements/supplier_indicators.aspx>. lxvii
Philips works with the Ellen MacArthur Foundation on the idea of a circular economy, which they believe has much promise. They see that
lighting accounts for roughly 19 per cent of the world’s footprint, with LED having the potential to create up to 80 per cent savings, which
translates into a lower footprint and reduced cost of use. They are further working on defining the social benefit of energy savings, and the risk
management benefits to shareholders. lxviii
"Supplier indicators." (See twelfth endnote). lxix
(S/G) Relative growth rate of sustainability-advantaged revenue to revenue overall. lxx
(S/P) Contribution to operating income from sustainability initiatives. lxxi
(S/R) Potential for risks to revenue and brand from key sustainability factors. lxxii
Any share price movements come from a review of Yahoo Finance as interpreted by this research. lxxiii
"Sustainable Development Report 2012 Data Year." Praxair, Inc. 2013 lxxiv
"Sustainable Development Report 2012 Data Year." (See fifth endnote). lxxv
"Sustainable Development Report 2012 Data Year." (See fifth endnote).
lxxvi
"Carbon Disclosure Project." Praxair, Inc. 2013.
<http://www.praxair.com/~/media/North%20America/US/Documents/Reports%20Papers%20Case%20Studies%20and%20Presentations/Our%
20Company/Sustainable%20Development/Praxair%20Investor_CDP_2013%20response_FIN.ashx>. lxxvii
"Carbon Disclosure Project." (See seventh endnote). lxxviii
"Sustainable Development Report." Praxair, Inc. 2013.
<http://www.praxair.com/~/media/North%20America/US/Documents/Reports%20Papers%20Case%20Studies%20and%20Presentations/Our%
20Company/Sustainable%20Development/Sustainable_Development_Report_2012.ashx>. lxxix
"Sustainable Development Report 2012 Data Year." (See fifth endnote) lxxx
“Sustainable Development Report 2012 Data Year." Page 3. (See fifth endnote) lxxxi
“Sustainable Development Report 2012 Data Year." (See fifth endnote) lxxxii
“Sustainable Development Report 2012 Data Year." (See fifth endnote) lxxxiii
"How to Become a Sustainable Company." MIT Sloan Management Review RSS. 2013.
<http://sloanreview.mit.edu/article/how-to-become-a-sustainable-company/>. lxxxiv
Interview with Riva Krut, Vice President and Chief Sustainability Officer, Praxair. August 5, 2013
Additional Sources
Interview with Riva Krut of Praxair. August 5, 2013
lxxxv
(S/G) Relative growth rate of sustainability-advantaged revenue to revenue overall. lxxxvi
(S/R) Potential for risks to revenue and brand from key sustainability factors. lxxxvii
"Our Approach to Sustainability." Reckitt Benckiser. 2013.
<https://www.rb.com/our-responsibility/betterbusiness>. lxxxviii
S3 estimate from Reckitt Benckiser sustainability and annual reports 2012. lxxxix
"Annual Report and Financial Statements 2012." Reckitt Benckiser. 2012.
<http://www.rb.com/documentdownload.axd?documentresourceid=44050>. xc
"Annual Report and Financial Statements 2012." (See fourth endnote). xci
"Sustainability Report 2012." Reckitt Benckiser. 2013.
<http://www.rb.com/documentdownload.axd?documentresourceid=48859>. xcii
"Executive Committee." Reckitt Benckiser. 2013.
<http://www.rb.com/rb-worldwide/executive-committee>. xciii
"Sustainability Report 2012." (See seventh endnote). xciv
"Healthier Kids Happier Homes." Save the Children. 2013.
<http://www.savethechildren.org.uk/about-us/who-we-work-with/corporate-partnerships/our-partners/rb>. xcv
“Our Approach to Sustainability." (See third endnote). xcvi
"Our Approach to Sustainability." (See third endnote). xcvii
“Sustainability Report 2012." (See seventh endnote). xcviii
Any share price movements come from a review of Yahoo Finance as interpreted by this research.
Additional Sources
Interview with Dave Challis, Director of Global Sustainability, Environment, Health and Safety, Reckitt Benckiser. 5 August 2013
xcix (S/G) Relative growth rate of sustainability-advantaged revenue to revenue overall.
c (S/P) Contribution to operating income from sustainability initiatives. ci (S/R) Potential for risks to revenue and brand from key sustainability factors.
cii "History of Schneider Electric." Schneider Electric. 2013.
<http://www.schneider-electric.com/sites/corporate/en/group/profile/history/schneider-electric-history-animation.page>. ciii
"2013 Financial Results." Schneider Electric. 2013.
<http://www.schneider-electric.com/sites/corporate/en/finance/presentations/financial-results.page>. civ
Any share price movements come from a review of Yahoo Finance as interpreted by this research. cv This and other thresholds presented here were deemed reasonable by the authors for the purposes of this analysis. They are
illustrative and could vary in different company contexts. cvi
"Planet and Society Barometer."Schneider Electric. 2013.
<http://www.schneider-electric.us/sites/us/en/company/sustainable-development-and-foundation/planet-and-society-barometer/planet-and-
society-barometer.page.>. cvii
"2013 Half-Year Results." Schneider Electric. 2013.
<http://www.schneider-electric.com/documents/financial-results/en/local/2013-half-year-results/presentation-hy-2013-en.pdf>. cviii
"Schneider Electric, 170 Years of History." Schneider Electric. March 2005 .
<http://www.schneider-electric.com/documents/presentation/en/local/2006/12/se_history_brands_march2005.pdf>.

cix
"Lighting Control Catalogue." Schneider Electric. 2013.
<http://www.schneider-electric.com/documents/buildings/lighting-control-catalogue.pdf>. cx
"Barometer Guide." Schneider Electric. 2013.
<http://www2.schneider-electric.com/documents/sustainable-development-and-foundation/en/barometer-guide-en.pdf>. cxi
"Score S409." Schneider Electric. 2013.
<http://www.schneider-electric.us/documents/sustainable-development-and-foundation/en/score_s409.pdf>. cxii
"Sustainability Performance Evolution." Schneider Electric. 2013.
<http://www2.schneider-electric.com/sites/corporate/en/group/sustainable-development-and-foundation/planet-and-society-barometer/our-
sustainable-development-scorecard/sustainability-performance-evolution.page>. cxiii
After the second quarter of 2013, SE is more than halfway to achieving these goals. It is likely to achieve them if it maintains its current pace
of progress. cxiv
"Sustainability Performance Evolution." (See 14th endnote). cxv
(S/R) Potential for risks to revenue and brand from key sustainability factors. cxvi
"Family Digs Deep Into Life Savings to Rebuild Business After Hurricane Sandy." Yahoo Finance. 2013.
<http://finance.yahoo.com/blogs/breakout/retirement-delayed-jersey-shore-business-funds-sandy-repairs-134454126.html>. cxvii
"How the world’s economies can help shape climate-adaptation approaches." McKinsey & Company. September 2009.
<http://mckinseyonsociety.com/shaping-climate-resilient-development/>. cxviii
The ECA is a consortium that also involves the Global Environment Facility, McKinsey & Company, the Rockefeller Foundation,
ClimateWorks Foundation, the European Commission, Standard Chartered and other global academics and experts. cxix
"How the world’s economies can help shape climate-adaptation approaches." (See third endnote). cxx
"A Stronger, More Resilient New York." NYC Special Initiative for Rebuilding and Resiliency. 11 June 2013.
<http://nytelecom.vo.llnwd.net/o15/agencies/sirr/SIRR_singles_Hi_res.pdf>. cxxi
"Climate Change 2013." IPCC. 27 September 2013.
<http://www.ipcc.ch/report/ar5/wg1/#.UoPI60oo4dk>. cxxii
Any share price movements come from a review of Yahoo Finance as interpreted by this research. cxxiii
Interview with Andreas Spiegel of Swiss Re. August 8, 2013