boeing financial analysis sukanta
DESCRIPTION
this is a nice documentTRANSCRIPT
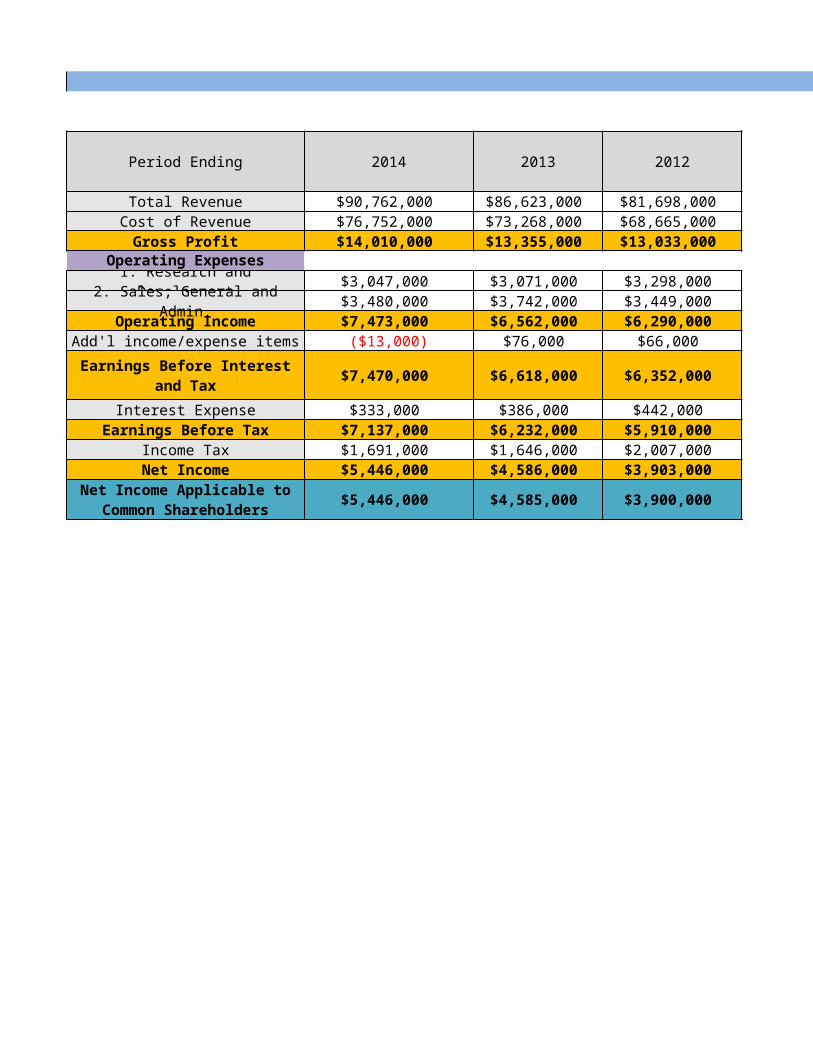
Comparative Income Statement
Period Ending 2014 2013 2012
Total Revenue $90,762,000 $86,623,000 $81,698,000 Cost of Revenue $76,752,000 $73,268,000 $68,665,000
Gross Profit $14,010,000 $13,355,000 $13,033,000 Operating Expenses
1. Research and Development $3,047,000 $3,071,000 $3,298,000 2. Sales, General and Admin. $3,480,000 $3,742,000 $3,449,000
Operating Income $7,473,000 $6,562,000 $6,290,000 Add'l income/expense items ($13,000) $76,000 $66,000
$7,470,000 $6,618,000 $6,352,000
Interest Expense $333,000 $386,000 $442,000 Earnings Before Tax $7,137,000 $6,232,000 $5,910,000
Income Tax $1,691,000 $1,646,000 $2,007,000 Net Income $5,446,000 $4,586,000 $3,903,000
$5,446,000 $4,585,000 $3,900,000
Earnings Before Interest and Tax
Net Income Applicable to Common Shareholders

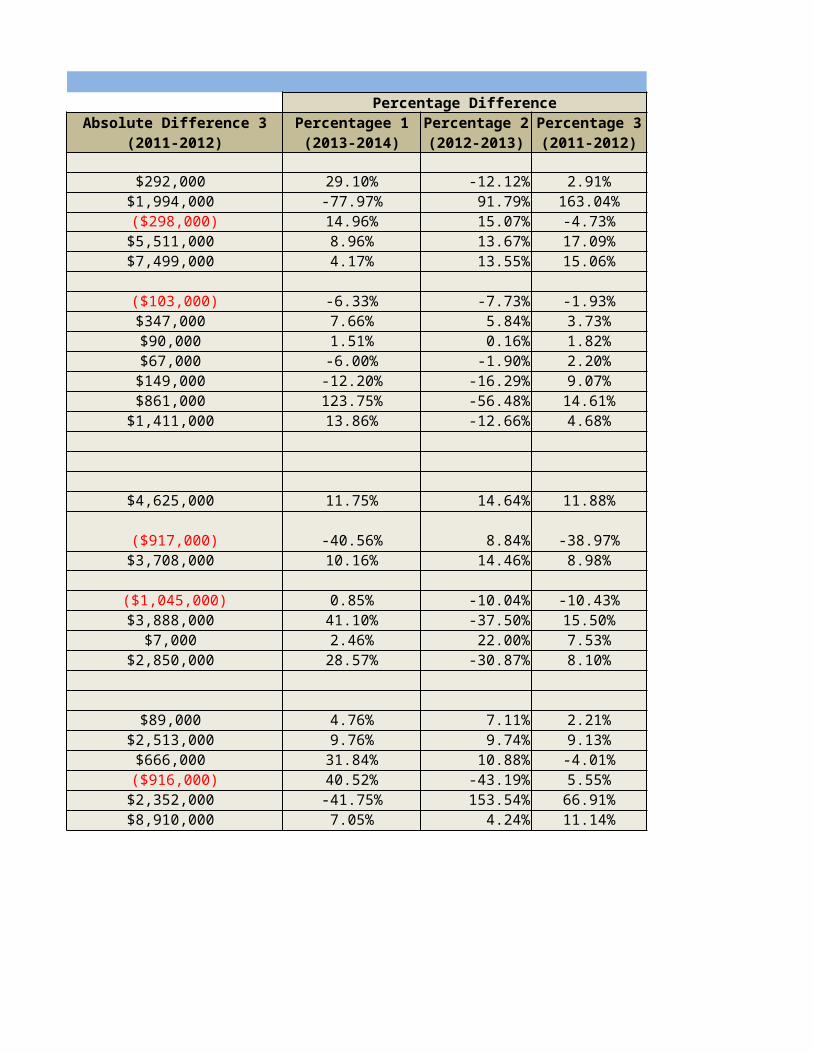
Comparative Income Statement
Percentage Difference
2011
$68,735,000 $4,139,000 $4,925,000 $12,963,000 4.78%$55,888,000 $3,484,000 $4,603,000 $12,777,000 4.76%$12,847,000 $655,000 $322,000 $186,000 4.90%
$0 $0 $0 0.00%$3,918,000 ($24,000) ($227,000) ($620,000) -0.78%$3,130,000 ($262,000) $293,000 $319,000 -7.00%$5,823,000 $911,000 $272,000 $467,000 13.88%
$71,000 ($89,000) $10,000 ($5,000) -117.11%
$5,870,000 $852,000 $266,000 $482,000 12.87%
$477,000 ($53,000) ($56,000) ($35,000) -13.73%$5,393,000 $905,000 $322,000 $517,000 14.52%$1,382,000 $45,000 ($361,000) $625,000 2.73%$4,011,000 $860,000 $683,000 ($108,000) 18.75%
$4,018,000 $861,000 $685,000 ($118,000) 18.78%
Absolue Difference 1 (2013-2014)
Absolute Difference 2 (2012-2013)
Absolute Difference 3 (2011-2012)
Percentagee 1 (2013-2014)

Comparative Income Statement
Percentage Difference
6.03% 18.86%6.70% 22.86%2.47% 1.45%0.00% 0.00%-6.88% -15.82%8.50% 10.19%4.32% 8.02%
15.15% -7.04%
4.19% 8.21%
-12.67% -7.34%5.45% 9.59%
-17.99% 45.22%17.50% -2.69%
17.56% -2.94%
Percentage 2 (2012-2013)
Percentage 3 (2011-2012)
From the Income statement Total Revenue is decreased and it further decreased due to reduction is cost of revenue. So gross
profit is increasing.
Operating income increases due to operation expenses decreases.
Net income is also increased due to increase in Operative Income and decrease in expenses.

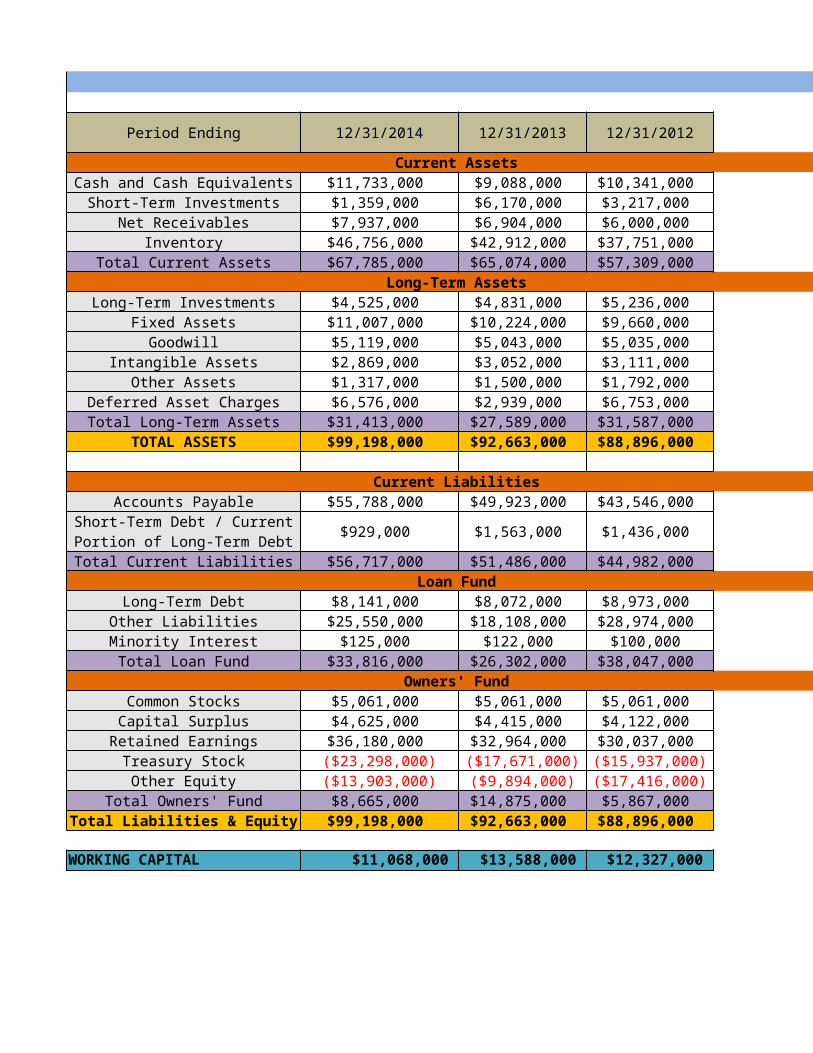
Comparative Balance Sheet
Period Ending 12/31/2014 12/31/2013 12/31/2012 12/31/2011
Current AssetsCash and Cash Equivalents $11,733,000 $9,088,000 $10,341,000 $10,049,000 Short-Term Investments $1,359,000 $6,170,000 $3,217,000 $1,223,000
Net Receivables $7,937,000 $6,904,000 $6,000,000 $6,298,000 Inventory $46,756,000 $42,912,000 $37,751,000 $32,240,000
Total Current Assets $67,785,000 $65,074,000 $57,309,000 $49,810,000 Long-Term Assets
Long-Term Investments $4,525,000 $4,831,000 $5,236,000 $5,339,000 Fixed Assets $11,007,000 $10,224,000 $9,660,000 $9,313,000
Goodwill $5,119,000 $5,043,000 $5,035,000 $4,945,000 Intangible Assets $2,869,000 $3,052,000 $3,111,000 $3,044,000
Other Assets $1,317,000 $1,500,000 $1,792,000 $1,643,000 Deferred Asset Charges $6,576,000 $2,939,000 $6,753,000 $5,892,000 Total Long-Term Assets $31,413,000 $27,589,000 $31,587,000 $30,176,000
TOTAL ASSETS $99,198,000 $92,663,000 $88,896,000 $79,986,000
Current LiabilitiesAccounts Payable $55,788,000 $49,923,000 $43,546,000 $38,921,000
$929,000 $1,563,000 $1,436,000 $2,353,000
Total Current Liabilities $56,717,000 $51,486,000 $44,982,000 $41,274,000 Loan Fund
Long-Term Debt $8,141,000 $8,072,000 $8,973,000 $10,018,000 Other Liabilities $25,550,000 $18,108,000 $28,974,000 $25,086,000
Minority Interest $125,000 $122,000 $100,000 $93,000 Total Loan Fund $33,816,000 $26,302,000 $38,047,000 $35,197,000
Owners' FundCommon Stocks $5,061,000 $5,061,000 $5,061,000 $5,061,000 Capital Surplus $4,625,000 $4,415,000 $4,122,000 $4,033,000
Retained Earnings $36,180,000 $32,964,000 $30,037,000 $27,524,000 Treasury Stock ($23,298,000) ($17,671,000) ($15,937,000) ($16,603,000)Other Equity ($13,903,000) ($9,894,000) ($17,416,000) ($16,500,000)
Total Owners' Fund $8,665,000 $14,875,000 $5,867,000 $3,515,000 Total Liabilities & Equity $99,198,000 $92,663,000 $88,896,000 $79,986,000
WORKING CAPITAL $11,068,000 $13,588,000 $12,327,000 $8,536,000
Short-Term Debt / Current Portion of Long-Term Debt
Comparative Balance SheetPercentage Difference
$2,645,000 ($1,253,000) $292,000 29.10%($4,811,000) $2,953,000 $1,994,000 -77.97%$1,033,000 $904,000 ($298,000) 14.96%$3,844,000 $5,161,000 $5,511,000 8.96%$2,711,000 $7,765,000 $7,499,000 4.17%
($306,000) ($405,000) ($103,000) -6.33%$783,000 $564,000 $347,000 7.66%$76,000 $8,000 $90,000 1.51%
($183,000) ($59,000) $67,000 -6.00%($183,000) ($292,000) $149,000 -12.20%$3,637,000 ($3,814,000) $861,000 123.75%$3,824,000 ($3,998,000) $1,411,000 13.86%
$5,865,000 $6,377,000 $4,625,000 11.75%
($634,000) $127,000 ($917,000) -40.56%$5,231,000 $6,504,000 $3,708,000 10.16%
$69,000 ($901,000) ($1,045,000) 0.85%$7,442,000 ($10,866,000) $3,888,000 41.10%
$3,000 $22,000 $7,000 2.46%$7,514,000 ($11,745,000) $2,850,000 28.57%
$210,000 $293,000 $89,000 4.76%$3,216,000 $2,927,000 $2,513,000 9.76%($5,627,000) ($1,734,000) $666,000 31.84%($4,009,000) $7,522,000 ($916,000) 40.52%($6,210,000) $9,008,000 $2,352,000 -41.75%$6,535,000 $3,767,000 $8,910,000 7.05%
Absolue Difference 1 (2013-2014)
Absolute Difference 2 (2012-2013)
Absolute Difference 3 (2011-2012)
Percentagee 1 (2013-2014)

Comparative Balance SheetPercentage Difference
-12.12% 2.91%91.79% 163.04%15.07% -4.73%13.67% 17.09%13.55% 15.06%
-7.73% -1.93%5.84% 3.73%0.16% 1.82%
-1.90% 2.20%-16.29% 9.07%-56.48% 14.61%-12.66% 4.68%
14.64% 11.88%
8.84% -38.97%14.46% 8.98%
-10.04% -10.43%-37.50% 15.50%22.00% 7.53%
-30.87% 8.10%
7.11% 2.21%9.74% 9.13%
10.88% -4.01%-43.19% 5.55%153.54% 66.91%
4.24% 11.14%
Percentage 2 (2012-2013)
Percentage 3 (2011-2012)
From the balance sheet we can find cash and cash equivalent has been increased from 2011 to 2012 then it further decreases in 2013 and increases in 2014. So company has maximum cash compared with other years. So company can pay its liability
easily. In terms of Inventory it is decreased slowly. So sales
are reduced.In terms of Fixed asset we can find changes is
positive (increased manner) and highest at 2014.If we see current liability, it is increased in between
and then decreased but overall figure in 2014 is higher than 2011. Means they paid their liability due
to increase in sales. If we look into Loan fund it is decreased initially and then increases finally. This means owners has more
share than its creditor and after that loan fund increases, so there is a rise in Loan fund.
Owners fund initially increases due to decrease in Loan Fund and Owner’s fund is further reduced due
to increase in Total Loan Fund.
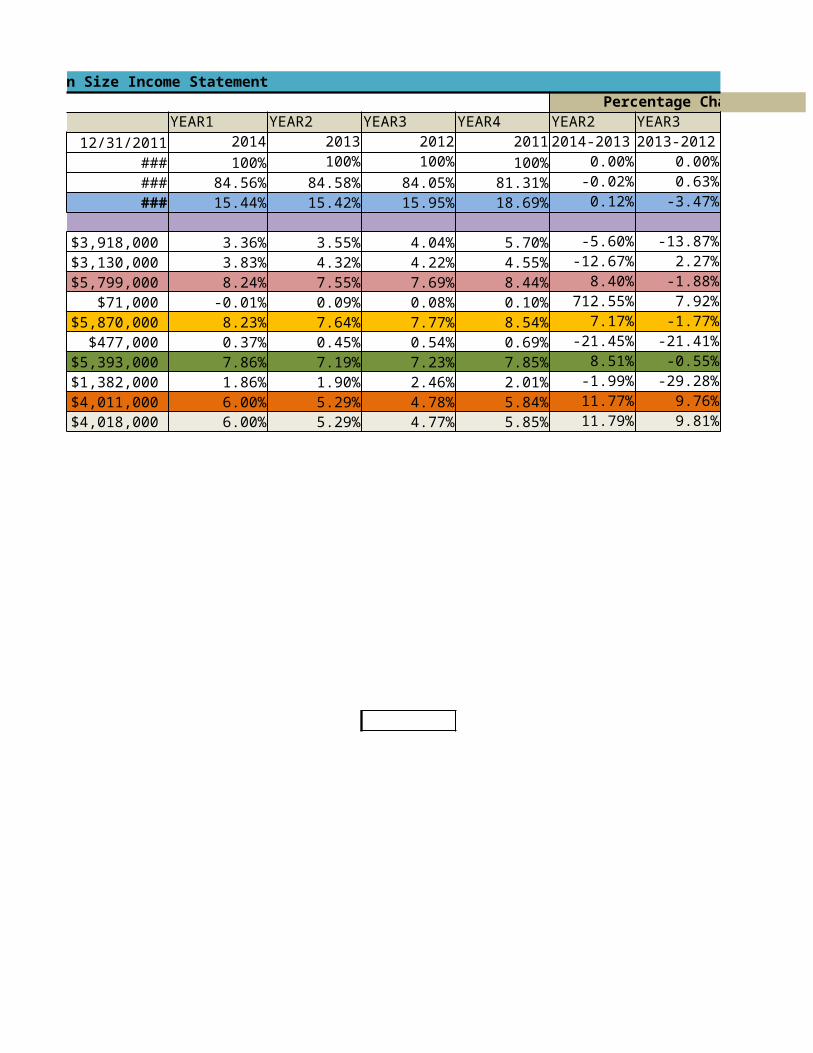
Common Size Income Statement
Period Ending YEAR1PARTICULARS 12/31/2014 12/31/2013 12/31/2012 12/31/2011 2014
Total Revenue $90,762,000 $86,623,000 $81,698,000 $68,735,000 100%$76,752,000 $73,268,000 $68,665,000 $55,888,000 84.56%
Gross Profit $14,010,000 $13,355,000 $13,033,000 $12,847,000 15.44%Less: Operating Expenses1. Research and Development $3,047,000 $3,071,000 $3,298,000 $3,918,000 3.36%2. Sales, General and Admin. $3,480,000 $3,742,000 $3,449,000 $3,130,000 3.83%Operating Income $7,483,000 $6,542,000 $6,286,000 $5,799,000 8.24%Add: Addl income/expense items ($13,000) $76,000 $66,000 $71,000 -0.01%Earnings Before Interest and Tax $7,470,000 $6,618,000 $6,352,000 $5,870,000 8.23%Less: Interest Expense $333,000 $386,000 $442,000 $477,000 0.37%Earnings Before Tax $7,137,000 $6,232,000 $5,910,000 $5,393,000 7.86%Income Tax $1,691,000 $1,646,000 $2,007,000 $1,382,000 1.86%Net Income $5,446,000 $4,586,000 $3,903,000 $4,011,000 6.00%
$5,446,000 $4,585,000 $3,900,000 $4,018,000 6.00%
Less: Cost of Revenue
Net Income Applicable to Common Shareholders

Common Size Income StatementPercentage Change
YEAR2 YEAR3 YEAR4 YEAR2 YEAR3 YEAR42013 2012 2011 2014-2013 2013-2012 2012-2011100% 100% 100% 0.00% 0.00% 0.00%
84.58% 84.05% 81.31% -0.02% 0.63% 3.26%15.42% 15.95% 18.69% 0.12% -3.47% -17.16%
3.55% 4.04% 5.70% -5.60% -13.87% -41.20%4.32% 4.22% 4.55% -12.67% 2.27% -7.87%7.55% 7.69% 8.44% 8.40% -1.88% -9.65%0.09% 0.08% 0.10% 712.55% 7.92% -27.86%7.64% 7.77% 8.54% 7.17% -1.77% -9.84%0.45% 0.54% 0.69% -21.45% -21.41% -28.27%7.19% 7.23% 7.85% 8.51% -0.55% -8.46%1.90% 2.46% 2.01% -1.99% -29.28% 18.15%5.29% 4.78% 5.84% 11.77% 9.76% -22.15%5.29% 4.77% 5.85% 11.79% 9.81% -22.46%
If we saw Gross Profit, it is increases because cost of revenue decreases. Cost of revenue decreases means expenses decreases due to this Gross Profit increaes. Operating Income increases because operating expenses decreases. Net income increases it happened becauses company reduced their expenses.

If we saw Gross Profit, it is increases because cost of revenue decreases. Cost of revenue decreases means expenses decreases due to this Gross Profit increaes. Operating Income increases because operating expenses decreases. Net income increases it happened becauses company reduced their expenses.
Common Size Balance SheetPeriod Ending
PARTICULARS 12/31/2014 12/31/2013 12/31/2012 12/31/2011
Current AssetsCash and Cash Equivalents $11,733,000 $9,088,000 $10,341,000 $10,049,000 Short-Term Investments $1,359,000 $6,170,000 $3,217,000 $1,223,000 Net Receivables $7,937,000 $6,904,000 $6,000,000 $6,298,000 Inventory $46,756,000 $42,912,000 $37,751,000 $32,240,000 Total Current Assets $67,785,000 $65,074,000 $57,309,000 $49,810,000
Long-Term AssetsLong-Term Investments $4,525,000 $4,831,000 $5,236,000 $5,339,000 Fixed Assets $11,007,000 $10,224,000 $9,660,000 $9,313,000 Goodwill $5,119,000 $5,043,000 $5,035,000 $4,945,000 Intangible Assets $2,869,000 $3,052,000 $3,111,000 $3,044,000 Other Assets $1,317,000 $1,500,000 $1,792,000 $1,643,000 Deferred Asset Charges $6,576,000 $2,939,000 $6,753,000 $5,892,000 Total Long-Term Assets $31,413,000 $27,589,000 $31,587,000 $30,176,000 Total Assets $99,198,000 $92,663,000 $88,896,000 $79,986,000
Current LiabilitiesAccounts Payable $55,788,000 $49,923,000 $43,546,000 $38,921,000
$929,000 $1,563,000 $1,436,000 $2,353,000
Total Current Liabilities $56,717,000 $51,486,000 $44,982,000 $41,274,000 Loan Fund
Long-Term Debt $8,141,000 $8,072,000 $8,973,000 $10,018,000 Other Liabilities $25,550,000 $18,108,000 $28,974,000 $25,086,000 Minority Interest $125,000 $122,000 $100,000 $93,000 Total Loan Fund $33,816,000 $26,302,000 $38,047,000 $35,197,000
Owners' FundCommon Stocks $5,061,000 $5,061,000 $5,061,000 $5,061,000 Capital Surplus $4,625,000 $4,415,000 $4,122,000 $4,033,000 Retained Earnings $36,180,000 $32,964,000 $30,037,000 $27,524,000 Treasury Stock ($23,298,000) ($17,671,000) ($15,937,000) ($16,603,000)Other Equity ($13,903,000) ($9,894,000) ($17,416,000) ($16,500,000)Total Owners' Fund $8,665,000 $14,875,000 $5,867,000 $3,515,000 Total Liabilities & Equity $99,198,000 $92,663,000 $88,896,000 $79,986,000
Notes:Working Capital $11,068,000 $13,588,000 $12,327,000 $8,536,000
Short-Term Debt / Current Portion of Long-Term Debt

Common Size Balance SheetYEAR1 YEAR2 YEAR3 YEAR4 Percentage Change
2014 2013 2012 2011 YEAR2 YEAR3 YEAR42014-2013 2013-2012 2012-2011
11.83% 9.81% 11.63% 12.56% 17.08% -18.61% -8.00%1.37% 6.66% 3.62% 1.53% -386.03% 45.65% 57.75%8.00% 7.45% 6.75% 7.87% 6.88% 9.41% -16.66%
47.13% 46.31% 42.47% 40.31% 1.75% 8.30% 5.09%4.00% 11.93% 13.09%
4.56% 5.21% 5.89% 6.67% -14.29% -12.98% -13.33%11.10% 11.03% 10.87% 11.64% 0.56% 1.51% -7.15%
5.16% 5.44% 5.66% 6.18% -5.46% -4.07% -9.15%2.89% 3.29% 3.50% 3.81% -13.88% -6.25% -8.75%1.33% 1.62% 2.02% 2.05% -21.93% -24.53% -1.90%6.63% 3.17% 7.60% 7.37% 52.16% -139.51% 3.03%
12.17% -14.49% 4.47%100.00% 100.00% 100.00% 100.00% 0.00% 0.00% 0.00%
56.24% 53.88% 48.99% 48.66% 4.20% 9.08% 0.66%
0.94% 1.69% 1.62% 2.94% -80.11% 4.23% -82.11%9.22% 12.63% 8.24%
8.21% 8.71% 10.09% 12.52% -6.15% -15.87% -24.08%25.76% 19.54% 32.59% 31.36% 24.13% -66.79% 3.77%
0.13% 0.13% 0.11% 0.12% -4.48% 14.56% -3.36%22.22% -44.65% 7.49%
5.10% 5.46% 5.69% 6.33% -7.05% -4.24% -11.14%4.66% 4.76% 4.64% 5.04% -2.19% 2.68% -8.74%
36.47% 35.57% 33.79% 34.41% 2.46% 5.02% -1.84%-23.49% -19.07% -17.93% -20.76% 18.80% 5.99% -15.78%-14.02% -10.68% -19.59% -20.63% 23.82% -83.49% -5.29%
-71.67% 60.56% 40.09%100.00% 100.00% 100.00% 100.00% 0.00% 0.00% 0.00%
-22.77% 9.28% 30.75%

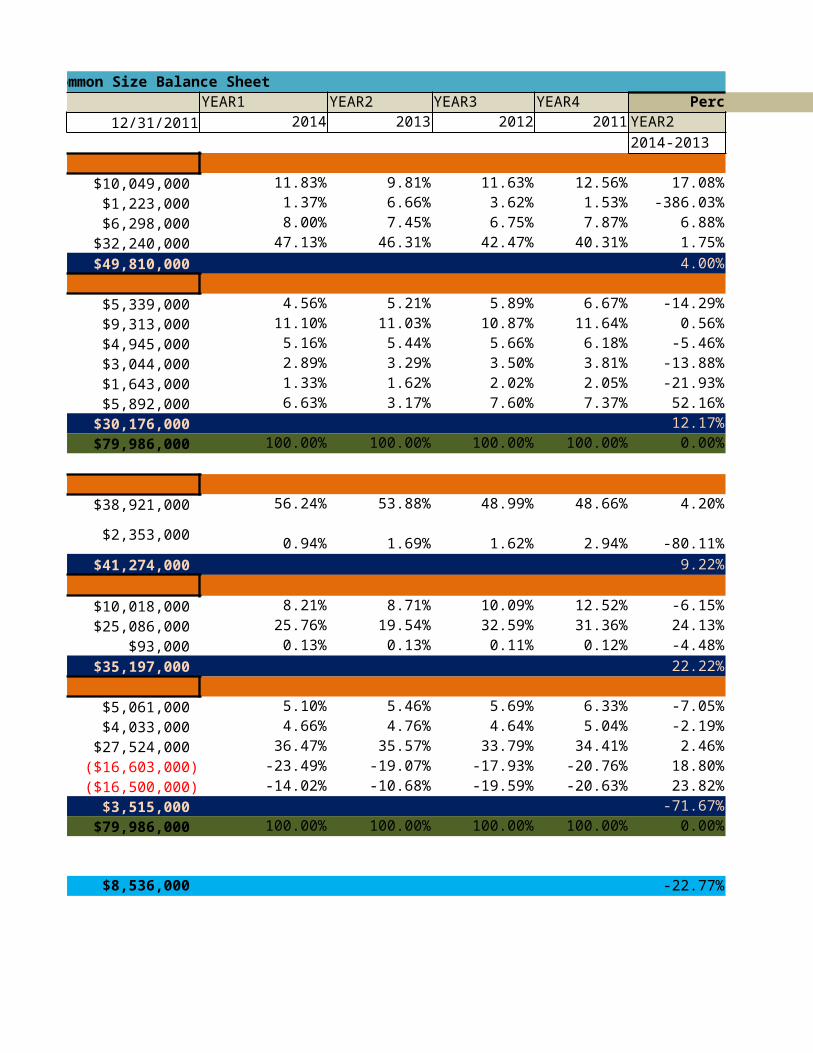
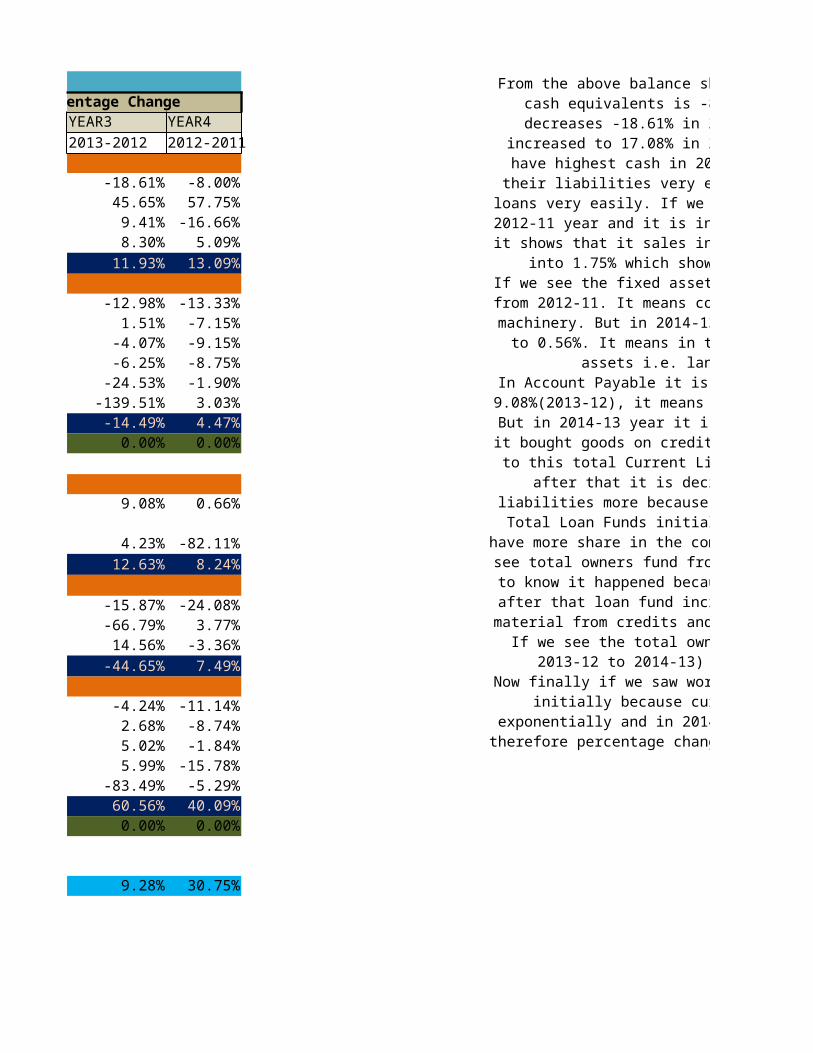
From the above balance sheet we clearly see that cash and cash equivalents is -8% in 2012-2011. It is further decreases -18.61% in 2013-2012 and after that it is increased to 17.08% in 2014-2013. It shows that company have highest cash in 2014 year it means they have paid their liabilities very easily. And they got short term loans very easily. If we
inventory row then it is 5.09% in 2012-11 year and it is increses to 8.30 % in 2013-12 years it shows that it sales increases and in 2014-13 it is dip
into 1.75% which shows that it sales decreases. If we see the fixed assets then it is increases in 2013-12 from 2012-11. It means company may bought lands or plant & machinery. But in 2014-13 years it is decrease from 1.51% to 0.56%. It means in this year company
sold his fixed assets i.e. land or plant & machines. In Account Payable it is increases from 0.66%(2012-11) to 9.08%(2013-12), it means they paid their liabilities more. But in 2014-13 year it is decreases
which may shows that it bought goods on credit less compare to other year. Due to this total Current Liability increases previously and after that
it is decreases, means they paid their liabilities more because their net sales also increases.
Total Loan Funds initially decreases which means owners have more share in the company compare to creditors (if we see total owners fund from
2012-11 to 2013-12 then we came to know it happened because total loan fund decfreases) , after that loan fund increases it means it take more raw
material from credits and treasury stock also increases .If we see the total owner's fund it is decreases (from 2013-12 to 2014-13)
because loan fund increases.Now finally if we saw working capital then it is decreases initially because current assets is not increases exponentially and in 2014-13 current assets is decreases therefore percentage change in working capital is negative.

Trend Analysis of Income Statement of BoeingPeriod Ending 2014 2013 2012PARTICULARS AMOUNT PERCENTAGE AMOUNT PERCENTAGE AMOUNTTotal Revenue $90,762,000 132% $86,623,000 126% $81,698,000
Cost of Revenue $76,752,000 137% $73,268,000 131% $68,665,000 Gross Profit $14,010,000 109% $13,355,000 104% $13,033,000
Operating Expenses
$3,047,000 78% $3,071,000 78% $3,298,000
$3,480,000 111% $3,742,000 120% $3,449,000
Operating Income $7,473,000 128% $6,562,000 113% $6,290,000
($13,000) -18% $76,000 107% $66,000
$7,470,000 127% $6,618,000 113% $6,352,000
Interest Expense $333,000 70% $386,000 81% $442,000 Earnings Before Tax $7,137,000 132% $6,232,000 116% $5,910,000
Income Tax $1,691,000 122% $1,646,000 119% $2,007,000 Net Income $5,446,000 136% $4,586,000 114% $3,903,000
$5,446,000 136% $4,585,000 114% $3,900,000
1. Research and Development
2. Sales, General and Admin.
Add'l income/expense items
Earnings Before Interest and Tax
Net Income Applicable to
Common Shareholders
Total
Reven
ue
Cost of R
even
ue
Gross
Profit
Researc
h and Dev
elopmen
t
Sales
, Gen
eral a
nd Admin.
Operating I
ncome
Add'l inco
me/exp
ense
items
Earn
ings Befo
re Inter
est an
d Tax
Interest
Expen
se
Earn
ings Befo
re Ta
x
Income T
ax
Net Inco
me
Net Inco
me Applica
ble to Common Sh
areholders-40%
-20%0%
20%40%60%80%
100%120%140%160%
2014201320122011
Trend Analysis of Income Statement of Boeing2012 2011
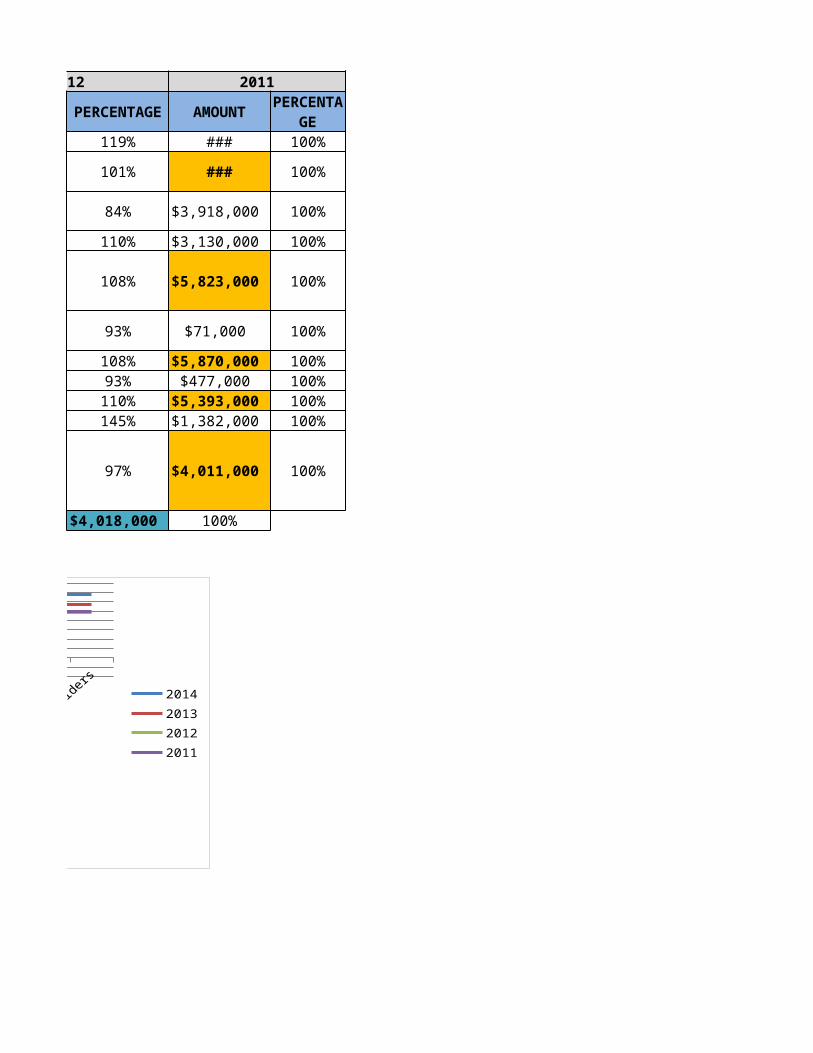
PERCENTAGE AMOUNT PERCENTAGE119% $68,735,000 100%123% $55,888,000 100%101% $12,847,000 100%
84% $3,918,000 100%
110% $3,130,000 100%
108% $5,823,000 100%
93% $71,000 100%
108% $5,870,000 100%
93% $477,000 100%110% $5,393,000 100%145% $1,382,000 100%97% $4,011,000 100%
97% $4,018,000 100%
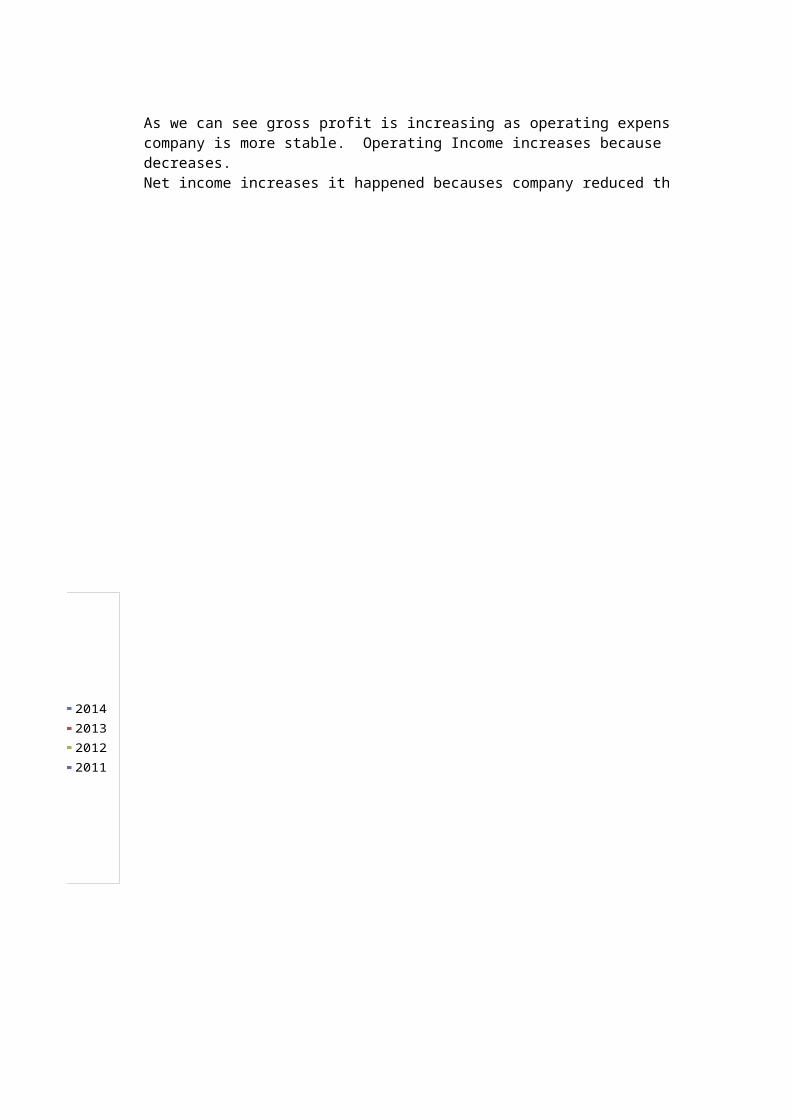
As we can see gross profit is increasing as operating expenses are decreasing. So the company is more stable. Operating Income increases because operating expenses decreases. Net income increases it happened becauses company reduced their expenses.
Total
Reven
ue
Cost of R
even
ue
Gross
Profit
Researc
h and Dev
elopmen
t
Sales
, Gen
eral a
nd Admin.
Operating I
ncome
Add'l inco
me/exp
ense
items
Earn
ings Befo
re Inter
est an
d Tax
Interest
Expen
se
Earn
ings Befo
re Ta
x
Income T
ax
Net Inco
me
Net Inco
me Applica
ble to Common Sh
areholders-40%
-20%0%
20%40%60%80%
100%120%140%160%
2014201320122011
As we can see gross profit is increasing as operating expenses are decreasing. So the company is more stable. Operating Income increases because operating expenses decreases. Net income increases it happened becauses company reduced their expenses.

Trend Analysis of Balance Sheet of BoeingPeriod Ending 2014 2013 2012PARTICULARS AMOUNT PERCENTAGE AMOUNT PERCENTAGE AMOUNT
Current Assets
$11,733,000 117% $9,088,000 90% $10,341,000
$1,359,000 111% $6,170,000 504% $3,217,000
Net Receivables $7,937,000 126% $6,904,000 110% $6,000,000 Inventory $46,756,000 145% $42,912,000 133% $37,751,000
Total Current Assets $67,785,000 136% $65,074,000 131% $57,309,000
Long-Term Assets
$4,525,000 85% $4,831,000 90% $5,236,000
Fixed Assets $11,007,000 118% $10,224,000 110% $9,660,000 Goodwill $5,119,000 104% $5,043,000 102% $5,035,000
Intangible Assets $2,869,000 94% $3,052,000 100% $3,111,000 Other Assets $1,317,000 80% $1,500,000 91% $1,792,000
$6,576,000 112% $2,939,000 50% $6,753,000
$31,413,000 104% $27,589,000 91% $31,587,000
TOTAL ASSETS $99,198,000 124% $92,663,000 116% $88,896,000
Current LiabilitiesAccounts Payable $55,788,000 143% $49,923,000 128% $43,546,000
$929,000 39% $1,563,000 66% $1,436,000
$56,717,000 137% $51,486,000 125% $44,982,000
Loan FundLong-Term Debt $8,141,000 81% $8,072,000 81% $8,973,000 Other Liabilities $25,550,000 102% $18,108,000 72% $28,974,000
Minority Interest $125,000 134% $122,000 131% $100,000 Total Loan Fund $33,816,000 96% $26,302,000 75% $38,047,000
Owners' FundCommon Stocks $5,061,000 100% $5,061,000 100% $5,061,000 Capital Surplus $4,625,000 115% $4,415,000 109% $4,122,000
Retained Earnings $36,180,000 131% $32,964,000 120% $30,037,000 Treasury Stock ($23,298,000) 140% ($17,671,000) 106% ($15,937,000)Other Equity ($13,903,000) 84% ($9,894,000) 60% ($17,416,000)
Total Owners' Fund $8,665,000 247% $14,875,000 423% $5,867,000
$99,198,000 124% $92,663,000 116% $88,896,000
Cash and Cash Equivalents
Short-Term Investments
Long-Term Investments
Deferred Asset Charges
Total Long-Term Assets
Short-Term Debt / Current Portion of Long-Term Debt
Total Current Liabilities
Total Liabilities & Equity

WORKING CAPITAL $11,068,000 130% $13,588,000 159% $12,327,000
Total Current Assets Total Current Liabilities WORKING CAPITAL Total Long-Term Assets Total Loan Fund Total Owners' Fund0%
50%
100%
150%
200%
250%
300%
350%
400%
450%
2014201320122011

Trend Analysis of Balance Sheet of Boeing2012 2011
PERCENTAGE AMOUNT PERCENTAGECurrent Assets
103% $10,049,000 100%
263% $1,223,000 100%
95% $6,298,000 100%117% $32,240,000 100%
115% $49,810,000 100%
Long-Term Assets
98% $5,339,000 100%
104% $9,313,000 100%102% $4,945,000 100%102% $3,044,000 100%109% $1,643,000 100%
115% $5,892,000 100%
105% $30,176,000 100%
111% $79,986,000 100%
Current Liabilities112% $38,921,000 100%
61% $2,353,000 100%
109% $41,274,000 100%
Loan Fund90% $10,018,000 100%
115% $25,086,000 100%108% $93,000 100%108% $35,197,000 100%
Owners' Fund100% $5,061,000 100%102% $4,033,000 100%109% $27,524,000 100%96% ($16,603,000) 100%
106% ($16,500,000) 100%
167% $3,515,000 100%
111% $79,986,000 100%
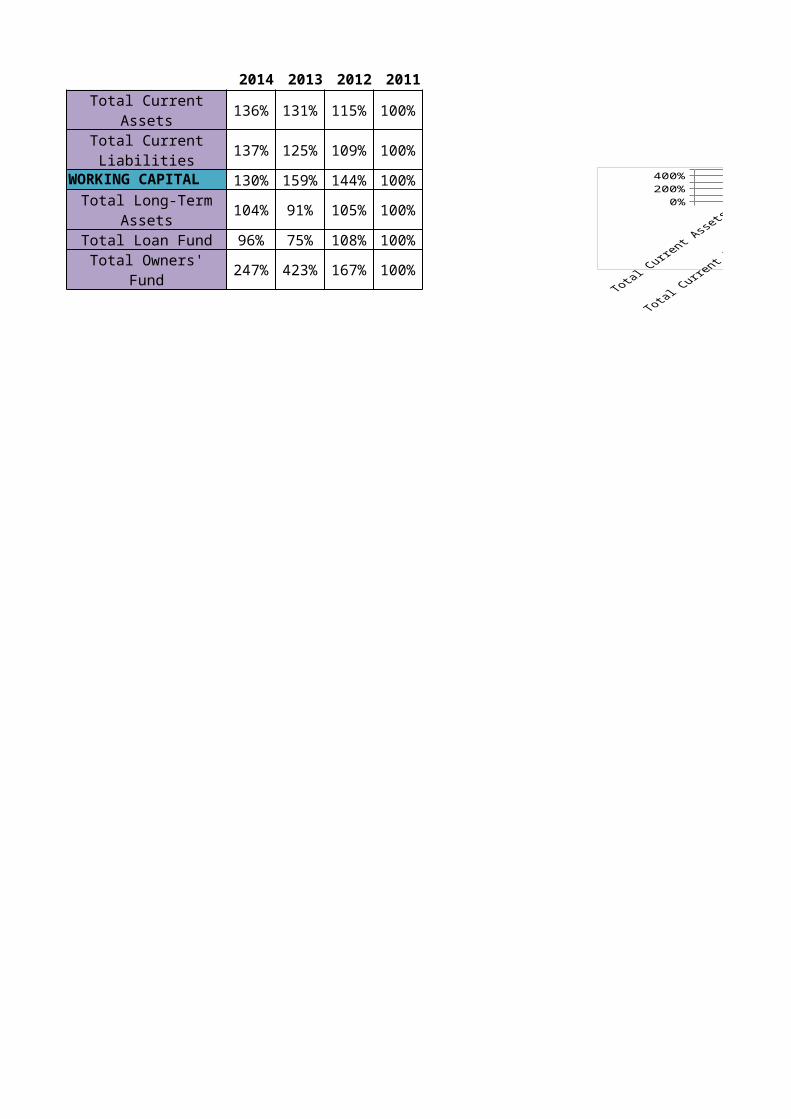
As per data available, Current asset have been increasing continiously since 2011 to 2014, which
represents Company's current asset are increasing at higher ratio as compared to current liablity except
for the year 2014. As per percentage derived for long term asset, we see there is a
increase in every year except 2013. So company is increasing its long term asset and it could be derived that company is in a good health and it's expanding.
If we look into Loan fund it is increased initially and then decreases. This means owners has less share than its creditor and after that loan fund
decreases, there is a fall in Loan fund. Owners fund is increased rapidly for two years, means
owners has more rights over the company than the creditors and later it decreases in 2014 which shows
opposite scenario of this.
144% $8,536,000 100%
Total Current Assets Total Current Liabilities WORKING CAPITAL Total Long-Term Assets Total Loan Fund Total Owners' Fund0%
50%
100%
150%
200%
250%
300%
350%
400%
450%
2014201320122011

As per data available, Current asset have been increasing continiously since 2011 to 2014, which
represents Company's current asset are increasing at higher ratio as compared to current liablity except
for the year 2014. As per percentage derived for long term asset, we see there is a
increase in every year except 2013. So company is increasing its long term asset and it could be derived that company is in a good health and it's expanding.
If we look into Loan fund it is increased initially and then decreases. This means owners has less share than its creditor and after that loan fund
decreases, there is a fall in Loan fund. Owners fund is increased rapidly for two years, means
owners has more rights over the company than the creditors and later it decreases in 2014 which shows
opposite scenario of this.

Total Revenue 2014 2013 2012
Cost of Revenue AMOUNT PERCENTAGE AMOUNT PERCENTAGE AMOUNT PERCENTAGE
Gross Profit $90,762,000 132% $86,623,000 126% $81,698,000 119%
$14,010,000 109% $13,355,000 104% $13,033,000 101%
$3,047,000 78% $3,071,000 78% $3,298,000 84%
Operating Income $3,480,000 111% $3,742,000 120% $3,449,000 110%
$7,473,000 128% $6,562,000 113% $6,290,000 108%
($13,000) -18% $76,000 107% $66,000 93%
Interest Expense $7,470,000 127% $6,618,000 113% $6,352,000 108%Earnings Before Tax $333,000 70% $386,000 81% $442,000 93%
Income Tax $7,137,000 132% $6,232,000 116% $5,910,000 110%Net Income $1,691,000 122% $1,646,000 119% $2,007,000 145%
$5,446,000 136% $4,586,000 114% $3,903,000 97%
$5,446,000 136% $4,585,000 114% $3,900,000 97% $4,018,000
Research and Development
Sales, General and Admin.
Add'l income/expense items
Earnings Before Interest and Tax
Net Income Applicable to
Common Shareholders
Total
Reven
ue
Cost of R
even
ue
Gross
Profit
Researc
h and Dev
elopmen
t
Sales
, Gen
eral a
nd Admin.
Operating I
ncome
Add'l inco
me/exp
ense
items
Earn
ings Befo
re Inter
est an
d Tax
Interest
Expen
se
Earn
ings Befo
re Ta
x
Income T
ax
Net Inco
me
Net Inco
me Applica
ble to Common Sh
areholders-40%
-20%0%
20%40%60%80%
100%120%140%160%
2014201320122011

2014 2013 2012 2011132% 126% 119% 100%137% 131% 123% 100%109% 104% 101% 100%78% 78% 84% 100%
111% 120% 110% 100%128% 113% 108% 100%-18% 107% 93% 100%127% 113% 108% 100%70% 81% 93% 100%
132% 116% 110% 100%122% 119% 145% 100%136% 114% 97% 100%136% 114% 97% 100%

2011
AMOUNT
$68,735,000 100%
$12,847,000 100%
$3,918,000 100%
$3,130,000 100%
$5,823,000 100%
$71,000 100%
$5,870,000 100%$477,000 100%
$5,393,000 100%$1,382,000 100%
$4,011,000 100%
100%
PERCENTAGE
Total
Reven
ue
Cost of R
even
ue
Gross
Profit
Researc
h and Dev
elopmen
t
Sales
, Gen
eral a
nd Admin.
Operating I
ncome
Add'l inco
me/exp
ense
items
Earn
ings Befo
re Inter
est an
d Tax
Interest
Expen
se
Earn
ings Befo
re Ta
x
Income T
ax
Net Inco
me
Net Inco
me Applica
ble to Common Sh
areholders-40%
-20%0%
20%40%60%80%
100%120%140%160%
2014201320122011

2014 2013 2012 2011
Total Current Assets 136% 131% 115% 100%
137% 125% 109% 100%
WORKING CAPITAL 130% 159% 144% 100%
104% 91% 105% 100%
Total Loan Fund 96% 75% 108% 100%
Total Owners' Fund 247% 423% 167% 100%
Total Current Liabilities
Total Long-Term Assets 0%
150%300%450%
2014201320122011

0%150%300%450%
2014201320122011

Liquidity Ratio
SL.No Years1 2011 1.21 0.432 2012 1.27 0.433 2013 1.26 0.434 2014 1.20 0.37
Current Ratio=(Current Asset /Current
Liability)
Quick Ratio=Quik Assets/Quick
Liabilities

Liquidity Ratio
0.240.230.180.21
Cash Ratio=(Cash+Bank+Marketable
Security)/Current Liabilities
PROFITABILITY RATIOS
SL.No Years1 2011 18.69% 91.56%2 2012 15.95% 92.30%3 2013 15.42% 92.45%4 2014 15.44% 91.75%
Gross Profit Ratio=Gross Profit/ Net Sales
Operating Ratio=( COGS + Operating
Expenses)/ Net Sales
PROFITABILITY RATIOS
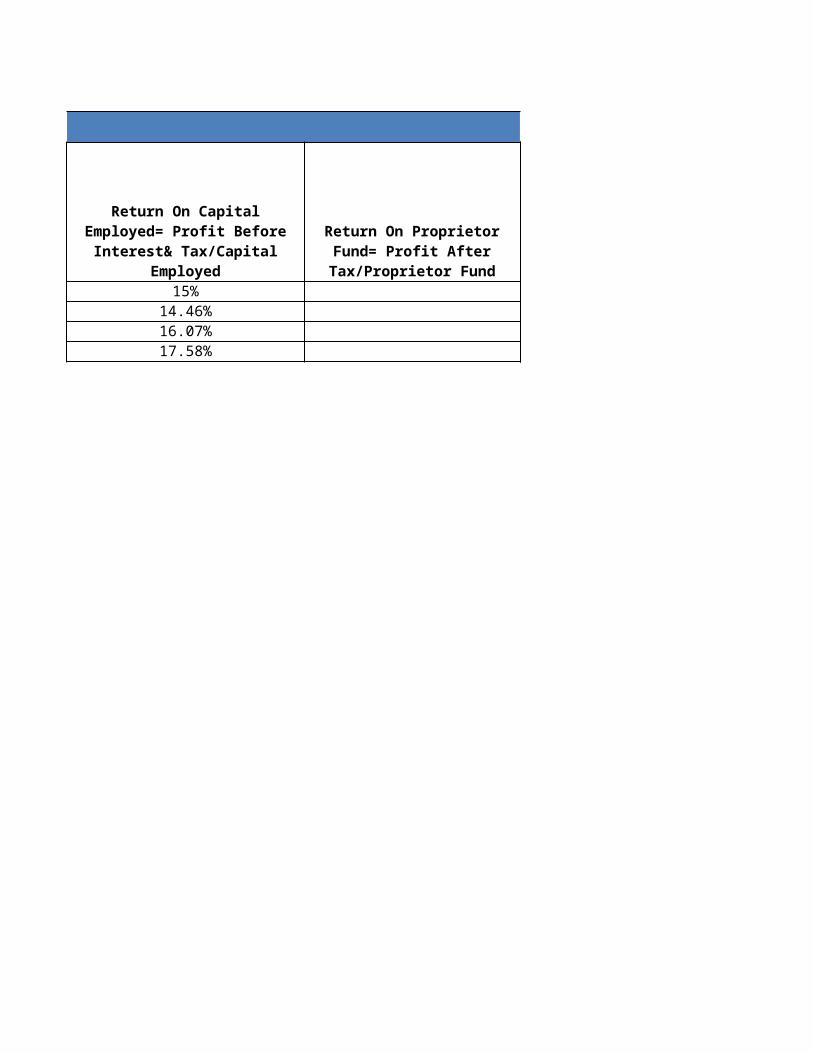
7.85% 10.25% 6% 15%7.23% 8.26% 5% 14.46%
7% 8% 5% 16.07%8% 7% 6% 17.58%
Operating profit Ratio=Operating Net Profit/
Net SalesExpenses Ratio=
Expenses/Net Sales
Net Profit Margin Ratio=
Net Profit after Tax/Net Sales
Return On Capital Employed= Profit Before Interest& Tax/Capital Employed

PROFITABILITY RATIOS
Return On Proprietor Fund= Profit After Tax/Proprietor
Fund
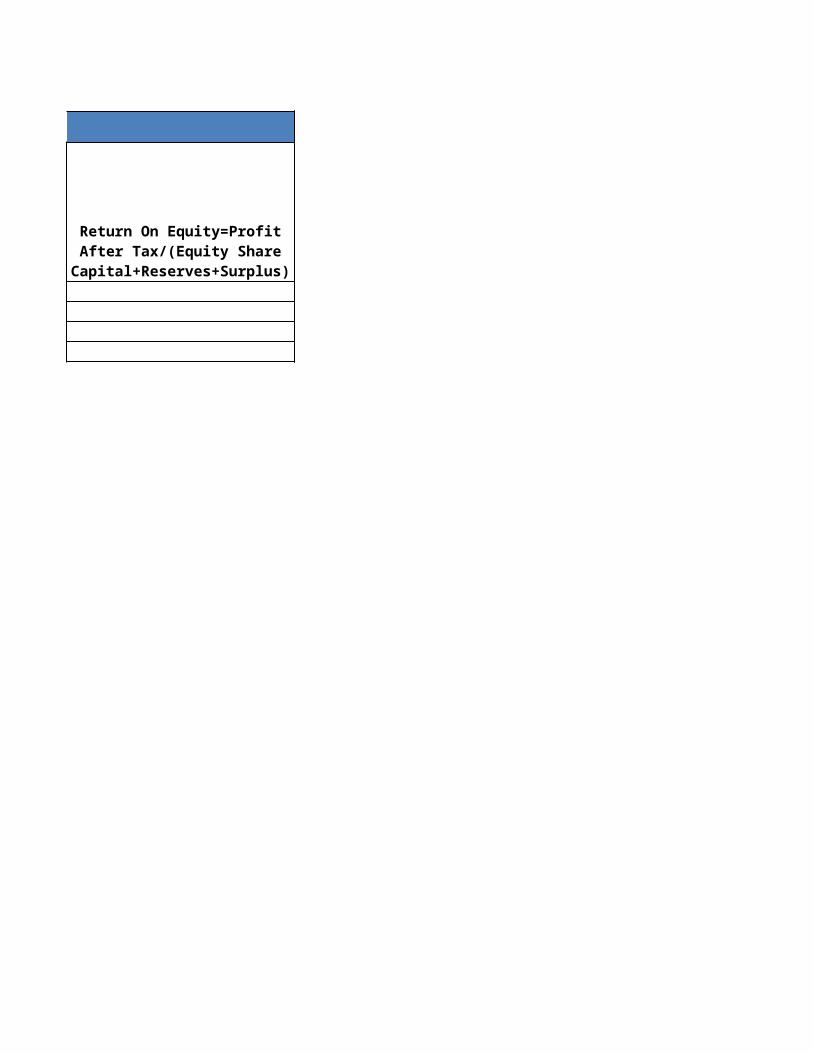
Return On Equity=Profit After Tax/(Equity Share
Capital+Reserves+Surplus)

Turnover Ratios
SL.No Year1 2014 8.20 2.892 2013 6.37 3.143 2012 6.63 2.594 2011 8.05 2.28
Work Capital Turnover Ratio=Net Sales / Working Capital
Fixed Asset Turnover Ratio=Net Sales/Net Fixed Assets

Turnover Ratios
2.14 1.34 0.912.10 1.33 0.931.86 1.43 0.921.78 1.38 0.86
Capital Turn Over ratio=Net Sales/ Capital Employed
Current Asset Turnover Ratio= Net Sales/ Current Assets
Net Asset Turnover Ratio= Net Sales/ Net Assets

Turnover Ratios
1.94 188.032.02 180.822.16 168.662.13 171.20
Inventory Turn Over Ratio (times)=Cost of Goods Sold/ Average Inventory
Inventory Holding Period (days)= 365/ Inventory Turn Over Ratio

Solvency Ratio
SL.No Years1 2011 22.76 0.042 2012 15.15 0.073 2013 6.23 0.164 2014 11.45 0.09
Debt to Equity Ratio= Total borrowed fund/Proprietors fund
Proprietary Ratio=Proprietors Fund/ Total Asset
Solvency Ratio
Capital Gearing Ratio/Leverage Ratio=Equity Share Capital+Reserve& Surplus/Fixed Interest& Divident Funds
Solvency Ratio
Debt Service Ratio or Interest Coverage Ratio=Net profit before interestand Tax/Fixed Interest Charges