boeing 727 performance handbook
DESCRIPTION
Performance Handbook for the Boeing 727-200 with JT8D-15 Engines. Handbook is for training only!TRANSCRIPT

Boeing 727-200
Performance Handbook
This document may only be used for training purposes.

All rights reserved. Copies of this publication may be reproduced as training material for students, for use within a company or organization, or for personal use, but may not otherwise be reproduced for publication or for commercial gain. © by Ralf M. Dittmer 1st Edition 2011

Boeing 727-200 Performance Handbook
Page 1
AIRPLANE LIMITATIONS AND GENERAL PERFORMANCE.....................................................2 Stall Speeds.............................................................................................................................2 Temperature Conversion .........................................................................................................3 Altimeter and Airspeed Calibration...........................................................................................3
FLIGHT PLANNING ....................................................................................................................4 Flight Planning Allowances ......................................................................................................4 Optimum Altitude .....................................................................................................................4 Holding ....................................................................................................................................5 Flight Time and Fuel Table ......................................................................................................5
TAKEOFF PERFORMANCE .......................................................................................................7 Introduction..............................................................................................................................7 Performance Limited Takeoff Weight .......................................................................................7 Altimeter Setting To Station Pressure ......................................................................................7 Wind Component .....................................................................................................................7 Takeoff Field Corrections.......................................................................................................11 Takeoff Field Limit..................................................................................................................11 Takeoff Climb Limit ................................................................................................................11 Tire Speed Limited Weight.....................................................................................................11 Slush/Standing Water Takeoff ...............................................................................................22 Takeoff Speeds......................................................................................................................23 Takeoff EPR and N1..............................................................................................................24 Takeoff EPR and N1..............................................................................................................25 Anti-Skid Inoperative..............................................................................................................26 Dispatch with Tailskid Extended.............................................................................................26 Stab Trim Setting ...................................................................................................................26
CLIMB PERFORMANCE...........................................................................................................28 Maximum Climb EPR.............................................................................................................28 Economic Climb Speeds........................................................................................................28 Distance, Time and Fuel ........................................................................................................29
CRUISE PERFORMANCE ........................................................................................................30 Maximum Cruise EPR............................................................................................................30 Cruise EPR and Specific Range ............................................................................................30 Turbulent Air Penetration .......................................................................................................32
HOLDING..................................................................................................................................33 DESCENT.................................................................................................................................34 LANDING PERFORMANCE......................................................................................................35
Landing Field Length Limitation .............................................................................................35 Landing Climb Limitation........................................................................................................35 Landing Speeds.....................................................................................................................41 Go-Around EPR.....................................................................................................................41
ENGINE OUT............................................................................................................................42 Maximum Continuous EPR....................................................................................................42 One Engine Out .....................................................................................................................43 Two Engine Out .....................................................................................................................44
ENGINE PARAMETER CHECK TABLES..................................................................................45 WEIGHT AND BALANCE..........................................................................................................47
Limitations .............................................................................................................................47 Index Equation.......................................................................................................................47 Loading Tables ......................................................................................................................49
AIRPORT ANALYSIS................................................................................................................52 Introduction............................................................................................................................52 Airplane Configuration ...........................................................................................................52 Airport Analysis Description ...................................................................................................52 Corrections ............................................................................................................................53 Determination of the Performance Limited Takeoff Weight ....................................................53
Boeing 727-200 Performance Handbook
Page 2
AIRPLANE LIMITATIONS AND GENERAL PERFORMANCE
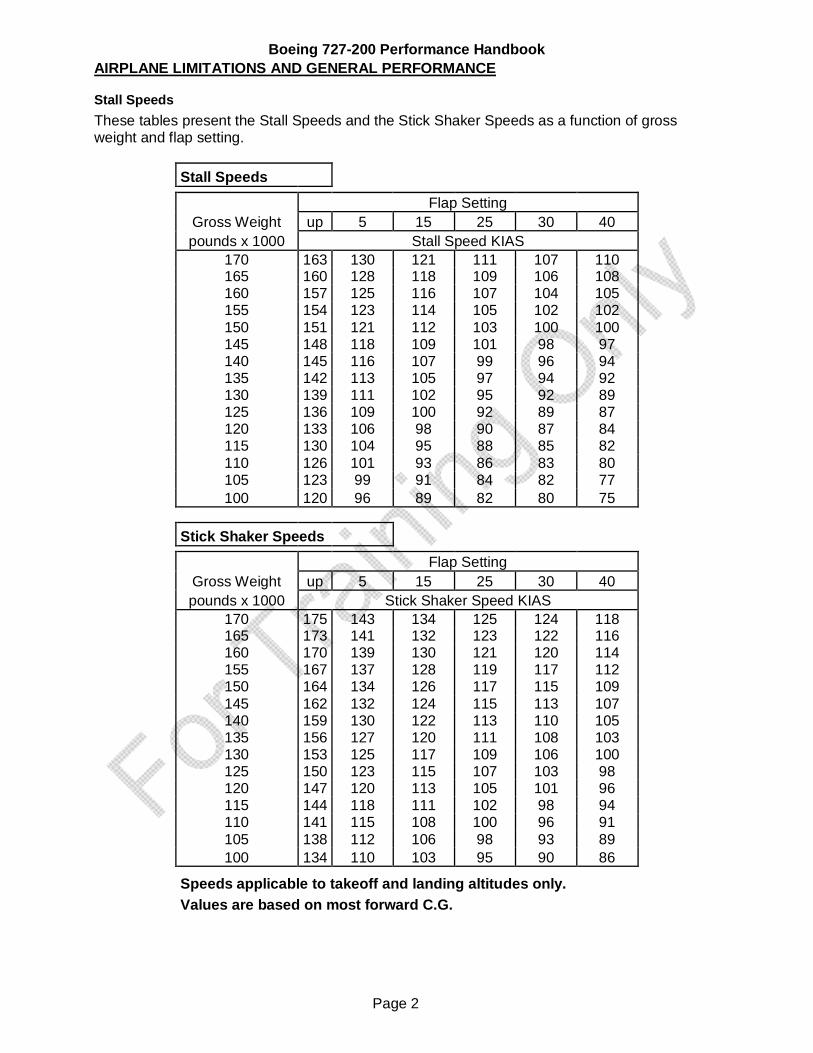
Stall Speeds These tables present the Stall Speeds and the Stick Shaker Speeds as a function of gross weight and flap setting.
Stall Speeds
Flap Setting Gross Weight up 5 15 25 30 40 pounds x 1000 Stall Speed KIAS
170 163 130 121 111 107 110 165 160 128 118 109 106 108 160 157 125 116 107 104 105 155 154 123 114 105 102 102 150 151 121 112 103 100 100 145 148 118 109 101 98 97 140 145 116 107 99 96 94 135 142 113 105 97 94 92 130 139 111 102 95 92 89 125 136 109 100 92 89 87 120 133 106 98 90 87 84 115 130 104 95 88 85 82 110 126 101 93 86 83 80 105 123 99 91 84 82 77 100 120 96 89 82 80 75
Stick Shaker Speeds
Flap Setting Gross Weight up 5 15 25 30 40 pounds x 1000 Stick Shaker Speed KIAS
170 175 143 134 125 124 118 165 173 141 132 123 122 116 160 170 139 130 121 120 114 155 167 137 128 119 117 112 150 164 134 126 117 115 109 145 162 132 124 115 113 107 140 159 130 122 113 110 105 135 156 127 120 111 108 103 130 153 125 117 109 106 100 125 150 123 115 107 103 98 120 147 120 113 105 101 96 115 144 118 111 102 98 94 110 141 115 108 100 96 91 105 138 112 106 98 93 89 100 134 110 103 95 90 86
Speeds applicable to takeoff and landing altitudes only. Values are based on most forward C.G.

Boeing 727-200 Performance Handbook
Page 3
Temperature Conversion Use the table to convert Total Air Temperature (TAT) to Outside Air Temperature (OAT).
INDICATED MACH NUMBER .30 .40 .50 .60 .70 .76 .78 .80 .82 .84
IND TAT - °C TRUE OUTSIDE AIR TEMPERATURE - DEGREES C
70 47 39 34 33 31 29 28 65 49 42 35 30 28 27 25 23 60 50 44 38 30 25 24 22 21 19 55 49 45 39 33 26 21 19 18 16 14 50 44 40 35 28 21 17 15 13 12 10 45 39 35 30 24 17 12 10 9 7 6 40 34 30 25 19 12 8 6 4 3 1 35 30 25 20 14 7 3 2 0 -2 -3 30 25 21 16 10 3 -1 -3 -4 -6 -7 25 20 16 11 5 -2 -6 -7 -9 -10 -12 20 15 11 6 0 -6 -10 -12 -13 -15 -16 15 10 6 1 -4 -11 -15 -16 -18 -19 -21 10 5 1 -3 -9 -15 -19 -21 -22 -24 -25
5 0 -4 -8 -14 -20 -24 -25 -27 -28 -29 0 -5 -8 -13 -18 -24 -28 -30 -31 -32 -34
-5 -10 -13 -18 -23 -29 -33 -34 -35 -37 -38 -10 -15 -18 -23 -28 -33 -37 -39 -40 -41 -43 -15 -20 -23 -27 -32 -38 -42 -43 -44 -46 -47 -20 -24 -28 -32 -37 -43 -46 -47 -49 -50 -51 -25 -29 -33 -37 -42 -47 -51 -52 -53 -54 -56 -30 -34 -38 -42 -46 -52 -55 -56 -58 -59 -60 -35 -39 -42 -46 -51 -56 -60 -61 -62 -63 -64 -40 -44 -47 -51 -56 -61 -64 -65 -66 -68 -69
Altimeter and Airspeed Calibration Corrections due to static port position error are minimal for Captain, F/O, and auxiliary static ports. They are less than 1 knot, .001 Mach, or 20 feet of altitude for all flap positions between 1.2 VS and VMO, MMO or VFE as applicable. This is true with the landing gear retracted or extended, also in taxi attitude on the ground. Since these corrections are so minimal, desired speed and altitude will be flown at that indicated value.

Boeing 727-200 Performance Handbook
Page 4
FLIGHT PLANNING This chapter contains flight planning data to determine trip fuel/time, and reserve fuel. The data includes engine bleed effects for normal air conditioning operation.
Flight Planning Allowances Simplified Flight Planning charts enable rapid determination of estimated trip time and fuel from brake release to landing. Additional flight planning information including maneuver allowances is summarized below. Fuel can be saved by minimizing APU utilization. Average APU fuel flow rates under normal operation are 230 lbs per hour on the ground. Taxi fuel allowance is approximately 500 lbs.
Optimum Altitude Optimum altitude for best fuel mileage is presented for .78M speed schedule.
25
27
29
31
33
35
37
39
41
100 110 120 130 140 150 160 170 180
Gross Weight - 1000 lbs
Alti
tude
- 10
00 fe
et

Boeing 727-200 Performance Handbook
Page 5
Holding This table provides total fuel flow information necessary for planning holding and reserve fuel requirements. The chart is based on a racetrack pattern in clean configuration and minimum drag airspeed.
Pressure Zero Fuel Weight - pounds x 1000 Altitude 140 130 120 110
ft Holding Fuel Flow- lbs/hr 9000 6784 6630 6508 6376 8000 6850 6702 6568 6442 7000 6920 6776 6634 6512 6000 6992 6852 6706 6586 5000 7068 6930 6786 6664 4000 7148 7010 6870 6746 3000 7230 7090 6960 6834 2000 7318 7174 7056 6924 1000 7406 7258 7158 7018
0 7500 7344 7266 7116
Flight Time and Fuel Table A Flight Time and Fuel Table is provided for .78M speed schedule at constant altitudes to determine trip time and trip fuel from brake release to touchdown. APU usage, taxi, inflight flaps down maneuvering (other than straight in approach) and reserve fuel should be added to the trip fuel obtained from the table to obtain the total fuel required. These fuel allowances are presented under Flight Planning Allowances. Additional fuel for extended inflight traffic delays should be determined from the holding table. Example: Segment Distance = 800 NM Flight Level = 330 Wind in FL 330 = 35 kts HW Landing Weight = 130,000 lbs Find: TAS in FL 330 = 454 kts Still Air Dist = 867 NAM Flight Fuel from table = 18,253 lbs, LW correction = 800 lbs. Flight Fuel = 19,053 lbs Flight Time = 2:00 hrs

Boeing 727-200 Performance Handbook
Page 6
Flight Time & Fuel Table
STILL AIR FLIGHT LEVEL DISTANCE 90 110 130 150 170 190 210 230 250 270 290 310 330 350 370 390
(NAM) 285 407 419 431 444 456 470 474 470 466 462 458 454 450 447 447 100 0:24 0:20 0:22 0:24 0:27 0:29 0:30 0:33 0:36 0:38 0:41 0:44 0:50 0:56 0:54 0:52
4.37 4.24 4.60 5.09 5.58 5.85 6.34 6.95 7.43 7.93 8.43 9.16 10.24 10.90 9.65 9.08 200 0:45 0:35 0:34 0:33 0:33 0:32 0:32 0:33 0:36 0:38 0:41 0:44 0:50 0:56 0:54 0:52
6.59 6.78 6.70 7.24 6.63 6.50 6.60 6.95 7.43 7.93 8.43 9.16 10.24 10.90 9.65 9.08 300 1:06 0:49 0:48 0:47 0:46 0:46 0:45 0:44 0:45 0:45 0:45 0:45 0:50 0:56 0:54 0:52
8.83 9.43 9.25 10.41 8.96 8.75 8.76 8.83 8.81 8.87 8.98 9.24 10.24 10.90 9.65 9.08 400 1:27 1:04 1:03 1:01 1:00 0:59 0:57 0:57 0:57 0:58 0:58 0:58 0:59 0:59 0:59 0:59
11.07 12.09 11.80 13.60 11.30 11.00 10.93 10.93 10.77 10.69 10.67 10.82 11.18 11.22 10.20 9.74 500 1:48 1:19 1:17 1:15 1:13 1:12 1:10 1:10 1:10 1:11 1:11 1:11 1:12 1:12 1:12 1:12
13.32 14.76 14.36 16.81 13.65 13.26 13.10 13.03 12.73 12.52 12.37 12.41 12.67 12.63 11.58 11.09 600 2:09 1:34 1:31 1:29 1:27 1:25 1:23 1:22 1:23 1:23 1:24 1:24 1:25 1:25 1:26 1:26
15.59 17.45 16.94 20.03 16.01 15.53 15.29 15.15 14.71 14.37 14.09 14.02 14.18 14.06 12.97 12.46 700 2:30 1:48 1:46 1:43 1:40 1:38 1:36 1:35 1:36 1:36 1:37 1:37 1:38 1:39 1:39 1:39
17.87 20.14 19.52 23.27 18.38 17.81 17.49 17.27 16.70 16.23 15.81 15.64 15.70 15.51 14.39 13.84 800 2:51 2:03 2:00 1:57 1:54 1:51 1:48 1:48 1:48 1:49 1:50 1:51 1:51 1:52 1:53 1:53
20.16 22.85 22.11 26.52 20.76 20.10 19.69 19.41 18.70 18.10 17.55 17.27 17.23 16.98 15.82 15.24 900 3:12 2:18 2:14 2:11 2:07 2:04 2:01 2:00 2:01 2:02 2:03 2:04 2:05 2:05 2:06 2:06
22.47 25.57 24.72 29.80 23.15 22.39 21.91 21.55 20.72 19.98 19.30 18.92 18.78 18.46 17.26 16.66 1000 3:33 2:33 2:29 2:25 2:21 2:18 2:14 2:13 2:14 2:15 2:16 2:17 2:18 2:19 2:20 2:19
24.78 28.30 27.33 33.09 25.55 24.69 24.13 23.70 22.75 21.87 21.06 20.58 20.35 19.96 18.73 18.10 1100 3:54 2:47 2:43 2:39 2:34 2:31 2:27 2:26 2:27 2:28 2:29 2:30 2:31 2:32 2:33 2:33
27.11 31.05 29.95 36.39 27.96 27.01 26.37 25.87 24.78 23.78 22.83 22.26 21.94 21.49 20.21 19.56 1200 4:15 3:02 2:57 2:53 2:48 2:44 2:39 2:38 2:39 2:41 2:42 2:43 2:44 2:45 2:46 2:46
29.45 33.80 32.59 39.72 30.38 29.32 28.62 28.04 26.83 25.70 24.62 23.95 23.54 23.02 21.72 21.03 1300 4:36 3:17 3:12 3:07 3:01 2:57 2:52 2:51 2:52 2:54 2:55 2:56 2:58 2:59 3:00 3:00
31.80 36.57 35.23 43.06 32.81 31.65 30.87 30.23 28.90 27.63 26.42 25.65 25.15 24.58 23.24 22.52 1400 4:57 3:32 3:26 3:20 3:15 3:10 3:05 3:04 3:05 3:06 3:08 3:09 3:11 3:12 3:13 3:13
34.17 39.35 37.88 46.41 35.25 33.98 33.14 32.42 30.97 29.57 28.23 27.37 26.79 26.16 24.78 24.03 1500 5:18 3:46 3:40 3:34 3:28 3:23 3:18 3:16 3:18 3:19 3:21 3:22 3:24 3:25 3:27 3:27
36.54 42.14 40.55 49.79 37.69 36.33 35.42 34.62 33.06 31.52 30.05 29.10 28.43 27.75 26.33 25.56 1600 5:39 4:01 3:55 3:48 3:42 3:37 3:31 3:29 3:31 3:32 3:34 3:35 3:37 3:39 3:40 3:40
38.93 44.94 43.22 53.18 40.15 38.68 37.70 36.84 35.16 33.49 31.88 30.85 30.10 29.36 27.91 27.11 1700 6:00 4:16 4:09 4:02 3:56 3:50 3:43 3:42 3:43 3:45 3:47 3:48 3:50 3:52 3:54 3:53
41.33 47.76 45.90 56.59 42.62 41.04 40.00 39.06 37.27 35.47 33.73 32.61 31.78 30.99 29.50 28.67 1800 6:21 4:31 4:23 4:16 4:09 4:03 3:56 3:54 3:56 3:58 4:00 4:02 4:04 4:05 4:07 4:07
43.74 50.59 48.60 60.01 45.10 43.40 42.30 41.30 39.39 37.46 35.59 34.38 33.47 32.64 31.11 30.25 1900 6:43 4:45 4:38 4:30 4:23 4:16 4:09 4:07 4:09 4:11 4:13 4:15 4:17 4:19 4:20 4:20
46.16 53.43 51.30 63.46 47.59 45.78 44.62 43.54 41.52 39.46 37.46 36.17 35.19 34.30 32.74 31.85 2000 7:04 5:00 4:52 4:44 4:36 4:29 4:22 4:20 4:22 4:24 4:26 4:28 4:30 4:32 4:34 4:34
48.60 56.28 54.01 66.92 50.09 48.16 46.95 45.79 43.67 41.48 39.34 37.97 36.91 35.99 34.38 33.47
Based on: Landing Weight = 110,000 lbs If actual landing weight is above 110,000 lbs, ADD a fuel burn correction of 200 lbs for each 5,000 lbs increament of additional landing weight.
CLIMB: 250 / 300 / M.78 Still Air Distance:
CRUISE: 250 / 350 / M.78
DESCENT: 280 / M.78
Example: 600 1:25 - Flight Time from start of takeoff roll to landing (h:m) 14.06 - Flight Fuel from start of takeoff roll to lanidng (1000 lbs)
WTAS
TAS
VVVNMSAD

Boeing 727-200 Performance Handbook
Page 7
TAKEOFF PERFORMANCE
Introduction This chapter contains data to determine takeoff performance limitations, based on engine bleed effects for normal air conditioning operation and antiice off, i.e., two packs on, one pack bleed from each engine. The data is presented in simplified form and is therefore conservative. In the event of any conflict between data presented in this section and those contained in the Approved Airplane Flight Manual, the Flight Manual shall always take precedence.
Performance Limited Takeoff Weight The Performance Limited Takeoff Weight (PTOW) is the least of the field length, climb, and tire speed limit weights.
Altimeter Setting To Station Pressure The determination of thrust setting and takeoff/landing performance generally requires station pressure altitude. If station pressure or station pressure altitude are not available, enter the chart with altimeter setting (QNH) and read the pressure altitude adjustment. Apply this adjustment to the station elevation to obtain station pressure altitude. For boundary QNH values, read the midpoint between tabulated adjustments to elevation, e.g., for QNH of 29.66 inches (1004 mb), the elevation adjustment is 250 ft. Alternatively, station pressure altitude may be determined by setting the cockpit altimeter to 29.92 inches (1013.2 mb); the altimeter will then read station pressure altitude.
Wind Component The Wind Component chart provides crosswind and head/tail wind components, appropriate to the runway headings, reported wind velocity and direction. To use the chart, find the intersection between reported wind velocity in knots (circular lines) and the angle in degrees between reported wind direction and the runway (radial lines). Then read head/tail wind component to the left and crosswind component from the bottom scale.

Boeing 727-200 Performance Handbook
Page 8
PERFORMANCE LIMITED TAKEOFF WEIGHT DETERMINATION PROCEDURE 1. With Wind, Slope, and Field Length Available enter Field Length Correction Chart (5.3.5) and
obtain Corrected Field Length. 2. With QNH and Field Elevation enter Altimeter Setting to Station Pressure Table (5.3.3) and
obtain Pressure Altitude. 3. With Corrected Field Length (step 1), OAT, and Pressure Altitude (step 2) enter Takeoff
Field Limit Chart (5.3.6) and obtain Field Length Limited Takeoff Weight. Adjust for Bleed Configuration.
4. With OAT and Pressure Altitude (step 2) enter Takeoff Climb Limit Chart (5.3.7) and obtain Climb Limited Takeoff Weight. Adjust for Bleed Configuration.
5. With OAT and Pressure Altitude (step 2) enter Tire Speed Limited Weight Chart (5.3.8) and obtain Tire Speed Limited Weight. Adjust obtained weight for wind.
6. Compare the obtained limiting weights from steps 3, 4, and 5. Use the SMALLER one as the Performance Limited Takeoff Weight.
Atmospheric Conditions: - QNH - OAT - Wind
Runway Characteristics: - Field Length Available - Slope - Field Elevation

Boeing 727-200 Performance Handbook
Page 9
ALTIMETER SETTING TO STATION PRESSURE
QNH IN. HG. Correction to Elevation for
Pressure Altitude QNH MILLIBARS
28.81 to 28.91 1000 976 to 979
28.91 to 29.02 900 979 to 983
29.02 to 29.12 800 983 to 986
29.12 to 29.23 700 986 to 990
29.23 to 29.34 600 990 to 994
29.34 to 29.44 500 994 to 997
29.44 to 29.55 400 997 to 1001
29.55 to 29.66 300 1001 to 1004
29.66 to 29.76 200 1004 to 1008
29.76 to 29.87 100 1008 to 1012
29.87 to 29.97 0 1012 to 1015
29.97 to 30.08 -100 1015 to 1019
30.08 to 30.19 -200 1019 to 1022
30.19 to 30.30 -300 1022 to 1026
30.30 to 30.41 -400 1026 to 1030
30.41 to 30.52 -500 1030 to 1034
30.52 to 30.63 -600 1034 to 1037
30.63 to 30.74 -700 1037 to 1041
30.74 to 30.85 -800 1041 to 1045
30.85 to 30.96 -900 1045 to 1048
30.96 to 31.07 -1000 1048 to 1052

Boeing 727-200 Performance Handbook
Page 10
WIND COMPONENT

Boeing 727-200 Performance Handbook
Page 11
Takeoff Field Corrections Enter the chart with field length available and correct for slope and wind.
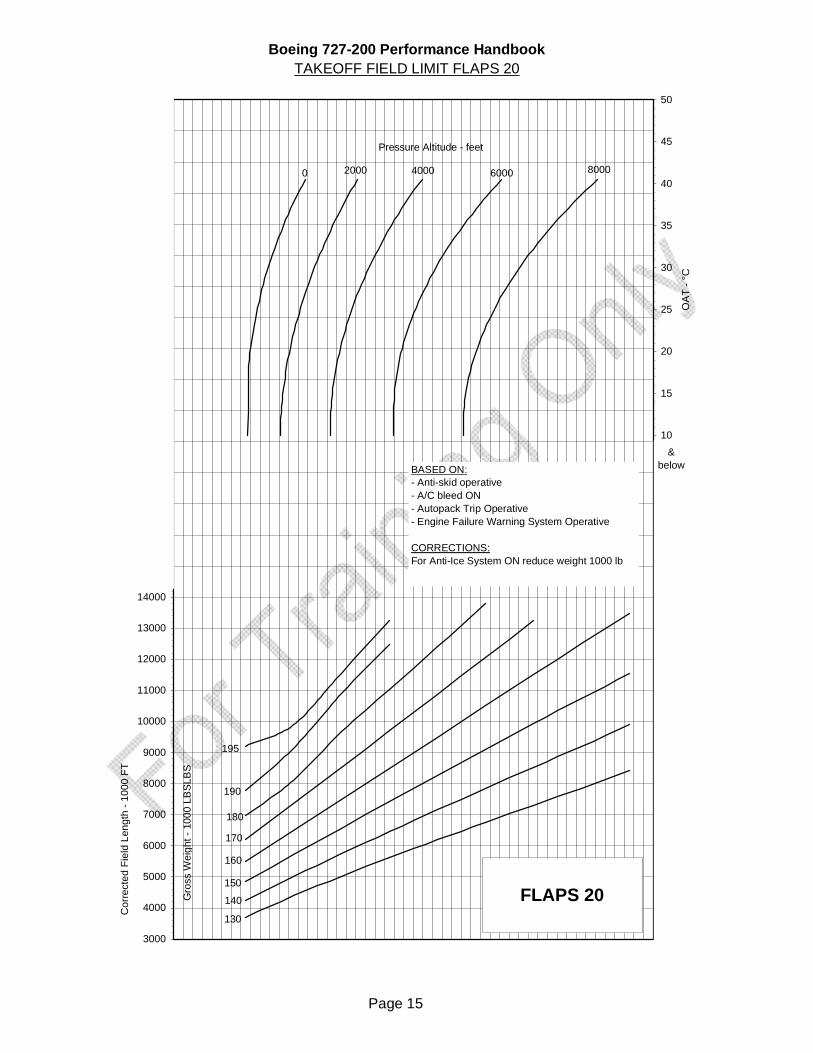
Takeoff Field Limit Maximum field length limited brake release weights are presented for all certified takeoff flap settings. The field length available is the amount of paved surface which may be used to accelerate to the decision speed and either stop at the end of the runway or climb to 35 ft. The field limited weight does not account for clearway or stopway. The reference takeoff condition is flap position 15, zero slope, and zero wind. To determine the field length limit brake release weight, enter the chart with OAT, move horizontally to airport pressure altitude and project a line vertically down. Now enter the chart with the Field Length corrected for wind and slope and move horizontally until the vertically line from the airport pressure altitude is intersected. At the intersection of both lines read the Field Length Limited Weight. Adjust the field length limit weight according to the notes below the chart to account for the appropriate engine bleed configuration.
Takeoff Climb Limit Maximum climb limited brake release weights are presented for all certified takeoff flap settings. The weights are limited by second segment climb performance and do not account for obstacles. To determine the climb limit weight, enter the chart with OAT, move vertically to airport pressure altitude. Move horizontally and read the climb limit weight to the left. Adjust the climb limit weight according to the notes below the chart to account for the appropriate engine bleed configuration.
Tire Speed Limited Weight Maximum Tire Speed Limited Weights are presented for one certified takeoff flap setting. The weights are limited by tire speed limit and are based on zero slope and zero wind conditions. To determine the tire speed limit weight, enter the chart with OAT, move vertically to airport pressure altitude. Move horizontally and read the tire speed limit weight to the left. Adjust the tire speed limit weight according to the notes below the chart to account for wind and different tires.

Boeing 727-200 Performance Handbook
Page 12
FIELD LENGTH CORRECTION
4000
6000
8000
10000
12000
14000
16000
18000
20000
22000
24000
26000
28000
30000
32000
34000
36000
38000
40000
42000
44000
46000
48000
0 2000 4000 6000 8000 10000 12000 14000 16000
Fiel
d Le
ngth
Ava
ilabl
e - f
eet
0
10000
20000
30000
40000
50000
60000
70000
80000
90000
100000
110000
120000
130000
140000
Cor
rect
ed F
ield
Len
gth
- fee
tRunway Slope - %
+ 2 (Uphill)
0 - 2 (Downhill)
0Wind Component - knots
-10 (TW)
20 (HW)
40 (HW)
14000
13000
12000
11000
10000
9000
8000
7000
6000
5000
Example:Field Length Available = 6700 ft, Runway Slope = 1% downhill, and Wind Component = 0 kts. Find: Corrected Field Length = 7000 ft

Boeing 727-200 Performance Handbook
Page 13
TAKEOFF FIELD LIMIT FLAPS 5
3000
4000
5000
6000
7000
8000
9000
10000
11000
12000
13000
14000
15000
16000
17000
18000
19000
20000
21000
22000
23000
24000
25000
26000
27000
28000
29000
30000
60 80 100 120 140 160 180
Cor
rect
ed F
ield
Len
gth
- fee
t
-50
-45
-40
-35
-30
-25
-20
-15
-10
-5
0
5
10
15
20
25
30
35
40
45
50
OA
T - °
C
& below
2000 4000 6000 80000
Pressure Altitude - feet
BASED ON:- Anti-skid operative- A/C bleed ON- Autopack Trip Operative- Engine Failure Warning System Operative
CORRECTIONS:For Anti-Ice System ON reduce weight 1000 lb
130
140
150
160
170
180
190195
Gro
ss W
eigh
t - 1
000
LBS
LBS
FLAPS 5

Boeing 727-200 Performance Handbook
Page 14
TAKEOFF FIELD LIMIT FLAPS 15
3000
4000
5000
6000
7000
8000
9000
10000
11000
12000
13000
14000
15000
16000
17000
18000
19000
20000
21000
22000
23000
24000
25000
26000
27000
28000
29000
30000
-50
-45
-40
-35
-30
-25
-20
-15
-10
-5
0
5
10
15
20
25
30
35
40
45
50
Cor
rect
ed F
ield
Len
gth
- fee
t
2000 4000 6000 8000Pressure Altitude - feet 0G
ross
Wei
ght -
100
0 LB
SLB
S
130
140
150
160
170
180
190195
OA
T - °
C
FLAPS 15
Example: For 25°C OAT, 2000 ft pressure altitude and 7000 ft Corrected Field Length, the Runway Limited Takeoff Weight is 160,000 lb.
BASED ON:- Anti-skid operative- A/C bleed ON- Autopack Trip Operative- Engine Failure Warning System Operative
CORRECTIONS:For Anti-Ice System ON reduce weight 1000 lb
&below
Boeing 727-200 Performance Handbook
Page 15
TAKEOFF FIELD LIMIT FLAPS 20
3000
4000
5000
6000
7000
8000
9000
10000
11000
12000
13000
14000
15000
16000
17000
18000
19000
20000
21000
22000
23000
24000
25000
26000
27000
28000
29000
30000
40 50 60 70 80 90 100 110 120 130 140
Cor
rect
ed F
ield
Len
gth
- 100
0 FT
-50
-45
-40
-35
-30
-25
-20
-15
-10
-5
0
5
10
15
20
25
30
35
40
45
50
OA
T - °
C
& below
2000 4000 6000 80000
Pressure Altitude - feet
BASED ON:- Anti-skid operative- A/C bleed ON- Autopack Trip Operative- Engine Failure Warning System Operative
CORRECTIONS:For Anti-Ice System ON reduce weight 1000 lb
FLAPS 20130
140
150
160
170
180
190
195
Gro
ss W
eigh
t - 1
000
LBSL
BS

Boeing 727-200 Performance Handbook
Page 16
TAKEOFF FIELD LIMIT FLAPS 25
3000
4000
5000
6000
7000
8000
9000
10000
11000
12000
13000
14000
15000
16000
17000
18000
19000
20000
21000
22000
23000
24000
25000
26000
27000
28000
29000
30000
40 50 60 70 80 90 100 110 120 130 140
Cor
rect
ed F
ield
Len
gth
- 100
0 FT
-50
-45
-40
-35
-30
-25
-20
-15
-10
-5
0
5
10
15
20
25
30
35
40
45
50
OAT
- °C
& below
2000 4000 6000 80000
Pressure Altitude - feet
BASED ON:- Anti-skid operative- A/C bleed ON- Autopack Trip Operative- Engine Failure Warning System Operative
CORRECTIONS:For Anti-Ice System ON reduce weight 1000 lb
FLAPS 25130
140
150
160
170
180190
195
Gro
ss W
eigh
t - 1
000
LBSL
BS

Boeing 727-200 Performance Handbook
Page 17
TAKEOFF CLIMB LIMIT FLAPS 5
130
135
140
145
150
155
160
165
170
175
180
185
190
195
200
10 15 20 25 30 35 40 45 50
OAT - °C
Gro
ss W
eigh
t - 1
000
LBS
FLAPS 52nd Segment Weight Limitation
Pressure Altitude - feet
0
1000
2000
3000
4000
5000
6000
7000
8000BASED ON:- A/C bleed ON- Autopack Trip Operative- Engine Failure Warning System Operative
CORRECTIONS:For Anti-Ice System ON reduce weight 2650 lb
& below

Boeing 727-200 Performance Handbook
Page 18
TAKEOFF CLIMB LIMIT FLAPS 15
130
135
140
145
150
155
160
165
170
175
180
185
190
195
200
10 15 20 25 30 35 40 45 50
FLAPS 152nd Segment Weight Limitation
Gro
ss W
eigh
t - 1
000
LBS
OAT - °C
Pressure Altitude - feet 0
100020003000
4000
5000
6000
7000
8000
Example: For 25°C OAT and 2000 feet pressure altitude, the 2nd Segment Limited Weight is 196,800 lb.
BASED ON:- A/C bleed ON- Autopack Trip Operative- Engine Failure Warning System Operative
CORRECTIONS:For Anti-Ice System ON reduce weight 2650 lb
& below

Boeing 727-200 Performance Handbook
Page 19
TAKEOFF CLIMB LIMIT FLAPS 20
130
135
140
145
150
155
160
165
170
175
180
185
190
195
200
10 15 20 25 30 35 40 45 50
OAT - °C
Gro
ss W
eigh
t - 1
000
LBFLAPS 20
2nd Segment Weight Limitation
Pressure Altitude - feet
0
1000
2000
3000
4000
5000
6000
7000
8000
BASED ON:- A/C bleed ON- Autopack Trip Operative- Engine Failure Warning System Operative
CORRECTIONS:For Anti-Ice System ON reduce weight 2650 lb
& below

Boeing 727-200 Performance Handbook
Page 20
TAKEOFF CLIMB LIMIT FLAPS 25
120
130
140
150
160
170
180
190
200
10 15 20 25 30 35 40 45 50
OAT - °C
Gro
ss W
eigh
t - 1
000
LBS
FLAPS 252nd Segment Weight Limitation
Pressure Altitude - feet
0
1000
2000
3000
4000
5000
6000
7000
8000
BASED ON:- A/C bleed ON- Autopack Trip Operative- Engine Failure Warning System Operative
CORRECTIONS:For Anti-Ice System ON reduce weight 2650 lb
& below

Boeing 727-200 Performance Handbook
Page 21
TIRE SPEED LIMITED WEIGHT
150
160
170
180
190
200
210
220
230
240
250
10 15 20 25 30 35 40 45 50OAT - °C
Tire
Spe
ed L
imite
d W
eigh
t - 1
000
LB
& below
FLAPS 15Tire Speed Weight Limitation
210 MPH TIRES
BASED ON:- Zero Wind- 210 MPH Tires
CORRECTIONS:-2000 lb/1kt TW+1500 lb/kt HW for 200 MPH Tires: -20000 lbfor 225 MPH Tires: +20000 lbfor Flaps 5: -18960 lb
Flap Positions 20 and 25 are NEVER Tire Speed Limited
Pressure Altitude - feet
0
1000
2000
3000
4000
5000
6000
7000
8000
Example: For 25°C OAT, zero wind and 2000 feet pressure altitude, the Tire Speed Limited Weight is 222,000 lb.

Boeing 727-200 Performance Handbook
Page 22
Slush/Standing Water Takeoff Experience has shown that aircraft performance may deteriorate significantly on runways covered with snow, slush, standing water, or ice. Therefore a reduction in dry field length/obstacle limited takeoff weight and revised takeoff speeds is necessary. The information provided is intended for guidance in accordance with advisory material. The performance is based on an engine failure at the critical point during takeoff and a 15 ft. screen height at the end of the runway. Tables are provided for dispatch with all three thrust reversers operative. The entire runway is assumed to be completely covered by a contaminant of uniform thickness and density. Therefore this information is conservative when operating under typical colder weather conditions where patches of slush exist and some degree of sanding is common. Takeoffs in slush depths greater than 13mm (0.5 inches) are not recommended because of possible airplane damage as a result of slush impingement on the airplane structure. Maximum depths for slush, snow and standing water covering an appreciable part of the runway are as follows: Takeoff Landing Slush or wet snow 0.5 inch (12 mm) 1 inch (25 mm) Standing water 0.25 inch (6 mm) 1 inch (25 mm) Dry snow 3.5 inch (90 mm) 3.5 inch (90 mm) The use of assumed temperature method for reduced thrust is not allowed on contaminated runways. Interpolation for slush/standing water depths between the values shown is permitted. Instructions for Using Tables: Determine the field limit weight for the takeoff flap setting. Enter the Weight Adjustment table with the pressure altitude and the corrected runway length to obtain the weight reduction for the slush/standing water depth. Reduce the field limit weight by the reduction shown. Takeoff speeds determination: Determine takeoff speeds V1, VR and V2 for actual brake release weight using the Takeoff Speeds table in this section. Enter the Weight Adjustment table with the pressure altitude and the corrected runway length to obtain the speed reduction for the slush/standing water depth. Reduce the V1 by the reduction shown.

Boeing 727-200 Performance Handbook
Page 23
SLUSH/STANDING WATER TAKEOFF
1/4 Inch Slush Corrections
Weight Reduction - pounds V1 Reduction - KTS Flaps 5 Flaps 15 Flaps 20,25 Flaps 5,15 Flaps 20,25
Runway Length
FT S.L. 4000 S.L. 4000 S.L. 4000 S.L. 4000 S.L. 4000 5000 12000 12000 15000 14000 16000 15000 33 33 32 31 7000 15000 13000 17000 16000 19000 18000 30 29 29 28 9000 17000 15000 20000 18000 21000 20000 29 27 27 27 11000 18000 16000 22000 20000 24000 22000 28 27 26 26 13000 20000 18000 24000 22000 - - 26 25 - -
1/2 Inch Slush Corrections
Weight Reduction - pounds V1 Reduction - KTS Flaps 5 Flaps 15 Flaps 20,25 Flaps 5,15 Flaps 20,25
Runway Length
FT S.L. 4000 S.L. 4000 S.L. 4000 S.L. 4000 S.L. 4000 5000 20000 20000 22000 21000 24000 22000 29 27 27 26 7000 22000 22000 26000 24000 28000 26000 26 25 25 25 9000 25000 23000 28000 26000 30000 28000 26 25 25 24 11000 27000 25000 30000 28000 32000 30000 26 25 25 24 13000 29000 27000 32000 30000 - - 26 26 - -
Takeoff Speeds The speeds presented in the Takeoff Speeds table can be used for all performance conditions except where adjustments must be made to V1 for clearway, stopway, brake deactivation, improved climb, contaminated runway situations, unbalanced for brake energy or obstacle clearance with unbalanced V1. These speeds may be used for weights less than or equal to the performance limited weight. Normal takeoff speeds, V1, VR, and V2, with anti-skid on, are read from the table by entering with takeoff flap setting, brake release weight, and appropriate column.

Boeing 727-200 Performance Handbook
Page 24
Press
Alt 1000 ft
OAT
°F -65 to -14 -13 to 33 34 to 86 9 to 10
°C -54 to -26 -25 to 0 1 to 30 °F - 65 to -36 -35 to 112 13 to 75 76 to 100
7 to 9 °C -54 to -38 -37 to -11 -10 to 24 25 to 38 °F 65 to 2 3 to 40 41 to 96 97 to 109
5 to 7 °C -54 to -17 -16 to 4 5 to 35 36 to 42 °F -65 to 32 33 to 88 89 to 112
3 to 5 °C -54 to 0 1 to 31 32 to 44 °F -65 to 84 85 to 104 105 to 120
1 to 3 °C -54 to 29 30 to 40 41 to 49 °F -65 to 100 101 to 120
-1 to 1 °C -54 to 38 39 to 49
WEIGHT FLAPS
lb V1 = VR V2 V1 = VR V2 V1 = VR V2 V1 = VR V2
210000 165 175 167 175 200000 159 170 161 170 190000 154 166 156 166 158 166 180000 148 161 150 161 152 161 5 170000 142 157 144 157 146 156 148 156 160000 137 151 138 151 140 156 142 150 150000 131 146 132 146 133 145 136 144 140000 128 143 129 143 129 142 131 142 130000 125 141 126 141 127 140 129 140 120000 119 136 120 135 121 134 122 133 210000 155 166 157 166 200000 150 161 152 161 190000 145 157 147 157 149 157 180000 139 152 141 152 143 152
15 170000 134 148 136 148 138 147 140 147 160000 129 143 130 143 132 143 134 142 150000 123 138 124 138 126 137 128 137 140000 121 137 122 136 123 135 125 134 130000 118 134 119 133 120 132 122 132 120000 112 128 113 128 114 127 115 126 210000 150 161 152 161 200000 145 157 147 157 190000 140 152 142 152 144 152 180000 135 148 137 148 139 148
20 170000 130 144 131 144 133 143 135 143 160000 125 139 126 139 128 138 130 138 150000 119 134 120 134 122 133 124 133 140000 116 131 117 131 118 130 120 130 130000 114 129 115 129 116 128 118 128 120000 109 124 109 124 110 123 111 122 210000 143 155 146 155 200000 141 152 143 152 190000 136 148 138 148 139 148 180000 130 144 132 144 134 144
25 170000 125 139 127 139 129 139 131 139 160000 120 135 122 135 124 134 125 134 150000 115 130 116 130 118 130 120 129 140000 112 128 113 127 114 127 116 127 130000 110 126 111 125 112 125 114 125 120000 105 121 106 120 106 120 107 119
SPEEDS NOT VALID WHEN WEIGHTS ARE PREDICATED ON USE OF CLEARWAY, STOWAY, IMPROVED CLIMB OR ARE LIMITED BY BRAKE ENERGY.

Boeing 727-200 Performance Handbook
Page 25
Takeoff EPR and N1
TAKEOFF EPR PRESS OAT
°F -4 5 14 23 32 41 50 59 68 77 86 95 104 113 120
ALT °C -20 -15 -10 -5 0 5 10 15 20 25 30 35 40 45 49
-1000 1 & 3 2.04 2.04 2.04 2.04 2.04 2.04 2.04 2.04 2.04 2.04 2.04 2.04 2.03 1.99 1.94 1.91
2 2.06 2.06 2.06 2.06 2.06 2.06 2.06 2.06 2.06 2.06 2.06 2.06 2.05 2.00 1.96 1.92
S.L. 1 & 3 2.10 2.10 2.10 2.10 2.10 2.10 2.10 2.10 2.10 2.10 2.10 2.08 2.03 1.99 1.94 1.91
2 2.11 2.11 2.11 2.11 2.11 2.11 2.11 2.11 2.11 2.11 2.11 2.10 2.05 2.00 1.96 1.92
1000 1 & 3 2.15 2.15 2.15 2.15 2.15 2.15 2.15 2.13 2.12 2.12 2.11 2.08 2.03 1.99 1.94 1.91
2 2.16 2.16 2.16 2.16 2.16 2.16 2.16 2.15 2.13 2.13 2.12 2.10 2.05 2.00 1.96 1.92
2000 1 & 3 2.21 2.21 2.21 2.21 2.21 2.20 2.17 2.14 2.14 2.14 2.11 2.08 2.03 1.99 1.94 1.91
2 2.22 2.22 2.22 2.22 2.22 2.21 2.18 2.16 2.16 2.15 2.12 2.10 2.05 2.00 1.96 1.92
3000 1 & 3 2.26 2.26 2.26 2.25 2.23 2.20 2.17 2.14 2.14 2.14 2.11 2.08 2.03 1.99 1.94 1.91
2 2.28 2.28 2.28 2.27 2.24 2.21 2.18 2.16 2.16 2.15 2.12 2.10 2.05 2.00 1.96 1.92
3856 & 1 & 3 2.31 2.29 2.27 2.25 2.23 2.20 2.17 2.14 2.14 2.14 2.11 2.08 2.03 1.99 1.94 1.91
ABOVE 2 2.32 2.31 2.29 2.27 2.24 2.21 2.18 2.16 2.16 2.15 2.12 2.10 2.05 2.00 1.96 1.92
EPR BLEED CORRECTIONS ENG 1 & 3 ENG 2
AIR CONDITIONING OFF +.04 -
ENGINE A/I ON ZERO -0.3
IN SHADED AREA COLDER
THAN 0°F (-18°C) -0.3 -0.6
MOD 'A' INLET - 0.1
TAKEOFF N1
PRESS OAT - °C
ALT -40 -35 -29 -23 -18 -12 -7 -1 4 10 16 18 21 24 27 29 32 35 38 41 43 49
-1000 82.2 83.2 84.2 85.1 86.1 87.0 87.9 88.8 89.7 90.6 91.5 92.0 92.4 92.8 93.2 93.7 94.1 94.2 93.7 93.3 92.9 92.0
S.L. 83.5 84.5 85.5 86.5 87.4 88.3 89.3 90.2 91.1 92.0 93.0 93.4 93.9 94.3 94.7 95.0 94.6 94.2 93.7 93.3 92.9 92.0
1000 85.4 86.4 87.3 88.3 89.2 90.2 91.1 92.0 92.9 93.3 93.0 93.4 93.9 94.3 94.7 95.0 94.6 94.2 93.7 93.3 92.9 92.0
2000 68.8 87.8 88.9 89.9 90.9 91.9 92.8 93.8 93.6 93.3 93.0 93.4 93.9 94.3 94.7 95.0 94.6 94.2 93.7 93.3 92.9 92.0
3000 88.4 89.5 90.5 91.5 92.5 93.5 94.0 93.8 93.6 93.3 93.0 93.4 93.9 94.3 94.7 95.0 94.6 94.2 93.7 93.3 92.9 92.0
4000 90.1 91.2 92.3 93.3 94.0 94.0 94.0 93.8 93.6 93.3 93.0 93.4 93.9 94.3 94.7 95.0 94.6 94.2 93.7 93.3 92.9 92.0
5000 92.0 93.1 93.7 93.9 94.0 94.0 94.0 93.8 93.6 93.3 93.0 93.4 93.9 94.3 94.7 95.0 94.6 94.2 93.7 93.3 92.9 92.0
5660 93.2 93.5 93.7 93.9 94.0 94.0 94.0 93.8 93.6 93.3 93.0 93.4 93.9 94.3 94.7 95.0 94.6 94.2 93.7 93.3 92.9 92.0
ADJUSTMENTS:
ENGINE ANTI-ICE ON -No. 1&3 + 0.7% - No. 2 + 0.2%

Boeing 727-200 Performance Handbook
Page 26
Anti-Skid Inoperative For antiskid inoperative, the runway limited maximum takeoff weight at breake release and the V1 speed must be reduced to allow for the effect on accelerate stop performance as detailed in the FAA Approved Airplane Flight Manual. Enter the table with flap setting and read weight reduction. Enter table with flap setting and runway length and read speed reduction.
Flap Setting Weight Reduction – pounds 5° 4000
15° 6300 20° 8500 25° 10000
Flap Setting Runway Length - FT V1 Reduction – KTS
10000 13 5° 12000 14 6000 21 7000 18 8000 17 9000 16
15°
10000 15 7000 18 8000 16 9000 16 20°
10000 15 6000 21 7000 18 25° 8000 16
Dispatch with Tailskid Extended In order to compensate for the increased drag resulting from an extended tail skid, the following adjustments are recommended. Increase climb time, fuel and distance to cruise altitude by 25 percent. Increase cruise fuel flows by 10 Percent (range reduction 10 percent). Reduce thrust limited cruise weights by 20,000 lb.
Stab Trim Setting To find takeoff stabilizer trim setting, enter the Stab Trim Setting table with flap setting and center of gravity (C.G. % MAC) and read required stabilizer trim units.

Boeing 727-200 Performance Handbook
Page 27
STABILZER TRIM SETTING
FLAPS
5 15 / 20 25 CG % UNITS AIRPLANE NOSE UP
10 6 3/4 7 1/2 8 1/4 12 6 1/2 7 1/4 8 14 6 1/4 7 7 3/4 16 6 6 3/4 7 1/2 18 5 3/4 6 1/2 7 20 5 1/2 6 6 1/2 22 5 5 3/4 6 1/4 24 4 3/4 5 1/4 5 3/4 26 4 1/2 4 3/4 5 1/4 28 4 4 1/2 4 3/4 30 3 3/4 4 4 1/4 32 3 1/2 3 3/4 4 34 3 1/4 3 1/4 3 1/2 36 2 3/4 3 3 38 2 1/2 2 1/2 2 1/2 40 2 1/2 2 1/2 2 1/2 42 2 1/2 2 1/2 2 1/2

Boeing 727-200 Performance Handbook
Page 28
CLIMB PERFORMANCE
Maximum Climb EPR
MAXIMUM CLIMB EPR Pressure TAT °C
Altitude ENG -40 -35 -30 -25 -20 -15 -10 -5 0 5 10 15 20 25 30 35 40 45 50
S.L. 1 & 3 2.07 2.07 2.07 2.07 2.07 2.07 2.07 2.07 2.07 2.03 1.97 1.93 1.88 1.84 1.79 1.75 1.72 1.68 1.64
2 2.09 2.09 2.09 2.09 2.09 2.09 2.09 2.09 2.09 2.05 2.00 1.95 1.90 1.86 1.82 1.78 1.74 1.70 1.67
1000 1 & 3 2.13 2.13 2.13 2.13 2.13 2.13 2.13 2.13 2.08 2.03 1.97 1.93 1.88 1.84 1.79 1.75 1.72 1.68 1.64
2 2.15 2.15 2.15 2.15 2.15 2.15 2.15 2.15 2.11 2.05 2.00 1.95 1.90 1.86 1.82 1.78 1.74 1.70 1.67
2000 1 & 3 2.19 2.19 2.19 2.19 2.19 2.19 2.18 2.13 2.08 2.03 1.97 1.93 1.88 1.84 1.79 1.75 1.72 1.68 1.64
2 2.21 2.21 2.21 2.21 2.21 2.21 2.20 2.16 2.11 2.05 2.00 1.95 1.90 1.86 1.82 1.78 1.74 1.70 1.67
3000 1 & 3 2.24 2.24 2.24 2.24 2.23 2.21 2.17 2.13 2.08 2.02 1.97 1.92 1.88 1.83 1.79 1.75 1.71 1.67 1.63
2 2.26 2.26 2.26 2.26 2.26 2.23 2.20 2.16 2.11 2.05 2.00 1.95 1.90 1.86 1.82 1.78 1.74 1.70 1.67
3900 to 1 & 3 2.29 2.28 2.27 2.25 2.23 2.20 2.17 2.13 2.08 2.02 1.97 1.92 1.87 1.83 1.79 1.75 1.71 1.67 1.63
5000 2 2.32 2.31 2.29 2.28 2.26 2.23 2.20 2.16 2.11 2.05 2.00 1.95 1.90 1.86 1.82 1.78 1.74 1.70 1.67
10000 1 & 3 2.28 2.27 2.26 2.24 2.22 2.20 2.16 2.12 2.07 2.01 1.96 1.91 1.86 1.82 1.78 1.74 1.70 1.66 1.62
2 2.32 2.31 2.29 2.28 2.26 2.23 2.20 2.16 2.11 2.05 2.00 1.95 1.90 1.86 1.82 1.78 1.74 1.70 1.67
20000 1 & 3 2.27 2.26 2.24 2.23 2.21 2.18 2.15 2.10 2.05 2.00 1.94 1.90 1.85 1.81 1.76 1.72 1.69 1.65 1.61
2 2.32 2.31 2.29 2.28 2.26 2.23 2.20 2.16 2.11 2.05 2.00 1.95 1.90 1.86 1.82 1.78 1.74 1.70 1.67
30000 1 & 3 2.25 2.24 2.23 2.21 2.19 2.17 2.13 2.09 2.04 1.98 1.93 1.88 1.83 1.79 1.75 1.71 1.67 1.63 1.59
2 2.32 2.31 2.29 2.28 2.26 2.23 2.20 2.16 2.11 2.05 2.00 1.95 1.90 1.86 1.82 1.78 1.74 1.70 1.67
40000 & 1 & 3 2.23 2.22 2.20 2.19 2.17 2.14 2.11 2.06 2.01 1.96 1.90 1.86 1.81 1.77 1.72 1.68 1.65 1.61 1.57
ABOVE 2 2.32 2.31 2.29 2.28 2.26 2.23 2.20 2.16 2.11 2.05 2.00 1.95 1.90 1.86 1.82 1.78 1.74 1.70 1.67
EPR BLEED CORRECTIONS ENG 1 & 3 ENG 2 S.L. OFF + .04 ON - .04
10000 FT OFF + .05 ON - .05 20000 FT OFF + .07 ON - .07 30000 FT OFF + .08 ON - .08
AIR CONDITIONING
AIR BLEED 40000 FT OFF + .11 ON - .10
ENGINE ANTI-ICE ON - .08 - .12 TWO ENG BLEEDS - .17 ENG AND WING
ANTI-ICE ONE ENG BLEED - .17 - .12
Economic Climb Speeds Economic climb speeds are presented as a function of gross weight.
Gross Speed Weight knots
lb IAS 120000 280 130000 285 140000 290 150000 295 160000 300 170000 305 180000 310 190000 315 200000 320 210000 325

Boeing 727-200 Performance Handbook
Page 29
Distance, Time and Fuel Distance, time, and fuel for climb are shown for a 250/300/.78M climb speed schedule. Enter the table with top of climb flight level and read distance, time, and fuel required. Based on: 250 / 300 / M.78 Climb
FL Distance Time Fuel NM min lbs
90 33 7 2646 110 54 8 3086 130 63 9 3417 150 72 10 3858 170 89 12 4299 190 99 13 4519 210 110 14 4960 230 126 16 5512 250 141 18 5952 270 155 20 6393 290 169 22 6834 310 191 25 7496 330 227 30 8488 350 263 35 9149 370 238 32 7937 390 224 30 7385

Boeing 727-200 Performance Handbook
Page 30
CRUISE PERFORMANCE
Maximum Cruise EPR
MAXIMUM CRUISE EPR TAT °C FL
ENG
-50 -45 -40 -35 -30 -25 -20 -15 -10 -5 0 5 10 15 20 25 30 35 40 45
50 2.24 2.23 2.22 2.21 2.20 2.18 2.15 2.13 2.09 2.04 1.99 1.93 1.87 1.80 1.75 1.70 1.65 1.61 1.57 1.53
100 2.24 2.23 2.22 2.20 2.19 2.18 2.16 2.13 2.09 2.04 1.99 1.93 1.86 1.80 1.74 1.69 1.65 1.60 1.56 1.52
200 2.23 2.22 2.21 2.19 2.18 2.17 2.14 2.12 2.08 2.03 1.98 1.92 1.85 1.79 1.73 1.68 1.64 1.59 1.55 1.51
300 2.22 2.21 2.00 2.18 2.17 2.16 2.13 2.10 2.07 2.02 1.97 1.91 1.84 1.78 1.72 1.67 1.63 1.58 1.54 1.50
400 2.19 2.18 2.17 2.16 2.15 2.13 2.11 2.08 2.04 2.00 1.94 1.89 1.82 1.76 1.70 1.65 1.60 1.56 1.52 1.48
420
1&3
2.19 2.18 2.17 2.16 2.14 2.13 2.11 2.08 2.04 1.99 1.94 1.88 1.82 1.75 1.69 1.64 1.60 1.56 1.52 1.48
50
420 2 2.25 2.24 2.23 2.22 2.21 2.19 2.17 2.14 2.10 2.06 2.01 1.95 1.89 1.82 1.76 1.72 1.67 1.63 1.59 1.55
EPR BLEED CORRECTIONS Flight Level
ENG 1 & 3 ENG 2
050 OFF + .03 ON - .03 100 OFF + .04 ON - .04 200 OFF + .05 ON - .05 300 OFF + .06 ON - .06 400 OFF + .08 ON - .07
Air Conditioning
Air Bleed
420 OFF + .08 ON - .07 Engine Anti-Ice ON - .08 - .11
TWO ENG BLEEDS - .16 ENG and Wing Anti-Ice ONE ENG BLEED - .16
-. 11
Cruise EPR and Specific Range The table presents the required EPR and the Specific Range (SR) as a function of gross weight and flight level. Fuel Flow (FF) can be calculated from the Specific Range (SR) by the following equation:
x1000SR
TASFF
To convert Nautical Miles (NM) into Nautical Air Miles (NAM) use the following equation, where GS is the Ground Speed:
GSTASNMNAM
TRUE AIRSPEED TABLE
M = 0.78 M = .80 OAT °C TAS KTS TAS KTS
-15 488 501 -20 484 496 -25 479 491 -30 474 486 -35 469 481 -40 464 476 -45 459 471 -50 454 466 -55 449 460 -60 444 455 -65 438 450 -70 433 444

Boeing 727-200 Performance Handbook
Page 31
EPR required Specific Range NAM/1000lbs
CRUISE EPR required 250/350/M.78
Press STD STD STD Alt TAS IAS SAT TAT M
GROSS WEIGHT - 1000 LBS
-1000 KTS KTS °C °C 175 170 165 160 155 150 145 140 135 130 125 120 115 110 FT
2.09 2.04 1.99 1.95 1.91 1.88 39 447 241 -57 -31 .78
58.5 61.4 64.3 67.1 69.9 72.6 2.11 2.06 2.01 1.97 1.93 1.90 1.87 1.84 1.82
37 447 252 -57 -31 .78 52.4 54.9 57.3 59.6 61.9 64.2 66.4 68.6 70.7 2.11 2.06 2.02 1.98 1.95 1.91 1.89 1.86 1.83 1.81 1.79 1.77
35 450 264 -54 -27 .78 47.7 49.7 51.7 53.6 55.5 57.4 59.3 61.1 62.9 64.6 66.3 68.0
2.06 2.02 1.98 1.95 1.92 1.89 1.87 1.85 1.82 1.80 1.79 1.77 1.75 1.74 33 454 277 -50 -23 .78
45.5 47.1 48.7 50.3 51.9 53.4 54.9 56.4 57.9 59.3 60.7 62.1 63.4 64.8 1.95 1.92 1.90 1.87 1.85 1.83 1.81 1.79 1.78 1.76 1.75 1.73 1.72 1.71
31 458 289 -46 -18 .78 46.0 47.3 48.6 49.9 51.1 52.3 53.5 54.7 55.8 57.0 58.1 59.2 60.3 61.3 1.87 1.85 1.83 1.82 1.80 1.78 1.77 1.76 1.74 1.73 1.72 1.71 1.69 1.68
29 462 302 -42 -14 .78 45.6 46.6 47.6 48.6 49.6 50.6 51.5 52.5 53.4 54.3 55.2 56.1 56.9 57.8 1.82 1.80 1.79 1.77 1.76 1.75 1.74 1.72 1.71 1.70 1.69 1.68 1.67 1.66
27 466 315 -38 -9 .78 44.4 45.3 46.1 46.9 47.7 48.4 49.2 50.0 50.7 51.4 52.2 52.9 53.6 54.2 1.77 1.76 1.75 1.75 1.73 1.72 1.71 1.70 1.69 1.68 1.67 1.66 1.66 1.65
25 470 329 -35 -6 .78 42.9 43.6 44.2 44.9 45.4 46.1 46.7 47.3 47.9 48.5 49.1 49.7 50.2 50.8 1.74 1.73 1.72 1.71 1.70 1.69 1.69 1.68 1.67 1.66 1.66 1.65 1.64 1.63
23 474 342 -31 -2 .78 41.1 41.6 42.1 42.7 43.2 43.7 44.2 44.7 45.2 45.6 46.1 46.6 47.0 47.5 1.70 1.69 1.68 1.67 1.67 1.66 1.65 1.64 1.64 1.63 1.62 1.62 1.61 1.60
21 470 350 -27 1 .76 41.1 41.5 41.9 42.3 42.7 43.1 43.5 43.9 44.3 44.6 45.0 45.4 45.7 46.1 1.65 1.65 1.64 1.63 1.62 1.61 1.61 1.60 1.59 1.59 1.58 1.58 1.57 1.56
19 456 350 -23 2 .71 39.9 40.2 40.6 41.0 41.3 41.7 42.0 42.3 42.7 43.0 43.3 43.7 44.0 44.3 1.61 1.61 1.60 1.59 1.58 1.58 1.57 1.56 1.56 1.55 1.55 1.54 1.53 1.53
17 444 350 -19 7 .71 38.4 38.8 39.2 39.5 39.9 40.1 40.5 40.9 41.2 41.5 41.8 42.1 42.4 42.7 1.57 1.57 1.56 1.55 1.55 1.54 1.53 1.53 1.52 1.52 1.51 1.50 1.50 1.49
15 431 350 -15 9 .68 37.1 37.4 37.8 38.1 38.4 38.7 39.0 39.3 39.6 39.9 40.2 40.5 40.7 41.0 1.53 1.53 1.52 1.51 1.51 1.50 1.50 1.49 1.49 1.48 1.48 1.47 1.47 1.46
13 419 350 -11 12 .66 35.7 36.0 36.3 36.6 36.9 37.2 37.5 37.7 38.0 38.3 38.5 38.8 39.1 39.3 1.49 1.49 1.48 1.48 1.47 1.47 1.46 1.46 1.45 1.45 1.44 1.44 1.43 1.43
11 407 350 -7 15 .64 34.3 34.6 34.1 35.2 35.4 35.7 36.0 36.2 36.5 36.7 37.0 37.2 37.4 37.7 1.38 1.37 1.36 1.35 1.34 1.33 1.31 1.30 1.29 1.28 1.28 1.27 1.26 1.25
9 285 250 -3 7 .44 38.7 39.2 39.7 40.2 40.7 41.1 41.6 42.0 42.5 43.0 43.3 43.8 44.3 44.7 1.36 1.35 1.33 1.31 1.31 1.30 1.29 1.28 1.27 1.26 1.25 1.24 1.23 1.22
7 276 250 1 11 .43 36.8 37.2 37.7 38.1 38.6 39.0 39.5 39.9 40.3 40.7 41.2 41.6 42.0 42.4 1.33 1.32 1.31 1.30 1.29 1.28 1.27 1.26 1.25 1.24 1.23 1.22 1.21 1.20
5 268 250 5 14 .41 35.0 35.4 35.9 36.3 36.7 37.1 37.5 37.9 38.3 38.7 39.1 39.5 39.9 40.2 1.30 1.29 1.28 1.27 1.26 1.25 1.24 1.23 1.22 1.21 1.21 1.20 1.19 1.18
3 261 250 6 15 .40 33.4 33.8 34.2 34.5 34.9 35.3 35.7 36.1 36.4 36.8 37.2 37.5 37.9 38.2
Notes: - A/C bleed from pod engines "ON" - No bleed from center engine - Shaded area indicates optimum altitude

Boeing 727-200 Performance Handbook
Page 32
Turbulent Air Penetration
Gross Weight – 1000 pounds 175 170 165 160 155 150 145 Target Speed
IAS/Mach Flight Level Nominal N1 % 390 93 92 350 95 93 91 88 88 86 85 310 88 88 86 84 84 82 81 270 84 85 82 81 81 80 79 200 80 83 78 77 77 76 75
280/.80
100 75 76 74 74 74 73 72

Boeing 727-200 Performance Handbook
Page 33
HOLDING Target EPR and fuel flow per engine information is tabulated for holding with flaps up based on the minimum drag airspeed. Enter the table with weight and pressure altitude to read EPR and fuel flow per engine. All engines 2 airbleeds fuel flow based on ISA adjust fuel flow +1% per +5°C ISA deviation Minimum Drag Airspeed (200 KTS Lower Limit) Press Altitude Gross Weight - 1000 pounds
feet 160 150 140 130 120 110 ISA °C 40000 2200 2200 -57 2.02 2.00 35000 2530 2490 2300 2120 2120 -54 1.95 1.93 1.91 1.82 1.80 30000 2800 2510 2470 2280 2120 2120 -44 1.84 1.77 1.75 1.70 1.65 1.60 25000 2755 2558 2490 2240 2200 2200 -35 1.68 1.61 1.57 1.53 1.51 1.48 20000 2840 2670 2580 2270 2300 2300 -25 1.56 1.49 1.46 1.43 1.40 1.38 15000 2910 2780 2670 2310 2380 2380 -15 1.43 1.39 1.36 1.33 1.32 1.29 10000 3040 2850 2740 2460 2520 2520 -5 1.33 1.31 1.29 1.27 1.25 1.23 5000 3130 2960 2830 2510 2580 2580 5 1.27 1.24 1.22 1.21 1.20 1.19 1500 3200 3020 2010 2600 2670 2670 12 1.23 1.21 1.18 1.18 1.18 1.17
FF PER ENG – LB/HR EPR

Boeing 727-200 Performance Handbook
Page 34
DESCENT Distance and time for descent are shown for a .78M/280 KIAS descent speed schedule. Enter the table with top of descent pressure altitude and read distance in nautical miles and time in minutes.
.78M / 280 knot descent Based on: - Idle power on all engines throughout descent down to initial approach configuration - Cruise Mach 0.78 to to crossover then 350 knots to 10000 feet - 250 knots or less below 10000 feet - Clean configuraton above 2000 feet - Add 120 pounds fuel burn for each minute of terminal area maneuvering Press. Distance Time Fuel Altitude NM min lbs feet 41000 133 23.6 1711 39000 127 22.8 1684 37000 121 22.1 1654 35000 115 21.3 1622 33000 109 20.6 1588 31000 104 19.9 1552 29000 98 19.2 1513 27000 93 18.6 1474 25000 88 18.0 1436 23000 83 17.4 1399 21000 78 16.7 1355 19000 72 16.0 1308 17000 66 15.2 1259 15000 60 14.4 1210 13000 54 13.7 1162 11000 49 12.9 1112 9000 36 10.6 1019 7000 30 9.4 974 5000 25 8.2 924 3000 18 6.5 848

Boeing 727-200 Performance Handbook
Page 35
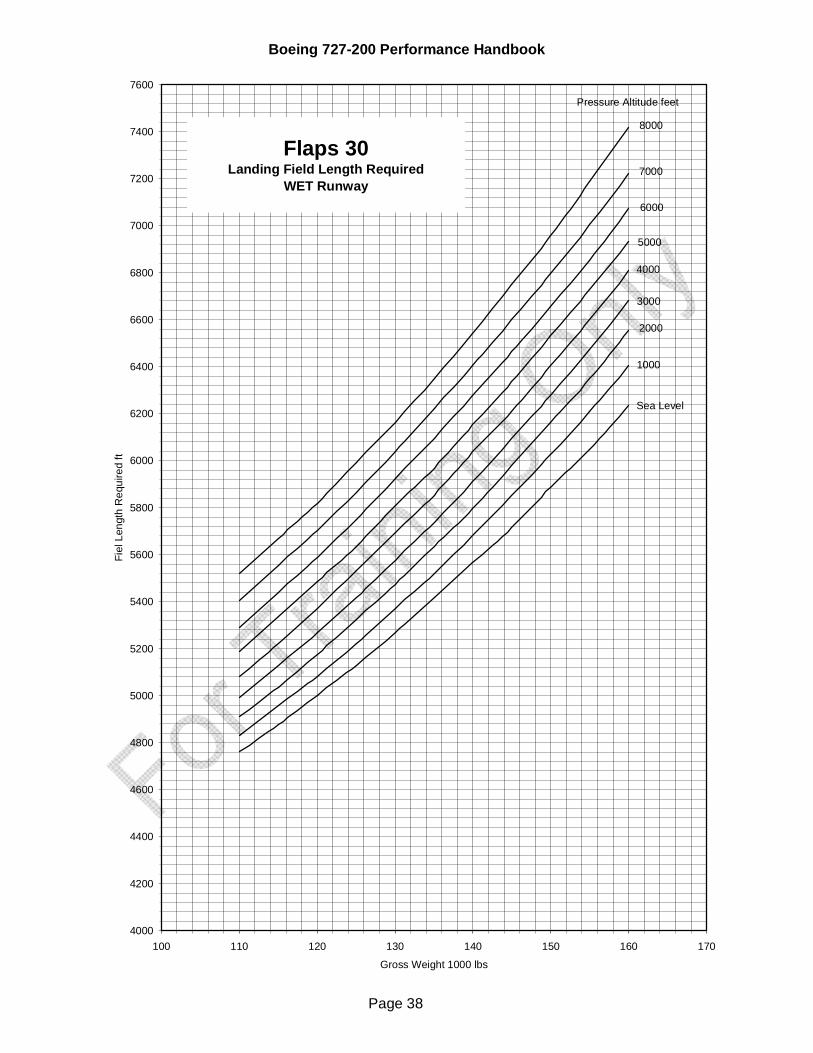
LANDING PERFORMANCE Charts are provided for determining the maximum landing weight as limited by field length or climb requirements for flap positions 30 and 40. Maximum performance landing weight is the smaller of the field length limit weight and climb limit weight; do not exceed maximum structural landing weight. Normally the flap setting for landing is 30 degrees. A flap 30 landing is required when the airport elevation is above 2000 ft. The use of flap 40 is recommended when landing under adverse conditions such as:
Slippery Runway Runway Length 7000 ft or less Braking action reported less then good
Landing Field Length Limitation To determine the landing field length rquired enter the chart with gross weight and airport pressure altitude and read field length required. Charts are provided for DRY and WET runway conditions.
Landing Climb Limitation Enter table with OAT and airport pressure altitude and read climb limited gross weight.

Boeing 727-200 Performance Handbook
Page 36
4000
4200
4400
4600
4800
5000
5200
5400
5600
5800
6000
6200
6400
6600
100 110 120 130 140 150 160 170
Gross Weight 1000 lbs
Fiel
d Le
ngth
Req
uire
d ft
Flaps 30Landing Field Length Required
DRY Runway
Pressure Altitude feet
8000
7000
6000
5000
4000
3000
2000
1000
Sea Level

Boeing 727-200 Performance Handbook
Page 37
4000
4200
4400
4600
4800
5000
5200
5400
5600
5800
6000
6200
6400
100 105 110 115 120 125 130 135 140 145 150
Gross Weight 1000 lbs
Fiel
d Le
ngth
Req
uire
d ft
Flaps 40Landing Field Length Required
DRY Runway
Pressure Altitude feet
8000
7000
6000
5000
4000
3000
2000
1000
Sea Level
Boeing 727-200 Performance Handbook
Page 38
4000
4200
4400
4600
4800
5000
5200
5400
5600
5800
6000
6200
6400
6600
6800
7000
7200
7400
7600
100 110 120 130 140 150 160 170
Gross Weight 1000 lbs
Fiel
Len
gth
Req
uire
d ft
Flaps 30Landing Field Length Required
WET Runway
Pressure Altitude feet
8000
7000
6000
5000
4000
3000
2000
1000
Sea Level

Boeing 727-200 Performance Handbook
Page 39
4400
4500
4600
4700
4800
4900
5000
5100
5200
5300
5400
5500
5600
5700
5800
5900
6000
6100
6200
6300
6400
6500
6600
6700
6800
6900
7000
7100
7200
100 105 110 115 120 125 130 135 140 145 150
Gross Weight 1000 lbs
Fiel
d Le
ngth
Req
uire
d ft
Flaps 40Landing Field Length Required
WET Runway
Pressure Altitude feet
8000
7000
6000
5000
4000
3000
2000
1000
Sea Level

Boeing 727-200 Performance Handbook
Page 40
Climb Limited Landing Weight Flaps 30
OAT AIRPORT ELEVATION (FEET) °F 0 1000 2000 3000 4000 5000 6000 7000 8000 Landing Climb Limited Weight pounds x 1000
50 160 160 160 160 160 160 160 160 160 55 160 160 160 160 160 160 160 160 160 60 160 160 160 160 160 160 160 160 160 65 160 160 160 160 160 160 160 160 160 70 160 160 160 160 160 160 160 160 160 75 160 160 160 160 160 160 160 160 160 80 160 160 160 160 160 160 160 160 160 85 160 160 160 160 160 160 160 160 160 90 160 160 160 160 160 160 160 160 158.6 95 160 160 160 160 160 160 160 160 155.5 100 160 160 160 160 160 160 160 157.9 151.9 105 160 160 160 160 160 160 159.7 153.7 147.9 110 160 160 160 160 160 160 154 149.1 143.5
Climb Limited Landing Weight Flaps 40
OAT AIRPORT ELEVATION (FEET) °F 0 1000 2000 3000 4000 5000 6000 7000 8000 Landing Climb Limited Weight pounds x 1000
50 142.5 142.5 142.5 142.5 142.5 142.5 142.5 142.5 142.5 55 142.5 142.5 142.5 142.5 142.5 142.5 142.5 142.5 142.5 60 142.5 142.5 142.5 142.5 142.5 142.5 142.5 142.5 142.5 65 142.5 142.5 142.5 142.5 142.5 142.5 142.5 142.5 142.5 70 142.5 142.5 142.5 142.5 142.5 142.5 142.5 142.5 142.5 75 142.5 142.5 142.5 142.5 142.5 142.5 142.5 142.5 142.5 80 142.5 142.5 142.5 142.5 142.5 142.5 142.5 142.5 142.5 85 142.5 142.5 142.5 142.5 142.5 142.5 142.5 142.5 141.6 90 142.5 142.5 142.5 142.5 142.5 142.5 142.5 142.5 139.3 95 142.5 142.5 142.5 142.5 142.5 142.5 142.5 141.7 136.6 100 142.5 142.5 142.5 142.5 142.5 142.5 142.5 133.5 133.5 105 142.5 142.5 142.5 142.5 142.5 142.5 140.2 134.9 129.9 110 142.5 142.5 142.5 142.5 142.5 141.3 136.1 130.9 126
Boeing 727-200 Performance Handbook
Page 41
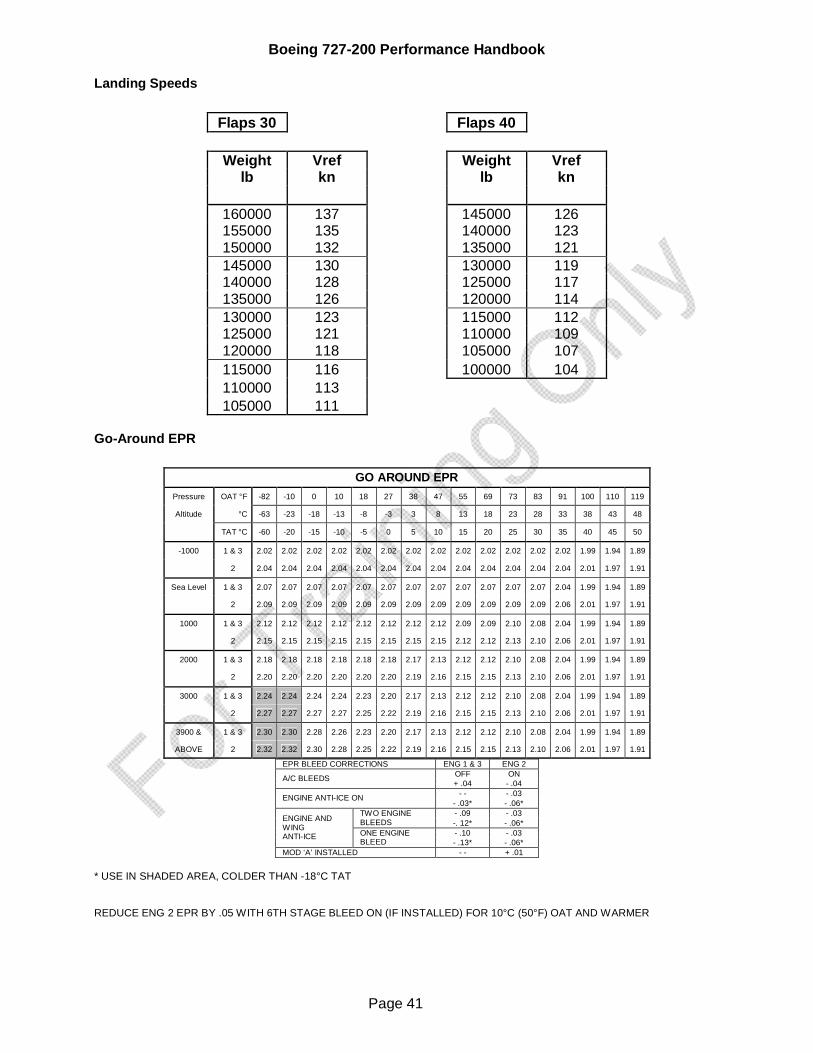
Landing Speeds
Flaps 30 Flaps 40
Weight Vref Weight Vref lb kn lb kn
160000 137 145000 126 155000 135 140000 123 150000 132 135000 121 145000 130 130000 119 140000 128 125000 117 135000 126 120000 114 130000 123 115000 112 125000 121 110000 109 120000 118 105000 107 115000 116 100000 104 110000 113 105000 111
Go-Around EPR
GO AROUND EPR Pressure OAT °F -82 -10 0 10 18 27 38 47 55 69 73 83 91 100 110 119
Altitude °C -63 -23 -18 -13 -8 -3 3 8 13 18 23 28 33 38 43 48
TAT °C -60 -20 -15 -10 -5 0 5 10 15 20 25 30 35 40 45 50
-1000 1 & 3 2.02 2.02 2.02 2.02 2.02 2.02 2.02 2.02 2.02 2.02 2.02 2.02 2.02 1.99 1.94 1.89
2 2.04 2.04 2.04 2.04 2.04 2.04 2.04 2.04 2.04 2.04 2.04 2.04 2.04 2.01 1.97 1.91
Sea Level 1 & 3 2.07 2.07 2.07 2.07 2.07 2.07 2.07 2.07 2.07 2.07 2.07 2.07 2.04 1.99 1.94 1.89
2 2.09 2.09 2.09 2.09 2.09 2.09 2.09 2.09 2.09 2.09 2.09 2.09 2.06 2.01 1.97 1.91
1000 1 & 3 2.12 2.12 2.12 2.12 2.12 2.12 2.12 2.12 2.09 2.09 2.10 2.08 2.04 1.99 1.94 1.89
2 2.15 2.15 2.15 2.15 2.15 2.15 2.15 2.15 2.12 2.12 2.13 2.10 2.06 2.01 1.97 1.91
2000 1 & 3 2.18 2.18 2.18 2.18 2.18 2.18 2.17 2.13 2.12 2.12 2.10 2.08 2.04 1.99 1.94 1.89
2 2.20 2.20 2.20 2.20 2.20 2.20 2.19 2.16 2.15 2.15 2.13 2.10 2.06 2.01 1.97 1.91
3000 1 & 3 2.24 2.24 2.24 2.24 2.23 2.20 2.17 2.13 2.12 2.12 2.10 2.08 2.04 1.99 1.94 1.89
2 2.27 2.27 2.27 2.27 2.25 2.22 2.19 2.16 2.15 2.15 2.13 2.10 2.06 2.01 1.97 1.91
3900 & 1 & 3 2.30 2.30 2.28 2.26 2.23 2.20 2.17 2.13 2.12 2.12 2.10 2.08 2.04 1.99 1.94 1.89
ABOVE 2 2.32 2.32 2.30 2.28 2.25 2.22 2.19 2.16 2.15 2.15 2.13 2.10 2.06 2.01 1.97 1.91
EPR BLEED CORRECTIONS ENG 1 & 3 ENG 2 OFF ON A/C BLEEDS + .04 - .04 - - - .03 ENGINE ANTI-ICE ON
- .03* - .06* - .09 - .03 TWO ENGINE
BLEEDS -. 12* - .06* - .10 - .03
ENGINE AND WING ANTI-ICE ONE ENGINE
BLEED - .13* - .06* MOD ‘A’ INSTALLED - - + .01
* USE IN SHADED AREA, COLDER THAN -18°C TAT REDUCE ENG 2 EPR BY .05 WITH 6TH STAGE BLEED ON (IF INSTALLED) FOR 10°C (50°F) OAT AND WARMER

Boeing 727-200 Performance Handbook
Page 42
ENGINE OUT
Maximum Continuous EPR
PRESS MAXIMUM CONTINUOUS EPR ALT TAT °C
FT ENG -40 -35 -30 -25 -20 -15 -10 -5 0 5 10 15 20 25 30 35 40 45 50
1 & 3 2.07 2.07 2.07 2.07 2.07 2.07 2.07 2.07 2.07 2.03 1.98 1.93 1.88 1.84 1.84 1.84 1.84 1.80 1.75 S.L.
2 2.09 2.09 2.09 2.09 2.09 2.09 2.09 2.09 2.09 2.05 2.00 1.95 1.91 1.87 1.86 1.86 1.86 1.83 1.78
1 & 3 2.13 2.13 2.13 2.13 2.13 2.13 2.13 2.13 2.09 2.03 1.98 1.93 1.88 1.84 1.84 1.84 1.84 1.80 1.75 1000
2 2.15 2.15 2.15 2.15 2.15 2.15 2.15 2.15 2.11 2.05 2.00 1.95 1.91 1.87 1.86 1.86 1.86 1.83 1.78
1 & 3 2.16 2.16 2.16 2.16 2.16 2.16 2.16 2.14 2.09 2.03 1.98 1.93 1.88 1.84 1.84 1.84 1.84 1.80 1.75 1499
2 2.17 2.17 2.17 2.17 2.17 2.17 2.17 2.16 2.11 2.05 2.00 1.95 1.91 1.87 1.86 1.86 1.86 1.83 1.78
1 & 3 2.16 2.16 2.16 2.16 2.16 2.16 2.16 2.16 2.16 2.16 2.14 2.10 2.05 2.01 1.96 1.91 1.86 1.80 1.75 1500
2 2.17 2.17 2.17 2.17 2.17 2.17 2.17 2.17 2.17 2.17 2.16 2.12 2.07 2.03 1.98 1.93 1.88 1.83 1.78
1 & 3 2.19 2.19 2.19 2.19 2.19 2.19 2.19 2.19 2.19 2.17 2.14 2.10 2.06 2.01 1.96 1.91 1.86 1.80 1.75 2000
2 2.20 2.20 2.20 2.20 2.20 2.20 2.20 2.20 2.20 2.19 2.16 2.12 2.07 2.03 1.98 1.93 1.88 1.83 1.78
1 & 3 2.24 2.24 2.24 2.24 2.24 2.24 2.24 2.23 2.20 2.17 2.13 2.09 2.05 2.00 1.95 1.90 1.85 1.80 1.75 3000
2 2.27 2.27 2.27 2.27 2.27 2.27 2.27 2.25 2.22 2.19 2.16 2.12 2.07 2.03 1.98 1.93 1.88 1.83 1.78
1 & 3 2.30 2.30 2.30 2.30 2.30 2.28 2.25 2.23 2.20 2.17 2.13 2.09 2.05 2.00 1.95 1.90 1.85 1.80 1.74 3900 TO
5000 2 2.32 2.32 2.32 2.32 2.32 2.30 2.28 2.25 2.22 2.19 2.16 2.12 2.07 2.03 1.98 1.93 1.88 1.83 1.78
1 & 3 2.29 2.29 2.29 2.29 2.29 2.27 2.25 2.22 2.19 2.16 2.12 2.08 2.04 1.99 1.94 1.89 1.84 1.79 1.74 10000
2 2.32 2.32 2.32 2.32 2.32 2.30 2.28 2.25 2.22 2.19 2.16 2.12 2.07 2.03 1.98 1.93 1.88 1.83 1.78
1 & 3 2.27 2.27 2.27 2.27 2.27 2.25 2.23 2.21 2.18 2.14 2.11 2.07 2.02 1.98 1.93 1.88 1.83 1.77 1.72 20000
2 2.32 2.32 2.32 2.32 2.32 2.30 2.28 2.25 2.22 2.19 2.16 2.12 2.07 2.03 1.98 1.93 1.88 1.83 1.78
1 & 3 2.26 2.26 2.26 2.26 2.26 2.24 2.22 2.19 2.16 2.13 2.09 2.05 2.01 1.96 1.91 1.86 1.81 1.76 1.71 30000
2 2.32 2.32 2.32 2.32 2.32 2.30 2.28 2.25 2.22 2.19 2.16 2.12 2.07 2.03 1.98 1.93 1.88 1.83 1.78
1 & 3 2.24 2.24 2.24 2.24 2.24 2.22 2.19 2.17 2.14 2.11 2.07 2.03 1.98 1.94 1.89 1.84 1.79 1.74 1.68 40000
2 2.32 2.32 2.32 2.32 2.32 2.30 2.28 2.25 2.22 2.19 2.16 2.12 2.07 2.03 1.98 1.93 1.88 1.83 1.78
1 & 3 2.23 2.23 2.23 2.23 2.23 2.21 2.19 2.16 2.13 2.10 2.06 2.02 1.98 1.93 1.88 1.83 1.78 1.73 1.68 42000
2 2.32 2.32 2.32 2.32 2.32 2.30 2.28 2.25 2.22 2.19 2.16 2.12 2.07 2.03 1.98 1.93 1.88 1.83 1.78
EPR BLEED CORRECTIONS ENG 1 &3 ENG 2
S.L. OFF + .04 ON - .04
10000 FT OFF + .05 ON - .05
20000 FT OFF + .07 ON - .07
30000 FT OFF + .08 ON - .08
40000 FT OFF + .10 ON - .09
AIR CONDITIONING AIR BLEED
42000 Ft OFF + .11 ON - .09
ENGINE ANTI-ICE ON - .08 - .12
TWO BLEEDS - .17 END AND WING ANTI-ICE
ONE BLEED - .17 - .12
MOD 'A' INLET - + .01

Boeing 727-200 Performance Handbook
Page 43
One Engine Out The table shows maximum altitude that can be maintained at a given weight and air temperature, based on long range cruise speed and maximum continuous thrust. In some cases following engine failure, a descent to a lower altitude and reduction in airspeed may be necessary. In these circumstances, a driftdown procedure should be adopted in order to minimize the loss in specific range. The turbulent air penetration speed schedule is recommended. For driftdown following engine failure, set up maximum continuous thrust and establish a speed schedule of 280 KIAS or M = .80, whichever is lower.
Altitude Capability One Engine Inop
Gross Weight Pressure Altitude - Feet
1000 lbs ISA-10°C ISA ISA+10°C ISA+20°C 200 21423 19995 16783 12158 190 22932 21684 18779 14551 180 24440 23374 20775 16943 170 25948 25063 22771 19336 160 27456 26753 24767 21729 150 28964 28443 26763 24122 140 30473 30132 28758 26514 130 31981 31822 30754 28907 120 33300 33512 32750 31300

Boeing 727-200 Performance Handbook
Page 44
Two Engine Out After failure of the second engine, set maximum continuous limit EPR and allow the airplane to descent at the airspeed shown in the driftdown table. The airplane should level off at approximately the altitude and weight shown in the table. EPR must be checked frequently during the driftdown to ensure that the maximum continuous limit EPR is not exceeded. When the airplane has leveled off, constant altitude should be maintained. This will allow the airplane to slowly accelerate to the optimum range speed as weight reduces due to fuel burnoff. When the optimum range speed shown in the climbing cruise table is achieved, the airplane should follow a climbing cruise procedure, flying at the airspeed appropriate to the gross weight. The pressure altitudes achievable under these weight and speed conditions are shown in the table.
Climbing Cruise
Gross Optimum ISA Deviation °C Weight Range -10 0 10 20 LBS 1000 Speed KIAS Pressure Altitude - Feet 110 216 17553 16758 15468 13180 120 225 15249 14218 12497 9612 130 234 12944 11678 9526 6043 140 242 10640 9138 6555 2475 150 251 8336 6598 3584 160 260 6032 4058 170 269 3727 1518
Driftdown
Gross Weight LBS 1000 Driftdown Leveloff Press Alt - Feet
Start Approx Speed ISA Deviation °C Driftdown Level-Off KIAS -10 0 10 20
120 115 205 17539 16482 15014 12816 130 124 213 15634 14382 12510 9795 140 133 220 13728 12282 10006 6774 150 142 228 11823 10182 7502 3753 160 151 236 9918 8082 4998 732 170 160 244 8013 5981 2494 180 169 251 6108 3881 190 178 259 4203 1781

Boeing 727-200 Performance Handbook
Page 45
ENGINE PARAMETER CHECK TABLES
Engine Parameter Check N1, N2, EGT versus EPR Pod Engines
TAT - °C -40 -30 -20 -10 0 10 20 30 40
EPR
N1 % 72.7 74.2 75.7 77.2 78.6 80.1 81.5 82.9 84.2 N2 % 77.2 78.8 80.4 82.0 83.5 85.0 86.5 88.0 89.4 1.55 EGT °C 308 333 358 383 407 432 457 482 507 N1 % 74.0 75.6 77.1 78.6 80.1 81.5 83.0 84.4 85.7 N2 % 77.8 79.5 81.1 82.7 84.2 85.8 87.3 88.7 90.2 1.60 EGT °C 308 333 358 383 408 433 458 483 508 N1 % 75.2 76.8 78.4 79.9 81.4 82.9 84.3 85.8 87.2 N2 % 78.4 80.1 81.7 83.3 84.9 86.5 88.0 89.5 90.9 1.65 EGT °C 309 334 359 384 409 434 459 484 508 N1 % 76.4 78.0 79.6 81.1 82.7 84.2 85.6 87.1 88.5 N2 % 79.1 80.8 82.4 84.0 85.6 87.1 88.7 90.2 91.6 1.70 EGT °C 309 334 359 384 409 434 459 484 509 N1 % 77.5 79.1 80.8 82.3 83.9 85.4 86.9 88.4 89.8 N2 % 79.7 81.4 83.1 84.7 86.3 87.8 89.4 90.9 92.4 1.75 EGT °C 310 335 360 385 410 435 460 485 510 N1 % 78.6 80.3 81.9 83.5 85.1 86.6 88.1 89.6 91.1 N2 % 80.3 82.0 83.7 85.4 87.0 88.5 90.1 91.6 93.1 1.80 EGT °C 310 335 360 385 410 435 460 485 510 N1 % 79.7 81.4 83.1 84.7 86.3 87.8 89.4 90.9 92.4 N2 % 81.0 82.7 84.4 86.0 87.7 89.2 90.8 92.3 93.9 1.85 EGT °C 311 336 361 386 411 436 461 486 511 N1 % 80.9 82.6 84.3 85.9 87.5 89.1 90.7 92.2 93.7 N2 % 81.6 83.4 85.1 86.7 88.4 90.0 91.5 93.1 94.6 1.90 EGT °C 311 336 361 386 412 437 462 487 512 N1 % 82.0 83.8 85.5 87.2 88.8 90.4 92.0 93.6 95.1 N2 % 82.3 84.1 85.8 87.5 89.1 90.7 92.3 93.9 95.4 1.95 EGT °C 312 337 362 387 412 437 462 487 512 N1 % 83.3 85.1 86.8 88.5 90.2 91.8 93.4 95.0 96.6 N2 % 83.0 84.8 86.5 88.2 89.9 91.5 93.1 94.7 96.2 2.00 EGT °C 312 337 362 388 413 438 463 488 513 N1 % 84.7 86.5 88.3 90.0 91.7 93.3 95.0 96.6 98.2 N2 % 83.7 85.5 87.3 89.0 90.6 92.3 93.9 95.5 97.1 2.05 EGT °C 313 338 363 388 413 438 463 489 514 N1 % 86.2 88.0 89.8 91.6 93.3 95.0 96.6 98.3 99.9 N2 % 84.5 86.3 88.1 89.8 91.5 93.1 94.8 96.4 97.9 2.10 EGT °C 313 338 363 389 414 439 464 489 514 N1 % 87.8 89.7 91.5 93.3 95.1 96.8 98.5 100.2 101.8 N2 % 85.3 87.1 88.9 90.6 92.3 94.0 95.6 97.3 98.9 2.15 EGT °C 314 339 364 389 414 439 465 490 515
Based on: - Straight and level flight - Only pod engines bleed, no bleed from center engine - Engines stabilized for five minutes

Boeing 727-200 Performance Handbook
Page 46
Engine Parameter Check
N1, N2, EGT versus EPR Center Engine
TAT - °C -40 -30 -20 -10 0 10 20 30 40
EPR
N1 % 73.1 74.6 76.2 77.6 79.1 80.5 82.0 83.3 84.7 N2 % 76.6 78.2 79.8 81.4 82.9 84.4 85.9 87.3 88.7 1.55 EGT °C 306 331 356 380 405 430 455 480 505 N1 % 74.2 75.7 77.3 78.8 80.3 81.7 83.2 84.6 85.9 N2 % 77.2 78.8 80.4 82.0 83.6 85.1 86.6 88.0 89.5 1.60 EGT °C 306 331 356 381 406 431 456 480 505 N1 % 75.2 76.8 78.3 79.9 81.4 82.9 84.3 85.7 87.1 N2 % 77.8 79.5 81.1 82.7 84.2 85.8 87.3 88.7 90.2 1.65 EGT °C 307 332 357 382 406 431 456 481 506 N1 % 76.2 77.8 79.4 80.9 82.5 84.0 85.4 86.9 88.3 N2 % 78.5 80.1 81.7 83.3 84.9 86.5 88.0 89.5 90.9 1.70 EGT °C 307 332 357 382 407 432 457 482 507 N1 % 77.2 78.8 80.4 82.0 83.5 85.0 86.5 88.0 89.4 N2 % 79.1 80.8 82.4 84.0 85.6 87.2 88.7 90.2 91.7 1.75 EGT °C 308 333 358 383 407 432 457 482 507 N1 % 78.2 79.8 81.5 83.1 84.6 86.1 87.7 89.1 90.6 N2 % 79.7 81.4 83.1 84.7 86.3 87.9 89.4 90.9 92.4 1.80 EGT °C 308 333 358 383 408 433 458 483 508 N1 % 79.2 80.9 82.5 84.2 85.7 87.3 88.8 90.3 91.8 N2 % 80.4 82.1 83.8 85.4 87.0 88.6 90.1 91.7 93.2 1.85 EGT °C 309 334 359 384 409 433 458 483 508 N1 % 80.3 82.0 83.7 85.3 86.9 88.5 90.0 91.6 93.1 N2 % 81.1 82.8 84.5 86.1 87.7 89.3 90.9 92.4 93.9 1.90 EGT °C 309 334 359 384 409 434 459 484 509 N1 % 81.5 83.2 84.9 86.6 88.2 89.8 91.4 92.9 94.4 N2 % 81.7 83.5 85.2 86.8 88.5 90.1 91.7 93.2 94.7 1.95 EGT °C 310 335 360 385 410 435 460 485 510 N1 % 82.7 84.5 86.2 87.9 89.6 91.2 92.8 94.4 95.9 N2 % 82.5 84.2 85.9 87.6 89.3 90.9 92.5 94.0 95.6 2.00 EGT °C 310 335 360 385 410 435 460 485 510 N1 % 84.1 85.9 87.7 89.4 91.1 92.7 94.3 95.9 97.5 N2 % 83.2 85.0 86.7 88.4 90.1 91.7 93.3 94.9 96.4 2.05 EGT °C 310 336 361 386 411 436 461 486 511 N1 % 85.7 87.5 89.3 91.0 92.7 94.4 96.1 97.7 99.3 N2 % 84.0 85.8 87.5 89.2 90.9 92.6 94.2 95.8 97.3 2.10 EGT °C 311 336 361 386 411 436 461 486 511 N1 % 87.4 89.2 91.0 92.8 94.6 96.3 98.0 99.6 101.2 N2 % 84.8 86.6 88.4 90.1 91.8 93.4 95.1 96.7 98.3 2.15 EGT °C 311 336 362 387 412 437 462 487 512
Based on: - Straight and level flight - Only pod engines bleed, no bleed from center engine - Engines stabilized for five minutes

Boeing 727-200 Performance Handbook
Page 47
WEIGHT AND BALANCE
Limitations Maximum Taxi Weight (MTXW): 185,800 pounds Maximum Takeoff Weight (MTOW): 184,800 pounds* Maximum Zero Fuel Weight (MZFW): 138,000 pounds Maximum Landing Weight (MLAW): Flaps 30 154,500 pounds Flaps 40 142,500 pounds * for pressure altitudes of 2000 ft and below with a linear reduction of 125 lbs for each 1000 ft airport pressure altitude above 2000 ft. The above maximum allowable weights may be further reduced by field length, climb, tire speed and size, or breake energy limits, or obstacle clearance, enroute and landing requirements. The fuel on board at takeoff must exceed 14,903 lbs when the following conditions exists:
flaps 5 improved climb performance is used airport altitude is below 6500 ft actual takeoff weight is within 882 lbs of the flaps 5 improved climb performance limit
weight.
Index Equation The Loading Tables are based on the following Index Equation:
2080000
880)weight(armI.U.

Boeing 727-200 Performance Handbook
Page 48
Center of Gravity Limitations
110
120
130
140
150
160
170
180
190
0 10 20 30 40 50Center of Gravity % MAC
Gro
ss W
eigh
t lbs
x100
0

Boeing 727-200 Performance Handbook
Page 49
Loading Tables Basic Operating Weight Table Passenger Loading Table
Item Weight I.U. PAX Weight I.U. lbs Number lbs
Basic Empty Weight 99380 51.55 Forward Compartment 2 Pilots 400 -3.86 5 850 -3.17 Flight Engineer 200 -1.84 10 1700 -6.33 Pilots Flight Bags 80 -0.77 15 2550 -9.50 Flight Engineer Flight Bag 40 -0.37 20 3400 -12.67 Potable Water 320 -0.72 25 4250 -15.83 Aircraft Library 60 -0.55 29 4930 -18.36 Crew Baggage 120 -0.54 Aft Compartment FWD Lavatory charge 40 -0.28 10 1700 3.15 AFT Lavatory charge (2) 80 0.52 20 3400 6.29 Magazines 30 -0.20 30 5100 9.44 Pillows 40 0.01 40 6800 12.58 LH & RH Closet Storage 30 -0.21 50 8500 15.73 46 Man Life Raft FWD 90 -0.33 60 10200 18.87 46 Man Life Raft AFT 90 -0.21 70 11900 22.02 9 Man Life Raft 30 -0.04 80 13600 25.16 Entertainment Cabinet 20 -0.10 90 15300 28.31 Blankets 34 -0.24 100 17000 31.45 Ferry BOW 101084 41.82 110 18700 34.60 2 Cabin Crew FWD 280 -2.40 120 20400 37.74 2 Cabin Crew AFT 280 1.42 130 22100 40.89 Cabin Crew Bags 160 -1.06 133 22610 41.83 Deadhead BOW 101804 39.78 Galley Items FWD 300 -2.40 Galley Items AFT 300 0.85 BOW 102404 38.23
Fuel Loading Table Cargo Loading Table
Total Fuel lbs I.U.
3000 2.84 Weight I.U. 6000 5.81 lbs Fwd Aft 9000 8.92 6000 21.45
12000 12.14 5000 -12.50 17.88 15000 15.47 4000 -10.00 14.30 18000 18.89 3000 -7.50 10.73 21000 22.40 2000 -5.00 7.15 24000 25.98 1000 -2.50 3.58 27000 29.61 900 -2.25 3.22 30000 33.30 800 -2.00 2.86 33000 37.02 700 -1.75 2.50 36000 40.76 600 -1.50 2.15 39000 42.05 500 -1.25 1.79 42000 43.31 400 -1.00 1.43 45000 44.57 300 -0.75 1.07 48000 45.84 200 -0.50 0.72 51000 47.11 100 -0.25 0.36

Boeing 727-200 Performance Handbook
Page 50
Index Conversion Chart
0
20000
40000
60000
80000
100000
120000
140000
160000
180000
200000
0 20 40 60 80 100 120 140 160
Index Units
Gro
ss W
eigh
t [lb
s]% MAC
5
10 15 2025 30 35 40
Example:Gross Weight = 14800 lbsIndex Units = 84
Find: MAC = 32%

Boeing 727-200 Performance Handbook
Page 51
Weight and Balance Calculation Form Flight Date Plane Departure Station
Item Weight LBS Index BOW
FWD Passengers
AFT
FWD Cargo
AFT
ZERO FUEL WEIGHT
MAX 138,000
Takeoff Fuel
TAKEOFF WEIGHT
MAX
Trip Fuel
LANDING WEIGHT
MAX
Remarks
MAC at Takeoff Handling Agent Pilot in Command
Flight EXAMPLE
Date Plane Departure Station
Item Weight LBS Index BOW 102404 38.2
FWD 4250 -15.8 Passengers
AFT 20400 37.7 FWD 3000 -7.5
Cargo AFT 2000 7.1
ZERO FUEL WEIGHT 132054 59.7 MAX 138,000 Takeoff Fuel 21000 22.4 TAKEOFF WEIGHT 153054 82.1 MAX Trip Fuel 18000 LANDING WEIGHT 135054 MAX
Remarks
MAC at Takeoff 28%
Handling Agent Pilot in Command

Boeing 727-200 Performance Handbook
Page 52
AIRPORT ANALYSIS
Introduction The Airport Analysis Chart shows the Climb Limited Takeoff Weight as a function of the outside air temperature (OAT). The chart also shows the Field Limited, Obstacle Limited, Tire Speed Limited, and Brake Energy Limited Takeoff Weight as a function of both OAT and wind. For the field limited, obstacle limited, tire speed limited, and brake energy limited takeoff weights the associated takeoff speeds V1, VR, and V2 are also shown on the chart. The weight limtations are shown as LBSx1000 and to the speeds 100 must be added to obtain the takeoff speeds.
Airplane Configuration Flap Setting All charts are calculated for a flap setting of 15 degress. Bleed Configuration The charts are based on the following bleed air configuration Anti-Ice OFF Packs ON
Airport Analysis Description Chart Description The airport elevation is shown in the upper left corner followed by the airport name and the runway designation. On the bottom part of the chart the maximum structural limited weight, the runway length and the runway slope are presented. If a clearway and/or a stopway has been accounted for in the calculation the respective amaount is also shown. The four letter code and the three letter code for the airport are shown on the lower left side of the chart followed by the printing date. All calculations are based on a standard QNH of 29.29 “HG (1013.25 mbar). Limitation Codes The limitation codes shown on the chart are the following: F = FIELD, T = TIRE SPEED, B = BRAKE ENERGY, * = OBSTACLE, ** = IMPROVED CLIMB

Boeing 727-200 Performance Handbook
Page 53
Corrections Corrections for Anti-Ice ON are presented in the following table:
Limit Anti-Ice ON
Climb - 1000 LB Field - 2650 LB
QNH corrections for the climb limited takeoff weight as well as for the field limited takeoff weight are presented in the the following table.
QNH Limit above
1013 below 1013
Climb + 140 LB - 140 LB Field + 150 LB - 150 LB per 1 MBAR
Determination of the Performance Limited Takeoff Weight The maximum takeoff weight limitation for the combination of airport, flap setting, temperature, runway and wind is the LESSER of the weights in steps A and B below. The Climb Limited Takeoff Weight and the Runway Limited Takeoff Weight are calculated separately because they are two different limitations (but neither one may exceed the structural limited takeoff weight). If the runway selected does not permit sufficient takeoff weight, consider the possibility of using a different runway. This will involve repeating step B for the new choice of runway. STEP A Enter the runway weight chart with the ambient temperature (°C) and proceed along the temperature line to the column labeled “CLIMB” and read the Climb Limited Weight. Correct the obtained weight for QNH as shown in the table above. STEP B Runway Limit – The next weight to be determined is the maximum takeoff weight for the particular runway to be used. Again enter the table with the ambient temperature. Proceed along the temperature line to its intersection with the column identified by the determinated head or tail wind component. Interpolate between two wind values if necessary. Read the runway limited weight. Correct the obtained weight for QNH as shown in the table above. The Maximum Takeoff Weight is the SMALLER of the following weights:
- Structural Limited Takeoff Weight (MTOW) - Climb Limited Weight from step A - Runway Limited Weight form step B

Boeing 727-200 Performance Handbook
Page 54
Example The following example demonstrates the use of the Airport Analysis Chart. Given: SAMPLEFIELD Runway 20 OAT = 16°C Wind = 0 KN QNH = 1020.4 MBAR Find: Climb = 205600 LB QNH Correction = + 1001 LB Total = 206601 LB Field = 217000 LB QNH Correction = + 1073 LB Total = 218073 LB Performance Limited Takeoff Weight = 206601 LB.

Boeing 727-200 Performance Handbook
Page 55
AIRPORT ANALYSIS CHART EXAMPLE ELEVATION 0 SAMPLE 1 RUNWAY 20 ***FLAPS 15*** A/C ON 727-200 ADV JT8D-15 ENGINES 210 MPH TIRES OAT CLIMB WIND COMPONENT IN KNOTS (MINUS DENOTES TAILWIND) C 1000 LBS -10 0 20 40 44 183.7 177.5F/38-38-51 187.3F/43-43-56 193.5F/47-47-59 196.4F/48-48-60 42 185.3 179.5F/39-39-52 189.5F/44-44-57 195.8F/48-48-60 198.9F/50-50-61 40 186.9 181.4F/40-40-53 191.6F/46-46-58 198.1F/49-49-61 201.3F/51-51-62 38 188.5 183.4F/41-41-54 193.8F/47-47-59 200.5F/51-51-62 203.8F/52-52-64 36 190.1 185.3F/42-42-55 195.9F/48-48-60 202.8F/52-52-63 206.3F/54-54-65 34 191.7 187.3F/43-43-56 198.1F/49-49-61 205.1F/53-53-64 208.8F/55-55-66 32 193.3 189.3F/44-44-57 200.2F/50-50-62 207.5F/55-55-65 211.3F/57-57-67 30 195.0 191.2F/45-45-58 202.4F/52-52-63 209.8F/56-56-67 213.7F/58-58-69 28 196.6 193.2F/46-46-59 204.6F/53-53-64 212.2F/57-57-68 216.2F/60-60-70 26 198.2 195.1F/48-48-59 206.7F/54-54-65 214.6F/59-59-69 218.7F/61-61-71 24 199.8 197.1F/49-49-60 208.9F/55-55-66 216.9F/60-60-70 221.2F/63-63-73 22 201.5 199.1F/50-50-61 211.1F/57-57-67 219.3F/62-62-72 223.7F/64-64-74 20 203.1 201.1F/51-51-62 213.2F/58-58-68 221.7F/63-63-73 226.2F/66-66-75 18 204.7 203.0F/52-52-63 215.4F/59-59-70 224.0F/65-65-74 228.7F/68-68-77 16 205.6 204.5F/53-53-64 217.0F/60-60-70 225.7F/66-66-75 230.5F/69-69-78 14 205.6 205.4F/53-53-64 217.9F/61-61-71 226.6F/66-66-75 231.4F/69-69-78 12 205.6 206.3F/54-54-65 218.8F/61-61-71 227.5F/67-67-76 232.2F/70-70-78 10 205.6 207.1F/54-54-65 219.6F/62-62-72 228.3F/67-67-76 233.1F/71-71-79 8 205.6 208.0F/55-55-66 220.5F/62-62-72 229.2F/68-68-77 234.0F/71-71-79 6 205.6 208.9F/55-55-66 221.4F/63-63-73 230.1F/69-69-77 234.9F/72-72-80 4 205.6 209.8F/56-56-67 222.3F/64-64-73 231.0F/69-69-78 235.8F/72-72-80 2 205.6 210.7F/56-56-67 223.2F/64-64-74 231.9F/70-70-78 236.6F/73-73-81 0 205.6 211.6F/57-57-68 224.0F/65-65-74 232.8F/70-70-79 237.5F/73-73-81 -2 205.6 212.4F/58-58-68 224.9F/65-65-75 233.6F/71-71-79 238.4F/74-74-82 -4 205.6 213.3F/58-58-68 225.8F/66-66-75 234.5F/71-71-80 239.3F/75-75-82 -6 205.6 214.2F/59-59-69 226.7F/66-66-75 235.4F/72-72-80 240.2F/75-75-83 -8 205.6 215.1F/59-59-69 227.6F/67-67-76 236.3F/73-73-81 241.1F/76-76-83 -10 205.6 216.0F/60-60-70 228.5F/68-68-76 237.2F/73-73-81 241.9F/76-76-84 -12 205.6 216.8F/60-60-70 229.3F/68-68-77 238.0F/74-74-82 242.8F/77-77-84 -14 205.6 217.7F/61-61-71 230.2F/69-69-77 238.9F/74-74-82 243.7F/78-78-85 -16 205.6 218.6F/61-61-71 231.1F/69-69-78 239.8F/75-75-83 244.6F/78-78-85 -18 205.6 219.5F/62-62-72 232.0F/70-70-78 240.7F/76-76-83 245.5F/79-79-86 -20 205.6 220.4F/62-62-72 232.9F/70-70-79 241.6F/76-76-84 246.3F/79-79-86 -22 205.6 221.3F/63-63-73 233.7F/71-71-79 242.5F/77-77-84 247.2F/80-80-87 -24 205.6 222.1F/64-64-73 234.6F/72-72-80 243.3F/77-77-85 248.1F/81-81-87 -26 205.6 223.0F/64-64-73 235.5F/72-72-80 244.2F/78-78-85 249.0F/81-81-88 -28 205.6 223.9F/65-65-74 236.4F/73-73-81 245.1F/79-79-86 249.9F/82-82-88 -30 205.6 224.8F/65-65-74 237.3F/73-73-81 246.0F/79-79-86 250.8F/83-83-89 -32 205.6 225.7F/66-66-75 238.2F/74-74-82 246.9F/80-80-87 251.6F/83-83-90 -34 205.6 226.5F/66-66-75 239.0F/74-74-82 247.7F/80-80-87 252.5F/84-84-90 -36 205.6 227.4F/67-67-76 239.9F/75-75-83 248.6F/81-81-88 253.4F/84-84-91 -38 205.6 228.3F/67-67-76 240.8F/76-76-83 249.5F/82-82-88 254.3F/85-85-91 -40 205.6 229.2F/68-68-77 241.7F/76-76-84 250.4F/82-82-89 255.2F/86-86-92 MAX BRAKE RELEASE WEIGHT MUST NOT EXCEED STRUCTURAL LIMIT OF 184200 LBS MINIMUM FLAP RETRACTION HEIGHT IS 400 FT LIMIT CODE IS F = FIELD, T = TIRE SPEED, B = BRAKE ENERGY, * = OBSTACLE RUNWAY IS 12000 FT LONG WITH 0 FT CLEARWAY AND 0 FT STOPWAY RUNWAY SLOPE IS -0.80 PERCENT AND OBSTACLES CONSIDERED ARE - NONE HERR/CHR 09-12-2009
