board of regents meeting information
TRANSCRIPT

B–3 BOARD OF REGENTS MEETING
B–3/205-19 5/8/19
2020 Operating Budget Deep Dive 2: Intercollegiate Athletics INFORMATION This item is for information only. BACKGROUND At the June 9, 2016 Board of Regents meeting, the University of Washington Department of Intercollegiate Athletics (ICA) presented a three-year Financial Stability Plan (FSP) to address recent operating deficits and ICA’s non-compliance with Internal Lending Program loan covenants. The Board approved ICA’s FSP and temporarily modified ICA’s loan covenants through Fiscal Year (FY) 2019 as follows:
1. suspending the debt-service coverage covenant; and 2. reducing minimum unrestricted fund balance to $10 million.
ICA will report on the progress made over the last three years to achieve financial solvency through the term of the FSP, and beyond through FY 2024. ICA’s FY 2020 budget reflects the impact of hosting both Oregon and Washington State in football, and projected growth in men’s basketball gate revenue. Beyond that, FY 2020 marks the beginning of ICA’s partnership with Adidas, approved by the Board on April 12, 2018. The financial impact of this partnership is reflected in Royalties and Sponsorship revenue and Sport Operational Expense. In compliance with recent legislation, the Board will take action on approving ICA’s FY 2020 budget during the June meeting. This will be included as an appendix in the FY 2020 University Operating Budget presentation. ICA has also provided its Semi-Annual Borrower’s Report (SABRe), which incorporates a forecast of year-end financial performance for FY 2019. Attachments
1. Intercollegiate Athletics Annual Financial Review – Board of Regents Presentation, May 2019
2. Intercollegiate Athletics (ICA) Semi-Annual Borrower’s Report – May 2019

Intercollegiate AthleticsAnnual Financial ReviewBoard of Regents Presentation
May 8, 2019
ATTACHMENT 1B-3.1/205-19 | 5/8/19 Page 1 of 7

Executive Summary
FY19 is the final year of ICA’s Financial Stability Plan.
Forecasted deficit of ($3.7M) in FY19 will be fully covered by ICA reserves; this is an improvement of $4.3M over the FSP projection. ICA will continue to work at closing the gap through the remainder of the fiscal year.
FY20 budget deep-dive is included given the passage of SB 6493, which took effect in June 2018.
Five-year projections show continued improvement as well as areas where work still needs to be done.
B-3.1/205-19 | 5/8/19 Page 2 of 7
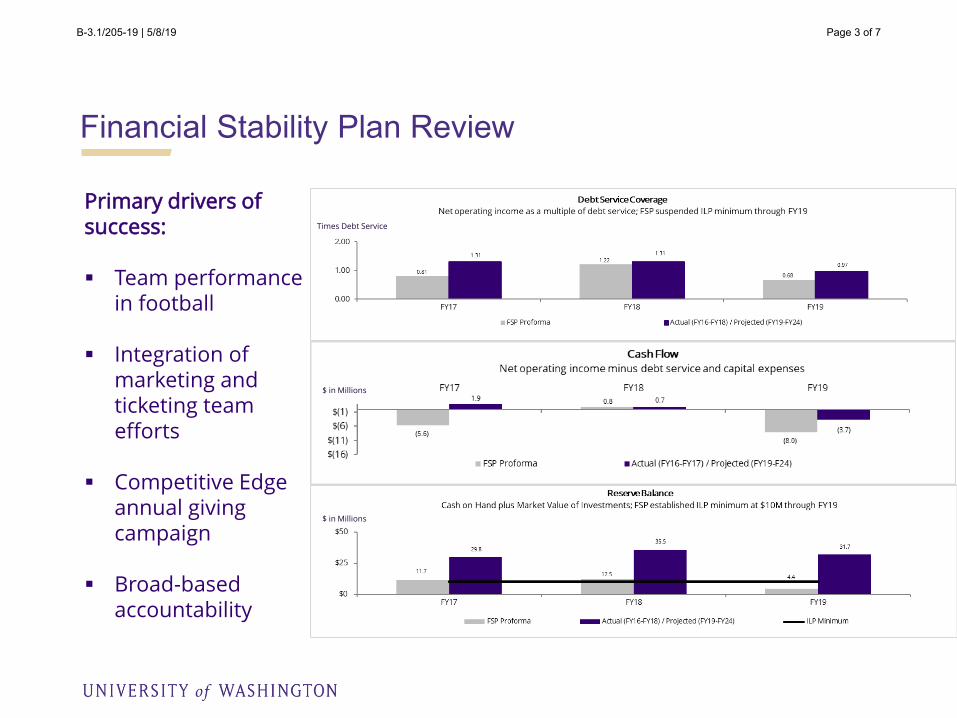
Financial Stability Plan Review
Primary drivers of success:
Team performance in football
Integration of marketing and ticketing team efforts
Competitive Edge annual giving campaign
Broad-based accountability
Times Debt Service
$ in Millions
$ in Millions
B-3.1/205-19 | 5/8/19 Page 3 of 7

FY20 Deep-DiveRevenue notes:
a. Reflects home games against Oregon and WSU in football, increase in season ticket sales in men’s basketball
b. Year one of Adidas apparel partnership; increase of $3.45M in products, $3.65M in cash plus $3M signing bonus
c. Assumes $400K additional related to fan experience enhancements in arena, baseball and softball
Expense notes:
d. Reflects recent contract negotiations for revenue sports
e. Includes $3.45M increase in products related to the Adidas partnership
f. University Institutional Overhead is anticipated to increase by $800K from FY19 due to increases in gate revenue and cash associated with Adidas partnership described in note b) above.
g. Debt service reflects post-FSP temporary debt restructuring
h. Major maintenance projects planned for FY20: $1.5M for Softball Performance Center (donor funding came in prior year), $650K for replacement of east football field, $550K for misc. stadium updates (repairs, fixing leaks, etc), $500K for security related projects, $370K for ADA updates
2019-20
BEGINNING BALANCE $31,734,000
REVENUE
Gate Revenue $34,308,000 a
Contributions $25,421,000
NCAA / Conference $38,131,000
Royalties, Adv & Sponsorships $26,134,000 b
Tuition Waivers $4,277,000
Other Revenue $11,130,000 c
TOTAL REVENUE $139,401,000
EXPENSE
Salaries $40,313,000 d
Benefits $10,677,000
Athletics Student Aid $14,291,000
Sport Operational Expense $30,226,000 e
Direct Facilities, Maintenance & Utilities $5,025,000
Misc. Marketing / Promotion Expense $4,404,000
UW Institutional Overhead $3,808,000 f
Misc. Expenses $10,187,000
TOTAL EXPENSE $118,931,000
NET OPERATING INCOME $20,470,000
Debt Service $14,760,000 g
NET OPERATING INCOME LESS DEBT SERVICE $5,710,000
DEBT SERVICE COVERAGE 1.39
Minor CapEx / Deferred Maint / Capitalized Equipment $4,900,000 h
Cash Flow after Investment in Capital $810,000
June 30 Cash Balance $32,544,000
B-3.1/205-19 | 5/8/19Page 4 of 7

Forecasted Financials FY20 – FY242019-20 2020-21 2021-22 2022-23 2023-24 CAGR
REVENUE
Gate Revenue $34,308,000 $34,512,000 $37,028,000 $35,098,000 $37,643,000 1.87%
Contributions $25,421,000 $26,332,000 $29,576,000 $32,639,000 $28,074,000 2.01%
NCAA / Conference $38,131,000 $39,831,000 $41,616,000 $43,488,000 $45,452,000 3.58%
Royalties, Adv & Sponsorships $26,134,000 $22,853,000 $22,973,000 $23,193,000 $23,314,000 -2.26%
Tuition Waivers $4,277,000 $4,405,000 $4,537,000 $4,673,000 $4,813,000 2.39%
Other Revenue $11,130,000 $11,604,000 $12,850,000 $13,384,000 $13,947,000 4.62%
TOTAL REVENUE $139,401,000 $139,537,000 $148,580,000 $152,475,000 $153,243,000 1.91%
EXPENSE
Salaries $40,313,000 $42,240,000 $44,271,000 $46,347,000 $48,461,000 3.75%
Benefits $10,677,000 $11,247,000 $11,822,000 $12,439,000 $12,805,000 3.70%
Athletics Student Aid $14,291,000 $14,696,000 $15,113,000 $15,543,000 $15,985,000 2.27%
Sport Operational Expense $30,226,000 $32,203,000 $31,040,000 $33,990,000 $33,524,000 2.09%
Direct Facilities, Maintenance & Utilities $5,025,000 $5,230,000 $5,402,000 $5,623,000 $5,813,000 2.96%
Misc. Marketing / Promotion Expense $4,404,000 $4,646,000 $4,695,000 $4,978,000 $5,233,000 3.51%
UW Institutional Overhead $3,808,000 $3,410,000 $3,851,000 $3,496,000 $3,856,000 0.25%
Misc. Expenses $10,187,000 $10,595,000 $11,019,000 $11,259,000 $11,891,000 3.14%
TOTAL EXPENSE $118,931,000 $124,267,000 $127,213,000 $133,675,000 $137,568,000 2.95%
NET OPERATING INCOME $20,470,000 $15,270,000 $21,367,000 $18,800,000 $15,675,000 -5.20%
Debt Service $14,760,000 $14,760,000 $14,760,000 $14,760,000 $14,760,000 0.00%
NET OPERATING INCOME LESS DEBT SERVICE $5,710,000 $510,000 $6,607,000 $4,040,000 $915,000 -30.66%
DEBT SERVICE COVERAGE 1.39 1.03 1.45 1.27 1.06 -5.20%
Minor CapEx / Deferred Maint / Capitalized Equipment $4,900,000 $1,995,000 $6,070,000 $3,280,000 $2,090,000 -15.67%
Cash Flow after Investment in Capital $810,000 ($1,485,000) $537,000 $760,000 ($1,175,000) -207.72%
June 30 Cash Balance $32,544,000 $31,059,000 $31,596,000 $32,356,000 $31,181,000 -0.85%
Note: CAGR = Compound Annual Growth Rate
B-3.1/205-19 | 5/8/19 Page 5 of 7
Challenges & OpportunitiesChallenges:
Growing market around coaching salaries in revenue sports
NCAA legislative items
Impacts of future litigation
Growing costs in non-revenue sports, but very little ability offset costs with revenues
Poor optics around Pac-12 conference negatively impacts fan engagement / perceptions
Significant capital needs with no ability to take on additional debt
Title IX compliance; as the University’s female admissions percentage rises, so will the need for ICA to provide equitable opportunities for female student athletes
Increasing internal charges (tuition, benefits, security, administrative systems)
Opportunities:
Exposure and marketing related to Adidas partnership
Men’s basketball additional revenue potential
Sustaining recently created programs around annual giving
Expansion of hospitality and fan amenities in venues
New Transportation Management Plan could allow ICA to hold 1-2 non-athletic events in Husky Stadium each year and bring about savings in game day expenses
Increased NCAA / Pac-12 distributions associated with Pac-12 success in football and men’s basketball
Cost savings from program and service reductions
B-3.1/205-19 | 5/8/19 Page 6 of 7

Next Steps
Board affirms FSP end date of June 30, 2019
SABRe – November 2019
On-going spring financial review
B-3.1/205-19 | 5/8/19 Page 7 of 7

(1) 2019 season ticket sales are estimated
(2) FSP suspended ILP minimum through FY19. FY20 and onward reflects reinstated ILP covenants
(3) Updated to reflect use of reserves to fund minor capital expenditures and deferred maintenance projects in FY21 and FY24
Intercollegiate Athletics (ICA)
Semi-Annual Borrower’s Report – May 2019 Summary
ICA is exiting their Financial Stability Plan (FSP) effective June 30, 2019. ICA's financial performance has exceeded FSP projections for FY17 - FY19,
largely attributed to the success of the football program over the last three seasons. The launch of the Competitive Edge annual giving campaign in
fall of 2016 has also had a significant positive impact.
Effective July 1, 2019, ICA will adhere to new covenants agreed upon between ICA and Treasury.
ICA entered FY19 with a projected budget deficit of -$2.6M. The department's updated forecasted deficit is -$3.7M, due primarily to falling short of
the aggressive football sales goals and mid-year contract updates in revenue sports. ICA's reserves of $35M will be used to cover this deficit.
FY20 is the first year of ICA's apparel partnership with Adidas. This partnership will result in annual increases in cash and product, as well as a $3M
signing bonus in FY20.
FY20 - FY24 projections shared in the October 2018 SABRe reflected steady increases in football season ticket prices and seat-related donation
levels. ICA revisited these at the conclusion of the 2018 football season and scaled-back assumptions to better reflect the market, impact of
opponents, fan feedback on game times, and 6-day windows, etc. As a result, ICA's updated projections illustrate the need to use reserves to fund
minor capital expenditures and deferred maintenance projects across the Athletic Village in FY21 and FY24.
Risk and Mitigations
Attrition in the football season ticket base due to schedule and unpredictable game times poses a financial risk for ICA.
Mounting costs associated with NCAA deregulation, challenges to amateurism and litigation pose considerable financial risks.
The market for coaching salaries, especially in football and men's basketball, continues to escalate at a significant pace.
Football and men's basketball outperforming expectations, an increase in Pac-12 distributions tied to improved performance of the Pac-12 peers,
and growing the annual giving donor base would help mitigate these risks.
Selected Indicators
2017 Season 2018 Season 2019 Season (1)
Football Season Ticket Renewal (%) 96% 88% 90%
New Season Ticket Sales 6,898 5,570 4,500
Game Changer Donors* 101 154 167
*”Game Changer” refers to donors that have given $50K and above to ICA’s general fund.
0.81
1.22
0.68
1.04 0.86
1.27 1.02
1.40 1.21
1.56 1.52
1.14
0.77
1.31 1.31
0.97
1.39
1.03
1.45 1.27
1.06
0.00
1.00
2.00
FY16 FY17 FY18 FY19 FY20 FY21 FY22 FY23 FY24
Debt Service Coverage (2)
Net operating income as a multiple of debt service
FSP Budget (FY16-FY19) / Oct 2018 Projection (FY20-FY24)
Actual (FY16-FY18) / Projection (FY19-FY24) ILP Minimum (FY20-FY24)
FY20 - FY24: Minimum DSC of 1.0x and 3-year DSC average will equal 1.25x or greater (if 1.25x is not met, additional reserves required); FY25: 1.25x
(5.6)
0.8
(8.0)
(2.3)(4.9)
1.5
(2.6)
0.4 0.7 1.2 1.2 0.4
(5.8)
1.9 0.7
(3.7)
0.8
(1.5)
0.5 0.8
(1.2)
$(16)
$(11)
$(6)
$(1)
FY16 FY17 FY18 FY19 FY20 FY21 FY22 FY23 FY24
Cash Flow (3)
Net operating income minus debt service and capital expenses
FSP Budget (FY16-FY19) / Oct 2018 Projection (FY20-FY24) Actual (FY16-FY18) / Projection (FY19-F24)
($ Millions)
11.7 12.5 4.4
29.8
19.6
31.3 32.9 33.3 34.0 35.2 36.4 36.9
17.6
29.8 35.5
31.7 32.5 31.1 31.6 32.4 31.2
$0
$25
$50
FY16 FY17 FY18 FY19 FY20 FY21 FY22 FY23 FY24
Reserve Balance (2)
Cash on hand plus market value of investments
FSP Budget (FY16-FY19) / Oct 2018 Projection (FY20-FY24) Actual (FY16-FY18) / Projection (FY19-FY24) ILP Minimum
($ Millions)
ATTACHMENT 2B-3.2/205-19 5/8/19
Page 1 of 1