board of education workshop session tuesday, march 6, 2012 university high school for science and...
TRANSCRIPT

Board of Education Workshop Session
Tuesday, March 6, 2012 University High School for Science and Engineering
Mid-Year Data Review of Intervention Schools
Presenters: Dr. Dianna Roberge-Wentzell – Assistant Superintendent PreK-12 Education
Leslyee Frederick – Acting Chief Academic OfficerElizabeth Michaelis / Jonathan Swan – Directors of Elementary Education
Kevin McCaskill – Director of Secondary EducationDelores Cole / Timothy Sullivan Jr. – Executive Principals
Eduardo V. Genao – School Quality OfficerSonia Dinnall – Assistant-Director of Post-Secondary Education
1
Intervention Schools
• Intervention schools have a history of student achievement that is below an acceptable level of performance as measured by the Connecticut Mastery Test (CMT, Grades 3-8) or the Connecticut Academic Performance Test (CAPT, Grade 10).
2
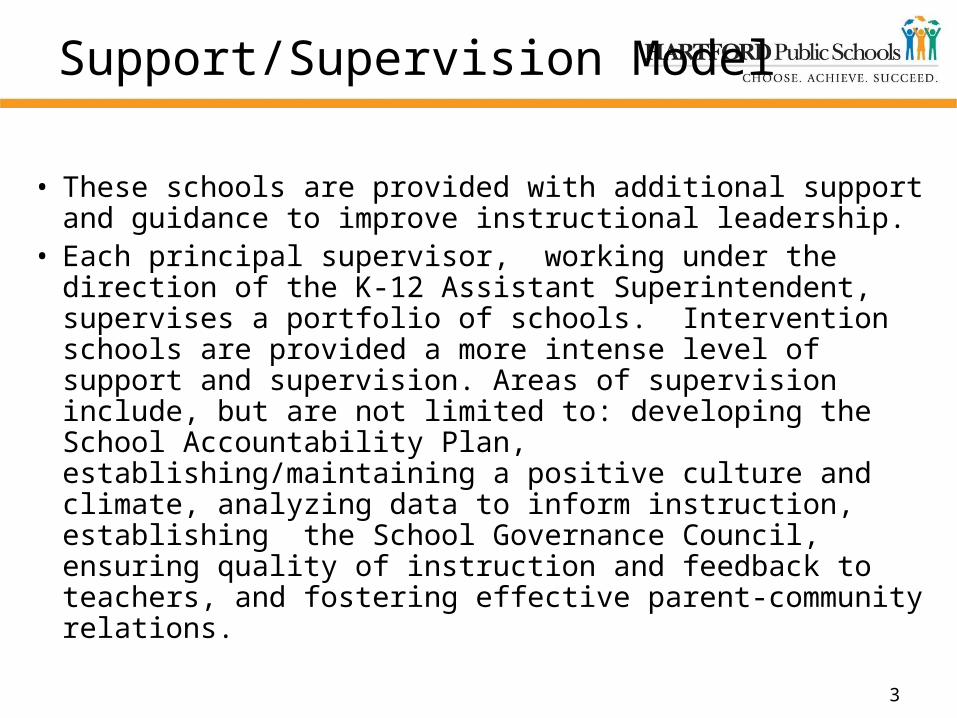
Support/Supervision Model
• These schools are provided with additional support and guidance to improve instructional leadership.
• Each principal supervisor, working under the direction of the K-12 Assistant Superintendent, supervises a portfolio of schools. Intervention schools are provided a more intense level of support and supervision. Areas of supervision include, but are not limited to: developing the School Accountability Plan, establishing/maintaining a positive culture and climate, analyzing data to inform instruction, establishing the School Governance Council, ensuring quality of instruction and feedback to teachers, and fostering effective parent-community relations.
3

Elementary SchoolsDRA 2 Reading – Proficient or Above
School September 2011
January 2012
Change +/-
Betances Early Reading Lab
28.3% 43.0% 14.7%
MD Fox Elementary 26.1% 37.8% 11.8%
Core Knowledge Academy at Milner
23.2% 20.6% -2.6%
America’s Choice at SAND
42.7% 39.6% -3.0%
Academy for Latino Studies at Burns
33.9% 30.6% -3.3%
District Average 39.6% 48.6% 9.0%
4
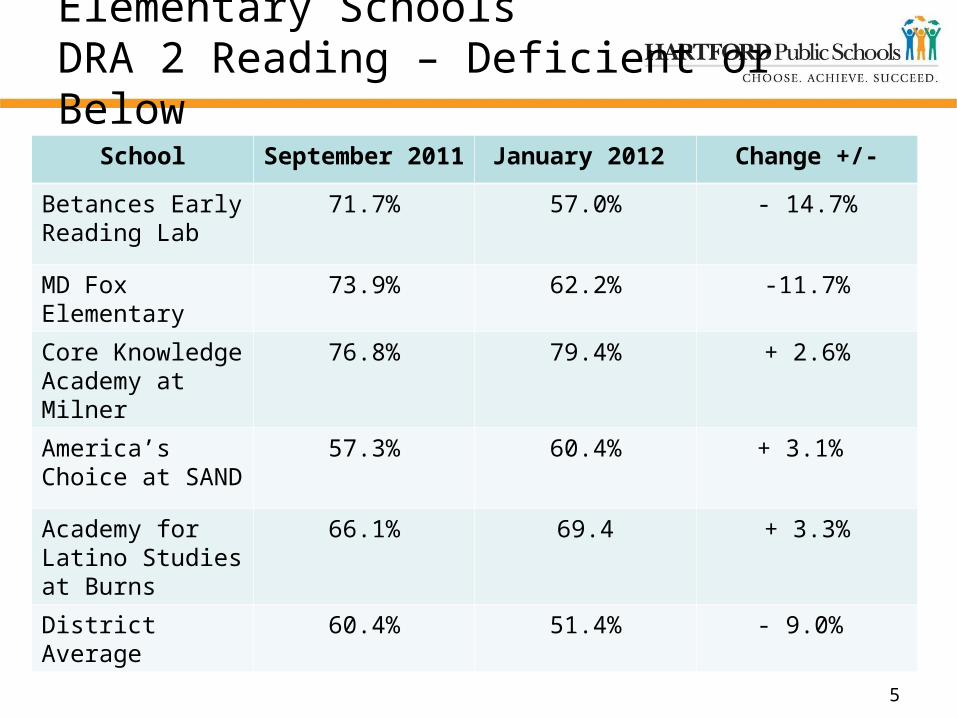
Elementary Schools DRA 2 Reading – Deficient or Below
School September 2011
January 2012 Change +/-
Betances Early Reading Lab
71.7% 57.0% - 14.7%
MD Fox Elementary
73.9% 62.2% -11.7%
Core Knowledge Academy at Milner
76.8% 79.4% + 2.6%
America’s Choice at SAND
57.3% 60.4% + 3.1%
Academy for Latino Studies at Burns
66.1% 69.4 + 3.3%
District Average 60.4% 51.4% - 9.0%
5

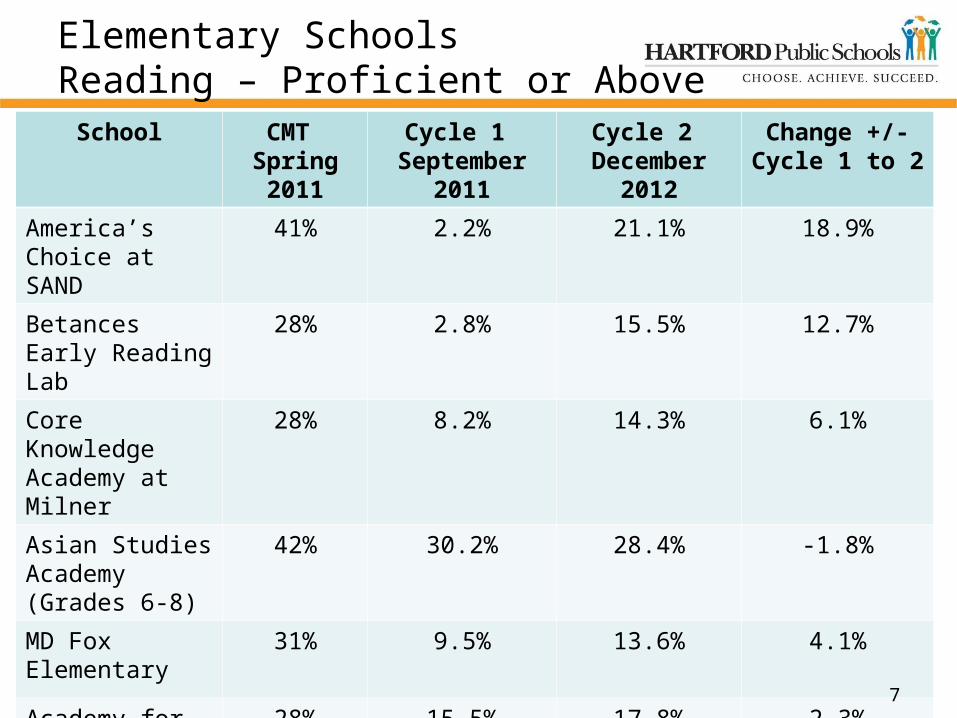
Elementary Schools Reading – Proficient or Above
School CMT Spring 2011
Cycle 1 September
2011
Cycle 2 December
2012
Change +/-Cycle 1 to 2
America’s Choice at SAND
41% 2.2% 21.1% 18.9%
Betances Early Reading Lab
28% 2.8% 15.5% 12.7%
Core Knowledge Academy at Milner
28% 8.2% 14.3% 6.1%
Asian Studies Academy (Grades 6-8)
40% 30.2% 28.4% -1.8%
MD Fox Elementary
31% 9.5% 13.6% 4.1%
Academy for Latino Studies at Burns
28% 15.5% 17.8% 2.3%
District Average
54% 19.8% 28.6% 8.8%
6
Elementary Schools Reading – Proficient or Above
School CMT Spring 2011
Cycle 1 September
2011
Cycle 2 December
2012
Change +/-Cycle 1 to 2
America’s Choice at SAND
41% 2.2% 21.1% 18.9%
Betances Early Reading Lab
28% 2.8% 15.5% 12.7%
Core Knowledge Academy at Milner
28% 8.2% 14.3% 6.1%
Asian Studies Academy(Grades 6-8)
42% 30.2% 28.4% -1.8%
MD Fox Elementary
31% 9.5% 13.6% 4.1%
Academy for Latino Studies at Burns
28% 15.5% 17.8% 2.3%
District Average
54% 19.8% 28.6% 8.8%
7

Elementary SchoolsFive-Year CMT History - ReadingSchool CMT
2011CMT 2010
CMT2009
CMT 2008
CMT 2007
America’s Choice at SAND
41% 45% 30% 27% 27%
Betances Early Reading Lab
28% 25% 21% 18% 18%^
Core Knowledge at Milner
22% 24% 15% 14% 14%
Asian Studies Academy(Grades 6-8)
42% 43% 33%
M D Fox Elementary
31% 29% 28% 30% 23%
Academy for Latino Studies at Burns
28% 23% 15% 16% 19%8
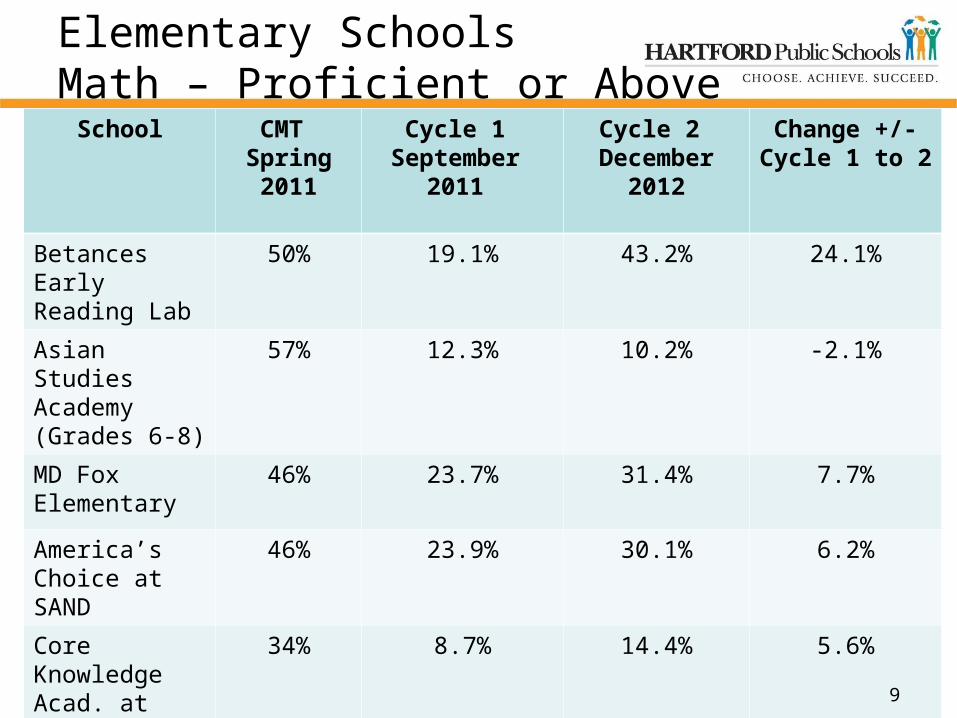
Elementary Schools Math – Proficient or Above
School CMT Spring 2011
Cycle 1 September
2011
Cycle 2 December
2012
Change +/-Cycle 1 to 2
Betances Early Reading Lab
50% 19.1% 43.2% 24.1%
Asian Studies Academy (Grades 6-8)
57% 12.3% 10.2% -2.1%
MD Fox Elementary
46% 23.7% 31.4% 7.7%
America’s Choice at SAND
46% 23.9% 30.1% 6.2%
Core Knowledge Acad. at Milner
34% 8.7% 14.4% 5.6%
Acad. for Latino Studies at Burns
38% 17.9% 23.4% 5.5%
District Average
64% 30.3% 38.7% 8.4%
9

Elementary SchoolsFive-Year CMT History - Math
School CMT 2011
CMT 2010
CMT 2009
CMT 2008
CMT2007
America’s Choice at SAND
46% 46% 31% 34% 36%
Betances Early Reading Lab
50% 35% 49% 44% 33%
Core Knowledge at Milner
34% 42% 30% 34% 23%
Asian Studies Academy(Grades 6-8)
57% 53% 53% 46% 41%
M D Fox Elementary
46% 56% 52% 48% 42%
Academy for Latino Studies at Burns
38% 45% 33% 24% 35%
10
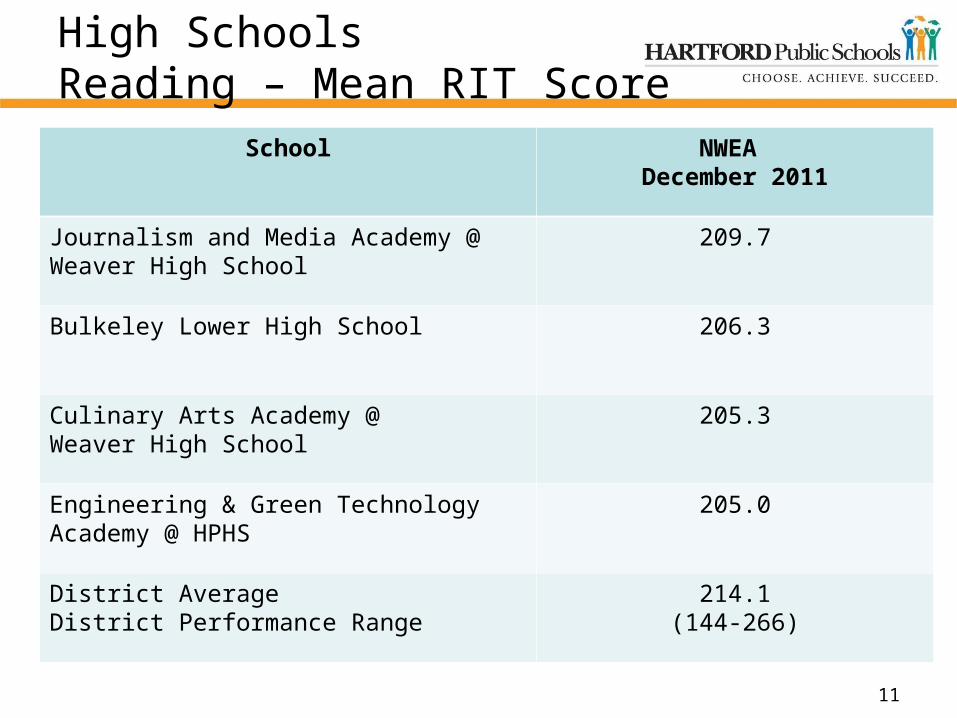
High SchoolsReading – Mean RIT Score
School NWEA December 2011
Journalism and Media Academy @ Weaver High School
209.7
Bulkeley Lower High School 206.3
Culinary Arts Academy @ Weaver High School
205.3
Engineering & Green Technology Academy @ HPHS
205.0
District AverageDistrict Performance Range
214.1(144-266)
11
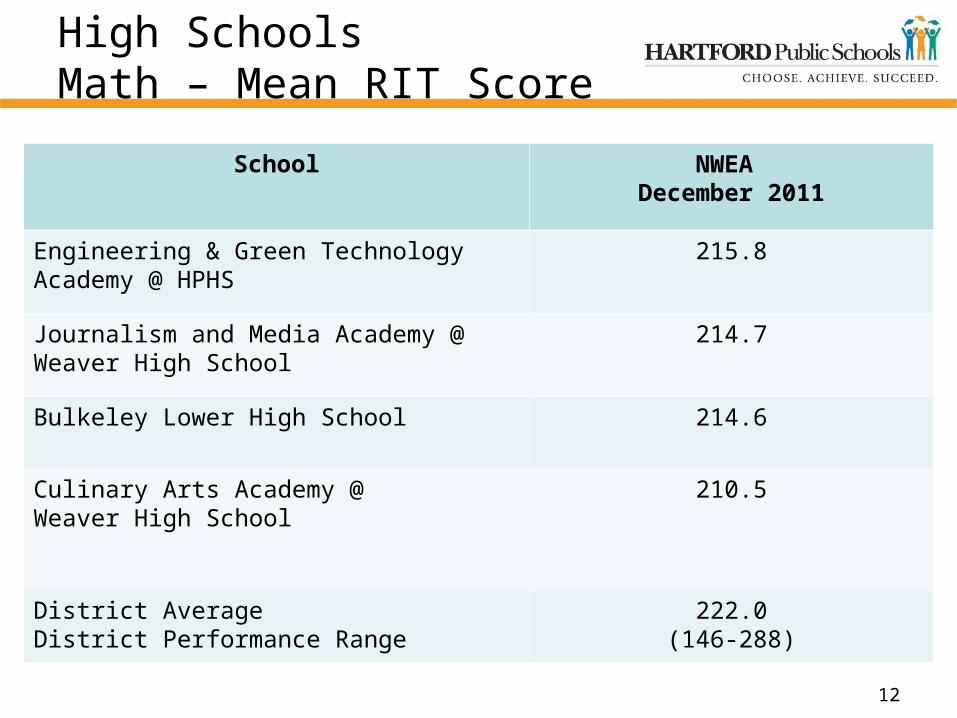
High SchoolsMath – Mean RIT Score
School NWEA December 2011
Engineering & Green Technology Academy @ HPHS
215.8
Journalism and Media Academy @ Weaver High School
214.7
Bulkeley Lower High School 214.6
Culinary Arts Academy @ Weaver High School
210.5
District AverageDistrict Performance Range
222.0(146-288)
12

High SchoolsPSAT – October 2011 (10th & 11th Grade)
13
School Total Tested
Critical Reading Range
Critical Reading Mean
MathRange
MathMean
Law and Gov’t Academy
203 20-58 34 20-57 32
Bulkeley HS 262 20-56 33 20-54 32
Nursing Academy
177 20-52 33 20-49 31
Culinary Arts Academy
75 20-51 32 20-47 32
Journalism and Media Academy
90 20-52 32 20-53 31
Academy of Engineering and Green Technology
125 20-53 31 20-55 32
District Average
2069 36 36
District Range
2069 20-74 20-77
State Average (11th grade)
47.8 47.5
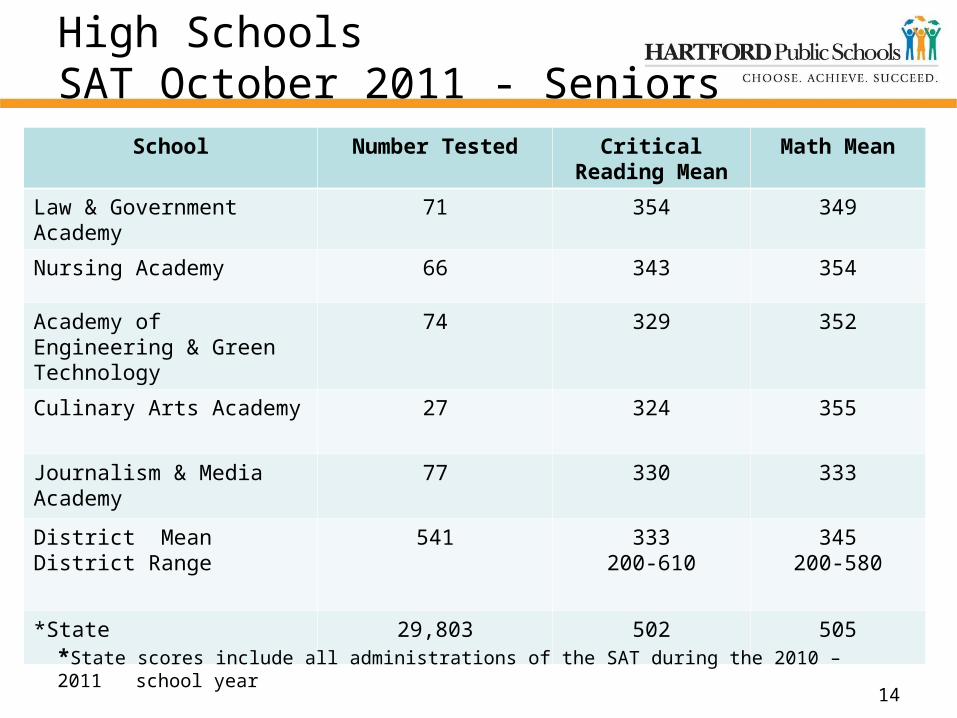
High SchoolsSAT October 2011 - Seniors
School Number Tested Critical Reading Mean
Math Mean
Law & Government Academy
71 354 349
Nursing Academy 66 343 354
Academy of Engineering & Green Technology
74 329 352
Culinary Arts Academy 27 324 355
Journalism & Media Academy
77 330 333
District MeanDistrict Range
541 333200-610
345200-580
*State 29,803 502 505
*State scores include all administrations of the SAT during the 2010 – 2011 school year
14
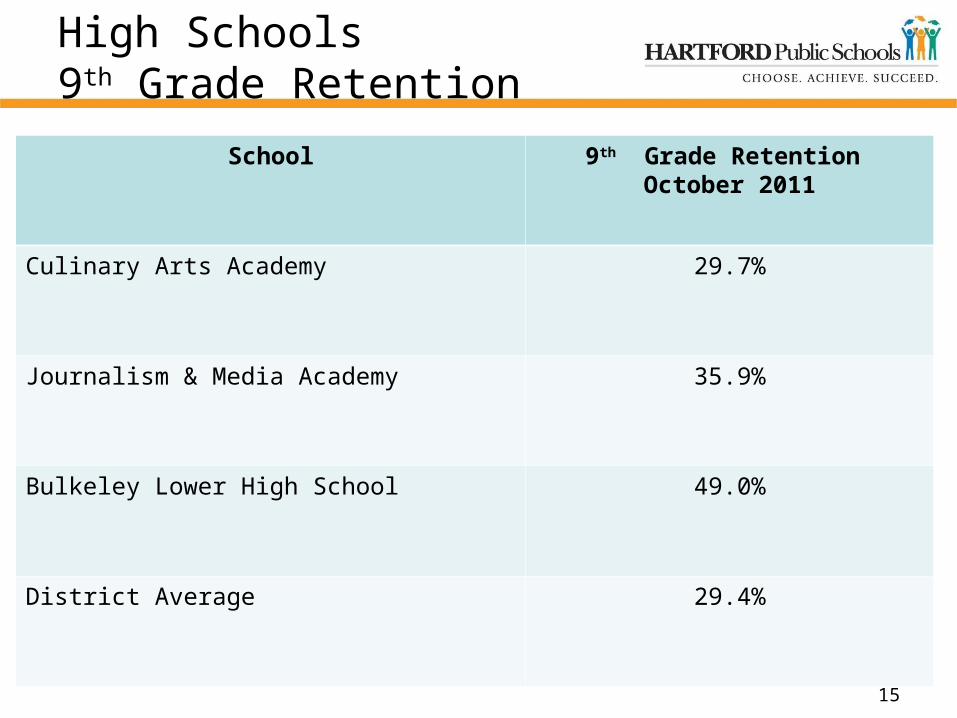
High Schools9th Grade Retention
School 9th Grade Retention October 2011
Culinary Arts Academy 29.7%
Journalism & Media Academy 35.9%
Bulkeley Lower High School 49.0%
District Average 29.4%
15
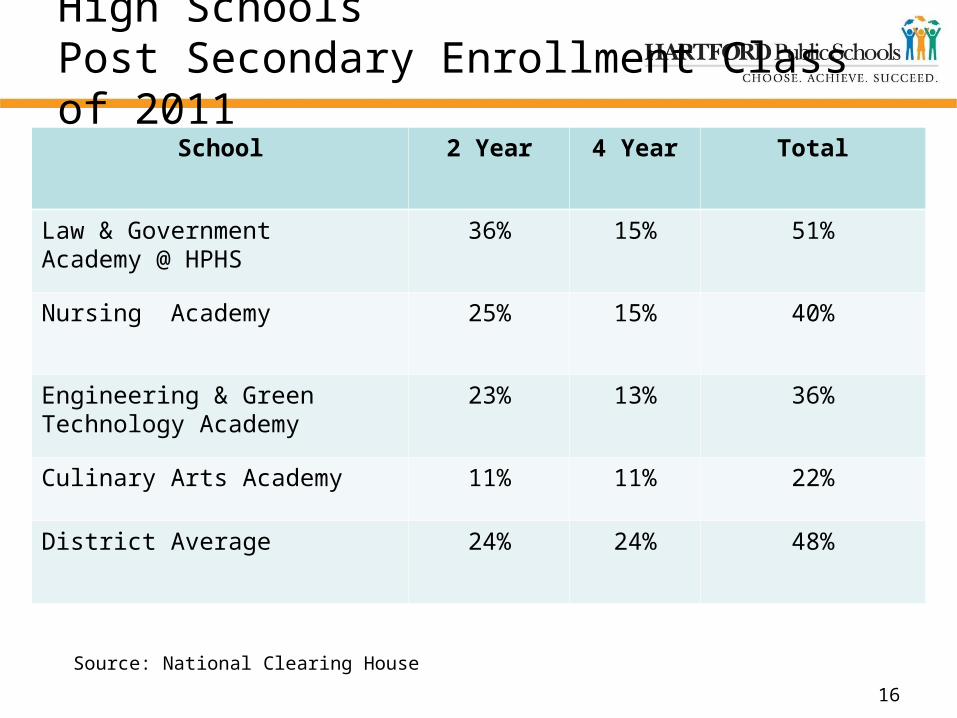
High SchoolsPost Secondary Enrollment Class of 2011
School 2 Year 4 Year Total
Law & Government Academy @ HPHS
36% 15% 51%
Nursing Academy 25% 15% 40%
Engineering & Green Technology Academy
23% 13% 36%
Culinary Arts Academy 11% 11% 22%
District Average 24% 24% 48%
16
Source: National Clearing House
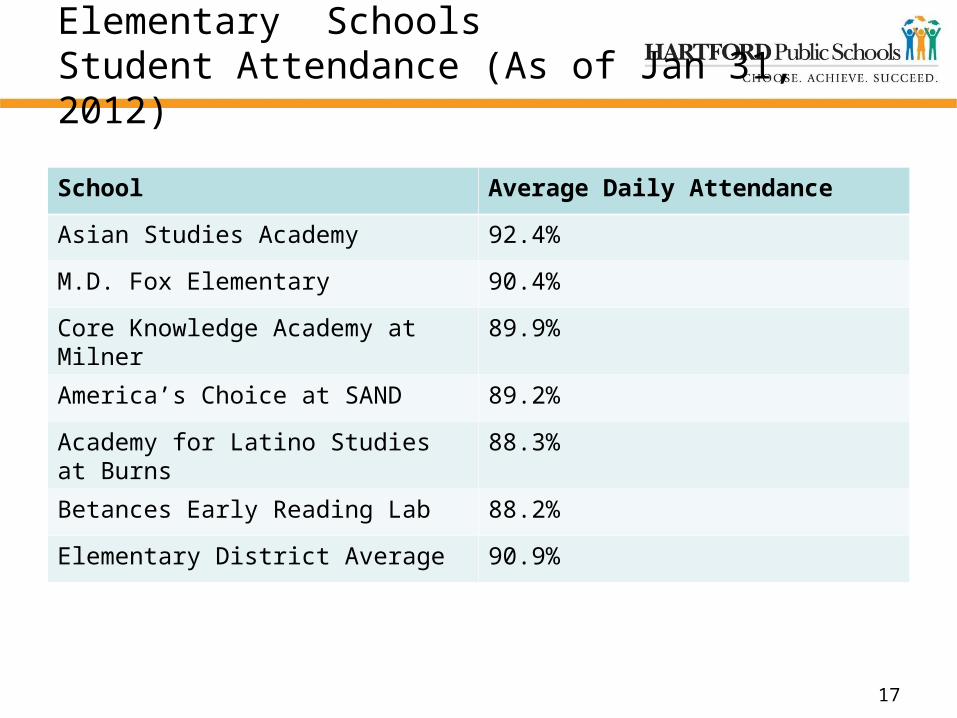
Elementary Schools Student Attendance (As of Jan 31, 2012)
School Average Daily Attendance
Asian Studies Academy 92.4%
M.D. Fox Elementary 90.4%
Core Knowledge Academy at Milner
89.9%
America’s Choice at SAND 89.2%
Academy for Latino Studies at Burns
88.3%
Betances Early Reading Lab 88.2%
Elementary District Average 90.9%
17
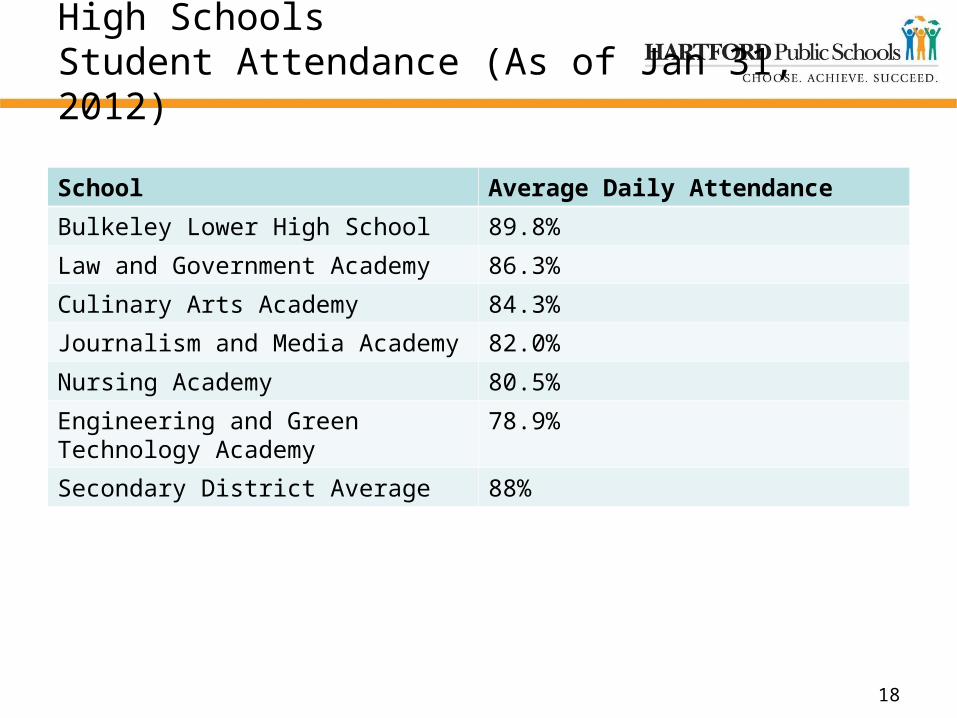
High Schools Student Attendance (As of Jan 31, 2012)
School Average Daily Attendance
Bulkeley Lower High School 89.8%
Law and Government Academy 86.3%
Culinary Arts Academy 84.3%
Journalism and Media Academy 82.0%
Nursing Academy 80.5%
Engineering and Green Technology Academy
78.9%
Secondary District Average 88%
18