board of education of the township of pennsauken school ... · board of education of the township...
TRANSCRIPT

BOARD OF EDUCATIONOF THE
TOWNSHIP OF PENNSAUKENSCHOOL DISTRICT
PENNSAUKEN, NEW JERSEY
COMPREHENSIVE ANNUAL FINANCIAL REPORTFOR THE FISCAL YEAR ENDED
JUNE 30, 2012

i
24000
PENNSAUKEN TOWNSHIP SCHOOL DISTRICT Table of Contents
Page
INTRODUCTORY SECTION Letter of Transmittal 2 Organizational Chart 9 Roster of Officials 10 Consultants and Advisors 11
FINANCIAL SECTION Independent Auditor's Report 13 Required Supplementary Information – Part I Management’s Discussion and Analysis 18 Basic Financial Statements A. District-Wide Financial Statements: A-1 Statement of Net Assets 27 A-2 Statement of Activities 28
B. Fund Financial Statements: Governmental Funds: B-1 Balance Sheet 30 B-2 Statement of Revenues, Expenditures and Changes in Fund Balances 31
B-3 Reconciliation of the Statement of Revenues, Expenditures and Changes in Fund Balances of Governmental Funds to the Statement of Activities 32 Proprietary Funds: B-4 Statement of Net Assets 33 B-5 Statement of Revenues, Expenses and Changes in Fund Net Assets 34 B-6 Statement of Cash Flows 35 Fiduciary Funds: B-7 Statement of Fiduciary Net Assets 36 B-8 Statement of Changes in Fiduciary Net Assets 37 Notes to the Financial Statements 38 Required Supplementary Information – Part II
C. Budgetary Comparison Schedules
C-1 Budgetary Comparison Schedule – General Fund 64 C-1a Combining Schedule of Revenues, Expenditures and Changes In Fund Balance – Budget and Actual N/A C-1b Budgetary Comparison Schedule – General Fund -- Education Jobs Fund 18 75 C-2 Special Revenue Fund 76 C-3 Budget-to-GAAP Reconciliation 78

ii
24000
PENNSAUKEN TOWNSHIP SCHOOL DISTRICT Table of Contents (Cont’d)
Page
Required Supplementary Information – Part III
RSI-1 Required Supplementary Information 80
Notes to the Required Supplementary Information 81
Other Supplementary Information
D. School Based Budget Schedules:
D-1 Combining Balance Sheet N/A D-2 Blended Resource Fund – Schedule of Expenditures Allocated by Resource Type – Actual N/A D-3 Blended Resource Fund – Schedule of Blended Expenditures – Budget and Actual N/A
E. Special Revenue Fund:
E-1 Combining Schedule of Revenues and Expenditures – Budgetary Basis 84 E-2 Preschool Education Aid Schedule of Expenditures – Budgetary Basis 88
F. Capital Projects Fund:
F-1 Summary Schedule of Project Expenditures 90 F-2 Summary Schedule of Revenues, Expenditures, and Changes in Fund Balances – Budgetary Basis 91 F-2a Schedule(s) of Project Revenues, Expenditures, Project Balance and -2g Project Status - Budgetary Basis 92
G. Proprietary Funds:
Enterprise Fund: G-1 Combining Statement of Net Assets 100 G-2 Combining Statement of Revenues, Expenses and Changes in Fund Net Assets 101 G-3 Combining Statement of Cash Flows 102 Internal Service Fund: G-4 Combining Statement of Net Assets N/A G-5 Combining Statement of Revenues, Expenses and Changes in Fund Net Assets N/A G-6 Combining Statement of Cash Flows N/A
H. Fiduciary Funds:
H-1 Combining Statement of Fiduciary Net Assets 104 H-2 Combining Statement of Changes in Fiduciary Net Assets 105 H-3 Student Activity Agency Fund Schedule of Receipts and Disbursements 106 H-4 Payroll Agency Fund Schedule of Receipts and Disbursements 107

iii
24000
PENNSAUKEN TOWNSHIP SCHOOL DISTRICT Table of Contents (Cont’d)
Page Other Supplementary Information (Cont’d)
I. Long-Term Debt:
I-1 Schedule of Serial Bonds 109 I-2 Schedule of Obligations under Capital Leases 110 I-3 Debt Service Fund Budgetary Comparison Schedule 111
STATISTICAL SECTION (Unaudited)
Introduction to the Statistical Section Financial Trends J-1 Net Assets by Component 114 J-2 Changes in Net Assets 115 J-3 Fund Balances—Governmental Funds 117 J-4 Changes in Fund Balances—Governmental Funds 118 J-5 General Fund Other Local Revenue by Source 119 Revenue Capacity J-6 Assessed Value and Estimated Actual Value of Taxable Property 121 J-7 Direct and Overlapping Property Tax Rates 122 J-8 Principal Property Taxpayers 123 J-9 Property Tax Levies and Collections 124 Debt Capacity J-10 Ratios of Outstanding Debt by Type 126 J-11 Ratios of General Bonded Debt Outstanding 127 J-12 Direct and Overlapping Governmental Activities Debt 128 J-13 Legal Debt Margin Information 129 Demographic and Economic Information J-14 Demographic and Economic Statistics 131 J-15 Principal Employers 132 Operating Information J-16 Full-time Equivalent District Employees by Function/Program 134 J-17 Operating Statistics 135 J-18 School Building Information 136 J-19 Schedule of Required Maintenance Expenditures by School Facility 137 J-20 Insurance Schedule 138
SINGLE AUDIT SECTION
K-1 Report on Internal Control Over Financial Reporting and on Compliance And Other Matters Based on an Audit of Financial Statements Performed in Accordance with Government Auditing Standards 15 K-2 Independent Auditor’s Report on Compliance with Requirements That Could Have a Direct and Material Effect on Each Major Program and on Internal Control Over Compliance in Accordance With OMB Circular A-133 and State of New Jersey Circular 04-04-OMB 140 K-3 Schedule of Expenditures of Federal Awards, Schedule A 143 K-4 Schedule of Expenditures of State Financial Assistance, Schedule B 145 K-5 Notes to the Schedules of Awards and Financial Assistance 147 K-6 Schedule of Findings and Questioned Costs 149 K-7 Summary Schedule of Prior Audit Findings 153

INTRODUCTORY SECTION
1

PENNSAUKEN PUBLIC SCHOOLS1695 Hylton Road
Pennsauken NJ 08110(856) 662-8505 FAX (856) 663-5865
December 3, 2012
Honorable President andMembers of the Board of EducationPennsauken Township School District1695 Hylton RoadPennsauken, New Jersey 08110
Dear Board Members:
The comprehensive annual financial report of the Pennsauken School System for the fiscal year ended June 30, 2012, is hereby submitted. Responsibility for both the accuracy of the data and completeness and fairness of the presentation, including all disclosures, rests with the management of the Board of Education. To the best of our knowledge and belief, the data presented in this report is accurate in all material respects and is reported in a manner designed to present fairly the financial position and results of operations of the various funds of the District. All disclosures necessary to enable the reader to gain an understanding of the District’s financial activities have been included:
Our comprehensive annual financial report is presented in four sections: introductory, financial, statistical and single audit. The introductory section includes the following:
Transmittal LetterDistrict’s Organizational ChartList of Principal Officials
The financial section includes:Basic Financial Statements, Fund Statements and SchedulesAuditor’s Reports
The statistical section includes:Selected Financial and Demographic Informationpresented on a multi-year basis.
The District is required to undergo an annual single audit in conformity with the provisions of the U.S. Office of Management and Budget Circular A-133, Audits ofStates, Local Governments, and Non-Profit Organizations; and State of New Jersey Circular 04-04-OMB, Single Audit Policy for Recipients of Federal Grants, State Grantsand State Aid. Information related to this single audit, including the auditor’s report on the internal control structure and compliance with applicable laws and regulations and findings and recommendations, are included in the single audit section of this report.
2

1) REPORT ENTITY AND ITS SERVICES:
The Pennsauken School District is an independent reporting entity within the criteria adopted by the GASB as established by NCGA Statement No.3. All funds of the District are included in this report.
The District provides a full range of educational services appropriate to grade levels Pre-K through 12. These include regular and classified students Pre-K through 12. The District enrollment for the 2011-2012school year was 5,383. This was a decrease of 92 students over the enrollment for 2010-2011. Student enrollment counts for the past tenyears as reported on the ASSA are detailed below:
STUDENT PERCENT YEAR ENROLLMENT CHANGE
2011-12 5383 (1.68%) 2010-11 5475 (.09%)
2009-10 5480 .07%2008-09 5476 (.81%)
2007-08 5521 (2.24%)2006-07 5648 (2.01%)2005-06 5764 (2.70%) 2004-05 5924 (0.65%)
2003-04 5963 (2.80%)2002-03 6135 0.16%
2) ECONOMIC CONDITION AND OUTLOOK:
A facilities committee composed of township residents and school personnel reviewed the district’s facilities needs and recommended that the Board of Education conduct a feasibility study. A feasibility study was completed by Duca/Huder & Kumlin Associates in February 1997. The Board of Education engaged The Vitetta Group for architectural services and reviewed building program options. A comprehensive building program proposal was developed by the board of education. The plan included a major addition to Fine School, a new elementary school, a new intermediate school and an addition to the high school. The voters of Pennsauken approved the $ 38.7 million plan on September 24, 1998. The project was finally completed by September 2002.
At the end of the 2006-2007 school year the Central Elementary School was closed and students redistricted to other schools throughout the district. The school district’s Long Range Facilities Plan was updated to reflect this change. The Board of Education is currently reviewing facility options with the focus on replacing the Central Elementary School. During the 2008-2009 school year, the Board of Education retained an Architect of Record, with plans presented and approved by the Department of Education. A referendum was held on September 29, 2009 and was not approved by the voters. The Board of Education is currently reviewing the project and will decide on a future referendumdate.
3

2) ECONOMIC CONDITION AND OUTLOOK (CONT’D):
Residential real estate sales in Pennsauken have slowed in the past year as has been the trend throughout the nation. Development projects at the Pennsauken Mart sites are still in the planning phases. Pennsauken’s residential community has reflected a moderate change. The Hispanic, Asian and Black populations are increasing.
3) MAJOR INITIATIVES:
The Pennsauken School District is evolving. Our community and our student population are greatly diverse. The district’s initiatives reflect a renewed vision and articulate the next chapter in the laudable history of the Pennsauken School District. This direction aims at embracing and uplifting the assets of its diverse school community and taking advantage of the new opportunities as they appear.
The Pennsauken Board of Education laid the foundation for progress by adopting a new Vision, Mission, and Belief Statements in the spring of 2012. All efforts toward improvement are undergirded and guided by these statements. They keep us all focus on our one, true purpose: student success – academically, socially, locally, and globally. The initiatives detailed in this document are ambitious, but achievable. We seek input from all stakeholders to review, revise, and commit to full realization of them. We owe our students and ourselves our most dedicated work. Through collaborative effort, we can and will be a district Soaring to New Heights.
The Pennsauken Schools’ vision is to foster diversity and talent as well as prepare students with the knowledge, higher-order thinking skills, and communication readiness for college, career, and workforce success. In partnership with parents and community stakeholders, our mission to provide continuous student academic improvement for the pursuit of life-long learning and happiness The Pennsauken Public Schools’ Belief Statements are the following: Potential: The district believes that all students have great potential to become innovators of the next generation. It is our responsibility to educate all students to their fullest potential and to foster an expectation for high performance. This requires adopting a positive attitude that drives the belief that with a high-quality education and appropriate supports, students can be successful regardless of circumstances.
Diversity: The district believes that our strength is in our diversity. Diversity enhances learning. The individuality and uniqueness of all school community members will be fostered and celebrated.
Accountability: The district will make all decisions in the best interests of all students be aligning our vision and mission with policies, budgets, guidelines, curricula, and district performance data. Students should be afforded a highly effective educator in each classroom, differentiated instruction, and alternative ways of leaning. We believe that the current disparity in academic performance between different groups of students can and must be eliminated.
4

3) MAJOR INITIATIVES (CONT’D):
Responsiveness: The district believes that communicating consistently with respect and honesty builds relational trust. Mutual trust fuels responsiveness that focuses appropriately to address the needs of each school community member. The district should be responsive to the needs of students in an evolving educational world and society.
Our major educational initiatives will continue to be:1. Developing a highly qualified staff;2. Creating a positive school climate and culture3. Sustaining school safety and security4. Differentiating Instruction5. Implementing 21
stCentury Technology
6. Providing College & Career Awareness Programs to all Students
Each school has developed a plan of action to implement these initiatives. Teachers are encouraged to participate in our comprehensive staff development courses that focus on strategies that will help them improve student academic learning outcomes. All professional development is aligned with the district's initiatives.
This year, the administration is working with school administration to use data more effectively and assess student progress and instructional programs. Professional development includes the following data: NJ ASK, benchmarks, student enrollment, violence and vandalism, trend data, attendance, truancy, tardiness, suspensions, report cards, special education inclusion student progress, and afterschool programs.
Since December 2011, the administration staff and Board of Education have discussed student achievement data analysis including NJASK 6 year analysis, SAT, AP, Science, Scantron Benchmarks; and Reading Levels. During the summer 2012, the administration presented the school board with the graduation dropout rate and the need for credit recovery programs. Data shared were Pennsauken Gap: Local & National Demographic and Economic Data; Comparison of NJ ASK & NAEP; NJASK 2012 AYP Performance Results.
Currently, the district is collaborating with partners on several strategies. The administration is working with the NJDOE Office of Safety and Security in the Tier 1 District, Making Our Schools Safe (M.O.S.S.). Together with local emergency responders, the district developed a more comprehensive school safety emergency plan to further sustain a positive school climate and culture.
In an effort to increase and communicate high expectations for greater positive student behavior, the district developed the Code of Conduct in collaboration with district staff, parents, students, and community-at large and Board Adopted on August 2012. Currently, we are training staff on Restorative Practices and implementing a Credit Recovery Program for particularly over-aged students with a history of continuous behavior misconduct and non-credit status.
5

3) MAJOR INITIATIVES (CONT’D):
During the spring and summer, staff were trained in the Masonic Model for Intervention and Referral Services, a state mandated system of clearlydefined steps that are taken to assist a struggling student in improving educational outcomes. We want to provide additional resources and support for students’ social wellbeing. Therefore, we have also expanded character education from only elementary level to K through 8th grades and adding high school programs.
Also, the district is working with the department of education to further align the Career and Technology Education programs with the NJ State’s Plan. The Pennsauken High School has terrific related arts program. However, our aim is to gain accreditation for certificated program to increase student college and career readiness.
Additionally, this year, the district expanded the middle and high school STEM (Science, Technology, Engineering, Math) programs through partnerships with Rowan University and other community organizations. High school students and science teachers worked with the Smithsonian Institute and NASA in creating experiments that were launched in space. Through this partnership, middle school students were able to view and ask questions to astronauts in outer space. Through the expansion and improvement of technology, teachers at school levels are integrating the use of classroom wireless computer carts, smart boards, and Promethean boards in their classroom instruction. Ultimately, it is our aim to strengthen and support are teaching staff with state of the arts equipment that will help prepare and engage students in 21st Century learning.
Lastly, it is with great zeal and passion that the district administration seeks to empower teachers to teach with the highest of expectations to encourage, foster and promote maximum student potential. Together, we will work to make decisions that greatly benefit all of our children.
3) INTERNAL ACCOUNTING CONTROLS:
Management of the Pennsauken Township School District is responsible for establishing and maintaining an internal control structure designed to ensure that the assets of the district are projected from loss, theft or misuse and to ensure that adequate accounting data are compiled to allow for the preparation of financial statement in conformity with accounting principles generally accepted in the United States of America (GAAP). The internal control structure is designed to provide reasonable, but not absolute, assurance that these objectives are met. The concept of reasonable assurance recognizes that: (1) the cost of a control should not exceed the benefits likely to be derived; and (2) the valuation of costs and benefits requires estimates and judgments by management.
6

4) INTERNAL ACCOUNTING CONTROLS (CONT'D):
As a recipient of federal and state financial assistance, the Pennsauken Township School District also is responsible for ensuring that an adequate internal control structure is in place to ensure compliance with applicable laws and regulations related to those programs. This internal control structure is also subject to periodic evaluation by the district management.
As part of the Pennsauken Township School District’s single audit described earlier, tests are made to determine the adequacy of the internal control structure, including that portion related to federal and state financial assistance programs, as well as to determine that the District has complied with applicable laws and regulations.
5) BUDGETARY CONTROLS:
In addition to internal controls, the District maintains budgetary controls. The objective of these budgetary controls is to ensure compliance with legal provisions embodied in the annual appropriated budget approved by the voters of the municipality. Annual appropriate budgets are adopted for the general fund, the special revenue fund, and the debt service fund. The final budget amount, as amended for the fiscal year, is reflected in the financial section.
An encumbrance accounting system is used to record outstanding purchase commitments on a line item basis. Open encumbrances at year-end are either canceled or are included as reappropriations of fund balance in the subsequent year. Those amounts to be reappropriated are reported as reservations of fund balance at June 30, 2012.
6) ACCOUNTING SYSTEM AND REPORTS:
The District’s accounting records reflect accounting principles generally accepted in the United States of America, as promulgated by the Governmental Accounting Standards Board (GASB). The accounting system of the District is organized on the basis of funds. These funds are explained in “Notes to the Financial Statements,” Note 1.
7) CASH MANAGEMENT:
The investment policy of the District is guided in large part by state statute as detailed in “Notes to the Financial Statements,” Note 1. The District has adopted a cash management plan, which requires it to deposit public funds in public depositories protected from loss under the provisions of the Governmental Unit Deposit Protection Act (“GUDPA”). GUDPA was enacted in 1970 to protect Governmental Units from a loss of funds on deposit with a failed banking institution in New Jersey. The law requires governmental units to deposit public funds only in public depositories located in New Jersey, where the funds are secured in accordance with the Act.
7

8

PENNSAUKEN PUBLIC SCHOOLS: ORGANIZATIONAL FLOW CHART OF ACTIVITIES
SUPERINTENDENT
School Business Administrator/
Board Secretary
Accounting/Finance Budget Capital Projects Facilities (Bldgs/Grounds) Fire Drills Food Services Grant and Fiscal Management Insurance IT/Student Information System Maintenance/Custodial NJSMART Payroll Purchasing Safety and Security Plans Transportation Tuition Students Warehouse
Director of Personnel/Monitoring
Affirmative Action Officer Budget Certification District Calendar District Objectives Educational Assistants Employee Operations Health and Benefit HIB Hirings Instructional Associates Monitoring New Employee Orientation New Teacher Programs NTAs Personnel Provisional Teacher Program Public Relations QSAC Resignations Retirements Staff Attendance State/Federal Reports State/Federal Reports Substitutes
Director of Special Services
504-ADA Attendance BTW/Alt. Ed. Budget Coordination with sending districts Counselors/SAC Home Schooling Homeless Liaison IDEA In-Service Nurses Related Services Special Ed. Educational Assistants Special Education Programs Speech Testing
Director of Curriculum, Instruction, and Professional Development
AP Test Coordinator Assessment Coordination and Analysis Benchmarks Curriculum Consortium Curriculum Development Curriculum Reviews Developing Dist.-Wide Strategic Plan format Gifted and Talented Instructional materials and supplies NJAHSA NJASK PAARC Professional Development QSAC Requirements Rowan Literacy Consortium
Director of Elementary Education
Pre-K-6th Grade
Assessments Elementary Staff Home Instruction I & RS (Masonic Model) Parent Link PBIS School Report Card School Schedules Student Attendance Student/Parent Handbook Supervising elementary Principals Teacher Evaluations Teacher Observations Title I Program West Jersey Reading Council
Grades 7-12 Athletic Director Career Tech Education Credit Recovery Secondary Staff Home Instruction Homebound Students HSPA I & RS (Masonic Model) Parent Link PBIS School Report Card School Schedules Student Attendance Student/Parent Handbook Supervising elementary Principals Teacher Evaluations Teacher Observations
Instructional Supervisors Language Arts/World Languages
Mathematics Science/Physical Education
Special Education
Coordinator of Buildings and Grounds
Supervisor of Food Service
Supervisor of Transportation
Principals High School
Middle School Intermediate School Elementary Schools
Assistant Business Administrator
Assistant Principals High School
Middle School Intermediate School
9
PENNSAUKEN BOARD OF EDUCATION
PENNSAUKEN, NEW JERSEY
ROSTER OF OFFICIALSJune 2012
MEMBERS OF THE BOARD OF EDUCATION TERM
Danny O’Brien, President 2014 Dung Nguyen, Vice-President 2012
Michael E. Stargell 2013
Bernhard H. Kofoet 2012
Matthew McDevitt 2013
Dr. Allyson Meloni 2014
Carlos Rodriguez 2012
Richard Brown 2013
Stephanie James-Wilson 2014
OTHER OFFICIALS
Marilyn Martinez, Superintendent of Schools
John C. Oberg, Interim School Business Administrator/Board Secretary
Walter Nicgorski, Treasurer of School Monies
Frank Piarulli, Solicitor
10

PENNSAUKEN BOARD OF EDUCATION
PENNSAUKEN, NEW JERSEY
CONSULTANTS AND ADVISORS
Audit Firm
Bowman & Company, LLP601 White Horse Road
Voorhees, New Jersey 08043
Attorney
Frank Piarulli, Esq.8-10 North Maple Ave.
Marlton, New Jersey 08053
Official Depositories
Beneficial Bank2501 Merchantville Avenue
Pennsauken, New Jersey 08110
Bank of New York MellonPO Box 11214
New York, New York 10286-1214
State of New JerseyCash Management Fund
Harborside Financial CenterJersey City, New Jersey 07311
11

FINANCIAL SECTION
12

INDEPENDENT AUDITOR'S REPORT
The Honorable President andMembers of the Board of EducationTownship of PennsaukenCounty of CamdenPennsauken, New Jersey 08110
We have audited the accompanying financial statements of the governmental activities, the business-typeactivities, each major fund, and the aggregate remaining fund information of the Township of Pennsauken School District, in the County of Camden, State of New Jersey, as of and for the fiscal year ended June 30, 2012, which collectively comprise the School District’s basic financial statements as listed in the table of contents. These financial statements are the responsibility, of the Township of Pennsauken School District's management. Our responsibility is to express opinions on these financial statements based on our audit.
We conducted our audit in accordance with auditing standards generally accepted in the United States ofAmerica; the standards applicable to financial audits contained in Government Auditing Standards, issued by the Comptroller General of the United States; and in compliance with audit requirements as prescribed by the Division of Administration and Finance, Department of Education, State of New Jersey. Those standards require that we plan and perform the audit to obtain reasonable assurance about whether the financial statements are free of material misstatement. An audit includes consideration of internal control over financial reporting as a basis for designing audit procedures that are appropriate in the circumstances, but not for the purpose of expressing an opinion on the effectiveness of the School District’s internal control over financial reporting. Accordingly, we express no such opinion. An audit includes examining, on a test basis, evidence supporting the amounts and disclosures in the financial statements. An audit also includes assessing the accounting principles used and the significant estimates made by management, as well as evaluating the overall financial statement presentation. We believe that our audit provides a reasonable basis for our opinions.
In our opinion, the financial statements referred to previously present fairly, in all material respects, the respectivefinancial position of the governmental activities, the business-type activities, each major fund, and the aggregate remaining fund information of the Township of Pennsauken School District in the County of Camden, State of New Jersey, as of June 30, 2012, and the respective changes in financial position and, where applicable, cash flows thereof for the fiscal year then ended in conformity with accounting principles generally accepted in the United States of America.
In accordance with Government Auditing Standards, we have also issued our report dated December 3, 2012 on our consideration of the Township of Pennsauken School District's internal control over financial reporting and on our tests of its compliance with certain provisions of laws, regulations, contracts, and grant agreements and other matters. The purpose of that report is to describe the scope of our testing of internal control over financial reporting and compliance and the results of that testing, and not to provide an opinion on internal control over financial reporting or on compliance. That report is an integral part of an audit performed in accordance with Government Auditing Standards and should be considered in assessing the results of our audit.
13

14

REPORT ON INTERNAL CONTROL OVER FINANCIAL REPORTING AND ON COMPLIANCE AND OTHER MATTERS BASED ON AN AUDIT OF FINANCIAL STATEMENTS PERFORMED IN
ACCORDANCE WITH GOVERNMENT AUDITING STANDARDS
The Honorable President andMembers of the Board of EducationTownship of Pennsauken School DistrictCounty of CamdenPennsauken, New Jersey 08110
We have audited the financial statements of the governmental activities, the business-type activities, each major fund, and the aggregate remaining fund information of the Township of Pennsauken School District, in the County of Camden, State of New Jersey, as of and for the fiscal year ended June 30, 2012, which collectively comprise the School District’s basic financial statements and have issued our report thereon dated December 3, 2012. We conducted our audit in accordance with auditing standards generally accepted in the United States of America, the standards applicable to financial audits contained in Government Auditing Standards, issued by the Comptroller General of the United States, and in compliance with audit requirements as prescribed by the Division of Administration and Finance, Department of Education, State of New Jersey.
Internal Control Over Financial ReportingManagement of the Township of Pennsauken School District is responsible for establishing and maintaining effective internal control over financial reporting. In planning and performing our audit, we considered the Township of Pennsauken School District's internal control over financial reporting as a basis for designing our auditing procedures for the purpose of expressing our opinions on the financial statements, but not for the purpose of expressing an opinion on the effectiveness of the School District’s internal control over financial reporting. Accordingly, we do not express an opinion on the effectiveness of the School District’s internal control over financial reporting.
A deficiency in internal control exists when the design or operation of a control does not allow management or employees, in the normal course of performing their assigned functions, to prevent, or detect and correct misstatements on a timely basis. A material weakness is a deficiency, or a combination of deficiencies, in internal control such that there is a reasonable possibility that a material misstatement of the School District’s financial statements will not be prevented, or detected and corrected on a timely basis.
Our consideration of internal control over financial reporting was for the limited purpose described in the first paragraph of this section and was not designed to identify all deficiencies in internal control over financial reporting that might be deficiencies, significant deficiencies or material weaknesses. We did not identify any deficiencies in internal control over financial reporting that we consider to be material weaknesses, as defined previously. However, we identified one deficiency in internal control over financial reporting, described in the accompanying Schedule of Findings and Questioned Costs and Independent Auditor’s Management Report on Administrative Findings - Financial, Compliance and Performance that we consider to be a significant deficiency in internal control over financial reporting as finding number 2012-1. A significant deficiency is a deficiency, or a combination of deficiencies, in internal control that is less severe than a material weakness, yet important enough to merit attention by those charged with governance.
15

16
REQUIRED SUPPLEMENTARY INFORMATIONPART I
17

PENNSAUKEN TOWNSHIP SCHOOL DISTRICT
Management’s Discussion and AnalysisFor the Fiscal Year Ended June 30, 2012
(Unaudited)
As management of the Township of Pennsauken School District, we offer readers of the Township of PennsaukenSchool District’s financial statements this narrative overview and analysis of the financial activities of the Township of Pennsauken School District for the fiscal year ended June 30, 2012. The intent of this discussion and analysis is to look at the Township of Pennsauken School District’s financial performance as a whole. Readers should also review the information furnished in our letter of transmittal, notes to the basic financial statements, and financial statements to enhance their understanding of the Township of Pennsauken School District’s financial performance.
Financial Highlights
The assets of the Township of Pennsauken School District exceeded its liabilities at the close of the most recent fiscal year by $32,640,304 (net assets).
The Township of Pennsauken School District’s total net assets increased by $4,279.451 from July 1, 2011.
As of the close of the current fiscal year, the Township of Pennsauken School District’s governmental funds reported combined ending fund balances of $17,327,634 an increase of $1,781,969 in comparison with the prior year.
At the end of the current fiscal year, there was no unassigned fund balance for the general fund as compared to $2,306,971 at the beginning of the fiscal year.
The Township of Pennsauken School District’s total debt decreased by $2,970,000 as a result of budgeted debt payments.
Overview of the Financial Statements
This discussion and analysis is intended to serve as an introduction to the Township of Pennsauken School District’s basic financial statements. The Township of Pennsauken School District’s basic financial statements comprise three components: (1) district-wide financial statements, (2) fund financial statements, and (3) notes to the basic financial statements themselves.
District-wide Financial Statements: The district-wide financial statements are designed to provide readers with a broad overview of the Township of Pennsauken School District’s finances, in a manner similar to a private-sector business.
The statement of net assets presents information on all of the Township of Pennsauken School District’s assets and liabilities, with the difference between the two reported as net assets. Over time, increases or decreases in net assets may serve as a useful indicator of whether the financial position of the Township of PennsaukenSchool District is improving or deteriorating.
The statement of activities presents information showing how the Township of Pennsauken School District’s net assets changed during the most recent fiscal year. All changes in net assets are reported as soon as the underlying event giving rise to the change occurs, regardless of the timing of related cash flows. Thus, revenues and expenses are reported in this statement for some items that will only result in cash flows in future fiscal periods (e.g., earned but unused sick leave).
18

TOWNSHIP OF PENNSAUKEN SCHOOL DISTRICTManagement’s Discussion and Analysis
For the Fiscal Year Ended June 30, 2012(Unaudited) (Cont’d)
District-wide financial statements (Cont'd): Both of the district-wide financial statements distinguish functions of the Township of Pennsauken School District that are principally supported by taxes and intergovernmental revenues (governmental activities) from other functions that are intended to recover all or a significant portion of their costs through user fees and charges (business-type activities). The governmental activities of the Township of Pennsauken School District include the education of students in grades Pre-K through 12 at the Township of Pennsauken School District's twelve schools. The business-type activities of the Township of Pennsauken School District include a food service program.
Fund Financial Statements: A fund is a grouping of related accounts that is used to maintain control over resources that have been segregated for specific activities or objectives. The Township of Pennsauken School District, like other state and local governments, uses fund accounting to ensure and demonstrate compliance with finance-related legal requirements. All of the funds of the Township of Pennsauken School District can be divided into three categories: governmental funds, proprietary funds, and fiduciary funds.
Governmental Funds: Most of the Township of Pennsauken School District’s activities are reported in governmental funds, which focus on how money flows into and out of those funds and the balances left at year-end available for spending in the future periods. These funds are reported using an accounting method called modified accrual basis of accounting, which measures cash and all other financial assets that can readily be converted to cash. The governmental fund statements provide a detailed short-term view of the Township of Pennsauken School District’s general government operations and the basic services it provides. Governmental fund information helps you determine whether there are more or fewer financial resources that can be spent in the near future to finance educational programs.
The Township of Pennsauken School District maintains five individual governmental funds. Information is presented separately in the governmental fund balance sheet and in the governmental fund statement of revenues, expenditures, and changes in fund balances for the general fund, special revenue fund, capital projects fund, debt service fund and permanent fund.
The relationship (or differences) between governmental activities (reported in the Statement of Net Assets and the Statement of Activities) and governmental funds is reconciled in the financial statements.
Also, the Township of Pennsauken School District adopts an annual budget for its general fund, special revenue fund, and debt service fund. Budgetary comparison schedules have been provided for both to demonstrate compliance with the budgets.
Proprietary Funds: The Township of Pennsauken School District maintains one type of proprietary fund. Enterprise funds, which are a proprietary fund type used to report an activity for which a fee is charged to external users for goods or services, are used to report the same functions presented as business-type activities in the district-wide financial statements. The Township of Pennsauken School District uses an enterprise fund to account for its food service program.
Proprietary funds provide the same type of information as the district-wide financial statements, only in more detail. The proprietary fund financial statements provide separate information for the food service program.
Fiduciary Funds: Fiduciary funds are used to account for resources held for the benefit of parties outside the government. Fiduciary funds are not reflected in the district-wide financial statements because the resources of those funds are not available to support the Township of Pennsauken School District’s own programs. The accounting used for fiduciary funds is much like that used for proprietary funds.
Notes to the Financial Statement: The notes provide additional information that is essential to a full understanding of the data provided in the district-wide and fund financial statements.
19

TOWNSHIP OF PENNSAUKEN SCHOOL DISTRICTManagement’s Discussion and Analysis
For the Fiscal Year Ended June 30, 2012(Unaudited) (Cont’d)
District-wide Financial Analysis
As noted earlier, net assets may serve over time as a useful indicator of a government’s financial position. In the case of the Township of Pennsauken School District, assets exceeded liabilities by $32,640,304 at the close of the most recent fiscal year.
The largest portion of the Township of Pennsauken School District’s net assets (66.36 percent) reflects its investment in capital assets (i.e., land, buildings, equipment), less any related debt used to acquire those assets that are still outstanding. The Township of Pennsauken School District uses these assets to provide educational services to students; consequently, these assets are not available for future spending. Although the Township of Pennsauken School District’s investment in its capital assets is reported net of related debt, it should be notedthat the resources needed to repay this debt must be provided from sources, since the capital assets themselves cannot be used to liquidate these liabilities.
TOWNSHIP OF PENNSAUKEN SCHOOL DISTRICT'S NET ASSETS
Governmental Business-Type
Activities Activities Total
2012 2011 2012 2011 2012 2011
Current and Other Assets 21,048,475$ 19,432,234$ 1,275,147$ 1,220,223$ 22,323,622$ 20,652,457$
Capital Assets 41,517,646 41,724,260 500,968 473,326 42,018,614 42,197,586
Total Assets 62,566,121 61,156,494 1,776,115 1,693,549 64,342,236 62,850,043
Long-term Liabilities Outstanding 23,953,901 26,793,480 53,696 37,053 24,007,597 26,830,533
Other Liabilities 6,854,547 6,998,508 839,788 660,148 7,694,335 7,658,656
Total Liabilities 30,808,448 33,791,988 893,484 697,201 31,701,932 34,489,189
Net Assets:
Invested in Capital Assets, Net of
Related Debt 18,597,789 15,978,876 500,968 473,327 19,098,757 16,452,203
Restricted 17,088,644 12,974,060 17,088,644 12,974,060
Unrestricted (3,928,760) (1,588,430) 381,663 523,021 (3,547,097) (1,065,409)
Total Net Assets 31,757,673$ 27,364,506$ 882,631$ 996,348$ 32,640,304$ 28,360,854$
The portion of the Township of Pennsauken School District’s net assets that represents resources that are subject to external restrictions on how they may be used is 53.81%.
There was a decrease of $113,716 in overall net assets for the Township of Pennsauken School District’s business-type activities. The primary reason for the decrease was a decrease in federal and state reimbursements for the program.
20

TOWNSHIP OF PENNSAUKEN SCHOOL DISTRICT Management’s Discussion and Analysis
For the Fiscal Year Ended June 30, 2012 (Unaudited) (Cont’d)
Governmental Activities: Governmental activities increased the Township of Pennsauken School District’s net assets by $4,393,167, thereby accounting for 100 percent of the total increase in net assets of the Township of Pennsauken School District. Key elements of this increase are as follows:
2012 2011 2012 2011 2012 2011Revenues:
Program Revenues: Charges for Services 1,072,591$ 618,550$ 842,124$ 871,227$ 1,914,715$ 1,489,777$ Operating Grants and Contributions 12,079,991 12,004,802 2,063,412 1,895,318 14,143,403 13,900,120 Capital Grants and Contributions 107,500 107,500
General Revenues: Property Taxes 37,039,257 37,060,308 37,039,257 37,060,308 Grants and Contributions not Restricted to Specific Programs 49,101,274 45,795,363 49,101,274 45,795,363 Other 490,445 410,437 10,448 10,684 500,893 421,121
Total Revenues 99,783,558 95,889,460 3,023,484 2,777,229 102,807,042 98,666,689
Expenses:
Instruction 43,178,053 35,372,166 43,178,053 35,372,166 Support Services 52,171,566 58,003,739 52,171,566 58,003,739 Food Service 3,137,200 2,910,533 3,137,200 2,910,533
Total Expenses 95,349,619 93,375,905 3,137,200 2,910,533 98,486,819 96,286,438
Increase In Net Assets before Transfers 4,433,939 2,513,555 (113,716) (133,304) 4,320,223 2,380,251
Transfers and Adjustments (40,772) (77,860) (9,176) (40,772) (87,036)
Increase in Net Assets 4,393,167 2,435,695 (113,716) (142,480) 4,279,451 2,293,215
Net Assets, July 1 27,364,506 24,928,811 996,348 1,138,828 28,360,854 26,067,639
Net Assets, June 30 31,757,673$ 27,364,506$ 882,632$ 996,348$ 32,640,305$ 28,360,854$
TOWNSHIP OF PENNSAUKEN SCHOOL DISTRICT'S CHANGESIN NET ASSETS
Governmental Activities
Business-TypeActivities Total
Property taxes decreased by $21,051. Other revenues increased by $3,915,149 (6.66 percent). Most of the increase was attributable to additional
state and federal aid. During the current fiscal year, the State of New Jersey made payments on-behalf of the Township of Pennsauken School District for T.P.A.F. pension and medical in the amount of $3,640,349, as compared to $2,536,892 in fiscal year 2011.
21

TOWNSHIP OF PENNSAUKEN SCHOOL DISTRICTManagement’s Discussion and Analysis
For the Fiscal Year Ended June 30, 2012(Unaudited) (Cont’d)
Business-Type Activities: Business-type activities decreased the Township of Pennsauken School District’s net assets by $113,716. The key element of this decrease is as follows:
Operating grants decreased by $168,094. Capital grants and contributions increased by $107,500. Other revenues accounted for the balance of the reduction.
Financial Analysis of the Government’s Funds
As stated earlier, the Township of Pennsauken School District uses fund accounting to ensure and demonstrate compliance with finance-related legal requirements.
Governmental Funds: The focus of the Township of Pennsauken School District’s governmental funds is to provide information on near-term inflows, outflows, and balances of spendable resources. Such information is useful in assessing the Township of Pennsauken School District’s financing requirements. In particular, unreserved fund balance may serve as a useful measure of a government’s net resources available for spending at the end of the fiscal year.
As of the end of the current fiscal year, the Township of Pennsauken School District’s governmental funds reported combining ending fund balances of $17,327,634, an increase of $1,781,969 in comparison with the prior year. This increase is primarily a result of the increase in state and federal aid.
Of the combined ending fund balances of $17,327,634, $647,062 constitutes unassigned fund balance. The remainder of fund balance is ear-marked to indicate that it is not available for new spending because it has already been committed (1) to liquidate contracts and purchase orders of the prior period ($1,170,554), (2) to be utilized in future budgets as tax relief ($4,848,238), (3) as a reserve for inventory ($225,984), (4) as a reserve for capital projects so identified in the Long Range Facility Plan ($9,994,559), (5) as a reserve for emergency purposes ($432,583) and (6) a permanent fund of ($8,654).
The general fund is the main operating fund of the Township of Pennsauken School District. At the end of the current fiscal year, there was no unassigned fund balance of the general fund, while total fund balance was $13,090,312.
Fund balance of the Township of Pennsauken School District General Fund decreased by $625,593 during the current fiscal year.
The special revenue fund has a fund balance at the end of the current fiscal year in the amount of $647,062. This amount represents unexpended pre-school education aid, which available for use in the 2012-13 Budget.
The debt service fund had no fund balance.
The capital projects fund has fund balance of $3,581,605 of which all has been committed to liquidate any unpaid orders, or for other approved capital projects.
Proprietary Funds: The Township of Pennsauken School District’s proprietary funds provide the same type of information found in the district-wide financial statements, but in more detail.
Unrestricted net assets were $381,663 at fiscal year end.
22
TOWNSHIP OF PENNSAUKEN SCHOOL DISTRICTManagement’s Discussion and Analysis
For the Fiscal Year Ended June 30, 2012(Unaudited) (Cont’d)
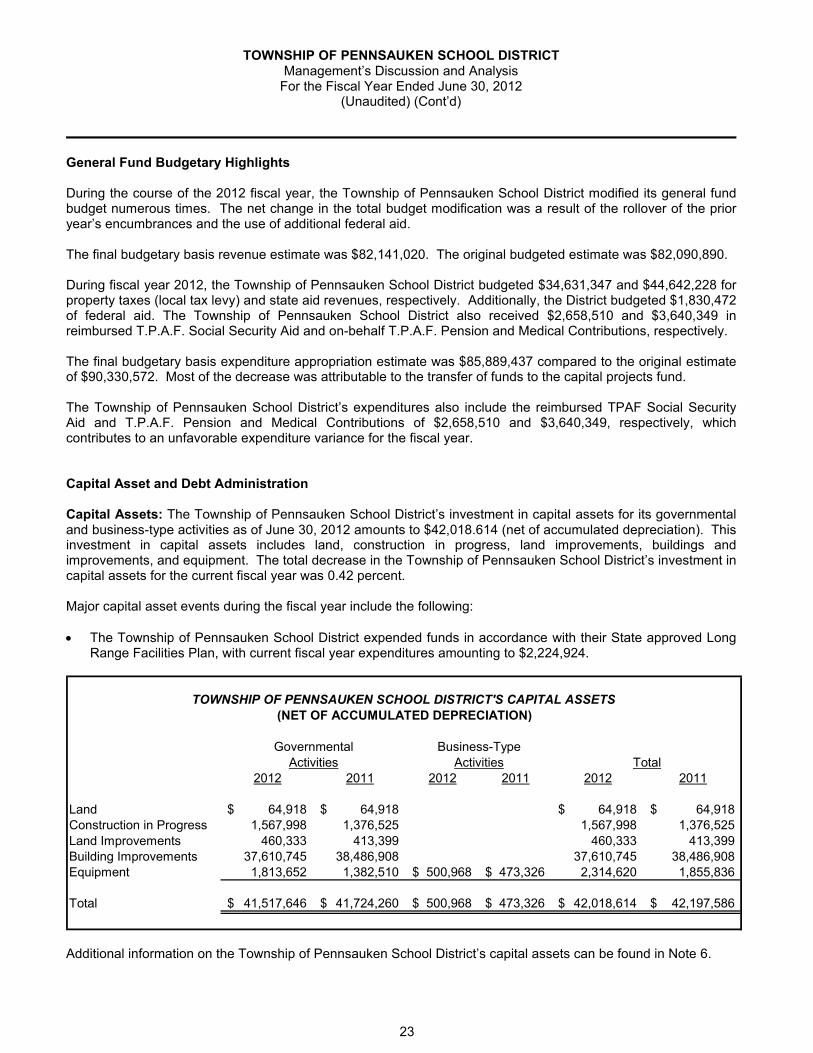
General Fund Budgetary Highlights
During the course of the 2012 fiscal year, the Township of Pennsauken School District modified its general fund budget numerous times. The net change in the total budget modification was a result of the rollover of the prior year’s encumbrances and the use of additional federal aid.
The final budgetary basis revenue estimate was $82,141,020. The original budgeted estimate was $82,090,890.
During fiscal year 2012, the Township of Pennsauken School District budgeted $34,631,347 and $44,642,228 for property taxes (local tax levy) and state aid revenues, respectively. Additionally, the District budgeted $1,830,472of federal aid. The Township of Pennsauken School District also received $2,658,510 and $3,640,349 in reimbursed T.P.A.F. Social Security Aid and on-behalf T.P.A.F. Pension and Medical Contributions, respectively.
The final budgetary basis expenditure appropriation estimate was $85,889,437 compared to the original estimate of $90,330,572. Most of the decrease was attributable to the transfer of funds to the capital projects fund.
The Township of Pennsauken School District’s expenditures also include the reimbursed TPAF Social Security Aid and T.P.A.F. Pension and Medical Contributions of $2,658,510 and $3,640,349, respectively, which contributes to an unfavorable expenditure variance for the fiscal year.
Capital Asset and Debt Administration
Capital Assets: The Township of Pennsauken School District’s investment in capital assets for its governmental and business-type activities as of June 30, 2012 amounts to $42,018.614 (net of accumulated depreciation). This investment in capital assets includes land, construction in progress, land improvements, buildings and improvements, and equipment. The total decrease in the Township of Pennsauken School District’s investment in capital assets for the current fiscal year was 0.42 percent.
Major capital asset events during the fiscal year include the following:
The Township of Pennsauken School District expended funds in accordance with their State approved Long Range Facilities Plan, with current fiscal year expenditures amounting to $2,224,924.
TOWNSHIP OF PENNSAUKEN SCHOOL DISTRICT'S CAPITAL ASSETS
(NET OF ACCUMULATED DEPRECIATION)
Governmental Business-Type
Activities Activities Total2012 2011 2012 2011 2012 2011
Land 64,918$ 64,918$ 64,918$ 64,918$ Construction in Progress 1,567,998 1,376,525 1,567,998 1,376,525
Land Improvements 460,333 413,399 460,333 413,399 Building Improvements 37,610,745 38,486,908 37,610,745 38,486,908 Equipment 1,813,652 1,382,510 500,968$ 473,326$ 2,314,620 1,855,836
Total 41,517,646$ 41,724,260$ 500,968$ 473,326$ 42,018,614$ 42,197,586$
Additional information on the Township of Pennsauken School District’s capital assets can be found in Note 6.
23
TOWNSHIP OF PENNSAUKEN SCHOOL DISTRICTManagement’s Discussion and Analysis
For the Fiscal Year Ended June 30, 2012(Unaudited) (Cont’d)
Long-term Obligations: At the end of the current fiscal year, the Township of Pennsauken School District had total long term obligations of $26,986,749 representing government activities and $53,696 representing business-type activities. Bonded debt outstanding at June 30, 201 was $23,550,000. All of the School District’s bonded debt is governmental as opposed to business-type. The 2012-2013 adopted budget includes an appropriation of $3,040,000 representing the payment of the annual principal. All of the bonds will mature by April 1, 2019.
Economic Factors and Next Year’s Budget
The future financing of public schools in the State of New Jersey continues to be very unsettling. This has been demonstrated by the withholding of both of the June state aid payments until after the close of the fiscal year, the state’s inability to fully fund the educational formulas created by law under the School Funding Reform Act, the passage of S-1701 by the legislature which reduces fund balance to 2% and imposing of more unfunded mandates. In addition the district is continuing to look at the overall decrease in student population, the increasing number of students attending charter schools and the escalating costs of Special Education Out-of-District placements and related services.
The over-reliance on property taxes to support the schools in Pennsauken Township is a concern faced by the Board of Education and Administration each year. The State Legislature is continuing to review the issue of property tax relief as well as shared services. While the community continues to support the School District, the issue of increasing property taxes is a concern. The School District has been committed to financial excellence for many years and will continue to seek alternative sources for funding as well as ways to reduce expenditures while maintaining our educational programs. The District is committed to sound fiscal management in order to meet the challenges of the future.
Requests for Information
This financial report is designed to provide our citizens, taxpayers, customers, and investors and creditors with a general overview of the District’s finances and to demonstrate the District’s accountability for the money it receives. If you have questions about this report or need additional financial information, contact the School Business Administrator/Board Secretary at:
Pennsauken Township Board of Education, 1695 Hylton Road, Pennsauken, New Jersey 08110.
24

BASIC FINANCIAL STATEMENTS
25

DISTRICT-WIDE FINANCIAL STATEMENTS
26

24000 Exhibit A-1TOWNSHIP OF PENNSAUKEN SCHOOL DISTRICT
Statement of Net Assets
Governmental Business-TypeActivities Activities Total
ASSETS:Cash and Cash Equivalents 9,396,213.27$ 1,152,609.24$ 10,548,822.51$ Receivables, net 8,496,043.26 84,820.90 8,580,864.16Inventory 225,984.14 37,716.42 263,700.56Debt Issuance Costs (Net of Amortization) 143,465.00 143,465.00Restricted Cash and Cash Equivalents 2,786,769.33 2,786,769.33Capital Assets, net (Note 6) 41,517,645.57 500,968.49 42,018,614.06
Total Assets 62,566,120.57 1,776,115.05 64,342,235.62
LIABILITIES:Accounts Payable 3,553,767.12 827,029.76 4,380,796.88 Accrued Interest 244,322.24 244,322.24 Deferred Revenue 23,608.85 12,757.76 36,366.61 Noncurrent Liabilities (Note 7): Due within One Year 3,032,848.02 3,032,848.02 Due beyond One Year 23,953,901.38 53,696.00 24,007,597.38
Total Liabilities 30,808,447.61 893,483.52 31,701,931.13
NET ASSETS:Invested in Capital Assets, Net of Related Debt 18,597,789.17 500,968.49 19,098,757.66Restricted for: Debt Service (238,989.98) (238,989.98) Endowment Fund 8,654.13 8,654.13 Capital Projects 9,994,559.27 9,994,559.27 Other Purposes 7,324,420.60 7,324,420.60Unrestricted (Deficit) (3,928,760.23) 381,663.04 (3,547,097.19)
Total Net Assets 31,757,672.96$ 882,631.53$ 32,640,304.49$
The accompanying Notes to Financial Statements are an integral part of this statement.
June 30, 2012
27

24000 Exhibit A-2TOWNSHIP OF PENNSAUKEN SCHOOL DISTRICT
Statement of ActivitiesFor the Fiscal Year Ended June 30, 2012
Net (Expense)Revenue and
Program Revenues Changes in Net AssetsOperating Capital
Charges for Grants and Grants and Governmental Business-TypeFunctions / Programs Expenses Services Contributions Contributions Activities Activities Total
Governmental Activities: Instruction: Regular 24,083,201.49$ 922,997.80$ (23,160,203.69)$ (23,160,203.69)$ Special Education 9,446,366.00 149,592.76 2,756,353.65$ (6,540,419.59) (6,540,419.59) Other Special Instruction 437,210.26 (437,210.26) (437,210.26) Other Instruction 1,262,800.83 (1,262,800.83) (1,262,800.83) Tuition 7,948,474.60 1,579,444.00 (6,369,030.60) (6,369,030.60) Support Services: Student and Instruction Related Services 6,676,305.43 554,753.40 (6,121,552.03) (6,121,552.03) School Administrative Services 2,779,594.88 (2,779,594.88) (2,779,594.88) Other Administrative Services 3,080,287.23 (3,080,287.23) (3,080,287.23) Plant Operations and Maintenance 8,521,054.59 (8,521,054.59) (8,521,054.59) Pupil Transportation 4,960,279.97 5,715.77 (4,954,564.20) (4,954,564.20) Unallocated Benefits 16,906,273.85 467,083.45 (16,439,190.40) (16,439,190.40) Reimbursed TPAF and Social Security 6,298,859.40 6,298,859.40 Transfer to Charter School 1,802,172.00 (1,802,172.00) (1,802,172.00) Amortization of Debt Issuance Costs 20,495.00 (20,495.00) (20,495.00) Interest on Long-Term Debt 1,126,243.76 417,781.95 (708,461.81) (708,461.81)
Total Governmental Activities 95,349,619.29 1,072,590.56 12,079,991.62 - (82,197,037.11) - (82,197,037.11)
Business-Type Activities: Food Service 3,137,200.51 842,124.29 2,063,412.02 107,500.00$ - (124,164.20)$ (124,164.20)
Total Primary Government 98,486,819.80$ 1,914,714.85$ 14,143,403.64$ 107,500.00$ (82,197,037.11) (124,164.20) (82,321,201.31)
General Revenues: Taxes: Property Taxes, Levied for General Purposes, net 34,631,347.00 34,631,347.00 Taxes Levied for Debt Service 2,407,910.00 2,407,910.00 Federal and State Aid Not Restricted 47,912,867.93 47,912,867.93 Federal and State Aid Restricted 1,188,406.05 1,188,406.05 Miscellaneous Income 490,444.83 10,447.89 500,892.72 Cancellation of Prior Year Accounts Receivable (133,473.75) (133,473.75) Cancellation of Special Revenue Grant Balances 235,801.93 235,801.93 Operating Transfers (143,100.00) (143,100.00)
Total General Revenues, Special Items, Extraordinary Items and Transfers 86,590,203.99 10,447.89 86,600,651.88
Change in Net Assets 4,393,166.88 (113,716.31) 4,279,450.57
Net Assets -- July 1 27,364,506.08 996,347.84 28,360,853.92
Net Assets -- June 30 31,757,672.96$ 882,631.53$ 32,640,304.49$
The accompanying Notes to Financial Statements are an integral part of this statement.
28

FUND FINANCIAL STATEMENTS
29
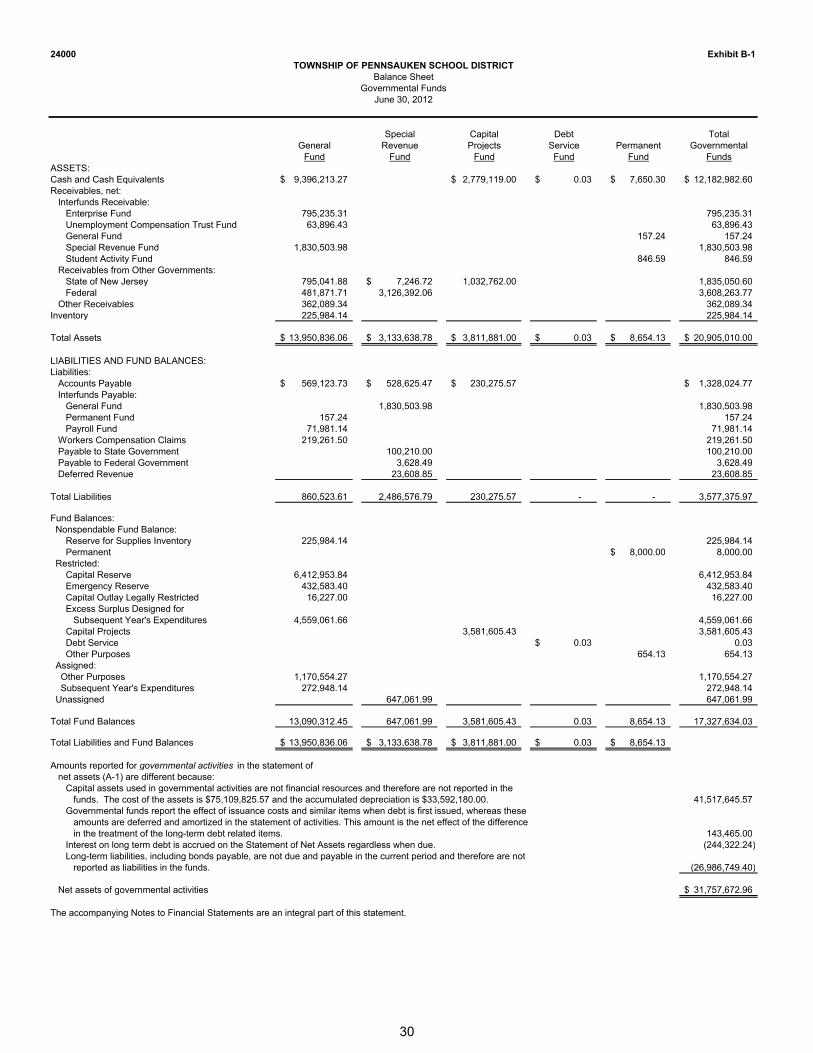
24000 Exhibit B-1TOWNSHIP OF PENNSAUKEN SCHOOL DISTRICT
Balance SheetGovernmental Funds
June 30, 2012
Special Capital Debt TotalGeneral Revenue Projects Service Permanent Governmental
Fund Fund Fund Fund Fund FundsASSETS:Cash and Cash Equivalents 9,396,213.27$ 2,779,119.00$ 0.03$ 7,650.30$ 12,182,982.60$ Receivables, net: Interfunds Receivable: Enterprise Fund 795,235.31 795,235.31 Unemployment Compensation Trust Fund 63,896.43 63,896.43 General Fund 157.24 157.24 Special Revenue Fund 1,830,503.98 1,830,503.98 Student Activity Fund 846.59 846.59 Receivables from Other Governments: State of New Jersey 795,041.88 7,246.72$ 1,032,762.00 1,835,050.60 Federal 481,871.71 3,126,392.06 3,608,263.77 Other Receivables 362,089.34 362,089.34Inventory 225,984.14 225,984.14
Total Assets 13,950,836.06$ 3,133,638.78$ 3,811,881.00$ 0.03$ 8,654.13$ 20,905,010.00$
LIABILITIES AND FUND BALANCES:Liabilities: Accounts Payable 569,123.73$ 528,625.47$ 230,275.57$ 1,328,024.77$ Interfunds Payable: General Fund 1,830,503.98 1,830,503.98 Permanent Fund 157.24 157.24 Payroll Fund 71,981.14 71,981.14 Workers Compensation Claims 219,261.50 219,261.50 Payable to State Government 100,210.00 100,210.00 Payable to Federal Government 3,628.49 3,628.49 Deferred Revenue 23,608.85 23,608.85
Total Liabilities 860,523.61 2,486,576.79 230,275.57 - - 3,577,375.97
Fund Balances: Nonspendable Fund Balance: Reserve for Supplies Inventory 225,984.14 225,984.14 Permanent 8,000.00$ 8,000.00 Restricted: Capital Reserve 6,412,953.84 6,412,953.84 Emergency Reserve 432,583.40 432,583.40 Capital Outlay Legally Restricted 16,227.00 16,227.00 Excess Surplus Designed for Subsequent Year's Expenditures 4,559,061.66 4,559,061.66 Capital Projects 3,581,605.43 3,581,605.43 Debt Service 0.03$ 0.03 Other Purposes 654.13 654.13 Assigned: Other Purposes 1,170,554.27 1,170,554.27 Subsequent Year's Expenditures 272,948.14 272,948.14 Unassigned 647,061.99 647,061.99
Total Fund Balances 13,090,312.45 647,061.99 3,581,605.43 0.03 8,654.13 17,327,634.03
Total Liabilities and Fund Balances 13,950,836.06$ 3,133,638.78$ 3,811,881.00$ 0.03$ 8,654.13$
Amounts reported for governmental activities in the statement of net assets (A-1) are different because: Capital assets used in governmental activities are not financial resources and therefore are not reported in the funds. The cost of the assets is $75,109,825.57 and the accumulated depreciation is $33,592,180.00. 41,517,645.57 Governmental funds report the effect of issuance costs and similar items when debt is first issued, whereas these amounts are deferred and amortized in the statement of activities. This amount is the net effect of the difference in the treatment of the long-term debt related items. 143,465.00 Interest on long term debt is accrued on the Statement of Net Assets regardless when due. (244,322.24) Long-term liabilities, including bonds payable, are not due and payable in the current period and therefore are not reported as liabilities in the funds. (26,986,749.40)
Net assets of governmental activities 31,757,672.96$
The accompanying Notes to Financial Statements are an integral part of this statement.
30

24000 Exhibit B-2TOWNSHIP OF PENNSAUKEN SCHOOL DISTRICT
Statement of Revenues, Expenditures and Changes in Fund BalancesGovernmental Funds
For the Fiscal Year Ended June 30, 2012
Special Capital Debt TotalGeneral Revenue Projects Service Permanent Governmental
Fund Fund Fund Fund Fund FundsREVENUES:Local Tax Levy 34,631,347.00$ 2,407,910.00$ 37,039,257.00$ Tuition 1,072,590.56 1,072,590.56Miscellaneous 490,419.74 17,445.30$ 25.09$ 507,890.13State Sources 52,362,717.46 1,746,781.80 1,606,188.00 55,715,687.26Federal Sources 1,849,009.87 3,599,123.17 5,448,133.04
Total Revenues 90,406,084.63 5,363,350.27 - 4,014,098.00 25.09 99,783,557.99
EXPENDITURES: Regular Instruction 23,606,722.32 500.00 23,607,222.32 Special Education Instruction 6,220,270.97 2,908,549.72 9,128,820.69 Other Special Instruction 437,210.26 437,210.26 Other Instruction 1,262,800.83 1,262,800.83 Tuition 6,369,030.60 1,579,444.00 7,948,474.60 Support Services and Undistributed Costs: Student and Instruction Related Services 5,953,794.03 554,753.40 6,508,547.43 School Administrative Services 2,777,904.88 2,777,904.88 Other Administrative Services 2,874,219.60 2,874,219.60 Plant Operations and Maintenance 7,585,757.89 7,585,757.89 Pupil Transportation 4,862,021.06 5,715.77 4,867,736.83 Unallocated Benefits 16,439,190.40 467,083.45 16,906,273.85 Reimbursed TPAF Pension, Medical and Social Security 6,298,859.40 6,298,859.40 Transfer to Charter Schools 1,802,172.00 1,802,172.00Debt Service: Principal 2,970,000.00 2,970,000.00 Interest and Other Charges 1,046,904.60 1,046,904.60Capital Outlay 700,394.83 334,190.91 1,190,337.82$ 2,224,923.56
Total Expenditures 87,190,349.07 5,849,737.25 1,190,337.82 4,016,904.60 500.00 98,247,828.74
Excess (Deficiency) of Revenues over Expenditures 3,215,735.56 (486,386.98) (1,190,337.82) (2,806.60) (474.91) 1,535,729.25
OTHER FINANCING SOURCES (USES): Change in Supplies Inventory 42,061.66 42,061.66 Cancellation of Prior Year Accounts Receivable (133,473.75) (133,473.75) Cancellation of Special Revenue Grant Balances 235,801.93 235,801.93 Transfer To and From Capital Reserve (4,237,269.00) 4,237,269.00 Transfer To and From Capital Outlay 16,227.00 (16,227.00) Assets Acquired Under Capital Lease 137,450.00 137,450.00 Operating Transfers Out (35,600.00) (35,600.00)
Total Other Financing Sources and Uses (3,841,328.41) - 4,087,568.25 - - 246,239.84
Net Change in Fund Balances (625,592.85) (486,386.98) 2,897,230.43 (2,806.60) (474.91) 1,781,969.09
Fund Balance -- July 1 13,715,905.30 1,133,448.97 684,375.00 2,806.63 9,129.04 15,545,664.94
Fund Balance -- June 30 13,090,312.45$ 647,061.99$ 3,581,605.43$ 0.03$ 8,654.13$ 17,327,634.03$
The accompanying Notes to Financial Statements are an integral part of this statement.
31

24000 Exhibit B-3TOWNSHIP OF PENNSAUKEN SCHOOL DISTRICT
Reconciliation of the Statement of Revenues, Expendituresand Changes in Fund Balances of Governmental Funds
to the Statement of ActivitiesFor the Fiscal Year Ended June 30, 2012
Total Net Change in Fund Balances - Governmental Funds 1,781,969.09$
Amounts reported for governmental activities in the statement of activities (A-2) are different because:
Capital outlays are reported in governmental funds as expenditures. However, in the statement of activities, the cost of those assets is allocated over their estimated useful lives as depreciation expense. This is the amount by which capital outlays exceeded depreciation in the period. Depreciation Expense (2,208,012.00)$ Assets Less Than $2,000.00 (116,025.99) Assets Transferred to Food Service Fund (107,500.00) Capital Outlays 2,224,923.56
(206,614.43) Repayment of bond principal is an expenditure in the governmental funds, but the repayment reduces long-term liabilities in the statement of net assets and is not reported in the statement of activities. 2,970,000.00
In the statement of activities, only the gain on the disposal of capital assets is reported, whereas in the governmental funds, the proceeds from a sale increase financial resources. Thus, the change in net assets will differ from the change in fund balance by the cost of the asset removed. (-) Amortization of Debt Issuance Costs (20,495.00) Amortization of Loss on Refunding Bonds (130,396.37) Amortization of Bond Sale Premiums 25,412.90
In the statement of activities, interest on long-term debt in the statement of activities is accrued, regardless of when due. In the governmental funds, interest is reported when due. The accrued interest is an addition in the reconciliation. (+) 22,691.48
Assets acquired under capital leases do not effect the Statement of Net Assets however, are reported as a financing source in the governmental funds. (137,450.00)
In the statement of activities, certain operating expenses, e.g., compensated absences (vacations) are measured by the amounts earned during the year. In the governmental funds, however, expenditures for these items are reported in the amount of financial resources used (paid). When the earned amount exceeds the paid amount, the difference is reduction in the reconciliation (-);when the paid amount exceeds the earned amount the difference is an addition to the reconciliation (+). (30,406.41)
Repayment of capital leases is an expenditure in the governmental fund, but the repayment reduces long-term liabilities in the statement of Net Assets and is not reported in the Statement of Activities. 118,455.62
Change in Net Assets of Governmental Activities 4,393,166.88$
The accompanying Notes to Financial Statements are an integral part of this statement.
32

24000 Exhibit B-4
FoodService
ASSETS:Current Assets: Cash and Cash Equivalents 1,152,609.24$ Accounts Receivable: State 1,477.06 Federal 79,795.59 Other 3,548.25 Inventories 37,716.42
Total Current Assets 1,275,146.56
Noncurrent Assets: Restricted Cash and Cash Equivalents Furniture, Machinery and Equipment 1,537,420.24 Less Accumulated Depreciation (1,036,451.75)
Total Noncurrent Assets 500,968.49
Total Assets 1,776,115.05
LIABILITIES:Current Liabilities: Interfund Accounts Payable: Due General Fund 795,235.31 Accounts Payable 31,794.45 Deferred Revenue 12,757.76
839,787.52 Noncurrent Liabilities: Compensated Absences Payable 53,696.00
Total Liabilities 893,483.52
NET ASSETS:Invested in Capital Assets, Net of Related Debt 500,968.49Unrestricted 381,663.04
Total Net Assets 882,631.53$
The accompanying Notes to Financial Statements are an integral part of this statement.
TOWNSHIP OF PENNSAUKEN SCHOOL DISTRICTStatement of Net Assets
Proprietary FundsJune 30, 2012
33

24000 Exhibit B-5
FoodService
OPERATING REVENUES:Charges for Services: Daily Sales - Reimbursable Programs: School Lunch Program 421,376.91$ School Breakfast Program 13,603.75 Special Milk Program 4,668.75 Daily Sales - Non-Reimbursable Programs 372,459.60 Miscellaneous 5,859.21 Special Functions 24,156.07
Total Operating Revenues 842,124.29
OPERATING EXPENSES:Salaries 908,344.34Employee Benefits 650,416.43General Supplies 8,995.46Depreciation 85,181.90Cost of Sales 1,410,575.69Miscellaneous 73,686.69
Total Operating Expenses 3,137,200.51
Operating Income / (Loss) (2,295,076.22)
NONOPERATING REVENUES (EXPENSES):State Sources: State School Lunch Program 35,130.01Federal Sources: National School Lunch Program 1,478,670.71 National School Breakfast Program 331,091.16 Special Milk Program 5,358.17 Food Distribution Program 179,788.54 Fresh Fruit and Vegetable Program 33,373.43Interest Revenue 10,447.89
Total Nonoperating Revenues (Expenses) 2,073,859.91
Income (Loss) before Contributions and Transfers (221,216.31)
Contributed Capital 107,500.00
Change in Net Assets (113,716.31)
Net Assets -- July 1 996,347.84
Net Assets -- June 30 882,631.53$
The accompanying Notes to Financial Statements are an integral part of this statement.
TOWNSHIP OF PENNSAUKEN SCHOOL DISTRICTStatement of Revenues, Expenses and Changes in Fund Net Assets
Proprietary FundsFor the Fiscal Year Ended June 30, 2012
34

24000 Exhibit B-6
FoodService
CASH FLOWS FROM OPERATING ACTIVITIES:Receipts from Customers 847,604.93$ Payments to Employees (900,421.12)Payments for Employee Benefits (650,416.43)Payments for Supplies and Services (1,489,713.48)
Net Cash Provided by (used for) Operating Activities (2,192,946.10)
CASH FLOWS FROM NON-CAPITAL FINANCING ACTIVITIES:State Sources 40,941.50Federal Sources 2,190,584.79Operating Subsidies and Transfers 217,788.88
Net Cash Provided by (used for) Non-Capital Financing Activities 2,449,315.17
CASH FLOWS FROM CAPITAL AND RELATED FINANCING ACTIVITIES:Purchases of Capital Assets (5,323.90)
CASH FLOWS FROM INVESTING ACTIVITIES:Interest Revenue 10,447.89
Net Increase (Decrease) in Cash and Cash Equivalents 261,493.06
Cash and Cash Equivalents -- July 1 891,116.18
Cash and Equivalents -- June 30 1,152,609.24$
Reconciliation of Operating Income (Loss) to Net Cash Provided (Used) by Operating Activities: Operating Income (Loss) (2,295,076.22)$ Adjustments to Reconcile Operating Income (Loss) to Net Cash Provided by (used for) Operating Activities: Depreciation and Net Amortization 85,181.90 (Increase) Decrease in Inventories (3,047.29) Increase (Decrease) in Accounts Payable 6,591.65 Increase (Decrease) in Deferred Revenue 4,920.29 Increase (Decrease) in Accrued Salary Benefits 7,923.22 (Increase) Decrease in Accounts Receivable 560.35
Total Adjustments 102,130.12
Net Cash Provided by (used for) Operating Activities (2,192,946.10)$
The accompanying Notes to Financial Statements are an integral part of this statement.
TOWNSHIP OF PENNSAUKEN SCHOOL DISTRICTStatement of Cash Flows
Proprietary FundFor the Fiscal Year Ended June 30, 2012
35

24000 Exhibit B-7TOWNSHIP OF PENNSAUKEN SCHOOL DISTRICT
Statement of Fiduciary Net AssetsFiduciary FundsJune 30, 2012
Trust Funds Agency Funds
UnemploymentScholarship Compensation Student
Trust Trust Activity Payroll Total
ASSETS:Cash and Cash Equivalents 21,487.00$ 591,810.71$ 276,079.99$ 26,505.46$ 915,883.16$
Accounts Receivable: Interfund Accounts Receivable: Due Agency Fund -- Payroll 29,409.36 29,409.36 Due General Fund 71,981.14 71,981.14 Refunds Receivable 15,764.58 15,764.58
Total Assets - 29,409.36 - 87,745.72 117,155.08
Total Assets 21,487.00 621,220.07 276,079.99$ 114,251.18$ 1,033,038.24
LIABILITIES:Accounts Payable 45,505.78 45,505.78 Interfund Accounts Payable: Due Unemployment Fund 29,409.36$ 29,409.36 Due Permanent Fund 846.59$ 846.59 Due General Fund 63,896.43 63,896.43Payable to Student Groups 275,233.40 275,233.40Payroll Deductions and Withholdings 84,841.82 84,841.82
Total Liabilities - 109,402.21 276,079.99$ 114,251.18$ 499,733.38
NET ASSETS:Held in Trust for Unemployment Claims and Other Purposes 21,487.00$ 511,817.86$ 533,304.86$
The accompanying Notes to Financial Statements are an integral part of this statement.
36

24000 Exhibit B-8
UnemploymentScholarship Compensation
Trust Trust
ADDITIONS:Contributions and Donations from Payroll Deductions Withheld 76,096.66$ Scholarship Donations 3,128.00$ Investment Earnings: Interest 69.74 6,442.33
Total Additions 3,197.74 82,538.99
DEDUCTIONS:Scholarship Awards 3,500.00 Unemployment Claims 197,856.63
Total Deductions 3,500.00 197,856.63
Change in Net Assets (302.26) (115,317.64)
Net Assets -- July 1 21,789.26 627,135.50
Net Assets -- June 30 21,487.00$ 511,817.86$
The accompanying Notes to Financial Statements are an integral part of this statement.
TOWNSHIP OF PENNSAUKEN SCHOOL DISTRICTStatement of Changes in Fiduciary Net Assets
Fiduciary FundsFor the Fiscal Year Ended June 30, 2012
37

924000
TOWNSHIP OF PENNSAUKEN SCHOOL DISTRICTNotes to Financial Statements
For the Fiscal Year Ended June 30, 2012
Note 1: SUMMARY OF SIGNIFICANT ACCOUNTING POLICIES
Description of the Reporting Entity - The Township of Pennsauken School District (hereafter referred to as the “School District”) is a Type II district located in the County of Camden, State of New Jersey. As a Type II district, the School District functions independently through a Board of Education. The Board is comprised of nine members elected to three-year terms. These terms are staggered so that three member's terms expire each year. The purpose of the School District is to educate students in grades Kthrough 12 at its twelve schools. The School District has an approximate enrollment at June 30, 2012 of 5,383.
The primary criterion for including activities within the School District's reporting entity, as set forth in Section 2100 of the GASB Codification of Governmental Accounting and Financial Reporting Standards, is the degree of oversight responsibility maintained by the School District. Oversight responsibility includes financial interdependency, selection of governing authority, designation of management, ability to significantly influence operations and accountability for fiscal matters. The combined financial statements include all funds of the School District over which the Board exercises operating control. There were no additional entities required to be included in the reporting entity under the criteria as described above, in the current fiscal year. Furthermore, the School District is not includable in any other reporting entity on the basis of such criteria.
Component Units - GASB Statement No. 14, The Financial Reporting Entity, provides guidance that all entities associated with a primary government are potential component units and should be evaluated for inclusion in the financial reporting entity. A primary government is financially accountable not only forthe organizations that make up its legal entity, but also for legally separate organizations that meet the criteria established by GASB Statement No. 14, as amended by GASB Statement No. 39, Determining Whether Certain Organizations are Component Units. The School District has determined that there are no organizations that are considered to be component units.
Basis of Presentation - The financial statements of the School District have been prepared in conformity with accounting principles generally accepted in the United States of America (GAAP) as applied to governmental units. The Governmental Accounting Standards Board (GASB) is the accepted standard-setting body for establishing governmental accounting and financial reporting principles. The School District also applies Financial Accounting Standards Board (FASB) Statements and Interpretations, issued on or before November 30, 1989, to its business-type activities and enterprisefunds, provided they do not conflict with or contradict GASB pronouncements. The more significant of the School District's accounting policies are described in this note.
The School District’s basic financial statements consist of government-wide statements, including a statement of net assets and a statement of activities, and fund financial statements, which provide a more detailed level of financial information.
38

24000 Notes to Financial Statements (Cont'd)
Note 1: SUMMARY OF SIGNIFICANT ACCOUNTING POLICIES (CONT'D)
Basis of Presentation (Cont’d)
Government-wide Financial Statements - The statement of net assets and the statement of activities display information about the School District as a whole. These statements include the financial activities of the primary government, except for fiduciary funds. The statements distinguish between those activities of the School District that are governmental and those that are considered business-type activities. The statement of net assets presents the financial condition of the governmental and business-type activities of the School District at fiscal year end. The statement of activities presents a comparison between direct expenses and program revenues for each program or function of the School District’s governmental activities and for the business-type activities of the School District. Direct expenses are those that are specifically associated with a service, program, or department and,therefore, clearly identifiable to a particular function. The policy of the School District is to not allocate indirect expenses to functions in the statement of activities. Program revenues include charges paid by the recipient of the goods or services offered by the program, grants, and contributions that are restricted to meeting the operational or capital requirements of a particular program, and interest earned on grants that is required to be used to support a particular program. Revenues, which are not classified as program revenues, are presented as general revenues of the School District, with certain limited exceptions. The comparison of direct expenses with program revenues identifies the extent to which each business segment or governmental function is self-financing or draws from the general revenues of the School District.
Fund Financial Statements - During the fiscal year, the School District segregates transactions related to certain School District functions or activities in separate funds in order to aid financial management and to demonstrate legal compliance. Fund financial statements are designed to present financial information of the School District at this more detailed level. The focus of governmental and enterprise fund financial statements is on major funds. Each major fund is presented in a single column. The fiduciary fund is reported by type. The School District uses funds to maintain its financial records during the fiscal year. A fund is defined as a fiscal and accounting entity with a self-balancing set of accounts. There are three categories of funds: governmental, proprietary, and fiduciary.
Governmental Funds - Governmental funds are those through which most governmental functions typically are financed. Governmental fund reporting focuses on the sources, uses, and balances of current financial resources. Expendable assets are assigned to the various governmental funds according to the purposes for which they may or must be used. Current liabilities are assigned to the fund from which they will be paid. The difference between governmental fund assets and liabilities is reported as fund balance. The following are the School District’s major governmental funds:
General Fund - The general fund is the general operating fund of the School District. It is used to account for all financial resources except those required to be accounted for in another fund. Included are certain expenditures for vehicles and movable instructional or non-instructional equipment classified in the capital outlay sub-fund.
As required by the New Jersey State Department of Education, the School District includes budgeted capital outlay in this fund. Accounting principles generally accepted in the United States of America, as they pertain to governmental entities, state that general fund resources may be used to directly finance capital outlays for long-lived improvements as long as the resources in such cases are derived exclusively from unrestricted revenues.
Resources for budgeted capital outlay purposes are normally derived from State of New Jersey aid, district taxes, and appropriated fund balance. Expenditures are those which result in the acquisition of or additions to capital assets for land, existing buildings, improvements of grounds, construction of buildings, additions to, or remodeling of buildings, and the purchase of built-in equipment.
39

24000 Notes to Financial Statements (Cont'd)
Note 1: SUMMARY OF SIGNIFICANT ACCOUNTING POLICIES (CONT'D)
Fund Financial Statements (Cont’d)
Governmental Funds (Cont’d)
General Fund (Cont’d) - In addition to the capital outlay sub-fund, the School District is accountable for an additional sub-fund, the Education Jobs Fund (“Ed Jobs”), resulting from federal legislation signed into law on August 10, 2010. The Ed Jobs program was created to provide funding assistance to states in order to save or create education jobs for the 2010-2011 schoolyear, through September 30, 2012. Jobs funded under this program include those that provide educational and related services for early childhood, elementary, and secondary education. Ed Jobs revenues and expenditures are recorded in the general fund (fund 18) on a reimbursement basis. As such, revenue is not included in the fiscal year surplus, and no portion of general fund balance at June 30, 2012 is considered to be attributable to Ed Jobs. Ed Jobs expenditures at June 30, 2012 are included as a component of overall general fund expenditures, and also are included in total general fund expenditures for purposes of the excess surplus calculation.
Special Revenue Fund - The special revenue fund is used to account for and report the proceeds of specific revenue sources that are restricted or committed to expenditure for specified purposes other than debt service or capital projects.
Capital Projects Fund - The capital projects fund is used to account for and report financial resources that are restricted, committed, or assigned to expenditure for capital outlays, including the acquisition or construction of capital facilities and other capital assets, other than those financed by proprietary funds. The financial resources are derived from New Jersey Economic Development Authority grants, temporary notes, or serial bonds which are specifically authorized by the voters as a separate question on the ballot either during the annual election or at a special election.
Debt Service Fund - The debt service fund is used to account for and report financial resources that are restricted, committed, or assigned to expenditure for principal and interest.
Permanent Fund - The permanent fund is used to account for and report resources that are restricted to the extent that only earnings, and not principal, may be used for purposes that support the School District’s programs, that is, for the benefit of the School District or its students as a whole. The School District maintains a permanent fund for the purpose of scholarships.
Proprietary Funds - Proprietary funds are used to account for the School District’s ongoing activities, which are similar to those found in the private sector.
Enterprise Funds - The enterprise funds are used to account for operations
1. that are financed and operated in a manner similar to private business enterprises, where the intent of the School District is that the costs (expenses, including depreciation) of providing goods or services to the students on a continuing basis be financed or recovered primarily through user charges; or
2. where the School District has decided that periodic determination of revenues earned, expenses incurred, and / or net income is appropriate for capital maintenance, public policy, management control, accountability, or other purposes.
The School District's one enterprise funds is
Food Service Fund - This fund accounts for the financial transactions related to the food service operations of the School District.
40

24000 Notes to Financial Statements (Cont'd)
Note 1: SUMMARY OF SIGNIFICANT ACCOUNTING POLICIES (CONT'D)
Fund Financial Statements (Cont’d)
Proprietary Funds (Cont’d) - All proprietary funds are accounted for on a cost of services or "capital maintenance" measurement focus. This means that all assets and all liabilities, whether current or noncurrent, associated with their activity are included on their balance sheets. Their reported fund equity (net assets) is segregated into investment in capital assets, net of related debt, and unrestricted net assets, if applicable. Proprietary fund type operating statements present increases (revenues) and decreases (expenses) in net total assets.
Depreciation of all exhaustive fixed assets used by proprietary funds is charged as an expense against their operations. Accumulated depreciation is reported on proprietary fund balance sheets. Depreciation has been provided over the estimated useful lives using the straight-line method. The estimated useful lives are as follows:
Equipment 12 YearsLight Trucks and Vehicles 4 YearsHeavy Trucks and Vehicles 6 Years
Fiduciary Funds - Fiduciary fund reporting focuses on net assets and changes in net assets. The fiduciary fund category is split into four classifications: pension trust funds, investment trust funds, private-purpose trust funds, and agency funds. Pension trust funds are used to account for resources held in trust for employees and their beneficiaries based on defined benefit pension agreements, defined contribution agreements, other postemployment benefit agreements, and other employee benefit arrangements. Investment trust funds are used to report the external portion of an investment pool as defined in GASB Statement No. 31, Accounting and Financial Reporting for Certain Investments and for External Investment Pools. Private-purpose trust funds are used to account for the principal and income for all other trust arrangements that benefit individuals, privateorganizations, or other governments. Agency funds are used to account for assets held by the School District in a trustee capacity or as an agent for individuals, private organizations, other governments, and / or other funds (i.e., payroll and student activities). They are custodial in nature (assets equal liabilities) and do not involve measurement of results of operations.
The School District has four fiduciary funds, an unemployment compensation trust fund, a private-purpose scholarship fund, a student activity fund and payroll fund.
Measurement FocusThe government-wide financial statements are prepared using the economic resources measurement focus. All assets and all liabilities associated with the operation of the School District are included on the statement of net assets.
For the fund financial statements, all governmental funds are accounted for using a flow of current financial resources measurement focus. With this measurement focus, only current assets and current liabilities generally are included on the balance sheet. The statement of revenues, expenditures and changes in fund balances reports on the sources (i.e., revenues and other financing sources) and uses (i.e., expenditures and other financing uses) of current financial resources. This approach differs from the manner in which the governmental activities of the government-wide financial statements are prepared. Governmental fund financial statements, therefore, include a reconciliation, with brief explanations to better identify the relationship between the government-wide statements and the statements for governmental funds.
Like the government-wide statements, all proprietary fund types are accounted for on a flow of economic resources measurement focus. All assets and all liabilities associated with the operation of these funds are included on the statement of net assets. The statement of changes in fund net assets presents increases (i.e., revenues) and decreases (i.e., expenses) in net total assets. The statement of cash flows provides information about how the School District finances and meets the cash flow needs of its proprietary activities. Fiduciary funds are reported using the economic resources measurement focus.
41

24000 Notes to Financial Statements (Cont'd)
Note 1: SUMMARY OF SIGNIFICANT ACCOUNTING POLICIES (CONT'D)
Basis of AccountingBasis of accounting determines when transactions are recorded in the financial records and reported on the financial statements. Government-wide financial statements are prepared using the accrual basis of accounting.
For fund financial statements, all governmental funds use the modified accrual basis of accounting. Proprietary and fiduciary funds, like the government-wide financial statements, use the accrual basis of accounting. Differences in the accrual and the modified accrual basis of accounting arise in the recognition of revenue and the presentation of expenses versus expenditures.
Recognition of Revenue - Revenue resulting from exchange transactions, which are defined as transactions in which each party gives and receives essentially equal value, is recorded on the accrual basis when the exchange takes place. For the governmental fund financial statements, which areprepared on the modified accrual basis, however, such revenue is recorded in the fiscal year in which the resources are measurable and become available. Available means that the resources will be collected within the current fiscal year or are expected to be collected soon enough thereafter to be used to pay liabilities of the current fiscal year. For the School District, available means expected to be received within sixty days after fiscal year end.
Revenue resulting from non-exchange transactions, which are defined as transactions in which the School District receives value without directly giving equal value in return, includes Ad Valorem (property) taxes, grants, entitlements, and donations. Ad Valorem (property) taxes are susceptible to accrual. As under New Jersey State Statute, a municipality is required to remit to its school district the entire balance of taxes in the amount voted upon or certified, prior to the end of the school year. The School District records the entire approved tax levy as revenue (accrued) at the start of the fiscal year since the revenue is both measurable and available. The School District is entitled to receive moneys under the established payment schedule and the unpaid amount is considered to be an "accounts receivable". With the exception of the restricted formula aids recorded in the special revenue fund, revenue from grants, entitlements, and donations is recognized in the fiscal year in which all eligibility requirements have been satisfied. Eligibility requirements include timing requirements, which specify the fiscal year when the resources are required to be used or the fiscal year when use is first permitted, matching requirements, in which the School District must provide local resources to be used for a specified purpose, and expenditure requirements, in which the resources are provided to the School District on a reimbursement basis. Restricted formula aids, which include Preschool Education Aid, are recorded in the special revenue fund in accordance with The Audit Program promulgated by the New Jersey Department of Education, which requires that these grants be realized in an amount equal to program expenditures.
Under the modified accrual basis, the following revenue sources are considered to be both measurable and available at fiscal year end: tuition, grants, fees, and rentals.
Expenses / Expenditures - On the accrual basis of accounting, expenses are recognized at the time they are incurred. The fair value of donated commodities used during the fiscal year is reported in the operating statement as an expense. Unused donated commodities are reported as deferred revenue. The measurement focus of governmental fund financial statements is on decreases in net financial resources (expenditures) rather than expenses. Expenditures are generally recognized in the accounting period in which the related fund liability is incurred, if measurable. Allocations of cost, such as depreciation and amortization, are not recognized in governmental funds.
Budgets / Budgetary Control - Annual appropriated budgets are prepared in the spring of each fiscal year for the general, special revenue, and debt service funds. The budgets are submitted to the county office and are voted upon at the annual school election on the third Tuesday in April. Budgets are prepared using the modified accrual basis of accounting. The legal level of budgetary control is established at line item accounts within each fund. Line item accounts are defined as the lowest (most specific) level of detail as established pursuant to the minimum chart of accounts referenced in N.J.A.C. 6A:23A-16.2(f)1. Transfers of appropriations may be made by school board resolution at any time during the fiscal year in accordance with N.J.A.C. 6A:23A-13.3.
42

24000 Notes to Financial Statements (Cont'd)
Note 1: SUMMARY OF SIGNIFICANT ACCOUNTING POLICIES (CONT'D)
Budgets / Budgetary Control (Cont’d) - Formal budgetary integration into the accounting system is employed as a management control device during the fiscal year. For governmental funds, there are no substantial differences between the budgetary basis of accounting and accounting principles generally accepted in the United States of America, with the exception of the legally mandated revenue recognition of the one or more June state aid payments for budgetary purposes only, and the special revenue fund. Encumbrance accounting is also employed as an extension of formal budgetary integration in the governmental fund types. Unencumbered appropriations lapse at fiscal year end.
The accounting records of the special revenue fund are maintained on the budgetary basis. The budgetary basis differs from GAAP in that the budgetary basis recognizes encumbrances as expenditures and also recognizes the related revenues, whereas the GAAP basis does not. Sufficient supplemental records are maintained to allow for the presentation of GAAP basis financial reports.
The budget, as detailed on Exhibit C-1, Exhibit C-2, and Exhibit I-3 includes all amendments to the adopted budget, if any.
Exhibit C-3 presents a reconciliation of the general fund revenues and special revenue fund revenues and expenditures from the budgetary basis of accounting, as presented in the general fund budgetary comparison schedule and the special revenue fund budgetary comparison schedule, to the GAAP basis of accounting as presented in the statement of revenues, expenditures and changes in fund balances -governmental funds. Note that the School District does not report encumbrances outstanding at fiscal year end as expenditures in the general fund since the general fund budget follows the modified accrual basis of accounting, with the exception of the revenue recognition policy for the one or more June state aid payments.
Encumbrances - Under encumbrance accounting, purchase orders, contracts, and other commitments for the expenditure of resources are recorded to reserve a portion of the applicable appropriation. Encumbrances are a component of fund balance at fiscal year end as they do not constitute expenditures or liabilities, but rather commitments related to unperformed contracts for goods and services. Open encumbrances in the governmental funds, other than the special revenue fund, which have not been previously restricted, committed, or assigned, should be included within committed or assigned fund balance, as appropriate.
Open encumbrances in the special revenue fund, however, for which the School District has received advances of grant awards, are reflected on the balance sheet as deferred revenues at fiscal year end.
The encumbered appropriation authority carries over into the next fiscal year. An entry will be made at the beginning of the next fiscal year to increase the appropriation reflected in the certified budget by the outstanding encumbrance amount as of the current fiscal year end.
Cash, Cash Equivalents and Investments - Cash and cash equivalents, for all funds, include petty cash, change funds, cash in banks and all highly liquid investments with a maturity of three months or less at the time of purchase and are stated at cost plus accrued interest. Such is the definition of cash and cash equivalents used in the statement of cash flows for the proprietary funds. U.S. treasury and agency obligations and certificates of deposit with maturities of one year or less when purchased are stated at cost. All other investments are stated at fair value.
New Jersey school districts are limited as to the types of investments and types of financial institutions they may invest in. N.J.S.A. 18A:20-37 provides a list of permissible investments that may be purchased by New Jersey school districts.
43

24000 Notes to Financial Statements (Cont'd)
Note 1: SUMMARY OF SIGNIFICANT ACCOUNTING POLICIES (CONT'D)
Cash, Cash Equivalents and Investments (Cont’d) - N.J.S.A. 17:9-41 et seq. establishes the requirements for the security of deposits of governmental units. The statute requires that no governmental unit shall deposit public funds in a public depository unless such funds are secured in accordance with the Governmental Unit Deposit Protection Act (“GUDPA”), a multiple financial institutional collateral pool, which was enacted in 1970 to protect governmental units from a loss of funds on deposit with a failed banking institution in New Jersey. Public depositories include State or federally chartered banks, savings banks or associations located in or having a branch office in the State of New Jersey, the deposits of which are federally insured. All public depositories must pledge collateral, having a market value at least equal to five percent of the average daily balance of collected public funds, to secure the deposits of governmental units. If a public depository fails, the collateral it has pledged, plus the collateral of all other public depositories, is available to pay the amount of their deposits to the governmental units.
Tuition Receivable - Tuition charges were established by the School District based on estimated costs. The charges are subject to adjustment when the final costs are determined.
Tuition Payable - Tuition charges for the fiscal years ended June 30, 2012 and 2011 were based on rates established by the receiving district. These rates are subject to change when the actual costs have been determined.
Inventories - Inventories are valued at cost, which approximates market. The costs are determined on a first-in, first-out method.
The cost of inventories in the governmental fund financial statements is recorded as expenditures when purchased rather than when consumed.
Inventories recorded on the government-wide financial statements and in the proprietary fund types are recorded as expenses when consumed rather than when purchased.
Prepaid Expenses - Prepaid expenses recorded on the government-wide financial statements and in the proprietary fund types represent payments made to vendors for services that will benefit periods beyond June 30, 2012.
In the governmental fund financial statements payments for prepaid items are fully recognized as expenditures in the fiscal year of payment. No asset for the prepayment is created, and no expenditure allocation to future accounting periods is required (non-allocation method). This is consistent with the basic governmental concept that only expendable financial resources are reported by a specific fund.
Deferred Expenditures - Deferred expenditures are disbursements that are made in one period, but are more accurately reflected as an expenditure / expense in the next fiscal period. Unlike prepaid expenses, deferred expenditures are not regularly recurring costs of operations.
Short-Term Interfund Receivables / Payables - Short-term interfund receivables / payables represent amounts that are owed, other than charges for goods or services rendered to / from a particular fund in the School District, and that are due within one year. These amounts are eliminated in the government-wide financial statements, except for the net residual amounts due between governmental and business-type activities, which are presented as interfunds receivable and / or interfunds payable on the statement of net assets.
Capital Assets - General capital assets are those assets not specifically related to activities reported in the proprietary funds. These assets generally result from expenditures in the governmental funds. These assets are reported in the governmental activities column of the government-wide statement of net assets, but are not reported in the governmental fund financial statements. Capital assets utilized by the proprietary funds, however, are reported both in the business-type activities column of the government-wide statement of net assets and the proprietary fund statement of net assets.
44

24000 Notes to Financial Statements (Cont'd)
Note 1: SUMMARY OF SIGNIFICANT ACCOUNTING POLICIES (CONT'D)
Capital Assets (Cont’d) - All capital assets are capitalized at cost (or estimated historical cost) and updated for additions and retirements during the fiscal year. Donated fixed assets are recorded at their fair market value as of the date received. The School District maintains a capitalization threshold of $2,000.00. The School District does not possess any infrastructure. Improvements are capitalized; the cost of normal maintenance and repairs that do not add to the value of the asset or materially extend an asset’s life are not. All reported capital assets, except land and construction in progress, are depreciated. Improvements are depreciated over the remaining useful lives of the related capital assets.
Depreciation is computed using the straight-line method over the following useful lives:
Governmental Business-TypeActivities Activities
Description Estimated Lives Estimated Lives
Land Improvements 10-20 Years N/ABuildings and Improvements 10-50 Years N/AFurniture and Equipment 5-20 Years 12 YearsVehicles 5-10 Years 4-6 Years
Accrued Salaries and Wages - Certain School District employees who provide services to the School District over the ten-month academic year have the option to have their salaries evenly disbursed during the entire twelve-month year. New Jersey statutes require that these earned but undisbursed amounts be retained in a separate bank account. As of June 30, 2012, the amounts earned by these employees were disbursed to the employees' own individual credit union accounts.
Compensated Absences - Compensated absences are those absences for which employees will be paid, such as vacation, sick leave, and sabbatical leave. A liability for compensated absences that are attributable to services already rendered, and that are not contingent on a specific event that is outside the control of the School District and its employees, is accrued as the employees earn the rights to the benefits. Compensated absences that relate to future services, or that are contingent on a specific event that is outside the control of the School District and its employees, are accounted for in the period in which such services are rendered or in which such events take place.
The entire compensated absence liability is reported on the government-wide financial statements.
For governmental fund financial statements, the current portion of unpaid compensated absences is the amount that is normally expected to be paid with expendable available financial resources. In the proprietary funds, the entire amount of compensated absences is recorded as a fund liability.
Deferred Revenue - Deferred revenue arises when assets are recognized before revenue recognition criteria have been satisfied.
Accrued Liabilities and Long-Term Obligations - All payables, accrued liabilities, and long-term obligations are reported in the government-wide financial statements, and all payables, accrued liabilities, and long-term obligations payable from proprietary funds are reported on the proprietary fund financial statements. In general, governmental fund payables and accrued liabilities that, once incurred, are paid in a timely manner, and in full from current financial resources, are reported as obligations of the funds. However, claims and judgments, compensated absences, special termination benefits, and contractually required pension contributions that will be paid from governmental funds, are reported as aliability in the fund financial statements only to the extent that they are normally expected to be paid with expendable available financial resources. Bonds are recognized as a liability on the governmental fund financial statements when due.
45

24000 Notes to Financial Statements (Cont'd)
Note 1: SUMMARY OF SIGNIFICANT ACCOUNTING POLICIES (CONT'D)
Net Assets - Net assets represent the difference between assets and liabilities. Net assets invested in capital assets, net of related debt consists of capital assets, net of accumulated depreciation, reduced by the outstanding balances of any borrowings used for the acquisition, construction, or improvement of those assets. Net assets are reported as restricted when there are limitations imposed on their use either through the enabling legislation adopted by the School District or through external restrictions imposed by creditors, grantors or laws or regulations of other governments.
It is the School District’s policy to apply restricted resources when an expense is incurred for purposes for which both restricted and unrestricted net assets are available.
Fund Balance - The School District reports fund balance in classifications that comprise a hierarchy based primarily on the extent to which the School District is bound to honor constraints on the specific purposes for which amounts in those funds can be spent. The School District’s classifications, and policies for determining such classifications, are as follows:
Nonspendable - The nonspendable fund balance classification includes amounts that cannot be spent because they are either not in spendable form or are legally or contractually required to be maintained intact. The “not in spendable form” criterion includes items that are not expected to be converted to cash, such as inventories and prepaid amounts.
Restricted - The restricted fund balance classification includes amounts that are restricted to specific purposes. Such restrictions, or constraints, are placed on the use of resources either by being (1) externally imposed by creditors, grantors, contributors, or laws or regulations of other governments; or (2) imposed by law through constitutional provisions or enabling legislation.
Committed - The committed fund balance classification includes amounts that can only be used for specific purposes pursuant to constraints imposed by formal action of the School District’s highest level of decision-making authority, which, for the School District, is the Board of Education. Such formal action consists of an affirmative vote by the Board of Education, memorialized by the adoption of a resolution. Once committed, amounts cannot be used for any other purpose unless the Board of Education removes, or changes, the specified use by taking the same type of action (resolution) it employed to previously commit those amounts.
Assigned - The assigned fund balance classification includes amounts that are constrained by the School District’s intent to be used for specific purposes, but are neither restricted nor committed. Intent is expressed by either the Board of Education or by the business administrator, to which the Board of Education has delegated the authority to assign amounts to be used for specific purposes. Such authority of the business administrator is established by way of a formal job description for the position, approved by the Board of Education.
Unassigned - The unassigned fund balance classification is the residual classification for the general fund. This classification represents fund balance that has not been assigned to other funds and that has not been restricted, committed, or assigned to specific purposes within the general fund. The general fund is the only fund that reports a positive unassigned fund balance amount. In other governmental funds, if expenditures incurred for specific purposes exceed the amounts restricted, committed, or assigned to those purposes, it may be necessary to report a negative unassigned fund balance.
When an expenditure is incurred for purposes for which both restricted and unrestricted fund balances are available, it is the policy of the School District to spend restricted fund balances first. Moreover, when an expenditure is incurred for purposes for which amounts in any of the unrestricted fund balance classifications can be used, it is the policy of the School District to spend fund balances, if appropriate, in the following order: committed, assigned, then unassigned.
46

24000 Notes to Financial Statements (Cont'd)
Note 1: SUMMARY OF SIGNIFICANT ACCOUNTING POLICIES (CONT'D)
Operating and Non-Operating Revenues and Expenses - Operating revenues are those revenues that are generated directly from the primary activity of the proprietary funds. For the School District, these revenues are sales for the food service program. Non-operating revenues principally consist of federal and state grant funding and interest income earned on various interest-bearing accounts.
Operating expenses are necessary costs incurred to provide the goods or services that are the primary activity of the fund. There were no non-operating expenses.
Interfund Activity - Transfers between governmental and business-type activities on the government-wide statements are reported in the same manner as general revenues. Exchange transactions between funds are reported as revenues in the seller funds and as expenditures / expenses in the purchaser funds. Flows of cash or goods from one fund to another without a requirement for repayment are reported as interfund transfers. Interfund transfers are reported as other financing sources / uses in governmental funds and after non-operating revenues / expenses in proprietary funds. Reimbursements from funds responsible for particular expenditures / expenses to the funds that initially paid for them are not presented on the financial statements.
Estimates - The preparation of financial statements in conformity with accounting principles generally accepted in the United States of America requires management to make estimates and assumptions that affect the amounts reported in the financial statements and accompanying notes. Actual results may differ from those estimates.
Note 2: CASH AND CASH EQUIVALENTS
Custodial Credit Risk Related to Deposits - Custodial credit risk is the risk that, in the event of a bank failure, the School District’s deposits might not be recovered. Although the School District does not have a formal policy regarding custodial credit risk, N.J.S.A. 17:9-41 et seq. requires that governmental unitsshall deposit public funds in public depositories protected from loss under the provisions of the Governmental Unit Deposit Protection Act (GUDPA). Under the Act, the first $250,000.00 of governmental deposits in each insured depository is protected by the Federal Deposit Insurance Corporation (FDIC). Public funds owned by the School District in excess of FDIC insured amounts are protected by GUDPA. However, GUDPA does not protect intermingled trust funds such as salary withholdings, athletic and student activity funds, or funds that may pass to the School District relative to the happening of a future condition.
As of June 30, 2012, the School District’s bank balances of $16,553,673.88 were all collateralized by securities held by the pledging financial institution.
New Jersey Cash Management Fund - During the fiscal year, the School District participated in the New Jersey Cash Management Fund. The Fund is governed by regulations of the State Investment Council, who prescribe standards designed to insure the quality of investments in order to minimize risk to the Funds participants. Deposits with the New Jersey Cash Management Fund are not subject to custodial credit risk as defined above. At June 30, 2012, the School District’s deposits with the New Jersey Cash Management Fund were $466,807.18.
47

24000 Notes to Financial Statements (Cont'd)
Note 3: CAPITAL RESERVE ACCOUNT
A capital reserve account was established by the School District by inclusion of $1,000.00 on September 28, 2000 for the accumulation of funds for use as capital outlay expenditures in subsequent fiscal years. The capital reserve account is maintained in the general fund and its activity is included in the general fund annual budget.
Funds placed in the capital reserve account are restricted to capital projects in the School District’s approved Long Range Facilities Plan (LRFP). Upon submission of the LRFP to the Department, a school district may increase the balance in the capital reserve by appropriating funds in the annual general fund budget certified for taxes or by transfer by board resolution at fiscal year-end (June 1 to June 30) of any unanticipated revenue or unexpended line-item appropriation amounts, or both. A school district may also appropriate additional amounts when the express approval of the voters has been obtained by either a separate proposal at budget time or by a special question at one of the four special elections authorized pursuant to N.J.S.A. 19:60-2. Pursuant to N.J.A.C. 6A:23A-14.1(g), the balance in the account cannot at any time exceed the local support costs of uncompleted capital projects in its approved LRFP.
The activity of the capital reserve for the July 1, 2011 to June 30, 2012 fiscal year is as follows:
Beginning Balance July 1, 2011 7,124,360.91$
Increased by:
Transfer per June 28, 2012 Resolution 3,500,000.00$
Transfer from Capital Projects Fund 312,731.00
Interest Earnings 25,861.93
3,838,592.93
10,962,953.84
Decreased by:
Budgeted Withdrawal Transferred
to Capital Projects Fund 4,550,000.00
Ending Balance June 30, 2012 6,412,953.84$
The LRFP balance of local support costs of uncompleted projects at June 30, 2012 is $32,682,220.00. The withdrawals from the capital reserve were for use in a DOE approved facilities projects, consistent with the School District’s LRFP.
48
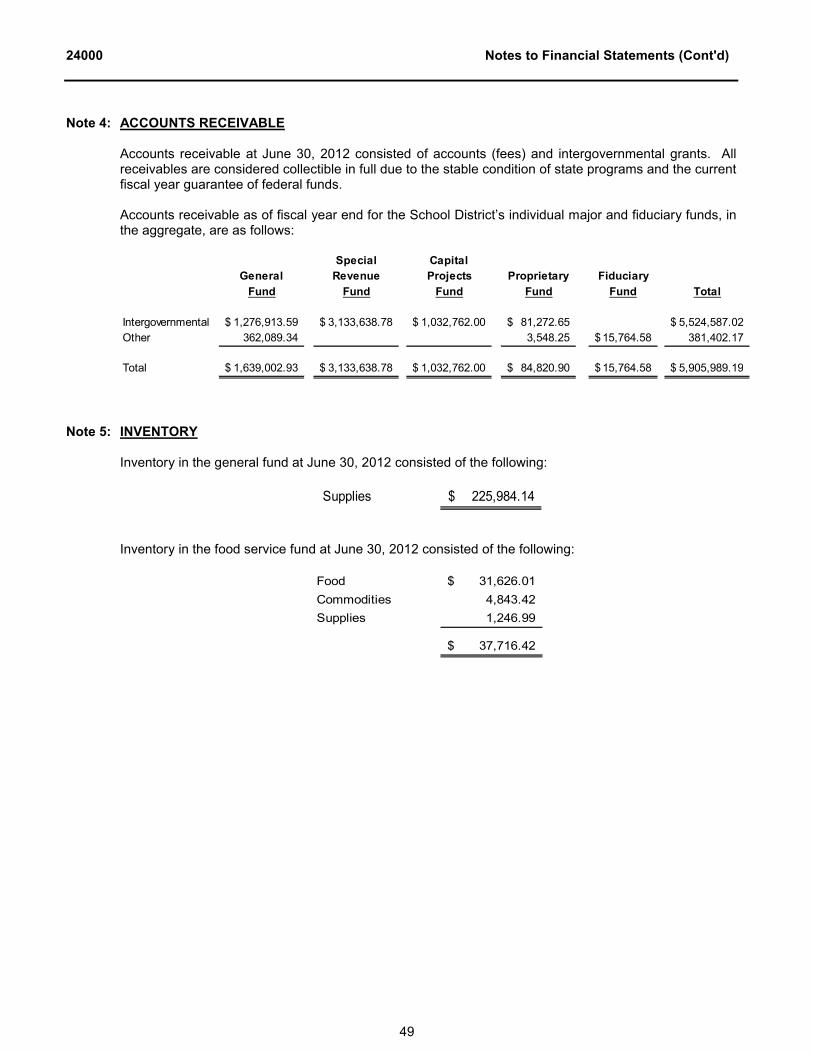
24000 Notes to Financial Statements (Cont'd)
Note 4: ACCOUNTS RECEIVABLE
Accounts receivable at June 30, 2012 consisted of accounts (fees) and intergovernmental grants. All receivables are considered collectible in full due to the stable condition of state programs and the current fiscal year guarantee of federal funds.
Accounts receivable as of fiscal year end for the School District’s individual major and fiduciary funds, in the aggregate, are as follows:
Special Capital
General Revenue Projects Proprietary Fiduciary
Fund Fund Fund Fund Fund Total
Intergovernmental 1,276,913.59$ 3,133,638.78$ 1,032,762.00$ 81,272.65$ 5,524,587.02$
Other 362,089.34 3,548.25 15,764.58$ 381,402.17
Total 1,639,002.93$ 3,133,638.78$ 1,032,762.00$ 84,820.90$ 15,764.58$ 5,905,989.19$
Note 5: INVENTORY
Inventory in the general fund at June 30, 2012 consisted of the following:
Supplies 225,984.14$
Inventory in the food service fund at June 30, 2012 consisted of the following:
Food 31,626.01$
Commodities 4,843.42
Supplies 1,246.99
37,716.42$
49

24000 Notes to Financial Statements (Cont'd)
Note 6: CAPITAL ASSETS
Capital asset activity for the fiscal year ended June 30, 2012 was as follows:
Balance Deletions / Balance
July 1, 2011 Additions Adjustments June 30, 2012
Government Activities:
Capital Assets that are not being Depreciated:
Land 64,918.00$ 64,918.00$
Construction In Progress 1,376,525.00 553,068.82$ 361,596.25$ 1,567,997.57
Total Capital Assets not being Depreciated 1,441,443.00 553,068.82 361,596.25 1,632,915.57
Land Improvements 1,779,048.00 113,147.00 1,892,195.00
Building and Improvements 63,174,060.00 524,122.00 (125,327.00) 63,823,509.00
Equipment 7,012,684.00 1,034,585.74 286,063.74 7,761,206.00
Totals at Historical Cost 71,965,792.00 1,671,854.74 160,736.74 73,476,910.00
Less: Accumulated Depreciation for:
Land Improvements (1,365,649.00) (66,213.00) (1,431,862.00)
Building and Improvements (24,687,152.00) (1,654,381.25) (128,769.25) (26,212,764.00)
Equipment (5,630,174.00) (487,417.75) (170,037.75) (5,947,554.00)
Total Accumulated Depreciation (31,682,975.00) (2,208,012.00) * (298,807.00) (33,592,180.00)
Total Capital Assets being Depreciated, net of
Accumulated Depreciation 40,282,817.00 (536,157.26) (138,070.26) 39,884,730.00
Government Activities Capital Assets, net 41,724,260.00$ 16,911.56$ 223,525.99$ 41,517,645.57$
Business-Type Activities:
Equipment 1,445,495.34$ 112,823.90$ 20,899.00$ 1,537,420.24$
Less: Accumulated Depreciation (972,168.85) (85,181.90) (20,899.00) (1,036,451.75)
Business-Type Activities Capital Assets, net 473,326.49$ 27,642.00$ - 500,968.49$
* Depreciation expense was charged to governmental functions as follows:
Regular Instruction 454,086.55$
Special Education Instruction 309,031.52
Transportation 175,646.75
General Administration 238,466.82
School Administration 1,690.00
Operations and Maintenance 861,332.36
Student and Instruction Related Services 167,758.00
Total Depreciation Expense 2,208,012.00$
50

24000 Notes to Financial Statements (Cont'd)
Note 7: LONG-TERM OBLIGATIONS
During the fiscal year ended June 30, 2012, the following changes occurred in long-term obligations:
Principal Principal
Outstanding Outstanding Due Within
July 1, 2011 Additions Reductions June 30, 2012 One Year
Governmental Activities:
General Obligation Bonds 26,520,000.00$ (2,970,000.00)$ 23,550,000.00$ 3,040,000.00$
Unamortized Costs:
Premium on Bonds 203,303.20 (25,412.90) 177,890.30 25,412.90
Loss on Refunding (1,043,170.91) 130,396.37 (912,774.54) (130,396.37)
Obligations under Capital
Lease 229,211.26 137,450.00$ (118,455.62) 248,205.64 82,864.49
Other Post Employment
Benefits 1,530,715.00 1,530,715.00
Compensated Absences 2,362,306.59 55,819.35 (25,412.94) 2,392,713.00 14,967.00
Governmental Activity
Long-term Liabilities 29,802,365.14$ 193,269.35$ (3,008,885.09)$ 26,986,749.40$ 3,032,848.02$
Business Type Activities:
Compensated Absences 45,772.78$ 16,642.87$ (8,719.65)$ 53,696.00$ -
Bonds Payable - Bonds and loans are authorized in accordance with State law by the voters of the municipality through referendums. All bonds are retired in serial installments within the statutory period of usefulness. Bonds issued by the School District are general obligation bonds.
On February 24, 2005, the School District issued $31,685,000.00 of refunding bonds at interest rates varying from 3.00% to 4.00%. The final maturity of these bonds is April 1, 2019. The bonds will be paid from property taxes.
Principal and interest due on bonds outstanding is as follows:
Fiscal Year
Ending June 30, Principal Interest Total
2013 3,040,000.00$ 945,455.00$ 3,985,455.00$
2014 3,130,000.00 816,255.00 3,946,255.00
2015 3,230,000.00 677,273.76 3,907,273.76
2016 3,295,000.00 560,967.50 3,855,967.50
2017 3,475,000.00 432,462.50 3,907,462.50
2018-2019 7,380,000.00 444,400.00 7,824,400.00
23,550,000.00$ 3,876,813.76$ 27,426,813.76$
Bonds Authorized but not Issued - As of June 30, 2012, the School District had no authorizations to issue additional bonded debt.
51
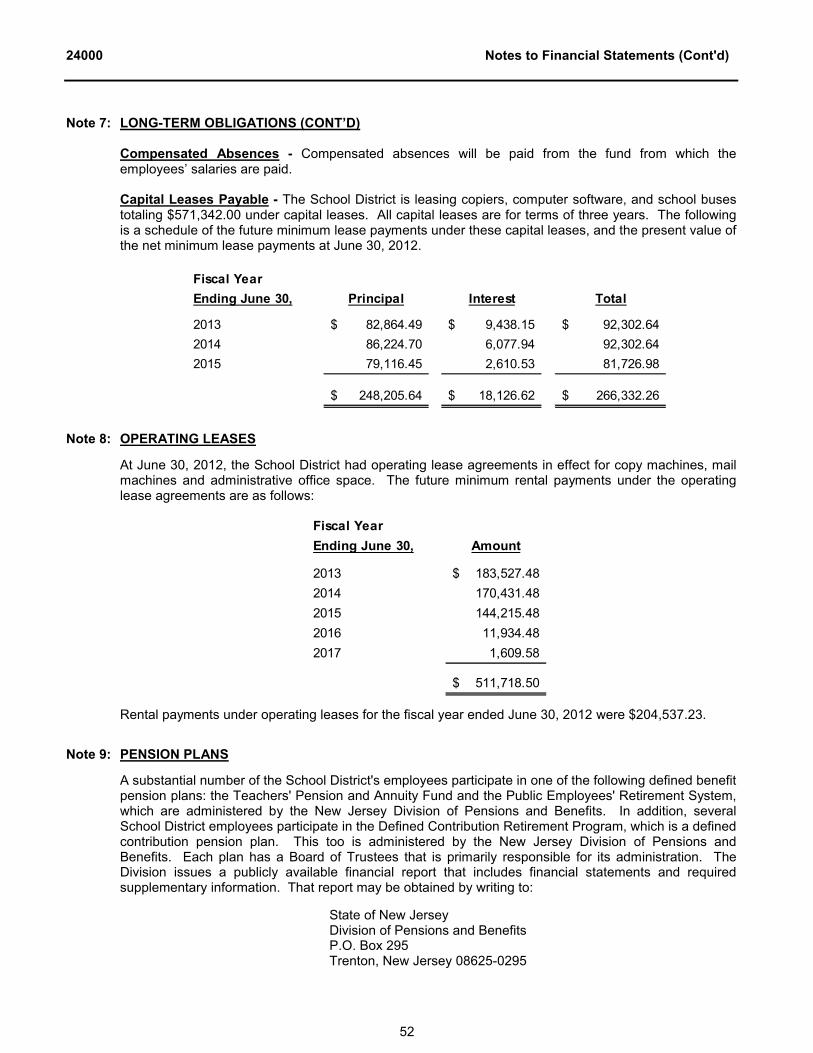
24000 Notes to Financial Statements (Cont'd)
Note 7: LONG-TERM OBLIGATIONS (CONT’D)
Compensated Absences - Compensated absences will be paid from the fund from which the employees’ salaries are paid.
Capital Leases Payable - The School District is leasing copiers, computer software, and school busestotaling $571,342.00 under capital leases. All capital leases are for terms of three years. The following is a schedule of the future minimum lease payments under these capital leases, and the present value of the net minimum lease payments at June 30, 2012.
Fiscal Year
Ending June 30, Principal Interest Total
2013 82,864.49$ 9,438.15$ 92,302.64$
2014 86,224.70 6,077.94 92,302.64
2015 79,116.45 2,610.53 81,726.98
248,205.64$ 18,126.62$ 266,332.26$
Note 8: OPERATING LEASES
At June 30, 2012, the School District had operating lease agreements in effect for copy machines, mail machines and administrative office space. The future minimum rental payments under the operating lease agreements are as follows:
Fiscal Year
Ending June 30, Amount
2013 183,527.48$
2014 170,431.48
2015 144,215.48
2016 11,934.48
2017 1,609.58
511,718.50$
Rental payments under operating leases for the fiscal year ended June 30, 2012 were $204,537.23.
Note 9: PENSION PLANS
A substantial number of the School District's employees participate in one of the following defined benefit pension plans: the Teachers' Pension and Annuity Fund and the Public Employees' Retirement System, which are administered by the New Jersey Division of Pensions and Benefits. In addition, several School District employees participate in the Defined Contribution Retirement Program, which is a defined contribution pension plan. This too is administered by the New Jersey Division of Pensions and Benefits. Each plan has a Board of Trustees that is primarily responsible for its administration. The Division issues a publicly available financial report that includes financial statements and required supplementary information. That report may be obtained by writing to:
State of New JerseyDivision of Pensions and BenefitsP.O. Box 295Trenton, New Jersey 08625-0295
52

24000 Notes to Financial Statements (Cont'd)
Note 9: PENSION PLANS (CONT’D)
Teachers' Pension and Annuity Fund - The Teachers' Pension and Annuity Fund (TPAF) is a cost-sharing contributory defined benefit pension plan which was established as of January 1, 1955, under the provisions of N.J.S.A. 18A:66. The TPAF provides retirement, death, and disability, and medical benefits to qualified members. Vesting and benefit provisions are established by N.J.S.A. 18A:66.
The contribution requirements of plan members are determined by State statute. In accordance with Chapters 113, 114 and 115, P.L. 1997, plan members enrolled in the TPAF were required to contribute 5% of their annual covered salary. Effective July 1, 2007, however, in accordance with Chapter 92, P.L. 2007 and Chapter 103, P.L. 2007, plan members were required to contribute 5.5% of their annual covered salary. For employees who were enrolled in the retirement system prior to July 1, 2007, the increase was effective with the payroll period that began immediately after July 1, 2007. Pursuant to the provisions of Chapter 78, P.L. 2011, effective October 1, 2011, the active member contribution rate was increased to 6.5%. An additional 1.0% increase will be phased-in over seven years beginning on July 1, 2012. The State Treasurer has the right under the current law to make temporary reductions in member rates based on the existence of surplus pension assets in the retirement system; however, statute also requires the return to the normal rate when such surplus pension assets no longer exist.
Under current statute, all employer contributions are made by the State of New Jersey on-behalf of the School District and all other related non-contributing employers. No normal or accrued liability contribution by the district has been required over several preceding fiscal years.
Public Employees' Retirement System - The Public Employees' Retirement System (PERS) is a cost-sharing multiple-employer defined benefit pension plan which was established as of January 1, 1955. The PERS provides retirement, death, and disability, and medical benefits to qualified members. Vesting and benefit provisions are established by N.J.S.A. 43:15A and 43:3B.
The contribution requirements of plan members are determined by State statute. In accordance with Chapter 62, P.L. 1994, plan members enrolled in the Public Employees' Retirement System were required to contribute 5% of their annual covered salary. Effective July 1, 2008, however, in accordance with Chapter 92, P.L. 2007 and Chapter 103, P.L. 2007, plan members are required to contribute 5.5% of their annual covered salary. For employees enrolled in the retirement system prior to July 1, 2008, the increase is effective with the payroll period that begins immediately after July 1, 2008. Pursuant to the provisions of Chapter 78, P.L. 2011, effective October 1, 2011, the active member contribution rate was increased to 6.5%. An additional 1.0% increase will be phased-in over seven years beginning on July 1, 2012. The State Treasurer has the right under the current law to make temporary reductions in member rates based on the existence of surplus pension assets in the retirement system; however, the statute also requires the return to the normal rate when such surplus pension assets no longer exist.
The School District is billed annually for its normal contribution plus any accrued liability. The School District's contributions, equal to the required contribution for each fiscal year, were as follows:
Public Employees Retirement System
Non-Contributory Paid by
Fiscal Normal Accrued Group Life Total School
Year Contribution Liability Insurance Liability District
2012 352,185.00$ 704,371.00$ 67,315.00$ 1,123,871.00$ 1,123,871.00$
2011 383,625.00 611,280.00 75,562.00 1,070,467.00 1,070,467.00
2010 327,963.00 421,395.00 103,919.00 853,277.00 853,277.00
53

24000 Notes to Financial Statements (Cont'd)
Note 9: PENSION PLANS (CONT’D)
Defined Contribution Retirement Program - The Defined Contribution Retirement Program (DCRP) is a cost-sharing multiple-employer defined contribution pension fund which was established on July 1, 2007, under the provisions of Chapter 92, P.L. 2007 and Chapter 103, P.L. 2007 (N.J.S.A. 43:15C-1 et.seq.), and expanded under the provisions of Chapter 89, P.L. 2008 and Chapter 1, P.L. 2010. The Defined Contribution Retirement Program Board oversees the DCRP, which is administered for the Division of Pensions and Benefits by Prudential Financial. The DCRP provides eligible members, and their beneficiaries, with a tax-sheltered, defined contribution retirement benefit, along with life insurance and disability coverage. Vesting and benefit provisions are established by N.J.S.A. 43:15C-1 et. seq.
The contribution requirements of plan members are determined by State statute. In accordance with Chapter 92, P.L. 2007 and Chapter 103, P.L. 2007, plan members are required to contribute 5.5% of their annual covered salary. In addition to the employee contributions, the School District’s contributionamounts for each pay period are transmitted to Prudential Financial not later than the fifth business day after the date on which the employee is paid for that pay period.
The School District's contributions equal to the required contribution for each fiscal year, was as follows:
Defined Contribution Retirement Program
Paid by
Fiscal Normal Accrued Total School
Year Contribution Liability Liability District
2012 4,208.14$ 4,208.14$ 4,208.14$
2011 None
2010 None
Note 10:POST-RETIREMENT BENEFITS
P.L. 1987, c.384 of P.L. 1990, c.6 required Teachers’ Pensions and Annuity Fund (TPAF) and the Public Employees’ Retirement System (PERS), respectively, to fund post-retirement medical benefits for those State employees who retire after accumulating 25 years of credited service or on a disability retirement. P.L. 2007, c.103 amended the law to eliminate the funding of postemployment medical benefits through the TPAF and PERS. It created separate funds outside of the pension plans for the funding and payment of postemployment medical benefits for retired State employees and retired educational employees. As of June 30, 2011, there were 93,323 retirees eligible for postemployment medical benefits. The cost of these benefits is funded through contributions by the State in accordance with P.L. 1994, c.62. Funding of post-retirement medical premiums changed from a pre-funding basis to a pay-as-you-go basis beginning in Fiscal Year 1994.
The State is also responsible for the cost attributable to P.L. 1992 c.126, which provides free health benefits to members of PERS and the Alternate Benefit Program who retire from a board of education or county college with 25 years of service. The State paid $144 million toward Chapter 126 benefits for 15,709 eligible retired members in fiscal year 2011.
54

24000 Notes to Financial Statements (Cont'd)
Note 11:OTHER POSTEMPLOYMENT BENEFITS (OTHER THAN PENSION)
Plan Description - The School District provides dental insurance benefits for retired employees, where such benefits are established and amended by the School District’s Board of Education. The School District’s plan, which is a single-employer post-employment healthcare plan, provides dental coverage for retired employees with twenty-five years of service. The Plan is administered by the School District; therefore, premium payments are made directly by the School District to the insurance carriers.
Funding Policy - Employees become eligible for retirement benefits based on hire date and years of service. There are no contribution requirements for the plan members. The School District established the requirements and they may be amended by the School District’s Board of Education. The School District presently funds its current retiree postemployment benefit costs on a “pay-as-you-go” basis. The School District’s contributions to the Plan for the fiscal year ended June 30, 2012 was $101,243.00.
Annual OPEB Cost and Net OPEB Obligation - In accordance with Statement No. 45 of the Governmental Accounting Standards Board, the School District is required to expense the annual required contribution of the employer (ARC), an amount actuarially determined in accordance with the parameters of Statement No. 45. The ARC represents a level of funding that, if paid on an ongoing basis, is projected to cover normal cost each year and amortize any unfunded actuarial liabilities (or funding excess) over a period not to exceed thirty (30) years. The ARC includes the costs of both current and future retirees. As indicated, the School District has funded the cost of existing retirees in the amount of $101,243.00, and in fiscal year 2012, the School District has accrued the benefit costs for future eligible employees, but has not yet begun funding this outstanding liability.
The School District’s annual required contribution (ARC), the interest on the net OPEB obligation (asset), the adjustment to the ARC, the increase or decrease in the net OPEB obligation, the net OPEB obligation, and the percentage of annual OPEB cost contributed to the plan for fiscal years 2012, 2011, and 2010 are as follows:
2012 2011 2010
Annual Required Contribution (arc) 173,450.00$ 173,450.00$ 47,590.00$
Interest on Net OPEB Obligation 78,616.00 78,616.00 57,108.84
Adjustment to Annual Required Contribution (150,823.00) (46,018.00) (6,587.56)
Annual OPEB Cost 101,243.00 206,048.00 98,111.28
Contributions Made (101,243.00) (103,054.00) (98,111.28)
Decrease in Net OPEB Obligation - 102,994.00 -
Net OPEB Obligation, July 1 1,530,715.00 1,427,721.00 1,427,721.00
Net OPEB Obligation, June 30 1,530,715.00$ 1,530,715.00$ 1,427,721.00$
Percentage of Annual OPEB Cost Contributed 100% 50% 100%
55

24000 Notes to Financial Statements (Cont'd)
Note 11:OTHER POSTEMPLOYMENT BENEFITS (OTHER THAN PENSION) (CONT’D)
Funded Status and Funding Progress - As of June 30, 2011, the most recent actuarial valuation date, the School District’s Plan was 0.0% funded. The actuarial accrued liability for benefits was $1,530,715.00 and the actuarial value of Plan assets was $0.00, resulting in an unfunded actuarial accrued liability (UAAL) of $1,530,715.00.
Actuarial valuations of an ongoing plan involve estimates of the value of reported amounts and assumptions about the probability of occurrence of events far into the future. Examples include assumptions about future employment, mortality, and the healthcare cost trend. Amounts determined regarding the funded status of the Plan and the annual required contributions of the employer are subject to continual revision as actual results are compared with past expectations and new estimates are made about the future. The schedule of funding progress, presented as required supplementary information following the notes to the financial statements, presents multiyear trend information that shows whether the actuarial value of the Plan assets is increasing or decreasing over time relative to the actuarial accrued liabilities for benefits.
Actuarial Methods and Assumptions - Projections of benefits for financial reporting purposes are based on the substantive plan (the plan as understood by the employer and the plan members) and include the types of benefits provided at the time of each valuation and the historical pattern of sharing of benefit costs between the employer and plan members to that point. The actuarial methods and assumptions used include techniques that are designed to reduce the effects of short-term volatility in actuarial accrued liabilities and the actuarial value of assets, consistent with the long-term perspective of the calculations.
In the June 30, 2011 actuarial valuation, the projected unit credit actuarial cost method was used. The actuarial assumptions included an annual healthcare cost trend rate of 5.0% initially, reduced by decrements to an ultimate rate of 5.0% after ten years. Both rates included a 5.0% inflation assumption.
Note 12:ON-BEHALF PAYMENTS
For the fiscal year ended June 30, 2012, the School District has recognized as revenues and expenditures on-behalf payments made by the State for normal costs and post-retirement costs related to TPAF. The amounts recognized as revenues and expenditures for normal costs and post-retirement costs were $1,209,313.00 and $2,431,036.00, respectively.
Note 13:RISK MANAGEMENT
The School District is exposed to various risks of loss related to torts; theft of, damage to, and destruction of assets; errors and omissions; injuries to employees; and natural disasters.
Property and Liability Insurance - The School District maintains commercial insurance coverage for property, liability, and surety bonds. A complete schedule of insurance coverage can be found in the Statistical Section of this Comprehensive Annual Financial Report.
New Jersey Unemployment Compensation Insurance - The School District has elected to fund its New Jersey Unemployment Compensation Insurance under the "Benefit Reimbursement Method". Under this plan, the School District is required to reimburse the New Jersey Unemployment Trust Fund for benefits paid to its former employees and charged to its account with the State. The School District is billed quarterly for amounts due to the State.
56

24000 Notes to Financial Statements (Cont'd)
Note 13:RISK MANAGEMENT (CONT’D)
The following is a summary of School District contributions, reimbursements to the State for benefits paid and the ending balance of the School District's expendable trust fund for the current and previous two fiscal years:
School
Fiscal Year District Employee Amount Ending
Ended June 30, Contributions Contributions Reimbursed Balance
2012 - 76,096.66$ 197,856.63$ 511,817.86$
2011 - 72,308.97 502,545.25 627,135.50
2010 - 83,009.93 248,733.21 1,047,126.00
Self-Insurance Plan - The School District has adopted a plan of self-insurance for workers' compensation insurance. As of June 30, 2012, the records of the administrator of the plan show $438,523.00 of potential claims. The District has established $219,261.50 of the pending claims as accounts payable as of June 30, 2012. Additionally, the School District is required fund potential claims up to $400,000.00 per any one accident. Claims greater than this amount are covered by an excess workers' compensation insurance policy. Any additional funds required for claims in excess of the amount payable will be paid and charged to the 2012-2013 or future budgets.
Joint Insurance Pool - The School District is a member of the Burlington and Camden CountyEducators Insurance Consortium, sub-fund of the New Jersey School Boards Association Group. The Fund provides its members with the following coverage:
PropertyComprehensive General LiabilityCommercial Inland MarineBoiler and MachineryCrimeAutomobileEnvironmental Impairment LiabilitySchool District Legal Liability
Contributions to the Fund, including a reserve for contingencies, are payable in two installments and are based on actuarial assumptions determined by the Fund's actuary. The Fund Board of Trustees may order additional assessments to supplement the Fund's claim, loss retention, or administrative accounts to assure the payment of the Fund's obligations.
The Fund publishes its own financial report for the fiscal year ended June 30, 2012, which can be obtained from:
New Jersey School Boards Association Insurance Group450 Veterans DriveBurlington, New Jersey 08016
57

24000 Notes to Financial Statements (Cont'd)
Note 14:DEFERRED COMPENSATION
The School District offers its employees a choice of six deferred compensation plans created in accordance with Internal Revenue Code Sections 403(b) and 457. The plans, which are administered by the entities listed below, permit participants to defer a portion of their salary until future years. Amounts deferred under the plans are not available to employees until termination, retirement, death, or unforeseeable emergency. The plan administrators are as follows:
Lincoln Investment PlanningAmeriprise Financial
SiracusaMidland NationalVanguard GroupValic Investments
Note 15:COMPENSATED ABSENCES
The School District accounts for compensated absences (e.g., unused vacation, sick leave) as directed by Governmental Accounting Standards Board Statement No. 16 (GASB 16), “Accounting for Compensated Absences”. A liability for compensated absences attributable to services already rendered and not contingent on a specific event that is outside the control of the employer and employee is accrued as employees earn the rights to the benefits.
School District employees participate in one of six collective bargaining units with varying provisions for accumulation of unused sick leave. Payment for unused sick leave does not occur until retirement from the District of in some cases upon death of the employee. The accounting and the accumulated days is maintained by the District.
The liability for vested compensated absences is recorded within those funds as the benefits accrue to employees. As of June 30, 2012, the liability for compensated absences in the governmental activities and proprietary fund types was $2,392,713.00 and $53,696.00, respectively.
Note 16: INTERFUND BALANCES AND TRANSFERS
The following interfund balances were recorded on the various balance sheets as June 30, 2012:
Interfunds Interfunds
Fund Receivable Payable
General 2,689,635.72$ 72,138.38$
Special Revenue 1,830,503.98
Permanent 1,003.83
Proprietary 795,235.31
Fiduciary 101,390.50 94,152.38
2,792,030.05$ 2,792,030.05$
The interfund receivables and payables above predominately resulted from payments made by certain funds on behalf of other funds. During the fiscal year 2013, the District expects to liquidate such interfunds, depending upon the availability of cash flow.
58

24000 Notes to Financial Statements (Cont'd)
Note 17:DEFICIT UNRESTRICTED NET ASSETS
The School District had a deficit in unrestricted net assets of $3,928,760.23 as of June 30, 2012. This deficit was mostly attributable to the allocation of the unpaid liability for compensated absences andother postemployment benefits.
Note 18:DEFICIT RESTRICTED NET ASSETS
The School District had a deficit in restricted net assets for debt service of $238,989.98 as of June 30, 2012. This deficit was attributable to the allocation of accrued interest.
Note 19:FUND BALANCES
NONSPENDABLE
As stated in note 1, the Nonspendable fund balance classification includes amounts that cannot be spent because they are either not in spendable form or are legally or contractually required to be maintained intact. The nonspendable fund balances of the School District, as of June 30, 2012, are summarized as follows:
General Fund - The School District records inventory utilizing the consumption method of accounting. As a result, because inventory is recorded as an asset, even though it does not represent expendable financial resources, it is necessary to set aside fund balance at fiscal year-end by an amount equal to the carrying value of the inventory. As of June 30, 2012, the nonspendable fund balance was $225,984.14.
Permanent Fund - The School District was the beneficiary of a distribution from an estate. In accordance with the terms of the distribution, the principal is to be invested upon good security, and the income only, derived there from, is to be used solely for student scholarships. As of June 30, 2012, the nonspendable fund balance amount was $8,000.00.
RESTRICTED
As stated in note 1, the restricted fund balance classification includes amounts that are restricted to specific purposes. Such restrictions, or constraints, are placed on the use of resources by either of the following: (1) externally imposed by creditors, grantors, contributors, or laws or regulations of other governments; or (2) imposed by law through constitutional provisions or enabling legislation. Specific restrictions of the School District’s fund balance are summarized as follows:
General Fund -
For Legally Restricted Appropriations – As a result of unexpended capital outlay funds transferred from the capital projects fund, the School District has legally restricted fund balance in the amount of $16,227.00.
For Excess Surplus - In accordance with N.J.S.A. 18A:7F-7, as amended, the designation of restricted fund balance - excess surplus is the result of a required calculation pursuant to the New Jersey Comprehensive Educational Improvement and Financing Act of 1996 (CEIFA). New Jersey school districts are required to reserve general fund balance at the fiscal year end of June 30 if they did not appropriate a required minimum amount as budgeted fund balance in their subsequent years’ budget. The excess fund balance at June 30, 2012 of $4,559,061.66 was generated during 2010-2011 has been restricted and designated for utilization in the 2012-2013budget.
59

24000 Notes to Financial Statements (Cont'd)
Note 19:FUND BALANCES (CONT’D)
RESTRICTED (CONT’D)
General Fund (Cont’d) -
For Capital Reserve Account - As of June 30, 2012, the balance in the capital reserve account is $6,412,953.84. These funds are restricted for future capital outlay expenditures for capital projects in the School District’s approved Long Range Facilities Plan (LRFP).
For Emergency Reserve - As of June 30, 2012, the balance in the emergency reserve is $432,583.40. These funds are restricted for the purpose of financing unanticipated general fund expenditures required for a thorough and efficient education in accordance with N.J.S.A. 18A:7F-41c(1).
Capital Projects Fund - On July 24, 2009 the District received approval from the Department of Education for window replacement at the Middle School. The project was funded with a combination of Grants from the State of New Jersey and transfers from Capital Outlay. In addition, the School District approved two additional projects upon adoption of the annual budget. These projects include window replacement at the Senior High School and demolition of Central School. As of June 30, 2012, the restricted fund balance amount was $3,581,605.43, of which $694,853.25 was restricted for reserve for encumbrances.
Debt Service Fund - As of June 30, 2012, $0.03 of debt service fund balance is restricted for future debt service expenditures.
Permanent Fund - Other Purposes - The School District was the beneficiary of a distribution from an estate. In accordance with the terms of the distribution, any interest income derived frompermanent fund principal is to be used solely for student scholarships. As of June 30, 2012, the restricted fund balance amount was $654.13.
ASSIGNED
As stated in note 1, the assigned fund balance classification includes amounts that are constrained by the School District’s intent to be used for specific purposes, but are neither restricted nor committed. Specific assignments of the School District’s fund balance are summarized as follows:
General Fund -
For Subsequent Year’s Expenditures - The School District has appropriated and included as anticipated revenue for the fiscal year ending June 30, 2013 $272,948.14 of general fund balance at June 30, 2012.
Other Purposes - As of June 30, 2012, the School District had $1,170,554.27 of encumbrances outstanding for purchase orders and contracts signed by the School District, but not completed,as of the close of the fiscal year.
60

24000 Notes to Financial Statements (Cont'd)
Note 19:FUND BALANCES (CONT’D)
UNASSIGNED
As stated in note 1, the unassigned fund balance classification represents fund balance that has not been restricted, committed, or assigned to specific purposes. The School District’s unassigned fund balance is summarized as follows:
Special Revenue Fund - As of June 30, 2012, the fund balance of the special revenue fund was$647,061.99.
Note 20:LITIGATION
The School District is a defendant in several legal proceedings that are in various stages of litigation. It is believed that the outcome, or exposure to the School District, from such litigation is either unknown or potential losses, if any, would not be material to the financial statements.
61

REQUIRED SUPPLEMENTARY INFORMATIONPART II
62

BUDGETARY COMPARISON SCHEDULES
63

24000 Exhibit C-1TOWNSHIP OF PENNSAUKEN SCHOOL DISTRICT
Required Supplementary InformationBudgetary Comparison Schedule
General FundFor the Fiscal Year Ended June 30, 2012
VarianceOriginal Budget Final Positive (Negative)Budget Modifications Budget Actual Final to Actual
REVENUES:Local Sources:
Local Tax Levy 34,631,347.00$ 34,631,347.00$ 34,631,347.00$ Tuition 613,860.00 613,860.00 1,072,590.56 458,730.56$ Interest Earned on Capital Reserve Funds 25,861.93 25,861.93Interest Earned on Emergency Reserve Funds 4,302.49 4,302.49Unrestricted Miscellaneous Revenues 423,113.00 423,113.00 460,255.32 37,142.32
Total - Local Sources 35,668,320.00 - 35,668,320.00 36,194,357.30 526,037.30
State Sources:Equalization Aid 41,330,163.00 41,330,163.00 41,330,163.00Special Education Aid 2,838,376.00 2,838,376.00 2,838,376.00Security Aid 473,689.00 473,689.00 1,385,430.00 911,741.00Extraordinary Aid 605,452.00 605,452.00Non-Public Transportation Aid 62,401.86 62,401.86Other State Aid 246.00 246.00Reimbursed TPAF Social Security Contributions (non-budgeted) 2,658,510.40 2,658,510.40On-behalf TPAF Medical Contributions (non-budgeted) 2,431,036.00 2,431,036.00On-behalf TPAF Pension Contributions (non-budgeted) 1,209,313.00 1,209,313.00
Total - State Sources 44,642,228.00 - 44,642,228.00 52,520,928.26 7,878,700.26
Federal Sources:Education Jobs Fund 1,600,166.00 50,130.00$ 1,650,296.00 1,650,296.00Medicaid Administrative Claiming Aid 14,980.15 14,980.15SEMI -- Medicaid Initiative 180,176.00 180,176.00 183,733.72 3,557.72
Total - Federal Sources 1,780,342.00 50,130.00 1,830,472.00 1,849,009.87 18,537.87
Total Revenues 82,090,890.00 50,130.00 82,141,020.00 90,564,295.43 8,423,275.43
(Continued)
64

24000 Exhibit C-1TOWNSHIP OF PENNSAUKEN SCHOOL DISTRICT
Required Supplementary InformationBudgetary Comparison Schedule
General FundFor the Fiscal Year Ended June 30, 2012
VarianceOriginal Budget Final Positive (Negative)Budget Modifications Budget Actual Final to Actual
EXPENDITURES:GENERAL CURRENT EXPENSE:
Regular Programs - Instruction:Salaries of Teachers:
Kindergarten 1,768,641.00$ (483,110.03)$ 1,285,530.97$ 1,253,620.36$ 31,910.61$ Grades 1 - 5 9,158,628.00 (987,184.47) 8,171,443.53 8,016,771.31 154,672.22Grades 6 - 8 5,367,348.00 301,087.58 5,668,435.58 5,507,337.88 161,097.70Grades 9 - 12 7,696,437.00 (37,479.59) 7,658,957.41 7,475,396.71 183,560.70
Regular Programs - Home Instruction:Salaries of Teachers 55,000.00 6,729.75 61,729.75 61,729.75Purchased Professional - Educational Services 37,000.00 503.97 37,503.97 36,021.97 1,482.00
Regular Programs - Undistributed Instruction:Other Salaries for Instruction 381,549.00 (1,233.97) 380,315.03 355,943.62 24,371.41Purchased Professional - Educational Services 55,000.00 (32,100.00) 22,900.00 14,766.87 8,133.13Other Purchased Services 19,000.00 19,000.00 12,814.46 6,185.54General Supplies 567,500.00 179,060.96 746,560.96 661,390.43 85,170.53Textbooks 313,500.00 (46,000.00) 267,500.00 209,868.11 57,631.89Other Objects 8,500.00 8,500.00 1,060.85 7,439.15
Total - Regular Programs 25,428,103.00 (1,099,725.80) 24,328,377.20 23,606,722.32 721,654.88
Special Education:Cognitive Mild:
Salaries of Teachers 169,269.00 (51,283.76) 117,985.24 63,551.79 54,433.45Other Salaries for Instruction 18,573.00 18,573.00 10,297.40 8,275.60General Supplies 750.00 750.00 134.10 615.90Textbooks 250.00 250.00 250.00
Total - Cognitive Mild 188,842.00 (51,283.76) 137,558.24 73,983.29 63,574.95
Learning and/or Language Disabilities:Salaries of Teachers 2,048,142.00 120,090.38 2,168,232.38 2,107,754.42 60,477.96Other Salaries for Instruction 365,298.00 19,909.62 385,207.62 384,923.82 283.80General Supplies 38,000.00 38,000.00 33,418.26 4,581.74Textbooks 20,000.00 20,000.00 19,742.37 257.63
Total - Learning and/or Language Disabilities 2,471,440.00 19,909.62 2,611,440.00 2,545,838.87 65,601.13
Behavioral Disabilities:Salaries of Teachers 965,765.00 (100,000.00) 865,765.00 795,170.22 70,594.78Other Salaries for Instruction 135,582.00 135,582.00 108,720.77 26,861.23General Supplies 10,000.00 10,000.00 7,216.55 2,783.45Textbooks 12,000.00 12,000.00 12,000.00Other Objects 650.00 650.00 39.90 610.10
Total - Behavioral Disabilities 1,123,997.00 (100,000.00) 1,023,997.00 911,147.44 112,849.56
(Continued)
65

24000 Exhibit C-1TOWNSHIP OF PENNSAUKEN SCHOOL DISTRICT
Required Supplementary InformationBudgetary Comparison Schedule
General FundFor the Fiscal Year Ended June 30, 2012
VarianceOriginal Budget Final Positive (Negative)Budget Modifications Budget Actual Final to Actual
EXPENDITURES (CONT'D):GENERAL CURRENT EXPENSE (CONT'D):
Special Education(Cont'd):Multiple Disabilities:
Salaries of Teachers 266,578.00$ 10,000.00$ 276,578.00$ 268,074.60$ 8,503.40$ Other Salaries for Instruction 53,404.00 53,404.00 42,776.10 10,627.90General Supplies 18,000.00 844.75 18,844.75 16,620.48 2,224.27Textbooks 4,500.00 4,500.00 4,500.00Other Objects 150.00 150.00 125.00 25.00
Total - Multiple Disabilities 342,632.00 844.75 353,476.75 327,596.18 25,880.57
Resource Room/Center:Salaries of Teachers 2,279,300.00 (294,573.77) 1,984,726.23 1,935,106.46 49,619.77Other Salaries for Instruction 53,514.72 53,514.72 52,326.22 1,188.50General Supplies 18,000.00 18,000.00 17,122.20 877.80Textbooks 12,000.00 (5,514.72) 6,485.28 2,569.30 3,915.98
Total - Resource Room/Center 2,309,300.00 (5,514.72) 2,062,726.23 2,007,124.18 55,602.05
Autism:Salaries of Teachers 56,763.00 4,000.00 60,763.00 58,524.90 2,238.10Other Salaries for Instruction 11,313.00 22,000.00 33,313.00 32,341.47 971.53General Supplies 2,000.00 2,000.00 1,686.75 313.25
Total - Autism 70,076.00 22,000.00 96,076.00 92,553.12 3,522.88
Preschool Disabilities - Part-Time:Salaries of Teachers - 169,150.00 169,150.00 164,850.00 4,300.00
Preschool Disabilities - Full-Time:Salaries of Teachers - 54,571.43 54,571.43 53,170.01 1,401.42
Home Instruction:Salaries of Teachers 35,000.00 35,000.00 3,898.50 31,101.50Purchased Professional - Educational Services 75,000.00 75,000.00 40,109.38 34,890.62
Total - Home Instruction 110,000.00 - 110,000.00 44,007.88 65,992.12
Total - Special Education 6,616,287.00 109,677.32 6,618,995.65 6,220,270.97 398,724.68
Basic Skills / Remedial - Instruction:Salaries of Teachers - 124,000.00 124,000.00 106,490.28 17,509.72
Bilingual Education:Salaries of Teachers 375,256.00 (32,342.47) 342,913.53 330,719.98 12,193.55Purchased Professional - Educational Services 4,200.00 4,200.00 4,200.00Other Purchased Services 250.00 250.00 250.00General Supplies 1,500.00 (1,000.00) 500.00 500.00
Total - Bilingual Education: 377,006.00 (29,142.47) 347,863.53 330,719.98 17,143.55
(Continued)
66

24000 Exhibit C-1TOWNSHIP OF PENNSAUKEN SCHOOL DISTRICT
Required Supplementary InformationBudgetary Comparison Schedule
General FundFor the Fiscal Year Ended June 30, 2012
VarianceOriginal Budget Final Positive (Negative)Budget Modifications Budget Actual Final to Actual
EXPENDITURES (CONT'D):GENERAL CURRENT EXPENSE (CONT'D):
School Sponsored Cocurricular Activities - Instruction:Salaries 198,855.00$ 54,940.00$ 253,795.00$ 253,779.00$ 16.00$ Purchased Services 9,000.00 1,360.00 10,360.00 5,066.92 5,293.08 Supplies and Materials 15,000.00 23,388.90 38,388.90 35,998.95 2,389.95 Other Objects 16,000.00 1,189.70 17,189.70 16,202.65 987.05
Total - School Sponsored Cocurricular Activities - Instruction 238,855.00 80,878.60 319,733.60 311,047.52 8,686.08
School Sponsored Athletics - Instruction:Salaries 413,536.00 (26,000.00) 387,536.00 384,941.82 2,594.18 Purchased Services 18,500.00 (4,500.00) 14,000.00 13,866.60 133.40 Supplies and Materials 79,800.00 9,129.00 88,929.00 87,054.81 1,874.19 Other Objects 20,000.00 20,000.00 19,046.50 953.50 Transfers to Cover Deficit 30,000.00 (30,000.00)
Total - School Sponsored Athletics - Instruction 561,836.00 (51,371.00) 510,465.00 504,909.73 5,555.27
Summer School Instruction:Salaries of Teachers 182,600.00 (34,381.00) 148,219.00 148,193.75 25.25Other Salaries for Instruction 17,424.00 1,791.00 19,215.00 19,215.00General Supplies 1,200.00 10,000.00 11,200.00 10,792.41 407.59
Total - Summer School Instruction 201,224.00 (22,590.00) 178,634.00 178,201.16 432.84
Alternative Education Program - InstructionSalaries of Teachers 106,560.00 108,505.25 215,065.25 215,065.25 Other Salaries for Instruction 57,960.00 (30,145.25) 27,814.75 21,425.75 6,389.00General Supplies 3,500.00 3,500.00 1,833.42 1,666.58
Total - Alternative Education Program - Instruction 168,020.00 78,360.00 246,380.00 238,324.42 8,055.58
Alternative Education Program - Support ServicesSalaries 31,680.00 - 31,680.00 30,318.00 1,362.00
Undistributed Expenditures - Instruction:Tuition to Other LEAs within the State - Regular 95,000.00 (2,850.00) 92,150.00 74,729.56 17,420.44 Tuition to Other LEAs within the State - Special 180,000.00 180,000.00 54,569.00 125,431.00Tuition to County Voc. School Dist. - Regular 712,500.00 (168,150.00) 544,350.00 544,350.00Tuition to County Voc. School Dist. - Special 171,000.00 171,000.00 171,000.00Tuition to CSSD & Reg. Day Schools 3,122,386.00 (135,743.20) 2,986,642.80 2,952,463.74 34,179.06Tuition to Private School for the Disabled within State 2,086,400.00 (299,798.80) 1,786,601.20 1,686,091.30 100,509.90Tuition to Private School for the Disabled & Other LEAs Outside State 146,000.00 146,000.00 121,512.00 24,488.00Tuition -- State Facilities 250,000.00 52,000.00 302,000.00 300,483.00 1,517.00Tuition -- Other 399,175.00 91,500.00 490,675.00 463,832.00 26,843.00
Total - Undistributed Expenditures - Instruction 6,991,461.00 (292,042.00) 6,699,419.00 6,369,030.60 330,388.40
Total - Instruction 40,614,472.00 (1,101,955.35) 39,405,547.98 37,896,034.98 1,509,513.00
(Continued)
67

24000 Exhibit C-1TOWNSHIP OF PENNSAUKEN SCHOOL DISTRICT
Required Supplementary InformationBudgetary Comparison Schedule
General FundFor the Fiscal Year Ended June 30, 2012
VarianceOriginal Budget Final Positive (Negative)Budget Modifications Budget Actual Final to Actual
EXPENDITURES (CONT'D):GENERAL CURRENT EXPENSE (CONT'D):
Undistributed Expenditures - Attendance and Social Work:Salaries 92,493.00$ 92,493.00$ 92,115.24$ 377.76$ Other Purchased Services 1,000.00 1,000.00 321.47 678.53Supplies and Materials 500.00 500.00 122.80 377.20
Total - Undistributed Expenditures - Attendance and Social Work 93,993.00 - 93,993.00 92,559.51 1,433.49
Health Services:Salaries 835,136.00 (22,470.00)$ 812,666.00 779,028.01 33,637.99Purchased Professional and Technical Services 50,000.00 50,000.00 50,000.00Other Purchased Services 2,000.00 2,000.00 480.00 1,520.00Supplies and Materials 15,000.00 15,000.00 14,957.22 42.78
Total - Health Services 902,136.00 (22,470.00) 879,666.00 844,465.23 35,200.77
Other Support Services - Students - Related Services:Salaries 635,891.00 3,000.00 638,891.00 627,309.41 11,581.59Purchased Professional - Educational Services 185,000.00 185,000.00 102,536.00 82,464.00Supplies and Materials 7,000.00 7,000.00 4,706.27 2,293.73
Total - Other Support Services-Students-Related Services 827,891.00 3,000.00 830,891.00 734,551.68 96,339.32
Other Support Services - Students - Extra Services:Salaries 477,909.00 (185,000.00) 292,909.00 260,253.35 32,655.65Purchased Professional - Educational Services 350,000.00 350,000.00 238,084.29 111,915.71
Total - Other Support Services - Students - Extra Services 827,909.00 (185,000.00) 642,909.00 498,337.64 144,571.36
(Continued)
68

24000 Exhibit C-1TOWNSHIP OF PENNSAUKEN SCHOOL DISTRICT
Required Supplementary InformationBudgetary Comparison Schedule
General FundFor the Fiscal Year Ended June 30, 2012
VarianceOriginal Budget Final Positive (Negative)Budget Modifications Budget Actual Final to Actual
EXPENDITURES (CONT'D):GENERAL CURRENT EXPENSE (CONT'D):
Undistributed Expenditures (Cont'd):Other Support Services - Students - Regular:
Salaries of Other Professional Staff 1,251,624.00$ 1,251,624.00$ 1,187,817.76$ 63,806.24$ Salaries of Secretarial and Clerical Assistants 99,938.00 99,938.00 66,920.88 33,017.12Purchased Professional - Educational Services 3,000.00 3,000.00 3,000.00Other Purchased Professional and Technical Services 50,000.00 50,000.00 44,000.00 6,000.00Supplies and Materials 32,500.00 32,500.00 19,856.73 12,643.27
Total - Other Support Services - Students - Regular 1,437,062.00 - 1,437,062.00 1,318,595.37 118,466.63
Other Support Services - Students - Special Services:Salaries of Other Professional Staff 1,366,149.00 2,200.00$ 1,368,349.00 1,280,372.10 87,976.90Salaries of Secretarial and Clerical Assistants 86,723.00 (2,200.00) 84,523.00 81,340.82 3,182.18Purchased Professional - Educational Services 60,000.00 600.00 60,600.00 49,444.28 11,155.72Miscellaneous Purchased Services 5,000.00 5,000.00 2,751.82 2,248.18Supplies and Materials 9,000.00 9,000.00 8,347.95 652.05
Total - Other Support Services - Students - Special Services 1,526,872.00 600.00 1,527,472.00 1,422,256.97 105,215.03
Improvement of Instructional Services:Salaries of Supervisors of Instruction 520,387.00 (25,000.00) 495,387.00 454,986.62 40,400.38 Salaries of Other Professional Staff 10,000.00 1,446.50 11,446.50 11,446.50Salaries of Secretarial and Clerical Assistants 33,000.00 33,000.00 25,921.08 7,078.92Other Purchased Services 5,000.00 (1,384.50) 3,615.50 255.00 3,360.50Supplies and Materials 3,000.00 (62.00) 2,938.00 1,511.50 1,426.50
Total - Improvement of Instruction Services 538,387.00 8,000.00 546,387.00 494,120.70 52,266.30
Educational Media Services/School Library:Salaries 395,726.00 45,811.17 441,537.17 435,297.29 6,239.88 Other Purchased Services 34,500.00 (3,106.17) 31,393.83 27,500.51 3,893.32 Supplies and Materials 63,500.00 (4,305.00) 59,195.00 46,398.44 12,796.56
Total - Educational Media Services/School Library 493,726.00 38,400.00 532,126.00 509,196.24 22,929.76
Instructional Staff Training Services:Salaries of Other Professional Staff 5,000.00 8,850.00 13,850.00 741.00 13,109.00Purchased Professional- Educational Services 25,999.00 25,999.00 25,998.50 0.50Other Purchased Services 1,500.00 13,151.00 14,651.00 12,971.19 1,679.81Supplies and Materials 1,500.00 (1,500.00)
Total - Instructional Staff Training Services 8,000.00 46,500.00 54,500.00 39,710.69 14,789.31
(Continued)
69

24000 Exhibit C-1TOWNSHIP OF PENNSAUKEN SCHOOL DISTRICT
Required Supplementary InformationBudgetary Comparison Schedule
General FundFor the Fiscal Year Ended June 30, 2012
VarianceOriginal Budget Final Positive (Negative)Budget Modifications Budget Actual Final to Actual
EXPENDITURES (CONT'D):GENERAL CURRENT EXPENSE (CONT'D):
Undistributed Expenditures (Cont'd):Support Services General Administration:
Salaries 429,614.00$ (50,974.00)$ 378,640.00$ 377,138.06$ 1,501.94$ Legal Services 135,000.00 (10,777.00) 124,223.00 81,254.07 42,968.93 Audit Fees 122,000.00 4,656.00 126,656.00 126,656.00Architectural/Engineering Services 60,000.00 44,627.02 104,627.02 101,914.23 2,712.79Other Purchased Professional Services 77,095.00 77,095.00 69,050.00 8,045.00Communications/Telephone/ Postage 206,000.00 206,000.00 145,215.74 60,784.26BOE Other Purchased Services 6,000.00 6,000.00 3,655.51 2,344.49Other Purchased Services 214,500.00 39,965.00 254,465.00 205,858.12 48,606.88General Supplies 173,300.00 (41,045.75) 132,254.25 116,688.29 15,565.96BOE In-House Training / Meeting Supplies 500.00 500.00 500.00Miscellaneous Expenditures 12,500.00 65,015.00 77,515.00 14,259.65 63,255.35BOE Membership Dues and Fees 30,000.00 30,000.00 28,033.95 1,966.05
Total - Support Services General Administration 1,389,414.00 128,561.27 1,517,975.27 1,269,723.62 248,251.65
Support Services School Administration:Salaries of Principals/Assistant Principals 1,790,406.00 2,967.72 1,793,373.72 1,783,340.42 10,033.30Salaries of Other Professional Staff 120,772.00 5,032.28 125,804.28 125,804.28Salaries of Secretarial and Clerical Assistants 720,290.00 (8,000.00) 712,290.00 702,190.47 10,099.53Other Salaries 110,544.00 110,544.00 106,276.03 4,267.97Other Purchased Services 10,500.00 10,500.00 1,150.60 9,349.40Supplies and Materials 57,000.00 57,000.00 38,594.92 18,405.08Other Objects 24,500.00 22.00 24,522.00 20,548.16 3,973.84
Total - Support Services School Administration 2,834,012.00 22.00 2,834,034.00 2,777,904.88 56,129.12
Central Services:Salaries 789,729.00 789,729.00 694,720.24 95,008.76Purchased Technical Services 49,000.00 19,470.00 68,470.00 67,114.75 1,355.25Miscellaneous Purchased Services 32,600.00 (14,889.81) 17,710.19 4,288.53 13,421.66Supplies and Materials 18,000.00 964.81 18,964.81 18,664.45 300.36Miscellaneous Expenditures 4,000.00 (75.00) 3,925.00 3,270.78 654.22
Total - Central Services 893,329.00 5,470.00 898,799.00 788,058.75 110,740.25
Administrative Information Technology:Salaries 312,049.00 (4,755.00) 307,294.00 305,733.54 1,560.46 Purchased Professional Services 1,000.00 (1,000.00)Purchased Technical Services 55,000.00 96,668.53 151,668.53 151,668.53Other Purchased Services 203,000.00 9,094.52 212,094.52 212,094.52Supplies and Materials 132,000.00 43,991.95 175,991.95 146,940.64 29,051.31
Total - Administrative Information Technology 703,049.00 144,000.00 847,049.00 816,437.23 30,611.77
(Continued)
70

24000 Exhibit C-1TOWNSHIP OF PENNSAUKEN SCHOOL DISTRICT
Required Supplementary InformationBudgetary Comparison Schedule
General FundFor the Fiscal Year Ended June 30, 2012
VarianceOriginal Budget Final Positive (Negative)Budget Modifications Budget Actual Final to Actual
EXPENDITURES (CONT'D):GENERAL CURRENT EXPENSE (CONT'D):
Undistributed Expenditures (Cont'd):Required Maintenance for School Facilities:
Salaries 1,093,561.00$ (42,000.00)$ 1,051,561.00$ 1,016,487.61$ 35,073.39$ Cleaning, Repair & Maintenance Services 212,430.00 (8,586.00) 203,844.00 156,888.01 46,955.99General Supplies 198,000.00 14,211.70 212,211.70 139,062.65 73,149.05
Total - Required Maintenance for School Facilities 1,503,991.00 (36,374.30) 1,467,616.70 1,312,438.27 155,178.43
Other Operation and Maintenance of Plant Services:Salaries 2,994,557.00 (7,000.00) 2,987,557.00 2,948,762.41 38,794.59Purchased Professional and Technical Services 210,157.00 150,640.00 360,797.00 360,787.02 9.98Cleaning, Repair and Maintenance Services 105,000.00 770.00 105,770.00 99,863.62 5,906.38Rental of Land & Building Other Than Lease Purchase Agreement 130,000.00 (1,013.00) 128,987.00 125,000.00 3,987.00Other Purchased Property Services 87,850.00 87,850.00 78,445.46 9,404.54Insurance 400,000.00 6,533.21 406,533.21 403,512.32 3,020.89Miscellaneous Purchased Services 3,500.00 3,500.00 3,500.00General Supplies 204,200.00 180,314.64 384,514.64 223,383.66 161,130.98Energy (Natural Gas & Electricity) 2,182,512.00 (595,128.88) 1,587,383.12 1,566,876.31 20,506.81Other Objects 7,000.00 4,100.00 11,100.00 10,145.70 954.30
Total - Other Operation and Maintenance of Plant Services 6,324,776.00 (260,784.03) 6,063,991.97 5,816,776.50 247,215.47
Undistributed Expenditures - Care & Upkeep of GroundsSalaries 441,884.00 (23,000.00) 418,884.00 396,989.32 21,894.68Cleaning, Repair and Maintenance Services 22,000.00 4,400.00 26,400.00 9,323.51 17,076.49General Supplies 70,000.00 (14,000.00) 56,000.00 50,230.29 5,769.71
Total - Care & Upkeep of Grounds 533,884.00 (32,600.00) 501,284.00 456,543.12 44,740.88
(Continued)
71

24000 Exhibit C-1TOWNSHIP OF PENNSAUKEN SCHOOL DISTRICT
Required Supplementary InformationBudgetary Comparison Schedule
General FundFor the Fiscal Year Ended June 30, 2012
VarianceOriginal Budget Final Positive (Negative)Budget Modifications Budget Actual Final to Actual
EXPENDITURES (CONT'D):GENERAL CURRENT EXPENSE (CONT'D):
Undistributed Expenditures (Cont'd):Student Transportation Services:
Salaries of Non-Instructional Aids 270,669.00$ (13,103.02)$ 257,565.98$ 227,171.61$ 30,394.37$ Salaries for Pupil Transportation (Between Home & School) - Regular 375,262.00 (4,826.77) 370,435.23 365,370.83 5,064.40 Salaries for Pupil Transportation (Between Home & School) - Special Education 609,020.00 16,553.32 625,573.32 607,035.60 18,537.72Salaries for Pupil Transportation (Other than Between Home & School) 200,000.00 200,000.00 185,249.09 14,750.91Salaries for Pupil Transportation (Between Home & School) - Non-Public School 50,752.00 1,376.47 52,128.47 50,115.18 2,013.29Management Fee - ESC & CTSA Transportation Program 43,560.00 43,560.00 29,786.45 13,773.55Other Purchased Professional and Technical Services 25,000.00 25,000.00 4,125.00 20,875.00Cleaning, Repair and Maintenance Services 35,000.00 2,496.20 37,496.20 32,419.19 5,077.01Lease Purchase Payments - School Buses 127,000.00 (30,000.00) 97,000.00 83,920.70 13,079.30Contracted Services (Between Home & School) - Vendors 850,000.00 (60,000.00) 790,000.00 782,069.74 7,930.26Contracted Services (Other Than Between Home & School) - Vendors 57,212.00 57,212.00 44,879.08 12,332.92Contracted Services (Special Education Students) - Vendors 55,000.00 344.00 55,344.00 13,246.60 42,097.40Contracted Services (Special Education Students) - ESCs & CTSAs 1,089,000.00 (60,000.00) 1,029,000.00 992,881.46 36,118.54Contracted Services - Aid in Lieu of Payments - Non-Public Schools 225,000.00 30,000.00 255,000.00 233,513.18 21,486.82Contracted Services - Aid in Lieu of Payments - Charter Schools 52,000.00 20,000.00 72,000.00 66,742.00 5,258.00Miscellaneous Purchased Services 4,000.00 4,000.00 885.25 3,114.75General Supplies 316,500.00 96,000.00 412,500.00 275,432.49 137,067.51Transportation Supplies 75,000.00 75,000.00 53,125.00 21,875.00Other Objects 14,000.00 14,000.00 9,085.44 4,914.56
Total - Student Transportation Services 4,469,975.00 2,840.20 4,472,815.20 4,057,053.89 415,761.31
Student Transportation Services - Employee Benefits:Social Security Contributions 119,000.00 119,000.00 104,967.17 14,032.83 Health Benefits 700,000.00 700,000.00 700,000.00
Total - Student Transportation Services - Employee Benefits 819,000.00 - 819,000.00 804,967.17 14,032.83
Unallocated Benefits - Employee Benefits:Social Security Contributions 972,500.00 131,061.00 1,103,561.00 987,961.16 115,599.84Other Retirement Contributions -Regular 1,240,055.00 1,240,055.00 1,123,871.00 116,184.00Workers Compensation 535,000.00 535,000.00 361,546.10 173,453.90 Health Benefits 13,602,139.00 1,135,933.00 14,738,072.00 13,726,996.94 1,011,075.06 Tuition Reimbursements 170,000.00 (19,130.00) 150,870.00 94,287.80 56,582.20 Other Employee Benefits 273,000.00 3,588.00 276,588.00 144,527.40 132,060.60
Total - Unallocated Benefits - Employee Benefits 16,792,694.00 1,251,452.00 18,044,146.00 16,439,190.40 1,604,955.60
(Continued)
72

24000 Exhibit C-1TOWNSHIP OF PENNSAUKEN SCHOOL DISTRICT
Required Supplementary InformationBudgetary Comparison Schedule
General FundFor the Fiscal Year Ended June 30, 2012
VarianceOriginal Budget Final Positive (Negative)Budget Modifications Budget Actual Final to Actual
EXPENDITURES (CONT'D):GENERAL CURRENT EXPENSE (CONT'D):
Undistributed Expenditures (Cont'd):TPAF Contributions:
On-behalf TPAF Pension Contributions 1,209,313.00$ (1,209,313.00)$ On-behalf TPAF Medical Contributions 2,431,036.00 (2,431,036.00)Reimbursed TPAF Social Security Contributions 2,658,510.40 (2,658,510.40)
Total TPAF Contributions - - - 6,298,859.40 (6,298,859.40)
Total Undistributed Expenses 42,920,100.00$ 1,091,617.14$ 44,011,717.14$ 46,791,747.26 (2,780,030.12)
Total Expenditures - Current Expense 83,534,572.00 (10,338.21) 83,417,265.12 84,687,782.24 (1,270,517.12)
CAPITAL OUTLAY:Equipment:
Grades 9-12Undistributed Expenditures - Admin Info Tech. 44,888.23 44,888.23 44,615.83 272.40Undistributed Expenditures - Operation and Maintenance of Plant 100,000.00 100,000.00 100,000.00Undistributed Expenditures - Care / Upkeep of Grounds 14,000.00 14,000.00 12,595.00 1,405.00Undistributed Expenditures - Student Trans. - Non-Inst. Equip. 5,000.00 5,000.00 5,000.00School Buses - Regular 590,000.00 (83,888.23) 506,111.77 505,734.00 377.77
Total - Equipment 595,000.00 75,000.00 670,000.00 562,944.83 107,055.17
Facilities Acquisition and Construction Services:Architectural / Engineering Services 200,000.00 (200,000.00)Construction Services 4,350,000.00 (4,350,000.00)
Total - Facilities Acquisition and Construction Services 4,550,000.00 (4,550,000.00) - - -
Assets Acquired Under Capital Leases (Non-Budgeted)Undistributed Expenditures - Equipment - - - 137,450.00 (137,450.00)
Total Capital Outlay 5,145,000.00 (4,475,000.00) 670,000.00 700,394.83 (30,394.83)
Transfer of Funds to Charter Schools 1,651,000.00 151,172.00 1,802,172.00 1,802,172.00 -
Total Expenditures 90,330,572.00 (4,334,166.21) 85,889,437.12 87,190,349.07 (1,300,911.95)
(Continued)
73

24000 Exhibit C-1TOWNSHIP OF PENNSAUKEN SCHOOL DISTRICT
Required Supplementary InformationBudgetary Comparison Schedule
General FundFor the Fiscal Year Ended June 30, 2012
VarianceOriginal Budget Final Positive (Negative)Budget Modifications Budget Actual Final to Actual
Calculation of Deficiency of Revenues Under Expenditures:Excess (Deficiency) of Revenues Over (Under) Expenditures (8,239,682.00)$ 4,384,296.21$ (3,748,417.12)$ 3,373,946.36$ 7,122,363.48$
Other Financing Sources (Uses):Change in Supplies Inventory 42,061.66 42,061.66Transfers in from Capital Projects to Capital Outlay Legally Restricted 16,227.00 (16,227.00)Transfers in from Capital Projects to Capital Reserve 312,731.00 (312,731.00)Capital Reserve Transferred to Capital Projects (4,550,000.00) (4,550,000.00) (4,550,000.00)Operating Transfer Out -- Fiduciary Fund (35,600.00) (35,600.00) (35,600.00)Assets Acquired Under Capital Lease 137,450.00 (137,450.00)Cancellation of Special Revenue Grant Balances 235,801.93 235,801.93
Total - Other Financing Sources (Uses) - (4,585,600.00) (4,585,600.00) (3,841,328.41) (188,544.41)
Excess (Deficiency) of Revenues and Other Financing SourcesOver (Under) Expenditures and Other Financing Uses (8,239,682.00) (94,335.12) (8,334,017.12) (467,382.05) 7,866,635.07
Fund Balances, July 1 17,796,614.50 - 17,796,614.50 17,796,614.50 -
Fund Balances, June 30 9,556,932.50$ (94,335.12)$ 9,462,597.38$ 17,329,232.45$ 7,866,635.07$
Recapitulation:Nonspendable Fund Balance:
Reserve for Supplies Inventory 225,984.14$ Restricted Fund Balance:
Excess Surplus -- Designated for Subsequent Years Expenditures 4,559,061.66Capital Outlay Legally Restricted 16,227.00Emergency Reserve 432,583.40Capital Reserve 4,428,592.84Capital Reserve -- Designated for Subsequent Years Expenditures 1,984,361.00
Assigned Fund Balance:Other Purposes 1,170,554.27Designated for Subsequent Years Expenditures 2,141,696.34
Unassigned Fund Balance 2,370,171.80
17,329,232.45Reconciliation to Governmental Funds Statements (GAAP):
Last State Aid Payment Not Recognized on GAAP Basis (4,238,920.00)
Fund Balance per Governmental Funds (GAAP) 13,090,312.45$
74

24000 Exhibit C-1bTOWNSHIP OF PENNSAUKEN SCHOOL DISTRICT
Required Supplementary InformationBudgetary Comparison Schedule
General Fund -- Educational Jobs FundFor the Fiscal Year Ended June 30, 2012
VarianceOriginal Budget Final Positive (Negative)Budget Modifications Budget Actual Final to Actual
REVENUES:Federal Sources:
Education Jobs Fund 1,600,166.00$ 50,130.00$ 1,650,296.00$ 1,650,296.00$ -
EXPENDITURES:GENERAL CURRENT EXPENSE:
Regular Programs - Instruction:Salaries of Teachers:
Grades 9 - 12 731,980.00 30,000.00 761,980.00 761,980.00 -
Undistributed Expenditures:Unallocated Benefits - Employee Benefits:
Social Security Contribution 131,061.00 131,061.00 131,061.00Health Benefits 737,125.00 20,130.00 757,255.00 757,255.00
Total - Unallocated Benefits - Employee Benefits 868,186.00 20,130.00 888,316.00 888,316.00 -
Total Expenditures - Current Expense 1,600,166.00 50,130.00 1,650,296.00 1,650,296.00 -
Excess (Deficiency) of Revenues and Other Financing SourcesOver (Under) Expenditures and Other Financing Uses - - - - -
Fund Balances, July 1 - - - - -
Fund Balances, June 30 - - - - -
75

24000 Exhibit C-2TOWNSHIP OF PENNSAUKEN SCHOOL DISTRICT
Required Supplementary InformationBudgetary Comparison Schedule
Special Revenue FundFor the Fiscal Year Ended June 30, 2012
VarianceOriginal Budget Final Positive (Negative)Budget Transfers Budget Actual Final to Actual
REVENUES:State Sources:
Preschool Education Aid 1,600,000.00$ 1,600,000.00$ 1,341,822.76$ (258,177.24)$ Adult Education Aid 28,400.00$ 28,400.00 26,415.72 (1,984.28)Non-Public Nursing 99,033.00 (10,361.00) 88,672.00 88,150.08 (521.92)Non-Public Textbook 69,331.00 (7,254.00) 62,077.00 52,662.01 (9,414.99) Chapter 192 Auxiliary Services 301,216.00 (31,514.00) 269,702.00 236,857.77 (32,844.23) Chapter 193 Handicapped Services 210,682.00 (22,042.00) 188,640.00 131,211.59 (57,428.41)
Total - State Sources 2,280,262.00 (42,771.00) 2,237,491.00 1,877,119.93 (360,371.07)
Federal Sources:Title I 1,585,913.00 641,247.95 2,227,160.95 1,454,001.92 (773,159.03) Title I ARRA 293,235.75 293,235.75 88,244.25 (204,991.50)Title IA School Improvement - Part A 88,365.68 88,365.68 27,152.49 (61,213.19)Title II Part A 267,954.00 102,305.90 370,259.90 200,201.48 (170,058.42)Title II Part D 10,698.81 10,698.81 228.81 (10,470.00)Title III 66,446.00 32,264.60 98,710.60 25,237.56 (73,473.04)Title III Immigrant 18,002.00 18,002.00 (18,002.00)Title V 1,038.25 1,038.25 (1,038.25)I.D.E.I.A., Part B Basic 1,741,139.00 137,553.52 1,878,692.52 1,696,070.18 (182,622.34)I.D.E.I.A., Part B Basic ARRA 192,435.68 192,435.68 43,913.68 (148,522.00)I.D.E.I.A., Part B, Preschool 51,087.70 51,087.70 790.00 (50,297.70)I.D.E.I.A., Part B, Preschool ARRA 63,739.00 63,739.00 63,282.80 (456.20)
Total - Federal Sources 3,661,452.00 1,631,974.84 5,293,426.84 3,599,123.17 (1,694,303.67)
Local Sources:Rebel 467.25 467.25 467.25PASA 11,942.94 11,942.94 6,847.05 (5,095.89)Not on Tobacco 940.00 940.00 (940.00)West Jersey Reading Council 1,000.00 1,000.00 (1,000.00)Safety Incentive 10,131.00 10,131.00 10,131.00
Total - Local Sources - 24,481.19 24,481.19 17,445.30 (7,035.89)
Total Revenues 5,941,714.00$ 1,613,685.03$ 7,555,399.03$ 5,493,688.40$ (2,061,710.63)$
(Continued)
76

24000 Exhibit C-2TOWNSHIP OF PENNSAUKEN SCHOOL DISTRICT
Required Supplementary InformationBudgetary Comparison Schedule
Special Revenue FundFor the Fiscal Year Ended June 30, 2012
VarianceOriginal Budget Final Positive (Negative)Budget Transfers Budget Actual Final to Actual
EXPENDITURES:Instruction:
Salaries of Teachers 1,421,996.60$ 537,412.31$ 1,959,408.91$ 1,652,025.62$ 307,383.29$ Other Salaries for Instruction 284,507.95 11,123.05 295,631.00 242,531.87 53,099.13Purchased Professional & Technical Services 1,037,951.19 225,346.35 1,263,297.54 644,508.43 618,789.11Tuition 1,258,045.88 321,398.12 1,579,444.00 1,579,444.00 General Supplies 223,038.13 70,837.56 293,875.69 105,990.78 187,884.91Textbooks 69,330.57 (7,253.57) 62,077.00 52,662.01 9,414.99Other Objects 88,264.19 52,008.81 140,273.00 11,441.52 128,831.48
Total Instruction 4,383,134.51 1,210,872.63 5,594,007.14 4,288,604.23 1,305,402.91
Support Services:Salaries of Other Professional Staff 20,510.18 5,239.82 25,750.00 25,750.00Personal Services - Employee Benefits 470,193.91 92,515.15 562,709.06 467,083.45 95,625.61Purchased Professional & Technical Services 396,106.27 163,560.97 559,667.24 227,315.55 332,351.69Other Purchased Services 104,954.34 (8,187.89) 96,766.45 92,179.27 4,587.18Contracted Services - Transportation Other than
Between Home and School 22,764.71 (2,481.71) 20,283.00 5,715.77 14,567.23Travel 2,150.09 901.19 3,051.28 3,051.28Supplies and Materials 151,227.83 201,806.03 353,033.86 78,599.22 274,434.64Other Objects 60,672.16 (60,672.16)
Total Support Services 1,228,579.49 392,681.40 1,621,260.89 870,893.26 750,367.63
Capital Outlay:Instructional Equipment 27,000.00 27,000.00 21,588.95 5,411.05Non-Instructional Equipment 303,000.00 10,131.00 313,131.00 312,601.96 529.04
330,000.00 10,131.00 340,131.00 334,190.91 5,940.09
Total Expenditures 5,941,714.00$ 1,613,685.03$ 7,555,399.03$ 5,493,688.40$ 2,061,710.63$
77

24000 Exhibit C-3TOWNSHIP OF PENNSAUKEN SCHOOL DISTRICT
Required Supplementary InformationBudget-to-GAAP Reconciliation
For the Fiscal Year Ended June 30, 2012
Note A - Explanation of Differences between Budgetary Inflows and Outflows and GAAP Revenues and Expenditures.
SpecialGeneral Revenue
Fund FundSources / Inflows of Resources:
Actual amounts (budgetary basis) "revenues" from the budgetary comparison schedules 90,564,295.43$ 5,493,688.40$
Differences - Budget to GAAP: Grant accounting budgetary basis differs from GAAP in that encumbrances are recognized as expenditures, and the related revenue is recognized. 356,048.85
The Restricted State Aids recorded in the Special Revenue Fund are realized utilizing the budgetary basis which dictates that revenue must equal expenditures and differs from GAAP which recognizes the revenue once the eligibility criteria are met as specified in Note 1 and GASB 33. (479,284.78)
The last State aid payment is recognized as revenue for budgetary purposes, and differs from GAAP which does not recognize this revenue until the subsequent year when the State recognizes the related expense (GASB 33) received July 2011. 4,080,709.20 79,138.80
The last State aid payment is recognized as revenue for budgetary purposes, and differs from GAAP which does not recognize this revenue until the subsequent year when the State recognizes the related expense (GASB 33) received July 2012. (4,238,920.00) (86,241.00)
Total revenues as reported on the statement of revenues, expenditures, and changes in fund balances - governmental funds 90,406,084.63$ 5,363,350.27$
Uses / Outflows of Resources:
Actual amounts (budgetary basis) "total expenditures" from the budgetary comparison schedule 87,190,349.07$ 5,493,688.40$
Differences - Budget to GAAP: Encumbrances for supplies and equipment ordered but not received is reported in the year the order is placed for budgetary purposes, but in the year the supplies are received for financial reporting purposes. 356,048.85
Total expenditures as reported on the statement of revenues, expenditures, and changes in fund balances - governmental funds (B-2) 87,190,349.07$ 5,849,737.25$
78

REQUIRED SUPPLEMENTARY INFORMATIONPART III
79

24000 Exhibit RSI-1
TOWNSHIP OF PENNSAUKEN SCHOOL DISTRICTRequired Supplementary Information
Schedule of Funding Progress for Health Benefits PlanFor the Fiscal Year Ended June 30, 2012
ActuarialAccrued UAAL as a
Actuarial Liability Unfunded PercentageActuarial Value of (AAL) - AAL Funded Covered of CoveredValuation Assets Entry Age (UAAL) Ratio Payroll Payroll
Date (a) (b) (b-a) (a/b) (c) [(b-a)/c]
06/30/11 - 1,530,715.00$ 1,530,715.00$ - N/A N/A
06/30/09 - 1,427,721.00 1,427,721.00 - N/A N/A
80

24000
TOWNSHIP OF PENNSAUKEN SCHOOL DISTRICTNotes to Required Supplementary Information
For the Fiscal Year Ended June 30, 2012
Other Postemployment Benefits
The information presented in the required supplementary schedule was determined as part of the actuarial valuation at the date indicated. Additional information as of the latest actuarial valuation is as follows:
Valuation Date June 30, 2011
Actuarial Cost Method Projected Unit Credit
Amortization Method Level Dollar
Remaining Amortization Period 30 years
Asset Valuation Method Market Value
Actuarial Assumptions:
Discount Rate 5.0%Rate of Salary Increases N/ARate of Dental Inflation 5.0%
For determining the annual required contribution (ARC), the rate of employer contributions to the Plan is composed of the normal cost plus amortization of the unfunded actuarial accrued liability (UAAL), multiplied by the sum of 1 plus the discount rate, or 1.05. The normal cost is a portion of the actuarial present value of plan benefits and expenses which is allocated to a valuation year by the actuarial cost method. The actuarial accrued liability (AAL) is that portion of the present value of projected benefits that will not be paid by future employer normal costs. The difference between this liability and the funds accumulated as of the same date is the unfunded actuarial liability (UAL).
81

OTHER SUPPLEMENTARY INFORMATION
82

SPECIAL REVENUE FUND
83

24000 Exhibit E-1TOWNSHIP OF PENNSAUKEN SCHOOL DISTRICT
Special Revenue FundCombining Schedule of Revenues and Expenditures - Budgetary Basis
For the Fiscal Year Ended June 30, 2012
TotalBrought
Total Title I Title I ARRA Title I SIA Title II Part A Title II Part D ForwardREVENUES:
Federal Sources 3,599,123.17$ 1,454,001.92$ 88,244.25$ 27,152.49$ 200,201.48$ 228.81$ 1,829,294.22$ State Sources 1,877,119.93 1,877,119.93 Local Sources 17,445.30 17,445.30
Total Revenues 5,493,688.40$ 1,454,001.92$ 88,244.25$ 27,152.49$ 200,201.48$ 228.81$ 3,723,859.45$
EXPENDITURES:
Instruction: Salaries of Teachers 1,652,025.62$ 932,471.75$ 37,744.75$ 1,374.75$ 166,600.47$ 513,833.90$ Other Salaries for Instruction 242,531.87 30,000.00 212,531.87 Purchased Professional & Technical Services 644,508.43 247,998.91 396,509.52 Tuition 1,579,444.00 1,579,444.00 General Supplies 105,990.78 5,653.80 1,253.84 228.81$ 98,854.33 Textbooks 52,662.01 52,662.01 Other Objects 11,441.52 11,441.52
Total Instruction 4,288,604.23 1,197,565.98 67,744.75 2,628.59 166,600.47 228.81 2,853,835.63
Support Services: Personal Services - Employee Benefits 467,083.45 146,856.17 28,655.28 291,572.00 Purchased Professional & Technical Services 227,315.55 108,137.43 20,499.50 98,678.62 Other Purchased Services 92,179.27 4,029.19 88,150.08 Contracted Services - Transportation Other than Between Home and School 5,715.77 5,715.77 Supplies and Materials 78,599.22 1,442.34 24,523.90 916.54 51,716.44
Total Support Services 870,893.26 256,435.94 20,499.50 24,523.90 33,601.01 - 535,832.91
Capital Outlay: Instructional Equipment 21,588.95 21,588.95 Non-Instructional Equipment 312,601.96 312,601.96
Total Capital Outlay 334,190.91 - - - - - 334,190.91
Total Expenditures 5,493,688.40$ 1,454,001.92$ 88,244.25$ 27,152.49$ 200,201.48$ 228.81$ 3,723,859.45$
(Continued)
I.A.S.A.
84

24000 Exhibit E-1TOWNSHIP OF PENNSAUKEN SCHOOL DISTRICT
Special Revenue Fund Combining Schedule of Program Revenues and Expenditures - Budgetary Basis
For the Fiscal Year Ended June 30, 2012
I.A.S.A.Total Total
Carried BroughtForward Title III Basic Basic ARRA Preschool Preschool ARRA Forward
REVENUES:
Federal Sources 1,829,294.22$ 25,237.56$ 1,696,070.18$ 43,913.68$ 790.00$ 63,282.80$ State Sources 1,877,119.93 1,877,119.93$ Local Sources 17,445.30 17,445.30
Total Revenues 3,723,859.45$ 25,237.56$ 1,696,070.18$ 43,913.68$ 790.00$ 63,282.80$ 1,894,565.23$
EXPENDITURES:
Instruction: Salaries of Teachers 513,833.90$ 6,151.50$ 507,682.40$ Other Salaries for Instruction 212,531.87 9,798.75$ 202,733.12 Purchased Professional & Technical Services 396,509.52 29,001.72 367,507.80 Tuition 1,579,444.00 1,579,444.00 General Supplies 98,854.33 718.95$ 2,053.94 16,791.36 63,282.80$ 16,007.28 Textbooks 52,662.01 52,662.01 Other Objects
Total Instruction 2,853,835.63 718.95 1,616,651.16 26,590.11 63,282.80 1,146,592.61
Support Services: Personal Services - Employee Benefits 291,572.00 291,572.00 Purchased Professional & Technical Services 98,678.62 1,739.50 79,419.02 3,100.10 790.00$ 13,630.00 Other Purchased Services 88,150.08 88,150.08 Contracted Services - Transportation Other than Between Home and School 5,715.77 5,715.77 Supplies and Materials 51,716.44 22,779.11 14,223.47 14,713.86
Total Support Services 535,832.91 24,518.61 79,419.02 17,323.57 790.00 - 413,781.71
Capital Outlay: Instructional Equipment 21,588.95 21,588.95 Non-Instructional Equipment 312,601.96 312,601.96
Total Capital Outlay 334,190.91 - - - - - 334,190.91
Total Expenditures 3,723,859.45$ 25,237.56$ 1,696,070.18$ 43,913.68$ 790.00$ 63,282.80$ 1,894,565.23$
(Continued)
I.D.E.I.A. Part B
85

24000 Exhibit E-1TOWNSHIP OF PENNSAUKEN SCHOOL DISTRICT
Special Revenue FundCombining Schedule of Program Revenues and Expenditures - Budgetary Basis
For the Fiscal Year Ended June 30, 2012
Total Non-Public Non-Public TotalCarried Preschool Textbook Aid Nursing Adult Safety BroughtForward Education Aid 2009-2010 2009-2010 Education Aid PASA Incentive Rebel Forward
REVENUES:
Federal SourcesState Sources 1,877,119.93$ 1,341,822.76$ 52,662.01$ 88,150.08$ 26,415.72$ 368,069.36$ Local Sources 17,445.30 6,847.05$ 10,131.00$ 467.25$
Total Revenues 1,894,565.23$ 1,341,822.76$ 52,662.01$ 88,150.08$ 26,415.72$ 6,847.05$ 10,131.00$ 467.25$ 368,069.36$
EXPENDITURES:
Instruction: Salaries of Teachers 507,682.40$ 481,762.40$ 25,920.00$ Other Salaries for Instruction 202,733.12 202,733.12 Purchased Professional & Technical Services 367,507.80 5,154.21$ 362,353.59$ Tuition General Supplies 16,007.28 15,044.31 495.72 467.25$ Textbooks 52,662.01 52,662.01$ Other Objects
Total Instruction 1,146,592.61 699,539.83 52,662.01 26,415.72 5,154.21 - 467.25 362,353.59
Support Services: Personal Services - Employee Benefits 291,572.00 291,572.00 Purchased Professional & Technical Services 13,630.00 13,630.00 Other Purchased Services 88,150.08 88,150.08$ Contracted Services - Transportation Other than Between Home and School 5,715.77 5,715.77 Supplies and Materials 14,713.86 13,021.02 1,692.84
Total Support Services 413,781.71 318,223.02 - 88,150.08 - 1,692.84 - - 5,715.77
Capital Outlay: Instructional Equipment 21,588.95 21,588.95 Non-Instructional Equipment 312,601.96 302,470.96 10,131.00$
Total Capital Outlay 334,190.91 324,059.91 - - - - 10,131.00 - -
Total Expenditures 1,894,565.23$ 1,341,822.76$ 52,662.01$ 88,150.08$ 26,415.72$ 6,847.05$ 10,131.00$ 467.25$ 368,069.36$
(Continued)
86

24000 Exhibit E-1TOWNSHIP OF PENNSAUKEN SCHOOL DISTRICT
Special Revenue FundCombining Schedule of Program Revenues and Expenditures - Budgetary Basis
For the Fiscal Year Ended June 30, 2012
N.J. Non-Public Handicapped Services N.J. Non-Public Auxiliary ServicesCh. 193 Ch. 192
Total Examination English as aCarried Supplemental and Corrective Compensatory Second HomeForward Instruction Classification Speech Education Language Instruction Transportation
REVENUES:
Federal SourcesState Sources 368,069.36$ 34,794.40$ 57,949.06$ 38,468.13$ 220,454.00$ 6,120.00$ 4,568.00$ 5,715.77$ Local Sources
Total Revenues 368,069.36$ 34,794.40$ 57,949.06$ 38,468.13$ 220,454.00$ 6,120.00$ 4,568.00$ 5,715.77$
EXPENDITURES:
Instruction: Salaries of Teachers Other Salaries for Instruction Purchased Professional & Technical Services 362,353.59$ 34,794.40$ 57,949.06$ 38,468.13$ 220,454.00$ 6,120.00$ 4,568.00$ Tuition General Supplies Textbooks Other Objects
Total Instruction 362,353.59 34,794.40 57,949.06 38,468.13 220,454.00 6,120.00 4,568.00 -
Support Services: Personal Services - Employee Benefits Purchased Professional & Technical Services Other Purchased Services Contracted Services - Transportation Other than Between Home and School 5,715.77 5,715.77$ Supplies and Materials
Total Support Services 5,715.77 - - - - - - 5,715.77
Capital Outlay: Instructional Equipment Non-Instructional Equipment
Total Capital Outlay - - - - - - - -
Total Expenditures 368,069.36$ 34,794.40$ 57,949.06$ 38,468.13$ 220,454.00$ 6,120.00$ 4,568.00$ 5,715.77$
87

24000 Exhibit E-2TOWNSHIP OF PENNSAUKEN SCHOOL DISTRICT
SPECIAL REVENUE FUNDSchedule of Preschool Education Aid
Budgetary BasisFor the Fiscal Year Ended June 30, 2012
Budgeted Actual Variance
EXPENDITURES:
Instruction: Salaries of Teachers 497,741.00$ 481,762.40$ 15,978.60$ Other Salaries for Instruction 265,631.00 202,733.12 62,897.88 General Supplies 75,000.00 15,044.31 59,955.69
Total Instruction 838,372.00 699,539.83 138,832.17
Support Services: Employee Benefits 291,572.00 291,572.00 Purchased Professional & Technical Services 65,056.00 13,630.00 51,426.00 Supplies and Materials 75,000.00 13,021.02 61,978.98
Total Support Services 431,628.00 318,223.02 113,404.98
Facilities Acquisition and Construction Services: Instructional Equipment 27,000.00 21,588.95 5,411.05 Non-Instructional Equipment 303,000.00 302,470.96 529.04
Total Facilities Acquisition and Construction Services 330,000.00 324,059.91 5,940.09
Total Expenditures 1,600,000.00$ 1,341,822.76$ 258,177.24$
Calculation of Budget and Carryover
2011-12 Revised Preschool Education Aid Allocation 862,410.00$ Actual ECPA/PEA Carryover (June 30, 2011) 1,212,587.77
Total Preschool Education Aid Funds Available for 2011-12 Budget 2,074,997.77Less: 2011-12 Budgeted Preschool Education Aid (Including Prior Year Budgeted Carryover) (1,600,000.00)
Available and Unbudgeted Preschool Education Aid Funds as of June 30, 2012 474,997.77
Add: 2011-12 Unexpended Preschool Education Aid 258,177.24
2011-12 Preschool Education Aid Actual Carryover 733,175.01$
2011-12 Preschool Education Aid Actual Carryover Budgeted for Preschool Programs 2012-13 -
88

CAPITAL PROJECTS FUND
89

24000 Exhibit F-1
CAPITAL PROJECTS FUNDSummary Schedule of Project ExpendituresFor the Fiscal Year Ended June 30, 2012
Expenditures to Date UnexpendedOriginal Prior Current Balance
Project Title / Issue Date Appropriations Years Year Cancellations June 30, 2012
Middle School Window Replacement 10/8/2009 1,549,603.00$ 1,261,003.00$ 24,000.00$ 264,600.00$
Renovation of Senior High School Gym Lighting 10/8/2009 51,000.00 1,800.00 49,200.00$
Renovation of Senior High School Lunch Line 10/8/2009 412,500.00 65,925.00 246,074.25 100,500.75
Renovation of Senior High School Window Replacement 7/1/2011 2,600,000.00 110,700.00 2,489,300.00
Central School Demolition 7/1/2011 1,000,000.00 172,294.57 827,705.43
Renovation of Senior High School Sound System 7/1/2011 300,000.00 99,500.00 200,500.00
Renovation of Senior High School Fire Alarm 7/1/2011 650,000.00 537,769.00 112,231.00
Total 6,563,103.00$ 1,328,728.00$ 1,190,337.82$ 462,431.75$ 3,581,605.43$
Unreserved Designated for Subsequent Years Expenditures 2,886,752.18$ Reserve for Encumbrances 694,853.25
3,581,605.43$
Cancellation of SDA Grant 133,473.75$ Canceled to General Fund - Capital Reserve 312,731.00 Canceled to General Fund - Capital Outlay Legally Restricted 16,227.00
462,431.75$
TOWNSHIP OF PENNSAUKEN SCHOOL DISTRICT
90

24000 Exhibit F-2
CAPITAL PROJECTS FUNDSummary Schedule of Revenues, Expenditures, and Changes in Fund Balance -- Budgetary Basis
For the Fiscal Year Ended June 30, 2012
Revenues and Other Financing SourcesState Sources--SCC GrantBond Proceeds and TransfersProceeds from Lease PurchaseOther Local SourcesTransfer form Capital Reserve 4,550,000.00$ Transfer form Capital Outlay
Total Revenues 4,550,000.00$
Expenditures and Other Financing UsesExpenditures:
Other Purchased Professional and Technical Services 138,693.00 Construction Services 1,051,644.82
Total Expenditures 1,190,337.82
Other Financing Uses:Cancellation of SDA Grants 133,473.75 Transfer to General Fund -- Capital Reserve 312,731.00 Transfer to General Fund -- Capital Outlay Legally Restricted 16,227.00
Total Other Financing Uses 462,431.75
Total Expenditures and Other Financing Uses 1,652,769.57
Excess (Deficiency) of Revenues Over (Under) Expenditures 2,897,230.43
Fund Balance -- July 1 684,375.00
Fund Balance -- June 30 3,581,605.43$
TOWNSHIP OF PENNSAUKEN SCHOOL DISTRICT
91

24000 Exhibit F-2a
CAPITAL PROJECTS FUNDSchedule of Project Revenues, Expenditures, Project Balance and Project Status--Budgetary Basis
From Inception and for the Fiscal Year Ended June 30, 2012
RevisedAuthorized
Prior Years Current Year Totals Cost
Revenues and Other Financing SourcesState Sources--EDA Grant 1,032,762.00$ 1,032,762.00$ 1,032,762.00$ Bond Proceeds and TransfersProceeds from Lease PurchaseOther Local SourcesTransfer from Capital ReserveTransfer from Capital Outlay 516,841.00 516,841.00 516,841.00
Total Revenues 1,549,603.00 - 1,549,603.00 1,549,603.00
Expenditures and Other Financing UsesLegal ServicesOther Purchased Professional and Technical Services 119,400.00 119,400.00 119,400.00Construction Services 1,141,603.00 24,000.00$ 1,165,603.00 1,430,203.00Transfer to Debt Service Fund
Total Expenditures 1,261,003.00 24,000.00 1,285,003.00 1,549,603.00
Excess (Deficiency) of Revenues Over(Under) Expenditures 288,600.00$ (24,000.00)$ 264,600.00$ -
Additional Project Information:Project Number 4060-055-09-1003Grant Date 10/8/2009Bond Authorization Date N/ABonds Authorized N/ABonds Issued N/AOriginal Authorized Cost 1,597,400.00$ Additional Authorized Cost (47,797.00) Revised Authorized Cost 1,549,603.00$
Percentage Increase over Original Authorized Cost -2.99%Percentage Completion 82.92%Original Target Completion Date 1/31/2011Revised Target Completion Date 12/31/2012
TOWNSHIP OF PENNSAUKEN SCHOOL DISTRICT
Middle School Window Replacement
92

24000 Exhibit F-2b
CAPITAL PROJECTS FUNDSchedule of Project Revenues, Expenditures, Project Balance and Project Status--Budgetary Basis
From Inception and for the Fiscal Year Ended June 30, 2012
RevisedAuthorized
Prior Years Current Year Totals Cost
Revenues and Other Financing SourcesState Sources--EDA Grant 32,973.00$ (32,973.00)$ Bond Proceeds and TransfersProceeds from Lease PurchaseOther Local SourcesTransfer from Capital ReserveTransfer from Capital Outlay 18,027.00 (16,227.00) 1,800.00$ 1,800.00$
Total Revenues 51,000.00 (49,200.00) 1,800.00 1,800.00
Expenditures and Other Financing UsesLegal ServicesOther Purchased Professional and Technical Services 1,800.00 1,800.00 1,800.00Construction ServicesTransfer to Debt Service Fund
Total Expenditures 1,800.00 - 1,800.00 1,800.00
Excess (Deficiency) of Revenues Over(Under) Expenditures 49,200.00$ (49,200.00)$ - -
Additional Project Information:Project Number 4060-050-09-1002Grant Date 10/8/2009Bond Authorization Date N/ABonds Authorized N/ABonds Issued N/AOriginal Authorized Cost 51,000.00$ Additional Authorized Cost (49,200.00) Revised Authorized Cost 1,800.00$
Percentage Increase over Original Authorized Cost -96.47%Percentage Completion 100.00%Original Target Completion Date 8/31/2011Revised Target Completion Date 6/30/2012
TOWNSHIP OF PENNSAUKEN SCHOOL DISTRICT
Renovation of Senior High School Gym Lighting
93

24000 Exhibit F-2c
CAPITAL PROJECTS FUNDSchedule of Project Revenues, Expenditures, Project Balance and Project Status--Budgetary Basis
From Inception and for the Fiscal Year Ended June 30, 2012
RevisedAuthorized
Prior Years Current Year Totals Cost
Revenues and Other Financing SourcesState Sources--EDA Grant 266,692.00$ (100,500.75)$ 166,191.25$ 166,191.25$ Bond Proceeds and TransfersProceeds from Lease PurchaseOther Local SourcesTransfer from Capital ReserveTransfer from Capital Outlay 145,808.00 145,808.00 145,808.00
Total Revenues 412,500.00 (100,500.75) 311,999.25 311,999.25
Expenditures and Other Financing UsesLegal ServicesOther Purchased Professional and Technical Services 24,980.00 1,310.00$ 26,290.00 26,290.00Construction Services 40,945.00 244,764.25 285,709.25 285,709.25Transfer to Debt Service Fund
Total Expenditures 65,925.00 246,074.25 311,999.25 311,999.25
Excess (Deficiency) of Revenues Over(Under) Expenditures 346,575.00$ (346,575.00)$ - -
Additional Project Information:Project Number 4060-050-09-1001Grant Date 10/8/2009Bond Authorization Date N/ABonds Authorized N/ABonds Issued N/AOriginal Authorized Cost 412,500.00$ Additional Authorized Cost (100,500.75) Revised Authorized Cost 311,999.25$
Percentage Increase over Original Authorized Cost -24.36%Percentage Completion 100.00%Original Target Completion Date 7/30/2011Revised Target Completion Date 9/30/2011
TOWNSHIP OF PENNSAUKEN SCHOOL DISTRICT
Renovation of Senior High School Lunch Line
94

24000 Exhibit F-2d
CAPITAL PROJECTS FUNDSchedule of Project Revenues, Expenditures, Project Balance and Project Status--Budgetary Basis
From Inception and for the Fiscal Year Ended June 30, 2012
RevisedAuthorized
Prior Years Current Year Totals Cost
Revenues and Other Financing SourcesState Sources--EDA GrantBond Proceeds and TransfersProceeds from Lease PurchaseTransfer from Capital OutlayTransfer from Capital Reserve 2,600,000.00$ 2,600,000.00$ 2,600,000.00$ Transfer from Capital Outlay
Total Revenues - 2,600,000.00 2,600,000.00 2,600,000.00
Expenditures and Other Financing UsesLegal ServicesOther Purchased Professional and Technical Services 110,700.00 110,700.00 170,000.00Construction Services 2,430,000.00Transfer to Debt Service Fund
Total Expenditures - 110,700.00 110,700.00 2,600,000.00
Excess (Deficiency) of Revenues Over(Under) Expenditures - 2,489,300.00$ 2,489,300.00$ -
Additional Project Information:Project Number 4060-050-11-1000Grant Date N/ABond Authorization Date N/ABonds Authorized N/ABonds Issued N/AOriginal Authorized Cost 2,600,000.00$ Additional Authorized Cost 0.00 Revised Authorized Cost 2,600,000.00$
Percentage Increase over Original Authorized Cost 0.00%Percentage Completion 4.26%Original Target Completion Date 4/30/2013Revised Target Completion Date 4/30/2013
TOWNSHIP OF PENNSAUKEN SCHOOL DISTRICT
Senior High School Window Replacement
95

24000 Exhibit F-2e
CAPITAL PROJECTS FUNDSchedule of Project Revenues, Expenditures, Project Balance and Project Status--Budgetary Basis
From Inception and for the Fiscal Year Ended June 30, 2012
RevisedAuthorized
Prior Years Current Year Totals Cost
Revenues and Other Financing SourcesState Sources--EDA GrantBond Proceeds and TransfersProceeds from Lease PurchaseOther Local SourcesTransfer from Capital Reserve 1,000,000.00$ 1,000,000.00$ 1,000,000.00$ Transfer from Capital Outlay
Total Revenues - 1,000,000.00 1,000,000.00 1,000,000.00
Expenditures and Other Financing UsesLegal ServicesOther Purchased Professional and Technical Services 26,683.00 26,683.00 42,000.00Construction Services 145,611.57 145,611.57 958,000.00Transfer to Debt Service Fund
Total Expenditures - 172,294.57 172,294.57 1,000,000.00
Excess (Deficiency) of Revenues Over(Under) Expenditures - 827,705.43$ 827,705.43$ -
Additional Project Information:Project Number 4060-103-09-1000Grant Date N/ABond Authorization Date N/ABonds Authorized N/ABonds Issued N/AOriginal Authorized Cost 1,000,000.00$ Additional Authorized Cost 0.00 Revised Authorized Cost 1,000,000.00$
Percentage Increase over Original Authorized Cost 0.00%Percentage Completion 17.23%Original Target Completion Date 12/31/2012Revised Target Completion Date 12/31/2012
TOWNSHIP OF PENNSAUKEN SCHOOL DISTRICT
Central School Demolition
96

24000 Exhibit F-2f
CAPITAL PROJECTS FUNDSchedule of Project Revenues, Expenditures, Project Balance and Project Status--Budgetary Basis
From Inception and for the Fiscal Year Ended June 30, 2012
RevisedAuthorized
Prior Years Current Year Totals Cost
Revenues and Other Financing SourcesState Sources--EDA GrantBond Proceeds and TransfersProceeds from Lease PurchaseOther Local SourcesTransfer from Capital Reserve 99,500.00$ 99,500.00$ 99,500.00$ Transfer from Capital Outlay
Total Revenues - 99,500.00 99,500.00 99,500.00
Expenditures and Other Financing UsesLegal ServicesOther Purchased Professional and Technical ServicesConstruction Services 99,500.00 99,500.00 99,500.00Transfer to Debt Service Fund
Total Expenditures - 99,500.00 99,500.00 99,500.00
Excess (Deficiency) of Revenues Over(Under) Expenditures - - - -
Additional Project Information:Project Number N/AGrant Date N/ABond Authorization Date N/ABonds Authorized N/ABonds Issued N/AOriginal Authorized Cost 300,000.00$ Additional Authorized Cost (200,500.00) Revised Authorized Cost 99,500.00$
Percentage Increase over Original Authorized Cost -66.83%Percentage Completion 100.00%Original Target Completion Date 10/31/2011Revised Target Completion Date 10/31/2011
TOWNSHIP OF PENNSAUKEN SCHOOL DISTRICT
Senior High School Sound System
97

24000 Exhibit F-2g
CAPITAL PROJECTS FUNDSchedule of Project Revenues, Expenditures, Project Balance and Project Status--Budgetary Basis
From Inception and for the Fiscal Year Ended June 30, 2012
RevisedAuthorized
Prior Years Current Year Totals Cost
Revenues and Other Financing SourcesState Sources--EDA GrantBond Proceeds and TransfersProceeds from Lease PurchaseOther Local SourcesTransfer from Capital Reserve 537,769.00$ 537,769.00$ 537,769.00$ Transfer from Capital Outlay
Total Revenues - 537,769.00 537,769.00 537,769.00
Expenditures and Other Financing UsesLegal ServicesOther Purchased Professional and Technical ServicesConstruction Services 537,769.00 537,769.00 537,769.00Transfer to Debt Service Fund
Total Expenditures - 537,769.00 537,769.00 537,769.00
Excess (Deficiency) of Revenues Over(Under) Expenditures - - - -
Additional Project Information:Project Number N/AGrant Date N/ABond Authorization Date N/ABonds Authorized N/ABonds Issued N/AOriginal Authorized Cost 650,000.00$ Additional Authorized Cost (112,231.00) Revised Authorized Cost 537,769.00$
Percentage Increase over Original Authorized Cost -17.27%Percentage Completion 100.00%Original Target Completion Date 10/31/2011Revised Target Completion Date 10/31/2011
TOWNSHIP OF PENNSAUKEN SCHOOL DISTRICT
Senior High School Fire Alarm
98

PROPRIETARY FUNDS
99

24000 Exhibit G-1TOWNSHIP OF PENNSAUKEN SCHOOL DISTRICT
Enterprise FundCombining Statement of Net Assets
June 30, 2012
FoodService
ASSETS:Current Assets: Cash and Cash Equivalents 1,152,609.24$ Accounts Receivable: State 1,477.06 Federal 79,795.59 Other 3,548.25 Inventories 37,716.42
Total Current Assets 1,275,146.56
Noncurrent Assets: Restricted Cash and Cash Equivalents Furniture, Machinery and Equipment 1,537,420.24 Less Accumulated Depreciation (1,036,451.75)
Total Noncurrent Assets 500,968.49
Total Assets 1,776,115.05
LIABILITIES:Current Liabilities: Interfund Accounts Payable: Due General Fund 795,235.31 Accounts Payable 31,794.45 Deferred Revenue 12,757.76
839,787.52 Noncurrent Liabilities: Compensated Absences Payable 53,696.00
Total Liabilities 893,483.52
NET ASSETS:Invested in Capital Assets, Net of Related Debt 500,968.49Unrestricted 381,663.04
Total Net Assets 882,631.53$
100
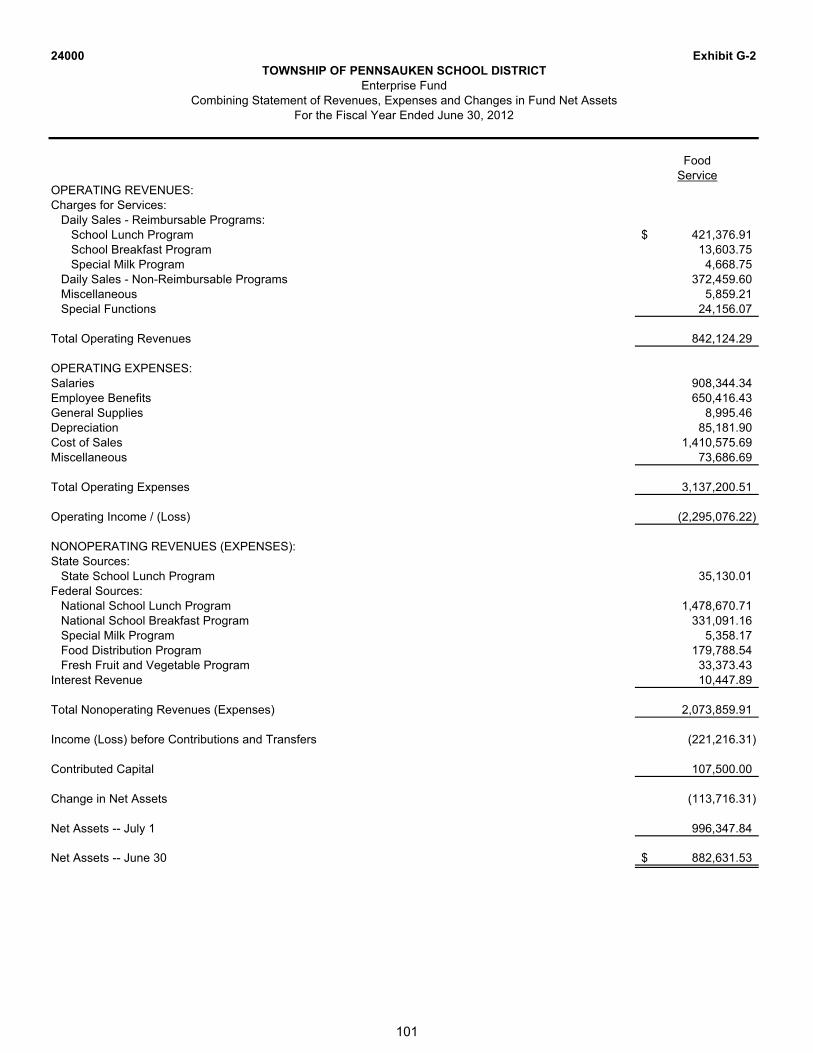
24000 Exhibit G-2TOWNSHIP OF PENNSAUKEN SCHOOL DISTRICT
Enterprise FundCombining Statement of Revenues, Expenses and Changes in Fund Net Assets
For the Fiscal Year Ended June 30, 2012
FoodService
OPERATING REVENUES:Charges for Services: Daily Sales - Reimbursable Programs: School Lunch Program 421,376.91$ School Breakfast Program 13,603.75 Special Milk Program 4,668.75 Daily Sales - Non-Reimbursable Programs 372,459.60 Miscellaneous 5,859.21 Special Functions 24,156.07
Total Operating Revenues 842,124.29
OPERATING EXPENSES:Salaries 908,344.34Employee Benefits 650,416.43General Supplies 8,995.46Depreciation 85,181.90Cost of Sales 1,410,575.69Miscellaneous 73,686.69
Total Operating Expenses 3,137,200.51
Operating Income / (Loss) (2,295,076.22)
NONOPERATING REVENUES (EXPENSES):State Sources: State School Lunch Program 35,130.01Federal Sources: National School Lunch Program 1,478,670.71 National School Breakfast Program 331,091.16 Special Milk Program 5,358.17 Food Distribution Program 179,788.54 Fresh Fruit and Vegetable Program 33,373.43Interest Revenue 10,447.89
Total Nonoperating Revenues (Expenses) 2,073,859.91
Income (Loss) before Contributions and Transfers (221,216.31)
Contributed Capital 107,500.00
Change in Net Assets (113,716.31)
Net Assets -- July 1 996,347.84
Net Assets -- June 30 882,631.53$
101
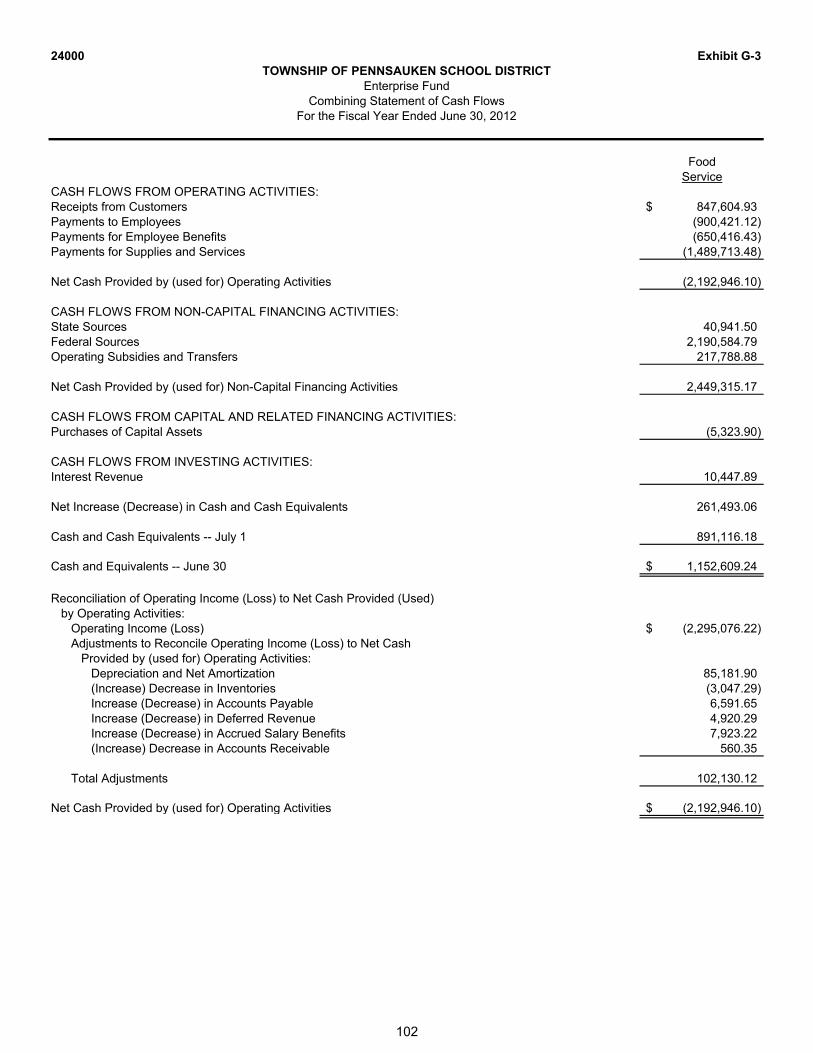
24000 Exhibit G-3TOWNSHIP OF PENNSAUKEN SCHOOL DISTRICT
Enterprise FundCombining Statement of Cash Flows
For the Fiscal Year Ended June 30, 2012
FoodService
CASH FLOWS FROM OPERATING ACTIVITIES:Receipts from Customers 847,604.93$ Payments to Employees (900,421.12)Payments for Employee Benefits (650,416.43)Payments for Supplies and Services (1,489,713.48)
Net Cash Provided by (used for) Operating Activities (2,192,946.10)
CASH FLOWS FROM NON-CAPITAL FINANCING ACTIVITIES:State Sources 40,941.50Federal Sources 2,190,584.79Operating Subsidies and Transfers 217,788.88
Net Cash Provided by (used for) Non-Capital Financing Activities 2,449,315.17
CASH FLOWS FROM CAPITAL AND RELATED FINANCING ACTIVITIES:Purchases of Capital Assets (5,323.90)
CASH FLOWS FROM INVESTING ACTIVITIES:Interest Revenue 10,447.89
Net Increase (Decrease) in Cash and Cash Equivalents 261,493.06
Cash and Cash Equivalents -- July 1 891,116.18
Cash and Equivalents -- June 30 1,152,609.24$
Reconciliation of Operating Income (Loss) to Net Cash Provided (Used) by Operating Activities: Operating Income (Loss) (2,295,076.22)$ Adjustments to Reconcile Operating Income (Loss) to Net Cash Provided by (used for) Operating Activities: Depreciation and Net Amortization 85,181.90 (Increase) Decrease in Inventories (3,047.29) Increase (Decrease) in Accounts Payable 6,591.65 Increase (Decrease) in Deferred Revenue 4,920.29 Increase (Decrease) in Accrued Salary Benefits 7,923.22 (Increase) Decrease in Accounts Receivable 560.35
Total Adjustments 102,130.12
Net Cash Provided by (used for) Operating Activities (2,192,946.10)$
102

FIDUCIARY FUNDS
103

24000 Exhibit H-1TOWNSHIP OF PENNSAUKEN SCHOOL DISTRICT
Fiduciary FundsCombining Statement of Fiduciary Net Assets
June 30, 2012
Trust Funds Agency Funds
UnemploymentScholarship Compensation Student
Trust Trust Activity Payroll Total
ASSETS:Cash and Cash Equivalents 21,487.00$ 591,810.71$ 276,079.99$ 26,505.46$ 915,883.16$
Accounts Receivable: Interfund Accounts Receivable: Due Agency Fund -- Payroll 29,409.36 29,409.36 Due General Fund 71,981.14 71,981.14 Refunds Receivable 15,764.58 15,764.58
Total Assets - 29,409.36 - 87,745.72 117,155.08
Total Assets 21,487.00 621,220.07 276,079.99$ 114,251.18$ 1,033,038.24
LIABILITIES:Accounts Payable 45,505.78 45,505.78 Interfund Accounts Payable: Due Unemployment Fund 29,409.36$ 29,409.36 Due Permanent Fund 846.59$ 846.59 Due General Fund 63,896.43 63,896.43Payable to Student Groups 275,233.40 275,233.40Payroll Deductions and Withholdings 84,841.82 84,841.82
Total Liabilities - 109,402.21 276,079.99$ 114,251.18$ 499,733.38
NET ASSETS:Held in Trust for Unemployment Claims and Other Purposes 21,487.00$ 511,817.86$ 533,304.86$
104

24000 Exhibit H-2TOWNSHIP OF PENNSAUKEN SCHOOL DISTRICT
Fiduciary FundsCombining Statement of Changes in Fiduciary Net Assets
For the Fiscal Year Ended June 30, 2012
UnemploymentScholarship Compensation
Trust Trust
ADDITIONS:Contributions and Donations from Payroll Deductions Withheld 76,096.66$ Scholarship Donations 3,128.00$ Investment Earnings: Interest 69.74 6,442.33
Total Additions 3,197.74 82,538.99
DEDUCTIONS:Scholarship Awards 3,500.00 Unemployment Claims 197,856.63
Total Deductions 3,500.00 197,856.63
Change in Net Assets (302.26) (115,317.64)
Net Assets -- July 1 21,789.26 627,135.50
Net Assets -- June 30 21,487.00$ 511,817.86$
105

24000 Exhibit H-3TOWNSHIP OF PENNSAUKEN SCHOOL DISTRICT
Fiduciary FundsStudent Activity Agency Fund Schedule of Receipts and Disbursements
For the Fiscal Year Ended June 30, 2012
Balance Cash Cash BalanceJune 30, 2011 Receipts Disbursements June 30, 2012
GENERAL 161,391.75$ 1,476.74$ 20,500.00$ 142,368.49$
MIDDLE SCHOOL 30,214.73 58,108.20 59,302.52 29,020.41
INTERMEDIATE SCHOOL 2,786.23 9,009.63 8,955.57 2,840.29
SENIOR HIGH SCHOOL: Pennsauken High School 90,870.35 276,343.07 265,395.28 101,818.14 Student Athletics 1,909.98 48,667.68 50,545.00 32.66
Total High School 92,780.33 325,010.75 315,940.28 101,850.80
Total All Schools 287,173.04$ 393,605.32$ 404,698.37$ 276,079.99$
106

24000 Exhibit H-4TOWNSHIP OF PENNSAUKEN SCHOOL DISTRICT
Fiduciary FundsPayroll Agency Fund Schedule of Receipts and Disbursements
For the Fiscal Year Ended June 30, 2012
Balance BalanceJune 30, 2011 Additions Deletions June 30, 2012
ASSETS:
Cash and Cash Equivalents 838,633.45$ 53,470,086.33$ 54,282,214.32$ 26,505.46$ Refunds Receivable 15,764.58 15,764.58 Due from General Fund 135,296.37 63,315.23 71,981.14
Total Assets 838,633.45$ 53,621,147.28$ 54,345,529.55$ 114,251.18$
LIABILITIES:
Payroll Deductions and Withholdings 414,436.51$ 23,116,691.55$ 23,446,286.24$ 84,841.82$ Net Payroll 30,428,359.07 30,428,359.07 Interfund Accounts Payable: Expendable Trust Fund 20,666.70 76,096.66 67,354.00 29,409.36 General Fund 403,530.24 403,530.24
Total Liabilities 838,633.45$ 53,621,147.28$ 54,345,529.55$ 114,251.18$
107

LONG-TERM DEBT
108

24000 Exhibit I-1TOWNSHIP OF PENNSAUKEN SCHOOL DISTRICT
Schedule of Serial BondsFor the Fiscal Year Ended June 30, 2012
Date of Amount of Annual Maturities Interest Balance BalanceIssue Issue Issue Date Amount Rate June 30, 2011 Issued Retired June 30, 2012
Series 2005 02/24/05 31,685,000.00$ 4-1-13 3,040,000.00$ 4.25%4-1-14 3,130,000.00 4.25%4-1-15 3,230,000.00 4.25%4-1-16 3,295,000.00 3.90%4-1-17 3,475,000.00 3.95%4-1-18 3,650,000.00 4.00%4-1-19 3,730,000.00 4.00% 26,520,000.00$ - 2,970,000.00$ 23,550,000.00$
109

24000 Exhibit I-2TOWNSHIP OF PENNSAUKEN SCHOOL DISTRICT
Schedule of Obligations Under Capital LeasesFor the Fiscal Year Ended June 30, 2012
Date Term Interest Amount Issued Retired Amountof of Amount of Original Issue Rate Outstanding Current Current Outstanding
Series Lease Lease Principal Interest Payable June 30, 2011 (a) Year Year June 30, 2012 (a)
(1) Student Information System 09/01/11 3 Years 137,450.00$ 12,550.00$ 3.620% 137,450.00$ 137,450.00$
(3) 2010 Buses 07/19/09 3 Years 240,110.00 11,652.10 3.600% 80,747.94$ 80,747.94$
(2) Cannon Copiers 03/10/10 3 Years 193,782.00 17,731.20 3.500% 148,463.32 37,707.68 110,755.64
229,211.26$ 137,450.00$ 118,455.62$ 248,205.64$
(a) Future Interest Payments Removed from Carrying Value of Leases.
110

24000 Exhibit I-3TOWNSHIP OF PENNSAUKEN SCHOOL DISTRICT
Budgetary Comparison Schedule Debt Service Fund
For the Fiscal Year Ended June 30, 2012
VarianceOriginal Budget Final Positive (Negative)Budget Transfers Budget Actual Final to Actual
REVENUES:
Local Sources: Local Tax Levy 2,407,910.00$ 2,407,910.00$ 2,407,910.00$ State Sources: Debt Service Aid Type II 1,606,188.00 1,606,188.00 1,606,188.00
Total Revenues 4,014,098.00 - 4,014,098.00 4,014,098.00 -
EXPENDITURES:
Regular Debt Service: Interest 1,046,905.00 1,046,905.00 1,046,904.60 0.40$ Redemption of Principal 2,970,000.00 2,970,000.00 2,970,000.00
Total Expenditures 4,016,905.00 - 4,016,905.00 4,016,904.60 0.40
Excess (Deficiency) of Revenues Over (Under) Expenditures (2,807.00) - (2,807.00) (2,806.60) 0.40
Fund Balance, July 1 2,806.63 - 2,806.63 2,806.63 -
Fund Balance, June 30 (0.37)$ - (0.37)$ 0.03$ 0.40$
111

STATISTICAL SECTION
112

Financial Trends Information
Financial trends information is intended to assist the user in understanding and assessing how the School District’s financial position has changed over time. Please refer to the following exhibits for a historical view of the School District’s financial performance.
113

24000 Exhibit J-1
2012 2011 2010 2009 2008 2007 2006 2005 2004 2003
Governmental Activities:Invested in Capital Assets, Net of Related Debt 18,597,789.17$ 15,978,876.45$ 13,651,296.15$ 10,475,418.98$ 9,514,902.50$ 8,282,089.80$ 6,089,562.47$ 4,964,484.85$ 3,994,388.19$ 2,716,170.12$ Restricted 17,088,644.02 12,974,059.20 15,602,679.42 19,513,829.69 16,451,763.94 13,411,247.86 12,056,901.78 8,139,098.07 2,070,507.94 2,808,879.25 Unrestricted (3,928,760.23) (1,588,429.57) (4,325,164.94) (2,090,814.90) (1,169,231.98) (1,163,603.68) (1,044,286.17) 117,529.89 3,260,281.23 1,957,415.54
Total Governmental Activities Net Assets 31,757,672.96$ 27,364,506.08$ 24,928,810.63$ 27,898,433.77$ 24,797,434.46$ 20,529,733.98$ 17,102,178.08$ 13,221,112.81$ 9,325,177.36$ 7,482,464.91$
Business-type Activities:Invested in Capital Assets, Net of Related Debt 500,968.49$ 473,326.49$ 546,666.92$ 519,804.60$ 529,027.97$ 567,242.86$ 568,666.23$ 588,432.85$ 648,440.55$ 697,639.19$ Unrestricted 381,663.04 523,021.35 592,161.07 654,165.38 730,794.19 725,390.26 659,312.96 428,198.33 189,630.83 239,343.92
Total Business-type Activities Net Assets 882,631.53$ 996,347.84$ 1,138,827.99$ 1,173,969.98$ 1,259,822.16$ 1,292,633.12$ 1,227,979.19$ 1,016,631.18$ 838,071.38$ 936,983.11$
District-wide:Invested in Capital Assets, Net of Related Debt 19,098,757.66$ 16,452,202.94$ 14,197,963.07$ 10,995,223.58$ 10,043,930.47$ 8,849,332.66$ 6,658,228.70$ 5,552,917.70$ 4,642,828.74$ 3,413,809.31$ Restricted 17,088,644.02 12,974,059.20 15,602,679.42 19,513,829.69 16,451,763.94 13,411,247.86 12,056,901.78 8,139,098.07 2,070,507.94 2,808,879.25 Unrestricted (3,547,097.19) (1,065,408.22) (3,733,003.87) (1,436,649.52) (438,437.79) (438,213.42) (384,973.21) 545,728.22 3,449,912.06 2,196,759.46
Total District-wide Net Assets 32,640,304.49$ 28,360,853.92$ 26,067,638.62$ 29,072,403.75$ 26,057,256.62$ 21,822,367.10$ 18,330,157.27$ 14,237,743.99$ 10,163,248.74$ 8,419,448.02$
Source: Exhibit A-1
Fiscal Year Ended June 30,
TOWNSHIP OF PENNSAUKEN SCHOOL DISTRICTNet Assets by Component
Last Ten Fiscal Years (Accrual Basis of Accounting)Unaudited
114

24000 Exhibit J-2
2012 2011 2010 2009 2008 2007 2006 2005 2004 2003Expenses:
Governmental Activities:Instruction:
Regular 24,083,201.49$ 23,753,650.27$ 24,748,038.50$ 24,056,366.72$ 20,034,160.34$ 19,524,302.63$ 19,042,263.70$ 19,204,230.27$ 18,954,495.47$ 22,068,509.93$ Special Education 9,446,366.00 10,084,115.04 10,334,044.03 9,861,586.40 11,294,145.13 11,802,512.50 10,536,787.07 11,413,984.28 11,110,209.34 7,191,242.90 Other Special Education 437,210.26 755,374.31 908,311.71 354,986.47 278,403.18 135,726.54 102,599.83 95,699.87 240,584.15 158,674.95 Other Instruction 1,262,800.83 779,026.57 826,136.89 780,783.20 796,670.08 748,384.76 735,460.07 819,616.91 941,777.53 1,040,033.86
Support Services:Tuition 7,948,474.60 8,033,185.23 8,499,180.99 7,516,143.47 6,534,047.81 4,541,774.58 5,370,991.12 3,873,992.09 3,740,804.12 3,116,381.79 Student and Instruction Related Services 6,676,305.43 6,610,873.26 8,315,875.23 6,975,497.37 7,186,050.24 6,610,183.94 6,477,472.13 6,320,670.31 6,135,937.59 6,137,794.37 School Administrative Services 2,779,594.88 2,666,973.97 3,019,663.09 2,839,906.56 2,599,262.78 2,749,064.31 2,473,954.44 2,466,887.08 2,158,103.12 2,318,169.97 Other Administrative Services 3,080,287.23 2,901,744.46 3,348,520.25 3,456,421.76 3,060,373.20 2,951,575.20 2,942,971.40 3,113,275.41 3,218,314.41 2,847,654.63 Plant Operations and Maintenance 8,521,054.59 8,516,377.76 9,379,751.77 8,173,792.39 7,927,311.89 7,803,296.82 7,560,177.66 7,228,116.28 7,065,697.87 6,799,056.18 Pupil Transportation 4,960,279.97 4,041,299.06 4,285,504.41 4,054,252.39 4,576,775.18 3,624,460.94 4,123,683.39 3,977,936.18 4,034,171.07 3,156,035.62 Unallocated Benefits 16,906,273.85 17,099,436.71 15,274,480.08 15,296,838.48 11,772,318.39 11,787,432.02 11,066,947.51 10,046,923.84 10,151,722.53 9,190,866.00 Reimbursed TPAF and Social Security 6,298,859.40 5,296,018.07 5,250,311.44 5,020,100.70 7,814,589.21 7,845,742.73 5,203,978.00 4,659,767.26 4,358,239.34 3,591,300.07 Special Schools 179,046.32 158,052.59 140,484.84 94,323.49 120,725.54 82,159.27 150,993.34 Transfer to Charter Schools 1,802,172.00 1,579,217.00 1,471,433.00 1,165,467.00 894,015.00 730,161.00 630,806.00 499,075.00 292,819.00 219,190.00
Interest on Long-term Debt 1,126,243.76 1,238,117.91 1,323,686.50 1,410,227.61 1,525,043.71 1,631,256.81 1,735,566.46 1,401,926.41 2,058,162.56 2,153,949.10 Amortization of Bond Issuance Costs 20,495.00 20,495.00 29,915.49 55,622.02 55,622.02 55,622.02 55,622.02 59,904.32 Unallocated Depreciation 60,059.22 150,512.22 197,136.96 85,011.00 95,436.73 591,342.76 72,677.00
Total Governmental Activities Expenses 95,349,619.29 93,375,904.62 97,074,912.60 91,347,551.08 86,703,977.71 82,766,992.64 78,249,041.02 75,894,073.81 74,615,874.37 70,139,852.71
Business-type Activities:Food Service 3,137,200.51 2,910,532.81 2,890,471.08 2,730,574.13 2,722,224.75 2,557,057.77 2,382,266.43 2,267,981.69 2,253,656.75 1,987,880.19
Total Business-type Activities Expense 3,137,200.51 2,910,532.81 2,890,471.08 2,730,574.13 2,722,224.75 2,557,057.77 2,382,266.43 2,267,981.69 2,253,656.75 1,987,880.19
Total District Expenses 98,486,819.80$ 96,286,437.43$ 99,965,383.68$ 94,078,125.21$ 89,426,202.46$ 85,324,050.41$ 80,631,307.45$ 78,162,055.50$ 76,869,531.12$ 72,127,732.90$
Program Revenues:Governmental Activities:
Charges for services 1,072,590.56$ 618,550.00$ 681,545.45$ 733,133.47$ 727,991.60$ 661,103.00$ 762,761.78$ 914,355.95$ 1,012,320.60$ 882,420.00$ Operating Grants and Contributions 12,079,991.62 12,004,801.98 12,393,472.52 10,247,068.19 17,733,582.97 16,377,689.41 13,892,182.00 13,617,560.25 13,015,070.07 12,531,092.49Capital Grants and Contributions 10,000.00
Total Governmental Activities Program Revenues 13,152,582.18 12,623,351.98 13,075,017.97 10,990,201.66 18,461,574.57 17,038,792.41 14,654,943.78 14,531,916.20 14,027,390.67 13,413,512.49
(Continued)
TOWNSHIP OF PENNSAUKEN SCHOOL DISTRICTChanges in Net Assets
Last Ten Fiscal Years (Accrual Basis of Accounting)
Fiscal Year Ended June 30,
Unaudited
115

24000 Exhibit J-2
2012 2011 2010 2009 2008 2007 2006 2005 2004 2003
TOWNSHIP OF PENNSAUKEN SCHOOL DISTRICTChanges in Net Assets
Last Ten Fiscal Years (Accrual Basis of Accounting)
Fiscal Year Ended June 30,
Unaudited
Program Revenues (Cont'd):Business-type activities:
Charges for servicesFood service 842,124.29$ 871,226.85$ 856,395.74$ 885,715.79$ 953,026.90$ 1,033,438.63$ 1,140,342.22$ 1,176,895.39$ 1,157,070.48$ 1,124,200.30$
Capital Grants and Contributions 107,500.00 57,159.20 4,741.00 571.00 Operating Grants and Contributions 2,063,412.02 1,895,317.67 1,932,487.02 1,734,327.27 1,657,427.44 1,479,455.82 1,374,084.89 1,236,169.54 989,198.72 889,727.27
Total Business-type Activities Program Revenues 3,013,036.31 2,766,544.52 2,846,041.96 2,624,784.06 2,611,025.34 2,512,894.45 2,514,427.11 2,413,064.93 2,146,269.20 2,013,927.57
Total District Program Revenues 16,165,618.49$ 15,389,896.50$ 15,921,059.93$ 13,614,985.72$ 21,072,599.91$ 19,551,686.86$ 17,169,370.89$ 16,944,981.13$ 16,173,659.87$ 15,427,440.06$
Net (Expense)/Revenue:Governmental Activities (82,197,037.11)$ (80,752,552.64)$ (83,999,894.63)$ (80,357,349.42)$ (68,242,403.14)$ (65,728,200.23)$ (63,594,097.24)$ (61,362,157.61)$ (60,588,483.70)$ (56,726,340.22)$
Business-type Activities (124,164.20) (143,988.29) (44,429.12) (105,790.07) (111,199.41) (44,163.32) 132,160.68 145,083.24 (107,387.55) 26,047.38
Total District-wide Net Expense (82,321,201.31)$ (80,896,540.93)$ (84,044,323.75)$ (80,463,139.49)$ (68,353,602.55)$ (65,772,363.55)$ (63,461,936.56)$ (61,217,074.37)$ (60,695,871.25)$ (56,700,292.84)$
General Revenues and Other Changes in Net Assets:Governmental Activities:
Property Taxes Levied for General Purposes, Net 34,631,347.00$ 34,631,347.00$ 34,260,911.00$ 34,388,514.00$ 34,433,660.00$ 33,134,647.00$ 31,386,960.00$ 29,976,732.00$ 28,199,245.00$ 25,112,947.00$ Taxes Levied for Debt Service 2,407,910.00 2,428,961.00 2,210,496.00 2,082,893.00 2,037,747.00 2,169,042.00 1,904,099.00 2,122,692.00 2,091,936.00 1,396,152.00 Unrestricted Grants and Contributions 47,912,867.93 45,144,427.29 41,248,283.63 43,800,521.15 32,937,112.02 31,298,796.30 31,373,902.15 31,164,011.69 29,720,100.98 27,659,288.79 Restricted Grants and Contributions 1,188,406.05 650,934.93 2,871,886.86 1,203,734.00 1,825,810.56 1,321,709.07 1,527,920.55 1,329,238.87 1,545,317.97 1,071,601.23 Investment Earnings 99,768.85 103,500.43 320,468.03 320,468.03 567,373.41 718,064.35 562,464.28 266,382.09 78,041.68 61,443.52 Other 390,675.98 306,938.39 146,774.07 253,155.67 641,530.66 462,081.86 355,262.53 439,036.41 210,335.28 427,271.98 Capital Leases Charged to Instruction 187,039.48 206,787.81 Disposal/Adjustment of Assets 399,554.00 431,092.00 (1,128,577.28) Cancellation of Prior Year Accounts Receivable (133,473.75) (38,359.00) Cancellation of Special Revenue Grant Balances 235,801.93 (8,501.95) Cancellation of Payables 45,895.95 66,870.06 50,471.60 Transfers (143,100.00) (31,000.00) (28,548.10) 1,363,166.93 (0.09) 943.95 (35,000.00) (40,000.00) (31,912.24) (21,083.89)
Total Governmental Activities 86,590,203.99 83,188,248.09 81,030,271.49 83,458,348.73 72,510,103.62 69,155,756.13 67,475,162.51 65,258,093.06 62,431,196.15 54,785,831.16
Business-type Activities:Investment Earnings 10,447.89 10,683.82 9,287.13 19,937.89 78,388.45 108,817.25 79,187.33 33,476.56 8,475.82 9,138.92 Cancellation of Prior Year Accounts Receivable (9,175.68)
Total Business-type Activities 10,447.89 1,508.14 9,287.13 19,937.89 78,388.45 108,817.25 79,187.33 33,476.56 8,475.82 9,138.92
Total District-wide 86,600,651.88$ 83,189,756.23$ 81,039,558.62$ 83,478,286.62$ 72,588,492.07$ 69,264,573.38$ 67,554,349.84$ 65,291,569.62$ 62,439,671.97$ 54,794,970.08$
Change in Net Assets:Governmental Activities 4,393,166.88$ 2,435,695.45$ (2,969,623.14)$ 3,100,999.31$ 4,267,700.48$ 3,427,555.90$ 3,881,065.27$ 3,895,935.45$ 1,842,712.45$ (1,940,509.06)$
Business-type Activities (113,716.31) (142,480.15) (35,141.99) (85,852.18) (32,810.96) 64,653.93 211,348.01 178,559.80 (98,911.73) 35,186.30
Total District 4,279,450.57$ 2,293,215.30$ (3,004,765.13)$ 3,015,147.13$ 4,234,889.52$ 3,492,209.83$ 4,092,413.28$ 4,074,495.25$ 1,743,800.72$ (1,905,322.76)$
Source: Exhibit A-2
116

24000 Exhibit J-3
2012 2011 2010 2009 2008 2007 2006 2005 2004 2003
General Fund:Nonspendable 225,984.14$ 183,922.48$ Restricted 11,420,825.90 10,225,188.53 12,296,554.20$ 17,965,073.28$ 13,671,845.56$ 11,147,725.70$ 9,754,608.07$ 6,534,430.43$ 3,490,918.64$ 3,442,994.38$ Assigned 1,443,502.41 999,822.87 Unassigned 2,306,971.42 (344,241.02) 2,002,797.03 1,859,049.93 1,676,063.43 1,855,221.75 2,948,830.34 3,768,423.87 3,528,232.52
Total General Fund 13,090,312.45$ 13,715,905.30$ 11,952,313.18$ 19,967,870.31$ 15,530,895.49$ 12,823,789.13$ 11,609,829.82$ 9,483,260.77$ 7,259,342.51$ 6,971,226.90$
All Other Governmental Funds:Nonspendable 8,000.00$ 8,000.00$ Restricted 3,582,259.59 687,181.63 1,266,534.00$ 221,069.87$ 8,000.00$ 460,905.00$ Unassigned, Reported in:
Capital Projects Fund 692,900.00 213,069.87 193,436.87 749,431.87$ 749,431.87$ 719,681.63$ 691,593.87$ Special Revenue Fund 647,061.99 1,133,448.97 1,636,102.03 1,478,431.99 2,588,024.86 1,895,380.23 1,615,388.24 1,189,312.69 564,647.61 171,118.69 Debt Service Fund 2,806.63 9,376.00 126,718.62 130,542.83 176,412.33 Permanent Fund 1,129.04 1,587.44 2,042.61 2,362.16 42.85 1,000.00 1,000.00 1,000.00 1,000.00
Total All Other Governmental Funds 4,237,321.58$ 1,829,759.64$ 3,599,930.10$ 1,701,544.47$ 2,811,456.89$ 2,549,764.95$ 2,375,196.11$ 2,066,463.18$ 1,415,872.07$ 1,040,124.89$
(1) In accordance with GASB 54, effective for the fiscal year ended June 30, 2011, the description and terminology utilized to identify fund Balance was changed. See the notes to the financial statements.
Source: Exhibit B-1
Fiscal Year Ended June 30,
TOWNSHIP OF PENNSAUKEN SCHOOL DISTRICTFund Balances, Governmental Funds
Last Ten Fiscal Years (Modified Accrual Basis of Accounting)Unaudited
117
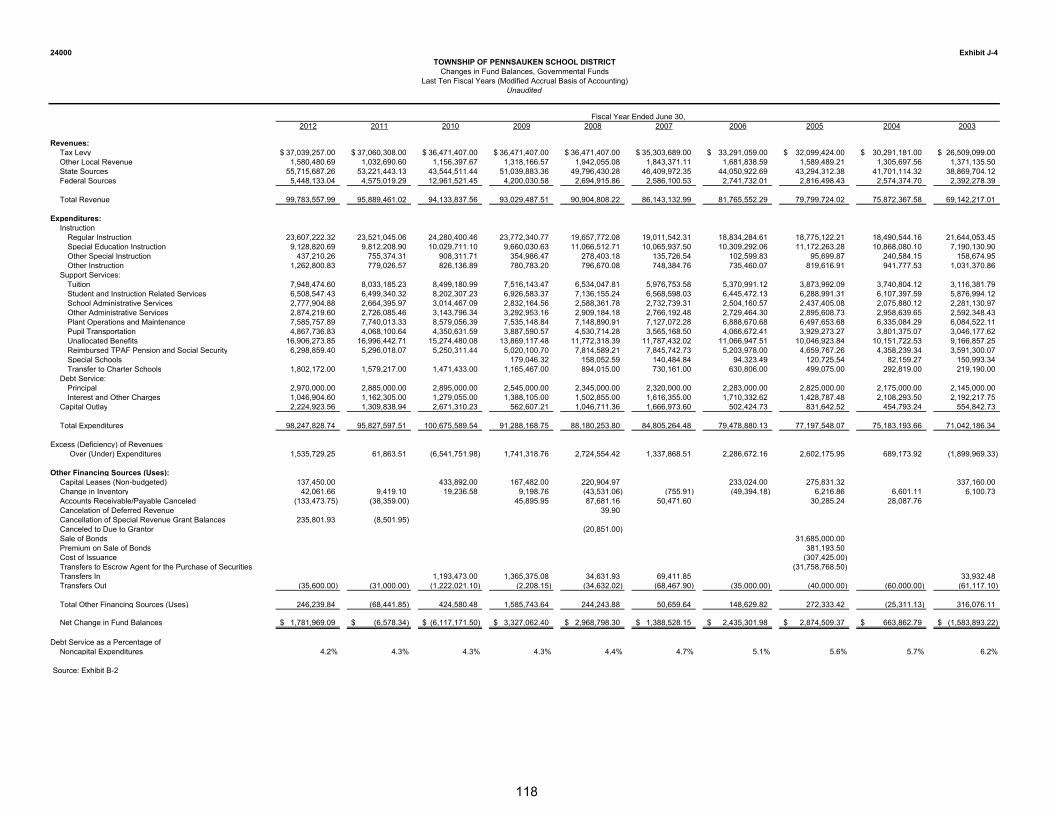
24000 Exhibit J-4
2012 2011 2010 2009 2008 2007 2006 2005 2004 2003
Revenues:Tax Levy 37,039,257.00$ 37,060,308.00$ 36,471,407.00$ 36,471,407.00$ 36,471,407.00$ 35,303,689.00$ 33,291,059.00$ 32,099,424.00$ 30,291,181.00$ 26,509,099.00$ Other Local Revenue 1,580,480.69 1,032,690.60 1,156,397.67 1,318,166.57 1,942,055.08 1,843,371.11 1,681,838.59 1,589,489.21 1,305,697.56 1,371,135.50 State Sources 55,715,687.26 53,221,443.13 43,544,511.44 51,039,883.36 49,796,430.28 46,409,972.35 44,050,922.69 43,294,312.38 41,701,114.32 38,869,704.12 Federal Sources 5,448,133.04 4,575,019.29 12,961,521.45 4,200,030.58 2,694,915.86 2,586,100.53 2,741,732.01 2,816,498.43 2,574,374.70 2,392,278.39
Total Revenue 99,783,557.99 95,889,461.02 94,133,837.56 93,029,487.51 90,904,808.22 86,143,132.99 81,765,552.29 79,799,724.02 75,872,367.58 69,142,217.01
Expenditures:Instruction
Regular Instruction 23,607,222.32 23,521,045.06 24,280,400.46 23,772,340.77 19,657,772.08 19,011,542.31 18,834,284.61 18,775,122.21 18,490,544.16 21,644,053.45 Special Education Instruction 9,128,820.69 9,812,208.90 10,029,711.10 9,660,030.63 11,066,512.71 10,065,937.50 10,309,292.06 11,172,263.28 10,868,080.10 7,190,130.90 Other Special Instruction 437,210.26 755,374.31 908,311.71 354,986.47 278,403.18 135,726.54 102,599.83 95,699.87 240,584.15 158,674.95 Other Instruction 1,262,800.83 779,026.57 826,136.89 780,783.20 796,670.08 748,384.76 735,460.07 819,616.91 941,777.53 1,031,370.86
Support Services:Tuition 7,948,474.60 8,033,185.23 8,499,180.99 7,516,143.47 6,534,047.81 5,976,753.58 5,370,991.12 3,873,992.09 3,740,804.12 3,116,381.79 Student and Instruction Related Services 6,508,547.43 6,499,340.32 8,202,307.23 6,926,583.37 7,136,155.24 6,568,598.03 6,445,472.13 6,288,991.31 6,107,397.59 5,876,994.12 School Administrative Services 2,777,904.88 2,664,395.97 3,014,467.09 2,832,164.56 2,588,361.78 2,732,739.31 2,504,160.57 2,437,405.08 2,075,880.12 2,281,130.97 Other Administrative Services 2,874,219.60 2,726,085.46 3,143,796.34 3,292,953.16 2,909,184.18 2,766,192.48 2,729,464.30 2,895,608.73 2,958,639.65 2,592,348.43 Plant Operations and Maintenance 7,585,757.89 7,740,013.33 8,579,056.39 7,535,148.84 7,148,890.91 7,127,072.28 6,888,670.68 6,497,653.68 6,335,084.29 6,084,522.11 Pupil Transportation 4,867,736.83 4,068,100.64 4,350,631.59 3,887,590.57 4,530,714.28 3,565,168.50 4,066,672.41 3,929,273.27 3,801,375.07 3,046,177.62 Unallocated Benefits 16,906,273.85 16,996,442.71 15,274,480.08 13,869,117.48 11,772,318.39 11,787,432.02 11,066,947.51 10,046,923.84 10,151,722.53 9,166,857.25 Reimbursed TPAF Pension and Social Security 6,298,859.40 5,296,018.07 5,250,311.44 5,020,100.70 7,814,589.21 7,845,742.73 5,203,978.00 4,659,767.26 4,358,239.34 3,591,300.07 Special Schools 179,046.32 158,052.59 140,484.84 94,323.49 120,725.54 82,159.27 150,993.34 Transfer to Charter Schools 1,802,172.00 1,579,217.00 1,471,433.00 1,165,467.00 894,015.00 730,161.00 630,806.00 499,075.00 292,819.00 219,190.00
Debt Service:Principal 2,970,000.00 2,885,000.00 2,895,000.00 2,545,000.00 2,345,000.00 2,320,000.00 2,283,000.00 2,825,000.00 2,175,000.00 2,145,000.00 Interest and Other Charges 1,046,904.60 1,162,305.00 1,279,055.00 1,388,105.00 1,502,855.00 1,616,355.00 1,710,332.62 1,428,787.48 2,108,293.50 2,192,217.75
Capital Outlay 2,224,923.56 1,309,838.94 2,671,310.23 562,607.21 1,046,711.36 1,666,973.60 502,424.73 831,642.52 454,793.24 554,842.73
Total Expenditures 98,247,828.74 95,827,597.51 100,675,589.54 91,288,168.75 88,180,253.80 84,805,264.48 79,478,880.13 77,197,548.07 75,183,193.66 71,042,186.34
Excess (Deficiency) of Revenues Over (Under) Expenditures 1,535,729.25 61,863.51 (6,541,751.98) 1,741,318.76 2,724,554.42 1,337,868.51 2,286,672.16 2,602,175.95 689,173.92 (1,899,969.33)
Other Financing Sources (Uses):Capital Leases (Non-budgeted) 137,450.00 433,892.00 167,482.00 220,904.97 233,024.00 275,831.32 337,160.00 Change in Inventory 42,061.66 9,419.10 19,236.58 9,198.76 (43,531.06) (755.91) (49,394.18) 6,216.86 6,601.11 6,100.73 Accounts Receivable/Payable Canceled (133,473.75) (38,359.00) 45,895.95 87,681.16 50,471.60 30,285.24 28,087.76 Cancelation of Deferred Revenue 39.90 Cancellation of Special Revenue Grant Balances 235,801.93 (8,501.95) Canceled to Due to Grantor (20,851.00) Sale of Bonds 31,685,000.00 Premium on Sale of Bonds 381,193.50 Cost of Issuance (307,425.00) Transfers to Escrow Agent for the Purchase of Securities (31,758,768.50) Transfers In 1,193,473.00 1,365,375.08 34,631.93 69,411.85 33,932.48 Transfers Out (35,600.00) (31,000.00) (1,222,021.10) (2,208.15) (34,632.02) (68,467.90) (35,000.00) (40,000.00) (60,000.00) (61,117.10)
Total Other Financing Sources (Uses) 246,239.84 (68,441.85) 424,580.48 1,585,743.64 244,243.88 50,659.64 148,629.82 272,333.42 (25,311.13) 316,076.11
Net Change in Fund Balances 1,781,969.09$ (6,578.34)$ (6,117,171.50)$ 3,327,062.40$ 2,968,798.30$ 1,388,528.15$ 2,435,301.98$ 2,874,509.37$ 663,862.79$ (1,583,893.22)$
Debt Service as a Percentage ofNoncapital Expenditures 4.2% 4.3% 4.3% 4.3% 4.4% 4.7% 5.1% 5.6% 5.7% 6.2%
Source: Exhibit B-2
Fiscal Year Ended June 30,
TOWNSHIP OF PENNSAUKEN SCHOOL DISTRICTChanges in Fund Balances, Governmental Funds
Last Ten Fiscal Years (Modified Accrual Basis of Accounting)Unaudited
118

24000 Exhibit J-5
TOWNSHIP OF PENNSAUKEN SCHOOL DISTRICTGeneral Fund - Other Local Revenue by Source
Last Ten Fiscal Years (Modified Accrual Basis of Accounting)Unaudited
2012 2011 2010 2009 2008 2007 2006 2005 2004 2003
Rental of School Facilities 16,217.50$ 18,035.00$ 5,110.00$ 9,215.00$ 111,652.50$ 114,008.63$ 20,268.25$ 14,439.00$ 33,187.00$ Lost Book Money 7,961.84 510.17 Comcast Tower Rental 22,750.00 21,000.00 19,999.98 18,999.96 20,583.29 17,416.63 17,416.63 18,416.71 17,000.04 Sale of Property 2,000.00 5,000.00 Refund of Prior Year Expenditures 92,577.25 50,232.53 43,513.73 64,709.92 272,140.62 113,175.06 90,229.95 57,867.42$ 49,445.93 68,525.02 Medicaid Initiative - SEMI Program 17,547.81 Adult School Tuition 6,015.00 22,715.00 46,530.00 Cancellation of Prior Year Accounts Payable 3,399.27 Cancellation of Outstanding Checks 8,001.01 Other 12,840.43 20,358.32 3,990.46 9,244.24 26,221.69 22,945.00 93,589.58 2,431.40 Settlement 29,701.34 7,000.00 2,817.19 Restitution 52.27 13,215.00 Miscellaneous Sales 519.31 36,303.32 11,524.34 1,109.72 5,832.43 7,522.55 8,135.60 Transportation Fees 13,890.40 9,912.00 6,352.00 4,877.37 8,887.20 E-Rate Refunds 216,564.37 181,947.38 143,725.06 147,357.09 137,103.41 134,589.45 112,267.39 71,873.05 Nonpublic Grant Administrative Fee 1,954.56 2,135.96 NJSBA Safety Award 13,369.00 12,471.00 Interest Earned on Deposits 99,768.85 103,500.43 218,443.44 320,468.03 567,373.41 718,064.35 562,464.28 78,041.68 61,443.52
Total Miscellaneous Revenues 490,419.74$ 410,397.22$ 464,390.64$ 573,330.74$ 1,185,268.64$ 1,141,635.46$ 917,726.91$ 63,699.85$ 288,376.96$ 266,766.36$
Source: District Records
Fiscal Year Ended June 30,
119

Revenue Capacity Information
Revenue capacity information is intended to assist users in understanding and assessing the factors affecting the School District’s ability to generate revenues. Please refer to the following exhibits for a historical view of these factors and how they relate to the School District’s ability to generate revenues.
120

24000 Exhibit J-6
Year Total Estimated Actual Total Direct Ended Assessed Public Net Valuation Tax-Exempt (County Equalized ) School Tax Dec. 31 Vacant Land Residential Farm Commercial Industrial Apartment Value Utilities (1) Taxable Property Value Rate (2)
2012 16,088,700.00$ 994,847,000.00$ 411,461,200.00$ 90,481,800.00$ 23,487,100.00$ 1,536,365,800.00$ 2,753,453.00$ 1,539,119,253.00$ 276,870,000.00$ 2,575,500,758.00$ 2.407$ 2011 16,565,200.00 992,894,700.00 427,107,300.00 92,069,800.00 21,025,000.00 1,549,662,000.00 2,788,010.00 1,552,450,010.00 275,412,600.00 2,644,268,455.00 2.348 2010 16,241,200.00 991,682,500.00 434,811,400.00 98,486,100.00 21,516,500.00 1,562,737,700.00 3,104,950.00 1,565,842,650.00 254,750,000.00 2,719,893,434.00 2.348 2009 16,358,300.00 991,423,700.00 442,168,000.00 126,968,400.00 22,297,900.00 1,599,216,300.00 2,892,138.00 1,602,108,438.00 254,418,900.00 2,945,593,746.00 2.277 2008 16,499,500.00 989,074,800.00 459,986,200.00 119,667,000.00 22,311,900.00 1,607,539,400.00 2,968,218.00 1,610,507,618.00 254,320,400.00 2,775,780,107.00 2.265 2007 16,770,800.00 986,574,300.00 486,458,700.00 101,217,200.00 22,311,900.00 1,613,332,900.00 3,213,046.00 1,616,545,946.00 252,375,200.00 2,418,530,739.00 2.220 2006 16,409,300.00 983,672,100.00 512,301,200.00 82,441,300.00 22,144,000.00 1,616,967,900.00 3,440,954.00 1,620,408,854.00 247,717,300.00 2,154,799,008.00 2.117 2005 16,644,000.00 981,220,100.00 511,958,600.00 82,591,300.00 21,879,200.00 1,614,293,200.00 4,191,415.00 1,618,484,615.00 250,565,600.00 1,894,737,315.00 1.917 2004 16,104,500.00 979,790,000.00 521,449,800.00 82,492,400.00 22,075,700.00 1,621,912,400.00 4,710,853.00 1,626,623,253.00 236,846,500.00 (3) 1,904,265,105.00 1.917 2003 16,331,900.00 977,271,400.00 527,205,300.00 84,640,600.00 22,206,400.00 1,627,655,600.00 5,170,360.00 1,632,825,960.00 1,387,000.00 1,770,960,911.00 1.740
(1) Taxable Value of Machinery, Implements and Equipment of Telephone, Telegraph and Messenger System Companies
(2) Tax Rates are per $100.00 of Assessed Valuation
(3) Change in identification process
Source: Camden County Board of Taxation
TOWNSHIP OF PENNSAUKEN SCHOOL DISTRICTAssessed Value and Actual Value of Taxable Property
Last Ten Fiscal YearsUnaudited
121

24000 Exhibit J-7
Year General Total Direct Township of Total Direct Ended Obligation Debt School Township of Pennsauken Camden and Overlapping Dec. 31 Basic Rate Service Tax Rate Pennsauken Garbage District County Tax Rate
2012 2.251$ 0.156$ 2.407$ 1.414$ 0.264$ 1.219$ 5.304$ 2011 2.233 0.154 2.387 1.380 0.259 1.164 5.190 2010 2.205 0.143 2.348 1.322 0.254 1.080 5.004 2009 2.147 0.130 2.277 1.210 0.254 1.084 4.825 2008 2.138 0.127 2.265 1.141 0.246 1.045 4.697 2007 2.084 0.136 2.220 1.052 0.234 0.999 4.505 2006 1.988 0.129 2.117 0.892 0.225 1.023 4.257 2005 1.897 0.124 2.021 0.801 0.225 0.917 3.964 2004 1.788 0.129 1.917 0.731 0.204 0.909 3.761 2003 1.633 0.107 1.740 0.694 0.171 0.946 3.551
Source: Municipal Tax Collector
TOWNSHIP OF PENNSAUKEN SCHOOL DISTRICTDirect and Overlapping Property Tax Rates
Last Ten Fiscal Years(Rate per $100 of Assessed Value)
Unaudited
District Direct Rate Overlapping Rates
122

24000 Exhibit J-8
Taxable % of Total Taxable % of TotalAssessed District Net Assessed District Net
Taxpayer Value Rank Assessed Value Value Rank Assessed Value
Bloom Organization 60,777,100.00$ 1 3.95% 74,680,100.00$ 1 4.57%Shapes LLC 23,902,600.00 2 1.46%Citgo Petroleum Corp. 20,000,000.00 3 1.22%Amerada Hess Corp. 12,252,500.00 2 0.80% 18,406,900.00 4 1.13%Sauken Assoc. LP 7,718,200.00 3Menu Foods, Inc. 7,526,900.00 4 0.49%Shapes LLC 7,503,000.00 5 0.49%Lockbourne Manor Inc. 6,750,000.00 6 0.44% 13,480,000.00 5 0.83%Stech LTD LP, Standard Warehouse 6,579,400.00 7 0.43%Geriatric Medical Center 6,060,000.00 8 0.39% 12,110,700.00 6 0.74%Pepsi Cola Bottling Corp 9,542,000.00 7 0.58%Corporate Fairways LLC 8,430,000.00 10 0.52%Hankin, Joel, etc, 9,542,000.00 8 0.58%PSE&G 5,965,000.00 9 0.39%Sun Life Assurance Co. of Canada 5,700,000.00 10EMK -- Penn 8,821,900.00 9 0.54%
Total 126,832,100.00$ 7.37% 198,916,200.00$ 12.18%
Source: Municipal Tax Assessor
2012 2003
TOWNSHIP OF PENNSAUKEN SCHOOL DISTRICTPrincipal Property Tax Payers
Current Year and Nine Years AgoUnaudited
123

24000 Exhibit J-9
School DistrictTaxes Levied
Fiscal Year for the Percentage Collections inEnded June 30, Fiscal Year Amount of Levy Subsequent Years
2012 37,039,257.00$ 37,039,257.00$ 100.00% - 2011 37,060,308.00 37,060,308.00 100.00% - 2010 36,471,407.00 36,471,407.00 100.00% - 2009 36,471,407.00 36,471,407.00 100.00% - 2008 36,471,407.00 36,471,407.00 100.00% - 2007 35,303,689.00 35,303,689.00 100.00% - 2006 33,291,059.00 33,291,059.00 100.00% - 2005 32,099,424.00 32,099,424.00 100.00% - 2004 30,291,181.00 30,291,181.00 100.00% - 2003 26,509,099.00 26,509,099.00 100.00% -
(1) School taxes are collected by the Municipal Tax Collector. Under New Jersey State Statute, a municipality is required to remit to the school district the entire property tax balance, in the amount voted upon or certified prior to the end of the school year.
Source: District Records
Collected within the Fiscal Year of the Levy (1)
TOWNSHIP OF PENNSAUKEN SCHOOL DISTRICTProperty Tax Levies and Collections
Last Ten Fiscal YearsUnaudited
124

Debt Capacity Information
Debt capacity information is intended to assist users in understanding and assessing the School District’s debt burden and its ability to issue additional debt. Please refer to the following exhibits for a historical view of the School District’s outstanding debt and its debt capacity.
125

24000 Exhibit J-10
Business-Type Activities
Fiscal General Certificates Bond Percentage of Year Ended Obligation of Capital Anticipation Personal
June 30, Bonds (1) Participation Leases Notes Capital Leases Total District Income (2) Per Capita (3)
2012 23,550,000.00$ - 248,205.64$ - - 23,798,205.64$ Unavailable Unavailable2011 26,520,000.00 - 229,211.26 - - 26,749,211.26 Unavailable 746.02 2010 29,405,000.00 - 399,163.03 - - 29,804,163.03 1.94% 830.62 2009 32,300,000.00 - 183,602.68 - - 32,483,602.68 2.24% 929.19 2008 34,845,000.00 - 143,734.99 - - 34,988,734.99 2.38% 998.51 2007 37,190,000.00 - 77,838.12 - - 37,267,838.12 2.63% 1,059.05 2006 39,510,000.00 - 244,535.68 - - 39,754,535.68 2.91% 1,126.45 2005 41,793,000.00 - 192,758.70 - - 41,985,758.70 3.28% 1,190.07 2004 42,738,000.00 - 106,057.47 - - 42,844,057.47 3.46% 1,211.14 2003 44,913,000.00 - 293,096.95 - - 45,206,096.95 3.77% 1,271.62
Sources: (1) District Records (2) Personal income has been estimated based upon the municipal population and per capita (3) Per Capita personal income by county-estimated based upon the 2000 Census published
Governmental Activities
TOWNSHIP OF PENNSAUKEN SCHOOL DISTRICTRatios of Outstanding Debt by Type
Last Ten Fiscal YearsUnaudited
126

24000 Exhibit J-11
Percentage of General Net General Net Assessed
Fiscal Year Obligation Bonded Debt ValuationEnded June 30, Bonds Deductions Outstanding (1) Taxable (2) Per Capita (3)
2012 23,550,000.00$ 23,550,000.00$ 1.53% Unavailable2011 26,520,000.00 - 26,520,000.00 1.71% 739.63 2010 29,405,000.00 - 29,405,000.00 1.88% 819.49 2009 32,300,000.00 - 32,300,000.00 2.02% 923.94 2008 34,845,000.00 - 34,845,000.00 2.16% 994.41 2007 37,190,000.00 - 37,190,000.00 2.30% 1,056.83 2006 39,510,000.00 - 39,510,000.00 2.44% 1,119.52 2005 41,793,000.00 - 41,793,000.00 2.58% 1,184.61 2004 42,738,000.00 - 42,738,000.00 2.63% 1,208.14 2003 44,913,000.00 - 44,913,000.00 2.75% 1,263.38
Sources:
(1) District Records (2) Net Assessed Valuation provided by Abstract of Ratables, County Board of Taxation (3) Per Capita calculation based upon population information provided by the NJ Dept of Labor and Workforce Development
General Bonded Debt Outstanding
TOWNSHIP OF PENNSAUKEN SCHOOL DISTRICTRatios of Net General Bonded Debt Outstanding
Last Ten Fiscal YearsUnaudited
127

24000 Exhibit J-12
TOWNSHIP OF PENNSAUKEN SCHOOL DISTRICTDirect and Overlapping Governmental Activities Debt
As of December 31, 2011Unaudited
Net DebtStatutory OutstandingNet Debt Allocated to
Gross Debt Deductions Outstanding Pennsauken Township
Municipal Debt: (1)Pennsauken Township School District 25,705,000.00$ 25,705,000.00$ Pennsauken Township 34,444,585.55 9,115,127.55 25,329,458.00$ 25,329,458.00$
60,149,585.55 34,820,127.55 25,329,458.00 25,329,458.00
Overlapping Debt Apportioned to the Municipality:
Pennsauken Sewerage Authority (2) 847,915.00 847,915.00 847,915.00 County of Camden: (2)
General:Bonds 43,903,921.00 27,403,718.00 (3) 16,500,203.00 1,060,251.86 (5)Loan Agreement 169,310,000.00 169,310,000.00 10,879,335.41 (5)Bonds Issued by Other Public Bodies
Guaranteed by the County 750,920,785.00 750,920,785.00 (4)
964,982,621.00 778,324,503.00 186,658,118.00 12,787,502.27
1,025,132,206.55$ 813,144,630.55$ 211,987,576.00$ 38,116,960.27$
Sources:(1) 2011 Annual Debt Statement
(2) Entity's Respective 2011 Reports of Audit
(3) Includes Reserve for Payment of Bonds, Other Accounts Receivable and General Obligation Pension Refunding Bonds. (4) Deductible in accordance with N.J.S. 40:37A-80.(5) Such debt is allocated as a proportion of the Township's share of the total 2011 Equalized Value, which is 6.43%.
The source for this computation was the 2011 Table of Equalized Valuations, which is supplied by the New Jersey Division of Taxation.
128

24000 Exhibit J-13
Legal Debt Margin Calculation for Fiscal Year 2012
Equalized valuation basis (1)2,593,142,570$ 2011
2,661,791,347 2010
2,777,863,992 2009
8,032,797,909$
2,677,599,303$ Average equalized valuation of taxable property
107,103,972 Debt limit 4% of 2,677,599,303.00$ (2)
23,550,000 Total Net Debt Applicable to Limit
83,553,972$ Legal Debt Margin
2012 2011 2010 2009 2008 2007 2006 2005 2004 2003
Debt limit 107,103,972.12$ 111,936,457.41$ 113,521,234.17$ 108,738,541.33$ 97,953,041.63$ 86,194,383.00$ 77,476,931.00$ 71,246,063.00$ 67,640,935.97$ 65,426,222.15$
Total net debt applicable to limit (3) 23,550,000.00 26,520,000.00 29,405,000.00 32,300,000.00 34,845,000.00 37,190,000.00 39,510,000.00 41,793,000.00 42,738,000.00 44,913,000.00
Legal debt margin 83,553,972.12$ 85,416,457.41$ 84,116,234.17$ 76,438,541.33$ 63,108,041.63$ 49,004,383.00$ 37,966,931.00$ 29,453,063.00$ 24,902,935.97$ 20,513,222.15$
Total net debt applicable to the limit
as a percentage of debt limit 21.99% 23.69% 25.90% 29.70% 35.57% 43.15% 51.00% 58.66% 63.18% 68.65%
Sources:(1) Equalized valuation bases were provided by the Annual Report of the State of New Jersey, Department of Treasury, Division of Taxation.
(2) Limit set by NJSA 18A:24-19 for a K through 12 district.(3) District Records
Fiscal Year Ended June 30,
TOWNSHIP OF PENNSAUKEN SCHOOL DISTRICT
Legal Debt Margin Information
Last Ten Fiscal Years
Unaudited
129

Demographic and Economic Information
Demographic and economic information is intended (1) to assist users in understanding the socioeconomic environment within which the School District operates and (2) to provide information that facilitates comparisons of financial statement information over time and among school districts. Please refer to the following exhibits for a historical view of the demographic and economic statistics and factors prevalent in the location in which the School District operates.
130

24000 Exhibit J-14
Per Capita Personal Personal Unemployment
Year Population (1) Income (2) Income (3) Rate (4)
2011 35,856 Unavailable Unavailable 11.70%2010 35,882 1,532,879,040.00$ 42,720.00$ 11.70%2009 34,959 1,447,512,354.00 41,406.00 11.20%2008 35,041 1,471,441,672.00 41,992.00 7.20%2007 35,190 1,416,749,400.00 40,260.00 5.50%2006 35,292 1,364,776,932.00 38,671.00 5.80%2005 35,280 1,280,628,720.00 36,299.00 5.30%2004 35,375 1,236,533,125.00 34,955.00 3.90%2003 35,550 1,200,594,600.00 33,772.00 4.40%2002 35,635 1,159,313,455.00 32,533.00 4.30%
Sources: (1) Population information provided by the NJ Dept of Labor and Workforce Development(2) Personal income has been estimated based upon the municipal population and per capita(3) Per Capita personal income by municipality-estimated based upon the 2000 Census published (4) Unemployment data provided by the NJ Dept of Labor and Workforce Development
Demographic and Economic StatisticsLast Ten Fiscal Years
Unaudited
TOWNSHIP OF PENNSAUKEN SCHOOL DISTRICT
131

24000 Exhibit J-15
Percentage Percentageof Total of Total
Municipal MunicipalEmployer Employees Rank Employment Employees Rank Employment
Pepsi/Beverage Dist. Ctr. 625 1 3.88% 625 2 3.58%Aluminum Shapes, Inc. 600 2 3.72% 1,400 1 8.03%J & J Snacks 435 3 2.70% 435 3 2.49%Disc Makers 300 4 1.86% 300 4 1.72%Helvoet Pharma 300 4 1.86%Lidestri FoodsHolman/RMP 230 6 1.43% 230 7 1.32%WAWA Inc 225 7 1.40%Forman Mills 189 9 1.17% 189 9 1.08%Old Dominion Freight 70 10 0.43%Mediq & Mediq/PRN 300 4 1.72%Lehigh Press 260 6 1.49%Simmons Pet Foods, Inc 223 8Unites Stationers 225 8 1.29%Barry Callebut 189 9 1.08%
3,197 18.44% 4,153 23.82%
Source: Individual Employers
20032012
TOWNSHIP OF PENNSAUKEN SCHOOL DISTRICTPrincipal Non-Governmental Employers
Current Year and Nine Years AgoUnaudited
132

Operating Information
Operating information is intended to provide contextual information about the School District’s operations and resources to assist readers in using financial statement information to understand and assess the School District’s economic condition. Please refer to the following exhibits for a historical view of the factors and statistics pertinent to the School District’s operations.
133

24000 Exhibit J-16
2012 2011 2010 2009 2008 2007 2006 2005 2004 2003Function/Program
InstructionRegular 321 321 333 360 353 350 348 352 352 - Special education 142 121 105 100 87 76 58 56 56 - Other special education - - - - - - - - - - Vocational - - - - - - - - - - Other instruction 24 36 80 85 73 72 95 100 104 - Nonpublic school programs - - - - - - - - - - Adult/continuing education programs - - - - - - - - - -
Support Services:Tuition - - - - - - - - - - Student & instruction related services 111 129 118 100 95 79 79 82 78 - General administrative services 5 11 12 15 13 13 14 15 9 - School administrative services 47 53 58 55 47 48 38 40 51 - Business administrative services 17 10 11 18 18 19 21 20 20 - Plant operations and maintenance 105 90 86 95 93 96 96 97 97 - Pupil transportation 67 66 61 67 63 48 49 48 48 -
Special Schools - - - - - - 4 - - - Food Service 32 27 28 38 49 47 45 43 43 - Community Education and Recreation - - - - - - - - - -
Total 871 864 892 933 891 848 847 853 858 -
(1)(1) UnavailableSource: District Records
Fiscal Year Ended June 30,
TOWNSHIP OF PENNSAUKEN SCHOOL DISTRICTFull-time Equivalent District Employees by Function/Program
Last Ten Fiscal YearsUnaudited
134
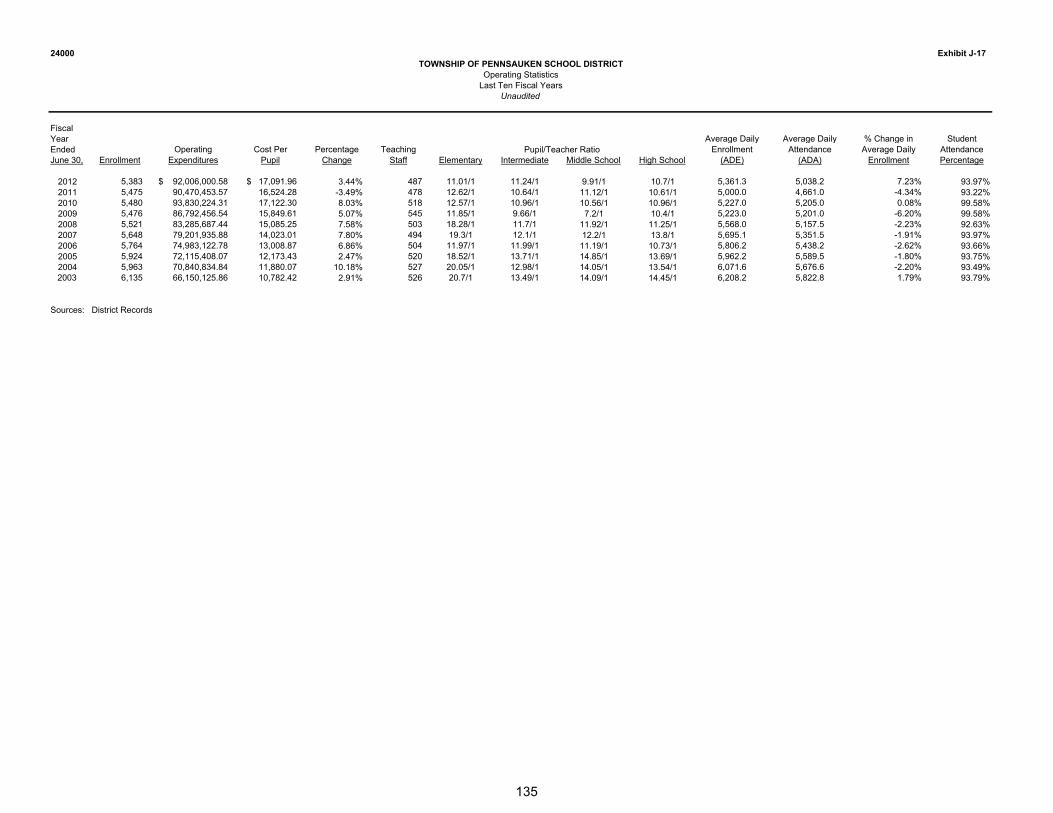
24000 Exhibit J-17
FiscalYear Average Daily Average Daily % Change in Student
Ended Operating Cost Per Percentage Teaching Enrollment Attendance Average Daily AttendanceJune 30, Enrollment Expenditures Pupil Change Staff Elementary Intermediate Middle School High School (ADE) (ADA) Enrollment Percentage
2012 5,383 $ 92,006,000.58 $ 17,091.96 3.44% 487 11.01/1 11.24/1 9.91/1 10.7/1 5,361.3 5,038.2 7.23% 93.97%2011 5,475 90,470,453.57 16,524.28 -3.49% 478 12.62/1 10.64/1 11.12/1 10.61/1 5,000.0 4,661.0 -4.34% 93.22%2010 5,480 93,830,224.31 17,122.30 8.03% 518 12.57/1 10.96/1 10.56/1 10.96/1 5,227.0 5,205.0 0.08% 99.58%2009 5,476 86,792,456.54 15,849.61 5.07% 545 11.85/1 9.66/1 7.2/1 10.4/1 5,223.0 5,201.0 -6.20% 99.58%2008 5,521 83,285,687.44 15,085.25 7.58% 503 18.28/1 11.7/1 11.92/1 11.25/1 5,568.0 5,157.5 -2.23% 92.63%2007 5,648 79,201,935.88 14,023.01 7.80% 494 19.3/1 12.1/1 12.2/1 13.8/1 5,695.1 5,351.5 -1.91% 93.97%2006 5,764 74,983,122.78 13,008.87 6.86% 504 11.97/1 11.99/1 11.19/1 10.73/1 5,806.2 5,438.2 -2.62% 93.66%2005 5,924 72,115,408.07 12,173.43 2.47% 520 18.52/1 13.71/1 14.85/1 13.69/1 5,962.2 5,589.5 -1.80% 93.75%2004 5,963 70,840,834.84 11,880.07 10.18% 527 20.05/1 12.98/1 14.05/1 13.54/1 6,071.6 5,676.6 -2.20% 93.49%2003 6,135 66,150,125.86 10,782.42 2.91% 526 20.7/1 13.49/1 14.09/1 14.45/1 6,208.2 5,822.8 1.79% 93.79%
Sources: District Records
Pupil/Teacher Ratio
TOWNSHIP OF PENNSAUKEN SCHOOL DISTRICTOperating Statistics
Last Ten Fiscal YearsUnaudited
135

24000 Exhibit J-18
2012 2011 2010 2009 2008 2007 2006 2005 2004 (1) 2003 (1)District Building
ElementaryBaldwin (1955)
Square Feet 11,621 11,621 11,621 11,621 11,621 11,621 11,621 11,621 - - Capacity (students) 275 275 275 275 275 275 275 275 - - Enrollment 125 143 125 114 113 103 144 148 - -
Burling (1963)Square Feet 14,880 14,880 14,880 14,880 14,880 - - - - - Capacity (students) 150 150 150 150 150 - - - - - Enrollment 111 125 131 127 119 - - - - -
Carson (1954)Square Feet 46,274 46,274 46,274 46,274 46,274 46,274 46,274 46,274 - - Capacity (students) 314 314 314 314 314 314 314 314 - - Enrollment 333 361 378 348 353 305 294 269 - -
Central (1925)Square Feet - 47,487 47,487 47,487 47,487 47,487 47,487 47,487 - - Capacity (students) - 486 486 486 486 486 486 486 - - Enrollment - - - - - 330 325 334 - -
Delair (2002)Square Feet 41,481 41,481 41,481 41,481 41,481 41,481 41,481 41,481 - - Capacity (students) 430 430 430 430 430 430 430 430 - - Enrollment 403 399 397 393 360 390 377 391 - -
Fine (1964)Square Feet 41,310 41,310 41,310 41,310 41,310 41,310 41,310 41,310 - - Capacity (students) 378 378 378 378 378 378 378 378 - - Enrollment 310 355 356 320 320 277 264 297 - -
Franklin (1954)Square Feet 56,802 56,802 56,802 56,802 56,802 56,802 56,802 56,802 - - Capacity (students) 551 551 551 551 551 551 551 551 - - Enrollment 443 466 458 409 436 397 388 405 - -
Longfellow (1926)Square Feet 22,320 22,320 22,320 22,320 22,320 22,320 22,320 22,320 - - Capacity (students) 227 227 227 227 227 227 227 227 - - Enrollment 252 233 247 252 252 165 183 190 - -
Roosevelt (1926)Square Feet 23,132 23,132 23,132 23,132 23,132 23,132 23,132 23,132 - - Capacity (students) 217 217 217 217 217 217 217 217 - - Enrollment 181 191 192 204 203 226 230 204 - -
IntermediateIntermediate School (2002)
Square Feet 82,733 82,733 82,733 82,733 82,733 82,733 82,733 82,733 - - Capacity (students) 986 986 986 986 986 986 986 986 - - Enrollment 798 798 805 792 807 827 849 863 - -
Middle SchoolMiddle School (1965)
Square Feet 153,790 153,790 153,790 153,790 153,790 153,790 153,790 153,790 - - Capacity (students) 1,274 1,274 1,274 1,274 1,274 1,274 1,274 1,274 - - Enrollment 793 834 837 885 882 894 949 1,029 - -
Booker T Washington AnnexBooker T. Washington (1927)
Square Feet 6,206 6,206 6,206 6,206 6,206 6,206 6,206 6,206 - - Capacity (students) 43 43 43 43 43 43 43 43 - - Enrollment 20 25 25 37 39 34 15 22 - -
High SchoolPennsauken High School (1959)
Square Feet 232,755 232,755 232,755 232,755 232,755 232,755 232,755 232,755 - - Capacity (students) 1,986 1,986 1,986 1,986 1,986 1,986 1,986 1,986 - - Enrollment 1,512 1,545 1,529 1,595 1,637 1,700 1,797 1,840 - -
Number of Schools at June 30, 2012Elementary = 8Intermediate = 1Middle School = 1Booker T Washington Annex = 1High School = 1Other = 0
(1) UnavailableSource: District Records
Last Ten Fiscal YearsUnaudited
TOWNSHIP OF PENNSAUKEN SCHOOL DISTRICTSchool Building Information
Fiscal Year Ended June 30,
136

24000 Exhibit J-19
* School Facilities Project # (s) 2012 2011 2010 2009 2008 2007 2006 2005 2004 2003
Pennsauken High 391,140.87$ 441,011.27$ 648,636.96$ 385,115.36$ 351,453.52$ 296,612.25$ 412,770.43$ 461,311.57$ 472,852.22$ 328,843.19$
Administration 69,181.24 34,296.42 72,436.96 26,612.80 21,939.44 16,228.05 15,695.81 19,771.14 29,244.40
Howard M. Phifer Middle 157,010.66 274,427.20 415,727.02 291,213.07 278,637.05 237,946.84 265,800.61 324,938.14 291,822.66 178,505.00Intermediate 83,182.27 103,303.13 219,037.58 88,732.49 64,924.38 60,608.50 74,155.69 90,733.65 69,964.03 186,090.00
A. E. Burling Magnet 49,841.65 20,469.51 33,452.99 37,726.04 97,098.89 113,296.93 17,029.11 11,985.34 10,671.24 21,280.00Booker T. Washington 44,446.87 45,275.77 24,575.86 20,304.96 14,722.17 22,430.33 15,697.44 14,908.38 7,773.60 16,446.00
Baldwin 54,825.80 24,145.54 28,077.08 33,892.76 26,838.19 20,409.65 21,950.01 23,167.87 20,187.74 22,961.00
Benjamin Franklin 77,492.41 63,660.42 118,476.79 104,726.74 54,343.55 65,318.05 60,508.78 68,180.28 48,697.41 59,426.00Central 19,610.62 32,524.74 40,009.72 57,745.22 67,753.71 42,703.30 47,334.00
Delair 91,353.00 85,094.91 102,711.52 69,493.03 52,557.69 40,203.31 51,435.18 56,476.93 48,598.17 40,099.00 Carson 66,925.97 63,259.84 101,450.07 58,013.03 48,725.82 43,519.40 58,536.16 78,564.98 53,463.70 52,052.00
George B. Fine 76,601.89 55,815.76 101,424.87 66,295.15 54,793.51 43,660.55 54,058.88 57,916.87 47,957.28 48,551.00
Longfellow 84,784.37 41,483.25 64,582.42 46,366.01 42,452.39 43,711.09 39,358.49 47,266.23 32,251.56 27,909.00 Roosevelt 65,651.27 49,237.12 75,709.78 69,083.38 43,899.25 35,243.26 36,676.19 46,849.91 35,716.46 44,554.00
1,312,438.27 1,301,480.14 2,006,299.90 1,317,185.44 1,184,910.59 1,079,197.93 1,181,418.00 1,369,825.00 1,211,903.77 1,074,050.19
Other Facilities - - - - - - - - - -
Grand Total 1,312,438.27$ 1,301,480.14$ 2,006,299.90$ 1,317,185.44$ 1,184,910.59$ 1,079,197.93$ 1,181,418.00$ 1,369,825.00$ 1,211,903.77$ 1,074,050.19$
* School Facilities as defined under EFCFA. (N.J.A.C. 6A:26-1.2 and N.J.A.C. 6A:26A-1.3)
Source: District Records
UNDISTRIBUTED EXPENDITURES - REQUIRED MAINTENANCE FOR SCHOOL FACILITIES (11-000-261-XXX)
TOWNSHIP OF PENNSAUKEN SCHOOL DISTRICT
Schedule of Required Maintenance
Last Ten Fiscal Years
Unaudited
Fiscal Year Ended June 30,
137

24000 Exhibit J-20TOWNSHIP OF PENNSAUKEN SCHOOL DISTRICT
Insurance ScheduleJune 30, 2012
Unaudited
Coverage Deductible
New Jersey School Boards Insurance Group:Blanket Property & Business Personal Property (A) 188,272,922.00$ 5,000.00$ Boiler and Machinery (B) 100,000,000.00 5,000.00Auto Liability (B) 6,000,000.00 1,000.00 General Liability (A) 6,000,000.00 Pollution Liability (B) 1,000,000.00 10,000.00 Environmental Impairment (A) 1,000,000.00 10,000.00 Workers Compensation -- Excess by Accident (B) 10,000,000.00 400,000.00
Inland Marine:Blanket Hardware and Software (A) 935,000.00 1,000.00
Accident Policies:Student Accident (B) 5,000,000.00
School Board Legal LiabilityLegal Liability Policy (A) 2,000,000.00 10,000.00
Employee Dishonesty Coverage (A) 100,000.00 1,000.00
Ohio Casualty Insurance Company Bond:Treasurer 425,000.00 School Business Administrator 375,000.00
(A) Per Claim/Annual Aggregate(B) Per Occurrence
Source: District Records
138

SINGLE AUDIT SECTION
139

INDEPENDENT AUDITOR’S REPORT ON COMPLIANCE WITH REQUIREMENTS THAT COULD HAVE ADIRECT AND MATERIAL EFFECT ON EACH MAJOR PROGRAM AND ON INTERNAL CONTROL OVER
COMPLIANCE IN ACCORDANCE WITH OMB CIRCULAR A-133 ANDSTATE OF NEW JERSEY CIRCULAR 04-04-OMB
The Honorable President andMembers of the Board of EducationTownship of Pennsauken School DistrictCounty of CamdenPennsauken, NJ 08110
ComplianceWe have audited the Township of Pennsauken School District’s compliance with the types of compliance requirements described in the OMB Circular A-133 Compliance Supplement and the New Jersey State Grant Compliance Supplement that could have a direct and material effect on each of the School District’s major federal and state programs for the fiscal year ended June 30, 2012. The School District's major federal and state programs are identified in the Summary of Auditor's Results section of the accompanying Schedule of Findings and Questioned Costs. Compliance with the requirements of laws, regulations, contracts, and grants applicable to each of its major federal and state programs is the responsibility of the School District's management. Our responsibility is to express an opinion on the School District's compliance based on our audit.
We conducted our audit of compliance in accordance with auditing standards generally accepted in the United States of America; the standards applicable to financial audits contained in Government Auditing Standards,issued by the Comptroller General of the United States; audit requirements as prescribed by the Division of Administration and Finance, Department of Education, State of New Jersey; OMB Circular A-133, Audits of States, Local Governments, and Non-Profit Organizations; and State of New Jersey Circular 04-04-OMB, Single Audit Policy for Recipients of Federal Grants, State Grants and State Aid. Those standards, OMB Circular A-133, and State of New Jersey Circular 04-04-OMB require that we plan and perform the audit to obtain reasonable assurance about whether noncompliance with the types of compliance requirements referred to above that could have a direct and material effect on a major federal or state program occurred. An audit includes examining, on a test basis, evidence about the Township of Pennsauken School District's compliance with those requirements and performing such other procedures as we considered necessary in the circumstances. We believe that our auditprovides a reasonable basis for our opinion. Our audit does not provide a legal determination of the School District's compliance with those requirements.
In our opinion, the Township of Pennsauken School District complied, in all material respects, with the compliance requirements referred to above that could have a direct and material effect on each of its major federal and state programs for the fiscal year ended June 30, 2012. However, the results of our auditing procedures disclosed one instance of noncompliance with those requirements, which is required to be reported in accordance with OMB Circular A-133 and New Jersey Circular 04-04-OMB and which is described in the accompanying Schedule of Findings and Questioned Costs and Independent Auditor’s Management Report on Administrative Findings -Financial, Compliance and Performance as finding number 2012-2.
140

141

24000
Grant orFederal Grantor/ Federal State Program orPass-through CFDA Project Award Grant Period BalanceGrantor / Program Title Number Number Amount From To June 30, 2011
General Fund U.S. Department of Education Passed-through State Department of Education: Education Job Fund 84.410A N/A 1,650,296.00$ 8-10-10 9-30-12 U.S. Department of Health and Human Services Passed Through State Department of Education: Special Education - Medicaid Administrative Claiming Aid 93.778 Unavailable 14,980.15 7-1-11 6-30-12 Special Education - Medicaid Initiative 93.778 Unavailable 183,733.72 7-1-11 6-30-12 Special Education - Medicaid Initiative 93.778 Unavailable 268,003.02 7-1-10 6-30-11 (55,667.70)$
Total General Fund (55,667.70)
Special Revenue Fund U.S. Department of Education Passed-through State Department of Education: I.A.S.A.: Title I Part A 84.010A IASA169009 1,651,131.00 9-1-08 8-31-09 (238,790.00) Title I Part A 84.010A IASA169010 1,529,359.00 9-1-09 8-31-10 (131,418.00) Title I Part A 84.010A IASA169011 1,585,913.00 9-1-10 8-31-11 (1,088,142.33) Title I Part A 84.010A IASA169012 1,598,707.00 9-1-11 8-31-12 ARRA - Title I Part A 84.389A IASA169010 967,244.00 9-1-09 8-31-11 (152,881.25) Title I - School Improvement Part A 84.377A IASA169009 95,675.00 9-1-08 8-31-09 (40,539.00) Title I - School Improvement Part A 84.377A IASA169010 104,991.00 9-1-09 8-31-10 (104,991.00) Title I - School Improvement Part A 84.377A IASA169011 104,991.00 9-1-10 8-31-11 88,365.68 Title I - School Improvement Part G 84.377A IASA169009 100,000.00 9-1-08 8-31-09 27,189.91 Title II Part A 84.367A IASA169009 268,029.00 9-1-08 8-31-09 (12,753.00) Title II Part A 84.367A IASA169010 262,986.00 9-1-09 8-31-10 (252.00) Title II Part A 84.367A IASA169011 267,954.00 9-1-10 8-31-11 (5,246.10) Title II Part A 84.367A IASA169012 225,414.00 9-1-11 8-31-12 Title II Part D 84.318X IASA169009 12,218.00 9-1-08 8-31-09 (2,525.00) Title II Part D 84.318X IASA169010 13,768.00 9-1-09 8-31-10 (6,878.00) Title II Part D 84.318X IASA169011 4,530.00 9-1-10 8-31-11 6,168.81 Title II Part D 84.318X IASA169011 4,530.00 9-1-11 8-31-12 Title III 84.365A IASA169009 55,173.00 9-1-08 8-31-09 (3,428.00) Title III 84.365A IASA169010 57,315.00 9-1-09 8-31-10 (1,566.00) Title III 84.365A IASA169011 66,446.00 9-1-10 8-31-11 18,415.60 Title III 84.365A IASA169012 53,526.00 9-1-11 8-31-12 Title III Immigrant 84.365A IASA169012 18,002.00 9-1-11 8-31-12 Title IV 84.186A IASA169009 26,585.00 9-1-08 8-31-09 (1,871.00) Title IV 84.186A IASA169010 23,866.00 9-1-09 8-31-10 (1,177.00) Title IV 84.186A IASA169011 4,362.00 9-1-10 8-31-11 1,038.25 Title V 84.298 IASA169008 13,313.00 9-1-07 8-31-08 1,566.00 I.D.E.I.A. Part B: Basic & Capacity 84.027 FT169009 1,741,005.00 9-1-08 8-31-09 (81,096.00) Basic & Capacity 84.027 FT169010 1,722,764.00 9-1-09 8-31-10 (93,430.00) Basic & Capacity 84.027 FT169011 1,741,139.00 9-1-10 8-31-11 (719,384.31) Basic & Capacity 84.027 FT169012 1,774,364.00 9-1-11 8-31-12 ARRA - Basic & Capacity 84.391 FT169010 1,771,136.00 9-1-09 8-31-11 (346,004.32) Pre-School 84.173 PS169009 46,802.00 9-1-08 8-31-09 (1,177.00) Pre-School 84.173 PS169010 46,595.00 9-1-09 8-31-10 (9,979.00) Pre-School 84.173 PS169011 49,245.00 9-1-10 8-31-11 (47,631.10) Pre-School 84.173 PS169012 49,144.00 9-1-11 8-31-12 ARRA - Pre-School 84.392A PS169010 63,739.00 9-1-09 8-31-11 Other: IDEAL MU-26 84.027A Unavailable 60,623.00 7-1-08 6-30-09 3,238.00 Math Intervention Consortium 84.027A Unavailable 1,105.57 7-1-08 6-30-09 390.49
Total Special Revenue Fund (2,944,786.67)
Enterprise Fund:U.S. Department of Agriculture: Food Distribution Program 10.555 Unavailable 179,788.54 7-1-11 6-30-12 Food Distribution Program 10.555 Unavailable 124,397.52 7-1-10 6-30-11 7,089.44 Passed-through State Department of Education: National School Lunch Program 10.555 Unavailable 1,478,670.71 7-1-11 6-30-12 National School Lunch Program 10.555 Unavailable 1,398,367.44 7-1-10 6-30-11 (227,259.22) National School Breakfast Program 10.553 Unavailable 331,091.16 7-1-11 6-30-12 National School Breakfast Program 10.553 Unavailable 313,924.68 7-1-10 6-30-11 (52,787.40) Special Milk Program 10.556 Unavailable 5,358.17 7-1-11 6-30-12 Special Milk Program 10.556 Unavailable 5,460.63 7-1-10 6-30-11 (986.16) Fresh Fruit and Vegetable Program 10.582 Unavailable 33,373.43 7-1-11 6-30-12 Fresh Fruit and Vegetable Program 10.582 Unavailable 18,676.98 7-1-10 6-30-11 (2,007.09)
Total Enterprise Fund (275,950.43)
Total Federal Financial Assistance (3,276,404.80)$
(A) See Note 5 to the Schedules of Expenditures of Federal Awards and State Financial AssistanceThe accompanying Notes to Financial Statements and Notes to the Schedules of Expenditures of Federal Awards and State Financial Assistance are an integral part of this schedule.
TOWNSHIP OF PENNSAUKEN SCHOOL DISTRICTSchedule of Expenditures of Federal Awards, Schedule A
For the Fiscal Year Ended June 30, 2012
142

Exhibit K-3
Carryover / Repayment of(Walkover) Cash Budgetary (A) Prior Years' (Accounts Deferred Due to
Amount Received Expenditures Adjustments Balances Receivable) Revenue Grantor
1,214,275.90$ 1,650,296.00$ (436,020.10)$
1,756.71 14,980.15 (13,223.44) 151,105.55 183,733.72 (32,628.17) 55,667.70
- 1,422,805.86 1,849,009.87 - - (481,871.71) - -
238,790.00 131,418.00
1,214,872.00 257,412.95 130,683.28$ 1,196,588.97 (1,969,748.00) 773,159.03$
241,125.00 88,244.25 (16,880.50) (16,881.00) 40,539.00 99,839.00 5,152.00
27,152.49 (61,213.19) (27,189.91)
12,753.00 252.00
148,499.00 (143,252.90) 200,201.48 (370,260.00) 170,058.52
2,525.00 5,167.00 1,711.00
228.81 (5,940.00) (4,530.00) 4,530.00
3,428.00 1,566.00
18,415.60 9,376.60 (27,454.60) 8,842.40 15,860.96 (8,843.65) (89,334.00) 73,471.79
(18,002.00) 18,002.001,871.00 1,177.00
276.00 (1,314.25) (1,566.00)
81,096.00 93,430.00
659,965.00 316.00 59,735.31 1,695,754.18 (314.52) (1,938,098.00) 242,029.30
389,918.00 43,913.68 1,177.00
(1,943.00)$ 11,922.00 1,943.00 49,834.00 (4,145.90)
790.00 0.30 (51,087.00) 50,297.3063,283.00 63,282.80 (0.20)
3,238.00$ 390.49
- 3,521,980.00 3,599,123.17 (100,833.73) - (4,457,940.00) 1,331,547.94 3,628.49
179,788.54 174,945.12 4,843.427,089.44
1,415,494.52 1,478,670.71 (63,176.19)227,259.22 316,698.12 331,091.16 (14,393.04)52,787.40 5,117.43 5,358.17 (240.74)
986.16 31,387.81 33,373.43 (1,985.62)2,007.09
- 2,231,526.29 2,030,528.03 - - (79,795.59) 4,843.42 -
- 7,176,312.15$ 7,478,661.07$ (100,833.73)$ - (5,019,607.30)$ 1,336,391.36$ 3,628.49$
Balance June 30, 2012
143
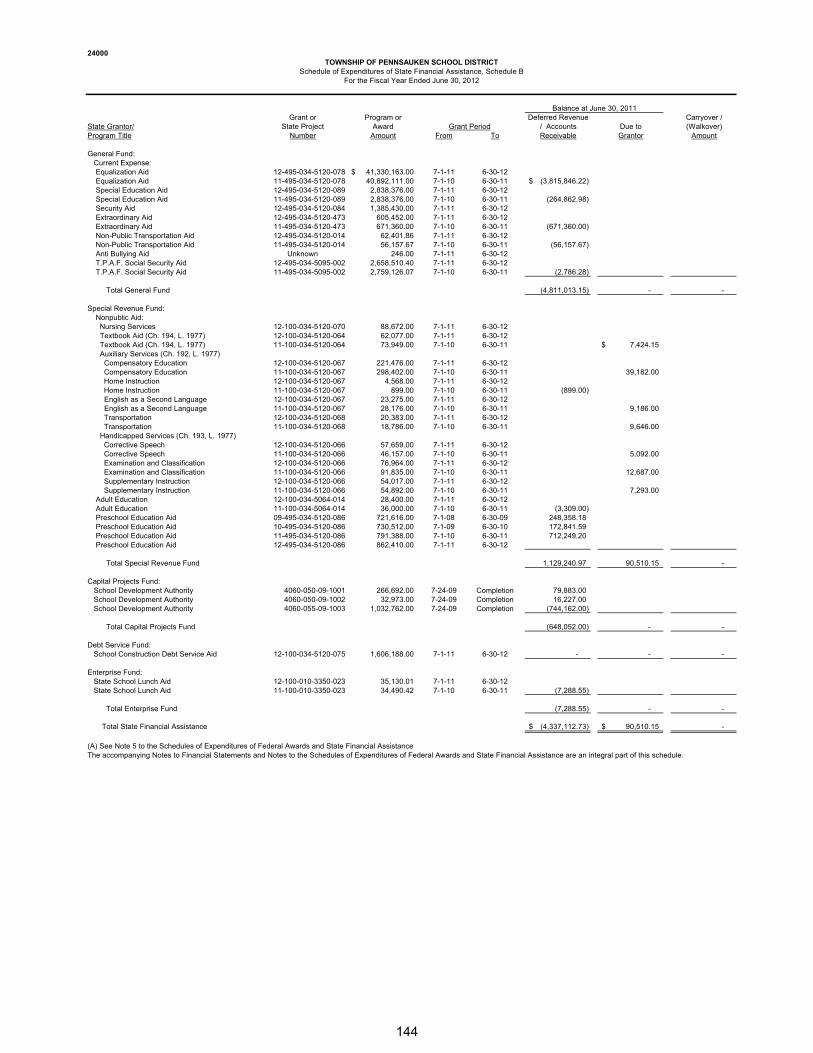
24000
Grant or Program or Deferred Revenue Carryover /State Grantor/ State Project Award Grant Period / Accounts Due to (Walkover)Program Title Number Amount From To Receivable Grantor Amount
General Fund: Current Expense: Equalization Aid 12-495-034-5120-078 41,330,163.00$ 7-1-11 6-30-12 Equalization Aid 11-495-034-5120-078 40,892,111.00 7-1-10 6-30-11 (3,815,846.22)$ Special Education Aid 12-495-034-5120-089 2,838,376.00 7-1-11 6-30-12 Special Education Aid 11-495-034-5120-089 2,838,376.00 7-1-10 6-30-11 (264,862.98) Security Aid 12-495-034-5120-084 1,385,430.00 7-1-11 6-30-12 Extraordinary Aid 12-495-034-5120-473 605,452.00 7-1-11 6-30-12 Extraordinary Aid 11-495-034-5120-473 671,360.00 7-1-10 6-30-11 (671,360.00) Non-Public Transportation Aid 12-495-034-5120-014 62,401.86 7-1-11 6-30-12 Non-Public Transportation Aid 11-495-034-5120-014 56,157.67 7-1-10 6-30-11 (56,157.67) Anti Bullying Aid Unknown 246.00 7-1-11 6-30-12 T.P.A.F. Social Security Aid 12-495-034-5095-002 2,658,510.40 7-1-11 6-30-12 T.P.A.F. Social Security Aid 11-495-034-5095-002 2,759,126.07 7-1-10 6-30-11 (2,786.28)
Total General Fund (4,811,013.15) - -
Special Revenue Fund: Nonpublic Aid: Nursing Services 12-100-034-5120-070 88,672.00 7-1-11 6-30-12 Textbook Aid (Ch. 194, L. 1977) 12-100-034-5120-064 62,077.00 7-1-11 6-30-12 Textbook Aid (Ch. 194, L. 1977) 11-100-034-5120-064 73,949.00 7-1-10 6-30-11 7,424.15$ Auxiliary Services (Ch. 192, L. 1977) Compensatory Education 12-100-034-5120-067 221,476.00 7-1-11 6-30-12 Compensatory Education 11-100-034-5120-067 298,402.00 7-1-10 6-30-11 39,182.00 Home Instruction 12-100-034-5120-067 4,568.00 7-1-11 6-30-12 Home Instruction 11-100-034-5120-067 899.00 7-1-10 6-30-11 (899.00) English as a Second Language 12-100-034-5120-067 23,275.00 7-1-11 6-30-12 English as a Second Language 11-100-034-5120-067 28,176.00 7-1-10 6-30-11 9,186.00 Transportation 12-100-034-5120-068 20,383.00 7-1-11 6-30-12 Transportation 11-100-034-5120-068 18,786.00 7-1-10 6-30-11 9,646.00 Handicapped Services (Ch. 193, L. 1977) Corrective Speech 12-100-034-5120-066 57,659.00 7-1-11 6-30-12 Corrective Speech 11-100-034-5120-066 46,157.00 7-1-10 6-30-11 5,092.00 Examination and Classification 12-100-034-5120-066 76,964.00 7-1-11 6-30-12 Examination and Classification 11-100-034-5120-066 91,835.00 7-1-10 6-30-11 12,687.00 Supplementary Instruction 12-100-034-5120-066 54,017.00 7-1-11 6-30-12 Supplementary Instruction 11-100-034-5120-066 54,892.00 7-1-10 6-30-11 7,293.00 Adult Education 12-100-034-5064-014 28,400.00 7-1-11 6-30-12 Adult Education 11-100-034-5064-014 36,000.00 7-1-10 6-30-11 (3,309.00) Preschool Education Aid 09-495-034-5120-086 721,616.00 7-1-08 6-30-09 248,358.18 Preschool Education Aid 10-495-034-5120-086 730,512.00 7-1-09 6-30-10 172,841.59 Preschool Education Aid 11-495-034-5120-086 791,388.00 7-1-10 6-30-11 712,249.20 Preschool Education Aid 12-495-034-5120-086 862,410.00 7-1-11 6-30-12
Total Special Revenue Fund 1,129,240.97 90,510.15 -
Capital Projects Fund: School Development Authority 4060-050-09-1001 266,692.00 7-24-09 Completion 79,883.00 School Development Authority 4060-050-09-1002 32,973.00 7-24-09 Completion 16,227.00 School Development Authority 4060-055-09-1003 1,032,762.00 7-24-09 Completion (744,162.00)
Total Capital Projects Fund (648,052.00) - -
Debt Service Fund: School Construction Debt Service Aid 12-100-034-5120-075 1,606,188.00 7-1-11 6-30-12 - - -
Enterprise Fund: State School Lunch Aid 12-100-010-3350-023 35,130.01 7-1-11 6-30-12 State School Lunch Aid 11-100-010-3350-023 34,490.42 7-1-10 6-30-11 (7,288.55)
Total Enterprise Fund (7,288.55) - -
Total State Financial Assistance (4,337,112.73)$ 90,510.15$ -
(A) See Note 5 to the Schedules of Expenditures of Federal Awards and State Financial AssistanceThe accompanying Notes to Financial Statements and Notes to the Schedules of Expenditures of Federal Awards and State Financial Assistance are an integral part of this schedule.
Balance at June 30, 2011
TOWNSHIP OF PENNSAUKEN SCHOOL DISTRICTSchedule of Expenditures of State Financial Assistance, Schedule B
For the Fiscal Year Ended June 30, 2012
144

Exhibit K-4
Repayment of Budgetary CumulativeCash Budgetary (A) Prior Years' (Accounts Deferred Due to Receivable Total
Received Expenditures Adjustments Balances Receivable) Revenue Grantor June 30, 2012 Expenditures
37,484,279.57$ 41,330,163.00$ (3,845,883.43)$ (3,845,883.43)$ 41,330,163.00$ 3,815,846.22 2,574,257.44 2,838,376.00 (264,118.56) (264,118.56) 2,838,376.00
264,862.98 1,256,511.99 473,689.00 (128,918.01) 911,741.00$ (128,918.01) 473,689.00
605,452.00 (605,452.00) 605,452.00671,360.00
62,401.86 (62,401.86) 62,401.8656,157.67
246.00 246.00 246.002,531,322.38 2,658,510.40 (127,188.02) 2,658,510.40
2,786.28
48,657,630.53 47,968,838.26 - - (5,033,961.88) 911,741.00 - (4,238,920.00) 47,968,838.26
88,672.00 88,150.08 0.08$ 522.00$ 88,150.08 62,077.00 52,662.01 0.01 9,415.00 52,662.01
(0.15) 7,424.00$
221,476.00 220,454.00 1,022.00 220,454.0039,182.00
4,568.00 (4,568.00) 4,568.00899.00
23,275.00 6,120.00 17,155.00 6,120.009,186.00
20,383.00 5,715.77 (0.23) 14,667.00 5,715.779,646.00
57,659.00 38,468.13 0.13 19,191.00 38,468.135,092.00
76,964.00 57,949.06 0.06 19,015.00 57,949.0612,687.00
54,017.00 34,794.40 0.40 19,223.00 34,794.407,293.00
23,737.00 26,415.72 (2,678.72) 26,415.723,309.00
248,358.18 248,358.18172,841.59 172,841.59
79,138.80 791,388.00 791,388.00776,169.00 129,234.99 (86,241.00) 733,175.01 (86,241.00) 129,234.99
1,487,775.80 1,877,119.93 0.30 90,510.00 (93,487.72) 733,175.01 100,210.00 (86,241.00) 1,877,119.93
(79,883.00) (16,227.00)
24,000.00 (1,032,762.00) 264,600.00 1,332,800.00
- 24,000.00 (96,110.00) - (1,032,762.00) 264,600.00 - - 1,332,800.00
1,606,188.00 1,606,188.00 - - - - - - 1,606,188.00
33,652.95 35,130.01 (1,477.06) 35,130.01 7,288.55
40,941.50 35,130.01 - - (1,477.06) - - - 35,130.01
51,792,535.83$ 51,511,276.20$ (96,109.70)$ 90,510.00$ (6,161,688.66)$ 1,909,516.01$ 100,210.00$ (4,325,161.00)$ 52,820,076.20$
Balance June 30, 2012
145

24000
TOWNSHIP OF PENNSAUKEN SCHOOL DISTRICTNotes to Schedules of Expenditures of Federal Awards and State Financial Assistance
For the Fiscal Year Ended June 30, 2012
Note 1: GENERAL
The accompanying schedules of expenditures of federal awards and state financial assistance include federal and state award activity of the Township of Pennsauken School District (hereafter referred to as the “School District”). The School District is defined in note 1 to the School District's basic financial statements. All federal and state awards received directly from federal and state agencies, as well as federal awards and state financial assistance passed through other government agencies, are included on the schedules of expenditures of federal awards and state financial assistance.
Note 2: BASIS OF ACCOUNTING
The accompanying schedules of expenditures of federal awards and state financial assistance are presented using the budgetary basis of accounting, with the exception of program recorded in the food service fund, which are presented using the accrual basis of accounting. These bases of accounting are described in note 1 to the School District's basic financial statements. The information in this schedule is presented in accordance with the requirements of OMB Circular A-133, Audits of States, Local Governments, and Non-Profit Organizations; therefore, some amounts presented in this schedule may differ from amounts presented in, or used in the preparation of, the basic financial statements.
Note 3: RELATIONSHIP TO BASIC FINANCIAL STATEMENTS
The basic financial statements present the general fund and special revenue fund on a GAAP basis. Budgetary comparison statements or schedules (RSI) are presented for the general fund and special revenue fund to demonstrate finance-related legal compliance in which certain revenue is permitted by law or grant agreement to be recognized in the audit year, whereas for GAAP reporting, revenue is not recognized until the subsequent year or when expenditures have been made.
The general fund is presented in the accompanying schedules on the modified accrual basis with the exception of the revenue recognition of the one or more deferred June state aid payments in the current budget year, which is mandated pursuant to N.J.S.A. 18A:22-44.2. For GAAP purposes, payments arenot recognized until the subsequent budget year due to the state deferral and recording of the one or more June state aid payments in the subsequent year. The special revenue fund is presented in the accompanying schedules on the grant accounting budgetary basis which recognizes encumbrances as expenditures and also recognizes the related revenues, whereas the GAAP basis does not. The special revenue fund also recognizes the one or more June state aid payments in the current budget year, consistent with N.J.S.A. 18A:22-44.2.
The net adjustment to reconcile revenues from the budgetary basis to the GAAP basis is $(158,210.80)for the general fund and $(130,338.13) for the special revenue fund. The net adjustment to reconcile expenditures from the budgetary basis to the GAAP basis is $356,048.85 for the special revenue fund. There is no required adjustment for the general fund. See Exhibit C-3, notes to required supplementary information, for a reconciliation of the budgetary basis to the modified accrual basis of accounting for the general and special revenue funds.
146

24000 Notes to the Schedules of Expenditures of Federal Awardsand State Financial Assistance (Cont'd)
Note 3: RELATIONSHIP TO FINANCIAL STATEMENTS (CONT’D)
Awards and financial assistance expenditures are reported in the School District's basic financial statements on a GAAP basis as presented as follows:
Fund Federal State Total
General 1,849,009.87$ 48,880,579.26$ 50,729,589.13$ Special Revenue 3,599,123.17 2,233,168.78 5,832,291.95 Capital Projects 24,000.00 24,000.00 Debt Service 1,606,188.00 1,606,188.00 Food Service 2,030,528.03 35,130.01 2,065,658.04
Total Awards and Financial Assistance 5,448,133.04$ 52,743,936.04$ 58,192,069.08$
Note 4: RELATIONSHIP TO FEDERAL AND STATE FINANCIAL REPORTS
Amounts reported in the accompanying schedules agree with the amounts reported in the related federal and state financial reports.
Note 5: ADJUSTMENTS
Amounts reported in the column entitled "adjustments" represent favorable differences incurred in the liquidation of encumbrances charged as budgetary basis expenditures in fiscal year 2010-2011 and the cancellation of receivables and appropriations to the general fund.
Note 6: OTHER
Revenues and expenditures reported under the food distribution program represent current year value received and current year distribution, respectively. TPAF social security Contributions represents the amount reimbursed by the State for the employer’s share of social security contributions for TPAF members for the fiscal year ended June 30, 2012.
Note 7: MAJOR PROGRAMS
Major programs are identified in the Summary of Auditor's Results section of the Schedule of Findings and Questioned Costs.
147

Section 1- Summary of Auditor's Results
Financial Statements
Type of auditor's report issued Unqualified
Internal control over financial reporting:
Material weakness(es) identified? yes X no
Significant deficiency(ies) identified? X yes none reported
Noncompliance material to financial statements noted? X yes no
Federal Awards
Internal control over major programs:
Material weakness(es) identified? yes X no
Significant deficiency(ies) identified? yes X none reported
Type of auditor's report issued on compliance for major programs Unqualified
Any audit findings disclosed that are required to be reported in accordance with Section 510(a) of OMB Circular A-133? X yes no
Identification of major programs:
CFDA Number(s) Name of Federal Program or Cluster
84.027 IDEA Part B -- Basic & Capacity
84.391 ARRA - IDEA Part B -- Basic & Capacity
84.173 IDEA Part B -- Pre-School
84.392A ARRA -- IDEA Part B -- Pre-School
84.410A Educational Job Fund
84.010A Title I Part A
84.389A ARRA -- Title I Part A
10.555 Food Distribution Program
10.555 National School Lunch Program
10.553 National School Breakfast Program
10.556 Special Milk Program
Dollar threshold used to determine Type A programs $ 300,000.00
Auditee qualified as low-risk auditee? X yes no
24000TOWNSHIP OF PENNSAUKEN SCHOOL DISTRICT
Schedule of Findings and Questioned CostsFor the Year Ended June 30, 2012
148

Section 1- Summary of Auditor's Results (Cont'd)
State Financial Assistance
Internal control over major programs:
Material weakness(es) identified? yes X no
Significant deficiency(ies) identified? yes X none reported
Type of auditor's report issued on compliance for major programs Unqualified
Any audit findings disclosed that are required to be reported in accordance with Section 510(a) of OMB Circular A-133 orNew Jersey Circular 04-04-OMB? yes X no
Identification of major programs:
GMIS Number(s) Name of State Program
12-495-034-5120-078 State Aid Public -- Equalization Aid
12-495-034-5120-089 State Aid Public -- Special Education Aid
12-495-034-5120-084 State Aid Public -- Security Aid
12-495-034-5095-002 Reimbursed TPAF Social Security Contributions
12-100-034-5120-075 School Construction Debt Service Aid
Dollar threshold used to determine Type A programs $ 1,545,338.00
Auditee qualified as low-risk auditee? X yes no
For the Year Ended June 30, 2012
24000
TOWNSHIP OF PENNSAUKEN SCHOOL DISTRICT
Schedule of Findings and Questioned Costs
149

24000
TOWNSHIP OF PENNSAUKEN SCHOOL DISTRICTSchedule of Findings and Questioned Costs
For the Fiscal Year Ended June 30, 2012
Section 2- Schedule of Financial Statement Findings
This section identifies the significant deficiencies, material weaknesses, and instances of noncompliance related to the financial statements that are required to be reported in accordance with Government Auditing Standardsand with audit requirements as prescribed by the Division of Administration and Finance, Department of Education, State of New Jersey.
Finding No. 2012-1
Criteria or Specific RequirementPayments to the New Jersey Division of Pensions and to the State Department of Labor for employees’ payroll deductions are required to be made on a timely basis. In addition, proper internal control procedures require that the reconciliation of payroll deductions payable be performed on a monthly basis.
ConditionSeveral payroll reports and remittances were not made timely and the reconciliation of payroll deductions payable was not performed on a monthly basis.
ContextEight of the twelve payments to the New Jersey Division of Pensions for employees’ payroll deductions of Teacher’s Pension and Annuity Fund and Public Employees Retirement System were not made on a timely basisand one of the quarterly reports to the New Jersey Department of Labor was not filed on a timely basis.
EffectThe New Jersey Division of Pension, Internal Revenue Service and New Jersey Department of Labor Guidelines were not adhered to and the District was required to pay $5,382.54 of penalty and interest charges and may be assessed additional penalty and interest charges.
CauseThere was a significant turnover in staffing and there was an oversight by the responsible official.
RecommendationThat all payroll reports and remittances, be made timely and that the reconciliation of payroll deductions payable is completed on a monthly basis.
View of Responsible Officials and Planned Corrective ActionThe responsible officials agree with the finding and will address the matter as part of their corrective action plan.
150

24000
TOWNSHIP OF PENNSAUKEN SCHOOL DISTRICTSchedule of Findings and Questioned Costs
For the Fiscal Year Ended June 30, 2012
Section 3- Schedule of Federal Award Findings and Questioned Costs
This section identifies the significant deficiencies, material weaknesses, and instances of noncompliance, including questioned costs, related to the audit of major Federal programs, as required by OMB Circular A-133.
Finding No. 2012-2
Information on the Federal ProgramU.S. Department of Education Passed Through the State Department of Education:
Title I Part A (CFDA No. 84.010A)
Criteria or Specific RequirementThe Elementary and Secondary Education Act requires that the District must notify parents of students in schools in need of improvement, the current status of the school.
ConditionOur audit of the Title I Part A grant revealed that the District did not notify parents of students in schools in need of improvement, the current status of the school as required by the Elementary and Secondary Education Actsection 1116.
Questioned CostsN/A
ContextN/A
EffectParents of students in schools in need of improvement were not made aware of the current status of the school.
CauseOversight by the responsible official.
RecommendationThat the District notify parents of students in schools in need of improvement, the current status of the school as required by the Elementary and Secondary Education Act.
View of Responsible Officials and Planned Corrective ActionThe responsible officials agree with the finding and will address the matter as part of their corrective action plan.
151

24000
TOWNSHIP OF PENNSAUKEN SCHOOL DISTRICTSchedule of Findings and Questioned Costs
For the Fiscal Year Ended June 30, 2012
Section 4- Schedule of State Financial Assistance Findings and Questioned Costs
This section identifies the significant deficiencies, material weaknesses, and instances of noncompliance, including questioned costs, related to the audit of major State programs, as required by OMB Circular A-133 and State of New Jersey Circular 04-04-OMB.
None.
152

24000
TOWNSHIP OF PENNSAUKEN SCHOOL DISTRICTSummary Schedule of Prior Year Audit Findings and
Questioned Costs as Prepared by Management
This section identifies the status of prior year findings related to the financial statements and Federal Awards and State Financial Assistance that are required to be reported in accordance with Government Auditing Standards, OMB Circular A-133 and State of New Jersey Circular 04-04-OMB.
FINANCIAL STATEMENT FINDINGS
Finding No. 2011-1
ConditionThe School District did not adopt the required resolution to transfer capital reserve funds to state approved “Other Capital Projects” for cafeteria window replacement.
Current StatusThis condition has been resolved.
Finding No. 2011-2
ConditionOur audit of the middle school activities account revealed the following:
1. Four of the receipts are entered with the “date of receipt.”2. The turnover date was not recorded for six of the receipts.3. Three of the receipts tested were not deposited within forty-eight hours.
Current StatusThis condition has been resolved.
FEDERAL AWARDS
None.
STATE FINANCIAL ASSISTANCE PROGRAMS
None.
153
