board of directors' report on the corporation's state of ... · periodical report for...
TRANSCRIPT

1
Board of Directors' Report on the Corporation's State of Affairs
Brack Capital Properties NV (hereinafter: "the Company") hereby submits the Board of Directors' report
for a period of three months ending on March 31, 2017 (hereinafter: "the Reported Period" or "the
Report Period.
The review is limited in scope and refers to events and changes occurring in the corporation's state of
affairs during the Reported Period the influence of which is material. The report was prepared assuming
that the report of the Company's Board of Directors for 2016 (which is included in the Company's
periodical report for 2016) (hereinafter, respectively: "2016 Board of Directors Report" and "2016
Periodic Report")1 is available to the reader.
The financial statements attached in Chapter B of this quarterly report are presented according to
International Standards – the IFRS.
All the data in this report refer to the interim consolidated financial statements unless otherwise stated.
In this report:
"The report date or "the date of the report" – March 31, 2017.
"Report signing date" or "the date of signing the report" – May 18, 2017.
"The reported quarter" – the first quarter of 2017.
Preamble
Below are the Company's principal results for the three months ended March 31, 2017.
1. Profitability – in the first quarter of 2017, the Company's net income attributed to the Company's shareholders amounted to approximately EUR 22.6 million compared to income of EUR 18.4 million in the corresponding quarter last year. The following is the contribution of income producing real estate and residential development activities to the Company's results:
- Income producing real estate – in the first quarter of 2017, the FFO amounted to EUR 8.1 million compared to EUR 8.0 million in the fourth quarter of 2016. In the reported quarter, the FFO grosses up an annual rate of EUR 32.3 million.
- Residential development activity- in the reported quarter, the contribution to profit in the Grafental project amounted to EUR 1.7 million (consolidated) from the completion of delivering 13 flats from Stage B32.
1 Published on March 20, 2017 (Ref No. 029265-01-2017] 2 As of the date of signing the report the last flat in the stage was delivered.

2
2. Operating segments – key operational data3. a. Residential development – Grafental project4
Stage Number of
flats
Expected revenues (EUR in
millions)
Expected income (EUR in millions)
Entrepreneurial profit
(in percentage) Sales (in
percentage)
Revenue recognition until now
B3 107 55.2 11.5 26% 100% 98%
C 109 56.2 12.4 28% 93% 0
D 119 67.6 16.4 32% 18% 0
Total 335 179.0 40.3 29% 67% 28%
b. Income producing real estate5
Zoning Area
(square meters)
Actual Return of
rental fees6
ERV Return7
Actual NOI return5
NOI return according to
ERV8
Occupancy rate
Residential 609 %46. %48. %55. %47. %96
Commercial 334 %6.6 %7.2 %26. %6.7 %95
Total 943 %56. %7.9 %85. %17. %96
- Residential: in the first quarter of 2017, rental fees increased by 5.4% from identical assets and
7.8 % in rental fees per square meter in new rentals compared to the corresponding quarter of 2016. The rental fees in new rentals in the residential market are higher by 31% of the actual rental fees.
- Commercial: in the first quarter of 2017, rental fees have increased by 2.6% from identical assets compared to the corresponding quarter in 2016 mainly from the betterment of assets. In this regard it is indicated that the Company promotes projects for the betterment of commercial assets out of the existing portfolio of the Company at an estimated investment scope of approximately EUR 50 million9 which will take several years and will produce an annual yield of 9% on the investment. In addition the Company examines and promotes rezoning procedures in part of those assets10 and other assets as well, which in case they will mature, the expected investment volume will be more material.
3 As of the report signing date 4 Data according to 100%, the effective corporation's share in the project is 83%; sales include reservations. 5Assets consolidated in the Company's financial statements. 6Data of May 2017 in annual terms divided by the carrying values. 7ERV - estimated rental value – the expected annual return provided that all of the assets are leased in full occupancy in return for the rental fees prevailing in the market. 8Actual NOI plus the difference between actual rental fees and the ERV divided by the carrying values. 9of which EUR 30 million in four assets under the Matrix Portfolio 10of which 2 assets in large cities in Bavaria
3
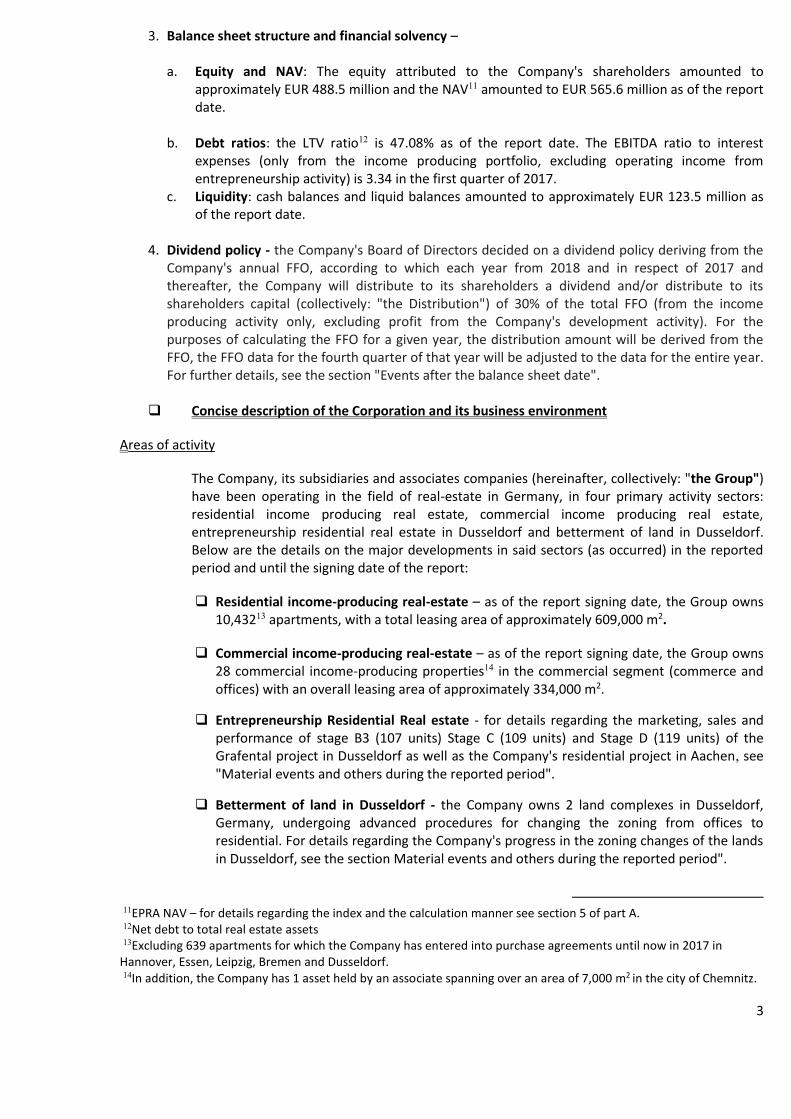
3. Balance sheet structure and financial solvency – a. Equity and NAV: The equity attributed to the Company's shareholders amounted to
approximately EUR 488.5 million and the NAV11 amounted to EUR 565.6 million as of the report date.
b. Debt ratios: the LTV ratio12 is 47.08% as of the report date. The EBITDA ratio to interest expenses (only from the income producing portfolio, excluding operating income from entrepreneurship activity) is 3.34 in the first quarter of 2017.
c. Liquidity: cash balances and liquid balances amounted to approximately EUR 123.5 million as of the report date.
4. Dividend policy - the Company's Board of Directors decided on a dividend policy deriving from the Company's annual FFO, according to which each year from 2018 and in respect of 2017 and thereafter, the Company will distribute to its shareholders a dividend and/or distribute to its shareholders capital (collectively: "the Distribution") of 30% of the total FFO (from the income producing activity only, excluding profit from the Company's development activity). For the purposes of calculating the FFO for a given year, the distribution amount will be derived from the FFO, the FFO data for the fourth quarter of that year will be adjusted to the data for the entire year. For further details, see the section "Events after the balance sheet date".
Concise description of the Corporation and its business environment
Areas of activity
The Company, its subsidiaries and associates companies (hereinafter, collectively: "the Group") have been operating in the field of real-estate in Germany, in four primary activity sectors: residential income producing real estate, commercial income producing real estate, entrepreneurship residential real estate in Dusseldorf and betterment of land in Dusseldorf. Below are the details on the major developments in said sectors (as occurred) in the reported period and until the signing date of the report:
Residential income-producing real-estate – as of the report signing date, the Group owns 10,43213 apartments, with a total leasing area of approximately 609,000 m2.
Commercial income-producing real-estate – as of the report signing date, the Group owns 28 commercial income-producing properties14 in the commercial segment (commerce and offices) with an overall leasing area of approximately 334,000 m2.
Entrepreneurship Residential Real estate - for details regarding the marketing, sales and performance of stage B3 (107 units) Stage C (109 units) and Stage D (119 units) of the Grafental project in Dusseldorf as well as the Company's residential project in Aachen, see "Material events and others during the reported period".
Betterment of land in Dusseldorf - the Company owns 2 land complexes in Dusseldorf, Germany, undergoing advanced procedures for changing the zoning from offices to residential. For details regarding the Company's progress in the zoning changes of the lands in Dusseldorf, see the section Material events and others during the reported period".
11EPRA NAV – for details regarding the index and the calculation manner see section 5 of part A. 12Net debt to total real estate assets 13Excluding 639 apartments for which the Company has entered into purchase agreements until now in 2017 in Hannover, Essen, Leipzig, Bremen and Dusseldorf. 14In addition, the Company has 1 asset held by an associate spanning over an area of 7,000 m2 in the city of Chemnitz.

4
Property financing
The Company consistently works for maximizing the return-risk profile for its shareholders by
means, inter alia, of optimization of the capital/debt structure, both on property level and on
corporation level. To that end the Company uses the following sources: bank loans, bonds raising in
Israel etc.
Below are the details on updates in the aforesaid financing methods (as occurred) in the reported
period and until the signing date of the report:
Bank loans – the Company has bank loans amounting to EUR 581,618 thousand. As of the report date, the average rate of interest of these loans is approximately 1.8%. The average duration of the loans is about 3.9 years.
Bonds – the Company has three series of bonds (non convertible to shares) rated by S&P Maalot Ltd. (Maalot) with AA- rating as of the signing date of the report: Series A at a scope of approximately NIS 228,640 thousand par value with an interest (linked) of approximately 4.8% per year with an average duration of approximately 1.6 years, Series B at a scope of approximately NIS 210,000 thousand par value with an interest (linked) of approximately 3.29% per year with an average duration of approximately 4.7 years and Series C at a scope of NIS 156,911 thousand par value with an interest (linked) of approximately 3.3% per year with an average duration of approximately 6.8 years.
Activity environment
The German economy is the fourth in the world in terms of Gross National Product (GDP). It is
characterized by low unemployment rate and low and steady inflation. The German government
enjoys a perfect credit rating (AAA) with a stable outlook and low financing cost of government
bonds.15
The real estate market in Germany is characterized with high stability and positive directions as
occupancy rates improve and rental prices are increasing. In 2016, the German GDP recorded an
increase of 1.9% while the other large European economies recorded lower growth rate, when the
GDP of the entire Eurozone increased by 1.7%. In 2016, the German GDP has grown mainly from an
increase in private consumption and increase in volumes of investments in equipment and
construction. The Organization for Economic Co-operation and Development (OECD) expects an
increase in the economic activity in Germany in 2017, which is expected to show a growth of 1.7%
mainly due to an additional improvement in the private consumption, which is supported among
others, by low interest and low petrol prices as well as due to low unemployment rate. In the first
quarter of 2017, the German GDP increased by 0.6%.
15As of the date of signing the report, the German government bonds for 10 years yields a nominal annual return of
0.378%.

5
Material Events in the Report Period
Purchase of 18 flats in Leipzig - during the fourth quarter of 2016 and the first quarter of 2017 the Company entered into notarized sale agreements with third parties who are not related to the Company and/or to its controlling shareholder for the purchase of 18 flats in addition to 543 flats that are owned by the Company in the Leipzig Am Zoo asset16 for a total consideration (including
transaction costs) of approximately EUR 550 thousand. The completion of the transaction was financed by the Company's equity and was carried out during the first quarter of 2017.
Review of Privatization17in Leipzig – in 2015 and 2016, the Company commenced reviewing the Privatization process for a building spanning over 779 m2 in Leipzig. As part of such process, the Company expects to invest a total of EUR 1.5 million (including the value of the income generating asset) in adapting the asset and turning it into a building consisting of 8 flats. The total sale consideration is expected to amount to EUR 1.95 million and the expected entrepreneurial profit grosses up a profitability of 30% over total cost and 1.25 times the value in the financial statements
as an income generating asset. As of the report signing date, binding agreements were signed for the sale of all flats. The Company explores the option of expanding its activity in this field.
Capital issuance – on January 31, 2017, the Company completed a public offering in Israel of 598,540 shares and 299,270 warrants (Series 1) exercisable into 299,270 shares of the Company at a total monetary scope of EUR 49.5 million (gross) by a uniform offer in the tender on the unit price pursuant to a shelf offering report that was published on January 29, 2017 by virtue of the shelf prospectus bearing the date of May 29, 201518.
Purchase of residential portfolio in Hannover, Germany - on February 8, 2017, the Company (through a sub subsidiary) entered into a notarized sale agreement with a third party that is not related to the Company and/or to its controlling shareholder (in this sub section only: the seller) under which the seller will sell the Company 156 residential units in Hannover, Germany (in this sub section only: the acquired asset) for a total consideration of EUR 18 million (including related transaction costs).
For the purpose of financing the purchase, the Company (through a sub-subsidiary) negotiates with a German bank to enter into an agreement to obtain a loan in the amount of EUR 10.4 million under non-recourse terms which its final repayment date is 5 years from the date of receiving the loan bearing a variable interest based on Euribor plus a margin of 1.20% per annum. The transaction is expected to be completed at end of May 201719.
16Were purchased by an investee of the Company where the Company holds (by indirect holding) about 68% of the rights (before adjustments for Promote mechanism) and the remaining rights are held the investors club. The transfer of said shares was not yet performed and the investors hold contractual rights in the joint venture. Leipzig Am Zoo is a residential complex that was purchased in May 2013 consisting of 435 flats at an average area of 34 sq.m per unit. The total leasable area of the complex is 15,266 sq.m after purchasing the 18 flats. 17Under this review, the Company reviews the profitability of selling some of the apartments which constitute part of the income generating assets to individuals such that each purchaser will purchase a single apartment in a building owned by the Company. Under this process, the Company is required to adapt the asset for sale for the commercial and legal standpoints. 18For additional information see immediate report of the Company dated January 31, 2017 (reference number 011337-01-2017) which is brought by way of reference. 19For additional information see immediate report of the Company dated February 9, 2017 (reference number 014511-01-2017) which is brought by way of reference.

6
Purchase of residential portfolio in Essen, Germany - on February 22, 2017, the Company (through a sub subsidiary) entered into a notarized sale agreement with a third party that is not related to the Company and/or to its controlling shareholder (in this sub section only: the seller) under which the Company will purchase from the seller 320 residential units in Essen, Germany for a total consideration of EUR 23.6 million (including related transaction costs).
For the purpose of financing the purchase, the Company (through a sub-subsidiary) negotiates with a German bank to enter into an agreement to obtain a loan in the amount of EUR 16 million under non-recourse terms which its final repayment date is 5 years from the date of receiving the loan bearing a fixed interest rate of 1.18% per annum. The transaction is expected to be completed in June 201720.
Purchase of residential assets in Leipzig, Bremen and Dusseldorf, Germany – in the first quarter of 2017, the Company, through its wholly owned Dutch companies, entered into 4 different transactions for the purchase of 163 flats for leasing in Leipzig, Bremen and Dusseldorf in Germany (the acquired assets) for a total consideration of EUR 8 million (including related transaction costs). The acquired assets span over a leasable area of 7.3 thousand sq.m, generating current annual of EUR 342 thousand grossing up a significant rental increase of 25% to 35%, as per the Company's estimate in view of the average rental in those cities/locations for similar assets. The transactions will be financed in the first stage by equity where they are expected to be completed in the second quarter of 2017.
Ratification of credit rating by Maalot – on March 26, 2017, the credit rating company, Maalot, ratified for the Comp[any the rating of ilAA- (stable outlook) and for the Company's bonds Series A B and C ratified the rating of ilAA-21
Advancement of construction rights in existing residential complexes – the Company advances the review of the possibility of adding an additional construction rights in existing residential complexes. For the avoidance of doubt, construction rights, if any, are not reflected in the appraisals of the assets.
The Company's residential project in Aachen, Germany - on February 26, 2016, the Company (through sub- subsidiaries) entered with a third party who is not related to the Company and/or its controlling shareholders (the "Partner") into a notarized sale agreement with a third party who is not related to the Company and/or its controlling shareholders (the seller) to acquire ownership rights to the land in the city of Aachen in Germany, on which an old plant which is not in use is erected, for a total consideration of € 6 million (the Company's share is EUR 3 million) that was completed in April 2016 after the various required conditions were met22.
20For additional information see immediate report of the Company dated February 23, 2017 (reference number 0-01-2017) which is brought by way of reference. 21For additional information see Maalot rating activity report that was attached to the Company's immediate report of dated March 26, 2017 (reference number 029532-01-2017) which is brought by way of reference. 22For additional information see the Company's immediate report dated February 28, 2016 (reference 035506-01-
2016 which is brought in this report by way of reference

7
The planning authorities in Aachen have agreed with the Company on the planning concept of the project such that it would be feasible to construct 280-300 residential units (instead of 180-220 residential units as was indicated in the immediate report published by the Company on the asset purchase date) resulting in increase in the sales volume and the expected profitability in the project compared to the original planning of the project. In addition, in January 2017, the planning authorities in the city have approved to change the planning master plan for the area from industry to residence such that the Company would be able to promote the urban building plan and bring such plan for approval of the planning authorities in the city until the end of 2017 and commence construction in the second half of 2018 simultaneously with issuing building permits for the project.
During the second quarter, the Company commenced promoting a detailed architectural planning for the purpose of submitting a building permit application for the first stage of the project, as well as commenced a detailed planning of the public infrastructure in the project (roads, sewage/water/ electricity, kindergarten etc ) and at the same time promotes the planning procedures and approval of the Urban Planning Scheme in the timetables detailed above.
Progress with the development of the residential project in Düsseldorf
Below are the major developments regarding the development of the residential project in Grafental in the reported period and until the date of signing the report:
a. Performance and marketing of stage B3 – the construction of Stage B3 commenced in April 2015 and ended in December of 2016. Marketing of Stage B3 commenced in January 2015 and until the report signing date (signed agreements and reservations) 107 apartments were marketed (about 99.8% of this stage, 4 parking spaces remained unsold) for a total consideration of EUR 55.1 million. As of the report date and the report signing date, advances of EUR 54.8 million and EUR 55.0 million, respectively, were received from apartment purchasers.
b. Delivery of apartments and profit recognition of Stage B3 – in the first quarter of 2017, the Company delivered an additional 13 flats of the stage and consequently recognized a profit of EUR 1.7 million. The last flat of the stage was delivered in May 2017 and the profit for such flat will be recognized in the financial statements for the second quarter of 2017.
c. Performance and marketing of Stage C – in April 2016, upon receiving the building permit, the Company commenced the construction of Stage C which includes 109 flats and 125 parking spaces at a total area of 16,000 m2 gross. The Company commenced marketing of Stage C in May 2016 at selling prices higher by 7% compared to Stage B3. As of the report signing date, 100 apartments (signed agreements and reservations) (about 93 % of this stage) were marketed at a total monetary consideration of EUR 52.2 million. As of the report date and the report signing date, advances of EUR 18.9 million and EUR 21.9 million, respectively, were received from apartment purchasers.
d. Performance and marketing of Stage D – in April 2017, upon receiving the building permit, the commenced constructing Stage D which includes 109 flats and underground parking lot of 125 parking spaces with 10 townhouses (total 119 flats at a total scope of 18,000 m2 gross). In May 2017, the Company commenced marketing and sales of Stage D and as of the report date and the report signing date, 22 flats (signed agreements and reservations) were marketed (about 18% of this stage) for a total consideration of EUR 12.0 million.
The selling prices in Stage D gross up an increase of 8% compared to the selling prices of Stage C and consequently the entrepreneurial profitability is expected to increase from 28% in Stage C to 32% in Stage D (for additional information see the table in page 7 below).
e. Planning Stages E – the Company commenced the planning of Stage E that will include 110 flats and 5 townhouses at a total scope of 17,000 m2, gross, and filed applications for building permits for this stage in September 2016.

8
For additional information on the performance and marketing status of the stages under construction of the project, see the tables below.
Project marketing Data according to 100% The effective corporation's share in the project – 83%)
2017
2017
2016
2017
2016
As of the date of
signing the report22
As of the date of signing the
report
Quarter 1
As of the date of signing the
report
Quarter 1
DStage 3Stage B 3Stage B
:signed in the current period greementsCumulative a
Flats )#( 5 98 91 72 107 107 107
Flats – total monetary consideration (including for parking, EUR in thousands)
2,813 51,224 47,648 37,482 55,053 55,053 55,032
Flats (square meters)
575 11,198 10,408 8,205 13,263 13,263 13,263
Average price per sq.m (EUR) (including consideration for parking)
4,889 4,574 4,578 4,568 4,151 4,151 4,149
Apartment Reservations* as of the date of signing the reports:
Flats )#( 17 2 -
Flats – total monetary consideration (including for parking, EUR in thousands)
9,193 1,022
-
Flats (square meters)
1,826 211
-
Average price per sq.m (EUR)
5,034 4,839
-
22The project's marketing commenced on May 1, 2017.

9
the date of signing the reportsCumulative signed agreements and reservations until
Flats )#( 22 100 107
Flats – total monetary consideration (including for parking, EUR in thousands)
12,006 52,246
55,053
Flats (square meters)
2,402 11,409
13,263
Average price per sq.m (EUR)
4,999 4,579
4,151
Marketing rate of the project: (%)
As of the date of
signing the report
As of the date of signing the
report
As of March 31, 2017
As of December 31, 2016
As of the date of signing the
report
As of March 31, 2017
As of December 31, 2016
Marketing rate on the last date of the period -signed agreements
%4.2 %91.2 84.9% 66.8% %99.8 99.8% 99.8%
Marketing rate on the last date of the period -signed agreements and reservations
%17.8 %93.0 %99.8
Advances from tenants
As of the date of
signing the report
As of the date of signing the
report
As of March 31, 2017
As of December 31, 2016
As of the date of signing the
report
As of March 31, 2017
As of December 31, 2016
Advances from tenants (EUR in thousands)
0 21,893 18,879 7,104 009,55 54,847 52,384
Rate of Advances from tenants (%)
%0.0 %39.0 33.6% 12.7% %799. 99.4% 95.0%
Spaces in respect of which agreements and reservations were not yet signed as of the date of signing the reports:
Flats )#( 97 9
-
For 4 unsold parking spaces
Flats – total expected monetary consideration (including for parking, EUR in thousands)
55,547 3,904 116
Flats (square meters)
11,671 875 NA
Average price per sq.m (EUR)
4,759 4,463 NA

10
Total cumulative cost attributed to spaces in respect of which binding agreements were not yet signed in the statement of financial position (consolidated) (EUR in thousands)
11,630 1,917 85
*)Reservation is a process where a potential purchaser signs a document that includes a description of the apartment and its registered number, number of purchased parking spaces and their registered numbers, amendments to specifications, if any, including the total price (apartment, parking spaces, amendments to specifications) and payment terms. The purchaser deposits EUR 2,000 for the reservation. The reservation is not legally binding and the purchaser may cancel such reservation without a penalty.

11
Forecast of revenues, costs and entrepreneurial profits of the stages in progress (EUR in thousands)
In accordance with accounting principles, the Company recognizes revenues, costs and gross profit deriving from the stages in progress, upon completion of performance and delivering the apartments to the tenants.
24The performance of Stage C has commenced in April 2016 upon receiving the building permit 25The performance and marketing of Stage D commenced in April and May 2017 upon receiving the building permit. 26It is stressed that engineering completion rate is not identical to apartment delivery rate and profit recognition rate
from delivering the apartments that was carried out when the apartments were delivered. See Note 2ff to the
consolidated financial statements which is attached in Chapter C of the 2016 periodic report.
Stage B3 Stage C24 Stage D 25
Total expected revenues 55,169 56,150 67,553
Advances from apartment purchasers as of the report date
54,847 18,879 0
Advances from apartment purchasers as of the date of signing the report
55,009 21,893 0
Total cumulative costs invested 40,472 26,914 14,023
Total costs remaining for investment 3,202 16,861 37,150
Total expected cost (including land (EUR in thousands) 43,674 43,776 51,173
Completion rate (engineering/monetary)(excluding land)(%)26
90.7% 50.9% 6.1%
Total expected entrepreneurial profit 11,495 12,374 16,379
Total entrepreneurial profit recognized in the Company's financial statements (consolidated) cumulatively as of the report date
11,299 0 0
Rate of expected entrepreneurial profit (%) 26.3% 28.3% 32.0%
Expected completion date and profit recognition
Fourth quarter
of 2016 and
first quarter
and second
quarters of
2017
Fourth quarter
of 2017 and
first quarter of
2018
Fourth quarter of
2018.

12
The following is a tabular summary of expected revenue, cash flow and entrepreneurial profit, not yet
recognized in the financial statements of the company, from stages in progress and from stages under the
approved urban scheme which its execution has not yet begun, in Grafental project:
From sold apartments (EUR in thousands) Data according to 100%. The corporation's effective portion in the project – 83%
Revenue not yet recognized
Cash flow not yet recognized
Entrepreneurial profit not yet
recognized
Stages in progress (stages B3 , C and D)
65,077 24,249 14,622
From apartments not yet sold (EUR in thousands) Data according to 100%. The corporation's effective portion in the project – 83%
Revenue not yet recognized
Cash flow not yet recognized
Entrepreneurial profit not yet
recognized
Stages in progress (stages C and D) 59,621 21,637 14,364
Stages E (under approved urban scheme) not yet in progress
75,090 22,654 13,597
Total 134,711 44,291 27,961
Betterment of the land in Dusseldorf and changing the zoning to residence – the following are the
main developments regarding the betterment of lands in Dusseldorf in the reported period and until the date of signing the report:
a. with respect to the remaining land that includes construction rights of 124.5 thousand m2 for offices (the parcel of land): in the reported period, the Company with Dusseldorf municipality, advanced a new urban scheme for the complex such that it will be feasible to build, with the formal approval of the new urban scheme which is in progress, if approved, on the entire parcel of land an additional 650 flats in addition to 850 flats that are included today in the valid urban scheme (in total 1,500 flats). The Company estimates that if the urban scheme is approved, the 300 flats out of the 650 flats deriving from changing the zoning will be available for construction to commence at the end of 2017 and the balance will be available for construction to commence at the end of 2018 27 29
b. Purchase of several office and residential buildings in Grafenberg neighborhood for betterment – in August 2014, the Company consummated the purchase of land spanning over 20,000 m2 erected thereon residential and office buildings (generating annual income of EUR 220 thousand) in Grafenberg – one of the luxurious neighborhoods of Dusseldorf – and adjacent to the Grafental project which is constructed by the Company in Dusseldorf28. In the reported period, the Company had advanced with the Dusseldorf municipality a new urban scheme for the complex such that it will be feasible to construct a residential project on the land that will include 80 up to 100 flats (a constructed area of
27For additional information see section 1.8.5 in Chapter A "Description of the Corporation's businesses" attached to the 2016 periodic report. 28For additional information regarding the above transaction see immediate report dated August 31, 2014 (reference
146337-01-2016) which is brought in this report by way of reference.

13
20,000 m2, gross) (instead of the existing buildings). The Company estimates that said plans will be approved, if at all, by the municipality until the end of 2017 and the land will be available for construction (with the necessary approvals) in the first half of 2018 29 28.
The following is a tabular summary of expected revenue, cash flow and entrepreneurial profit expected
from the betterment of the land in Dusseldorf29
Data according to 100% (EUR in thousands)
Revenue not yet recognized
Cash flow not yet recognized
Entrepreneurial profit not yet
recognized
Parcel of land under the change of zoning from offices to residence in Grafental30 and the land in Grafenberg
439,765 159,252 84,567
The information described above in connection with stages C and D in progress and stage E of the
Grafental project (which is included in the approved urban scheme) which their performance was not yet
commenced and in connection with the betterment of the lands in Dusseldorf and the change of their
zoning (including the expected dates of completion) regarding the total expected sales ,the expected
entrepreneurial profit and expected cash flows before taxes ,is a forward looking information which is not
under the full control of the Company and the actual materialization of such change of zoning ,in whole or
in part ,is uncertain.
The information is based on information possessed by the Company as of the report date, regarding: 1)
demand for residential spaces in Dusseldorf; 2) market prices of residential spaces in Dusseldorf generally
and in the area of the projects (including competing projects comparable with the Company's projects); 3)
accumulated know how and experience of the Company's management and project managers in the
segment; 4) the Company's forecasts and estimates regarding the costs of construction, development,
marketing of projects based on the costs of the stages that as of the report date are in progress; and other
estimates of the Company.
It is uncertain whether the change of zoning will take place and/or consummated, if any, since its
consummation is subject to the planning and construction procedures required under German law, the
consummation of which is not controlled by the Company.
In addition ,even if the approvals are received and the Company will resolve to establish the projects
independently and the performance of the projects will be executed, change in circumstances (including
without derogating from the generality of the foregoing – decrease in demand for flats in Dusseldorf
and/or decrease in market prices of flats in Dusseldorf) or increase in construction costs (and other costs)
29It should be noted that the Company has not yet decided how to use the land under the change of zoning from offices to residence in Grafental and/or the land in Grafenberg including the development of which of the parcels of land. The decision to develop the above lands or any of them is subject to consummating the relevant approval procedures of urban scheme, the market conditions that shall prevail upon completing the urban scheme, the ability to obtain financing for developing the project in the said lands, the availability of equity resources required to realize said development plans, meeting financial ratios and more. The data shown in the table below were calculated under the assumption that the Company shall elect to develop the land complexes and the rates of entrepreneurial profit and cash flow in future stages shall be similar to the rates of the Grafental project that are in progress as of the report date (entrepreneurial profit of 28% - 32% and cash flows of 35% - 40% of the scope of sales). 30The corporation's effective portion in said parcel of land is 83%.

14
and/or the formation of special conditions that may significantly change the Company's estimates detailed
above and have a material impact on the expected revenues from the projects ,including their overall
profitability.
Part A – Board of Directors Explanations in regard to the State of the Corporations' Businesses, the Results of its Activities, its Equity and Cash Flow; (1) Financial Position
Assets
March 31
December 31,
Explanation for the change
2017 2016 2016
EUR in thousands
Current assets
Cash and cash equivalents 123,546 70,397 89,278 See details in the statement of cash flows
Balances receivable from
banks 2,195 1,277 2,221
Restricted deposits,
financial assets and other
receivables 13,157 15,063 10,088
Tenants and trade
receivables, net 4,121 4,959 3,545
Inventory of buildings
under construction
44,451 45,719 45,754
On one hand, increase in inventory in
respect of progress in constructing Stages C
and D and on the other hand, decrease in
inventory for hand over apartments in Stage
B3.
Total current assets 187,470 137,415 150,886
Asset held for sale - 4,700 -
Non-current assets:
Investments measured at
equity 8,318 5,005 8,318
Inventory of real estate 14,092 25,307 13,820
Investment property – real
estate rights 101,984 96,657 101,939
Investment property –
income producing assets 1,116,174 1,020,177 1,089,943
The increase in the reported period derived
from capex investments in existing assets
and revaluation profits
Restricted deposits for
investments in assets 2,324 76 2,227
Other accounts receivable,
fixed assets and other
financial assets 1,669 1,254 3,027
Deferred taxes 6,367 8,657 3,608
Total non-current assets: 1,250,928 1,157,133 1,222,882
Total assets 1,438,398 1,299,248 1,373,768

15
Liabilities
March 31
December 31, Explanation for the change
2017 2016 2016
EUR in thousands
Current liabilities:
Current maturities of loans
from banks 24,164 15,622 16,164
Current maturities of
debentures 18,489 16,362 17,750
Loans for financing
inventory of buildings
under construction 3,000 3,500 7,000
Repayment of construction loan
Current maturities of other
financial liabilities 450 768 456
Accounts payable 22,447 22,138 26,270
Advances from apartment
purchasers 19,901 24,785 16,073
Liability component in
respect of issuance of
warrants 542 - -
Total current liabilities 88,993 83,175 83,713
Non-current liabilities:
Loans from banks and
others 554,454 563,280 568,157
Debentures 135,586 125,389 130,169
The increase in the reported period derives
from exchange rate differences
Other liabilities 3,133 3,148 3,133
Other financial liabilities 296 2,129 434
Deferred taxes 72,888 56,035 68,099
766,357 749,981 769,992
Total liabilities 855,350 833,156 853,705
Equity
Equity attributable to
equity holders of the
company 488,503 358,351 419,173
The increase in the reported period mainly
derives from issuance of capital and profit in
the period.
Non controlling interests 94,545 107,741 100,890
Total equity 583,048 466,092 520,063
Total liabilities and equity 398,81,43 1,299,248 1,373,768

16
(2) Activity Results
Three months
ended March 31
Year ended
December 31,
Explanation for the change
2017 2016 2016
EUR in thousands
Revenues from rental of
properties 18,129 17,339 72,111
Purchase of new assets and increase in
rental fees in identical assets Revenues from property
management and others 7,153 6,050 25,539
Property management expenses (6,750) (5,688) (25,064)
Cost of maintenance of rental
properties (2,289) (2,019) (8,803)
Rental and management
revenues, net 16,243 15,682 63,783
Revenues from sale of
apartments 8,371 21,095 73,935
Handover of apartments in Stage B3 of
the residential project
Cost of sale of apartments (6,627) (16,729) (58,537)
Income from the sale of
apartments 1,744 4,366 15,398
General and administrative
expenses (2,355) (3,355) (12,594)
General and administrative
expenses attributed to inventory
of apartments under
construction and inventory of
real estate (724) (824) (2,222)
selling and marketing expenses (172) (104) (422)
Cost of share based payment (218) (383) (1,227)
Increase (decrease) in the value
of investment property, net 21,207 15,383 80,459
Operating profit 35,725 30,765 143,175
Financing income 26 6 25
Financing expenses excluding the
effect of exchange rate
differences, CPI and hedging
transactions, net (4,924) (5,123) (20,716)
Current repayments of bank loans and
bonds and decrease in interest rate on
refinanced loans offset by increase in
bank loans for financing the purchase of
new assets.
Effect of exchange rate
differences, CPI and currency
hedging transactions, net (4,749) 22 (3,399)
Change in the value of loans and
interest rate swap transactions,
net 288 (440) (3,793)
Changes in the interest curve in Europe
and hedging transactions
Income before taxes on income 26,366 25,230 115,292
Taxes on income (2,204) (5,563) (26,586)
Reported net income 24,162 19,667 88,706
Net income attributed to:
Company shareholders 22,582 18,401 76,276
Non-controlling interests 1,580 1,266 12,430

17
3) Cash flows
Access to financing sources – the Company evaluates its accessibility to financing sources as very high in light of its financial strength, the stability of core activity, and the good relationships it has created with the banks financing real-estate projects in Germany as well as high accessibility to the capital market in Israel and the Company's high debt rating.
It is indicated that for the period of three months ended March 31, 2017, the Company has in its solo reports positive cash flows from operating activity deriving from exchange rate differences and therefore is not representative and for the period ended December 31, 2016, the Company has in its solo reports negative (but not in the consolidated statements) cash flows from operating activity amounting to EUR 1,584 thousand. The Board has determined, based on its examination, that this does not indicate on liquidity difficulty since cash flows and liquid balances in the Company (solo) with the unlimited liquid balances which can be distributed immediately from subsidiaries as of the signing date of the report amount to EUR 95 million compared to its current liabilities amounting EUR 20 million so as of the report signing date, the Company (solo) has a working capital surplus of EUR 75 million consisting of cash balances and liquid balances. The Board believes that the issue at hand is merely technical whereas in view of the high liquid balances maintained by the Company (solo), the Company elected not to receive management fees or distribute dividends from its wholly owned subsidiary (Brack German Properties B.V) and therefore no current revenues were recorded under the separate activity of the Company (solo) in a manner resulting in negative cash flows from operating activity of the solo company in 2016 and net of exchange differences - in the reported period.
(4) FFO (Funds from Operations)
Calculating FFO – the FFO index is calculated as the net profit (loss) attributed to Company's
shareholders from the income generating activity only excluding the income from sale apartments
in Grafental project with some adjustments for non-operating items, which are affected from the
revaluation of the fair value of assets and liabilities. It deals mainly with adjustments of the fair
value of investment property, miscellaneous capital profits and losses, miscellaneous amortizations,
adjustment of expenses for management and marketing of the Düsseldorf project (since the
revenues in respect of this project are not taken into account in the FFO), changes in fair value
recognized for financial instruments, deferred taxes and non controlling interests for the above
items.
Three months
ended March 31
Year ended
December 31, Explanation for the change
2017 2016 2016
EUR in thousands
Cash flows provided by operating activities (Cash flows used in operating activities)
16,361 14,737 71,086
Expansion of the Company's
activity and the timing of receipts
from the residential development
project
Cash flows provided by investing activities (Cash flows used in investing activities) (8,006) (2,512) (62,275)
Purchase of new assets and Capex
investments in existing assets
Cash flows provided by financing activities (Cash flows used in financing activities) 25,913 2,352 24,647

18
The Company believes that this index reflects more correctly the Company's operating results,
without the entrepreneurial project and its publication will provide a more correct basis for
comparing the Company's operating results in a certain period with prior periods, and will enable
the comparison of the operating results with other real-estate companies in Israel and in Europe.
The Company clarifies that the FFO index does not represent cash flows from operating activity
according to generally accepted accounting principles, does not reflect cash held by the Company
and its ability to distribute it, and does not replace the reported net profit (loss). In addition, it is
clarified that these indices do not constitute data audited by the Company's auditors.

19
Below is the calculation of the Company's FFO for the said periods:
As aforesaid, the FFO I in the three months ended March 31, 2017 amounted to approximately EUR 8.1 million, grossing up an annual FFO rate of EUR 32.3 million.
Three months ended March 31, 2017
Three months ended March 31,
2016
Year ended December 31, 2016
Net profit attributed to the Company's
shareholders 22,582 18,401 76,276
Adjustments for net profit:
Adjustments for revaluations
Increase (decrease) in the value of investment
property and adjustments of liability value relating
to investment property (21,497) (14,410) (72,261)
Revaluation of loans and interest swap
transactions at fair value (161) 356 3,867
B. Adjustments for non cash flow items
Cost of share-based payment and changes in
capital reserves 394 443 1,327
Amortization of financing costs, indexing and non
cash exchange rate differences and hedging
transactions 5,350 425 5,367
Interest component in hedging transactions 228 213 1,059
Deferred tax expenses and taxes for prior years 2,204 4,908 24,308
C. Unique items / new activities / ceased
activities / other
Depreciation and contributions, professional
services and onetime expenses (725) 858 1,553
Adjustments related to associates and non
controlling interests - (1,851) (2,665)
Expenses relating to project management and
marketing in connection with the establishment of
residential project in Düsseldorf and adjustments
in respect of current leasing activity in the project 1,154 1,033 3,236
Gain from sale of apartments (1,447) (3,624) (12,781)
Total of adjustments to net profit (14,500) (11,649) (46,990)
F.F.O 8,082 6,752 29,286

20
5) EPRA NAV Index – Net Asset Value (EUR in millions)
The EPRA NAV is an index purported to show the net asset value of the real estate company
according to the status paper of EPRA - European Public Real Estate Association. The EPRA NAV
reflects the net asset value of the Company assuming that assets are held for a long term and
therefore certain adjustments are required such as neutralizing deferred taxes deriving from
revaluation of investment property and neutralizing the fair value of derivative financial
instruments. Furthermore, the adjustments made by the Company under this index include the
addition of profits that were not yet recognized in the statements in respect of apartments under
construction that were sold in Grafental project (stages B and C).
The Company believes that this index reflects more correctly the net asset value of the Company
and its publication will enable the comparison to other real estate companies in Israel and Europe.
The Company clarifies that the EPRA NAV index data do not represent a valuation nor they
represent a substitute to the data contained in the financial statements. It is further clarified that
these data are not audited by the Company's auditors.
The following is the calculation of the EPRA NAV index and the adjusted EPRA NAV index of the
Company:
March 31, 2017 EUR in millions
March 31, 2016 EUR in millions
December 31, 2016
EUR in millions
Equity attributed to the Company's shareholders 488. 5 358.4 419.2
Plus deferred taxes for EPRA adjustments (net of non controlling interest)
70.7 53.4 65.9
Net of fair value of derivative financial instruments, net (net of non controlling interest)
0.3 0.5 0.3
Plus profits that were not yet recognized in respect of apartments that were sold and are under construction in stages B and C of the residential project
6.1 6.2 5.8
EPRA NAV –Net Asset Value 565.6 418.5 491.2

21
6) Events after the date of the report, affecting the Company's financial position
Dividend policy – on May 18, 2017, the Company's Board of Directors decided on a dividend policy deriving from the Company's annual FFO, according to which each year from 2018 and in respect of 2017 and thereafter, the Company will distribute to its shareholders a dividend and/or distribute to its shareholders capital (collectively: "the Distribution") of 30% of the total FFO31 (from the income producing activity only, excluding profit from the Company's development activity) according to the audited annual consolidated financial statements known on the time the distribution resolution has been made. For the purposes of calculating the FFO for a given year, the distribution amount will be derived from the FFO, the FFO data for the fourth quarter of that year will be adjusted to the data for the entire year (namely, if the FFO in the fourth quarter amounts to EUR 8 million, the FFO amount for that year from which the distribution amount is to be derived will be EUR 32 million. The resolution on such distribution will be made by the Company's Board of Directors after the approval of the annual financial statements for that year for which distribution is made. It should be noted that this decision does not derogate from the Board of Directors' authority to examine from time to time the policy and decide at any time, taking into account business considerations and the provisions of the law, on a change in policy or on a change in the distribution rate for a particular period or decide not to make a distribution at all
It is hereby clarified that the aforesaid dividend policy should not be regarded as a commitment by the Company to make a distribution according to its provisions, and each distribution will be discussed separately by the Company's Board of Directors, which will be authorized to decide on the actual distribution at its discretion, inter alia, taking into account the criteria detailed above and subject to the approval to carry out such distribution by the general meeting of the Company's shareholders, if and to the extent required (in accordance with the provisions of any law).The Company's Board of Directors may also review from time to time such dividend policy and change it and/or cancel it at its sole discretion.
Part B – Exposure to Market Risks and Way of Managing Them
Market risks to which the Company is exposed
Exchange rate effects – as of the report date, the Company's net currency exposure, net of the liabilities for which the Company carried out currency hedging transactions is at a rate of 6.27% of its total scope of assets as a result of the Company's liabilities due to the bonds (Series A, B and C) that were issued to the public in Israel and are denominated in NIS. Other than that, the Company is not exposed to material changes in currency exchange rates, as most of its activities, assets and liabilities are denominated in EUR. The Company reviews from time to time, the possibility, and hedges its liabilities in NIS, partly or wholly, against future changes in the EUR/NIS exchange rate.
The fair value of the Company's primary financial instruments
As at the report date, most of the Company's financial instruments are presented at their fair value.
31 for information about the FFO calculation manner for 2016 see section 1.7.5.2 in Chapter A "Description of the
corporations business" in the Company's periodic report for 2016 (which was published on March 26, 2017 (Ref.
number 029265-01-2017).

22
Below are sensitivity tests for changes in the fair value of the Company's primary financial instruments, due to changes in the interest (in EUR thousands):
The basic interest is 3-month Euribor.
March 31, 2017:
*) The fair value of the bonds is presented at its quoted value in the Tel Aviv stock exchange. The sensitivity
tests are performed based on the interest basis deriving from this value.
Below are sensitivity tests for changes in the fair value of the Group's primary financial instruments, due to changes in the EUR-NIS exchange rate (in EUR thousands):
March 31, 2017:
-10% -5% Fair Value 5% 10%
(14,236) (7,118) (142,364) 7,118 14,236 Bonds (net of cash held in NIS)
Below are sensitivity tests for changes in the fair value of the Group's primary financial instruments, due to changes in the EUR-NIS exchange rate (in EUR thousands):
March 31, 2017:
-10% -5% Fair Value 5% 10%
4,000 2,000 3,959 (2,000) (4,000) Currency hedging transactions
Below are sensitivity tests for changes in the fair value of the Group's primary financial
instruments, linked to the consumers' price index, due to changes in consumers' price index
March 31, 2017:
-4% -3% Fair Value 3% 4%
6,709 5,032 (167,737) (5,032) (6,709) Bonds
-10% -5% Fair Value 5% 10%
(1,563) (920) (167,737) 351 980 Bonds *)
(318) (159) (274,869) 159 318 Fixed-interest loans
(36) (18) (730) 18 36
Interest rate swap transactions
which are not recognized as
accounting hedging
(1,917) (1,097) (443,336) 528 1,334 Total

23
The fair value of the investment properties is also affected by changes in the interest rate in
the market. A permanent increase / decrease (increase/decrease forecast by the market as one
which is not temporary, but rather characterizes a medium/long-term trend) in market interest
rates will lead to changes in the requested yields on real-estate properties (although there is no
full correlation between the change in market interest levels and the change in yield on
properties), and to a decrease / increase in their fair value, respectively. However, since only a
change in market interest levels forecast as being permanent will lead to a change in the fair
value of the Company's properties, the transmission between the change of interest in the
market and the change in the fair value of the Company's properties is "slow", and occurs over
time (usually, a period of between 6 and 9 months is necessary before real-estate prices in the
market react to changes in market interest rates). Therefore, the effect of the increase in
market interest rates, which generally leads, after a certain period of time, to a decrease in the
fair value of the Company's properties, will be offset by the decrease in the fair value of the
Company's financial liabilities, and vice-versa.
Linkage basis report
Apart from the payments due to the bonds issued by the Company to the public in Israel that
are denominated in NIS, the Company's entire activity as of the report date is performed in
EUR, and therefore the Company's assets and liabilities are affected mainly by the EUR
currency. The payments of principal and interest due to the bonds issued by the Company will
be paid in NIS and linked to the consumers' price index. As at the Report Period, the Company
has no material exposure to other currencies except for NIS.

24
Part C – Corporate Governance Aspects
The Company is a Dutch company and the provisions of the Companies Law, 5759-1999
(hereinabove and hereinafter: "the Companies Law") do not apply thereto, with the exception of
such sections of the Companies Law which apply to a foreign company offering shares to the public
in Israel, by virtue of Section 39A of the Securities Law, 5728-1968 (hereinafter: "the Securities
Law").
On February 17 ,2016 , the Securities Order came into force (replacing the fourth addendum of the
law (- 2016 whereby the fourth amendment to the Securities Law has been replaced with the new
fourth addendum which is twofold :Part A ,which applies the provisions of corporate law which will
apply to companies incorporated outside Israel (below and only in this sub section "foreign
companies which shares are offered to the public in Israel - including applying the provisions of
sections 311-301 of the Companies Law regarding a permitted distribution ,dividends ,acquisition
and prohibited distribution (hereinafter" :part A of the fourth addendum) and Part B which applies
the provisions of corporate law on foreign companies offering liability certificates to the public. It is
clarified that the fourth addendum will not apply to foreign companies offering shares or liability
certificates to the public prior to the legislative amendment (like the Company). Nevertheless, the
amendment will apply to every foreign company (including the Company) that will carry out an IPO
of securities from the amendment date (February 17, 2016 onwards) including foreign companies
(including the Company) which carry out a reissuance. Accordingly, since the Company performed
reissuance of bonds (Series C) on April 4, 2016 starting from that date, the amendment applies to
the Company.
(1) Further to the aforesaid and according to the directive of the Securities Authority (ISA) for
foreign companies, which section 39a is applicable to them, to update the incorporation documents
such that they reflect the provisions of the fourth addendum, and according to the Company's
obligation toward ISA at the end of January 2017, that it will act to complete all of the actions
described above as soon as practicable including the summoning of the shareholders meeting, the
Company has acted and acts in the manner detailed below:
(a) Recently the Company has reviewed with its legal advisors in Holland a formal prescription of
the provisions of the companies law in the Company's articles of association so as to reflect the
above fourth addendum and upon the conclusion of such review (after receiving the approval of the
board which was granted on May 18, 2017) the Company will summon a general meeting of
shareholders for approving the revised articles;
(b) Based on interim findings it appears that there is no prevention to include those provisions,
mutatis mutandis, (as far as those were not yet prescribed in the Company's articles) and regarding
the derivative claim and answer and monetary sanction – by approximate performance as stated in
sub section (c) below;
(c) since the sections of the derivative claim and answer (sections 194 – 205a of the companies law)
and the sections of imposing monetary sanction (sections 363a(a) and (b)(2) to (12), 363b and 363c
of the companies law) cannot be prescribed explicitly in the Company's articles since they are not in
line with the absolute law applicable to the Company in Holland, the Company included in the
revised articles (which will be brought for approval of the meeting of the Company's shareholders)

25
provisions that relate to jurisdiction and application of law including the derivative claim and
answer and imposing administrative enforcement measures by the ISA;
(d) in addition to the aforesaid, on January 29, 2017, the deeds of trust were amended between the
Company, on one hand and Reznik Paz Nevo Trusts Ltd. on the other hand as the trustee for the
bondholders (Series A – C) such that the deeds of trust contained the obligations of the
Company/officers in connection with imposing monetary sanctions and/or administrative
enforcement measures on the Company and/or its officers32 as well as the obligations of the
Company and its officers not to raise any allegations against the right of the bondholders to file a
derivative claim (the obligations of the Company and officers). Furthermore, the obligations of the
Company and officers were included in the shelf offering report published by the Company on
January 29, 2017 under the shelf prospectus dated May 28, 2015 bearing the date of May 29, 2015;
2) Translation of the report to English
Without derogating from the liability, pursuant to the law, of each Board member for the contents
of this report, it is clarified that the members of the Board of Directors the Messers Jan Van Der
Meer, Lambertus Van den Heuvel, Robert Israel, Ulrich Tappe, Willem Van Hassel and Mrs. Nansia
Koutsu), are not Hebrew speakers33. The members of the Board of Directors informed the Company
that they approved this report based on the translation of the report to English and not the original
version of the report in Hebrew. Said directors stated that they are aware that the binding version
of the report is in its original version in Hebrew.
3) Donations
On March 23, 2017, the Board of Directors approved a donations budget of EUR 85 thousand for
2017. In the reported period, the Company did not make donations.
(4) Directors with accounting and financial expertise and independent directors
For information regarding the skills, education and experience of the Messers Jan Van Der Meer
(the chairman of the Board of Directors), Lambertus Van Den Heuvel (external director), Willem Van
Hassel (external director), Robert Israel (independent director) Ulrich Tappe (director and manager
of the development division of the Company) and Nansia Koutsou (director) in respect of which the
Company views them as directors having accounting and financial expertise , see regulation 26 in
the chapter "Additional Information About the Corporation" which is attached in chapter D to 2016
periodical report.
32Not to raise allegations against the powers of ISA and/or the administrative enforcement committee in Israel (the committee) in connection with monetary sanctions and/or administrative enforcement measures that will be imposed on the Company and/or its officers (as the case maybe) by ISA and/or the committee pursuant to Chapter H3 and/or Chapter H4 of the securities law and uphold the resolutions of ISA and/or committee including, without derogating from the generality of the foregoing, pay the monetary sanctions and/or payments to injured parties from the violation to be imposed on the Company and/or its officers (as the case may be and if imposed at all) and to take actions to cure the violation and its recurrence. 33It is noted that Mr. Or Levkovich who serves on the Company's Board from January 5, 2017 is a Hebrew speaker.

26
Part D – Disclosure Provisions in Regard to the Corporation's Financial Reporting
Events after the date of the Statement of Financial Position
See part A, section (6) as aforesaid.
Critical Accounting Estimates
Regarding critical accounting estimates see note 2 to the annual audited consolidated financial statements for 2016 which are attached in Chapter C in the periodic report for 2016.
Disclosure on material and very material valuations
There were no material or very material valuations in the first quarter of 2017.

27
Part E – Specific Disclosure for Bond Holders 1) Following are details regarding the liability certifications issued by the Company which are at the possession of the public as at the date of the report according to the
eighth addendum of the reports' regulations:
Bonds (Series A) Bonds (Series B) Bonds (Series C)
Is the series material (as this term is
defined in Regulation 10(B)(13)(a) of
the Reports' Regulations ?
Yes
Yes
Yes
Date of issue March 1, 2011 May 21, 2013 July 22, 2014
Date of expanding series June 19, 2012, November 6, 2012 February 4, 2014 April 4, 2016
Par value on the date of issue
(thousands NIS)
200,000
175,000
102,165
Par value on the date of expanding
series (thousands NIS)
240,000; 400,000
240,000
160,180
Par value as at 31.3.2017(thousands
NIS) 640,228 0,00012 156,911
Linked par value as at 31.3.2017
(thousands NIS) 237,413 210,000 159,911
Sum of cumulative interest plus linkage
differentials (thousands NIS) as at
31.3.2017 2,353 1,690 985
Value in financial statements as at
31.3.2017 including interest payable
(thousands NIS) 237,111 209,593 156,679
Value at the stock exchange as at
31.3.2017 (thousands NIS) 255,368 228,270 167,549
28
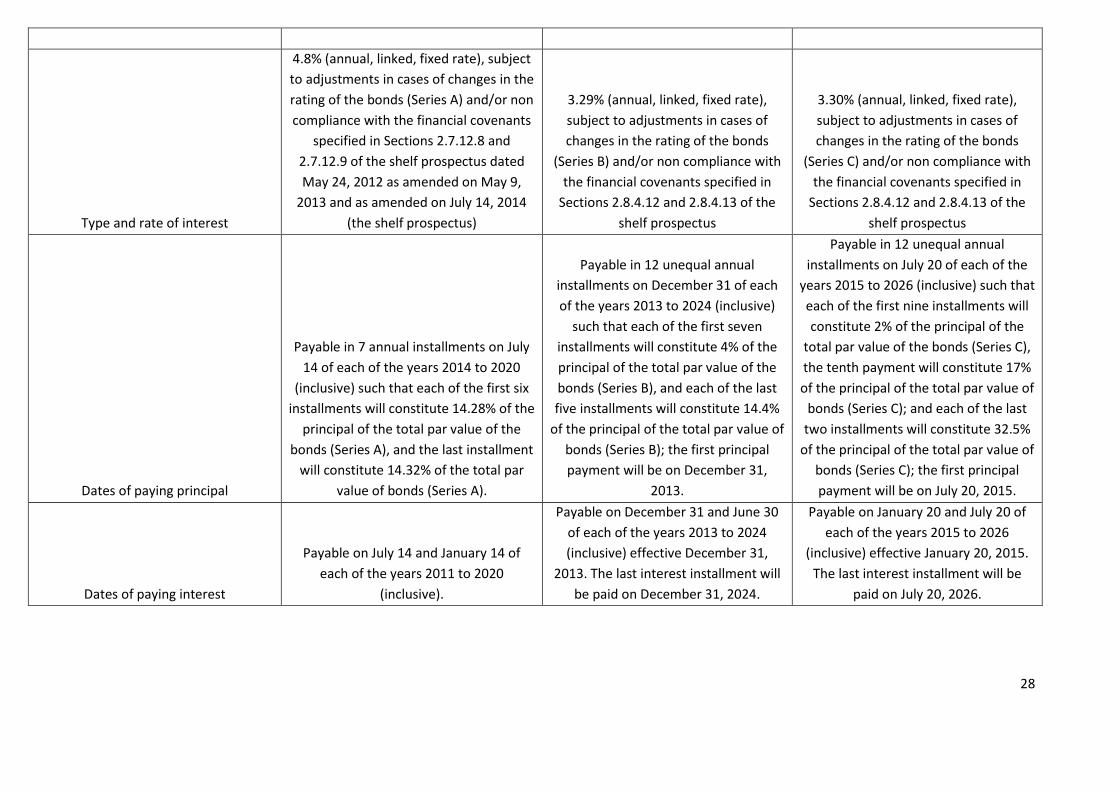
Type and rate of interest
4.8% (annual, linked, fixed rate), subject
to adjustments in cases of changes in the
rating of the bonds (Series A) and/or non
compliance with the financial covenants
specified in Sections 2.7.12.8 and
2.7.12.9 of the shelf prospectus dated
May 24, 2012 as amended on May 9,
2013 and as amended on July 14, 2014
(the shelf prospectus)
3.29% (annual, linked, fixed rate),
subject to adjustments in cases of
changes in the rating of the bonds
(Series B) and/or non compliance with
the financial covenants specified in
Sections 2.8.4.12 and 2.8.4.13 of the
shelf prospectus
3.30% (annual, linked, fixed rate),
subject to adjustments in cases of
changes in the rating of the bonds
(Series C) and/or non compliance with
the financial covenants specified in
Sections 2.8.4.12 and 2.8.4.13 of the
shelf prospectus
Dates of paying principal
Payable in 7 annual installments on July
14 of each of the years 2014 to 2020
(inclusive) such that each of the first six
installments will constitute 14.28% of the
principal of the total par value of the
bonds (Series A), and the last installment
will constitute 14.32% of the total par
value of bonds (Series A).
Payable in 12 unequal annual
installments on December 31 of each
of the years 2013 to 2024 (inclusive)
such that each of the first seven
installments will constitute 4% of the
principal of the total par value of the
bonds (Series B), and each of the last
five installments will constitute 14.4%
of the principal of the total par value of
bonds (Series B); the first principal
payment will be on December 31,
2013.
Payable in 12 unequal annual
installments on July 20 of each of the
years 2015 to 2026 (inclusive) such that
each of the first nine installments will
constitute 2% of the principal of the
total par value of the bonds (Series C),
the tenth payment will constitute 17%
of the principal of the total par value of
bonds (Series C); and each of the last
two installments will constitute 32.5%
of the principal of the total par value of
bonds (Series C); the first principal
payment will be on July 20, 2015.
Dates of paying interest
Payable on July 14 and January 14 of
each of the years 2011 to 2020
(inclusive).
Payable on December 31 and June 30
of each of the years 2013 to 2024
(inclusive) effective December 31,
2013. The last interest installment will
be paid on December 31, 2024.
Payable on January 20 and July 20 of
each of the years 2015 to 2026
(inclusive) effective January 20, 2015.
The last interest installment will be
paid on July 20, 2026.

29
Linkage base (principal and interest)
Linked (principal and interest) to the
consumers' price index published on
February 15, 2011 in respect of January
2011.
Linked (principal and interest) to the
consumers' price index published on
May 15, 2013 in respect of April 2013.
Linked (principal and interest) to the
consumers' price index published on
July 15, 2014 in respect of June 2014.
Are they convertible? No No No
Company's right to perform early
redemption or forced conversion
The Company may (but is not obligated
to), at any time and at its sole discretion,
make an early redemption of some or all
of the bonds (Series A), as it chooses,
until the date of the final repayment of
the bonds (Series A), everything
according to the decisions of the
Company's Board of Directors. For
further details, please see Section 2.7.3
of the shelf prospectus.
The Company may (but is not obligated
to), at any time and at its sole
discretion, make an early redemption
of some or all of the bonds (Series B),
as it chooses, until the date of the final
repayment of the bonds (Series B),
everything according to the decisions
of the Company's Board of Directors.
For further details, please see Section
2.8.15 of the shelf prospectus.
The Company may (but is not obligated
to), at any time and at its sole
discretion, make an early redemption
of some or all of the bonds (Series C),
as it chooses, until the date of the final
repayment of the bonds (Series C),
everything according to the decisions
of the Company's Board of Directors.
For further details, please see Section
2.8.15 of the shelf prospectus.
Was a guarantee provided for the
payment of the Company's liabilities
under the deed of trust? No No No

30
2) Details on the trustee
Bonds (Series A)
(A) Name of trust company: Reznik Paz Nevo Trust Ltd. (B)
Name of person responsible for the series of bond certificates in the trust company:
Yosi Reznik, CPA
(C)
Contact details:
Tel: 03-6399200 Fax: 03-6389222 Email: [email protected]
(D)
Mailing address for documents:
14 Yad Harutzim Street, Tel-Aviv
Bonds (Series B)
(A) Name of trust company: Reznik Paz Nevo Trust Ltd. (B)
Name of person responsible for the series of bond certificates in the trust company:
Yosi Reznik, CPA
(C)
Contact details:
Tel: 03-6399200 Fax: 03-6389222 Email: [email protected]
(D)
Mailing address for documents:
14 Yad Harutzim Street, Tel-Aviv
Bonds (Series C)
(A) Name of trust company: Reznik Paz Nevo Trust Ltd. (B)
Name of person responsible for the series of bond certificates in the trust company:
Yosi Reznik, CPA
(C)
Contact details:
Tel: 03-6399200 Fax: 03-6389222 Email: [email protected]
(D)
Mailing address for documents:
14 Yad Harutzim Street, Tel-Aviv
31
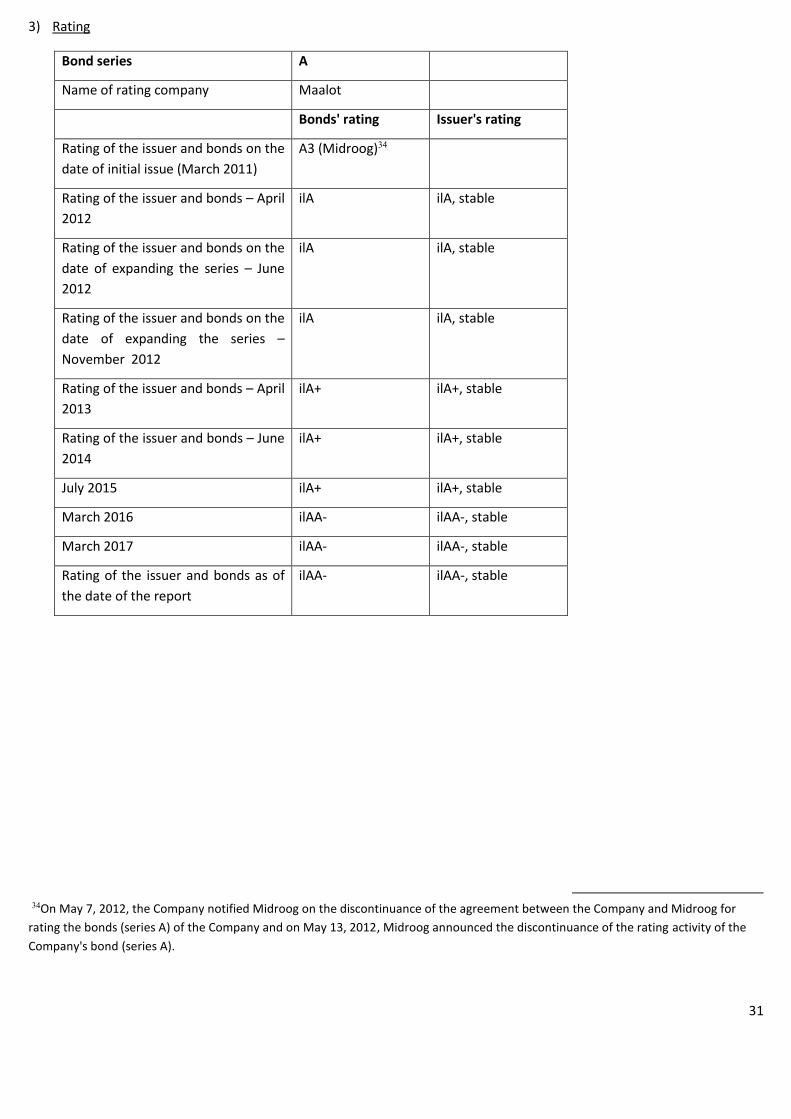
3) Rating
Bond series A
Name of rating company Maalot
Bonds' rating Issuer's rating
Rating of the issuer and bonds on the
date of initial issue (March 2011)
A3 (Midroog)34
Rating of the issuer and bonds – April
2012
ilA ilA, stable
Rating of the issuer and bonds on the
date of expanding the series – June
2012
ilA ilA, stable
Rating of the issuer and bonds on the
date of expanding the series –
November 2012
ilA ilA, stable
Rating of the issuer and bonds – April
2013
ilA+ ilA+, stable
Rating of the issuer and bonds – June
2014
ilA+ ilA+, stable
July 2015 ilA+ ilA+, stable
March 2016 ilAA- ilAA-, stable
March 2017 ilAA- ilAA-, stable
Rating of the issuer and bonds as of
the date of the report
ilAA- ilAA-, stable
34On May 7, 2012, the Company notified Midroog on the discontinuance of the agreement between the Company and Midroog for
rating the bonds (series A) of the Company and on May 13, 2012, Midroog announced the discontinuance of the rating activity of the
Company's bond (series A).

32
Bond series B
Name of rating company Maalot
Bonds' rating Issuer's rating
Rating of the issuer and bonds on
the date of initial issue (May 2013)
ilA+ ilA+, stable
Rating of the issuer and bonds on
the date of expanding the series –
February 2014
ilA+ ilA+, stable
Rating of the issuer and bonds –
June 2014
ilA+ ilA+, stable
July 2015 ilA+ ilA+, stable
March 2016 ilAA- ilAA-, stable
March 2017 ilAA- ilAA-, stable
Rating of the issuer and bonds as of
the date of the report
ilAA- ilAA-, stable
Bond series C
Name of rating company Maalot
Bonds' rating Issuer's rating
Rating of the issuer and bonds on the
date of initial issue (July 2014)
ilA+ ilA+, stable
July 2015 ilA+ ilA+, stable
March 2016 ilAA- ilAA-, stable
March 2017 ilAA- ilAA-, stable
Rating of the issuer and bonds as of
the date of the report
ilAA- ilAA-, stable

33
4) Compliance with terms and liabilities according to the deed of trust
To the Company's best knowledge, as of the report date and over the reported year, the Company has complied with
all the terms and liabilities according to the deeds of trust, including as at the end of the Report Period the Company
complied with all the financial covenants prescribed in the deed of trust of February 24, 2011 between the Company
and Reznik Paz Nevo Trust Ltd, the trustee for the bond holders (series A) and in the deed of trust dated May 9, 2013
between the Company and Reznik Paz Nevo Trust Ltd, the trustee for the bond holders (series B) and in the deed of
trust for bond holders dated July 14, 2014 (Series C) (the trustee and the deeds of trust, respectively) including the
following financial covenants:
A. The ratio of the Company's equity at the end of each quarter to its financial debt, net, according to solo reports
for that date, will not be under 187.5%35:
The Company's equity, which is attributed to the majority shareholders as at the Report Period, namely, as at
March 31, 2017, is EUR 488,503 thousand.
The financial debt, net, according to solo reports of the Company as at the same date is EUR 71,349 thousand.
Therefore, the ratio of the Company's equity to the financial debt, net, according to solo reports as at the end of
the Report Period, namely, as at March 31, 2017, is approximately 685%.
The ratio of the charged share value to net debt will not be less than the basic ratio (as defined hereunder).
With respect to the bond holders (Series A):
"The Basic Ratio": the ratio of the charged share value to a net debt of 175%.
"Net debt": the balance of the bonds' principal (series A) (plus accumulated linkage differentials and interest that
were not yet paid).
The number of charged shares of Brack Capital German Properties B.V., a subsidiary (100%) of the Company
(hereinafter: "BGP") as of March 31, 2017– 943,804.
The total issued share capital of BGP as of March 31, 2017 and as of the signing date of the report – 1,978,261.
The rate of charged shares out of the issued capital share of BGP as of March 31, 2017 – 47.7%.
BGP's equity which is attributed to its shareholders, as appears in the Company's financial statements as of March
31, 2017 – EUR 557,946 thousand.
The EUR/NIS representative exchange rate known, as of the signing date of the report as published by the Bank of
Israel - NIS 4.0114
The value of the charged shares – NIS 1,067,791 thousand.
Net debt – NIS 239,800 thousand.
Accordingly ,the ratio between the charged share value to net debt, as at the end of the Report Period, is
approximately 445% and therefore, the Company meets this ratio as well.
35The requirement to meet this ratio is relevant only to the bondholders of series A and B.

34
With respect to the bond holders (Series B):
"The Basic Ratio": the ratio of the charged share value to a net debt of 175%.
"Net debt": the ratio of the bonds' principal (series B) (plus accumulated linkage differentials and interest that
were not yet paid).
The number of charged shares of BGP as of March 31, 2017 – 640,027.
The total issued share capital of BGP as of March 31, 2017 and the signing date of the report – 1,978,261.
The rate of charged shares out of the issued capital share of BGP as of March 31, 2017 - 32.4%.
BGP's equity which is attributed to its shareholders, as appears in the Company's financial statements as of March
31, 2017 – EUR 557,946 thousand.
The EUR/NIS representative exchange rate known, as of the signing date of the report, as published by the Bank
of Israel – NIS 4.0114
The value of the charged shares – NIS 724,107 thousand.
Net debt – NIS 211,718 thousand.
Accordingly ,the ratio between the charged share value to net debt, as at the end of the Report Period, is
approximately 342% and therefore, the Company meets this ratio as well.

35
With respect to the bond holders (Series C):
"The Basic Ratio": the ratio of the charged share value to a net debt of 175%.
"Net debt": the ratio of the bonds' principal (series C) (plus accumulated linkage differentials and interest that
were not yet paid).
The number of charged shares of BGP as of March 31, 2017 – 394,430.
The total issued share capital of BGP as of March 31, 2017 and the signing date of the report – 1,978,261.
The rate of charged shares out of the issued capital share of BGP as of March 31, 2017 - 19.9%.
BGP's equity which is attributed to its shareholders, as appears in the Company's financial statements as of March
31, 2017 – EUR 557,946 thousand.
The EUR/NIS representative exchange rate known, as of the signing date of the report, as published by the Bank
of Israel - NIS 4.0114
The value of the charged shares – NIS 446,246 thousand.
Net debt – NIS 157,906 thousand.
Accordingly ,the ratio between the charged share value to net debt, as at the end of the Report Period, is
approximately 283% and therefore, the Company meets this ratio as well.
In addition, the Company committed under the financial covenants set forth in the deeds of trust that:
a. Minimum equity - pursuant to the series A deed of trust -the equity attributed to the majority shareholders
shall not fall below EUR 80 million and pursuant to the series B and C deeds of trust- equity shall not fall
below EUR 150 million and EUR 190 million, respectively, whereas as of the report date, the equity attributed
to the majority shareholders is EUR 488.5 million.
b. Restrictions on dividend distribution - under series A deed of trust- not to distribute dividends and/or
distribute equity to its shareholders and/or repurchase its treasury shares or of its convertible securities if it
will result in equity attributed to the majority shareholders that is lower than EUR 80 million, pursuant to the
series A deed of trust. As of the report date, the equity attributed to the majority shareholders is EUR 488.5
million.
Under series B and C deeds of trust - not to distribute dividends and/or distribute equity to its shareholders
and/or repurchase its treasury shares or its convertible securities if it will result in equity attributed to the
majority shareholders that is lower than EUR 160 million and EUR 200 million, respectively, and/or the debt
ratio to CAP (as defined below) that will exceed 70%. As of the report date, the equity attributed to the
majority shareholders is EUR 488.5 million and the debt ratio to CAP is 51.05% (as detailed below).
c. Maximum CAP ratio - the ratio between the net financial liabilities and its equity in addition to non
controlling interests and other financial liabilities (CAP) shall not exceed 90% pursuant to series A deed of
trust and shall not exceed 75% pursuant to Series B and C deeds of trust and is calculated in the following
manner (it is indicated that the value of items B (deferred loans) and C (negative equity) defining CAP as
specified in the bond deed is Zero):

36
Financial liabilities according to solo reports 154,075
Financial liabilities of the subsidiaries 581,618
Net of cash, cash equivalents and deposits (124,680)
Net of debt in respect of inventory of apartments under construction
(3,000)
CAP36 608,013
Equity including non controlling interests 583,048
Net financial debt, consolidated 608,013
CAP 1,191,061
Therefore, this ratio is 51.05%, whereas according to the deeds of trust such ratio should be lower than 90%
for Series A and lower than 75% for Series B and C.
5) Description of the charged properties for securing the Corporation's undertakings according to the liability certificates
The following are details regarding the charges for securing the Company's undertakings pursuant to the terms of the
Company's bonds (Series A, Series B and Series C) which are in force pursuant to any law and the Company's
corporate instruments, as at the date of issuing the report:
Bonds (Series A)
a) Charging BGP shares
To secure the liabilities of the Company toward the bond holders (Series A) and the trustee (including the
repayment of principal, interest and linkage differences) the Company charged, by first degree charge, in favor of
the trustee 943,804 ordinary shares par value of EUR 0.01 of BGP (representing 47.7% of BGP's issued and
outstanding share capital).
For details on the value of the charged shares in the financial statements of the Company, see the above small
section 3(b).
36Total equity and debt (CAP) – "the net consolidated financial debt" in addition to all the items below: a) the Company's equity
(including minority interests) as stated in the audited or reviewed consolidated statements of the Company; b) the Company's deferred
loan balance (as defined below); and – c) impairments recorded in the consolidated financial statements (as far as recorded) in respect
of the charged assets to secure the loans in the amount of the difference between the recourse and the loan carrying value in the
Company's consolidated financial statements. "Deferred loans" – any loan the Company received from any party, which under its terms
is subordinate in the repayment level to bonds (series A), bonds (series B), bonds of series C - F, or convertible bonds series G – K to be
issued, as far as it will issue, according to the shelf prospectus and which cannot be repaid (principal and/or interest) throughout the
term of the aforementioned bonds.

37
b) Negative pledge
As long as the bonds (Series A) are within the cycle (namely, as long as the bonds (Series A) have not been fully
repaid or settled in any way, including by way of self acquisition and/or early redemption), the Company
undertakes that it shall not charge, mortgage, assign by way of charging, or provide as another security of any
kind or as another security (hereinafter together in this sub-section only: "the Security") to any of its charges or
to the charges of others, in favor of any third party, BGP shares, if after creating the Security, the Company is left
with a number of BGP shares which are free and clean, in an amount constituting 10% or less than the total
number of the charged shares (for securing the bonds (Series A), as shall be from time to time. Whenever the
Company provides a security as stated in this Section above, the Company will forward a confirmation to the
trustee to the effect that it meets said condition, prior to providing the security37.
For details regarding the conditions set forth in the deed of trust for changing, releasing, replacing or cancelling
said liens, see Sections 2.7.12.10 – 2.7.12.12 of the shelf prospectus.
For details regarding the limitations on issuing additional liability certificates, see Section 2.7.12.33 of the shelf
prospectus.
As to the bonds (Series A), the Company warrants and represents , inter alia, that as long as there is a surplus of
bonds (Series A) in cycle, the Company will not take credit which shall be secured by charging the shares of any of
the companies held by BGP or the assets held by such companies.
Without derogating from the foregoing, the creation of the charge on the charged shares will not limit any action
of BGP or corporations it holds, including a limitation on charging shares which are held by BGP in other
corporations for securing non-recourse credit to BGP and/or put a limitation on charging assets by corporations
held by BGP for securing non-recourse credit to BGP.
For further details regarding the Company's liabilities towards the holders of bonds (Series A), see, inter alia,
Section 2.7.12.12(D) of the shelf prospectus.
Bonds (Series B)
a) Charging BGP shares
To secure the liabilities of the Company toward the bond holders (Series B) and the trustee (including the
repayment of principal, interest and linkage differences) the Company charged, by first degree charge, in favor of
the trustee 640,027 ordinary shares par value of EUR 0.01 of BGP (representing 32.4% of BGP's issued and
outstanding share capital).
For details on the value of the charged shares in the financial statements of the Company, see the above small
section 3(b). For additional information regarding said charge see section 5.6 of the modification and addendum
number 1 dated May 9, 2013 of the deed of trust dated May 23, 2012, which was attached as an appendix to the
shelf prospectus report of the Company dated May 19, 2013 (Series B deed of trust).
37It is indicated that as of March 31, 2017, all BGP shares are charged in favor of the trustee for the bond holders (Series A – C) and
therefore such condition does not appear to have been met. Nevertheless, it is clarified and stressed that the number of BGP charged
shares in favor of the trustee for the bond holders (Series A) is greater by 154% than the minimum number of BGP shares the Company
is required to charge to the trustee according to the basic ratio and the ratio of the charged shares to the net debt exceeds 134% the
ratio required to release the collaterals (as defined in the Series A deed of trust) and therefore the non fulfillment of the above
condition will not harm the holders

38
b) Negative pledge
As long as the bonds (Series B) are within the cycle (namely, as long as the bonds (Series B) have not been fully
repaid or settled in any way, including by way of self acquisition and/or early redemption), the Company
undertakes that it shall not charge, mortgage, assign by way of charging, or provide as another security of any
kind or as another security (hereinafter together in this sub-section only: "the Security") to any of its charges or
to the charges of others, in favor of any third party, BGP shares, if after creating the Security, the Company is left
with a number of BGP shares which are free and clean from any claim/demand and/or a right of any third party,
in an amount constituting 10% or less than the total number of the charged shares to the trustee (for securing the
bonds (Series B) and BGP shares charged to the trustee for bonds (Series A) to secure the bonds (Series A) , as
shall be from time to time.
It is stressed that this small section will not apply as long as the ratio of charged shares to the net debt will be
equal to the ratio required for releasing collaterals (as defined in the Series B deed of trust).
For details regarding the conditions set forth in the deed of trust for changing, releasing, replacing or cancelling
said liens, see Section 5.5 of the Series B deed of trust.
For details regarding the limitations on issuing additional liability certificates, see Section 4 of the Series B deed of
trust.

39
As to the bonds (Series B), the Company warrants and represents, inter alia, that as long as there is a surplus of
bonds (Series B) in cycle, the Company will not take credit which shall be secured by charging the shares of any of
the companies held by BGP or the assets held by such companies. It was clarified that the creation of the charge
on the charged shares will not limit any action of BGP or corporations it holds, including a limitation on charging
shares which are held by BGP in other corporations for securing non-recourse credit to BGP and/or put a
limitation on charging assets by corporations held by BGP for securing non-recourse credit to BGP.
For further details regarding the Company's liabilities towards the holders of bonds (Series B), see, inter alia,
Section 8 of the Series B deed of trust.
Bonds (Series C)
c) Charging BGP shares
To secure the liabilities of the Company toward the bond holders and the trustee (including the repayment of
principal, interest and linkage differences) the Company charged, by first degree charge, in favor of the trustee
394,430 ordinary shares par value of EUR 0.01 of BGP (representing 19.9% of BGP's issued and outstanding share
capital).
For details on the value of the charged shares in the financial statements of the Company, see the above small
section 3(b). For additional information regarding said charge see section 5.6 of the modification and addendum
number 2 dated July 14, 2014 of the deed of trust dated May 23, 2012, which was attached as an appendix to the
shelf prospectus report of the Company dated July 20, 2014 (Series C deed of trust).
Negative pledge As long as the bonds (Series C) are within the cycle (namely, as long as the bonds (Series C) have not been fully
repaid or settled in any way, including by way of self acquisition and/or early redemption), the Company
undertakes that it shall not charge, mortgage, assign by way of charging, or provide as another security of any
kind or as another security (hereinafter together in this sub-section only: "the Security") to any of its charges or
to the charges of others, in favor of any third party, BGP shares, if after creating the Security, the Company is left
with a number of BGP shares which are free and clean from any claim/demand and/or a right of any third party,
in an amount constituting 10% or less than the total number of the charged shares to the trustee for securing the
bonds (Series C) BGP shares charged to the trustee for securing the bonds (Series B) and BGP shares for securing
the bonds( Series A), as shall be from time to time.
It is stressed that this small section will not apply as long as the ratio of charged shares to the net debt will be
equal to the ratio required for releasing collaterals.
For details regarding the conditions set forth in the deed of trust for changing, releasing, replacing or cancelling
said liens, see Section 5.5 of the Series C deed of trust.
For details regarding limitations on issuing additional liability certificates, see Section 4 of the Series C deed of
trust.
As to the bonds (Series C), the Company warrants and represents, inter alia, that as long as there is a surplus of
bonds (Series C) in cycle, the Company will not take credit which shall be secured by charging the shares of any of
the companies held by BGP or the assets held by such companies.
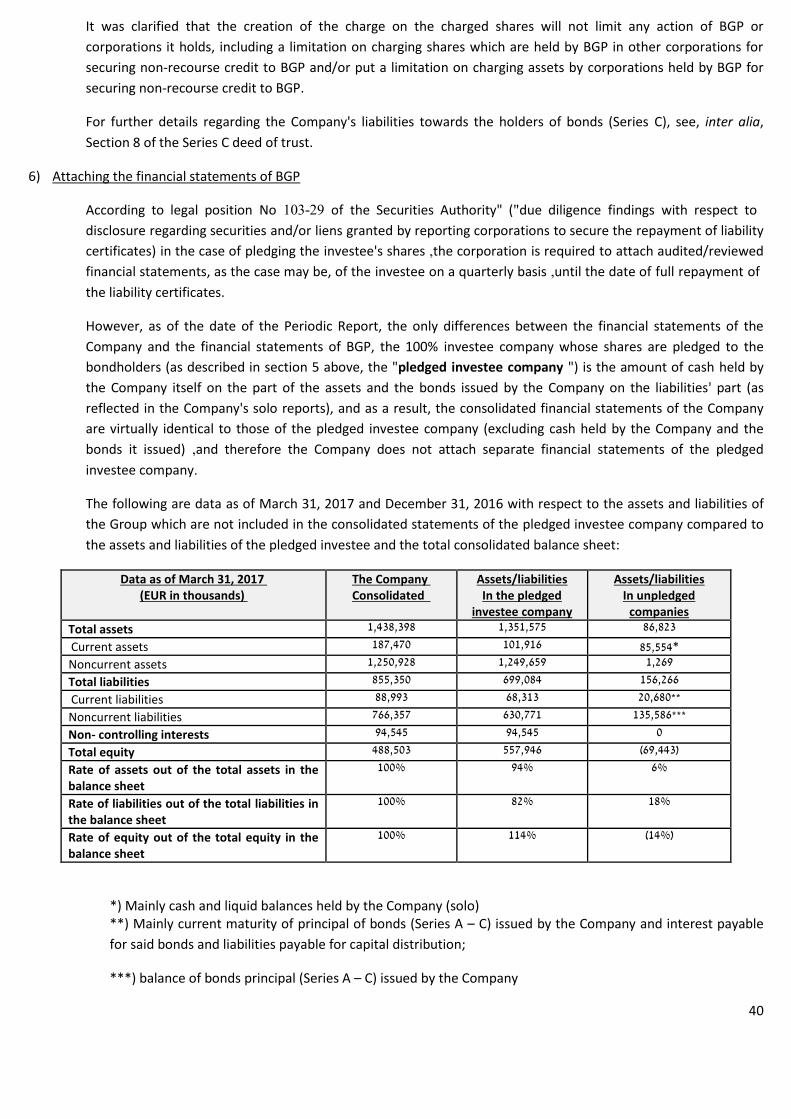
40
It was clarified that the creation of the charge on the charged shares will not limit any action of BGP or
corporations it holds, including a limitation on charging shares which are held by BGP in other corporations for
securing non-recourse credit to BGP and/or put a limitation on charging assets by corporations held by BGP for
securing non-recourse credit to BGP.
For further details regarding the Company's liabilities towards the holders of bonds (Series C), see, inter alia,
Section 8 of the Series C deed of trust.
6) Attaching the financial statements of BGP
According to legal position No 29-103 of the Securities Authority" ("due diligence findings with respect to
disclosure regarding securities and/or liens granted by reporting corporations to secure the repayment of liability
certificates) in the case of pledging the investee's shares ,the corporation is required to attach audited/reviewed
financial statements, as the case may be, of the investee on a quarterly basis ,until the date of full repayment of
the liability certificates.
However, as of the date of the Periodic Report, the only differences between the financial statements of the
Company and the financial statements of BGP, the 100% investee company whose shares are pledged to the
bondholders (as described in section 5 above, the "pledged investee company ") is the amount of cash held by
the Company itself on the part of the assets and the bonds issued by the Company on the liabilities' part (as
reflected in the Company's solo reports), and as a result, the consolidated financial statements of the Company
are virtually identical to those of the pledged investee company (excluding cash held by the Company and the
bonds it issued) ,and therefore the Company does not attach separate financial statements of the pledged
investee company.
The following are data as of March 31, 2017 and December 31, 2016 with respect to the assets and liabilities of
the Group which are not included in the consolidated statements of the pledged investee company compared to
the assets and liabilities of the pledged investee and the total consolidated balance sheet:
7March 31, 201Data as of (EUR in thousands)
The Company Consolidated
Assets/liabilities In the pledged
investee company
Assets/liabilities In unpledged
companies
Total assets 1,438,398 1,351,575 86,823
Current assets 187,470 101,916 *85,554
Noncurrent assets 1,250,928 1,249,659 1,269
Total liabilities 855,350 699,084 156,266
Current liabilities 88,993 68,313 **20,680
Noncurrent liabilities 766,357 630,771 ***135,586
Non- controlling interests 94,545 94,545 0
Total equity 488,503 557,946 (69,443)
Rate of assets out of the total assets in the balance sheet
%100 %94 %6
Rate of liabilities out of the total liabilities in the balance sheet
%100 %82 %18
Rate of equity out of the total equity in the balance sheet
%100 %114 (%14)
*) Mainly cash and liquid balances held by the Company (solo) **) Mainly current maturity of principal of bonds (Series A – C) issued by the Company and interest payable
for said bonds and liabilities payable for capital distribution;
***) balance of bonds principal (Series A – C) issued by the Company
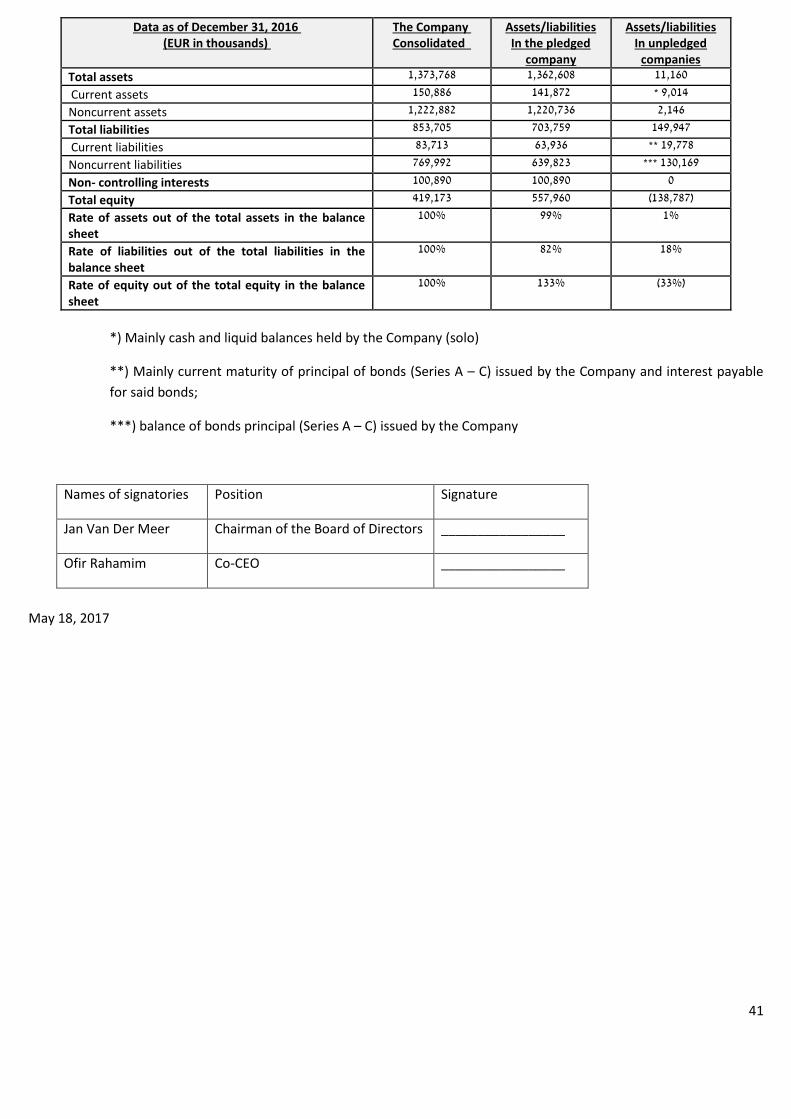
41
620131, December Data as of (EUR in thousands)
The Company Consolidated
Assets/liabilities In the pledged
company
Assets/liabilities In unpledged
companies
Total assets 1,373,768 1,362,608 11,160
Current assets 150,886 141,872 9,014 *
Noncurrent assets 1,222,882 1,220,736 2,146
Total liabilities 853,705 703,759 149,947
Current liabilities 83,713 63,936 19,778 **
Noncurrent liabilities 769,992 639,823 130,169 ***
Non- controlling interests 100,890 100,890 0
Total equity 419,173 557,960 (138,787)
Rate of assets out of the total assets in the balance sheet
100% 99% 1%
Rate of liabilities out of the total liabilities in the balance sheet
100% 82% 18%
Rate of equity out of the total equity in the balance sheet
100% 133% (33%)
*) Mainly cash and liquid balances held by the Company (solo)
**) Mainly current maturity of principal of bonds (Series A – C) issued by the Company and interest payable
for said bonds;
***) balance of bonds principal (Series A – C) issued by the Company
Names of signatories Position Signature
Jan Van Der Meer Chairman of the Board of Directors _________________
Ofir Rahamim Co-CEO _________________
May 18, 2017

- 1 -
BRACK CAPITAL PROPERTIES NV
INTERIM CONDENSED CONSOLIDATED FINANCIAL STATEMENTS
AS OF MARCH 31, 2017
UNAUDITED
IN THOUSANDS OF EUROS
Table of Contents
Page
Auditors Review Report 2
Interim Condensed Consolidated Statements of Financial Position 4-3
Interim Condensed Consolidated Statements of Profit or Loss
and Other Comprehensive Income 5
Interim Condensed Consolidated Statements of Changes in Equity 8-6
Interim Condensed Consolidated Statements of Cash Flows 9- 10
Notes to the Interim Condensed Consolidated Financial Statements 20-11
- - - - - - - - - - - -

- 2 -
Auditor Review Report to the Shareholders of Brack Capital Properties NV
Introduction
We have reviewed the accompanying financial information of Brack Capital Properties NV and its subsidiaries
(hereinafter – the Group), which includes the condensed consolidated statement of financial position as of March
31, 2017 and the condensed consolidated statements of profit or loss and other comprehensive income, changes of
equity and cash flows for the three-month period ending that date. The Board of Directors and Management are
responsible for preparing and presenting financial information for these interim periods in accordance with IAS
34, Interim Financial Reporting, and are responsible for preparing financial information for these interim periods
in accordance with Chapter D of the Securities Regulations (Periodic and Immediate Reports), 1970.Our
responsibility is to express our conclusions with regard to the financial information for these interim periods,
based on our review.
Scope of the Review
We conducted our review in accordance with Review Standard 1 of the Institute of Certified Public Accountants
in Israel, "Review of Interim Financial Information Performed by the Independent Auditor of the Entity”. A
review of financial information for interim periods consists of inquiries, mainly from people responsible for
finances and accounting, and of the application of analytical and other reviewing procedures. A review is
significantly limited in scope relative to an audit conducted according to generally accepted Israeli auditing
standards, and therefore does not allow us to achieve assurance that we have been made aware of all material
issues that might have been identified in an audit. Accordingly, we are not expressing an audit opinion.
Conclusion
Based on our review, nothing has come to our attention that causes us to believe that the above financial
information has not been prepared, in all material aspects, in accordance with IAS 34.
In addition to the previous paragraph, based on our review, nothing has come to our attention that causes us to
believe that the above financial information does not comply, in all material respects, with disclosure provisions
according to Chapter D of the Securities Regulations (Periodic and Immediate Reports), 1970.
May 18, 2017 Amit, Halfon, CPAs
:e-mail 03-6125030 :פקס 03-6123939 :טל 52506גן -רמת ,16 סילבר אבא הילל 'רח
[email protected] www.ahcpa.co.il Amit, Halfon is a member firm of the PKF International Limited network of legally independent firms and does not accept any responsibility or liability for the actions or inactions on
the part of any other individual member firm or firms.
עמית, חלפון

- 3 -
BRACK CAPITAL PROPERTIES NV
INTERIM CONDENSED CONSOLIDATED STATEMENTS OF FINANCIAL POSITION
March 31, December 31,
2017 6201 2016
(Unaudited) (Audited)
€ in thousands
Current Assets Cash and cash equivalents 123,546 70,397 89,278 Balances receivable from banks 2,195 1,277 2,221 Restricted deposits, financial assets and other receivables 13,157 15,063 10,088 Tenants and trade receivables, net 4,121 4,959 3,545 Inventory of buildings under construction 44,451 45,719 45,754 187,470 137,415 150,886 Asset held for sale - 4,700 - Non-Current Assets Investments in companies measured at equity 8,318 5,005 8,318 Inventory of real estate 14,092 25,307 13,820 Investment property - rights to land 101,984 96,657 101,939 Investment property – income generating assets 1,116,174 1,020,177 1,089,943 Restricted deposits for investments in properties 2,324 76 2,227 Other accounts receivable, fixed assets and other
financial assets 1,669 1,254 3,027 Deferred taxes 6,367 8,657 3,608
9281,250, 1,157,133 1,222,882 398,81,43 1,299,248 1,373,768
The accompanying notes are an integral part of the interim consolidated financial statements.

- 4 -
BRACK CAPITAL PROPERTIES NV
INTERIM CONDENSED CONSOLIDATED STATEMENTS OF FINANCIAL POSITION
March 31, December 31,
7201 6201 2016
(Unaudited) (Audited)
€ in thousands
Current Liabilities Current maturities of loans from banks 24,164 15,622 16,164
Current maturities of debentures 18,489 16,362 17,750
Loans for financing inventory of buildings under
construction 3,000 3,500 7,000
Current maturities of other financial liabilities 450 768 456
Accounts payable 22,447 22,138 26,270
Advances from apartment purchasers 19,901 24,785 16,073
Liability component in respect of the issuance of
warrants 542
88,993 83,175 83,713
Non-Current Liabilities
Loans from banks and others 554,454 563,280 568,157
Debentures 135,586 125,389 130,169
Other liabilities 3,133 3,148 3,133
Other financial liabilities 296 2,129 434
Deferred taxes 72,888 56,035 68,099
766,357 749,981 769,992
Equity Attributable to Company Shareholders
Share capital 72 66 67
Premium on shares 115,590 68,640 69,221
Treasury shares (883) (951) (883)
Other capital reserves 6,988 4,317 6,614
Statutory capital reserve 253,971 286,279 233,463
Retained earnings 112,765 - 110,691
Total equity attributable to Company shareholders 488,503 358,351 419,173
Non-controlling interests 94,545 107,741 100,890
Total equity 583,048 466,092 520,063
1,438,398 1,299,248 1,373,768
The accompanying notes are an integral part of the interim consolidated financial statements.
May 18, 2017
Date of approval of
the financial statements Jan Van Der Meer Chairman of the Board
of Directors
Ofir Rahamim Joint CEO
Guy Priel CFO

BRACK CAPITAL PROPERTIES NV
- 5 -
INTERIM CONDENSED CONSOLIDATED STATEMENTS OF PROFIT OR LOSS AND OTHER
COMPREHENSIVE INCOME
Three months ended
March 31,
Year ended
December 31,
2017 2016 2016
(Unaudited) (Audited)
€ in thousands (except per share amounts)
Revenues from rental of properties 18,129 17,339 72,111
Revenues from property management and others 7,153 6,050 25,539
Property management expenses (6,750) (5,688) (25,064)
Cost of maintenance of rental properties (92,28) (2,019) (8,803)
Rental and management revenues, net 316,24 15,682 63,783
Revenues from sale of apartments 8,371 21,095 73,935
Cost of sale of apartments (6,627) (16,729) (58,537)
Income from sale of apartments 1,744 4,366 15,398
Administrative and general expenses (3552,) (3,355) (12,594)
Administrative and general expenses attributed to the
inventory of apartments under construction and
inventory of real estate (724) (824) (2,222)
Selling and marketing expenses (172) (104) (422)
Cost of share based payment (Administrative and
general) (218) (383) (1,227)
Operating income before change in investment property
value 51814, 15,382 62,716
Increase in value of investment property, net 21,207 15,383 80,459
Operating income 72535, 30,765 143,175
Finance income 26 6 25
Finance expenses excluding the effect of exchange rate
differences, CPI and currency hedging transactions (4,924) (5,123) (20,716)
Effect of exchange rate differences, CPI and currency
hedging transactions, net (4,749) 22 (3,399)
Change in value of loans, interest-swap transactions
and refinance costs, net 288 (440) (3,793)
Income before taxes on income 36626, 25,230 115,292
Taxes on income (2042,) (5,563) (26,586)
Net income 162,24 19,667 88,706
Other comprehensive income: - - -
Total other comprehensive income 162,24 19,667 88,706
Total comprehensive income attributable to:
Company shareholders 22,582 18,401 76,276
Non-controlling interests 1,580 1,266 12,430
24,162 19,667 88,706
Net earnings per share attributable to the Company's
shareholders (in Euro)
Basic net income 223. 2.79 11.55
Diluted net income 133. 2.74 11.22
The accompanying notes are an integral part of the interim consolidated financial statements.

BRACK CAPITAL PROPERTIES NV
- 6 -
INTERIM CONDENSED CONSOLIDATED STATEMENTS OF CHANGES IN EQUITY
Equity Attributable to Company Shareholders
Share
Capital Premium
on Shares Treasury
Shares Other capital
reserves Statutory Capital
Reserve Retained
Earnings Total Controlling -Non
Interests Total
Equity
Unaudited
€ in thousands
Balance as of January 1,
2017 (audited) 67 69,221 (883) 6,614 233,463 110,691 419,173 100,890 520,063 Net income and
comprehensive income - - - - - 582,22 582,22 5801, 162,24 Total comprehensive
income - - - - - 582,22 582,22 5801, 162,24 Classification as per
provisions of Dutch law - - - - 508,20 (508,20) - - - Cost of share-based
payment - - - 218 - - 218 - 218 Capital reserve adjustment
in respect of transactions
with controlling
shareholder - - - 156 - - 156 - 156 Issuance of share capital,
net 5 36946, - - - - 37446, - 37446, Distribution and payment
to non controlling
interests - - - - - - - (7,925) (7,925) Balance as of March 31,
2017 (unaudited) 72 590,115 (883) 6,988 971,325 765,112 503488, 54594, 048,358
The accompanying notes are an integral part of the interim consolidated financial statements.

BRACK CAPITAL PROPERTIES NV
- 7 -
INTERIM CONDENSED CONSOLIDATED STATEMENTS OF CHANGES IN EQUITY
Equity Attributable to Company Shareholders
Share
Capital Premium
on Shares Treasury
Shares Other capital
reserves Statutory Capital
Reserve Retained
Earnings Total Controlling -Non
Interests Total
Equity
Unaudited
€ in thousands
Balance as of January 1,
2016 (audited) 66 74,689 (951) 3,841 267,878 - 345,523 108,577 454,100
Net and comprehensive
income - - - - - 18,401 18,401 1,266 19,667
Total comprehensive
income - - - - - 18,401 18,401 1,266 19,667
Classification as per
provisions of Dutch law - - - - 18,401 (18,401) - - -
Cost of share-based
payment - - - 383 - - 383 - 383
Capital reserve adjustment
in respect of transactions
with controlling
shareholder - - - 93 - - 93 - 93
Distribution and payment
to non-controlling
interests - - - - - - - (2,102) (2,102)
Increase of share capital 6,049 (6,049) - - - - - - -
Capital distribution to the
Company's shareholders (6,049) - - - - - (6,049) - (6,049)
Balance as of March 31,
2016 (unaudited) 66 68,640 (951) 4,317 286,279 - 358,351 107,741 466,092
The accompanying notes are an integral part of the interim consolidated financial statements.

BRACK CAPITAL PROPERTIES NV
- 8 -
INTERIM CONDENSED CONSOLIDATED STATEMENTS OF CHANGES IN EQUITY
Equity Attributable to Company Shareholders
Share
Capital Premium
on Shares Treasury
Shares Other capital
reserves Statutory Capital
Reserve Retained
Earnings Total Controlling -Non
Interests Total
Equity
Unaudited
€ in thousands
Balance as of January 1,
2016 (audited) 66 74,689 (951) 413,8 267,878 - 345,523 108,577 454,100
Total net income and
comprehensive income - - - - - 76,276 76,276 12,430 88,706
Total comprehensive income - - - - - 76,276 76,276 12,430 88,706
Classification as per provisions of Dutch law, net - - - - (34,415) 34,415 - - -
Exercise of options into shares 1 544 68 (466) - - 147 - 147
Cost of share-based payment - - - 1,227 - - 1,227 - 1,227
Adjustment of capital reserve in respect of transactions with controlling shareholder - - - 80 - - 80 - 80
Purchase of rights from non-controlling interests - - - 1,932 - - 1,932 (16,920) (14,988)
Increase of share capital 6,049 (6,049) - - - - - - - Capital distribution to the
Company's shareholders and adjustment in respect of treasury shares (6,049) 37 - - - - (6,012) - (6,012)
Distribution and payment to non-controlling interests - - - - - - - (3,197) (3,197)
Balance as of December
31, 2016 (audited) 67 69,221 (883) 6,614 233,463 110,691 419,173 100,890 520,063
The accompanying notes are an integral part of the interim consolidated financial statements.

BRACK CAPITAL PROPERTIES NV
- 9 -
INTERIM CONDENSED CONSOLIDATED STATEMENTS OF CASH FLOWS
Three months ended March 31,
Year ended December 31,
2017 2016 2016 Unaudited Audited € in thousands
Cash flows from operating activities: Net income 162,24 19,667 88,706 Adjustments required to present net cash provided by
operating activities:
Adjustments to profit or loss:
Depreciation 74 50 281 Financial expenses, net 10,804 5,455 25,121 Increase in value of investment property, net (21,207) (15,383) (80,459) Deferred taxes, net 2,201 5,521 25,944 Cost of share-based payment 218 383 1,227 Capital reserve adjustment in respect of transactions
with controlling shareholder 156 93 80
(754,7) (3,881) (27,806)
Cash flows from operating activities before changes in asset and liability items 408,16 15,786 60,900
Changes in assets and liabilities items:
Decrease (increase) in tenants, restricted deposits and
other receivables and related parties (4,065) (79) 1,772 Increase (decrease) in accounts payable (1,411) (846) 4,077
(5,476) (925) 5,849
Net cash provided by operating activities before
decrease (increase) in inventory of real estate, inventory of buildings under construction and advances from apartment purchasers 10,932 14,861 66,749
Increase (decrease) in advances from apartment purchasers 6,015 (10,902) (19,614)
Decrease (increase) in inventory of buildings under construction (314) 10,495 12,180
Decrease (increase) in inventory of real estate (272) 283 11,771
Net cash provided by operating activities 16,361 14,737 71,086
The accompanying notes are an integral part of the interim consolidated financial statements.

BRACK CAPITAL PROPERTIES NV
- 10 -
INTERIM CONDENSED CONSOLIDATED STATEMENTS OF CASH FLOWS
Three months ended
March 31, Year ended
December 31, 2017 2016 2016 Unaudited Audited € in thousands
Cash Flows from investing activities
Investment in fixed assets (5,295) (189) (529)
Investment in companies measured at equity - - (3,313)
Proceeds from sale of investment property - - 10,963
Proceeds from sale of subsidiaries, net (a) - - 10,708
Repayment (grant) of loans to employees, net - (72) -
Increase in long term accounts receivable - - (84)
Withdrawal (placement) of restricted deposits, prepaid
transaction costs and withdrawal (placement) of long-
term deposits in banks, net (2,737) (3092,) 697
Interest received and sale of derivatives 26 24,728 25,174
Net cash used in investing activities (8,006) (2,512) (62,275)
Cash flows from financing activities Interest paid (5,275) (5,460) (18,567) Exercise of stock options - - 147 Distribution and payment to non controlling interests (145,6) (2,102) (3,197) Receipt of long-term loans, net - 13,842 93,195 Issuance of debentures, net - - 14,127 Repayment of debentures - - (17,117) Repayment of long-term loans (9,583) (3,928) (22,941) Issuance of shares and warrants, net 46,916 Capital distribution to the Company's shareholders - - (6,012) Purchase of rights from non-controlling interests - - (14,988)
Net cash provided by (used in) financing activities 913,25 2,352 24,647
Change in cash and cash equivalents 34,268 14,577 33,458 Balance of cash and cash equivalents at the beginning of
the period 89,278 55,820 55,820
Balance of cash and cash equivalents at the end of the
period 123,546 70,397 89,278
The accompanying notes are an integral part of the interim consolidated financial statements.
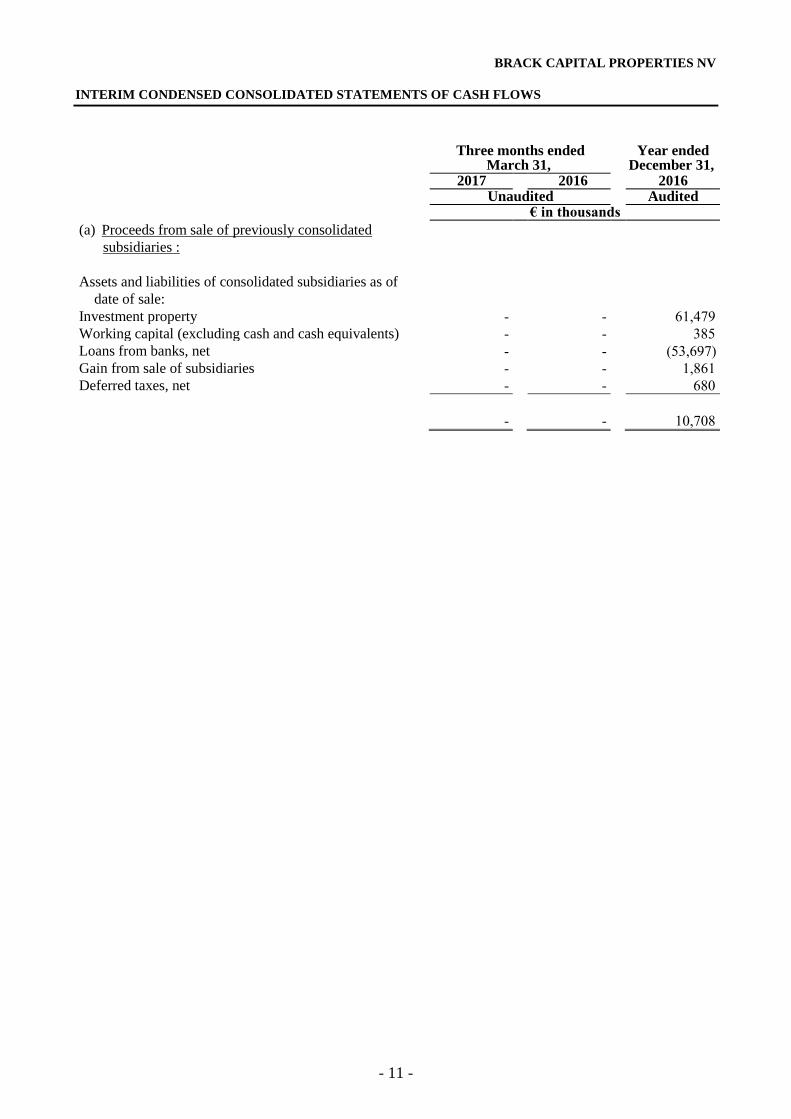
BRACK CAPITAL PROPERTIES NV
- 11 -
INTERIM CONDENSED CONSOLIDATED STATEMENTS OF CASH FLOWS
Three months ended March 31,
Year ended December 31,
2017 2016 2016 Unaudited Audited € in thousands
(a) Proceeds from sale of previously consolidated
subsidiaries :
Assets and liabilities of consolidated subsidiaries as of
date of sale:
Investment property - - 61,479
Working capital (excluding cash and cash equivalents) - - 385
Loans from banks, net - - (53,697)
Gain from sale of subsidiaries - - 1,861
Deferred taxes, net - - 680
- - 10,708

BRACK CAPITAL PROPERTIES NV
NOTES TO THE INTERIM CONDENSED CONSOLIDATED FINANCIAL STATEMENTS
- 12 -
Note 1: - General
These Financial Statements have been prepared in a condensed format as of March 31, 2017
and for the three month period then ended (hereinafter – the Consolidated Interim Financial
Statements). These Statements should be read in conjunction with the annual financial
statements as of December 31, 2016 and for the year then ended and the accompanying notes
(the consolidated annual financial statements).
Note 2: - Significant accounting policies
a. Preparation format of the Interim Consolidated Financial Statements
The Consolidated Interim Financial Statements are prepared in accordance with
acceptable accounting principles for preparing financial statements for interim periods as
stated in International Accounting Standard 34 Interim Financial Reporting and in
accordance with the provisions of disclosure pursuant to Chapter D of the Securities
(Immediate and Periodic Reports) Regulations, 1970.
b. The significant accounting policies and calculation methods implemented in preparing the
Interim Consolidated Financial Statements are consistent with those implemented in
preparing the consolidated annual Financial Statements.
c. New standards in the period prior to their adoption
1. IFRS 15 - Revenue from Contracts with Customers:
For details regarding the expected changes in the Company's revenue recognition policy
and regarding other effects on matters relating to the Company's business – see Note 2
(AE) of the Company's annual financial statements as of December 31, 2016.
2. IFRS 9 – Financial Instruments:
For details regarding the expected changes in the classification and measurement policy
of financial assets and regarding other effects on matters relating to the Company's
business – see Note 2 (AE) of the Company's annual financial statements as of December
31, 2016.
Note 3: - Financial instruments
a. Financial instruments not measured at fair value
The following are the carrying balances and the fair value of the financial instruments
groups shown in the financial statements not at their fair value:
7201, March 31 6201, March 31 6201December 31,
Carrying
value
Fair value
Carrying
value
Fair value
Carrying
value
Fair value
Unaudited Audited
housands€ in t
Debentures and
interest payable in respect of debentures
155,389 167,737 143,023 155,438 149,794 161,297

BRACK CAPITAL PROPERTIES NV
NOTES TO THE INTERIM CONDENSED CONSOLIDATED FINANCIAL STATEMENTS
- 13 -
Note 3: - Financial instruments (Cont.)
Management has estimated that the balance of cash, short term deposits, trade
receivables, overdrafts and other current liabilities and bank loans presented at amortized
cost approximates their fair value.
b. Financial instruments measured at fair value
Classification of the financial instruments according to fair value hierarchy
The table below presents the financial assets and the financial liabilities of the group
according to fair value:
March 31, 2017
Level 1 Level 2 Level 3
Unaudited
€ in thousands
Assets: Foreign currency forward contracts– dollar 1,776 - -
CAP transactions - 1 -
Liabilities: Interest swap agreements - (730) -
Loans (76,074)
March 31, 2016
Level 1 Level 2 Level 3
Unaudited
€ in thousands
Assets: Interest swap agreements - 8 -
Liabilities: Foreign currency forward contracts– dollar (1,712) - - - (1,185) -
Loans - - (244,208)

BRACK CAPITAL PROPERTIES NV
NOTES TO THE INTERIM CONDENSED CONSOLIDATED FINANCIAL STATEMENTS
- 14 -
Note 3: - Financial instruments (Cont.)
c. Reconciliation of fair value measurements that are categorized within Level 3 of the fair
value hierarchy in financial instruments:
Financial instruments
2017 2016
€ in thousands
Balance as of January 1 (audited) (76,867) (245,509)
Total profit (loss) recognized in profit or loss 295 (188)
Repayment/classification of loans 498 4891,
Balance as of March 31 (unaudited) (76,074) (208244,)
Financial
instruments
€ in
thousands
Balance as of January 1, 2016 (audited) (245,509)
Total loss recognized in profit or loss (259)
Repayment/classification of loans 168,901
As of December 31, 2016 (audited) (76,867)
December 31, 2016 Level 1 Level 2 Level 3 € in thousands
Assets: Foreign currency forward contracts – dollar 2,146 - -
CAP transactions - 1 -
Liabilities:
Interest swap agreements - (875) -
Loans - - (76,867)

BRACK CAPITAL PROPERTIES NV
NOTES TO THE INTERIM CONDENSED CONSOLIDATED FINANCIAL STATEMENTS
- 15 -
Note 3: - Financial instruments (Cont.)
d. Valuation techniques
The following methods and assumptions were used to estimate the fair values:
The fair value of financial instruments not traded in active market is determined using
a valuation technique. Valuation techniques specific to financial instruments include:
- The fair value of interest swap contracts and CAP agreements is based on
calculating the present value of the estimated future cash flows using observable
return curves.
- The fair value of short term bank credit is based on calculating the discounted
cash flows using the credit actually observed of the euribor rate plus a margin.
e. The following describes unobservable material data in active market used in valuation:
Valuation
technique
unobservable
material data
Range
(weighted
average)
Sensitivity of
fair value to
change in data
Loans DCF
Discount
interest
Fixed
interest
2%
increase/decrease
in discount rate
will result in
increase/decrease
of up to € 1.5
million in fair
value
Interest
swap
transactions DCF
Payment
curve
Euribor
curve for
the
transaction
period
2%
increase/decrease
in Euribor curve
will result in
increase/decrease
of up to € 2.1
million in fair
value

BRACK CAPITAL PROPERTIES NV
NOTES TO THE INTERIM CONDENSED CONSOLIDATED FINANCIAL STATEMENTS
- 16 -
Note 4: - Operating Segments
Income-
Generating
Commercial
Real Estate
Income-
Generating
Residential
Real Estate
Land for
Betterment
Residential
development
Adjustments
Total
€ in thousands
For the Three-Month Period Ended
March 31, 2017 (unaudited)
Revenues from sale of apartments - - - 8,371 - 8,371
Cost of sale of apartments - - - (6,627) - (6,627)
Income from sale of apartments - - - 1,744 - 1,744
Revenues from property rental 7,883 10,199 47 - - 18,129
Revenues from property management
and others
2,051 5,087 15 - - 7,153
Property management expenses (2,046) (4,689) (15) - - (6,750)
Rental property maintenance expenses (865) (1,473) (158) - - (92,28)
Total rental and management
revenues, net
2307, 9,124 (111) - - 316,24
Administrative and general expenses (3552,)
Selling and marketing expenses and
administrative and general expenses
attributed to inventory of buildings
under construction and inventory of
real estate
- - - (896) - (896)
Cost of share based payment (218)
Increase in value of investment
property, net
(117) 21,538 (214) - - 21,207
Financial expenses, net (9,359)
Income before taxes on income 36626,

BRACK CAPITAL PROPERTIES NV
NOTES TO THE INTERIM CONDENSED CONSOLIDATED FINANCIAL STATEMENTS
- 17 -
Note 4: - Operating Segments (Cont.)
Income-
Generating
Commercial
Real Estate
Income-
Generating
Residential
Real Estate
Land for
Betterment
Residential
development
Adjustments
Total
€ in thousands
For the Three-Month Period Ended
March 31, 2016 (unaudited)
Revenues from property rental 8,737 5178, 85 - - 33917,
Revenues from property management
and others
1,941 0894, 20 - - 0506,
Property management expenses (1,903) (7653,) (20) - - (6885,)
Rental property maintenance expenses (745) (2191,) (55) - - (0192,)
Total rental and management
revenues, net
8,030 227,6 30 - - 68215,
Revenues from sale of apartments - - - 21,095 - 21,095
Cost of sale of apartments - - - (16,729) - (16,729)
Income from sale of apartments - - - 4,366 - 4,366
Administrative and general expenses (3,355)
Selling and marketing expenses and
administrative and general expenses
attributed to inventory of buildings
under construction and inventory of
real estate
- - - (928) - (928)
Cost of share based payment (383)
Increase in value of investment
property, net
3,119 12,264 - - - 15,383
Financial expenses, net (5,535)
Income before taxes on income 23025,
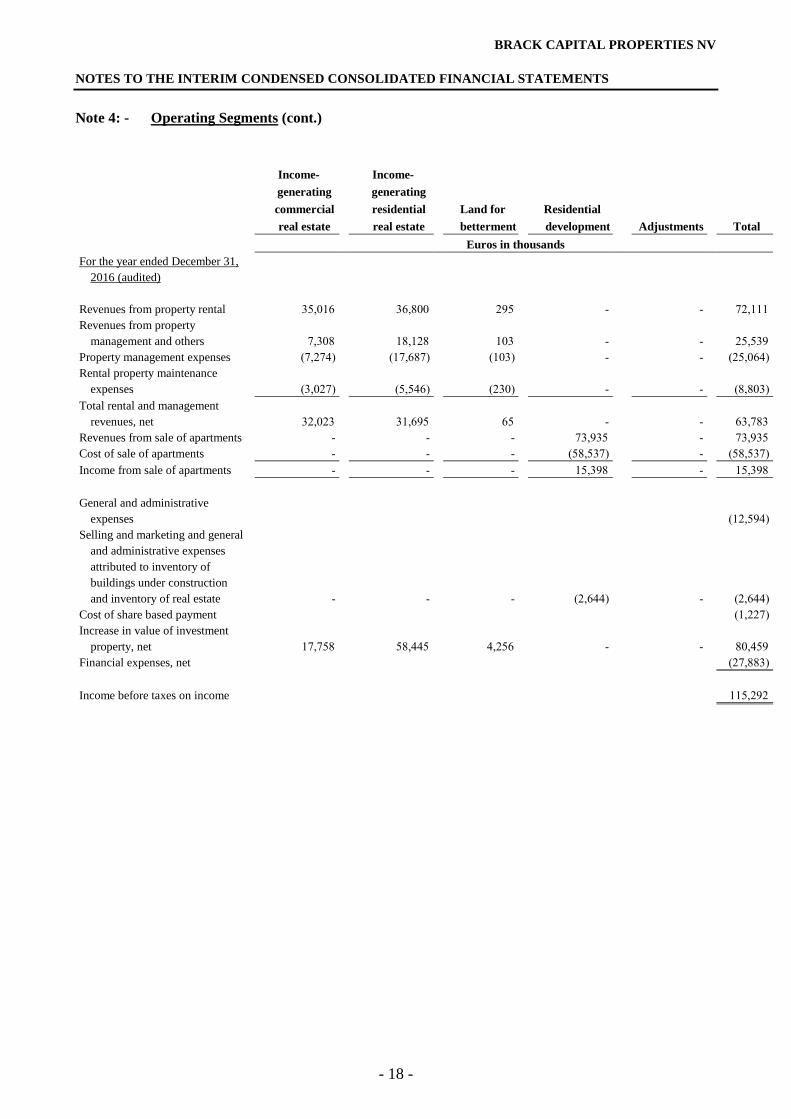
BRACK CAPITAL PROPERTIES NV
NOTES TO THE INTERIM CONDENSED CONSOLIDATED FINANCIAL STATEMENTS
- 18 -
Note 4: - Operating Segments (cont.)
Income-
generating
commercial
real estate
Income-
generating
residential
real estate
Land for
betterment
Residential
development
Adjustments
Total
Euros in thousands
For the year ended December 31,
2016 (audited)
Revenues from property rental 35,016 36,800 295 - - 72,111
Revenues from property
management and others
7,308 18,128 103 - - 25,539
Property management expenses (7,274) (17,687) (103) - - (25,064)
Rental property maintenance
expenses
(3,027) (5,546) (230) - - (8,803)
Total rental and management
revenues, net
32,023 31,695 65 - - 63,783
Revenues from sale of apartments - - - 73,935 - 73,935
Cost of sale of apartments - - - (58,537) - (58,537)
Income from sale of apartments - - - 15,398 - 15,398
General and administrative
expenses
(12,594)
Selling and marketing and general
and administrative expenses
attributed to inventory of
buildings under construction
and inventory of real estate
- - - (2,644) - (2,644)
Cost of share based payment (1,227)
Increase in value of investment
property, net
17,758 58,445 4,256 - - 80,459
Financial expenses, net (27,883)
Income before taxes on income 115,292

BRACK CAPITAL PROPERTIES NV
NOTES TO THE INTERIM CONDENSED CONSOLIDATED FINANCIAL STATEMENTS
- 19 -
Note 5: - Material Events during the Reported Period
1. Capital issuance – on January 31, 2017, the Company completed a public offering of 598,540
shares and 299,270 warrants (Series 1) exercisable into 299,270 shares of the Company at a total
monetary scope of EUR 49.5 million (gross) by a uniform offer in the tender on the unit price
pursuant to a shelf offering report that was published on January 29, 2017 by virtue of the shelf
prospectus bearing the date of May 29, 2015.
2. Purchase of residential portfolio in Hannover, Germany - on February 8, 2017, the Company
(through sub subsidiaries) entered into a notarized sale agreement with a third party that is not
related to the Company and/or to its controlling shareholder under which the seller will sell the
Company 156 residential units in Hannover, Germany for a total consideration of EUR 18
million (including related transaction costs). For the purpose of financing the purchase, the
Company (through a sub-subsidiary) negotiates with a German bank to obtain a loan in the
amount of EUR 10.4 million under non-recourse terms which its final repayment date is 5 years
from the date of receiving the loan bearing a variable interest based on Euribor plus a margin of
1.20% per annum. The transaction is expected to be completed in May 2017.
3. Purchase of residential portfolio in Essen, Germany – in the first quarter of 2017, the Company
(through a sub subsidiary) entered into a notarized sale agreement with a third party that is not
related to the Company and/or to its controlling shareholder under which the Company will
purchase from the seller 320 residential units in Essen, Germany for a total consideration of
EUR 23.6 million (including related transaction costs). For the purpose of financing the
purchase, the Company (through a sub-subsidiary) negotiates with a German bank to obtain a
loan in the amount of EUR 16 million under non-recourse terms which its final repayment date
is 5 years from the date of receiving the loan bearing a fixed interest rate of 1.08% per annum.
The transaction is expected to be completed in June 2017.
4. Purchase of residential assets in Leipzig, Bremen and Dusseldorf, Germany – in the first quarter
of 2017, the Company, through its wholly owned Dutch companies, entered into 4 different
transactions for the purchase of 163 flats for leasing in Leipzig, Bremen and Dusseldorf in
Germany (the acquired assets) for a total consideration of EUR 8 million (including related
transaction costs). The acquired assets span over a leasable area of 7.3 thousand sq.m, generating
current annual of EUR 342 thousand grossing up a significant rental increase of 25% to 35%, as
per the Company's estimate in view of the average rental in those cities/locations for similar
assets. The transactions will be financed in the first stage by equity where they are expected to
be completed in the second quarter of 2017.

BRACK CAPITAL PROPERTIES NV
NOTES TO THE INTERIM CONDENSED CONSOLIDATED FINANCIAL STATEMENTS
- 20 -
Note 6: - Material Events after the Reported Period
Dividend policy - the Company's Board of Directors decided on a dividend policy deriving from the
Company's annual FFO, according to which each year from 2018 and in respect of 2017 and
thereafter, the Company will distribute to its shareholders a dividend and/or distribute to its
shareholders capital (collectively: "the Distribution") of 30% of the total FFO (from the income
producing activity only, excluding profit from the Company's development activity). For the
purposes of calculating the FFO for a given year, the distribution amount will be derived from the
FFO, the FFO data for the fourth quarter of that year will be adjusted to the data for the entire year.

- 1 -
BRACK CAPITAL PROPERTIES NV
PRESENTATION OF FINANCIAL DATA
FROM THE INTERIM CONSOLIDATED FINANCIAL STATEMENTS
ATTRIBUTED TO THE COMPANY ITSELF
AS OF MARCH 31, 2017
UNAUDITED
IN THOUSANDS OF EUROS

- 2 -
To the Shareholders of Brack Capital Properties NV
Re: special report for review of the separate interim financial information in accordance with Regulation 38d of
the Securities Regulations (Periodic and Immediate Reports), 1970.
Introduction
We have reviewed the separate interim financial information according to regulation 38d of the Securities
regulations (Periodic and Immediate Reports), 1970 of Brack Capital Properties NV (hereinafter – the Company),
as of March 31, 2017 and for the three-month period ending that date. The Board of Directors and Management
are responsible for the separate interim financial information. Our responsibility is to express our conclusions with
regard to the separate interim financial information for this interim period, based on our review.
Scope of the Review
We conducted our review in accordance with Review Standard 1 of the Institute of Certified Public Accountants
in Israel, "Review of Interim Financial Information Performed by the Independent Auditor of the Entity”. A
review of financial information for interim periods consists of inquiries, mainly from people responsible for
finances and accounting, and of the application of analytical and other reviewing procedures. A review is
significantly limited in scope relative to an audit conducted according to generally accepted Israeli auditing
standards, and therefore does not allow us to achieve assurance that we have been made aware of all material
issues that might have been identified in an audit. Accordingly, we are not expressing an audit opinion.
Conclusion
Based on our review, nothing has come to our attention that causes us to believe that the above separate interim
financial information has not been prepared, in all material aspects, in accordance with Regulation 38d of the
Securities regulations (Periodic and Immediate Reports), 1970.
May 18, 2017 Amit, Halfon, CPAs
:e-mail 03-6125030 :פקס 03-6123939 :טל 52506גן -רמת ,16 סילבר אבא הילל 'רח
[email protected] www.ahcpa.co.il Amit, Halfon is a member firm of the PKF International Limited network of legally independent firms and does not accept any responsibility or liability for the actions or inactions on
the part of any other individual member firm or firms.
עמית, חלפון

- 3 -
BRACK CAPITAL PROPERTIES NV
AMOUNTS OF ASSETS AND LIABILITIES INCLUDED IN THE INTERIM CONSOLIDATED
STATEMENTS ATTRIBUTED TO THE COMPANY
March 31, December 31,
2017 6201 2016
Unaudited Audited
€ in thousands
Current Assets 41,049 17,620 4,654
Cash and cash equivalents 41,677 12,919 2,042
Cash and cash equivalents in trust 2,195 1,277 2,221
Balances receivable from banks 125 85 97
Other receivables 508 - -
Other financial assets
85,554 31,901 9,014
Non-Current Assets
Other financial assets 1,269 - 2,146
Investment in investee 557,946 477,423 557,960
559,215 477,423 560,106
644,769 509,324 569,120
Current Liabilities
Other accounts payable 1,649 7,512 2,028
Current maturity of debentures 18,489 16,362 17,750
Liability component in respect of issuance of warrants 542 - -
Other financial liabilities - 319 -
20,680 24,193 19,778
Non-Current Liabilities
Debentures 135,586 125,389 130,169
Other financial liabilities - 1,391 -
135,586 126,780 130,169
Equity
Share Capital 72 66 67
Premium on Shares 115,590 68,640 69,221
Treasury Shares (883) (951) (883)
Other capital reserves 6,988 4,317 6,614
Statutory capital reserve 253,971 286,279 233,463
Retained earnings 112,765 - 110,691
Total equity 488,503 358,351 419,173
644,769 509,324 569,120
May 18, 2017
Date of approval of
the financial statements
Jan Van Der Meer
Chairman of the Board
of Directors
Ofir Rahamim
Joint CEO
Guy Priel
CFO
The accompanying additional information is an integral part of the financial data and the separate financial
information

- 4 -
AMOUNTS OF PROFIT OR LOSS AND OTHER COMPREHENSIVE INCOME INCLUDED IN THE
INTERIM CONSOLIDATED STATEMENTS ATTRIBUTED TO THE COMPANY
Three months ended March 31,
Year ended December 31,
2017 2016 2016
Unaudited Audited
€ in thousands Administrative and general expenses (1,010) (752) (2,761)
Financial expenses, net (6,517) (239) (11,187)
Equity in earnings of investess 30,109 19,392 90,224
Net income 22,582 18,401 76,276
Other comprehensive income:
Total comprehensive income - - -
22,582 18,401 76,276
The accompanying additional information is an integral part of the financial data and the separate financial
information

BRACK CAPITAL PROPERTIES NV
- 5 -
AMOUNTS OF CASH FLOWS INCLUDED IN THE INTERIM CONSOLIDATED STATEMENTS
ATTRIBUTED TO THE COMPANY
Three months ended March 31,
Year ended December 31,
2017 2016 2016 Unaudited Audited € in thousands
Cash flows from operating activities: Net income attributed to the Company's shareholders 22,582 18,401 76,276
Adjustments required to present net cash provided by
operating activities:
Adjustments to the profit or loss items:
Financial expenses, net 8,089 181 11,110
Cost of share-based payment 218 383 1,227 Capital reserve adjustment in respect of transactions
with controlling shareholders 156 93 80
Equity in earnings of investees (30,109) (19,392) (90,224)
(21,646) (18,735) (77,807)
Changes in assets and liabilities items:
Increase in other receivables and related parties (29) (15) (27) Increase (decrease) in accounts payable and related
parties 164 (4) (26)
135 (19) (53)
Net cash provided by (used in) operating activities of
the Company 1,071 (353) (1,584)
Cash Flows from investing activities
Withdrawals of restricted deposits - 530 530
Change in investment in investees, net (9,535) (10,347) (9,853)
Interest received and exercise of derivatives - 24,722 25,174
Net cash provided by (used in) investing activities of the
Company (9,535) 14,905 15,851
The accompanying additional information is an integral part of the financial data and the separate financial
information

BRACK CAPITAL PROPERTIES NV
- 6 -
AMOUNTS OF CASH FLOWS INCLUDED IN THE INTERIM CONSOLIDATED STATEMENTS
ATTRIBUTED TO THE COMPANY
Three months ended
March 31, Year ended
December 31, 2017 2016 2016 Unaudited Audited € in thousands
Cash flows from financing activities Interest paid (2,057) (2,082) (5,908)
Issuance of debentures, net - - 14,127
Issuance of shares and stock options, net 46,916 - -
Capital distribution to the Company's shareholders - - (6,012)
Repayment of debentures - - (17,117)
Exercise of stock options - - 147
Net cash provided by (used in) financing activities of the
Company 44,859 (2,082) (14,763)
Change in cash and cash equivalents 36,395 12,470 (496) Balance of cash and cash equivalents at the beginning of
the period 4,654 5,150 5,150
Balance of cash and cash equivalents at the end of the
period 41,049 17,620 4,654
The accompanying additional information is an integral part of the financial data and the separate financial
information

BRACK CAPITAL PROPERTIES NV
ADDITIONAL INFORMATION
- 7 -
Note 1: - General
a. This separate financial information has been prepared in a condensed format as of March 31,
2017 and for the three month period then ended in accordance with Regulation 38d of the
Securities Regulations (Periodic and Immediate Reports), 1970. This separate financial
information should be read in conjunction with the annual financial statements as of
December 31, 2016 and for the year then ended and the additional information.
b. Subsidiaries as defined in note 1b of the annual financial statements of the Company as of
December 31, 2016.
c. The accounting policies applied in the preparation of this separate financial information is
consistent with the policies applied in the preparation of the separate financial information
as of December 31, 2016.
Note 2: Material Events during the Reported Period
a. Capital issuance - On January 31, 2017, the Company completed a public offering of
598,540 shares and 299,270 warrants (Series 1) exercisable into 299,270 shares of the
Company at a total monetary scope of EUR 49.5 million (gross) by a uniform offer in the
tender on the unit price pursuant to a shelf offering report that was published on January 29,
2017 by virtue of the shelf prospectus bearing the date of May 29, 2015
Note 3: Material Events after the Reported Period
Dividend policy - on May 18, 2017, the Company's Board of Directors decided on a
dividend policy deriving from the Company's annual FFO, according to which each year
from 2018 and in respect of 2017 and thereafter, the Company will distribute to its
shareholders a dividend and/or distribute to its shareholders capital of 30% of the total FFO
(from the income producing activity only, excluding profit from the Company's
development activity). For the purposes of calculating the FFO for a given year, the
distribution amount will be derived from the FFO, the FFO data for the fourth quarter of
that year will be adjusted to the data for the entire year.