board independence and corporate cash holding - aabriaabri.com/manuscripts/131627.pdf · journal of...
TRANSCRIPT

Journal of Finance and Accountancy
Board independence corporate cash, page 1
Board independence and corporate cash holding
Hoontaek Seo
Niagara University
Daniel L. Tompkins
Niagara University
Sangho Yi
Sogang University
ABSTRACT
The enactment of the Sarbanes-Oxley Act (SOX hereafter) and the contemporaneous change of
exchange listing rules in 2002 creates a natural experiment for the examination of the effect of board
independence on corporate cash holding practices and value of cash to shareholders. Findings include that
firms that are driven to take on a majority of independent directors on the board increased their cash
holdings and experienced higher value of cash to shareholders after the SOX. The increase in cash
holding is smaller in the firms which were financially constrained and firms which were subject to high
degree of external monitoring.
Keywords: Sarbanes-Oxley Act, Corporate Governance, Board Structure, Corporate Cash Holding, Value
of Cash
Copyright statement: Authors retain the copyright to the manuscripts published in AABRI
journals. Please see the AABRI Copyright Policy at http://www.aabri.com/copyright.html.
Journal of Finance and Accountancy
Board independence corporate cash, page 2
INTRODUCTION
The enactment of the Sarbanes-Oxley Act (SOX hereafter) and the contemporaneous change of
exchange listing rules in 2002 creates a natural experiment for the examination of the effect of board
independence on corporate cash holding practices and value of cash to shareholders.
In the perfect capital market, cash holding is a zero net present value investment and a firm’s
decision about how to use internal funds do not affect firm value since firms can freely access the capital
market to finance any positive net present value project without any friction (Modigliani and Miller
(1958)). However, this value irrelevance proposition of Modigliani and Miller is frequently violated in
reality. When a firm seeks external financing, it has to bear sizable transaction costs arising from several
ubiquitous factors including information asymmetry, taxes and bankruptcy costs in the actual capital
market. Thus, a firm’s cash holding practices may have significant value consequences.
Theory of the firm suggests another within-a-firm channel whereby a firm’s cash holding
practices may influence firm value. As a nexus of contracts, conflicts of interest between upper-level
managers and shareholders are common within a firm (Jensen and Meckling (1976)). While these
managers are contractually liable to maximize shareholders’ wealth, they often have strong preferences
for increasing their own utility at the expense of shareholders unless effective corporate governance
circumvents managers’ opportunistic behavior diverging from shareholders’ interests. Likewise, effective
corporate governance may limit a manager’s ability to pursue private benefits by squandering cash at her
discretion (Jensen (1986); Stultz (1990)), increasing value of cash to shareholders.
Previous studies report inconsistent evidence on the aforementioned relationship between
corporate governance, corporate cash holding practices and value of cash to shareholders. For example,
Dittmar and Mahrt-Smith (2007) show that the value of excess cash is reduced when firms are poorly
governed. They also show that poorly governed firms spend excess cash more quickly on less profitable
investments relative to firms with good corporate governance. Pinkowitz, Stultz, and Williamson (2006);
and Kalcheva and Lins (2007) provide similar evidence in their cross-country analysis. On the other hand,
Opler, Pinkowitz, Stultz and Williamson (1999) find that there is no significant relationship between
corporate cash holding practices and firm-level corporate governance. Thus, a causal relationship between
corporate governance and corporate cash holding practices is still not clear in the previous literature and is
still an open empirical question.
This paper revisits this issue by taking advantage of the SOX as a natural experiment. The SOX is
an interesting avenue of inquiry on this issue for the following reasons. The SOX provides a useful
laboratory since, after the passage of the SOX, the New York Stock Exchange (NYSE) and NASDAQ
amended their listing standards to raise the required percentage of independent directors on corporate
boards (Chhaochharia and Grinstein (2009)). Guo and Masulis (2012) conclude that monitoring becomes
more effective with a greater representation of independent directors on a board. This research uses the
difference-in-difference methodology, and compares the changes of corporate cash holdings and value of
cash to shareholders after the SOX for firms which had a minority of independent directors on the board
in the pre-SOX period with those of the firms which had a majority of independent directors on the board
in the pre-SOX period.
The overall results support the hypothesis that board independence significantly affects corporate
cash holding practices and increases value of cash to shareholders. First, previous research finds that
firms which had a minority of independent directors on the board in the pre-SOX period increased their
cash holdings in the post-SOX period relative to firms which had a majority of independent directors on
the board in the pre-SOX period. This finding suggests that improved board monitoring motivates firms
to hold larger cash reserves since improved board monitoring allows firms to adopt more flexible cash
holding practices. Especially, firms whose boards consisted predominately of non- independent directors
on the board in the pre-SOX period are critically affected by new listing standards resulting from the SOX.
Second, the effect of board independence on corporate cash holding practices was weaker for financially
constrained firms than for financially unconstrained firms. This finding further confirms the hypothesis
that improved board monitoring motivates firms to hold larger cash reserves since managers of financially

Journal of Finance and Accountancy
Board independence corporate cash, page 3
constrained firms are less able to squander their cash reserves and the effects of improved board
monitoring on corporate cash holding practices are expected to be smaller for these firms. The third result
is that the positive relationship between board independence and corporate cash holdings is smaller for
firms which were subject to intense external monitoring. The results imply that board independence and
external monitoring seem to act as substitutes to each other. Finally, the value of additional dollar of cash
increased in the post-SOX period in firms which didn’t have a majority of independent directors on the
board in the pre-SOX period relative to the value of additional dollar of cash in firms which had a
majority of independent directors on the board in the pre-SOX period. The result implies that improved
board monitoring increases the value of additional dollar of cash.
This paper contributes to the literature in several significant ways. First, it provides endogeneity-
free evidence that board independence leads to more flexible corporate cash holding practices and greater
value of cash to shareholders. Clear evidence on the causal relationship between board independence and
corporate cash holding practices is still scarce in the extant literature. The research exploits a unique
feature of the SOX to isolate a shock to corporate boards enhancing board independence. Second, taking
advantage of the SOX as a natural experiment, the research provides evidence on the substitutability
between internal and external corporate governance mechanisms. Improvement in internal corporate
governance mechanism impacts corporate cash holding practices only when the firm is subject to weak
external monitoring. Direction of the interaction between internal and external governance mechanisms is
not obvious ex ante but understanding how internal governance mechanisms interact with external
governance mechanisms is necessary when one views corporate governance of a firm as a portfolio of
internal and external governance mechanisms (Barber and Liang (2008)).
The remainder of this paper proceeds as follows. Developing the main hypothesis is first,
followed by a description of the data and sample. Third, the paper provides the empirical results. Last is
the conclusion.
HYPOTHESES DEVELOPMENT
This section develops several hypotheses concerning the causal relationship between board
independence and corporate cash holding practices.
Agency theory predicts that self-interested managers are more likely to squander excess cash
reserves in the present to fund pet projects or consume perquisites rather than hold them for future
investment (Jensen and Meckling (1976); Harford, Mansai and Maxwell (2008)). Furthermore, John and
Knyazeva (2006) suggest that poorly governed firms may choose to rely on pre-commitment to dividend
payments for the purpose of diluting significant managerial moral hazard problem due to poor corporate
governance, which results in small cash reserves maintained by such firms. On the other hand, Stultz
(1990) and Harford, Mansai and Maxwell (2008) suggest that good corporate governance may increase
corporate cash holding since shareholders who are aware of diluted managerial moral hazard problem due
to good corporate governance allows managers to hold larger cash reserves for the purpose of overcoming
underinvestment problem in the presence of costly frictions in the external financing. The aforementioned
arguments lead to the following hypothesis:
H1. Firms which have a minority of independent directors on the board in the pre-SOX period
would increase their cash holdings in the post-SOX period relative to firms which had a majority of
independent directors on the board in the pre-SOX period.
As a firm is financially more constrained, a manager’s ability to squander excess cash reserves to
seek private benefits and consume perquisites will be limited. Furthermore, cash holdings are more
valuable to financially constrained firms since for these firms external financing is more costly, which
aggravates costs of manager’s squandering cash for private benefit seeking (Denis and Sibilkov (2010)).
Therefore, the effect of board independence on corporate cash holding practices will be smaller for
financially constrained firms. Thus the paper investigates the hypothesis:
H2. For firms which were more financially constrained, the aforementioned effect of the
independent directors on corporate cash holding in H1 would be smaller.

Journal of Finance and Accountancy
Board independence corporate cash, page 4
Chhaochharia and Grinstein (2009) explain that the monitoring role of independent directors
could be well established by investigating the interaction between board independence and external
monitoring by block-holders, public pension funds or the market for corporate control. Harford, Mansi,
and Maxwell (2008) show that anti-takeover provisions are negatively related to corporate cash holdings
and institutional ownership is positively related to corporate cash holdings. If such external monitoring
substitutes for monitoring needs by independent directors, the board independence should not have an
effect on the corporate cash holdings in firms subject to intense external monitoring. These arguments
lead to the following hypothesis:
H3. For firms which were subject to high degree of external monitoring, the aforementioned
effect of the board independence on corporate cash holding in H1 would be smaller.
Dittmar and Mahrt-Smith (2007) show that an extra dollar of cash is less valuable to shareholders
at poorly governed firms. Thus, one could expect that an extra dollar of cash would be more valuable to
shareholders in the post-SOX period at firms that didn’t have a majority of independent directors on the
board in the pre-SOX period relative to the shareholders at firms that had a majority of independent
directors on the board. Thus the final hypothesis:
H4. The value of additional dollar of cash increased in the post-SOX period in firm which didn’t
have a majority of independent directors on the board in the pre-SOX period relative to the value of
additional dollar of cash in firms which had a majority of independent directors on the board.
DATA AND DESCRIPTIVE STATISTICS
RiskMetrics (formerly called IRRC) provides the data on boards of directors. The database
contains directors’ information of S&P 1500 firms. Accounting data is obtained from Compustat, the
stock return from CRSP, the Gompers, Ishii and Metrick (2003) index from RiskMetrics and
shareholdings by institutional investors from Thomson’s 13f filings database.
The sample spans from the year 1996 to 2006. The sample begins in 1996 since the board data is
available since 1996. The sample consists of all US firms which have complete (no missing) data on
director independence data on RiskMetrics in 2001 to determine whether a firm is affected or unaffected
by the regulation. Consistent with the previous literature, such as Liu and Mauer (2011) and Guo and
Masulis (2012), excluded firms include those in the financial service industries (SIC 6000-6999) and in
the utility sector (SIC 4900-4999). The firms are required to be listed on NYSE or NASDAQ from 2001
until 2004 to make sure that firms are subject to the regulation and the results are not driven by firms
entering or leaving the sample before or after the implementation of regulation. The final sample of firms
is comprised of 849 firms with 8059 firm-year observations.
Following Guo and Masulis (2012), Firms are identified as affected by the new listing rules
according to their board structure in the year 2001. The NYSE and NASDAQ required firms with
nonclassified boards to abide by the new listing rules during their first annual meeting between January
15, 2004 and October 31, 2004. For firms with classified board, the compliance deadline is the second
annual meeting between January 15, 2004 and December 31, 2005. However, many firms began to
change their board structure before the compliance deadlines. Guo and Masulis (2012) argue that board
structure “in year 2001 [represents] the most recent board structures that were not influenced by
[anticipation] of new listing rules.”
A firm is placed in a treatment group for not meeting the terms of the new listing rule on board
independence in year 2001; otherwise to a control group. The percent of independent directors on a board
determines board independence. As noted by Bradley and Chen (2009) “RiskMetrics’ independence
standard is higher than [that of] NYSE and NASDAQ:”
“First, NYSE and Nasdaq define former employees as independent if three years has
passed since their employment in the firm ended, while RiskMetrics considers all former
employees non-independent. Second, the NYSE and Nasdaq definition allows for the
existence of “insignificant” business relations between independent directors and the firm,

Journal of Finance and Accountancy
Board independence corporate cash, page 5
while RiskMetrics considers any director with a business relation as non-independent.
Hence, what is considered by NYSE and Nasdaq to be an independent director may be
considered as linked (gray)director according to the RiskMetrics definition.” (Guo and
Masulis, 2012)
Following Chhaochharia and Grinstein (2009), nonindependent directors are reclassified as
independent directors if they were former employees of a firm and at least three years have passed since
the termination of their employment. However, nonindependendent directors cannot be reclassified as
independent directors if their business transactions are insignificant since the size of the business
transactions are not observed. Thus, the adjusted standard is still higher than that of NYSE and NASDAQ.
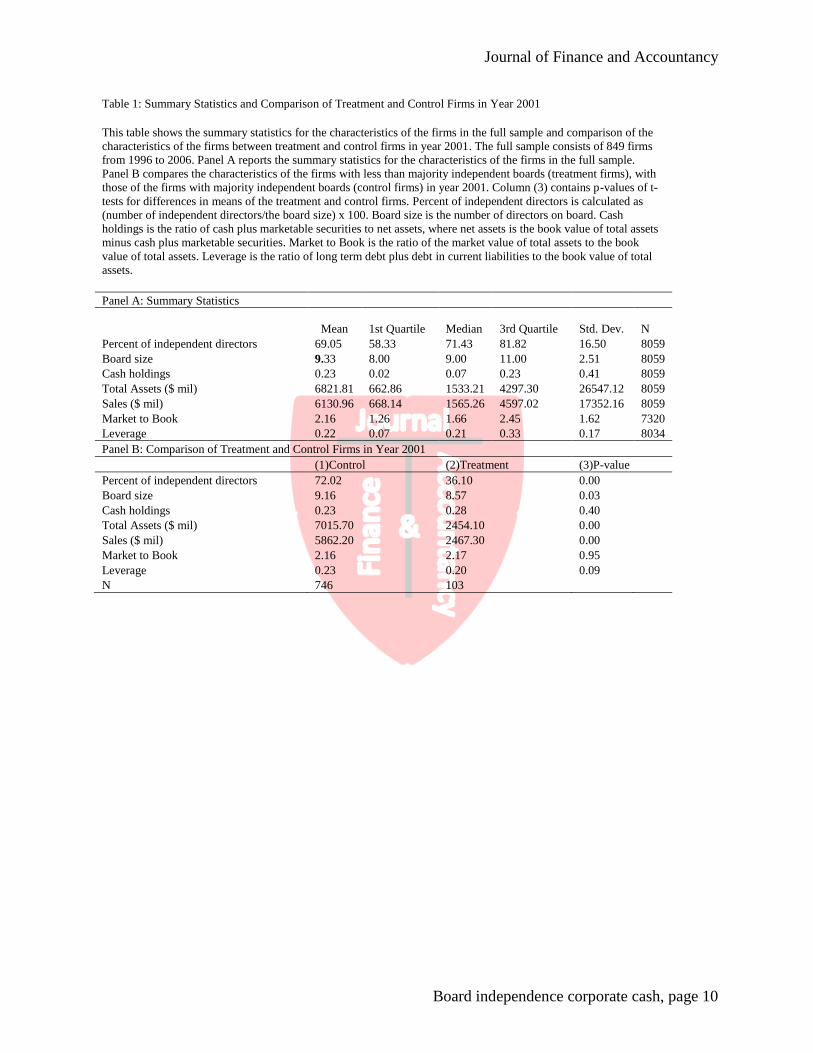
Panel A in Table 1(appendix) reports the summary statistics for the characteristics of the firms in
the full sample. The mean and median value of percent of independent directors is 69.05% and 71.43%
respectively, well over the majority requirement. Panel B of Table 2 (Appendix) compares the
characteristics of the firms with a minority percentage of independent boards (treatment firms), with those
of the firms with majority independent boards (control firms) in year 2001. The researchers also report p-
values of t-tests for differences in means of the treatment and control firms. The mean value of percent of
independent directors for treatment firms is 36.10%, while the mean value of percent of independent
directors for control firms is 72.02%. The difference is highly significant at 1% level. The treatment firms
on average have smaller boards, smaller total assets, smaller sales and lower leverage than control firms.
However, p-values show that treatment firms are not significantly different from control firms in terms of
cash holdings and market to book ratio.
RESULTS
Board Independence and Cash Holdings
To examine the effect of board independence on a firm’s cash holding, the research uses the
following difference-in-difference (DID) specification:
Cash Holdingsit = 1
× Dummy(perind < 0.5 ′01)i × Post_SOX
+[2
× 𝐷𝑢𝑚𝑚𝑦(𝑖𝑛𝑑𝑎𝑢𝑑𝑖𝑡 = 0 ′01)𝑖 × 𝑃𝑜𝑠𝑡_𝑆𝑂𝑋
+3
× 𝐷𝑢𝑚𝑚𝑦(𝑖𝑛𝑑𝑐𝑜𝑚𝑝𝑒𝑛𝑠𝑎𝑡𝑖𝑜𝑛 = 0 ′01)𝑖 × 𝑃𝑜𝑠𝑡_𝑆𝑂𝑋
+4
× 𝐷𝑢𝑚𝑚𝑦(𝑖𝑛𝑑𝑛𝑜𝑚𝑖𝑛𝑎𝑡𝑖𝑜𝑛 = 0 ′01)𝑖 × 𝑃𝑜𝑠𝑡_𝑆𝑂𝑋]
+5
𝑋𝑖𝑡 + 𝑖𝑡 (1)
In the above specification, 𝐶𝑎𝑠ℎ 𝐻𝑜𝑙𝑑𝑖𝑛𝑔𝑠𝑖𝑡 is firm i’s cash holdings at year t. 1 is the change in
the cash holdings of the firms which had a majority of nonindependent directors on the board at 2001 in
the post-SOX period compared to the cash holdings of the firms that had a majority of independent
directors on the board at 2001. 1 is the primary coefficient of interest. 𝐷𝑢𝑚𝑚𝑦(𝑝𝑒𝑟𝑖𝑛𝑑 < 0.5 ′01)𝑖 is a
dummy variable that equals to one if the firm did had a majority of nonindependent directors on the board
in 2001, and zero otherwise. 𝑃𝑜𝑠𝑡 − 𝑆𝑂𝑋 is a dummy that equals to one if year t is 2003 or thereafter,
and zero otherwise. As in Liu and Mauer (2011), also included is the interaction terms listed in the
brackets to account for the effects of committee independence on cash holdings. 2(3,4) represent the
change in the cash holdings of the firms whose audit (compensation, nomination) committees were not
fully independent at 2001 in the post-SOX period compared to the cash holdings of the firms who had
fully independent audit (compensation, nomination) committee. Dummy(ind_audit=0 ’01)i (Dummy(ind_
compensation=0 ’01)i, Dummy(ind_nomination =0 ’01)i) is a dummy variable that equals to one if the
firm did not have a fully independent audit (compensation, nomination) committee on the board in 2001,
and zero otherwise.

Journal of Finance and Accountancy
Board independence corporate cash, page 6
The control variables in the cash holdings regressions are motivated by the variables used in Liu
and Mauer (2011). The control variables are as follows: log firm size is measured by natural logarithm of
the book value of net assets measured in 2006 dollars; market-to-book asset ratio is computed as the ratio
of the book value of net assets minus the book value of equity plus the market value of equity to the book
value of net assets; cash flow/net assets is calculated as the ratio of earnings after interest, dividends and
taxes but before depreciation to the book value of net assets; NWC/assets is the ratio of net working
capital to the book value of net assets; capex/net assets is the ratio of capital expenditures to the book
value of net assets; leverage is computed as the sum of long-term debt and debt in current liabilities
divided by the book value of net assets; industry sigma is measured by the mean of the standard
deviations of cash flow/net assets over 10 years for firms in the same industry, where industries are
defined by two-digit SIC codes; dividend dummy is an indicator variable that equals to one in years in
which a firm pays a common dividend and zero otherwise; R&D/sale is the ratio of research and
development expenditure to sales. If research and development expenditure is missing, the ratio is set
equal to zero; acquisition activity is measured by the ratio of expenditures on acquisitions to the book
value of net assets; related debt dummy is an indicator variable that equals one if S&P credit rating is
between "C" and "AAA" and zero otherwise. All continuous variables are winsorized at the 1st and 99th
percentiles to mitigate the effect of outliers. Following Chhaochharia and Grinstein (2009), each control
variable interacts with two dummy variables for whether the observation belongs to pre-SOX (at or before
2002) period or post-SOX (2003 or thereafter) period to explain any potential change in cash holdings for
all firms as a consequence of the corporate scandals. The estimation includes firm fixed effects, year fixed
effects and industry fixed effects. In all the regressions, standard errors are adjusted for heteroscedasticity.
Table 2 reports the results of DID regressions of cash holdings on increases in board
independence after the SOX. The coefficient on interaction term on Dummy(pct_ind<0.5 '01) is
significantly positive in column 1, implying that firms which didn’t have a majority of independent
directors on the board in the pre-SOX period increased their cash holdings in the post-SOX period relative
to firms which had a majority of independent directors on the board in the pre-SOX period. The result is
consistent with hypothesis 1. In Model 2 of Table 2, added are the three additional interaction terms on
committee independence as in equation (1). The interaction term on audit committee is significantly
positive. The result also shows that the nominating committee is not significantly associated with cash
holdings. Interestingly, the coefficient on the interaction term on compensation committee is significantly
negative. However, this is consistent with Guthrie, Sokolowsky, and Wan (2012). They document that the
compensation committee independence requirement increases CEO total pay.
Board Independence and Cash Holdings Conditional Upon Financial Constraints
This paper also examines how the effect of board independence on corporate cash holdings
depends on financial constraints. Firms that are more financially constrained have less cash to waste.
Thus these firms are less likely to waste their cash and the effect of board independence on corporate cash
holdings will be smaller than for firms that are less financially constrained. Following the literature (see
e.g. Harford, Kecskés, and S. Mansi (2012)), the research uses four proxies for financial constraints: the
total payout ratio, total assets, bond rating status, and commercial paper rating status. Firms are classified
as constrained if their total payout ratio is zero; if the firm does not have a bond rating but reports long-
term debt; if the firm has no commercial paper rating but reports short-term debt; or if the firm’s total
assets are below the sample median; otherwise firms are classified as unconstrained. To examine whether
financial constraints influence the effect of board independence on corporate cash holdings,
Dummy(pct_ind<0.5 '01) and Post-SOX interact with proxy variables for financial constraints. Negative
coefficients on these triple interaction variables would indicate that the positive effect of board
independence on corporate cash holdings is less positive for financially constrained firms than for firms
that are not financially constrained.
Table 3 (Appendix) reports the results of DID regressions of cash holdings which interacts
Dummy(pct_ind<0.5 '01) and Post-SOX with a dummy variable for whether the firm has zero total
Journal of Finance and Accountancy
Board independence corporate cash, page 7
payouts in Model 1, a dummy variable for firms that do not have a bond rating but report long-term debt
in Model 2, a dummy variable for firms that have no commercial paper rating but report short-term debt
in Model 3, and a dummy variable for firms whose total assets are below the sample median in Model 4.
The primary interest variable is the triple interaction variables. The coefficient on these triple interaction
variables in Model 2 and 3 are significantly negative. This implies that the effect of board independence
on corporate cash holdings is less positive for financially constrained firms than for financially
unconstrained firms. This result is consistent with hypothesis 2.
Board Independence and External Monitoring
Independent boards are internal means to control agency problems. There could be also external
pressure to reduce the agency problems from institutional investors or from the market for corporate
control. Specifically, Harford, Mansi, and Maxwell (2008) show that anti-takeover provisions are
negatively related to corporate cash holdings and institutional ownership is positively related to corporate
cash holdings. To the extent that such external monitoring substitutes for monitoring needs by
independent directors, the board independence should not have an effect on the corporate cash holdings in
firms that have external monitoring in place.
Similar to Kim and Purnanandam (2006), three proxies for external pressure/monitoring and
analyze are used: shareholdings by institutional block-holders; shareholdings by public pension funds;
anti-takeover index of Gompers, Ishii and Metrick (2003). two dummy variables are created for external
monitoring. Low Monitoring equals one for firms that fall in the bottom quartile of respective monitoring
dimension, and zero otherwise. High monitoring equals one for firms that fall in the top quartile of
respective monitoring dimension, and zero otherwise. To analyze how external monitoring influences the
effect of board independence on corporate cash holdings, the research interacts Dummy(pct_ind<0.5 '01)
and Post-SOX with proxy variables for external monitoring.
Table 4 reports the results of DID regressions of cash holdings which interacts
Dummy(pct_ind<0.5 '01) and Post-SOX with proxy variables for external monitoring. The research uses
shareholdings by institutional block-holders as the proxy for external monitoring in Model 1,
shareholdings by public pension funds as the proxy for external monitoring in Model 2, and anti-takeover
index of Gompers, Ishii and Metrick (2003) as the proxy for external monitoring in Model 3. The results
provide evidence that board independence does not have explanatory power for firms that are subject to
high degree of external monitoring in all Models. The research finds a positively significant relationship
between board independence and corporate cash holdings only in firms that belong to the bottom quartile
of respective monitoring dimension. The results imply that the existence of high degree of external
monitoring reduces the importance of board independence for corporate cash holdings decision. In fact,
board independence and external monitoring seem to act as substitutes to each other.
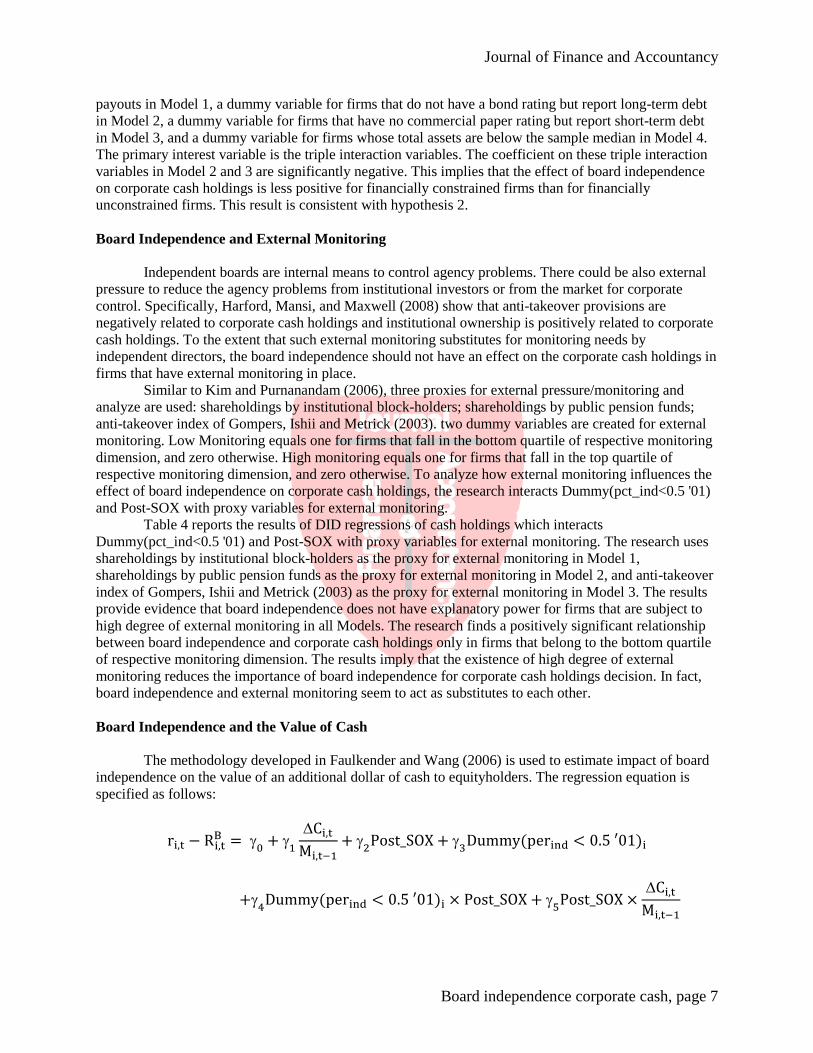
Board Independence and the Value of Cash
The methodology developed in Faulkender and Wang (2006) is used to estimate impact of board
independence on the value of an additional dollar of cash to equityholders. The regression equation is
specified as follows:
ri,t − Ri,tB =
0+
1
Ci,t
Mi,t−1+
2Post_SOX +
3Dummy(perind < 0.5 ′01)i
+4
Dummy(perind < 0.5 ′01)i × Post_SOX + 5
Post_SOX ×Ci,t
Mi,t−1

Journal of Finance and Accountancy
Board independence corporate cash, page 8
+6
Dummy(perind < 0.5 ′01)i × Post_SOX ×Ci,t
Mi,t−1+
7
Ei,t
Mi,t−1
+8
NAi,t
Mi,t−1+
9
RDi,t
Mi,t−1+
10
Ii,t
Mi,t−1+
11
Di,t
Mi,t−1+
12
Ci,t
Mi,t−1+
13Li,t
+14
NFi,t
Mi,t−1+
15
Ci,t
Mi,t−1×
Ci,t
Mi,t−1+
16Li,t
Ci,t
Mi,t−1+ i,t
(2)
where ∆Xit indicates a change in variable X for firm i over year t-1 to year t. To avoid having the largest
firms dominate the results, the 1-year lagged market value of equity (𝑀𝑖,𝑡−1) is used as the scaling
variable. The independent variable include: cash and marketable securities (Ci,t), earnings before
extraordinary items (Ei,t), net assets (NAi,t), research and development expense (RDi,t), interest expense
(Ii,t), common dividends (Di,t), long-term debt plus in current liabilities divided by the market value of
equity at time t-1 (Li,t), and net financing (NFi,t). The dependent variable is the excess stock return, the
difference between firm i’s stock return during fiscal year t (ri,t) and the stock i's benchmark return at year
t (𝑅𝑖,𝑡𝐵 ). The research calculates the benchmark return by annualizing the monthly returns from the Fama
and French (1993) 25 size and book-to-market portfolio the firm belongs to each month. The regression is
run as OLS with robust standard errors. 6 is the primary coefficient of interest. 6 measures the change in
the value of an additional dollar of cash for firms that did not have a majority of independent directors on
the board at 2001 in the post-SOX period compared to the value of an additional dollar of cash for firms
that had a majority of independent directors on the board at 2001 in the post-SOX period.
Table 5 reports the result of DID regression of the value of additional dollar of cash on board
independence. The triple interaction variable is of primary interest. The coefficient on this triple
interaction is significantly positive. This result suggests that the value of additional dollar of cash
increased in the post-SOX period in firms which didn’t have a majority of independent directors on the
board in the pre-SOX period relative to the value of additional dollar of cash in firms which had a
majority of independent directors on the board in the pre-SOX period. The findings support hypothesis 4.
CONCLUSIONS
This paper investigates how board independence affects corporate cash holding practices and
value of cash to shareholders using the SOX as a natural experiment. Empirical studies of corporate
governance are known to suffer from pervasive endogeneity problems since unobservable factors, which
are not controlled for in regressions, may cause spurious correlation between corporate governance
variables and corporate cash holding practices (Gompers, Ishii and Metrick, 2003). Taking advantage of
the SOX, provides for endogeneity-free evidence that improved board monitoring leads to increased cash
holdings and higher value of cash to shareholders. Further, the effect of board independence on cash
holdings is smaller in the firms which were financially constrained and firms which were subject to high
degree of external monitoring.

Journal of Finance and Accountancy
Board independence corporate cash, page 9
REFERENCES
Barber, W., and Liang, L. (2008). Associations between internal and external corporate governance
characteristics and the consequences of regulating governance practices. Available at SSRN:
http://ssrn.com/abstract=1146922 or http://dx.doi.org/10.2139/ssrn.1146922
Chhaochharia, V., and Grinstein, Y. (2009). CEO compensation and board structure. Journal of Finance
64, 231-261.
Denis, D. J., and Sibilkov, V. (2010). Financial constraints, investment, and the value of cash holdings,
Review of Financial Studies 23, 247–269
Dittmar, A, and Mahrt-Smith, J. (2007). Corporate governance and the value of cash holdings, Journal of
Financial Economics 83, 599-634.
Fama, E., and French, K. (1993). Common risk factors in the returns on stocks and bonds, Journal of
Financial Economics 33, 3-56.
Faulkender, M., and Wang, R. (2006). Corporate financial policy and the value of cash, Journal of
Finance 61, 1957-1990.
Gompers, P., Ishii, J., & Metrick, A. (2003). Corporate governance and equity prices, Quarterly Journal
of Economics 118, 107-155.
Guo, L., and Masulis, R. (2012). Board structure and monitoring: New evidence from CEO turnover,
Available at SSRN: http://ssrn.com/abstract=2021468 or http://dx.doi.org/10.2139/ssrn.2021468
Guthrie, K., J. Sokolowsky, J., & Wan, K. (2012) CEO Compensation and Board Structure Revisited,
Journal of Finance 67, 1149-1168.
Harford, J., Kecskés,, A. & Mansi, S. (2012). Investor horizons and corporate cash holdings, Available at
SSRN: http://ssrn.com/abstract=2000226 or http://dx.doi.org/10.2139/ssrn.2000226
Harford, J., Mansi, S. & Maxwell, W. (2008). Corporate governance and firm cash holdings in the US,
Journal of Financial Economics 87, 535-555.
Jensen, M., (1986). Agency costs of free cash flow, corporate finance and takeovers, American Economic
Review 76, 323-329.
Jensen, M., and Meckling, W. (1976). Theory of the firm: Managerial behavior, agency costs and
capital structure, Journal of Financial Economics 3, 305-360.
John, K., and Knyazeva, A. (2006). Payout policy, agency conflicts and corporate governance, Available
at SSRN: http://ssrn.com/abstract=841064 or http://dx.doi.org/10.2139/ssrn.841064.
Kalcheva. I., and Lins, K. V. (2007). International Evidence on Cash Holdings and Expected Managerial
Agency Problems, The Review of Financial Studies, 20, 1087-1112.
Kim, E., and Purnanandam, A. (2006). Why do investors react negatively to seasoned equity offerings?,
Ross School of Business Working Paper. Retrieved from
http://deepblue.lib.umich.edu/handle/2027.42/48733
Liu, Y., and Mauer, D. (2011). Corporate cash holdings and CEO compensation incentives, Journal of
Financial Economics 102, 183- 198.
Modigliani, F., and Miller, M. (1958). The Cost of Capital, Corporation Finance, and the Theory of
Investment, American Economic Review VO1.XLVIII, No.3, 261-97.
Opler, T., Pinkowitz,L., Stulz, R., & Williamson, R. (1999). The determinants and implications of cash
holdings, Journal of Financial Economics 52, 3-46.
Pinkowitz, L., Stulz, R., & Williamson, R. (2006). Does the contribution of corporate cash holdings and
dividends to firm value depend on governance? A cross-country analysis, Journal of Finance 61,
2725-2751.
Stultz, R., (1990). Managerial discretion and optimal financing policies, Journal of Financial
Economics 26, 3-27.
Journal of Finance and Accountancy
Board independence corporate cash, page 10
Table 1: Summary Statistics and Comparison of Treatment and Control Firms in Year 2001
This table shows the summary statistics for the characteristics of the firms in the full sample and comparison of the
characteristics of the firms between treatment and control firms in year 2001. The full sample consists of 849 firms
from 1996 to 2006. Panel A reports the summary statistics for the characteristics of the firms in the full sample.
Panel B compares the characteristics of the firms with less than majority independent boards (treatment firms), with
those of the firms with majority independent boards (control firms) in year 2001. Column (3) contains p-values of t-
tests for differences in means of the treatment and control firms. Percent of independent directors is calculated as
(number of independent directors/the board size) x 100. Board size is the number of directors on board. Cash
holdings is the ratio of cash plus marketable securities to net assets, where net assets is the book value of total assets
minus cash plus marketable securities. Market to Book is the ratio of the market value of total assets to the book
value of total assets. Leverage is the ratio of long term debt plus debt in current liabilities to the book value of total
assets.
Panel A: Summary Statistics
Mean 1st Quartile Median 3rd Quartile Std. Dev. N
Percent of independent directors 69.05 58.33 71.43 81.82 16.50 8059
Board size 9.33 8.00 9.00 11.00 2.51 8059
Cash holdings 0.23 0.02 0.07 0.23 0.41 8059
Total Assets ($ mil) 6821.81 662.86 1533.21 4297.30 26547.12 8059
Sales ($ mil) 6130.96 668.14 1565.26 4597.02 17352.16 8059
Market to Book 2.16 1.26 1.66 2.45 1.62 7320
Leverage 0.22 0.07 0.21 0.33 0.17 8034
Panel B: Comparison of Treatment and Control Firms in Year 2001
(1)Control (2)Treatment (3)P-value
Percent of independent directors 72.02 36.10 0.00
Board size 9.16 8.57 0.03
Cash holdings 0.23 0.28 0.40
Total Assets ($ mil) 7015.70 2454.10 0.00
Sales ($ mil) 5862.20 2467.30 0.00
Market to Book 2.16 2.17 0.95
Leverage 0.23 0.20 0.09
N 746 103

Journal of Finance and Accountancy
Board independence corporate cash, page 11
Table 2: Board Independence and Cash Holdings
This table shows the results of regressions of cash holdings on board independence. The sample includes all the firm
years from 1996 to 2006 in the full sample. The dependent variable is the ratio of cash plus marketable securities to net
assets, where net assets is the book value of total assets minus cash plus marketable securities.
Dummy(pct_ind<0.5 ’01) is a dummy variable that equals to one if the firm did not have a majority of independent
directors on the board in 2001, and zero otherwise. Dummy(ind_audit=0 ’01)(Dummy(ind_compendation=0 ’01),
Dummy (ind_nomination=0 ’01)) is a dummy variable that equals to one if the firm did not have a fully independent
audit(compensation, nomination) committee on the board in 2001, and zero otherwise. Other variables are defined in
the Appendix. ***, **, and * indicate statistical significance at the 1%, 5%, and 10% levels, respectively. T-statistics
are in parentheses below parameter estimates. The t-statistics are adjusted for heteroscedasticity.
Dependent Variable: Cash Holdings (1) (2)
Dummy(pct_ind<0.5 '01) * Post-SOX
0.050***
0.048***
(3.82)
(3.59)
Dummy(ind_audit=0 '01) * Post-SOX
0.023**
(2.37)
Dummy(ind_compensation=0 '01) * Post-SOX
-0.020*
(-1.91)
Dummy(ind_nominating=0 '01) * Post-SOX
-0.008
(-1.00)
Log firm size * Pre-SOX
-0.221***
-0.221***
(-16.99)
(-16.96)
Log firm size * Post-SOX
-0.209***
-0.209***
(-16.36)
(-16.4)
Market to book * Pre-SOX
0.030***
0.030***
(7.12)
(7.14)
Market to book * Post-SOX
0.056***
0.055***
(9.12)
(9.09)
Cash flow /net assets * Pre-SOX
0.172
0.171
(1.52)
(1.51)
Cash flow/net assets * Post-SOX
0.352***
0.355***
(3.1)
(3.13)
NWC/net assets * Pre-SOX
-0.537***
-0.537***
(-8.56)
(-8.56)
NWC/net assets * Post-SOX
-0.500***
-0.502***
(-7.06)
(-7.08)
Capex/net assets * Pre-SOX
-0.185*
-0.186*
(-1.70)
(-1.71)
Capex/net assets * Post-SOX
-0.050
-0.051
(-0.37)
(-0.37)
Leverage * Pre-SOX
0.311***
0.310***
(6.71)
(6.70)

Journal of Finance and Accountancy
Board independence corporate cash, page 12
Leverage * Post-SOX
0.234***
0.234***
(4.50)
(4.48)
Industry sigma * Pre-SOX
0.004
0.004
(1.38)
(1.35)
Industry sigma * Post-SOX
0.001
0.001
(0.69)
(0.60)
Dividend dummy * Pre-SOX
0.052***
0.052***
(5.19)
(5.18)
Dividend dummy * Post-SOX
0.033***
0.033***
(3.08)
(3.08)
R&D/sales * Pre-SOX
0.489***
0.491***
(2.70)
(2.71)
R&D/sales * Post-SOX
0.202
0.214
(1.09)
(1.15)
Acquisition activity * Pre-SOX
-0.156***
-0.158***
(-3.19)
(-3.23)
Acquisition activity * Post-SOX
-0.271***
-0.274***
(-3.45)
(-3.48)
Rated debt dummy * Pre-SOX
0.015
0.016
(1.04)
(1.09)
Rated debt dummy * Post-SOX
0.030*
0.031*
(1.86)
(1.94)
Industry fixed effects
Yes
Yes
Year fixed effects
Yes
Yes
Firm fixed effects
Yes
Yes
Observations
6715
6712
Adjusted R2 0.86 0.86

Journal of Finance and Accountancy
Board independence corporate cash, page 13
Table 3: Board Independence and Cash Holdings Conditional Upon Financial Constraints
This table shows the results of regressions of cash holdings on board independence conditional upon financial constraints.
The sample includes all the firm years from 1996 to 2006 in the full sample. The dependent variable is the ratio of cash plus
marketable securities to net assets, where net assets is the book value of total assets minus cash plus marketable securities.
Dummy(pct_ind<0.5 ’01) is a dummy variable that equals to one if the firm did not have a majority of independent directors
on the board in 2001, and zero otherwise. Proxies for financial constraints used are the zero total payout dummy variable (a
dummy variable equals to one if the firm’s total payout ratio is zero, and zero otherwise), the no bond rating dummy variable
(a dummy variable equals to one if the firm does not have a bond rating but reports long-term debt, and zero otherwise), the
no commercial paper rating dummy variable (a dummy variable equals to one if the firm has no commercial paper rating but
reports short-term debt, and zero otherwise), and the total assets below the sample median (a dummy variable equals to one
if the firm’s total assets are below the sample median, and zero otherwise). Other variables are defined in the Appendix. ***,
**, and * indicate statistical significance at the 1%, 5%, and 10% levels, respectively. T-statistics are in parentheses below
parameter estimates. The t-statistics are adjusted for heteroscedasticity.
(1) (2) (3) (4)
Dependent Variable: Constrained Constrained Constrained Constrained
Cash Holdings if zero total payouts if no bond rating if no cp rating if small
Financially constrained dummy 0.005 -0.088*** -0.037*** -0.086***
(0.43) (-4.24) (-3.90) (-7.70)
Dummy(pct_ind<0.5 '01) * Post-SOX 0.041*** 0.069*** -0.086*** 0.052***
(3.42) (4.32) (4.80) (2.87)
Financially constrained dummy* 0.043 -0.061*** -0.058*** -0.007
Dummy(pct_ind<0.5 '01) * Post-SOX (1.26) (-2.61) (-2.65) (-0.27)
Log firm size * Pre-SOX -0.220*** -0.217*** -0.219*** -0.242***
(-17.00) (-16.89) (-16.87) (-17.82)
Log firm size * Post-SOX -0.209*** -0.204*** -0.208*** -0.231***
(-16.41) (-16.11) (-16.27) (-17.11)
Market to book * Pre-SOX 0.030*** 0.029*** 0.030*** 0.029***
(7.07) (7.02) (7.11) (7.06)
Market to book * Post-SOX 0.056*** 0.056*** 0.055*** 0.055***
(9.09) (9.11) (9.06) (9.05)
Cash flow /net assets * Pre-SOX 0.171 0.187* 0.178 0.164
(1.51) (1.67) (1.58) (1.46)
Cash flow/net assets * Post-SOX 0.358*** 0.343*** 0.348*** 0.328***
(3.17) (3.03) (3.08) (2.91)
NWC/net assets * Pre-SOX -0.536*** -0.527*** -0.542*** -0.516***
(-8.55) (-8.41) (-8.67) (-8.45)
NWC/net assets * Post-SOX -0.502*** -0.485*** -0.517*** -0.486***
(-7.08) (-6.78) (-7.31) (-7.02)
Capex/net assets * Pre-SOX -0.186* -0.186* -0.190* -0.178*
(-1.70) (-1.71) (-1.74) (-1.65)
Capex/net assets * Post-SOX -0.051 -0.052 -0.070 -0.042
(-0.38) (-0.39) (-0.52) (-0.31)

Journal of Finance and Accountancy
Board independence corporate cash, page 14
Leverage * Pre-SOX 0.311*** 0.352*** 0.319*** 0.311***
(6.72) (7.54) (6.9) (6.75)
Leverage * Post-SOX 0.234*** 0.285*** 0.247*** 0.231***
(4.47) (5.46) (4.75) (4.45)
Industry sigma * Pre-SOX 0.004 0.004 0.004 0.004
(1.41) (1.35) (1.37) (1.12)
Industry sigma * Post-SOX 0.001 0.001 0.001 0.001
(0.69) (0.57) (0.78) (0.75)
Dividend dummy * Pre-SOX 0.054*** 0.052*** 0.052*** 0.053***
(4.79) (5.17) (5.16) (5.31)
Dividend dummy * Post-SOX 0.038*** 0.032*** 0.030*** 0.033***
(3.19) (3.04) (2.84) (3.12)
R&D/sales * Pre-SOX 0.486*** 0.514*** 0.500*** 0.484***
(2.68) (2.85) (2.75) (2.68)
R&D/sales * Post-SOX 0.199 0.196 0.187 0.194
(1.07) (1.06) (1.01) (1.05)
Acquisition activity * Pre-SOX -0.156*** -0.156*** -0.159*** -0.149***
(-3.18) (-3.24) (-3.25) (-3.08)
Acquisition activity * Post-SOX -0.272*** -0.264*** -0.265*** -0.264***
(-3.46) (-3.38) (-3.38) (-3.40)
Rated debt dummy * Pre-SOX 0.015 -0.066*** 0.014 0.006
(1.03) (-2.74) (0.98) (0.44)
Rated debt dummy * Post-SOX 0.030* -0.056** 0.031** 0.024
(1.85) (-2.29) (1.96) (1.51)
Industry fixed effects Yes Yes Yes Yes
Year fixed effects Yes Yes Yes Yes
Firm fixed effects Yes Yes Yes Yes
Observations 6715 6715 6715 6715
Adjusted R2 0.86 0.86 0.86 0.86

Journal of Finance and Accountancy
Board independence corporate cash, page 15
Table 4: Board Independence and External Monitoring
This table shows the regression results analyzing the interaction effect of external monitoring and board independence
on cash holdings. The sample includes all the firm years from 1996 to 2006 in the full sample. The dependent variable
is the ratio of cash plus marketable securities to net assets, where net assets is the book value of total assets minus cash
plus marketable securities. Dummy(pct_ind<0.5 ’01) is a dummy variable that equals to one if the firm did not have a
majority of independent directors on the board in 2001, and zero otherwise. Column (1) uses shareholdings by
institutional block-holders (defined as institutional shareholders with more than 5% holdings) and column (2) uses
shareholdings by public pension funds as proxies for external monitoring/pressure. Column (3), uses GIM-Index as the
proxy for external monitoring/pressure. Low monitoring is a dummy variable that equals one for firms that fall in the
bottom quartile of respective monitoring dimension and high monitoring is a dummy variable that equals one for firms
that fall in the top quartile of respective monitoring dimension. Other variables are defined in the Appendix. ***, **,
and * indicate statistical significance at the 1%, 5%, and 10% levels, respectively. T-statistics are in parentheses below
parameter estimates. The t-statistics are adjusted for heteroscedasticity.
Dependent variable: (1) (2) (3)
Cash Holdings Block Holders Public Pension Funds GIM-Index
Low Monitoring* 0.051** 0.054** 0.104**
Dummy(pct_ind<0.5 '01) * Post-SOX 2.35 (2.44) (2.14)
High Monitoring* -0.025 0.015 -0.007
Dummy(pct_ind<0.5 '01) * Post-SOX (-0.68) (0.51) (0.31)
Log firm size * Pre-SOX -0.220*** -0.221*** -0.211***
(-16.78) (-16.86) (-15.77)
Log firm size * Post-SOX -0.209*** -0.209*** -0.203***
(-16.22) (-16.23) (-15.14)
Market to book * Pre-SOX 0.030*** 0.029*** 0.029***
(7.07) (7.06) (6.84)
Market to book * Post-SOX 0.056*** -0.056*** 0.054***
(9.12) (9.15) (8.20)
Cash flow /net assets * Pre-SOX 0.177 0.174 0.087
(1.56) (1.53) (0.76)
Cash flow/net assets * Post-SOX 0.346*** 0.342*** 0.292**
(3.05) (3.01) (2.39)
NWC/net assets * Pre-SOX -0.538*** -0.539*** -0.566***
(-8.56) (-8.57) (-8.67)
NWC/net assets * Post-SOX -0.501*** -0.495*** -0.528***
(-7.05) (-6.97) (-7.07)
Capex/net assets * Pre-SOX -0.191* -0.193* -0.141
(-1.75) (-1.77) (-1.26)
Capex/net assets * Post-SOX -0.045 -0.044 0.074
(-0.33) (-0.32) (0.52)
Leverage * Pre-SOX 0.311*** 0.312*** 0.271***

Journal of Finance and Accountancy
Board independence corporate cash, page 16
(6.68) (6.70) (5.72)
Leverage * Post-SOX 0.234*** 0.234*** 0.201***
(4.49) (4.51) (3.67)
Industry sigma * Pre-SOX 0.005 0.005 0.004
(1.51) (1.50) (1.42)
Industry sigma * Post-SOX 0.001 0.001 0.002
(0.61) (0.68) (1.15)
Dividend dummy * Pre-SOX 0.054*** 0.055*** 0.049***
(5.28) (5.40) (4.77)
Dividend dummy * Post-SOX 0.033*** 0.032*** 0.026**
(3.11) (3.02) (2.39)
R&D/sales * Pre-SOX 0.494*** 0.490*** 0.430**
(2.72) (2.70) (2.18)
R&D/sales * Post-SOX 0.197 0.197 0.206
(1.06) (1.06) (1.05)
Acquisition activity * Pre-SOX -0.157*** -0.158*** -0.157***
(-3.20) (-3.22) (-3.22)
Acquisition activity * Post-SOX -0.268*** -0.267*** -0.262***
(-3.41) (-3.39) (-3.14)
Rated debt dummy * Pre-SOX 0.014 0.014 0.011
(0.94) (0.95) (0.82)
Rated debt dummy * Post-SOX 0.027* 0.028* 0.029*
(1.70) (1.71) (1.74)
Industry fixed effects Yes Yes Yes
Year fixed effects Yes Yes Yes
Firm fixed effects Yes Yes Yes
Observations 6688 6688 6152
Adjusted R2 0.86 0.86 0.85

Journal of Finance and Accountancy
Board independence corporate cash, page 17
Table 5: Board Independence and the Value of Cash
This table shows the regression results for the value regression on board independence. The sample includes all the firm
years from 1996 to 2006 in the full sample. The dependent variable is the excess stock return during fiscal year t.
Dummy(pct_ind<0.5 ’01) is a dummy variable that equals to one if the firm did not have a majority of independent
directors on the board in 2001, and zero otherwise. Other variables are defined in the Appendix. All variables except
dummy variables are scaled by the lagged market value of equity. ∆X is notation for the one-year change. ***, **, and *
indicate statistical significance at the 1%, 5%, and 10% levels, respectively. T-statistics are in parentheses below
parameter estimates. The t-statistics are adjusted for heteroscedasticity.
Dependent variable: Excess stock return
Cash
5.028***
(2.89)
Post-SOX dummy
-0.052***
(-3.62)
Dummy(pct_ind<0.5 '01) * Post-SOX
0.004
(0.16)
Post-SOX * ∆Cash
-1.604
(-1.57)
Dummy(pct_ind<0.5 '01) * Post-SOX * ∆Cash
2.184*
(1.87)
arnings
1.566***
(5.97)
∆Net Assets
0.345***
(3.26)
∆R&D
-0.826
(-0.61)
∆Interest
-14.805***
(-5.35)
∆Dividend
0.623
(1.44)
Lagged Cash
0.507***
(4.06)
Leverage
0.106
(1.57)
New Financing
0.206
(0.48)
Lagged Cash * ∆Cash
-9.139***
(-3.01)
Leverage * ∆Cash
-2.634
(-0.80)
Observations
3979

Journal of Finance and Accountancy
Board independence corporate cash, page 18
Adjusted R2 0.18
Appendix: Definition of Variables
Variables Definition
Dependent variables
Cash holdings Ratio of cash plus marketable securities to net assets, where net
assets is the book value of total assets minus cash plus marketable
securities
CHE/(AT-CHE)
Excess stock return
𝑟𝑖𝑡 − 𝑅𝑖𝑡𝐵 , where rit is the stock return for firm i during fiscal year t
and 𝑅𝑖𝑡𝐵 is stock i's benchmark return at year t. One calculates the
benchmark return by annualizing the monthly returns from the
Fama and French 25 size and book-to-market portfolio the firm
belongs to each month.
Control variables
Dummy(pct_ind<0.5 '01) An indicator variable that equals to one if the firm did not have a
majority of independent directors on the board in 2001, and zero
otherwise
Dummy(ind_audit=0 '01) An indicator variable that equals to one if the firm did not have a
fully independent audit committee on the board in 2001, and zero
otherwise
Dummy(ind_compensation=0 '01) An indicator variable that equals to one if the firm did not have a
fully independent compensation committee on the board in 2001,
and zero otherwise
Dummy(ind_nomination=0 '01) An indicator variable that equals to one if the firm did not have a
fully independent nomination committee on the board in 2001, and
zero otherwise
Post-SOX An indicator variable that equals one if the observation is in the
period at or after 2003 and zero otherwise
Pre-SOX An indicator variable that equals one if the observation is in the
period before 2003 and zero otherwise
Log firm size Natural logarithm of the book value of net assets measured in 2006
dollars
ln(AT-CHE)
Market to book Ratio of the book value of net assets minus the book value of equity
plus the market value of equity to the book value of net assets
(AT-CHE-CEQ+CSHO*PRCC_F)/(AT-CHE)
Cash flow /net assets Ratio of earnings after interest, dividends and taxes but before
depreciation to the book value of net assets
(OIBDP-XINT-TXT-DVC)/(AT-CHE)

Journal of Finance and Accountancy
Board independence corporate cash, page 19
NWC/net assets Ratio of net working capital to the book value of net assets
(ACT-LCT-CHE)/(AT-CHE)
Capex/net assets Ratio of capital expenditures to the book value of net assets
CAPX/(AT-CHE)
Leverage Sum of long-term debt and debt in current liabilities divided by the
book value of net assets
(DLTT+DLC)/(AT-CHE)
Industry sigma Mean of the standard deviations of cash flow/net assets over 10
years for firms in the same industry, where industries are defined by
two-digit SIC codes
Dividend dummy An indicator variable that equals to one in years in which a firm
pays a common dividend (DVC) and zero otherwise
R&D/sales Ratio of research and development expenditure to sales. If research
and development expenditure is missing, the ratio is set equal to
zero.
XRD/SALE
Acquisition activity
Ratio of expenditures on acquisitions to the book value of net assets
AQC/(AT-CHE)
Rated debt dummy An indicator variable that equals one if S&P credit rating
(SPLTICRM) is between "C" and "AAA" and zero otherwise
Zero total payouts An indicator variable equals to one if the firm’s total payout ratio
(the ratio of dividends plus share repurchases to operating income)
is zero, and zero otherwise
Total payouts = (DVC+PRSTKC)/OIBDP
No bond rating An indicator variable that equals to one if the firm does not have a
bond rating (DLTT) but reports long-term debt (SPLTICRM), and
zero otherwise
No cp rating An indicator variable equals to one if the firm has no commercial
paper rating (DLC) but reports short-term debt (SPSTICRM), and
zero otherwise
Small An indicator variable equals to one if the firm’s total assets (AT)
are below the sample median, and zero otherwise
Block Holders Shareholdings by institutional block-holders (defined as
institutional shareholders with more than 5% holdings)
Public Pension Funds Shareholdings by public pension funds
GIM-Index The Gomper, Ishi and Metricks (2003) index. It is calculated by
counting the number of antitakeover provisions of the firm. It varies
from 0 to 24.
Cash Cash plus marketable securities
CHE

Journal of Finance and Accountancy
Board independence corporate cash, page 20
Dividend Common dividend
DVC
Net assets Book value of total assets minus cash plus marketable securities
AT-CHE
Interest XINT
Earnings Earnings before extraordinary items plus interest, deferred tax
credits, and investment tax credits
IB+XINT+TXDI+ITCI
New Financing Sales of common and preferred stock minus stock repurchase plus
issuance of long-term debt minus long-term debt reduction
SSTK-PRSTKC+DLTIS-DLTR
R&D Research and development expenditure. If research and
development expenditure is missing, it is set equal to zero.
XRD