bnp paribas · results 31.12.2006 disclaimer 2 disclaimer this presentation includes...
TRANSCRIPT

1
Results as at 31 December 2006BNP Paribas
15 February 2007

DisclaimerResults 31.12.2006 2
Disclaimer
This presentation includes forward-looking statements based on current beliefs and expectations about future events. Forward-looking statements include financial projections and estimates and their underlying assumptions, statements regarding plans, objectives and expectations with respect to future events, operations, products and services, and statements regarding future performance and synergies. Forward-looking statements are not guarantees of future performance and are subject to inherent risks, uncertainties and assumptions about BNP Paribas and its subsidiaries and investments, developments of BNP Paribas and its subsidiaries, banking industry trends, future capital expenditures and acquisitions, changes in economic conditions globally or in BNP Paribas’ principal local markets, the competitive market and regulatory factors. Those events are uncertain; their outcome may differ from current expectations which may in turn significantly affect expected results. Actual results may differ materially from those projected or implied in these forward-looking statements. Any forward-looking statement contained in this presentation speaks as of the date of this presentation: BNP Paribas undertakes no obligation to publicly revise or update any forward-looking statements in light of new information or future events.
The information contained in this presentation as it relates to parties other than BNP Paribas or derived from external sources has not been independently verified and no representation or warranty expressed or implied is made as to, and no reliance should be placed on the fairness, accuracy, completeness or correctness of, the information or opinions contained herein. None of BNP Paribas or its representatives shall have any liability whatsoever in negligence or otherwise for any loss however arising from any use of this presentation or its contents or otherwise arising in connection with this presentation or any other information or material discussed.

3
Group Results Core Businesses Results
Conclusion
Overview

BNP Paribas GroupResults 31.12.2006 4
BNP Paribas: 4Q06
Revenues €7.1bn +25.4%
Gross Operating Income €2.4bn +22.8%
Operating Income €2.1bn +27.5%
Net Income Groupe Share €1,719mn +28.8%
Continued powerful and profitable growth driveContinued powerful and profitable growth drive

BNP Paribas GroupResults 31.12.2006 5
BNP Paribas: 4Q06
Substantial organic growth: Revenue : +11.3% at constant scope and exchange ratesRevenues: +25.4% with the scope effect (primarily BNL)
Operating expenses & depreciation: +8.2% at constant scope and exchange rates+23.0%/4Q05, with the scope effect, excluding the impact of BNL’s restructuring costs (€141mn)
Very substantial growth in Gross Operating Income: +16.9% at constant scope and exchange rates
+30.0% with the scope effect, excluding the impact of BNL’s restructuring costs
Lower cost of risk despite a €114mn scope effect (including BNL €92mn)Operating income up 27%
* +23.0% excluding restructuring costs of BNL (€141 mn)
In millions of euros 4Q06 4Q06 / 4Q05 4Q06 / 4Q05
Revenues 7,052 +25.4% +11.3%Operating Ex penses and Dep. -4,654 +26.8% +8.2%
Gross Operating Income 2,398 +22.8% +16.9%Prov isions -282 -3.8% -40.9%
Operating Income 2,116 +27.5% +26.8%
Pre-Tax Income 2,315 +26.9%Net Income, Group Share 1,719 +28.8%
At constant scope and exchange rates
* *

BNP Paribas GroupResults 31.12.2006 6
BNP Paribas: 2006Substantial growth throughout the year
Revenues €27.9bn +27.9% +13.5%*
Operating expenses -€17.1bn +27.6% +11.1%*
Gross operating income €10.9bn +28.2% +17.2%*
Sharp rise in profitability Net income group share €7,308mn +24.9%
ROE after tax 21.2% +1 pt
Employee Profit-Sharing** +23.9%
Earnings per share 8.03 euros (+15.4%)Dividend per share 3.10*** euros (+19.2%)Earnings per share 8.03 euros (+15.4%)Dividend per share 3.10*** euros (+19.2%)
* At constant scope and exchange rates ** Group agreements applicable in France *** subject to shareholder approval

BNP Paribas GroupResults 31.12.2006 7
BNP Paribas: 2006
19.2 21.927.9
2004 2005 2006
Revenues
in €bnEU-IFRS
+27.9%+14.1%
13.5%
10.0%
2005/2004 2006/2005
Organic revenue growth
Accelerated growthAccelerated growth
Powerful organic growth drive
Powerful organic growth drive
Developing a second home market
Developing a second home market

BNP Paribas GroupResults 31.12.2006 8
BNP Paribas: Geographic Breakdown of Revenues
Revenues 4Q06
France
43%
Italy 15%
Asia, Pacific 3%Latin America 1%
Emerging Europe 3% Africa Middle East 3%
North America 14%
Further internationalisationFurther internationalisation
Other Europe
18%
Annual Revenues
2005 2006
55%
52%
48%
45%
€21.9bn
€27.9bn10%
FranceOutside France
57%

BNP Paribas GroupResults 31.12.2006 9
BNP ParibasMajor Growth Dynamic (1/2)
Revenues growth in all the business lines in 2006
FRB: good drive to win new customersIRFS: full effect of accelerated international growthAMS: major organic growthCIB: very strong growth compared to an already high 2005
BNL’s contribution : €2,294mn in revenues for nine months in 2006
Powerful growth enginesPowerful growth engines
7,859
6,422
4,3503,552
7,2965,9685,6715,438
in €mn
Revenues
FRB** IRFS AMS CIB
+4.3%* +22.3% +22.5% +22.4%20062005
*Excluding PEL/CEL effects; +7.3% including PEL/CEL effects**Including 100% of Private Banking in France
BNP Paribas GroupResults 31.12.2006 10
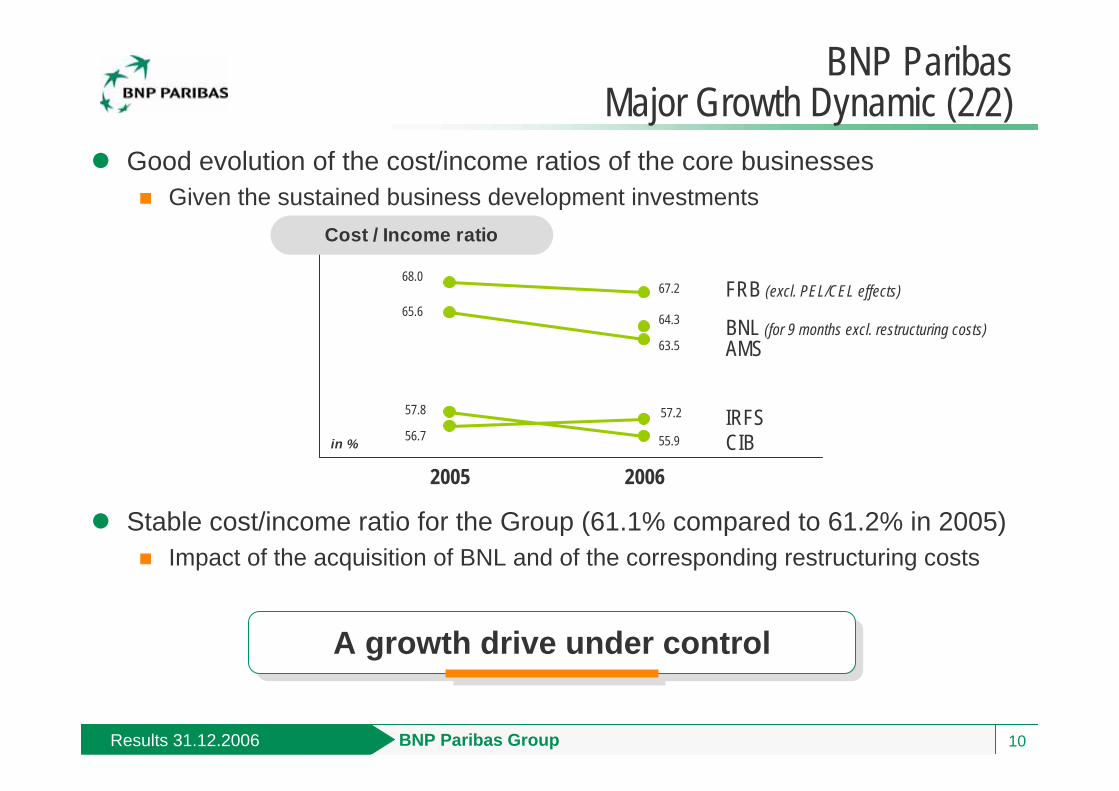
Good evolution of the cost/income ratios of the core businessesGiven the sustained business development investments
Stable cost/income ratio for the Group (61.1% compared to 61.2% in 2005)Impact of the acquisition of BNL and of the corresponding restructuring costs
BNP Paribas Major Growth Dynamic (2/2)
68.067.2
64.3
56.7
57.2
65.6
63.5
57.8
55.9
2005 2006in %
Cost / Income ratio
AMS
FRB (excl. PEL/CEL effects)
IRFS CIB
BNL (for 9 months excl. restructuring costs)
A growth drive under controlA growth drive under control

11
Results as at 31 December 2006 BNP Paribas
Core Businesses Results

French Retail BankingResults 31.12.2006 12
French Retail Banking: 4Q06
Including 100 % of French Retail Banking for revenues to pre-tax income line items
Net interest margin down due to the impact of the rise in regulated interest rates andthe flattening of the yield curve as a result of higher short-term rates
Negligible PEL/CEL effects in 4Q06 (see appendix p59)
Good fee performance related to the volume of businessFees on investment funds and transactions : +15.0% despite a high benchmark in 4Q05Other banking service fees: +2.6%/4Q05 in line with volume growth given moderate pricing
Operating expenses and depreciation: +0.2%/4Q05 (positive base effect) Cost of risk down again : 26 bp* in 4Q06 compared to 33 bp in 4Q05Pre-tax income: +8.0%/4Q05
In millions of euros 4Q06 4Q06 / 4Q05
Revenues 1,408 +1.6% Incl. Interest Margin 791 -2.1% Incl. Commissions 617 +6.7%Operating Ex penses and Dep. -972 +0.2%Gross Operating Income 436 +4.8%Prov isions -56 -17.6%Pre-Tax Income 381 +9.5%Income Attributable to AMS -28 +33.3%Pre-Tax Income of French Retail Bkg 353 +8.0%
* Cost of risk/Average risk weighted assets

French Retail BankingResults 31.12.2006 13
French Retail Banking: 2006
Including 100 % of French Retail Banking for revenues to cost/income line items and 2/3 of French Private Banking for pre-tax income to pre-tax ROE line items
Solid revenue growth despite an environment that has become less favourable: +4.3%/ 2005 excluding PEL/CEL effects
Slight rise in net interest revenues: +0.8% Fees +9.2%: sharp rise in business volumes (including fees from financial savings : +19.7% and fees from banking services: +3.7%)
Cost/income ratio excluding PEL/CEL effects: 67.2% compared to 68.0% in 2005Moderate growth in operating expenses and depreciation: +3.0%
Further improvement of ROE excluding PEL/CEL effects: 29% compared to 28% in 2005
Excl. PEL/CEL effects2006 2006/2005 2006 2006/2005
Revenues €5.9 bn + 7.3% +4.3%Operating Exp. and Dep -€3.8 bn + 3.0% +3.0%Gross Operating Income €2.0 bn +16.4% +7.0%Cost / Income 65.1% - 2.8 pts 67.2% -0.8 ptPre-Tax Income €1.8 bn +20.4% +9.2%Allocated Equity €5.5 bn + 7.3% +7.3%Pre-Tax ROE 32% + 3 pts 29% +1 pt
A confirmed underlying growth trendA confirmed underlying growth trend

French Retail BankingResults 31.12.2006 14
FRB: Individual CustomersMajor sales and marketing drive
Number of deposit and cheque accounts: +170,000Outstanding loans: +13.6%/4Q05, including mortgages: +14.8% and consumer loans: +6.5% Gross financial savings inflows: +35.9%/4Q05
Continued innovation strategyTERCEO: confirmed success of the card which allows split instalments Multiplacements Avenir: life insurance for children under the age of 18
Enhanced customer satisfaction thanks to the multi-channel banking tool
Sales and marketing drive based on winning, retaining and satisfying customers
Sales and marketing drive based on winning, retaining and satisfying customers
+170,000
+155
,000
+128
,000
+120
,100
+104
,000
+97,
000*
+72,
700
2000 2001 2002 2003 2004 2005 2006
Increase in the number of individual cheque and deposit accounts
* plus30,000 customers transferred from the Treasury network

French Retail BankingResults 31.12.2006 15
538
750
425
263
100
2002 2003 2004 2005 2006
Revenues from cross-selling between FRB and CIB (100 reference in 2002)
FRB: Corporate Customers
Sharp rise in value added businessCross-selling between FRB and CIB:+40%/2005 including Corporate Finance x 2.2 and Fixed Income +58%Up front fees for structured financing: +85%/2005
Investment: strong businessFees on mutual funds: +15%/2005
Outstanding loans: selective growthInvestment loans: +12.4%/2005Factoring: + 17.9%/2005
A value added development modelA value added development model

French Retail BankingResults 31.12.2006 16
FRB 2007: Priorities and Challenges
Grow revenues by 4% in 2007 (excl. PEL/CEL effects)Maintain a one point jaws effect between revenues and costs
Grow revenues by 4% in 2007 (excl. PEL/CEL effects)Maintain a one point jaws effect between revenues and costs
Continue deploying new branch programmeContinue product innovation (financial savings products, death and disability insurance, etc.)
Individual Customers Win new customers and
raise customer satisfaction
Individual Customers Win new customers and
raise customer satisfaction
Leverage on expertise and product innovation Develop service offering to Ultra High Networth customers
Private Banking Consolidate leading
market position in France
Private Banking Consolidate leading
market position in France
Be the main bank for growing businessesStep up cross-selling with all the business lines (Italian desks with BNL…)
Corporate Customers Capitalise on the success of the business centres
Corporate Customers Capitalise on the success of the business centres
Front offices: free up time for sales and marketingBack offices: continue streamlining and automating processes
Operational Efficiency Operational Efficiency

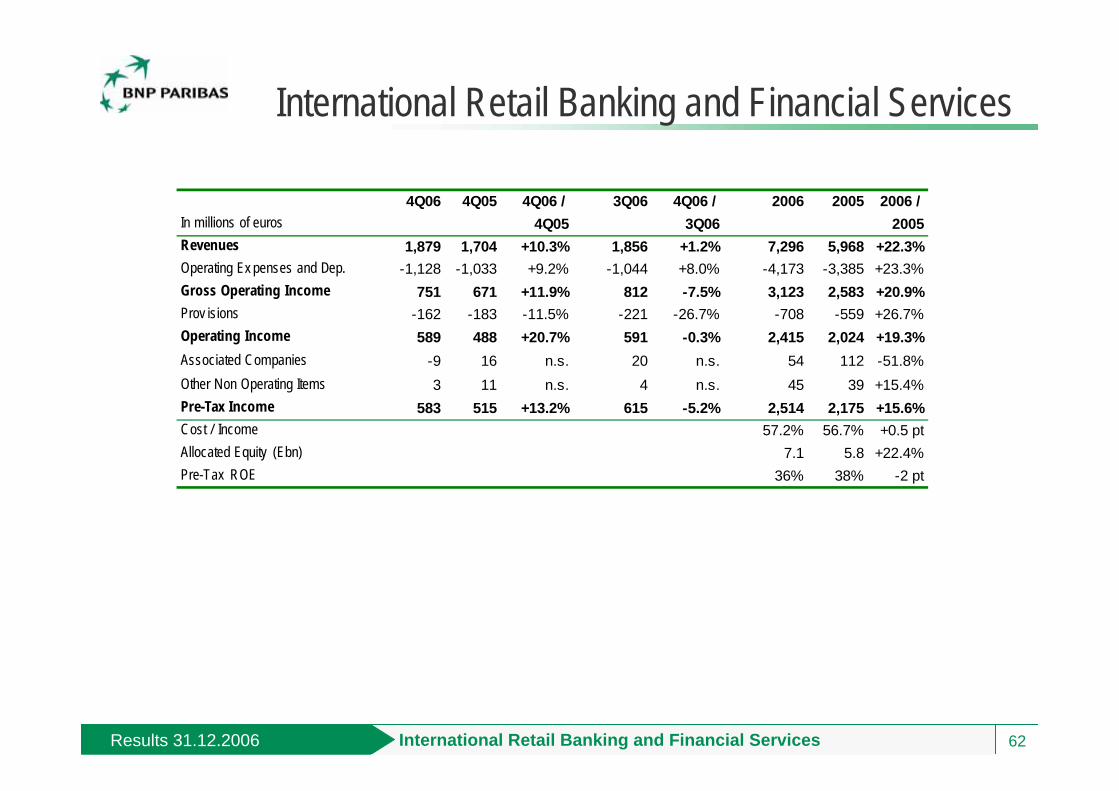
International Retail Banking and Financial Services Results 31.12.2006 17
International Retail Banking and Financial Services
Good quarterly (+13.2%) and annual (+15.6%) pre-tax income growth
Differentiated trends in each businessUnited StatesEmerging MarketsRetail Financial Services
2006 2006/2005 2006/2005*
Revenues €7.3bn + 22.3% + 6.1%Operating Exp. and Dep. - €4.2bn + 23.3% + 7.4%Pre-Tax Income €2.5bn +15.6% + 6.6%Cost / Income 57.2% + 0.5 pt + 0.7 ptAllocated Equity €7.1bn + 22.4%Pre-Tax ROE 36 % - 2 pts
2,175 2,514
7,296
5,968
2005 2006 2005 2006
Annual Revenues and Pre-Tax Income
in €mn
+22.3%+15.6%
* At constant scope and exchange rates
In millions of euros 4Q06 4Q06 / 4Q05
Revenues 1,879 +10.3%Operating Ex penses and Dep. -1,128 +9.2%Gross Operating Income 751 +11.9%Prov isions -162 -11.5%Operating Income 589 +20.7%Non Operating Items -6 n.s.Pre-Tax Income 583 +13.2%

International Retail Banking and Financial Services Results 31.12.2006 18
1,8772,191
891 1,030
2005 2006 2005 2006
Annual Revenues and Pre-Tax Income
in €mn
Revenues : +1.7%/4Q05 At constant scope and exchange rates: -1.3%/4Q05(integration of Commercial Federal on 01.12.05)Interest margin : 3.13% compared to 3.51% in 4Q05
Gross Operating Income: +18.1%/4Q05At constant scope and exchange rates: -2.4%
Good performance compared to the market in 3Q06
Good sales business in 4Q/3Q: loans +1.8%, deposits +2.6% (higher growth than the market)Revenues: +0.6%/3Q06Gross Operating Income: +2.3%/3Q06
Cost of risk maintained at a very low level15 bp of weighted assets in 2006 (10 bp in 2005)Good quality of real estate portfolio; marginal subprime exposure (see appendix page 68)
IRFS: BancWest
+16.7%
+15.6%

International Retail Banking and Financial Services Results 31.12.2006 19
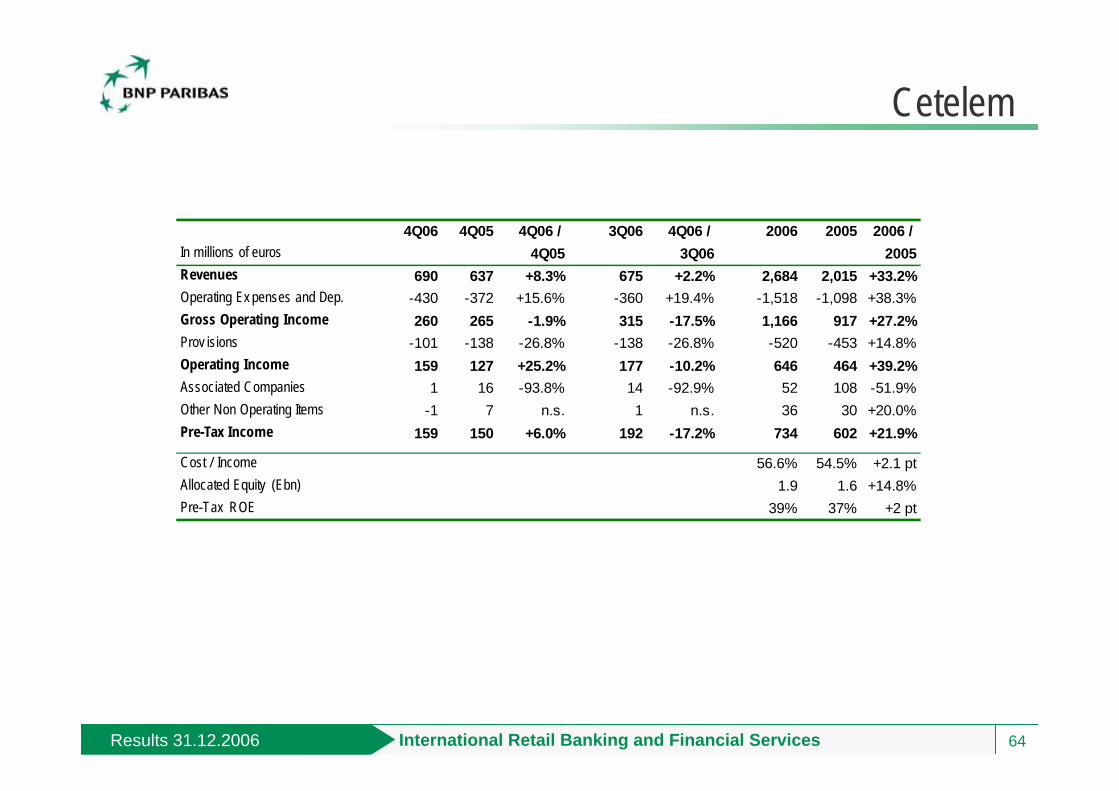
IRFS: Cetelem Revenues : +8.3%/4Q05 #1 in Continental Europe
€52.1bn in outstandings excluding the BNP Paribas network as at 31.12.06Outstandings doubled in 4 years
Strong Sales & Marketing Drive France: outstandings +11.8%*/31.12.2005Fast growth outside France: outstandings +24.3%**
Operating expenses and depreciation: +15.6%/4Q05Stable for Cetelem France, excluding the sales organisation streamlining plan (€18mn in 4Q06)Continued sustained international business development: Spain, Germany, Italy, Brazil
Cost of Risk DownOne-off write-back in Spain (€28mn) 197 bp in 2006 (excluding the one-off write-back) compared to 208 bp in 2005
Operating income: +25.2%/4Q05
2,015
2,684
602 734
2005 2006 2005 2006
in €mn
Annual Revenues and Pre-Tax Income
+33.2%
*restated from the transfer of €0.9bn of outstandings from the consolidation of UCB’s receivables** restated the impact of the disposal of a subsidiary of LaSer Cofinoga in 1Q06
+21.9%
67% 58%
14%33% 42%
86%
1996 2002 2006
Loans Outstandings
FranceOutside France

International Retail Banking and Financial Services Results 31.12.2006 20
IRFS: Emerging Markets (1/2)
Revenues: +43.9% (+15.3%*) / 4Q05Substantial organic growth, especially in Turkey (+34.9%) and in the Maghreb (+11.9%)
UkrSibbank’s superior growth (Revenues: €68mn in 4Q06 compared to €79mn for the 2Q06 and 3Q06 aggregate)
Operating expenses and depreciation: +48.9% (+15.5%*)/4Q05
163 branches opened in 4Q06 in Ukraine (111), Turkey (25), Middle East (10) and the Maghreb (17)
Cost of risk: +10.0% / 4Q05 Including the scope effect
Operating income: +43.6% (+38.2%*)/4Q05
766
1,037
249 279
2005 2006 2005 2006
in €mn
Annual Revenues and Pre-Tax Income
+35.4%
*At constant scope and exchange rates
864
841
574
2005 2006
Number of BranchesEnd of period
+12.0%
External growth
1,705

International Retail Banking and Financial Services Results 31.12.2006 21
Very favourable economic environmentGDP: +6.5% over 10 months 2006Sharp decline in inflation: +6.8% 1H06/ +14.4% 1H05
Sharp Growth in BusinessLoans: 3.6bn USD as at 31.12.2006
Gradual introduction of cross-selling with the Group’s other entities
Opened a trade centreOpened a TEB desk
Gross Operating Income over 9 months: €40mn
Rose from 5th to 3rd place* in Ukraine less than a year after the acquisition
Rose from 5th to 3rd place* in Ukraine less than a year after the acquisition
IRFS: Emerging Markets(2/2) UkrSibbank
*in total balance sheet
2,1042,591
3,570
1,729
1Q06 2Q06 3Q06 4Q06
in $mn
Loans Oustandings

International Retail Banking and Financial Services Results 31.12.2006 22
IRFS 2007: Priorities and ChallengesIntensify the sales and marketing driving through innovationContinue efforts to optimise operational effectiveness Italy: achieve the expected synergies
EuropeConsolidate leading positions in retail financial services
EuropeConsolidate leading positions in retail financial services
Grow the branch network, deploy the speciality business centres and bolster the customer relations organisationDistribute a wider product range throughout the entire branch network
BancWest Implement the organic
growth plan
BancWest Implement the organic
growth plan
Continue to pursue investments (190 branch openings planned)Roll out all the Group’s offering in the networks (consumer lending, credit protection insurance, leasing, car fleet financing, trade finance, etc.)
Emerging countries (branch networks + financial services)
Grow the revenues by more than 25%
Emerging countries (branch networks + financial services)
Grow the revenues by more than 25%

Asset Management and ServicesResults 31.12.2006 23
Asset Management & Services
Strong revenue growth: +15.7%/4Q05In all business lines
Increased pace of international growth Bolstered presence in Europe and Asia
Sharp rise in profitability Pre-tax income: +20.2%/4Q05
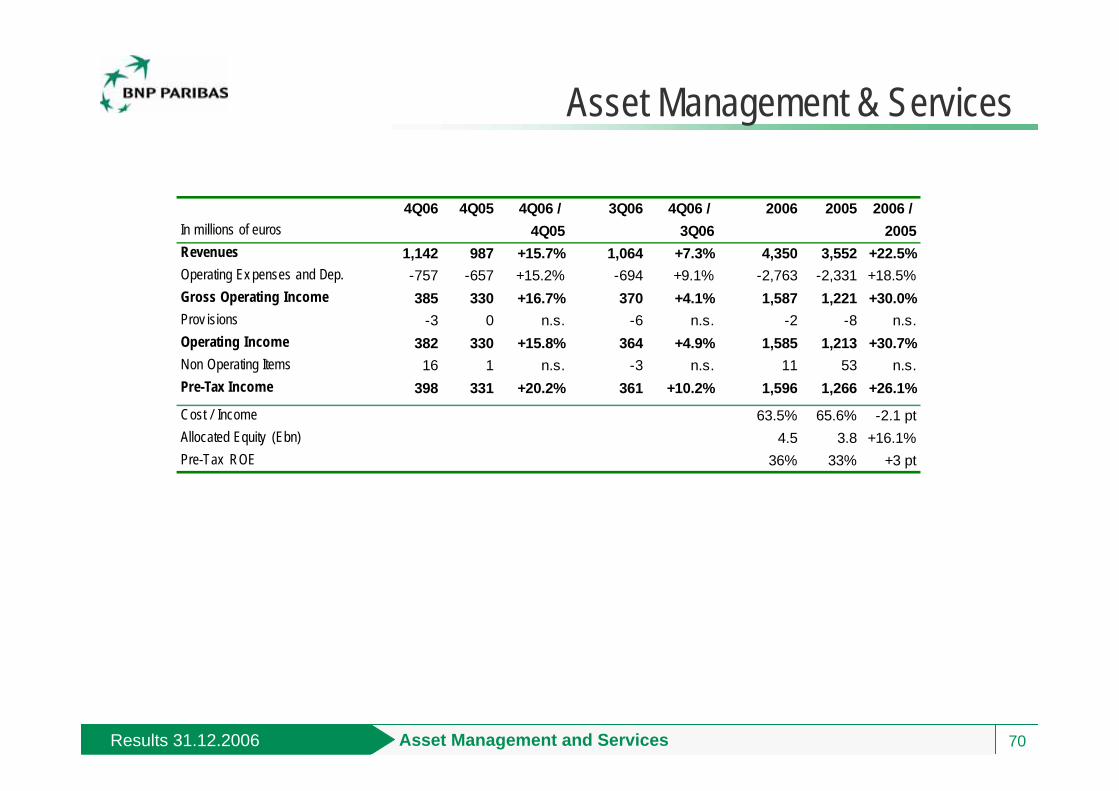
2006 2006/2005
Revenues €4.4 bn + 22.5 %Operating Exp. and Dep. -€2.8 bn + 18.5%Pre-Tax Income €1.6 bn +26.1%Cost/Income 63.5 % - 2.1 ptsAllocated Equity €4.5 bn + 16.1%Pre-Tax ROE 36 % + 3 pts
2,4763,019
3,552
4,350
723 993 1,2661,596
2003* 2004* 2005 2006 2003* 2004* 2005 2006
Annual Revenues and Pre-Tax Income
in €mn
* French accounting standards
x 1.8
x 2.2
In millions of euros 4Q06 4Q06 / 4Q05
Revenues 1,142 +15.7%Operating Ex penses and Dep. -757 +15.2%Gross Operating Income 385 +16.7%Prov isions -3 n.s.Operating Income 382 +15.8%Non Operating Items 16 n.s.Pre-Tax Income 398 +20.2%

Asset Management and ServicesResults 31.12.2006 24
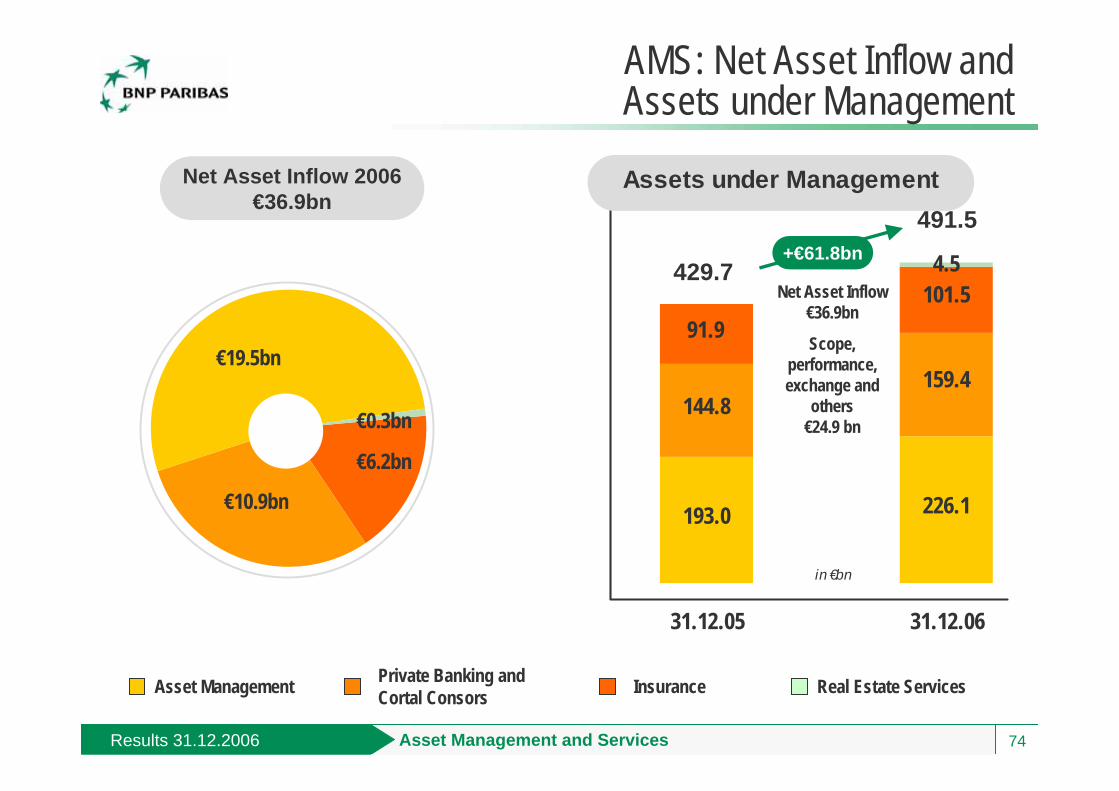
429.7
491.536.9
24.9
31.12.05 31.12.06
in €bn
Assets under Management
AMS: Assets under ManagementAssets under management: up +14%/31.12.05
Substantial net asset inflows across all business lines: 8.6% of assets under managementPositive performance effect
Net Inflow
Scope, Performance effects and
Others13.6 14.2
34.136.9
2003 2004 2005 2006
Net Asset Inflow
in €bn
Asset Management and ServicesResults 31.12.2006 25
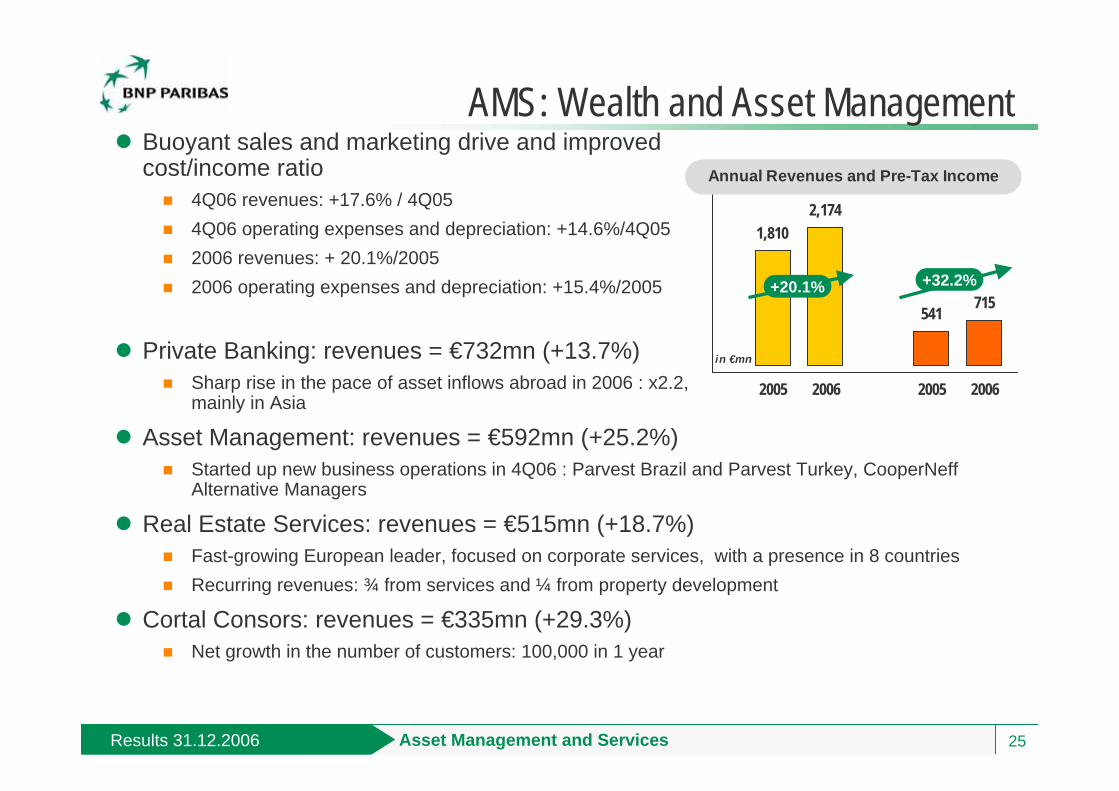
Buoyant sales and marketing drive and improved cost/income ratio
4Q06 revenues: +17.6% / 4Q05 4Q06 operating expenses and depreciation: +14.6%/4Q05 2006 revenues: + 20.1%/20052006 operating expenses and depreciation: +15.4%/2005
Private Banking: revenues = €732mn (+13.7%)Sharp rise in the pace of asset inflows abroad in 2006 : x2.2, mainly in Asia
Asset Management: revenues = €592mn (+25.2%)Started up new business operations in 4Q06 : Parvest Brazil and Parvest Turkey, CooperNeff Alternative Managers
Real Estate Services: revenues = €515mn (+18.7%)Fast-growing European leader, focused on corporate services, with a presence in 8 countriesRecurring revenues: ¾ from services and ¼ from property development
Cortal Consors: revenues = €335mn (+29.3%)Net growth in the number of customers: 100,000 in 1 year
AMS: Wealth and Asset Management
1,8102,174
541 715
2005 2006 2005 2006
Annual Revenues and Pre-Tax Income
in €mn
+20.1% +32.2%

Asset Management and ServicesResults 31.12.2006 26
757 901
260376
2005 2006
Annual Revenues
in €mn
AMS – Insurance Revenues: +11.3 %/4Q05 despite a high baseFrance: record level of gross asset inflows: €11bn in 2006, +17%/2005
Share of the unit-linked insurance products in life insurance asset inflows : 40.9% compared to 27.5% for the market
Abroad: fast-paced growthPresence in 35 countries at the end of 2006: set up operations in 3 new countries in 4Q (Bulgaria, Algeria and Rumania)€4.5bn gross inflows (+28%/2005), in particular: Taiwan and India (savings products)
Italy, Brazil, Japan and Chilli (Credit protection insurance)
Sustained commercial momentum Increased pace of international development
Sustained commercial momentum Increased pace of international development
+25.6%1,0171,277
+44.6%
+19%
580680
2005 2006
Annual Pre-Tax Income
in €mn
+17.2%
FranceOuside France

Asset Management and ServicesResults 31.12.2006 27
Revenues: +17.6%/4Q05
Very buoyant businessAssets under custody: €3,614bn, +18.2%/4Q05
Number of transactions : +19%/4Q05
Assets under administration: €623bn as at 31.12.06 (€520bn as at 31.12.05)
Buoyant sales and marketing effort illustrated by many new mandates
Global Pan European custody for Bâloise Assurances Group
Custody, valuation and performance allocation for EDF
AMS - Securities Services
“Fund Administrator of the Year”(FundsEurope 30 Nov. 2006) for the second year in a row
“Most innovative Securities Services provider in Europe”(Financial-i 9 Nov. 2006)
“Fund Administrator of the Year”(FundsEurope 30 Nov. 2006) for the second year in a row
“Most innovative Securities Services provider in Europe”(Financial-i 9 Nov. 2006)
725899
145 201
2005 2006 2005 2006
Annual Revenues and Pre-Tax Income
in €mn
+24.0% +38.6%
Asset Management and ServicesResults 31.12.2006 28
Maintain a high level of organic growth based on favourable structural trends
Less market sensitivity thanks to expansion of servicesLimited capital use Limited goodwill investments
Strengthen existing positions in Europe Accelerate growth in emerging countries: Asia, Middle East, Latin America
Step up the pace of growth abroadStep up the pace of growth abroad
Deploy French Private Banking’s model in ItalyBolster the product offering, in particular by using BNP ParibasAsset Management and BNP Paribas Assurance’s expertise
Extend the business model
to BNL
Extend the business model
to BNL
AMS 2007: Priorities and Challenges
Continuing double-digit organic growth Continuing double-digit organic growth
Continue deploying
substantial value creative model
Continue deploying
substantial value creative model

Corporate and Investment BankingResults 31.12.2006 29
Corporate and Investment Banking: 4Q06
Very good 4th quarter for all business linesRevenues: €1,904mn, +19.0%/4Q05, +8.1%/3Q06Gross Operating income: €900mn, +33.5%/4Q05,+ 17.6%/3Q06
Net write-back of provisionsNew provisions requirements still limited
Very sharp rise in profitabilityPre-tax income: €929mn, +38.5%/4Q05, +9.0%/3Q06
1,566 1,5681,688 1,600
2,282
1,9121,761
1,904
1Q05 2Q05 3Q05 4Q05 1Q06 2Q06 3Q06 4Q06
Quarterly Revenues
in €mn
In millions of euros 4Q06 4Q06 / 4Q05
Revenues 1,904 +19.0%Operating Ex penses and Dep. -1,004 +8.4%Gross Operating Income 900 +33.5%Prov isions 30 n.s.Operating Income 930 +41.3%Non Operating Items -1 n.s.Pre-Tax Income 929 +38.5%

Corporate and Investment BankingResults 31.12.2006 30
Corporate and Investment Banking: 2006
Sustained growth throughout the year, essentially in Capital Markets business lines
Particularly low cost/income ratio
Substantial growth in pre-tax income
Sharp rise in ROE year-on-year
2006 2006/2005
Revenues €7.9bn + 22.4%Operating Exp. and Dep. -€4.4bn + 18.5%Gross Operating Income €3.4bn + 27.7%Pre-Tax Income €3.8bn + 30.0% Cost/Income 55.9 % - 1.9 ptsAllocated Equity €9.4bn + 3.9%Pre-Tax ROE 40% + 8 pts
33%40%
34% 37%
2005 2006Equity and AdvisoryFixed IncomeFinancing Businesses
Annual Revenues
in €bn
+22.4%6.4
7.9
26%30%
Corporate and Investment BankingResults 31.12.2006 31
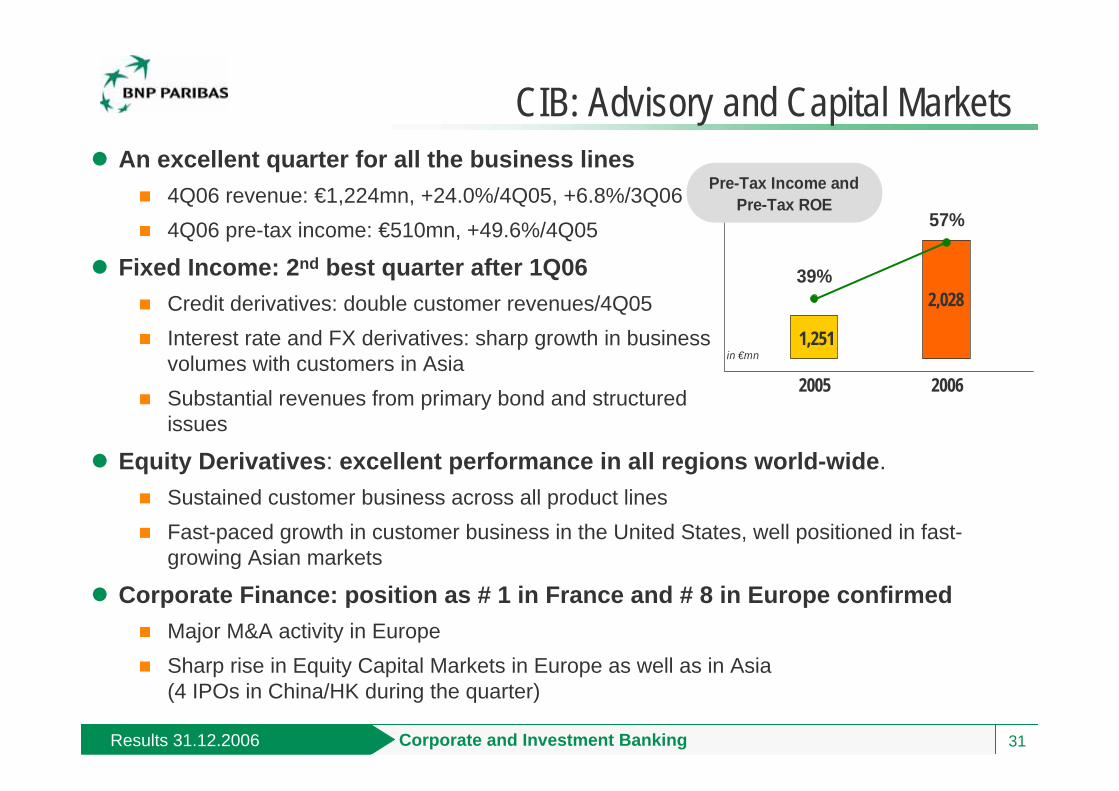
CIB: Advisory and Capital Markets An excellent quarter for all the business lines
4Q06 revenue: €1,224mn, +24.0%/4Q05, +6.8%/3Q064Q06 pre-tax income: €510mn, +49.6%/4Q05
Fixed Income: 2nd best quarter after 1Q06Credit derivatives: double customer revenues/4Q05Interest rate and FX derivatives: sharp growth in businessvolumes with customers in AsiaSubstantial revenues from primary bond and structured issues
Equity Derivatives: excellent performance in all regions world-wide. Sustained customer business across all product lines Fast-paced growth in customer business in the United States, well positioned in fast-growing Asian markets
Corporate Finance: position as # 1 in France and # 8 in Europe confirmedMajor M&A activity in EuropeSharp rise in Equity Capital Markets in Europe as well as in Asia (4 IPOs in China/HK during the quarter)
2,028
1,251
39%
57%
2005 2006in €mn
Pre-Tax Income and Pre-Tax ROE

Corporate and Investment BankingResults 31.12.2006 32
Sustained growth throughout the quarter 4Q06 revenues: €680mn, +10.9%/4Q05, + 10.6%/3Q06
Pre-tax: €419mn, +27.0%/4Q05
Structured FinanceThe year’s best quarter in terms of revenues, especially in Europe
Energy and Commodities Finance: major revenue growth
Strong business volumes in structured commodities, asset and infrastructure finance
Negative effect of drop in oil prices on oil trade finance revenues
Risk weighted assets down over the year (-3.4%)Significant rise in gross risk weighted assets offset by the rise in protection bought
Pre-Tax ROE: 30% (+ 2 pts)
CIB: Financing Businesses
1,7291,639
30%
28%
2005 2006
in €mn
Pre-Tax Income andPre-Tax ROE
95.8 92.5
20.25.7
2005 2006
Average Risk Weighted Assets
in €bn
Protection boughtAverage net weighted assets
+11%
-3.4%

Corporate and Investment BankingResults 31.12.2006 33
CIB: A European Leader With Global FranchisesEquity, Interest Rate, FX and Credit Derivatives
Equity Derivatives House of the Year - Risk Awards 2007(Risk Magazine, Jan. 07)
Bank of the Year for Interest Rate Derivatives(The Banker, Oct. 06)
Global Structured Products House of the Year (Euromoney, July 06)
Innovation of the year, Americas: arranger of HP’s share buyback programme (Structured Products, April 06)
Energy, Commodities, Export and Project FinanceBest Project Finance Arranger (Project Finance Magazine, Aug. 06)#2 Top Arrangers of Global Trade Finance Loans* (Dealogic – Full year 2006)
Excellence in Renewable Energy award (Energy Business, Dec. 06)Aircraft Finance Innovator of the Year (Jane's Transport Finance, Nov. 06)
*including aircraft and shipping finance

Corporate and Investment BankingResults 31.12.2006 34
Major presence in the main countries3,300 employees, 23% of CIB’s workforce
Leader in DerivativesBest Credit Derivatives Provider Asia(Global Finance, Sept 06)
Rising Star Derivatives House (The Asset Asian Derivatives and Structured Products Awards 2006)
#1 in exotic rate derivatives in all Asian currencies (AsiaRisk, April 06)
#3 interest rate and FX directives in euros, dollars and yens (Asia Money, April 06)
Leader in Energy, Commodities & Project Finance#1 Mandated Arrangers of Asia Pacifc Trade Finance Loans (2006, Dealogic)
Recognised Presence in Corporate FinanceBest Mid-Cap Equity House of the Year (The Asset, Dec. 06) for the 4th year in a rowBest M&A Deal of the Year - Cathay Pacific Acquisition of Dragonair (Finance Asia, June 06)
CIB: A Powerful Presence in Asia
Hong Kong
Shanghai
Tokyo
HanoiManilla
Mumbai
Ho Chi Minh City
Beijing
Singapore
New Delhi
Seoul
Energy & Commodities
Fixed Income
EQD
Structured Finance
Corporate Finance
Osaka
Jakarta
Kuala Lumpur
Melbourne
Sydney
Taipei
Bangkok

Corporate and Investment BankingResults 31.12.2006 35
CIB 2007: Priorities and ChallengesMaintain leadership in derivative product innovationExpand flow business in derivatives (Equity, Fixed Income)Capitalise on our positions in specialised financingGrow the customer base (financial institutions, mid caps, etc.)
Grow strategic
franchises
Grow strategic
franchises
Step up organic growth in China, India, Russia and in the Gulf
Invest in emerging markets
Invest in emerging markets
Accelerate the expansion the Italian franchise Grow cross-selling with the Group’s retail banking networks(IRFS, FRB)
Reinforce synergies with
the other business lines
Reinforce synergies with
the other business lines
Continue to focus on higher added value businessesMaintain selectivity at origination Actively manage the loan portfolio
Optimise capital usage
Optimise capital usage
A strong and profitable growth potentialInvestor Day on June 20th 2007
A strong and profitable growth potentialInvestor Day on June 20th 2007
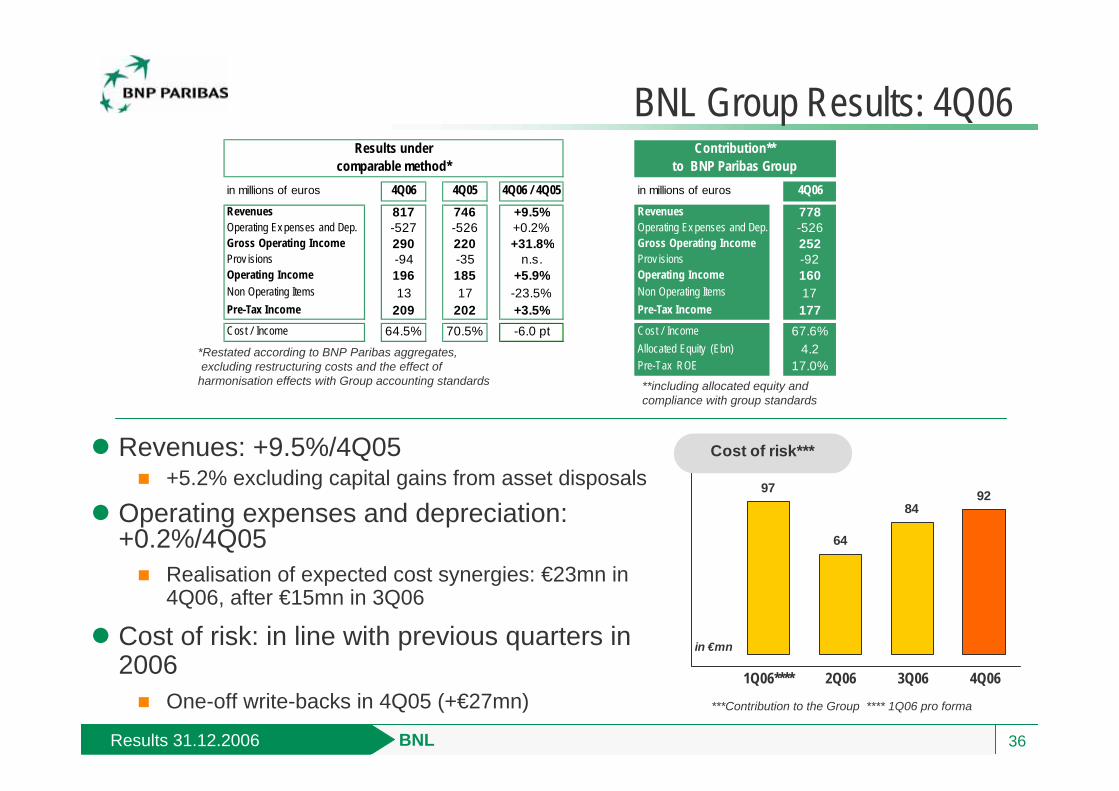
BNLResults 31.12.2006 36
97
64
8492
1Q06**** 2Q06 3Q06 4Q06
Cost of risk***
in €mn
Revenues: +9.5%/4Q05+5.2% excluding capital gains from asset disposals
Operating expenses and depreciation: +0.2%/4Q05
Realisation of expected cost synergies: €23mn in 4Q06, after €15mn in 3Q06
Cost of risk: in line with previous quarters in 2006
One-off write-backs in 4Q05 (+€27mn)
BNL Group Results: 4Q06
*Restated according to BNP Paribas aggregates,excluding restructuring costs and the effect of
harmonisation effects with Group accounting standards
***Contribution to the Group **** 1Q06 pro forma
**including allocated equity and compliance with group standards
in millions of euros 4Q06 4Q05 4Q06 / 4Q05 in millions of euros 4Q06Revenues 817 746 +9.5% Revenues 778Operating Ex penses and Dep. -527 -526 +0.2% Operating Ex penses and Dep. -526Gross Operating Income 290 220 +31.8% Gross Operating Income 252Prov isions -94 -35 n.s. Prov isions -92Operating Income 196 185 +5.9% Operating Income 160Non Operating Items 13 17 -23.5% Non Operating Items 17Pre-Tax Income 209 202 +3.5% Pre-Tax Income 177Cost / Income 64.5% 70.5% -6.0 pt Cost / Income 67.6%
Allocated Equity (Ebn) 4.2Pre-Tax ROE 17.0%
Contribution** to BNP Paribas Group
Results undercomparable method*

BNLResults 31.12.2006 37
21.7 22.8
2005 2006
in €bn
Deposits OutstandingsBNL SpA
BNL: Business TrendsIndividual Customers
Corporate Customers
16.3 18.4
4.44.6
2005 2006
Other Loans
Mortgages in €bn
Loans OutstandingsBNL SpA
+9.3%20.9 22.8
28.7 30.2
2005 2006
in €bn
Loans OustandingsBNL SpA
+5.2%+5.4%
26.4 26.9
2005 2006
in €bn
Deposits OutstandingsBNL SpA
+2.1%

BNLResults 31.12.2006 38
BNL: Integration Progress Report BNL banca commerciale
Revitalising the BNL franchiseRevitalising the BNL franchise
New organisation in place in the Retail & Private et Corporate divisions
New territorial organisation brought down to 5 regions
Pilot project under way in the Northeast region (completion expected by end of March)
Renovated Retail & Private product offeringSuccess of a second life-insurance product (over €1bn collected in Jan./Feb.)Launch of new ”Conto Revolution”
Initial cross-selling to businessesNew customer contacts with the Italian desks opened in Paris, Lyon and Tunis and with the French desks in Rome and MilanFirst international cash management mandatesDeveloped structured transactions for local authorities
Northwest (Milan)
Northeast (Bologna)
Centre (Florence)
Latium and Sardinia (Rome)
South (Naples)

BNLResults 31.12.2006 39
BNL: Integration Progress Report Business Lines
Promising success of the two new structured products (4WD, Target Return)BNL Vita / UNIPOL agreement signed to distribute life-insurance productsBNL – BNP Paribas Private Bank launched: new asset management services offered
AMSAMS
Leasing: tying up of the organisations to create a leader in Italy under way
Distribution agreements signed between Arval and the Corporate Division, and between UCB and the Retail & Private Division
Italian desk operational in Tunisia and being opened in Turkey
IRFSIRFS
BNP Paribas-BNL CIB fully operational with 225 professionalsTraining of BNL bc customer relationship managers on CIB products under wayJoint client visits with BNL bc has started
CIBCIB
BNP Paribas’ know-how brought to BNL’s customers
BNP Paribas’ know-how brought to BNL’s customers

BNLResults 31.12.2006 40
Restructuring costs in 4Q06: €141mn booked at the Group level
Implementation of the HR plan signed in Nov. 2006 by BNL SpA
First employees leaving as part of the early retirement plan at the end of March
Project management and synergies tracking tool in place
Managers fully accountable for business and financial targets
GrossRevenuesSynergies
MarginalCosts
CostSynergies
TotalSynergies
BNL : Integration Progress ReportSynergies
Synergies expected in 2007: €119mnSynergies expected in 2007: €119mn
Synergies expected in 2007
in €mn
79-60
100
119

41
Results as at 31 December 2006 BNP Paribas
Perspectives

BNP Paribas GroupResults 31.12.2006 42
Business lines developing strong franchisesRetail banking: combination of branch retail banking and retail financial services expertiseCIB and AMS: leading business lines with strong organic growth potentialInnovation as a factor of out performance
Business mix promoting regular growthAnchored in Europe with 2 home markets (France and Italy)A growing presence in emerging countries based on the combined growth of the branch banking network and the business lines’ platforms Giving the Group flexible growth options
Proven delivery skills and know-howAn integrated organisation that facilitates cross-selling and growth control Acquisition of BNL and integration in line with targets
Key Strenghts
BNP Paribas GroupResults 31.12.2006 43
Consolidate the franchises and the leading positions of each of the Group’s core businesses
Commercial out performance to be reached through innovation and customer satisfaction
Major growth in international businesses
Continue to enhance operating efficiency FRB: maintain a positive jaws effect each year of at least one point, excluding PEL/CEL effects
BNL bc: achieve the cost and revenue synergies expected
AMS: invest to generate growth while maintaining a positive jaws effect
IRFS: continue to pursue investments in organic growth and achieve the synergies associated with acquisitions
CIB: maintain one of the best cost/income ratios in the industry
2007 Goals

BNP Paribas GroupResults 31.12.2006 44
Cost of riskNet provisions / RWA
23 26 32 3925 18
2001 2002 2003 2004 2005 2006
FRB
51 62 627
-17-9
2001 2002 2003 2004 2005 2006
CIB
0
213 209 194 217 197209
2001 2002 2003 2004 2005 2006*
Cetelem
6138 30 16 10 15
2001 2002 2003 2004 2005 2006
BancWest
2007: Remain Vigilant in Risk Management
A prudent risk policy and stringent monitoring proceduresLimited real estate risks both in Europe and in the United StatesActive syndication of corporate loans, in particular LBOsModerate exposure to market risks and counterparty risks largely collateralisedBNL incorporated in the Group’s risk management procedures
* Excl exceptional items

BNP Paribas GroupResults 31.12.2006 45
2005–2006: Capital ManagementPay out ratio raised in two years from 37.9% to 40.3%Only 60% of BNL acquisition financed by the rights issueOrganic growth and other acquisitions financed through own cashflowTier 1 ratio stable over two years : 7.4% as at 31 December 2006
Capital Uses and Resources: 2005 + 2006 (in billions of €)
Capital increase
Hybrid share issues
Net income group share
Other
BNL acquisition
Other acquisitions
Dividends
Organic growth
Net share buybacks
5.0
3.0
8.9
0.8
13.0
3.7
3.9
5.4
0.5
Uses Ressources
BNP Paribas GroupResults 31.12.2006 46
Priority given to organic growth and BNL integration
Continue the disciplined and targeted acquisition strategyMaintain stringent valuation criteriaGeographic and business priorities unchanged
Preparing for the switch to Basel II: all the core businesses well-positioned for pillar 1
Due to the nature of the businesses and the quality of the portfolios
2007: Capital Management

BNP Paribas GroupResults 31.12.2006 47
Dividend and Earnings per Share
Undiluted EPS calculated based on the average number of shares oustandings
** subject to shareholders’ approval
4.35.6
7.08.0
2003 2004 2005 2006in €
Earnings per Share
3,10**2.60
2.001.45
2003 2004 2005 2006
in €
Dividend per share
New strong increase despite the capital increase realised in 2006
New strong increase despite the capital increase realised in 2006
* *
* French accounting standards
CAGR = +28.8%CAGR = +23.0%
48
Results as at 31 December 2006 BNP Paribas
Conclusion
BNP Paribas GroupResults 31.12.2006 49
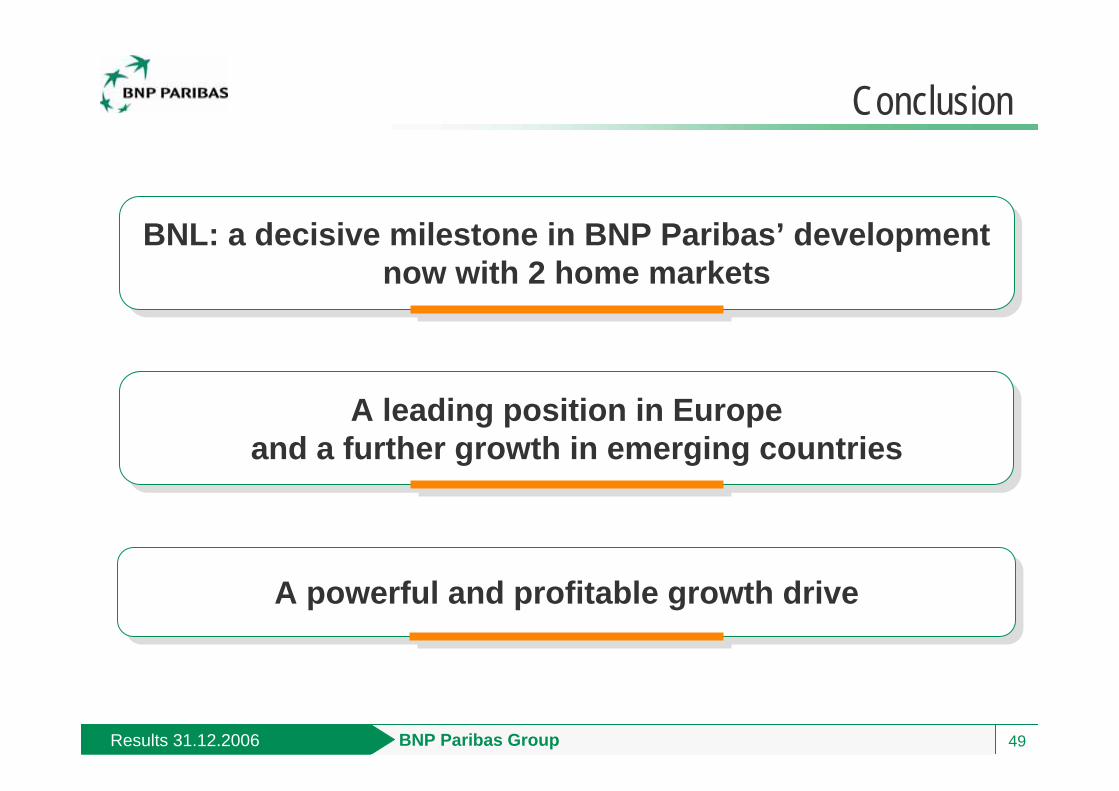
Conclusion
A powerful and profitable growth driveA powerful and profitable growth drive
A leading position in Europeand a further growth in emerging countries
A leading position in Europeand a further growth in emerging countries
BNL: a decisive milestone in BNP Paribas’ developmentnow with 2 home markets
BNL: a decisive milestone in BNP Paribas’ developmentnow with 2 home markets

50
Results as at 31 December 2006 BNP Paribas
Appendices

BNP Paribas GroupResults 31.12.2006 51
Corporate Social ResponsibilityMain Initiatives in 2006
Economically Depressed Suburbs Project Suburbs: supported economic development and business startup programmes, academic support for children, local community initiatives (already 40 organisations receive support and 5 microcredit branches are scheduled to open in 2007)6,000 jobs to be created in Seine-Saint-Denis in 2008: After relocating its IT Division in the city of Montreuil, BNP Paribas is set to become in 2008, with the relocation of its Securities Services business line, the largest employer in Seine Saint Denis
MicrocreditFrance: financed 1,400 projectsBank of the West: funded incubators for microbusinessesEmerging countries: project to refinance microcredit organisations in emerging countries
Sponsored small business startupsPledged to support 4,000 business startup projects in March 2007 as part of the Entrepreneurs Open House eventItaly: Artigiancassa supports small and family businesses
Commitment to support medical research BNP Paribas sponsors the Telethon in France and in Italy
BNP Paribas: Corporate Social Responsability Award 2007 from the Foreign Policy Association
BNP Paribas: Corporate Social Responsability Award 2007 from the Foreign Policy Association

BNP Paribas GroupResults 31.12.2006 52
BNP Paribas Group
4Q06 4Q05 4Q06 / 3Q06 4Q06 / 2006 2005 2006 / In millions of euros 4Q05 3Q06 2005Revenues 7,052 5,622 +25.4% 6,829 +3.3% 27,943 21,854 +27.9%Operating Expenses and Dep. -4,654 -3,669 +26.8% -4,261 +9.2% -17,065 -13,369 +27.6%Gross Operating Income 2,398 1,953 +22.8% 2,568 -6.6% 10,878 8,485 +28.2%Provisions -282 -293 -3.8% -264 +6.8% -783 -610 +28.4%Operating Income 2,116 1,660 +27.5% 2,304 -8.2% 10,095 7,875 +28.2%Associated Companies 54 92 -41.3% 118 -54.2% 293 352 -16.8%Other Non Operating Items 145 72 n.s. 4 n.s. 182 197 -7.6%Non Operating Items 199 164 +21.3% 122 +63.1% 475 549 -13.5%Pre-Tax Income 2,315 1,824 +26.9% 2,426 -4.6% 10,570 8,424 +25.5%Tax Expense -481 -358 +34.4% -638 -24.6% -2,762 -2,138 +29.2%Minority Interests -115 -131 -12.2% -113 +1.8% -500 -434 +15.2%Net Income, Group Share 1,719 1,335 +28.8% 1,675 +2.6% 7,308 5,852 +24.9%Cost / Income 66.0% 65.3% +0.7 pt 62.4% +3.6 pt 61.1% 61.2% -0.1 pt
BNP Paribas GroupResults 31.12.2006 53
Earnings per share
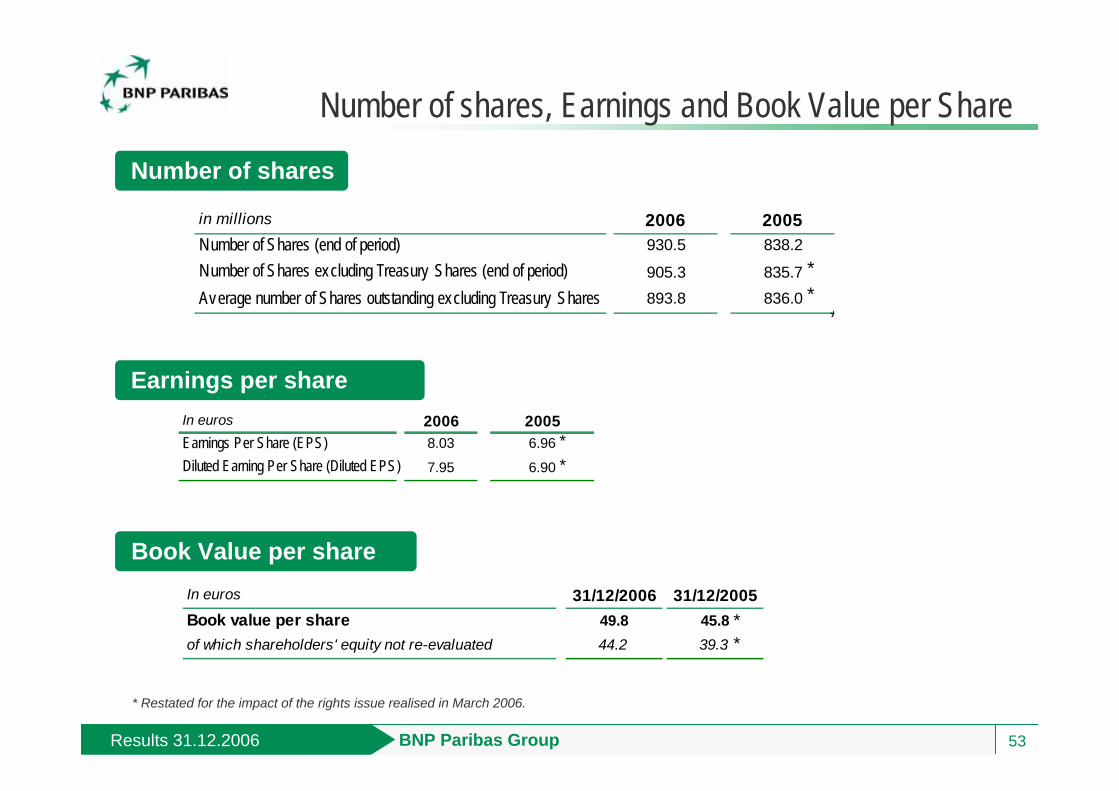
Number of shares, Earnings and Book Value per Share
Number of shares
Book Value per share
* Restated for the impact of the rights issue realised in March 2006.
in millions 2006 2005Number of Shares (end of period) 930.5 838.2Number of Shares excluding Treasury Shares (end of period) 905.3 835.7Average number of Shares outstanding excluding Treasury Shares 893.8 836.0 *
*
*
In euros 2006 2005Earnings Per Share (EPS) 8.03 6.96Diluted Earning Per Share (Diluted EPS) 7.95 6.90 *
*
In euros 31/12/2006 31/12/2005Book value per share 49.8 45.8of which shareholders' equity not re-evaluated 44.2 39.3
**

BNP Paribas GroupResults 31.12.2006 54
A Solid Financial Structure
Ratings
Coverage ratio
Taux de couverture Equity
S&P AA Positive outlook Outlook upgraded on November 15, 2006Moody's Aa2 Stable outlook Reaffirmed on February 7, 2006
Fitch AA Stable outlook Reaffirmed on May 15, 2006
In billions of euros31-Dec-06 31-Dec-05
Shareholders' equity Group share, not re-evaluated (a) 37.2 30.7Valuation Reserve 5.0 5.5 (of which BNP Paribas Capital) (2.2) (1.6)
Total Capital ratio 10.5% 11.0%Tier One Ratio (b) 7.4% 7.6%
(a) Excluding undated participating subordinated notes and after estimated distribution.(b) on estimated risk weighted assets respectively o f E465.2 bn as at 31.12.06 and E377.7bn as at 31.12.05.
Return on Equity 21.2% 20.2%
In billions of euros31-Dec-06 31-Dec-05
Doubtful loans and commitments 15.7 12.7
Provisions 13.9 11.1
Coverage ratio 89% 87%

BNP Paribas GroupResults 31.12.2006 55
A positive impact of Pillar 1 for all the core businesses despite inclusion of operational risks
Substantial reduction in capital requirements for mortgages Consumer lending mostly prime, hence will also benefit from Basel 2Good quality corporate lending and significant reduction in capital requirements for counterparty riskA more favourable method for AMS (due to the Securities Services business)
Well-positioned for Pillar 2Major regional and industry diversificationAn internal economic capital model covering all risks
A limited Tier 1 ratio gain in 2008 due to the transition periodA floor at 90% of Basel 1 risk weighted assets in 2008New equity deduction rules that will attenuate the increase of the Tier 1 ratio
Preparing for the Switch to Basel 2

BNP Paribas GroupResults 31.12.2006 56
Break-down of Commitments by Industry
Gross outstandings + off balance sheet commitments, unweighted = €715 bn as at 31.12.06
Sovereign, Public Administrations and
Finance19%
Energy excluding Electricity
4%
Household goods1%
Utilities (Electricity, Gas, Water, etc)
3%
Media & Cultural Services
1%
Transport & Logistics3%
Hotels, Tourism, Leisure
1%
Healthcare & Pharmateucicals
1%
Communications Services
1%Metals & Ores
3%Business Services
4%
Private individuals29%
Utilities1%
Information Technologies
2%
Equipment excluding IT3%
Real Estate3%
Agriculture, Food, Tobacco
3%
Insurance3%
Automotive1%
Building and Public Works
3%
Retailers2%
Wholesale & BulkTrade7%
Chemicals excluding Pharmaceuticals
2%

BNP Paribas GroupResults 31.12.2006 57
Break-down of Commitments by Region
Gross oustandings + off balance sheet commitments, unweighted = €715 bn as at 31.12.06
European Economic Area (excluding Italy)
14%
Asia-Pacific (excl. Japan)
4%
Japan1%
Other European countries
5%
Africa & Middle East3%
Latin America3%
BancWest6%
North America (excl. BancWest)
13%
Italy15%
France36%

French Retail BankingResults 31.12.2006 58
French Retail Banking: 2006
4Q06 4Q05 4Q06 / 3Q06 4Q06 / 2006 2005 2006 / In millions of euros 4Q05 3Q06 2005Revenues 1,408 1,386 +1.6% 1,439 -2.2% 5,850 5,451 +7.3% Incl. Interest Margin 791 808 -2.1% 847 -6.6% 3,380 3,189 +6.0% Incl. Commissions 617 578 +6.7% 592 +4.2% 2,470 2,262 +9.2%Operating Ex penses and Dep. -972 -970 +0.2% -972 +0.0% -3,811 -3,699 +3.0%Gross Operating Income 436 416 +4.8% 467 -6.6% 2,039 1,752 +16.4%Prov isions -56 -68 -17.6% -35 +60.0% -153 -194 -21.1%Operating Income 380 348 +9.2% 432 -12.0% 1,886 1,558 +21.1%Non Operating Items 1 0 n.s. 0 n.s. 1 0 n.s.Pre-Tax Income 381 348 +9.5% 432 -11.8% 1,887 1,558 +21.1%Income Attributable to AMS -28 -21 +33.3% -24 +16.7% -117 -88 +33.0%Pre-Tax Income of French Retail Bkg 353 327 +8.0% 408 -13.5% 1,770 1,470 +20.4%
Cost / Income 65.1% 67.9% -2.8 ptAllocated Equity (Ebn) 5.5 5.1 +7.3%Pre-Tax ROE 32% 29% +3 pt

French Retail BankingResults 31.12.2006 59
Volatility of the Revenue Items Associated with the PEL/CEL (Home Ownership Savings Plans and Accounts) Provision
Negligible contribution in 2005 : +€13mnA substantial contribution of additional revenues in 2006, especially in Q1
FRB’s 2006/2005 revenues growth: +7.3% Revenues growth excluding the PEL/CEL effects: +4.3%
Limited contribution expected in 2007Slightly positive volume effect expected due to the continued erosion trend of PEL/CEL outstandings Neutral interest rate effect expected based on the assumption of stable long-term interest rates
Negative base effect for 2007Negative base effect for 2007
in €mn 1Q06 2Q06 3Q06 4Q06 Year 2006
Volume Effect (1) 38 13 7 8 66Interest Rate Effect 26 41 32 15 113
Total Effects (2) 64 54 38 23 179(1) Consequence of the outflows(2) Including carrying costs of the provision

French Retail BankingResults 31.12.2006 60
FRB* 4Q06: Fees
* Including 100% of French Private Banking
367 371 370 376 379 388 387 386
198 192 187 202259 235 206 231
1Q05 2Q05 3Q05 4Q05 1Q06 2Q06 3Q06 4Q06
Fees oninvestmentfunds andtransactionsFees on otherbankingtransactions
in €mn
Fees
565 562 557 578623638
592617

French Retail BankingResults 31.12.2006 61
FRB 4Q06: Outstandings
In billions of euros
Outstandings 4Q06
% Change1 year
4Q06/4Q05
% Change1 quarter
4Q06/3Q06
Average Outstandings
2006
% Change1 year
2006/2005
LENDINGS (1)Total Loans 98.3 +8.8% +1.9% 95.6 +9.6%Individual Customers 53.1 +13.6% +1.9% 51.1 +15.5% Incl. Mortgages 45.7 +14.8% +2.0% 43.9 +17.1% Incl. Consumer Lending 7.5 +6.5% +1.5% 7.3 +7.2%Corporates 41.9 +4.7% +2.0% 41.1 +4.4%DEPOSITS and SAVINGS (1) 82.1 +5.1% +0.8% 80.7 +4.4%Cheque and Current Accounts 34.8 +6.9% +1.3% 33.9 +6.4%Savings Accounts 36.9 -2.7% -1.3% 37.5 -0.9%Market Rate Deposits 10.4 +36.5% +6.8% 9.3 +22.9%(1) Average cash Outstandings
In billions of euros31-Dec-06
% Change31.12.06/31.12.05
% Change31.12.06/30.09.06
Funds under managementLife Insurance 52.3 +14.3% +3.5%Mutual Funds (2) 77.5 +18.6% +3.0%(2) These statistics do not include mutual funds assets registered in Luxemburg (PARVEST). Source: Europerformance.
International Retail Banking and Financial Services Results 31.12.2006 62
International Retail Banking and Financial Services
4Q06 4Q05 4Q06 / 3Q06 4Q06 / 2006 2005 2006 / In millions of euros 4Q05 3Q06 2005Revenues 1,879 1,704 +10.3% 1,856 +1.2% 7,296 5,968 +22.3%Operating Ex penses and Dep. -1,128 -1,033 +9.2% -1,044 +8.0% -4,173 -3,385 +23.3%Gross Operating Income 751 671 +11.9% 812 -7.5% 3,123 2,583 +20.9%Prov isions -162 -183 -11.5% -221 -26.7% -708 -559 +26.7%Operating Income 589 488 +20.7% 591 -0.3% 2,415 2,024 +19.3%Associated Companies -9 16 n.s. 20 n.s. 54 112 -51.8%Other Non Operating Items 3 11 n.s. 4 n.s. 45 39 +15.4%Pre-Tax Income 583 515 +13.2% 615 -5.2% 2,514 2,175 +15.6%Cost / Income 57.2% 56.7% +0.5 ptAllocated Equity (Ebn) 7.1 5.8 +22.4%Pre-Tax ROE 36% 38% -2 pt

International Retail Banking and Financial Services Results 31.12.2006 63
BancWest
4Q06 4Q05 4Q06 / 3Q06 4Q06 / 2006 2005 2006 / In millions of euros 4Q05 3Q06 2005Revenues 534 525 +1.7% 531 +0.6% 2,191 1,877 +16.7%Operating Ex penses and Dep. -267 -299 -10.7% -270 -1.1% -1,104 -954 +15.7%Gross Operating Income 267 226 +18.1% 261 +2.3% 1,087 923 +17.8%Prov isions -20 -8 n.s. -17 +17.6% -58 -32 +81.3%Operating Income 247 218 +13.3% 244 +1.2% 1,029 891 +15.5%Associated Companies 0 0 n.s. 0 n.s. 0 0 n.s.Other Non Operating Items 1 0 n.s. 0 n.s. 1 0 n.s.Pre-Tax Income 248 218 +13.8% 244 +1.6% 1,030 891 +15.6%
Cost / Income 50.4% 50.8% -0.4 ptAllocated Equity (Ebn) 2.6 2.0 +30.5%Pre-Tax ROE 40% 45% -5 pt
International Retail Banking and Financial Services Results 31.12.2006 64
Cetelem
4Q06 4Q05 4Q06 / 3Q06 4Q06 / 2006 2005 2006 / In millions of euros 4Q05 3Q06 2005Revenues 690 637 +8.3% 675 +2.2% 2,684 2,015 +33.2%Operating Ex penses and Dep. -430 -372 +15.6% -360 +19.4% -1,518 -1,098 +38.3%Gross Operating Income 260 265 -1.9% 315 -17.5% 1,166 917 +27.2%Prov isions -101 -138 -26.8% -138 -26.8% -520 -453 +14.8%Operating Income 159 127 +25.2% 177 -10.2% 646 464 +39.2%Associated Companies 1 16 -93.8% 14 -92.9% 52 108 -51.9%Other Non Operating Items -1 7 n.s. 1 n.s. 36 30 +20.0%Pre-Tax Income 159 150 +6.0% 192 -17.2% 734 602 +21.9%
Cost / Income 56.6% 54.5% +2.1 ptAllocated Equity (Ebn) 1.9 1.6 +14.8%Pre-Tax ROE 39% 37% +2 pt

International Retail Banking and Financial Services Results 31.12.2006 65
Arval, BNP Paribas Lease Group, UCB
4Q06 4Q05 4Q06 / 3Q06 4Q06 / 2006 2005 2006 / In millions of euros 4Q05 3Q06 2005Revenues 350 330 +6.1% 348 +0.6% 1,384 1,310 +5.6%Operating Ex penses and Dep. -227 -225 +0.9% -216 +5.1% -868 -830 +4.6%Gross Operating Income 123 105 +17.1% 132 -6.8% 516 480 +7.5%Prov isions -19 -17 +11.8% -15 +26.7% -44 -58 -24.1%Operating Income 104 88 +18.2% 117 -11.1% 472 422 +11.8%Associated Companies -9 0 n.s. 1 n.s. -5 4 n.s.Other Non Operating Items 1 2 -50.0% 1 +0.0% 4 7 -42.9%Pre-Tax Income 96 90 +6.7% 119 -19.3% 471 433 +8.8%
Cost / Income 62.7% 63.4% -0.7 ptAllocated Equity (Ebn) 1.8 1.6 +11.6%Pre-Tax ROE 26% 26% +0 pt

International Retail Banking and Financial Services Results 31.12.2006 66
Emerging Markets
4Q06 4Q05 4Q06 / 3Q06 4Q06 / 2006 2005 2006 / In millions of euros 4Q05 3Q06 2005Revenues 305 212 +43.9% 302 +1.0% 1,037 766 +35.4%Operating Ex penses and Dep. -204 -137 +48.9% -198 +3.0% -683 -503 +35.8%Gross Operating Income 101 75 +34.7% 104 -2.9% 354 263 +34.6%Prov isions -22 -20 n.s. -51 n.s. -86 -16 n.s.Operating Income 79 55 +43.6% 53 +49.1% 268 247 +8.5%Associated Companies -1 0 n.s. 5 n.s. 7 0 n.s.Other Non Operating Items 2 2 +0.0% 2 +0.0% 4 2 n.s.Pre-Tax Income 80 57 +40.4% 60 +33.3% 279 249 +12.0%
Cost / Income 65.9% 65.7% +0.2 ptAllocated Equity (Ebn) 0.8 0.5 +49.4%Pre-Tax ROE 36% 47% -11 pt

International Retail Banking and Financial Services Results 31.12.2006 67
BancWest: ActivityUS GAAP
31.12.06 31.12.06(in billions of USD) / 31.12.05 / 30.09.06
Total Assets 67.3 66.3 +1.5% 67.8 -0.7%Loans and Leases 45.9 43.8 +4.9% 45.1 +1.8% +5.2%Deposits 46.1 42.4 +8.7% 44.9 +2.6% +5.5%
Non Performing Assets/Loans and foreclosed properties 0.57% 0.51% +6 bp 0.54% +3 bp
4Q06 4Q06 / 4Q05 / 3Q06
Net Interest Margin 3.13% 3.51% -38 bp 3.16% -3 bp
Average Outstandings4Q06 / 4Q05
4Q06 4Q05 3Q06
31.12.06 31.12.05 30.09.06
At constant scope
International Retail Banking and Financial servicesResults 31.12.2006 68
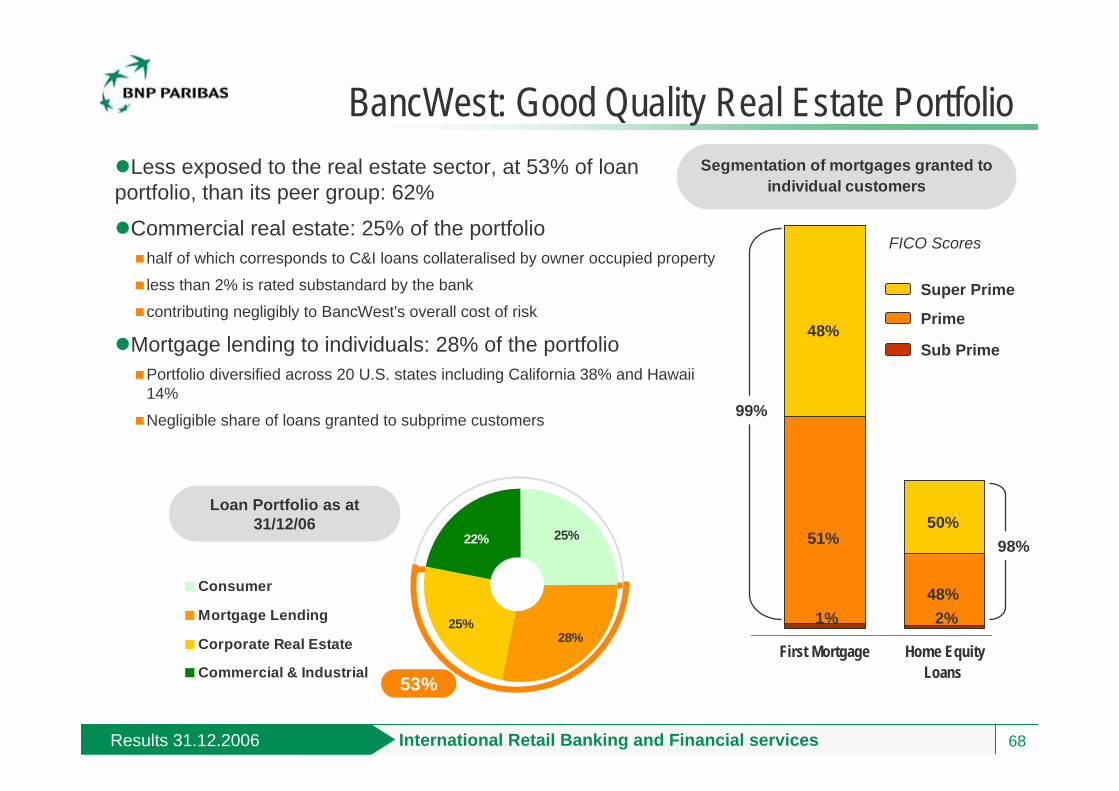
Less exposed to the real estate sector, at 53% of loan portfolio, than its peer group: 62%
Commercial real estate: 25% of the portfoliohalf of which corresponds to C&I loans collateralised by owner occupied property
less than 2% is rated substandard by the bank
contributing negligibly to BancWest's overall cost of risk
Mortgage lending to individuals: 28% of the portfolioPortfolio diversified across 20 U.S. states including California 38% and Hawaii 14%
Negligible share of loans granted to subprime customers
BancWest: Good Quality Real Estate Portfolio
First Mortgage Home EquityLoans
Segmentation of mortgages granted to individual customers
48%
51%
1%
50%
Prime
Super Prime
Sub Prime
99%
FICO Scores
2%
98%
48%
28%25%
22% 25%
Consumer
Mortgage Lending
Corporate Real Estate
Commercial & Industrial53%
Loan Portfolio as at 31/12/06

International Retail Banking and Financial Services Results 31.12.2006 69
Financial Services: Outstandings
In billions of eurosDec-06 Dec-05
% Change1 year
/ Dec-05Sep-05
% Change1 quarter/ Sep-06
CETELEM 53.3 47.4 +12.6% 49.9 +6.8%France (1) 30.9 26.8 +15.3% 28.7 +7.6%Outside France (2) 22.5 20.6 +9.2% 21.2 +5.8%
BNP Paribas Lease Group MT 15.8 15.1 +4.8% 15.6 +1.2%France 10.6 10.8 -2.0% 10.6 -0.4%Europe (ex cluding France) 5.2 4.3 +21.8% 5.0 +4.6%
UCB 32.6 28.0 +16.3% 32.1 +1.6%France (1) 16.1 15.4 +4.7% 16.5 -2.6%Europe (ex cluding France) 16.5 12.6 +30.4% 15.5 +6.0%
Long Term Leasing with Services 6.6 6.1 +8.4% 6.5 +1.7%France 2.1 2.0 +5.8% 2.1 +1.7%Europe (ex cluding France) 4.5 4.1 +9.7% 4.4 +1.6%
ARVAL (in thousands)Financed vehicles 504 469 +7.4% 494 +1.9%included in total managed v ehicles 623 607 +2.7% 618 +0.8%(1) Transfer of E0.9bn from UCB France to Cetelem France (activity of debt consolidation)
(2) Disposal of a subsidiary of LaSer-Cofinoga in 1Q06 (€2.5bn)
Asset Management and ServicesResults 31.12.2006 70
Asset Management & Services
4Q06 4Q05 4Q06 / 3Q06 4Q06 / 2006 2005 2006 / In millions of euros 4Q05 3Q06 2005Revenues 1,142 987 +15.7% 1,064 +7.3% 4,350 3,552 +22.5%Operating Ex penses and Dep. -757 -657 +15.2% -694 +9.1% -2,763 -2,331 +18.5%Gross Operating Income 385 330 +16.7% 370 +4.1% 1,587 1,221 +30.0%Prov isions -3 0 n.s. -6 n.s. -2 -8 n.s.Operating Income 382 330 +15.8% 364 +4.9% 1,585 1,213 +30.7%Non Operating Items 16 1 n.s. -3 n.s. 11 53 n.s.Pre-Tax Income 398 331 +20.2% 361 +10.2% 1,596 1,266 +26.1%
Cost / Income 63.5% 65.6% -2.1 ptAllocated Equity (Ebn) 4.5 3.8 +16.1%Pre-Tax ROE 36% 33% +3 pt

Asset Management and ServicesResults 31.12.2006 71
AMS: Wealth and Asset Management
4Q06 4Q05 4Q06 / 3Q06 4Q06 / 2006 2005 2006 / In millions of euros 4Q05 3Q06 2005Revenues 595 506 +17.6% 517 +15.1% 2,174 1,810 +20.1%Operating Ex penses and Dep. -416 -363 +14.6% -353 +17.8% -1,465 -1,270 +15.4%Gross Operating Income 179 143 +25.2% 164 +9.1% 709 540 +31.3%Prov isions -1 0 n.s. -1 +0.0% -1 0 n.s.Operating Income 178 143 +24.5% 163 +9.2% 708 540 +31.1%Non Operating Items 9 0 n.s. -3 n.s. 7 1 n.s.Pre-Tax Income 187 143 +30.8% 160 +16.9% 715 541 +32.2%
Cost / Income 67.4% 70.2% -2.8 ptAllocated Equity (Ebn) 1.3 1.1 +22.1%Pre-Tax ROE 55% 51% +4 pt

Asset Management and ServicesResults 31.12.2006 72
AMS: Insurance
4Q06 4Q05 4Q06 / 3Q06 4Q06 / 2006 2005 2006 / In millions of euros 4Q05 3Q06 2005Revenues 326 293 +11.3% 318 +2.5% 1,277 1,017 +25.6%Operating Ex penses and Dep. -156 -135 +15.6% -156 +0.0% -599 -481 +24.5%Gross Operating Income 170 158 +7.6% 162 +4.9% 678 536 +26.5%Prov isions -2 0 n.s. -5 n.s. -1 -8 n.s.Operating Income 168 158 +6.3% 157 +7.0% 677 528 +28.2%Non Operating Items 7 1 n.s. 0 n.s. 3 52 n.s.Pre-Tax Income 175 159 +10.1% 157 +11.5% 680 580 +17.2%
Cost / Income 46.9% 47.3% -0.4 ptAllocated Equity (Ebn) 2.6 2.3 +12.7%Pre-Tax ROE 26% 25% +1 pt

Asset Management and ServicesResults 31.12.2006 73
AMS: Securities Services
4Q06 4Q05 4Q06 / 3Q06 4Q06 / 2006 2005 2006 / In millions of euros 4Q05 3Q06 2005Revenues 221 188 +17.6% 229 -3.5% 899 725 +24.0%Operating Ex penses and Dep. -185 -159 +16.4% -185 +0.0% -699 -580 +20.5%Gross Operating Income 36 29 +24.1% 44 -18.2% 200 145 +37.9%Prov isions 0 0 n.s. 0 n.s. 0 0 n.s.Operating Income 36 29 +24.1% 44 -18.2% 200 145 +37.9%Non Operating Items 0 0 n.s. 0 n.s. 1 0 n.s.Pre-Tax Income 36 29 +24.1% 44 -18.2% 201 145 +38.6%
Cost / Income 77.8% 80.0% -2.2 ptAllocated Equity (Ebn) 0.6 0.5 +19.7%Pre-Tax ROE 36% 31% +5 pt
Asset Management and ServicesResults 31.12.2006 74
AMS: Net Asset Inflow and Assets under Management
6
10 9
19.5
€10.9bn
€6.2bn
€19.5bn
Net Asset Inflow 2006€36.9bn
€0.3bn
193.0 226.1
144.8159.4
91.9101.54.5
31.12.05 31.12.06
in € bn
Assets under Management
Net Asset Inflow €36.9bn
Scope, performance, exchange and
others €24.9 bn
429.7
491.5+€61.8bn
Private Banking and Cortal ConsorsAsset Management Insurance Real Estate Services
Asset Management and ServicesResults 31.12.2006 75
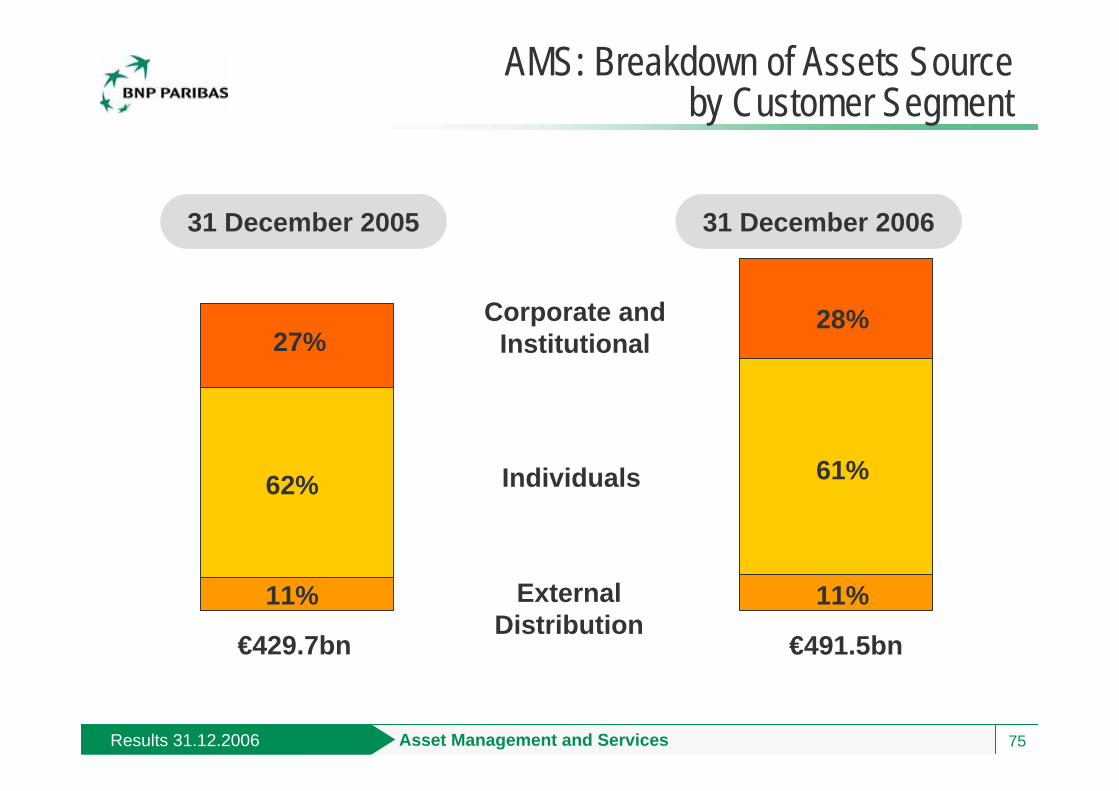
AMS: Breakdown of Assets Source by Customer Segment
Corporate and Institutional
Individuals
External Distribution
€429.7bn €491.5bn
31 December 2005 31 December 2006
11%
27%
62%
11%
28%
61%

Asset Management and Services - Asset ManagementResults 31.12.2006 76
Asset Management:Breakdown of Assets under Management
31/12/0631/12/05
Money Market26%
Equity21%
Diversified13%
Alternative, structured
and Index-based16%
Bonds24%Money Market
27%
Equity18%
Diversified13%
Alternative, structured
and Index-based14%
Bonds28%
€193.0bn €226.1bn
50%45%
Growing share of high value added assetsGrowing share of high value added assets

Corporate and Investment BankingResults 31.12.2006 77
Corporate and Investment Banking
4Q06 4Q05 4Q06 / 3Q06 4Q06 / 2006 2005 2006 / In millions of euros 4Q05 3Q06 2005Revenues 1,904 1,600 +19.0% 1,761 +8.1% 7,859 6,422 +22.4%Operating Ex penses and Dep. -1,004 -926 +8.4% -996 +0.8% -4,397 -3,711 +18.5%Gross Operating Income 900 674 +33.5% 765 +17.6% 3,462 2,711 +27.7%Prov isions 30 -16 n.s. 82 n.s. 253 130 n.s.Operating Income 930 658 +41.3% 847 +9.8% 3,715 2,841 +30.8%Non Operating Items -1 13 n.s. 5 n.s. 42 49 -14.3%Pre-Tax Income 929 671 +38.5% 852 +9.0% 3,757 2,890 +30.0%
Cost / Income 55.9% 57.8% -1.9 ptAllocated Equity (Ebn) 9.4 9.1 +3.9%Pre-Tax ROE 40% 32% +8 ptp
Corporate and Investment BankingResults 31.12.2006 78
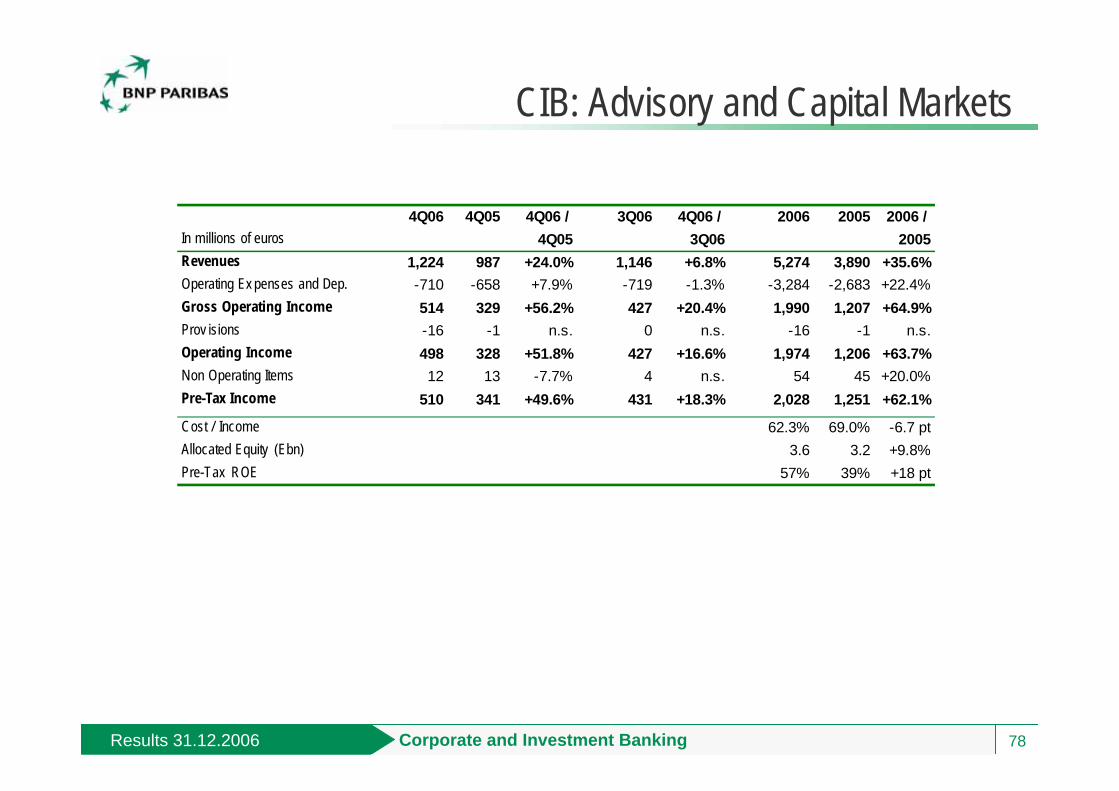
CIB: Advisory and Capital Markets
4Q06 4Q05 4Q06 / 3Q06 4Q06 / 2006 2005 2006 / In millions of euros 4Q05 3Q06 2005Revenues 1,224 987 +24.0% 1,146 +6.8% 5,274 3,890 +35.6%Operating Ex penses and Dep. -710 -658 +7.9% -719 -1.3% -3,284 -2,683 +22.4%Gross Operating Income 514 329 +56.2% 427 +20.4% 1,990 1,207 +64.9%Prov isions -16 -1 n.s. 0 n.s. -16 -1 n.s.Operating Income 498 328 +51.8% 427 +16.6% 1,974 1,206 +63.7%Non Operating Items 12 13 -7.7% 4 n.s. 54 45 +20.0%Pre-Tax Income 510 341 +49.6% 431 +18.3% 2,028 1,251 +62.1%
Cost / Income 62.3% 69.0% -6.7 ptAllocated Equity (Ebn) 3.6 3.2 +9.8%Pre-Tax ROE 57% 39% +18 pt

Corporate and Investment BankingResults 31.12.2006 79
CIB: Financing Businesses
4Q06 4Q05 4Q06 / 3Q06 4Q06 / 2006 2005 2006 / In millions of euros 4Q05 3Q06 2005Revenues 680 613 +10.9% 615 +10.6% 2,585 2,532 +2.1%Operating Ex penses and Dep. -294 -268 +9.7% -277 +6.1% -1,113 -1,028 +8.3%Gross Operating Income 386 345 +11.9% 338 +14.2% 1,472 1,504 -2.1%Prov isions 46 -15 n.s. 82 n.s. 269 131 n.s.Operating Income 432 330 +30.9% 420 +2.9% 1,741 1,635 +6.5%Non Operating Items -13 0 n.s. 1 n.s. -12 4 n.s.Pre-Tax Income 419 330 +27.0% 421 -0.5% 1,729 1,639 +5.5%
Cost / Income 43.1% 40.6% +2.5 ptAllocated Equity (Ebn) 5.9 5.8 +0.6%Pre-Tax ROE 30% 28% +2 pt

Corporate and Investment BankingResults 31.12.2006 80
CIB: Risk Weighted Assets by Type
89.4 98.5 102.0 93.3 97.6 91.7 88.7 92.1
37.540.3 46.7
49.0 48.9 52.4 56.0 54.6
6.15.15.36.46.67.07.0
8.7
1Q05 2Q05 3Q05 4Q05 1Q06 2Q06 3Q06 4Q06
Market RisksCounterparty Risks - Capital marketsCredit Risks - Financing Businesses
in €bn
Risk Weighted Assets - CIB(beginning of period)
+9.2%/4Q05
-1.3%/4Q05
149 149153 153150156146
136

Corporate and Investment BankingResults 31.12.2006 81
VaR (1 day - 99%) by Type of Risk
-28-21 -23
-35-25 -31
-23 -22 -24 -30 -27 -30 -28 -29-37
-45
13 14 12 15 11 14 17 1220 13 16 18 22
1614
1828
1415
1115 13
14
1815
11
17
1914
922
21
2
241826
25
43
23
621
12
17
1413
14
3
2
2
21
2
32
34
2 4
13
2
3
4
3
233
3
2 2 5
4 4
4
5
22
26 27
54
3431
40
26
2125 25
2323 2021 21 25
31.0
3.03
30.0
6.03
30.0
9.03
31.1
2.03
31.0
3.04
30.0
6.04
30.0
9.04
31.1
2.04
31.0
3.05
30.0
6.05
30.0
9.05
31.1
2.05
31.0
3.06
30.0
6.06
30.0
9.06
31.1
2.06
Commodities
Change andothers
Equities
Interest Rate
Credit
Netting
AverageQuarterly VaR
In millions of euros
Total
Introduced credit risk in 4Q03, which was previously included and offset in interest rate risks(Diagram: data from the last market trading date of the period)
23 38 22 22 25 28 27 19 19 36 25 28 16 19 21 20
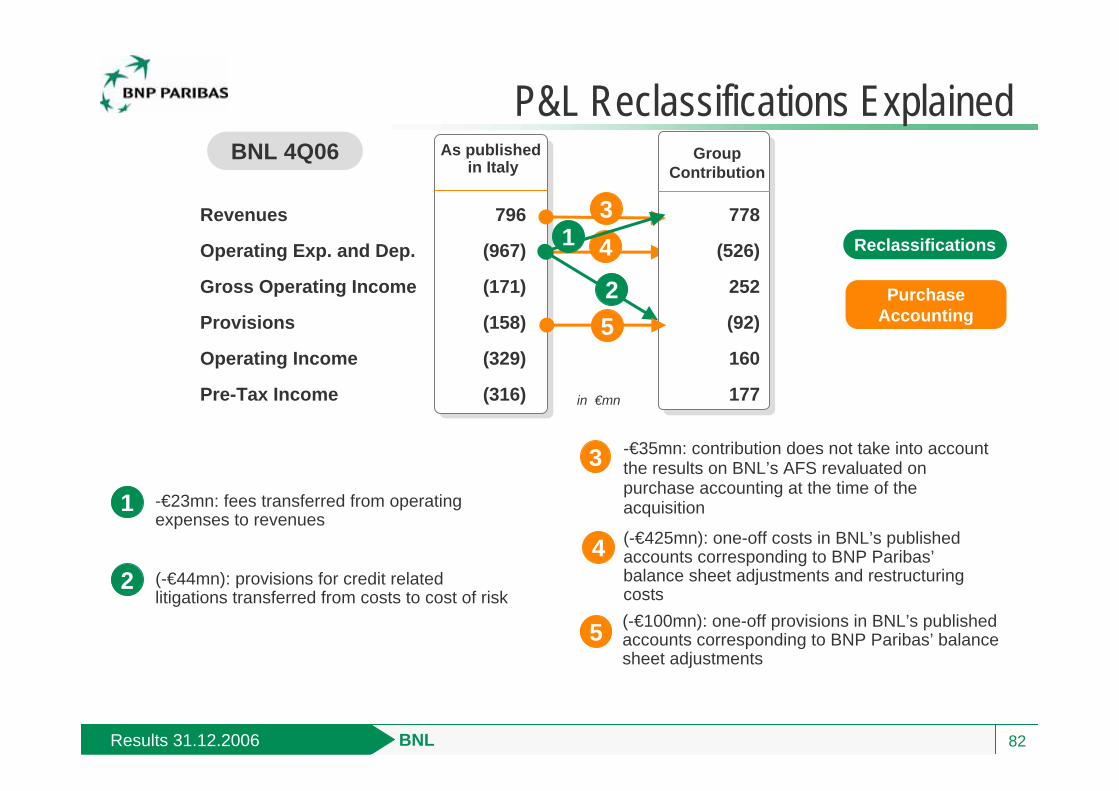
BNLResults 31.12.2006 82
P&L Reclassifications Explained
Revenues
Operating Exp. and Dep.
Gross Operating Income
Provisions
Operating Income
Pre-Tax Income
As published in Italy
GroupContribution
796
(967)
(171)
(158)
(329)
(316)
778
(526)
252
(92)
160
177
(-€44mn): provisions for credit related litigations transferred from costs to cost of risk
BNL 4Q06
2
2
3 -€35mn: contribution does not take into account the results on BNL’s AFS revaluated on purchase accounting at the time of the acquisition
4
(-€425mn): one-off costs in BNL’s published accounts corresponding to BNP Paribas’balance sheet adjustments and restructuring costs
4
(-€100mn): one-off provisions in BNL’s published accounts corresponding to BNP Paribas’ balance sheet adjustments
5
Reclassifications
3
Purchase Accounting
in €mn
1
-€23mn: fees transferred from operating expenses to revenues
1
5
BNP Paribas GroupResults 31.12.2006 83
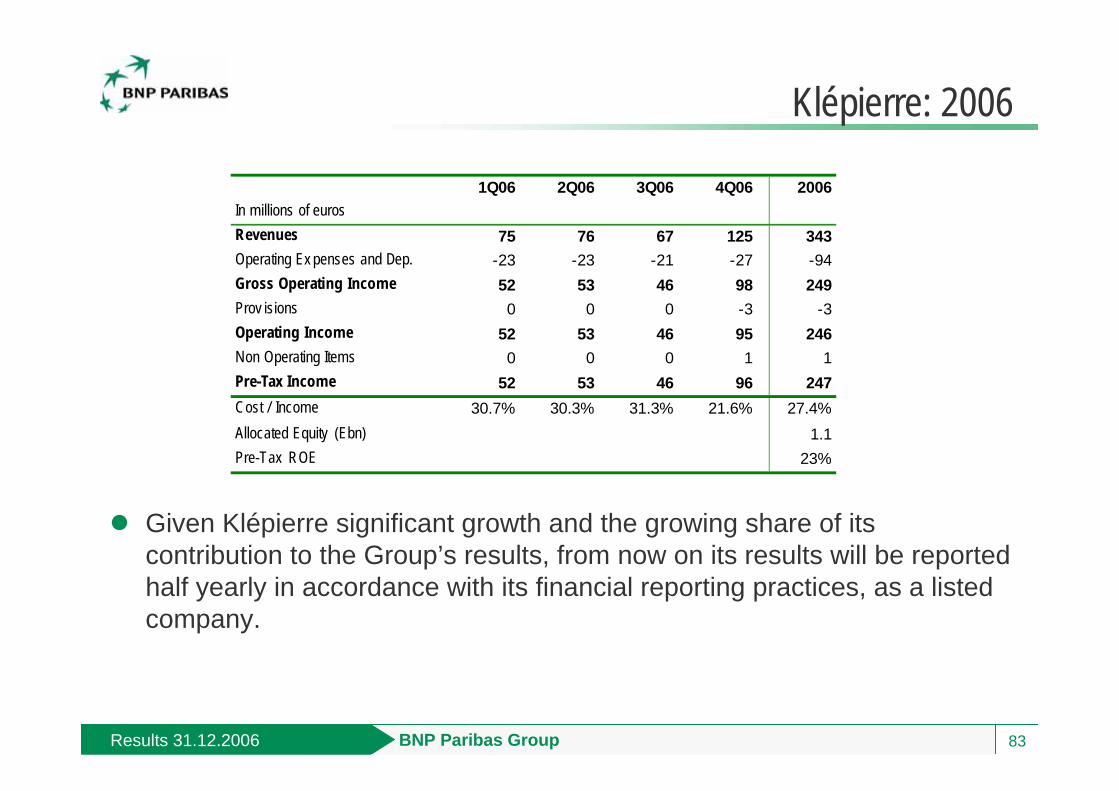
Klépierre: 2006
Notations Given Klépierre significant growth and the growing share of its contribution to the Group’s results, from now on its results will be reported half yearly in accordance with its financial reporting practices, as a listed company.
1Q06 2Q06 3Q06 4Q06 2006In millions of eurosRevenues 75 76 67 125 343Operating Ex penses and Dep. -23 -23 -21 -27 -94Gross Operating Income 52 53 46 98 249Prov isions 0 0 0 -3 -3Operating Income 52 53 46 95 246Non Operating Items 0 0 0 1 1Pre-Tax Income 52 53 46 96 247Cost / Income 30.7% 30.3% 31.3% 21.6% 27.4%Allocated Equity (Ebn) 1.1Pre-Tax ROE 23%
84
Results as at 31 December 2006BNP Paribas
15 February 2007