(bmp) light!no surw stuw - dtic
TRANSCRIPT

r (BMP) LIGHT!NO SURW STUW
AT TUB
CORPUS MS ANM9 DBPOT counts cmtisti, routs
FIHAL REPORT
19971021 330
US Army Corps of Engineers Fort Worth Division
tp sy
N0ITT20UANS. INC. COHSULTIHC EHGIHEERS
fön mm, texts
4/S/9S
L jmßmünoi i a 'i^-^MzM u
jv Austin-»- tea p^te safefffT1 *i;

DEPARTMENT OF THE ARMY CONSTRUCTION- ENGINEERING RESEARCH LABORATORIES, CORPS OF ENGINEERS
P.O. BOX 9005 CHAMPAIGN. ILLINOIS 618:6-9005
REPLY-TO ATTENTION OF: J.R..J Library
17 Sep 1997
Based on SOW, these Energy Studies are unclassified/unlimited.
Distribution A. Approved for public release.
Marie Wakef^eld, Librarian^Engineering
(EEAP) Lighting Survey Study at the
Corpus Christi Army Depot Corpus Christi, Texas
FINAL REPORT April 5, 1995
TABLE OF CONTENTS
I. EXECUTIVE SUMMARY 1 A. Introduction 1 B. Buildings Studied 1 C. Present Energy Consumption 2
Base Year Energy Consumption 2 Lighting Energy Consumption . . 2
D. Energy Conservation Opportunity (ECO) Analysis 2 ECOs Rejected 2 ECOs Recommended 3 ECOs Not Recommended 4 Recommended Maintenance & Operations Practices 5
E. Energy And Cost Savings 6 ^ Total Potential Energy and Cost Savings 6
Energy Use and Costs Before and After 6 Percentage Saved 6
II. NARRATIVE REPORT 7 A. Entry Interview 7
Work Plan 7 Data List 7 ECO List 7
B. Data Collection 8 Building Data 8 Lighting Data 9 Maintenance Data 9 Utility Data 10
C. Plan To Implement Projects 11 Project 1 11 Project 2 12 Project 3 12
APPENDICES A. Energy Cost Analysis B. Detailed Calculations C. Data Forms BTxy QR52ITF USarTfrvrr-.-T
^ D. Recommended ECO Calculations f E. Non-Recommended ECO Calculations
F. (EEAP) Lighting Study Survey - Scope Of Work and Review Comments G. Sample Products
y'TJTr.r-ijrrrv-,,

)
>
I. EXECUTIVE SUMMARY
A. Introduction
This energy conservation study was performed by Huitt-Zollars Inc, for the U.S. Army Engineer District (USAED), Fort Worth, under contract number DACAC63-94-D-0015. The study was conducted at Corpus Christi Army Depot (CCAD) in Corpus Christi, Texas, between October 3, 1994 and April 5, 1995. The site survey and data collection was performed by CA. Pieper, P.E. and Tom Luckett, Lighting Designer.
The purpose of the study was to perform a limited site survey of specific buildings at the facility, identify specific Energy Conservation Opportunities (ECOs) that exist, and then evaluate these ECOs for technical and economic feasibility. These ECOs were limited to building interior lighting and it's effects on the heating, ventilating and air conditioning (HVAC) systems.
This survey was conducted with the assistance of many individuals at the facility, both CCAD and Navy staff. Special thanks are extended to all of them, including the following individuals:
Adan Pena, Energy Coordinator, CCAD
Albert Martinez, Electrical Engineering Technician, CCAD
Scott Hinte, Mechanical Engineer, CCAD
Roy Arispe, Maintenance Supervisor, CCAD
Park Lee, Mechanical Engineer, Naval Air Station
Any questions concerning this report should be directed to the Project Manager, CA. Pieper, P.E., at Huitt-Zollars Inc., 512 Main Street, Suite 1500, Fort Worth, Texas 76102. Phone 817-335- 3000.
B. Buildings Studied
The buildings included in this study and their total building areas are listed below:
Building 8 - 1,214,055 sqft
Hangar 43 - 106,039 sqft
Hangar 44 - 95,072 sqft
Hangar 45 - 95,072 sqft
Hangar 47 - 106,039 sqft
In building 8, only the offices which had pendent mounted fluorescent lights in the administrative areas, and high output fluorescent lights in the production areas, as well as the large and small hangar areas were included in this study. Although certain lighting ECOs existed in other areas of the building, the scope of work limited the analysis to the areas mentioned previously. See page F-12 for details. Maps of the buildings and areas studied are shown on pages C-10 through C-17.

)
)
C. Present Energy Consumption
Base Year Energy Consumption: The total metered electrical and steam consumptions for 12 consecutive months, prior to this study, were obtained from the facility and are referred to as the Tiase year'. These data are shown on page 10 and are summarized as follows:
Electrical 52.930 MWH
Steam 115.744 MLBS
Lighting Energy Consumption: The present annual lighting energy consumption (HVAC not included) for the building areas studied was calculated on page B-2 as follows:
Lighting Energy 2,598,077 KWH
4.9% of base year total
D. Energy Conservation Opportunity (ECO) Analysis
ECOs Rejected: After reviewing the data collected at the facility and considering all of the practical limitations involved, certain potential ECOs were rejected prior to performing calculations. These ECOs are summarized below with their reasons for rejection.
1. Remove Lamps or Fixtures: This ECO was rejected because no areas were found that had excessive amounts of lighting, or where painting walls alone would improve light levels enough to reduce the quantity of lamps or fixtures. Lowering the fixtures in some of the production areas was possible, but the expense would not be justifiable because of the age and inefficiency of the old direct/indirect fixtures. It would make more sense to just install newer, more efficient fixtures at a lower height. See ECOs Recommended.
2. Install Additional Switches in Large Areas, Turn Lights Off: Most of the production areas and all of the office areas were evenly occupied during working hours, and the addition of extra switches for groups of lights in a large area would not allow lights to be turned off. Those areas that had irregular or intermittent occupancy were considered for adding occupancy sensors to turn off lights. See ECOs Recommended.
3. Replace Incandescent Fixtures, Reduce Lighting Wattage: Very little if any incandescent lighting is present in CCAD buildings, and the areas studied were directed specifically at the areas with fluorescent or high bay HID fixtures.
4. Install Fluorescent Reflectors in Existing Fixtures: This ECO requires installing the polished silver reflectors into 4 lamp fluorescent fixtures and then removing 2 lamps and a ballast. While this cuts the fixtures energy consumption in half, it also drops the lumen output from the fixture by at least 1/3, based on IES tests. Therefore, an area must be overlighted by at least 33% in order to maintain acceptable light levels. Very few areas were found that could meet this criteria.
5. Replace Exit Signs With Low Wattage Signs: There are many different types of exist signs at CCAD, and many are not illuminated. Because there appears to be no stringent requirement for illuminated exit signs at the facility, any uniform replacement of the existing signs with low wattage illuminated signs would likely increase the lighting energy consumption. However, all new exit sign installations should be standardized to

use only low wattage LED or fluorescent types, rather than the incandescent type.
6. Install Compact Fluorescent Lamps in Incandescent Fixtures: These new compact fluorescent lamps can be easily replaced at a later time with inefficient incandescent lamps, therefore eliminating the benefit of any lamp retrofit project. Since the longevity of this energy conservation retrofit cannot be guaranteed, this potential ECO has been rejected.
ECOs Recommended: Certain ECOs which were identified during the building survey have been evaluated for technical and economic feasibility and are recommended for implementation. Complete documentation of all calculations as well as information required for implementation is included in Appendix D. These recommended ECOs are summarized below in order of descending Savings to Investment Ratio (SIR).
ECO D-l: Provide Motion Sensor Controls For Production Storage Areas of Building 8.
>
Electrical Energy Savings 76,789 KWH/yr Steam Energy Penalty 0 klb/yr Total Energy Savings 262.08 MMBTU/yr Total Cost Savings 5,779 $/yr Total Investment 4,358 $ Simple Payback 0.7 yrs SIR 20.44
ECO D-2: Provide Daylighting Controls For Large Hangar in Buildir
Electrical Energy Savings 63,936 KWH/yr Steam Energy Penalty 0 klb/yr Total Energy Savings 218.2 MMBTU/yr Total Cost Savings 3,879 $/yr Total Investment 10,393 $ Simple Payback 2.7 yrs SIR 5.81
ECO D-3: Provide Daylighting Controls For Repair Hangars 43, 44,'
Electrical Energy Savings 226,759 KWH/yr Steam Energy Penalty 0 klb/yr Total Energy Savings 773.3 MMBTU/yr Total Cost Savings 13,757 $/yr Total Investment 41,573 $ Simple Payback 3.0 yrs SIR 5.16
)

ECO D-5: Replace Fluorescent Lighting In Production Areas of Building 8
Electrical Energy Savings Steam Energy Penalty Total Energy Savings Total Cost Savings Total Investment Simple Payback SIR
ECO D-4:
Electrical Energy Savings Steam Energy Penalty Total Energy Savings Total Cost Savings Total Investment Simple Payback SIR
686,616 KWH/yr 830.7 klb/yr
1,597.5 MMBTU/yr 54,131 $/yr
477,286 $ 8.8 yrs
1.74
;nt Lighting In Admini
48,052 KWH/yr 53.8 klb/yr
115.7 MMBTU/yr 3,147 $/yr
29,424 $ 9.3 yrs
1.66
)
ECOs Not Recommended: Certain ECOs which were identified during the building survey have been evaluated for technical and economic feasibility but are not recommended for implementa- tion. Complete documentation of all calculations are included in Appendix E. These non-recom- mended ECOs are summarized below in order of order of descending SIR.
ECO E-l: Install Electronic Ballasts and Energy Savings Lamps In Fluorescent Fixtures
Electrical Energy Savings Steam Energy Penalty Total Energy Savings Total Cost Savings Total Investment Simple Payback SIR
409,466 KWH/yr 478.9 klb/yr
1397.5 MMBTU/yr 17,651 $/yr
407,015 $ 23.0 yrs 0.69
Because of the extremely long payback period, it is recommended to simply replace them with more efficient fixtures, (see ECOs D-4 and D-5)
ECIP Projects Developed. The facility decided not to submit any projects for ECIP funding. All projects will be submitted for funding as Non-ECIP projects.
Non-ECIP Projects Developed. The following projects will be submitted for funding as Non-ECIP projects:
■>

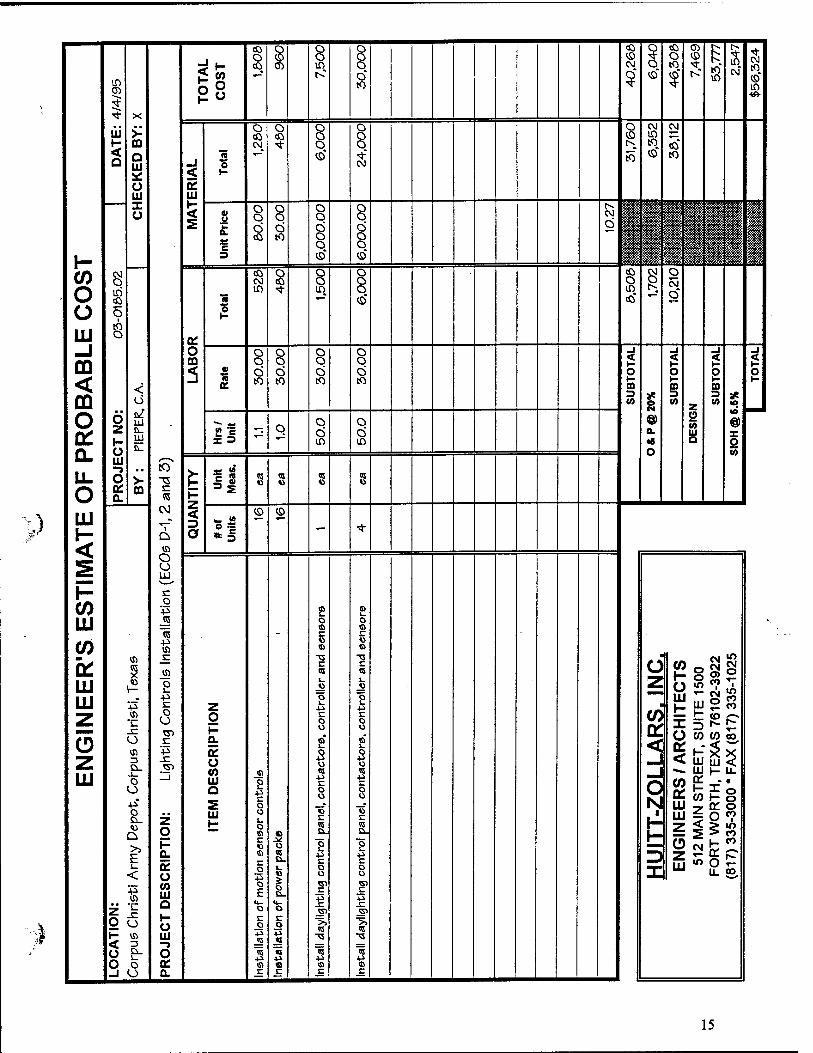
Project 1. Lighting Controls Installation (ECOs D-l, 2, 3)
Electrical Energy Savings 367,484 KWH/yr Steam Energy Penalty 0 klb/yr Total Energy Savings 1,254 MMBTU/yr Total Cost Savings 23,415 $/yr Total Investment 56,324 $ Simple Payback 2.4 yrs SIR 6.46
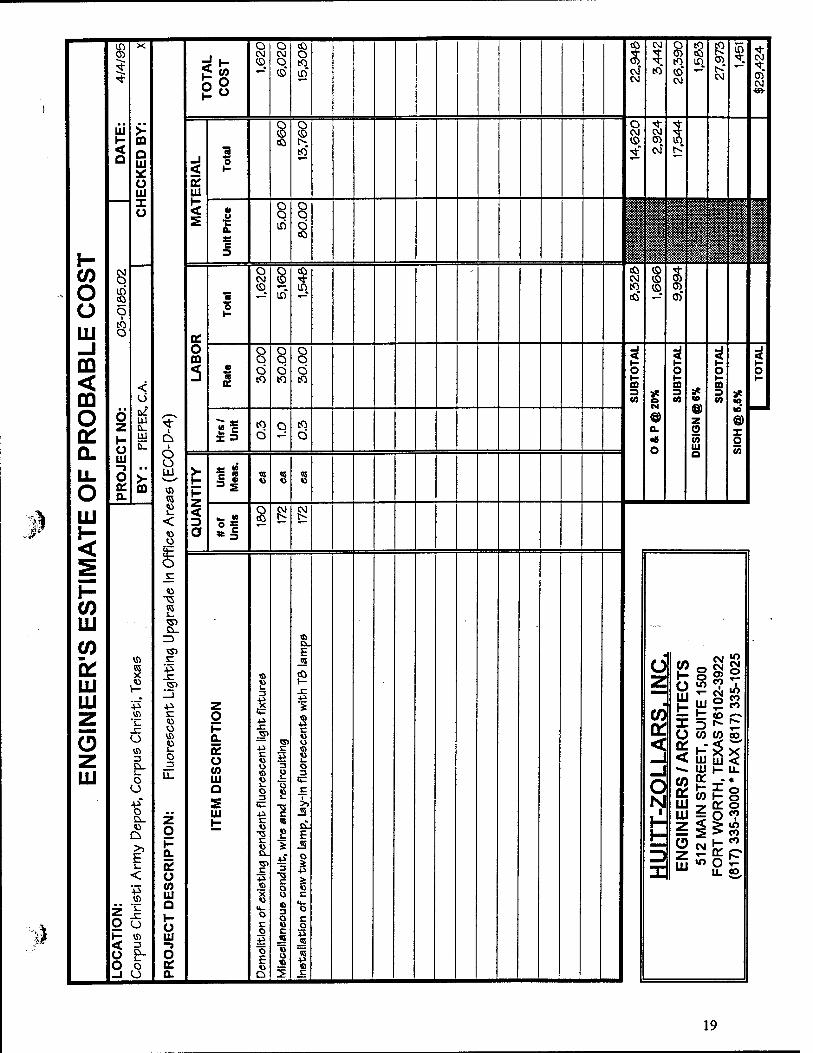
Project 2. Fluorescent Lighting Upgrade in Office Areas (ECO D-4)
Electrical Energy Savings 48,052 KWH/yr Steam Energy Penalty 53.8 klb/yr Total Energy Savings 115.7 MMBTU/yr Total Cost Savings 3,147 $/yr Total Investment 29,424 $ Simple Payback 9.3 yrs SIR 1.66
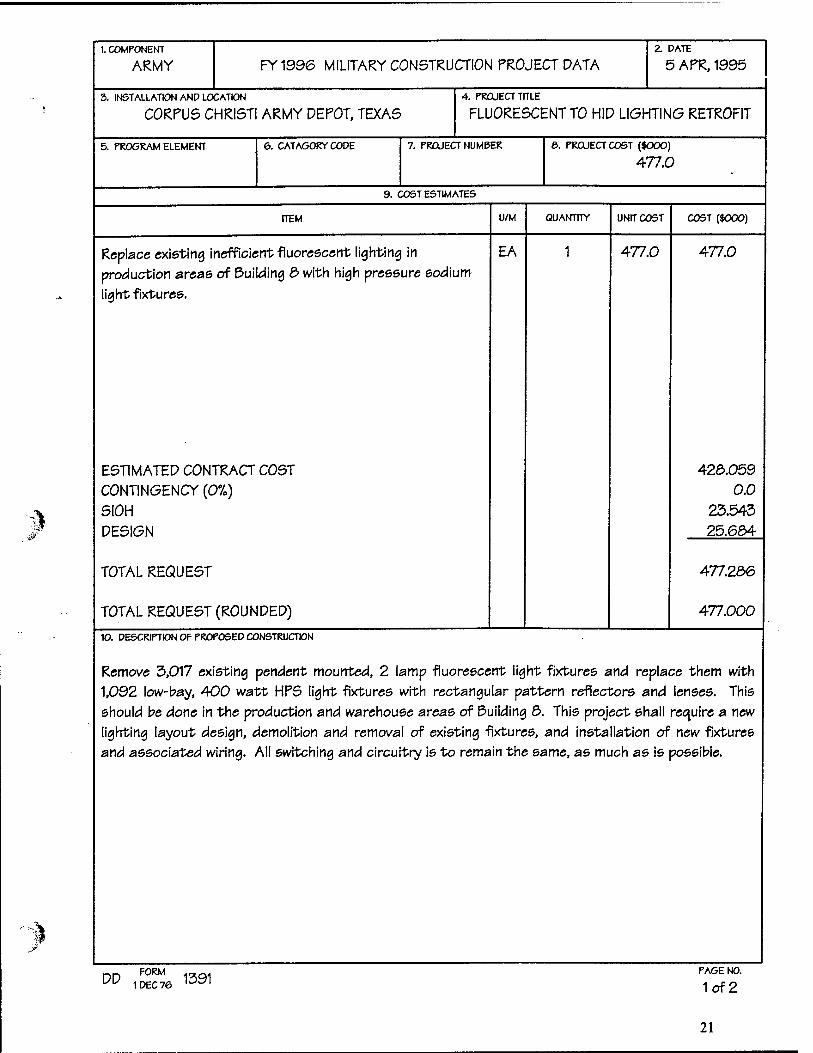
Project 3. Fluorescent Lighting Replacement With HID in Production Areas (ECO-5)
Electrical Energy Savings 686,616 KWH/yr Steam Energy Penalty 830.7 klb/yr Total Energy Savings 1,597.5 MMBTU/yr Total Cost Savings 54,131 $/yr Total Investment 477,286 $ Simple Payback 8.8 yrs SIR 1.74
Recommended Maintenance & Operations Practices: Although CCAD is generally doing a good job of maintaining lighting energy efficiency, the following maintenance and operations (M&O) practices are recommended to help conserve lighting energy at the CCAD.
1. The Energy Coordinator should work together with the CCAD Director of Public Works to develop a Standard Specification for all future lighting repair and renovation projects. All facility lighting designers, as well as the lighting maintenance contractors, should be required to follow this specification. The energy coordinator should review all new lighting designs to check for compliance with the specifications. This will help to eliminate the inadvertent use of inefficient lighting systems at the facility.
2. Facility lighting designers should obtain and use published design lighting levels for all lighting renovation projects or new installations. This will help to eliminate overlighting.
3. The installation of new incandescent lighting should be prohibited. More efficient sources should be used in all cases.
J 4. The energy coordinator should direct considerable energy conservation efforts towards the
production processes using electrical and steam energy, as these are the largest areas of potential savings. See page 10, Utility Data, for more details.

5. The energy coordinator should attend training seminars for building energy managers, whenever possible, such as those listed in Appendix G.
E. Energy And Cost Savings
Total Potential Energy and Cost Savings. The calculated energy and cost savings from the implementation of all 3 projects is as follows:
Electrical Energy Savings 1,102,152 KWH/yr Steam Energy Penalty 884.5 klb/yr Total Energy Savings 2,967 MMBTU/yr Total Cost Savings 80,693 $/yr Total Investment 563,034 $ Simple Payback 6.9 yrs
Energy Use and Costs Before and After. Based on the base year electrical and steam energy consumptions and costs shown on page 10, and the calculated total potential savings above, the CCAD energy and usage and costs before and after implementation of the 3 Non-ECIP projects is as follows:
)
Before After
Electrical 52.930 MWH 51.827 MWH
Steam 115.7 MLBS 116.6 MLBS
Total Cost 4,422,942 $ 4,342,249 $
Percentage Saved. Based on the base year electrical and steam energy consumptions and costs, the percentage of savings from the 3 projects is as follows:
Electrical Energy Saved = 1.102 MWH 52.930 MWH
= 2%
Steam Energy Penalty = 0.884 MLBS 115.7 MLBS
0.8%
Energy Cost Savings = 80,693 $ 4,422,942 $.
= 1.8%

II. NARRATIVE REPORT
A. Entry Interview
)
Work Plan: An entry interview meeting was con- ducted at the Corpus Christi Army Depot (CCAD) facility on October 3,1994. Present at the meeting were representatives of Huitt Zollars Inc., C.A. Pieper, Project Manager, and Tom Luckett, Lighting Designer, as well as representatives from CCAD, Adan Pena, Energy Coordinator, Scott Hinte, Mechanical Engineer, and Albert Martinez, Electrical Engineering Technician. At that time, a description of the work plan for this study was pre- sented. The work plan was a summary of the individual tasks to be performed to complete the lighting survey and the approximate date that each task was to begin. Each step of the work plan was work plan is shown in Figure 1.
Figure 1. Woik Plan
10/3/94/: EntryInterviewMeeting
10/3/94 Lighting & Building Data Collection
10/10/94 Perform ECO Calculations
: 11/16/94: Interim Findings Submittat
1/27/95 Pre-Final Report Submittat
3/29/95 Final Report Submittal
described in detail to the CCAD staff. The
Figure 2. Data Acquisition List
1. Existing lighting systems in buildings.
2. Existing light levels in buildings.
3. Building HVAC system efficiencies and operational hours.
4. Building size, age and remaining useful life.
Existing lighting operational periods and area usage.
Facility electricity; gas, other utility rates.
Facility electricity, gas, other utility consumptions.
Utility company rebate programs.
Past lighting energy conservation projects.
Proposed or planned lighting energy conservation projects.
5-
6.
7.
8.
9.
\6
Data List: After discussing the work plan, the CCAD staff was presented a list of data items to be collected by the study team, shown in Figure 2. This list was a summary of the information re- quired by the surveyors. The study team and CCAD staff dis- cussed the methods by which all of the data on the list were to be obtained. The data concerning the existing lighting systems and light levels were to be collected from the buildings or areas stud- ied and recorded onto preprinted data forms. All other data were to be obtained from the facility personnel responsible for each item. The CCAD personnel pro- ^^^^^^^^^^^^^^^^^^^^^^^^^^^^^^^ vided useful information on past energy conservation efforts, as well as any ongoing or future planned energy conservation measures. Also, they provided direction as to where to obtain other information on the list. Any security passes that the survey- ors needed to gain access to the facility were discussed and plans were made to obtain them.
ECO List: Following the discussion on the data list, the CCAD personnel were presented a list of specific Energy Conservation Opportunities (ECOs) that the surveyors were looking for. It in- cluded three general ways to conserve on lighting energy. The first method reduces lighting energy consumption by simply removing lamps or fixtures from areas which are currently overlighted or which could be modified to reduce the need for the existing quantity of lights. Light levels were to be measured by the surveyors and compared with design standards to
; 11. Typical lighting maintenance procedures, costs and materials, i
12. Typical lighting retrofit procedures.

determine whether or not an area lights off with additional switches, motion sensors or daylight sensors. Areas which were partially or intermittently unoccupied, or which had suffi- cient daylight from windows or skylights were to be located by the surveyors. The third method saves energy by reducing the wattage of the existing light source. The surveyors were to look for inefficient light sources within the buildings. These three general energy conservation strategies were discussed in detail with the CCAD staff, who provided feedback on potential applications at their facilities. The ECO list is shown in Figure 3.
was overlighted. The second method saves energy by turning
Figure 3. Energy Conservation Opportunity (ECO) List
1. Reduce / Enhance Lighting: Remove Lamps and or Fixtures.
a) Overlighted areas
b) Increase daylighting
c) Lower fixtures
d) Paint walls and ceiling light color.
2. Improve Lighting Controls: Tum Lights Off.
■a) Occupancy sensors
b) Additional switches in large areas
3. Improve Lighting Efficiency: Reduce Lighting Wattage
a) Replace incandescent source with more efficient source
b) Install more efficient lamps /ballasts /reflectors
■;•;!:■;;^Replace existing HID with more efficient HID source
B. Data Collection
Building Data: This lighting study at the CCAD was conducted on five (5) buildings, four of them stand alone hangars and the other one a large production and warehouse building with administrative offices. All of the buildings are located at the Corpus Christi Naval Air Station in Corpus Christi, Texas. The navy operates the base and provides the utilities, consisting of electricity, natural gas, water and steam, to the CCAD facilities. The CCAD does however provide it's own facility maintenance with permanent personnel, located in building 8. Mechanical cooling at CCAD is provided by electricity and heating is provided by steam. The Navy purchases the electrical power from the local utility company Central Power and Light (CP&L), and back charges CCAD for it's metered usage. Similarly, they purchase natural gas from the City of Corpus Christi Gas Department and produce steam at a large central boiler plant. The Navy meters CCAD's steam consumption and bills them monthly for they're usage. An analysis of these charges is included in Appendix A.
Included in this study were large portions of Building 8, which is actually comprised of several connected building additions and covers a total of 1,214,055 sqft, including a large hanger, small hangar, machine production areas, engine test facilities, warehouse areas and administrative offices. This building serves as the administrative headquarters for CCAD, as well as a helicopter maintenance facility, 4 days per week, 10 hours per day. The work day is typically from 6:45 am until 5:15 pm. The original portion of the building was constructed around 1942, and the entire facility is expected to be used at least 30 more years.
The exterior doors in the large hangar area and upper portions of some exterior walls in the small hangar area have large glass areas which allow natural light to enter the building. The large hangar doors remain open during the workday, except in inclement weather, and allow much natural light to enter the building.
All of the administrative areas in building 8 are cooled, along with large portions of the production area. Heating is provided for the entire building. The HVAC systems consisted of
8

)
modular air handling units with chilled water and steam coils, distributed throughout the building. In production areas without cooling, steam fan coil units are used to provide heating. The primary cooling systems consist of a central chiller plant operated by CCAD staff, distributing chilled water through a loop in the building. The steam for heating is provided from the building's steam piping loop, which is served by the base steam distribution system.
Hangars 43 and 47 had nearly identical floor plans and each covered approximately 106,039 sqft. Similarly, hangers 44 and 45 had nearly identical floor plans and each covered approximately 95,072 sqft. All of these hangars are currently used as helicopter repair facilities, 4 days per week, 10 hours per day. They are all well maintained buildings which were constructed around 1942 and are expected to be used by CCAD for approximately another 30 years. The hangars have no cooling in the high bay areas but do have steam fan coil units for heating.
The hangars have large sliding doors on opposite sides which remain open during the workday, except in inclement weather. These doors, as well as the upper portions of the exterior hangar walls, have large window areas which were originally provided to allow natural light to enter the building. The glass in these areas has since been replaced by translucent panels, which allow some daylight into the hangar, but less than the original glass would.
Lighting Data: In order to collect the existing lighting data, the walk through of the buildings was performed. This walk through covered Hangars 43, 44, 45 and 47, as well as production and office areas within building 8. The total area covered by the surveyors was approximately 1,616,277 sqft. During the walk through, the auditors went room by room, recording the quantity and type of existing lighting systems, measured average light levels, and potential ECOs available. These data were recorded onto the data forms included in Appendix C. Building maps are also included in Appendix C, which show room numbers corresponding to those listed on the data forms. This will allow the facility staff, as well as the study team, to readily identify the existing lighting conditions anywhere in the buildings or areas studied.
Lighting in Building 8 consists of aging fluorescent fixtures, mostly all pendent mounted, throughout the production areas as well as the office areas. Most of these older fixtures are combination direct/indirect fixtures, which allow a portion of the light to reflect off of the ceilings. In production areas, these 8' fluorescent strip fixtures are mounted approximately 14' above the floor, and require high output lamps to produce acceptable lighting levels. The newer production areas, as well as the large hangar, are lighted with high pressure sodium fixtures. The study excluded most areas with modern lighting and generally concentrated on the areas with the older lighting. However, the large hangar was included because of it's potential for daylighting. In Hangers 43, 44, 45 and 47, lighting in the high bay areas is provided by 400 W high pressure sodium fixtures, approximately 266 per hangar. This lighting is currently operated during the entire work day, which runs from 6:45 am until 5:15 pm. The total annual lighting energy consumption for the areas studied was calculated at 2,598,077 KWH, see Appendix B.
Maintenance Data: Lighting maintenance at CCAD is difficult due to the size of the facility, the number of light fixtures, and the reduced size of the maintenance staff. Many lights remain burned out for several weeks in some areas, and relamping takes place on a spot basis. Many areas have very old fluorescent lighting which should be replaced whenever possible.
The facility energy coordinator is involved in most of the building maintenance and renovation projects and has directed mat all lighting projects use the latest, most efficient light source available. The maintenance staff has started stocking F34T12 and F32T8 fluorescent lamps in an effort to reduce energy consumption. Motion detectors to control lighting were once tried in the restrooms, but problems were encountered with lights going off while the rooms were still

occupied. Also tried was an HID dimming system in one of the hangars, but it never operated properly. No other lighting energy conservation projects were planned at the time of this report. The Energy Coordinator should work together with the CCAD Director of Public Works to develop a Standard Specification for all future lighting repair and renovation projects. This will eliminate the inadvertent use of inefficient lighting systems at the facility.
Figure 4. CCAD Base Year Energy and Cost Data
)
Billing Period
Electrical Steam
Consumption Cost Consumption Cost
MWH $ MLBS $ AUG 5.004 293,518 6.502 67,947
SEP 6.184 303,994 6.684 69351
OCT 4.356 255.633 8.869 92,680
NOV 4.675 274305 10.885 113,749
DEC 2.868 168,579 13.381 139333
JAN 3.828 224,724 14.947 179367
FEB 3.584 210,492 13.227 158,721
MAR 4.314 253,150 11.363 136350
APR 3.816 224,044 6.464 77369
MAY 4.963 291,117 7.337 88,040
JUN 5.309 311,336 8.469 101,628
JUL 5.029 294,926 7.616 91389
Total 52.930 3,105,818 115.744 1317,124
Figure 5. CCAD Electrical Usage 1993-94
Utility Data: A 12 month utility billing history was obtained from the energy coordinator which covered the period from August, 1993 through July, 1994. This history included all of the metered electric and steam consumption for all the CCAD facilities and is shown in Figure 4. The total cost of electricity for the base year was $3.1 million and the total cost for steam was $1.3 million.
Charts of the base year energy usages were plotted and are shown in Figures 5 and 6. These charts give a visual representation of the energy usage patterns for the year. Looking at Figure 5, it can be seen that the electrical usage almost never falls below 3.5 MWH per month. This is considered a "baseline1 of electrical energy use. It can be assumed that all energy usage above this baseline is consumed by heating and cooling systems, based on the peaks and the months in which they occur. Therefore, the baseline would include all lighting as well as all of the process energy usage. Considering that the calculated lighting energy consumption for the buildings and areas studied amounts to only 0.2 MWH per month, it is reasoned that the process electrical energy usage makes the greatest contribution to the baseline of 3.5 MWH per month. Since this process energy usage appears to be so much greater than that for lighting, the potential for process energy savings is considered very great. Therefore, is recommended that the energy coordinator direct considerable conservation efforts to process energy usage.
This same observation can be made about steam energy usage, shown in Figure 6. The baseline usage here is around 6.5 Mlbs of steam per month. Since steam is the primary source of heating at CCAD, the obvious peak during the winter months can be considered heating energy.
10

0
Therefore, all steam energy usage below the baseline is used for the manufacturing processes. This is a tremendous amount of energy usage and should be considered a large target for potential energy savings.
Figure 6. CCAD Steam Usage 1993-94 The utility rates for fiscal year 1994, charged by the Navy for CCAD electricity and steam, were obtained and are included in Appendix A. The current cost for electricity is $0.0585 per KWH with no demand charge, and $0.012 per pound for steam. These rates are reviewed quarterly and adjusted if the Navy decides it to be necessary. These rates are based on the Navy's costs for purchasing electricity and gas from the local utility companies, and includes maintenance costs for distribution equipment as well as steam production costs.
There is currently no rebate available from the CP&L Co. for lighting energy conservation projects.
C. Plan To Implement Projects:
The analysis of all potential lighting ECOs at the facility has been completed and the grouping of individual ECOs into projects has been determined. These were detailed previously in the Executive Summary. Below is an abbreviated plan for implementation of the recommended projects.
Project 1: The forms DD-1391, cost estimate and associated life cycle cost analysis summary sheet for this project are provided on pages 13 to 16. These are to be submitted for project funding, along with the calculations in Appendix D if required. The recommended plan to implement this project after funding is obtained is as follows:
A. Install approximately 16 ceiling mounted motion sensors in various production storage areas of Building 8 (ECO D-l). These areas are identified on the building maps on pages C-10 and C-12 as room numbers 100, 101, 102, 105, 107, 108 and 131. First, a lighting controls sales representative should be consulted to determine the proper type and quantity of occupancy sensor to be used in each area. Information from a typical occupancy sensor manufacturer is included in the Appendix G. The sensors should most likely be the ceiling mounted type and cover 2,000 sqft of area in a 360° pattern. Once this is determined, contract documents, including engineering drawings and specifications should be produced in order to select a contractor and ensure that the final installation is acceptable. The designer should check the circuiting of the existing 8' fluorescent light fixtures and modify as required to allow the new sensors to turn off the lights during unoccupied periods. After the contract documents are produced and reviewed, then a contract for the work can be obtained.
B. Install 4 photocell sensors and 1 relay panel in the large hangar of Building 8 (ECO D-2). Again, a lighting controls sales representative should be consulted in order to determine
11

the best hardware and software to be used at this facility for this specific application. Typically, the sales representative will furnish a equipment specification to be used by the contractor during construction. A sample specification for this application is provided in Appendix G. Once this is determined, contract documents, including engineering drawings and specifications should be produced in order to select a contractor and ensure that the final installation is acceptable. The designer should ensure that the relays will operate off of a signal from photocell sensors. He should recircuit the 300 existing 400W HPS light fixtures to allow the new relays to turn off 3/4 of the lights in each quadrant, while leaving 1/4 of the lights on. The on/off setpoint of the relays should be adjustable from the relay panel. After the contract documents are produced and reviewed, then a contract for the work can be obtained.
C. Install 4 photocell sensors and 1 relay panel in each of hangars #43, 44, 45 and 47 (ECO D-3). This portion should be implemented in a similar manner to part B above. The designer should recircuit the 266 existing 400W HPS light fixtures in each hangar to allow the new relays to turn off 3/4 of the lights in each quadrant, while leaving 1/4 of the lights on. Relays should operate off of a signal from the photocell sensors. The on/off setpoint of the relays shall be adjustable from the relay panels. After the contract documents are produced and reviewed, then a contract for the work can be obtained.
Project 2: The forms DD-1391, cost estimate and associated life cycle cost analysis summary sheet for this project are provided on pages 17 to 20. These are to be submitted for project funding, along with the calculations in Appendix D if required. The recommended plan to implement this project after funding is obtained is as follows:
Upgrade the existing fluorescent lighting in rooms 3, 4, 5, 6, 7, 11, 12, 13,14, 22, 23, 25, 26, 27, 31, 45, 46, 47, 49, 95, and 96 in building 8. These rooms are identified on the building maps on page C-ll. First, contract documents, including engineering drawings and specifications should be produced. The designer should remove approximately 180 existing pendent mounted, 4 lamp fluorescent light fixtures and replace them with 172 lay-in, 2 lamp, 2x4 fluorescent light fixtures with electronic ballasts and prismatic lenses (ECO D-4). He should locate the new light fixtures over desks or other work tables as required to provide 50 fc at the work station in each room. All switching and circuitry is to remain the same. After the contract documents are produced and reviewed, then a contract for the work can be obtained.
Project 3: The forms DD-1391, cost estimate and associated life cycle cost analysis summary sheet for this project are provided on pages 21 to 24. These are to be submitted for project funding, along with the calculations in Appendix D if required. The recommended plan to implement this project after funding is obtained is as follows:
Replace the pendent mounted fluorescent lighting in the production areas of building 8 with high pressure sodium lighting. The areas are identified as rooms 103, 106, 109, 110, 111, 112, 113, 114, 115, 116, 117, 118, 119, 120, 121, 122, 123, 124, 125, 127, 128, 129, 130, 131, 132, 134, 136, 137, 138, 139, 142, and 143. These rooms are shown on the building maps on pages C-10 through C-13. First, contract documents, including engineering drawings and specifications should be produced. The designer should remove approximately 3,017 existing pendent mounted, 2 lamp fluorescent light fixtures and replace them with 1,092 low-bay, 400 watt HPS light fixtures with rectangular pattern reflectors and lenses. Information on a sample fixture of this type is included in Appendix G. He should locate the new light fixtures over desks or other work tables as required to provide IES design lighting level at the work station in each room. All switching and circuitry is to remain the same, as much as is possible. After the contract documents are produced and reviewed, then a contract for the work can be obtained.
12

1. COMPONENT
ARMY FY1996 MILITARY CONSTRUCTION PROJECT DATA 2. PATE
5 APR, 1995
3. INSTALLATION AND LOCATION
CORPUS CHRISTI ARMY DEPOT, TEXAS 4. PROJECT TITLE
LIGHTING? CONTROLS INSTALLATION
5. PROGRAM ELEMENT 6. CATAGORY CODE 7. PROJECT NUMBER &. PROJECT COST ($000)
56.0
9. COST ESTIMATES
ITEM
Installation of interior lighting controls for Hangars and
Building ß>.
ESTIMATED CONTRACT COST CONTINGENCY (0%) SIOH DESIGN
TOTAL REQUEST
TOTAL REQUEST (ROUNDED)
U/M
EA
QUANTITY UNIT COST
56.0
COST ($000)
56.0
46.305 0.0
2.547 7.469
56.324
56.000
10. DESCRIPTION OF PROPOSED CONSTRUCTION
A. Install 16, ceiling mounted motion sensors in various areas of building 6>, shown on building maps as room numbers 100,101,102,105,107,108- and 131. Recircuit the existing &' fluorescent lights as required to allow the sensors to turn off the lights during unoccupied periods.
&. Install 4-photocell sensors and 1 relay panel In the large hangar of building 8>. Recircuit the "500 existing lights to allow the new relays to turn off 3/4 of the lights in each quadrant, while leaving 1/4 of the lights on. The relays will operate off of a signal from photocell sensors.
C. Install 4 photocell sensors and 1 relay panel in each of the hangars #43, 44, 45 and 47. Recircuit the 266 existing lights in each hangar to allow the new relays to turn off 3/4 of the lights in each quadrant, while leaving 1/4 of the lights on. The relays will operate off of a signal from photocell sensors.
DD 1P™6 1391 PAGE NO.
1of2
13

1. COMPONENT
ARMY FY1996 MILITARY CONSTRUCTION PROJECT DATA 2. DATE
5 APR, 1995
3. INSTALLATION AND LOCATION
CORPUS CHRISTI ARMY DEPOT, TEXAS
4. PROJECT TITLE
LIGHTING CONTROLS INSTALLATION 5. PROJECT NUMBER
11. REQUIREMENT
The project is required to reduce lighting energy consumption at the Corpus Christi Army Depot facilities. The project provides controls for interior lighting, which will turn off all or a portion of the lights during periods of the day, in order to save lighting energy and cost. All buildings included in this project will be active throughout the payback period, installation of these controls will result in the following:
Electrical Savings Steam Penalty Total Energy Savings Cost Savings Payback Period SIR
367,404 KWH/yr 0 lbs/yr
1,254.0 MMBTU/yr 23,415 $/yr
2.4 yrs 6.46
CURRENT SITUATION: The hangars currently have areas which are overlit by artificial lighting whenever the large doors are open and the sunlight comes in. Also, areas of building 8> have lights burining all day, during unoccupied periods. There is currently no automatic means to turn off the lights in these areas during periods in which this would be acceptable.
IMPACT IF NOT PROVIDED If this project Is not provided, a reduction of 1,254 MMBTU per year of energy and $23,415 of utility and maintenance costs will continue to be wasted. There will be no contribution to energy reduction goals established at the facility.
™ 1DEC76 1391 PAGE NO.
2 OF 2
14
TO
TA
L
CO
ST
O eft
8 O O in
8 o cO Q cO CJ) © * O © CO O to * to'
in 1 to
in K o
to £ © «g ^ tvj"
©" in
lij > O <f) 8 o o O CM CO
© S 5=. H 00 CO ■4- o o ^. W. <0 < Q
Q UJ _J
(0 'S
*~ © ■<*■
CJ EÖ ® w
< 1-
O a: 111 X Ü
UJ
< o o o O
O o o o o CO Ä
a. o O o o O Ä tf> to o t> fe *S ii: ||;i§: •^^
c o o ;#;;
CO O
3 © © :^g|;i ^ ::p CO s o o o o ' <0 co o
Q O 5 o ^ in "4- in o
©* ^ ^ £ co ^ 2 o o £
LU -1 m
tO o a: o m
0)
o o cS
o o cS
o o cS cS o o o
_J
o <
o a: Ö z
< Ü
UJ
UJ
ID a. 10 tO to to m m 3 Jt 3 w £ tn
B. uj t Q
m 3 (0 ■q
■o
@ X o
H
ii ■r^ q o
Ö in
o cS in a. o
III
ü_ , _ O w
U. ■n O >-
CO fc ■5 *
TO «5 «5 <5 «
O LU
CL m E
TO CM
I Ci
Z <
a
3 S
* 3
© © «- ■+
< VB O UJ ■■■■
H E O
(f> to IS)
LU Is
O
E
o S) E
CO ■0 in
ä: vn 5
_E
ID
T5 E TO
E <5 c •T CM ">
- Ü w *? IA LU LU
s E z
"5 s z o z LU
-E u in 3
o o E
*+* .E
o i- Q.
Ü
E O o
i $
E O o «)" 1-
c c < Ml
b Ü W W oo ^ ^ H ^ *
O o '—i (0
UJ Q
2 •p E o
3 E o o
3 E O U c
' 111=0*° ■ zS^" - — 5 > £2
o CL.
a >> £ <
Z o UJ o
s. o IS) E -Si
o
E
S. P
E TO
Q.
u IS)
E o TO EL. t_ *> o
■P E O U
E O Ü Z u. oo
vn (0 Ul
o E E E
II Q H Ü
o E o
O n o
-E
">> TO TO
l- vn UJ •a +i TS TS
< 3 -> — ^
8 ^ O OS TO 3 3 O o vc «> a IS) IS) _i o a. E E _E _E
15

)
LIFE CYCLE COST ANALYSIS SUMMARY STUDY: CCAD ENERGY CONSERVATION INVESTMENT PROGRAM (ECIP) LCCID FY95
INSTALLATION & LOCATION: CCAD REGION NOS. 6 CENSUS: 3 PROJECT NO. & TITLE: 03-0185-02 LIGHTING SURVEY STUDY FISCAL YEAR 1995 DISCRETE PORTION NAME: PROJECT-1 ANALYSIS DATE: 04-04-95 ECONOMIC LIFE 20 YEARS PREPARED BY: CAP
1. INVESTMENT A. CONSTRUCTION COST $ 46308. B. SIOH $ 2547. C. DESIGN COST $ 7469. D. TOTAL COST (1A+1B+1C) $ 56324.
(92)
E. SALVAGE VALUE OF EXISTING EQUIPMENT $ F. PUBLIC UTILITY COMPANY REBATE $ G. TOTAL INVESTMENT (ID - IE - IF)
0. 0.
56324.
2. ENERGY SAVINGS (+) / COST (-) DATE OF NISTIR 85-3273-X USED FOR DISCOUNT FACTORS OCT 1993
4.
5.
>
UNIT COST FUEL $/MBTU(l)
A. ELECT $ 17.14 B. DIST $ .00 C. RESID $ .00 D. NAT G $ .00 E. COAL $ .00 F. LPG $ .00 M. DEMAND SAVINGS N. TOTAL
SAVINGS MBTU/YR(2)
1254. 0. 0. 0. 0. 0.
ANNUAL $ SAVINGS(3)
1254.
NON ENERGY SAVINGS(+) / COST(-)
$ $ $ $ $ $ $ $
21497. 0. 0. 0. 0. 0. 0.
21497.
DISCOUNT FACTOR(4)
15.61 17.56 19.97 20.96 17.58 16.12 14.74
DISCOUNTED SAVINGS(5)
A. ANNUAL RECURRING (+/-) (1) DISCOUNT FACTOR (TABLE A) (2) DISCOUNTED SAVING/COST (3A X 3Al)
B. NON RECURRING SAVINGS(+) / COSTS(-) SAVINGS(+) YR
ITEM COST(-) OC (1) (2)
14.74
$ $ $ $ $ $ $ $
$
$
335568. 0. 0. 0. 0. 0. 0.
335568.
1918.
28271.
DISCNT FACTR (3)
DISCOUNTED SAVINGS(+)/ COST(-)(4)
d. TOTAL $ 0.
C. TOTAL NON ENERGY DISCOUNTED SAVINGS(+)/COST(-)(3A2+3Bd4)$
FIRST YEAR DOLLAR SAVINGS 2N3+3A+(3Bdl/(YRS ECONOMIC LIFE))$
SIMPLE PAYBACK PERIOD (1G/4)
6. TOTAL NET DISCOUNTED SAVINGS (2N5+3C)
(SIR)=(6 / 1G)=
8. ADJUSTED INTERNAL RATE OF RETURN (AIRR):
7. SAVINGS TO INVESTMENT RATIO (IF < 1 PROJECT DOES NOT QUALIFY)
0.
28271.
23415.
2.41 YEARS
363839.
6.46
13.18 %
16

1. COMPONENT
ARMY FY 1996 MILITARY CONSTRUCTION PROJECT DATA Z DATE
5 APR, 1995
3. INSTALLATION AND LOCATION
CORPUS CHRISTI ARMY DEPOT, TEXAS 4. PROJECT TITLE
FLUORESCENT LIGHTING UPGRADE
5. PROGRAM ELEMENT 6. CAT AGORY CODE 7. PROJECT NUMBER 6. PROJECT COST (tOOO)
29.0
9. COST ESTIMATES
ITEM
Replace existing inefficient fluorescent lighting in office
areas of Building ß.
ESTIMATED CONTRACT COST CONTINGENCY (0%) SIOH DESIGN
TOTAL REQUEST
TOTAL REQUEST (ROUNDED)
U/M
EA
QUANTITY UNIT COST
29.0
COST {$000)
29.0
26.390 0.0
1.461 1.505
29.424
29.000
10. DESCRIPTION OF PROPOSED CONSTRUCTION
Remove 1&0 existing pendent mounted, 4 lamp fluorescent light fixtures and replace them with 172 lay-in, 2 lamp, 2x4 fluorescent light fixtures with electronic ballasts and prismatic lenses. This should be done in the administrative areas of Building fi>. Locate the new light fixtures over desks or other work tables as required to provide 50 fc at the work station in each room. This project shall require a new lighting layout design, demolition and removal of existing fixtures, and installation of new fixtures and associated wiring. All switching and circuitry is to remain the same.
™ 1DEC76 1391 PAGE NO.
1of2
17

1. COMPONENT
ARMY FY1996 MILITARY CONSTRUCTION PROJECT DATA Z DATE
5 APR, 1995
3. INSTALLATION AND LOCATION
C0RPU5 CHRI5TI ARMY DEPOT, TEXAS
4. PROJECT TITLE
FLUORESCENT LIGHTING UPGRADE
11. REQUIREMENT
5. PROJECT NUMBER
The project is required to reduce lighting energy consumption at the Corpus Christi Army Depot facilities. The project provides new, more efficient interior lighting, which will save lighting energy and cost. All buildings included in this project will be active throughout the payback period. Installation of this lighting will result in the following:
Electrical Savings Steam Penalty Total Energy Savings Cost Savings Payback Period SIR
40,052 KWH/yr 533 lbs/yr 115.7 MMBTU/yr
3,147 $/yr 9.3 yrs
1.66
CURRENT SITUATION: Some of the administrative office areas in building & have 4 lamp, pendent mounted fluorescent light fixtures. These fixtures typically have louvers on the bottom and apertures in the top of the enclosure for partial indirect lighting off of the ceiling, because only about 307» of the light that hits the ceiling is reflected back down to the work plane, a good deal of light is wasted. The lowered bottoms trap light within the fixture, lowering it's efficiency. These fixtures should be replaced with 2 lamp, 2x4 lay-in troffers with prismatic lenses. The offices generally have suspended ceilings which would easily accommodate the new fixtures. Because the new fixtures would direct all of the light down to the work plane, the number of lamps required to maintain design lighting levels would be reduced. The existing average light levels were measured and recorded on the data sheets, along with the number of fixtures in each room. Some of the rooms had average light levels that were somewhat above that recommended for their specific types of area.
IMPACT IF NOT PROVIDED If this project is not provided, a reduction of 115.7 MMBTU per year of energy and $3,147 of utility and maintenance costs will continue to be wasted. There will be no contribution to energy reduction goals established at the facility.
™ 1DEC76 1391 PAGE NO.
2 OF 2
18
SB X
TO
TA
L
CO
ST
o CO
O CO O
«0 O
in CO* CO
CO
to"
o 0) to ©" CO
8 in
CO
l 3 of CO
lii >■'
&
8 8 O 00 CO S
H CQ <0 r-» © CD in < a O
UJ
O UJ X o
< s UJ
<
IS
'S to £" CO ^;
«1 u
o o 8 fffi| ^p
s •c a. ss
in §
1- c/> O
CO O in* <n
c 3
To
o CO ®
in
<0 «0 CO to <0 1 0)
o o •2
HI -1 m
to o
0£ O m
3 o O a
o o cS
§ a
_l < P
-i
p o
-1
o < co
< Ü
IB tO to to m 3 (0
* o
ID 3 co
9 z (9 53
(- CO 3 (0
* ■o
i-
o a:
o z
UJ a. UJ
1 II tO Ö
o to Ö
9 a.
9 X o
a. o UJ
CL. 1
o UJ
o UJ a (0
LL o >- fc H «5 5 «5
O LU
CQ
u
<
Z < o
<0 £ £ H w a * 3
<
■■■■
C/> LU ^
&_ 3 »
—
CO
LU LU
X
+3
E
_E
1J •P z
UL.
E
d
z o z LU
"s_ J: O
i_ O o ■p"
E W
o 3
U_
O H 0. E ü (0 Ul Q
5
•p .E
+i c «1 o © v> i_ o 3
c
3
o
® •P c V) o S) VI i. o 3
_c 1 >>
(/)
< .j
o N
Ü W W co
< uJu13 — UJ J- u.
iXJ -r tr O UJ S o «? — 5 > to
o
>5
E <
Z o
UJ •p c u c v>
_5 si E «s
■ 1-
Q. OS Ü
c •p
■p" 3
o 3 Z ^ £ P U. CO
*+s (0 UJ Q t- Ü UJ -»
ID
v>
o ■p
o o A 3 O
c
c
o c o
■p
O o O 0£
o £ o « 5
«1 -I o a. Q > _c i
19

LIFE CYCLE COST ANALYSIS SUMMARY STUDY: CCAD ENERGY CONSERVATION INVESTMENT PROGRAM (ECIP) LCCID FY95
INSTALLATION & LOCATION: CCAD REGION NOS. 6 CENSUS: 3 PROJECT NO. & TITLE: 03-0185-02 LIGHTING SURVEY STUDY FISCAL YEAR 1995 DISCRETE PORTION NAME: PROJECT-2 ANALYSIS DATE: 04-04-95 ECONOMIC LIFE 20 YEARS PREPARED BY: CAP
1. INVESTMENT A. CONSTRUCTION COST $ 26390. B. SIOH $ 1451. C. DESIGN COST $ 1583. D. TOTAL COST (1A+1B+1C) $ 29424. E. SALVAGE VALUE OF EXISTING EQUIPMENT $ F. PUBLIC UTILITY COMPANY REBATE $ G. TOTAL INVESTMENT (ID - IE - IF) $ 29424,
(92)
0. 0.
2. ENERGY SAVINGS (+) / COST (-) DATE OF NISTIR 85-3273-X USED FOR DISCOUNT FACTORS OCT 1993
FUEL UNIT COST $/MBTU(l)
A. ELECT $ 17.14 B. DIST $ .00 C. RESID $ .00 D. NAT G $ .00 E. COAL $ .00 F. LPG $ .00 L. OTHER $ 13.16 M. DEMAND SAVINGS N. TOTAL
SAVINGS MBTU/YR(2)
164. 0. 0. 0. 0. 0.
-48.
116.
ANNUAL $ SAVINGS(3)
$ $ $ $ $ $ $ $ $
2811. 0. 0. 0. 0. 0.
-636. 0.
2175.
DISCOUNT FACTOR(4)
15.61 17.56 19.97 20.96 17.58 16.12 14.74 14.74
DISCOUNTED SAVINGS(5)
3. NON ENERGY SAVINGS(+) / COST(-)
A. ANNUAL RECURRING (+/-) (1) DISCOUNT FACTOR (TABLE A) (2) DISCOUNTED SAVING/COST (3A X 3Al)
B. NON RECURRING SAVINGS(+) / COSTS(-) SAVINGS(+) YR
ITEM COST(-) OC (1) (2)
14.74
$ $ $ $ $ $ $ $ $
$
$
43879. 0. 0. 0. 0. 0.
-9369. 0.
34510.
972.
14327.
DISCNT FACTR (3)
DISCOUNTED SAVINGS(+)/ COST(-)(4)
d. TOTAL $ 0.
C. TOTAL NON ENERGY DISCOUNTED SAVINGS(+)/COST(-)(3A2+3Bd4)$
4. FIRST YEAR DOLLAR SAVINGS 2N3+3A+(3Bdl/(YRS ECONOMIC LIFE))$
5. SIMPLE PAYBACK PERIOD (1G/4)
6. TOTAL NET DISCOUNTED SAVINGS (2N5+3C) $
(SIR) = (6 / IG)'
8. ADJUSTED INTERNAL RATE OF RETURN (AIRR):
7. SAVINGS TO INVESTMENT RATIO (IF < 1 PROJECT DOES NOT QUALIFY)
0.
14327.
3147.
9.35 YEARS
48837.
1.66
5.75 %
20
1. COMPONENT
ARMY FY1996 MILITARY CONSTRUCTION PROJECT DATA Z DATE
5 APR, 1995
3. INSTALLATION ANP LOCATION
CORPUS CHRISTI ARMY DEPOT, TEXAS 4. PROJECT TITLE
FLUORESCENT TO HID LIGHTING RETROFIT
5. PROGRAM ELEMENT 6. CATAGORYCODE 7. PROJECT NUMBER ß. PROJECT COST ($000)
477.0
9. COST ESTIMATES
ITEM U/M QUANTITY UNIT COST COST ($000)
Replace existing inefficient fluorescent lighting in production areas of Building ß with high pressure sodium light fixtures.
ESTIMATED CONTRACT COST CONTINGENCY (0%) SIOH DESIGN
TOTAL REQUEST
TOTAL REQUEST (ROUNDED)
EA 1 477.0 477.0
42Ö.059 0.0
23.543 25.604
477.2Ö0
477.000
10. DESCRIPTION OP PROPOSED CONSTRUCTION
Remove 3,017 existing pendent mounted, 2 lamp fluorescent light fixtures and replace them with 1,092 low-bay, 400 watt HPS light fixtures with rectangular pattern reflectors and lenses. This should be done in the production and warehouse areas of Building 6. This project shall require a new lighting layout design, demolition and removal of existing fixtures, and installation of new fixtures and associated wiring. All switching and circuitry is to remain the same, as much as is possible.
nn F0RM 1391 UU 1 DEC 76 ltJC31
PAGE NO.
1of2
21

1. COMPONENT
ARMY FY1996 MILITARY CONSTRUCTION PROJECT DATA 2. PATE
5 APR, 1995
3. INSTALLATION AND LOCATION
C0RPU5 CHRISTI ARMY DEPOT, TEXAS
4. PROJECT TITLE
FLUORESCENT TO HID LIGHTING RETROFIT
5. PROJECT NUMBER
11. REQUIREMENT
The project is required to reduce lighting energy consumption at the Corpus Christi Army Depot
facilities. The project provides new, more efficient interior lighting, which will save lighting energy and
cost. All buildings included in this project will be active throughout the payback period. Installation
of this lighting will result in the following:
Electrical Savings
Steam Penalty
Total Energy Savings
Cost Savings
Payback Period
SIR
656,616 KWH/yr Ö30.7 lbs/yr
1,597.5 MMBTU/yr 54,151 $/yr
Ö.Ö yrs 1.74
-;)
CURRENT SITUATION:
Most of the production areas in Building 6> have 2 lamp, pendent mounted fluorescent light fixtures.
These fixtures typically have apertures in the top of the enclosure for partial indirect lighting off of
the ceiling. Because only about 30% of the light that hits the ceiling is reflected back down to the
work plane, a good deal of light is wasted. Because of the high mounting height, 110 watt high-
output lamps are required to produce acceptable lighting levels.
These fixtures should be replaced with 400VV HPS, low-bay light figures with rectangular pattern
reflectors and lenses. The production areas generally have open beam ceilings which would easily
accommodate the new fixtures. Because the new fixtures would direct all of the light down to the
work plane, and because they produce a greater amount of light, less fixtures would be required to
maintain design lighting levels. The existing average light levels were measured and recorded on the
data sheets, along with the number of fixtures in each area.
IMPACT IF NOT PROVIDED
If this project is not provided, a reduction of1,597.5 MMBTU per year of energy and $54,131 of utility
and maintenance costs will continue to be wasted. There will be no contribution to energy reduction
goals established at the facility.
DD FORM
1 DEC 76 1391 PAGE NO.
2 OF 2
22

1
ili
X
>
TO
TA
L
CO
ST
CO
O CO CO
tO* to
CM in
§ to
in CM CM
to
cO in in
0)
<0* CM
in CO
to* 1 to* CM
CM
O co X s
H a O ^i- ■* OJ
< Q a
LU
o LU X u
_l < or LU
<
5 o
10
CM
CM o to
o <0
CM
to
« o
CL
o o in"
O o CM ^^^1
C CO
■^^
CM O
3 SB to in 8 <0
CM - ?
to"
tO
O in to irT "5 CM CO*
<0 of (0 to" o o
i
i O 1-
to <o
LU
m
to o O
in OS
a: o m O
O cS
o o cS
o o
_l < o
_i < o o
_l
o < «r
ID a: to to t<) m CD m
H
m o < 3 <0 o
3 (O
@> Z o
3 0) *
O O z UJ o
"■p o 15
to d
o to ö
® a. •0
■O
© X o
0. O &_ -*5 p
o LU a w
LL -> o >- £ i* «5
«1 <5
O a. GO E
Ci X .E
z <
a
= 2
LU - £ O to'
CM 0) q
CM
q
< >
E
J- E
(0 o <!5
LU CO
M. d
a: LU HI
WS E
.E
."^
z 3
o CM •"
Ü CO W 00
^ LU f= LJU
LU -, a: o UI^O«? = 5 > co O CM 1- *°
m "> O ^ LL eo
z o z LU
«5 *s_ -E o
3 Ci_ s_ O o
E « Ü
\- O
u_
O H OL a: o CO LU a 2
tt- ■p
c o
o
E •a 3 U
o £
3
■p
(0 or < —1 -J o N
o EL. U Q >> E <
Z O H Q. D£ Ü
LU E
£ u Si.
<S> E
■p
E
3
Cv. X
■
X vn
H iß
CO LU a
o LU
10 X u
o £ o
O U « O
£
«1 E
<t- O
E O
< 3 -? ^
O o o a: £ « 5
_J O Q. O i _E 1
23

LIFE CYCLE COST ANALYSIS SUMMARY STUDY: CCAD ENERGY CONSERVATION INVESTMENT PROGRAM (ECIP) LCCID FY95 (92)
INSTALLATION & LOCATION: CCAD REGION NOS. 6 CENSUS: 3 PROJECT NO. & TITLE: 03-0185-02 LIGHTING SURVEY STUDY
! FISCAL YEAR 1995 DISCRETE PORTION NAME: PROJECT-3 ANALYSIS DATE: 04-04-95 ECONOMIC LIFE 20 YEARS PREPARED BY: CAP
1. INVESTMENT A. CONSTRUCTION COST $ 428059. B. SIOH $ 23543. C. DESIGN COST $ 25684. D. TOTAL COST (1A+1B+1C) $ 477286. E. SALVAGE VALUE OF EXISTING EQUIPMENT $ 0. F. PUBLIC UTILITY COMPANY REBATE $ 0. G. TOTAL INVESTMENT (ID - IE - IF) $ 477286.
2. ENERGY SAVINGS (+) / COST (-) DATE OF NISTIR 85-3273-X USED FOR DISCOUNT FACTORS OCT 1993
•ß' s
FUEL UNIT COST $/MBTU(l)
A. ELECT $ 17.14 B. DIST $ .00 C. RESID $ .00 D. NAT G $ .00 E. COAL $ .00 F. LPG $ .00 L. OTHER $ 13.16 M. DEMAND SAVINGS N. TOTAL
SAVINGS MBTU/YR(2)
2343. 0. 0. 0. 0. 0.
-746.
ANNUAL $ SAVINGS(3)
1597.
NON ENERGY SAVINGS(+) / COST(-)
$ $ $ $ $ $ $ $ $
40166. 0. 0. 0. 0. 0.
-9816. 0.
30350.
DISCOUNT FACTOR(4)
15.61 17.56 19.97 20.96 17.58 16.12 14.74 14.74
DISCOUNTED SAVINGS(5)
A. ANNUAL RECURRING (+/-) (1) DISCOUNT FACTOR (TABLE A) (2) DISCOUNTED SAVING/COST (3A X 3A1)
B. NON RECURRING SAVINGS(+) / COSTS(-) SAVINGS(+) YR
ITEM COST(-) OC (1) (2)
14.74
$ $ $ $ $ $ $ $ $
$
$
626989. 0. 0. 0. 0. 0.
-144688. 0.
482301.
23781.
350532.
DISCNT FACTR (3)
DISCOUNTED SAVINGS(+)/ COST(-)(4)
d. TOTAL $ 0.
C. TOTAL NON ENERGY DISCOUNTED SAVINGS(+)/COST(-)(3A2+3Bd4)$
4. FIRST YEAR DOLLAR SAVINGS 2N3+3A+(3Bdl/(YRS ECONOMIC LIFE))$
5. SIMPLE PAYBACK PERIOD (1G/4)
6. TOTAL NET DISCOUNTED SAVINGS (2N5+3C) $
(SIR)=(6 / 1G)=
8. ADJUSTED INTERNAL RATE OF RETURN (AIRR):
7. SAVINGS TO INVESTMENT RATIO (IF < 1 PROJECT DOES NOT QUALIFY)
0.
350532.
54131.
8.82 YEARS
832833.
1.74
6.01 %
24