bmo fixed income insurance conference - … and events...bmo fixed income insurance conference. june...
TRANSCRIPT

B M O F I X E D I N C O M E I N S U R A N C E C O N F E R E N C E
June 15, 2017
Marlene Van den HoogenTreasurer and Head of Capital Planning

Forward-Looking Statements
From time to time, the Company makes written or oral forward-looking statements within the meaning of certain securities laws, including the “safe harbour” provisions of the United States Private Securities Litigation Reform Act of 1995 and applicable Canadian securities legislation. Forward-looking statements contained in this presentation include (i) statements relating to our strategies, (ii) growth initiatives and other business objectives, (iii) statements that are predictive in nature or that depend upon or refer to future events or conditions, and (iv) statements that include words such as “aim”, “anticipate”, “assumption”, “believe”, “could”, “estimate”, “expect”, “goal”, “initiatives”, “intend”, “may”, “objective”, “outlook”, “plan”, “project”, “seek”, “should”, “strategy”, “strive”, “target”, “will”, and similar expressions. Forward-looking statements include the information concerning our possible or assumed future results of operations. These statements represent our current expectations, estimates, and projections regarding future events and are not historical facts. Forward-looking statements are not a guarantee of future performance and involve risks and uncertainties that are difficult to predict. Future results and shareholder value may differ materially from those expressed in these forward-looking statements due to, among other factors, the risk factors set out in SLF Inc.’s 2016 AIF under the heading Risk Factors and the factors detailed in SLF Inc.’s other filings with Canadian and U.S. securities regulators, which are available for review at www.sedar.com and www.sec.gov, respectively.
Risk FactorsImportant risk factors that could cause our assumptions and estimates, and expectations and projections to be inaccurate and our actual results or events to differ materially from those expressed in or implied by the forward-looking statements contained in this presentation, are set out below. The realization of our forward-looking statements, essentially depends on our business performance which, in turn, is subject to many risks. Factors that could cause actual results to differ materially from expectations include, but are not limited to: credit risks - related to issuers of securities held in our investment portfolio, debtors, structured securities, reinsurers, counterparties, other financial institutions and other entities; market risks - related to the performance of equity markets; changes or volatility in interest rates or credit spreads or swap spreads; real estate investments; and fluctuations in foreign currency exchange rates; insurance risks - related to mortality, morbidity, longevity and policyholder behaviour; product design and pricing; the impact of higher-than-expected future expenses; and the availability, cost and effectiveness of reinsurance; business and strategic risks - related to global economic and political conditions; changes in distribution channels or Client behaviour including risks relating to market conduct by intermediaries and agents; the impact of competition; the design and implementation of business strategies; changes in the legal or regulatory environment, including capital requirements and tax laws; tax matters, including estimates and judgments used in calculating taxes; the performance of our investments and investment portfolios managed for Clients such as segregated and mutual funds; our international operations, including our joint ventures; market conditions that affect our capital position or ability to raise capital; downgrades in financial strength or credit ratings; and the impact of mergers, acquisitions and divestitures; operational risks - related to breaches or failure of information system security and privacy, including cyber-attacks; our ability to attract and retain employees; the execution and integration of mergers, acquisitions and divestitures; legal, regulatory compliance and market conduct, including the impact of regulatory inquiries and investigations; our information technology infrastructure; a failure of information systems and Internet-enabled technology; dependence on third-party relationships, including outsourcing arrangements; business continuity; model errors; information management; the environment, environmental laws and regulations and third-party policies; and liquidity risks - the possibility that we will not be able to fund all cash outflow commitments as they fall due.
The Company does not undertake any obligation to update or revise its forward-looking statements to reflect events or circumstances after the date of this presentation or to reflect the occurrence of unanticipated events, except as required by law.
2

KEY MESSAGES
1 Over past five years, we have built a strong defense and offense
2Four at-scale, competitive pillars with excellent growth prospects
Culture change Organic investments hitting their stride Track record of disciplined capital allocation
3 For the next leg, our objective is to become one of the best insurance and asset management companies in the world
4 Medium-term objectives are ambitious but achievable
5 Strong balance sheet with disciplined approach to capital management
6 Well positioned ahead of new capital rules in 2018
3

B U S I N E S S O V E R V I E W

SUN LIFE FINANCIAL IN 2017
A $30 billion1 leading, international financial services provider… operating through a balancedand diversified model… focused on creating shareholder value now and in the future
1 Market capitalization (C$), as of March 31, 20175
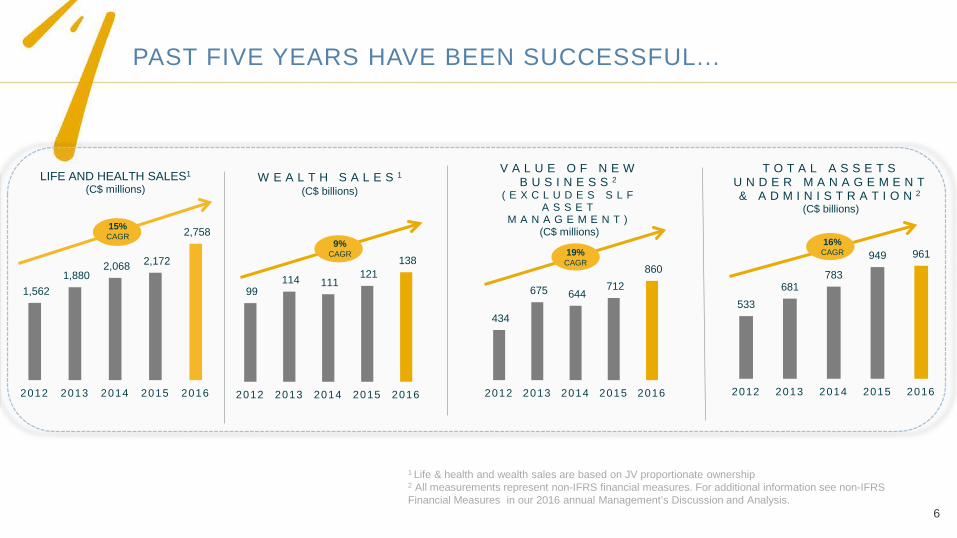
PAST FIVE YEARS HAVE BEEN SUCCESSFUL...
1,562 1,880
2,068 2,172
2,758
2012 2013 2014 2015 2016
LIFE AND HEALTH SALES1
(C$ millions)
15%CAGR
99 114 111
121 138
2012 2013 2014 2015 2016
W E A L T H S A L E S 1
(C$ billions)
533681
783
949 961
2012 2013 2014 2015 2016
T O T A L A S S E T S U N D E R M A N A G E M E N T & A D M I N I S T R A T I O N 2
(C$ billions)
434
675 644 712
860
2012 2013 2014 2015 2016
V A L U E O F N E W B U S I N E S S 2
( E X C L U D E S S L F A S S E T
M A N A G E M E N T )(C$ millions)
19%CAGR
1 Life & health and wealth sales are based on JV proportionate ownership2 All measurements represent non-IFRS financial measures. For additional information see non-IFRS Financial Measures in our 2016 annual Management’s Discussion and Analysis.
9%CAGR
16%CAGR
6

...AND WE’VE BUILT MOMENTUM
1,479
1,943 1,920
2,253
2,487
1,271
1,5811,816
2,305 2,335
2012 2013 2014 2015 2016
Operating Net Income Underlying Net Income 0% 5% 10% 15% 20% 25% 30%
TSX
S & P 500
Canadian Banks
U.S. Lifecos
Canadian Lifecos
Sun LifeCAGR 16%*
* CAGR for underlying net income
NET INCOME1
(C$ millions)
TOTAL SHAREHOLDER RETURNFIVE YEARS AS OF
DECEMBER 31, 2016 (annualized return)
Source: Bloomberg
1 All measurements represent non-IFRS financial measures. For additional information see non-IFRS Financial Measures in our 2016 annual Management’s Discussion and Analysis. 7

ASSET MANAGEMENT
28%
WEALTH10%
INDIVIDUAL INSURANCE
31%
GROUP INSURANCE
18%
RUN-OFF13%
SLF CANADA
35%
SLF ASIA12%
SLF US18%
SLF UK7%
SLF ASSET MANAGEMENT
28%
WE’VE BUILT A STRONG DEFENSE…
GEOGRAPHIC DIVERSIFICATION2016 UNDERLYING NET INCOME
BUSINESS DIVERSIFICATION2016 UNDERLYING NET INCOME
01No direct U.S. Variable Annuity or Long-Term
Care Exposure
02
Relatively low market risk exposure
03249% MCCSR (SLF), $1.1B of Holdco cash, 22.6% leverage ratio
04
Strong risk management culture
05Balanced and
diversified portfolio to deliver across cycles
1 Includes SLF Asia, International High Net Worth Asia, MFS Asia Pacific.
20% of underlying net income
comes from Asia1
8

…AND WE’VE BUILT A STRONG OFFENSE
Large investment in organic growth that will contribute to earnings
growth
Defined Benefit Solutions Sun Life Global Investments Retail Wealth in SLF Canada Client Solutions
Digital Health Business Vietnam and Indonesia Sun Life Investment Management SLF U.S. Voluntary Benefits MFS Blended Research Strategies
Disciplined allocation of $2.5 billion in inorganic
growth that will be accretive to earnings
U.S. Employee Benefits Bentall Kennedy Prime Advisors Ryan Labs
Malaysia Vietnam Indonesia India Hong Kong MPF
9
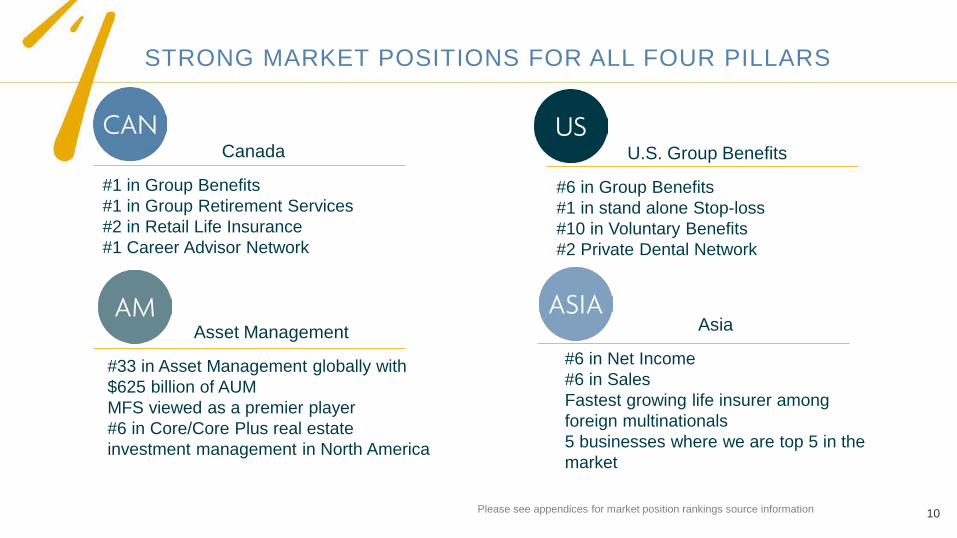
STRONG MARKET POSITIONS FOR ALL FOUR PILLARS
Canada
#1 in Group Benefits#1 in Group Retirement Services#2 in Retail Life Insurance#1 Career Advisor Network
Asia
#6 in Net Income#6 in SalesFastest growing life insurer among foreign multinationals5 businesses where we are top 5 in the market
U.S. Group Benefits
#6 in Group Benefits#1 in stand alone Stop-loss#10 in Voluntary Benefits#2 Private Dental Network
Asset Management
#33 in Asset Management globally with $625 billion of AUMMFS viewed as a premier player#6 in Core/Core Plus real estate investment management in North America
Please see appendices for market position rankings source information 10

SETTING A BOLD NEW OBJECTIVE
Our ambition is to be ONE OF THE BEST insurance and asset management companies globally
Each pillar viewed as one of the best
in its markets
DisproportionateShare of Top
Talent
Top Quartile Client Experience Top Quartile TSR
11
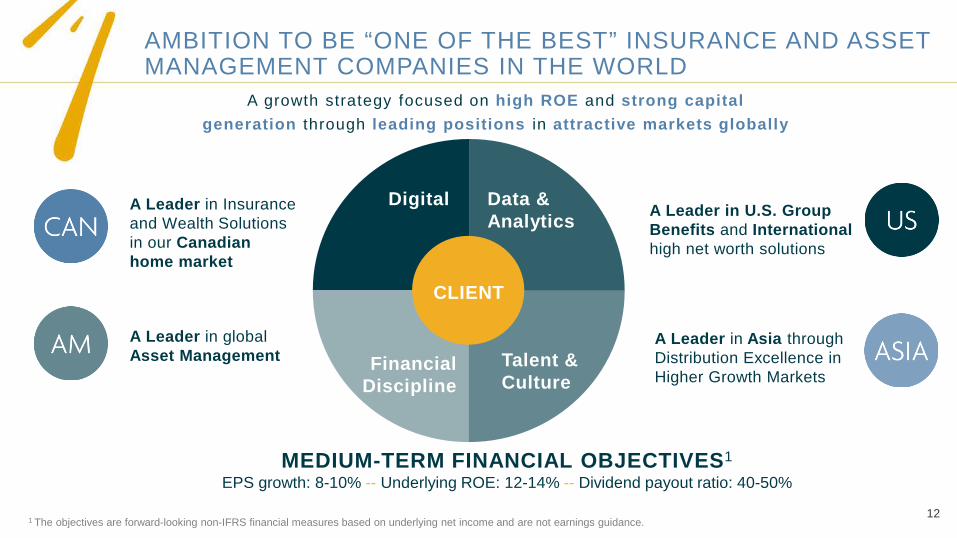
AMBITION TO BE “ONE OF THE BEST” INSURANCE AND ASSET MANAGEMENT COMPANIES IN THE WORLD
MEDIUM-TERM FINANCIAL OBJECTIVES1
EPS growth: 8-10% -- Underlying ROE: 12-14% -- Dividend payout ratio: 40-50%
1 The objectives are forward-looking non-IFRS financial measures based on underlying net income and are not earnings guidance.
A Leader in Insurance and Wealth Solutions in our Canadian home market
A Leader in U.S. Group Benefits and Internationalhigh net worth solutions
A Leader in globalAsset Management
A Leader in Asia through Distribution Excellence in Higher Growth Markets
Digital Data & Analytics
Talent &Culture
FinancialDiscipline
CLIENT
A growth strategy focused on high ROE and strong capitalgeneration through leading positions in attractive markets globally
12

Relevant and Useful Technology – My Sun Life
13

C A P I T A L M A N A G E M E N T

MANAGING EXPECTATIONS OF STAKEHOLDERS
Stakeholder Metric Target
Policyholders Capital Adequacy SLA MCCSR ratio > internal targets
Local Capital ratios > internal targets
Rating Agencies Leverage Ratio Lower than expectations for current rating: Maintain less than 30%
Interest Coverage Higher than expectations for current rating: Greater than 8x
Shareholders Capital generation Positive capital generation after capital support for new business and initiatives
Cash generation Positive cash generation after interest expenses and dividend payments
Hold Co Cash Operating target of $500 million
Dividend Payout Ratio(1) 40%-50% of underlying net income
Underlying ROE(1) 12%-14%
Underlying EPS growth(1) 8%-10% per annum
(1) The objectives are forward-looking non-IFRS financial measures and are not earnings guidance. 15

STRONG CAPITAL ADEQUACY AND FLEXIBLE BALANCE SHEET
250% 250%
243%249%
217%
240%
226%229%
2014 2015 2016 Q1'17
M C C S R R A T I O S ( 1 )
1,827
990816
1,100
2014 2015 2016 Q1'17
H O L D I N G C O M P A N Y C A S H ( 1 )
23.6%
22.1%23.0% 22.6%
2014 2015 2016 Q1'17
L E V E R A G E R A T I O ( 1 )
Minimum Cash Target Target Leverage Ratio
Upper Range of Target
(C$ millions)
1 2016 (SLF only): Pro forma $800 million subordinated debt redemption on March 2, 2017. 16

1 Net capital generation is based on 200% MCCSR.
STRONG CAPITAL GENERATION WITH BALANCED APPROACH TO DEPLOYMENT
Sun Life Assurance Companyof Canada Q1’17
Standard & Poor’s AA-(3)
Moody’s Aa3
A.M. Best A+
DBRS AA(low)
F I N A N C I A L S T R E N G T H R A T I N G S ( 2 )
2.0
2.72.5
0.3
Organic Dividends Acquisitions ShareRepurchases
SLF Canada
SLF UK
SLF Asia
SLF AM
SLF US
E X P E C T E D A N N U A L C A P I T A L G E N E R A T I O N
C A P I T A L D E P L O Y M E N T( 2 0 1 4 - 2 0 1 6 )
Net capital generation of $700 million per annum1
(C$ billions)
3 On March 13, 2017 S&P revised outlook to Positive from Stable.
2 As at June 14, 2017.17

CAPITAL MODEL
All information as at March 31, 2017
SLA
SLF
U.K. Canada Bermuda Asia
Capitalized to meet local capital rules Book value excl. from MCCSR
$1.1 billion cash at Holding Company
MCCSR of 229%
Sun Life Investment
Management
Sun Life Asset Management
MFS
$0.60B – Senior Debt
U.S. Branch
$2.89B – Subordinated Debt
$2.26B – Preferred Shares
$0.15B – Subordinated Debt
$0.70B – SLEECS
MCCSR 249%Leverage 22.6%Leverage Capacity to 25/30%: ~$0.9/$2.8B
18

January 2017Test Run1 Filed
YE 2015
February 2017Sensitivities Filed
YE 2015
During 2017Assess and
Establish New Internal targets
December 2017OSFI Filing Test
Run 2YE 2016
May 2018Begin reporting under LICAT
PREPARING FOR A CHANGE TO REGULATORY CAPITAL - LICAT
Key Facts Effective January 1, 2018, LICAT will replace
the current MCCSR Guideline LICAT better aligns capital requirements to
risks, but impacts on individual insurers will differ Mix of business Risk appetite and risk management
Key Considerations Systems development to support new capital
requirements Product and pricing assessments/business
implications Updates to external stakeholders as year
progresses
19

POSITIONED TO DELIVER ON TARGETS UNDER LICAT
UK
Capital and cash generation directly impacted by LICAT
Excluded from regulatory capital requirements
Dividends unaffected by LICAT
Local capital requirements and capital targets
Dividends unaffected by LICAT
20

A P P E N D I X
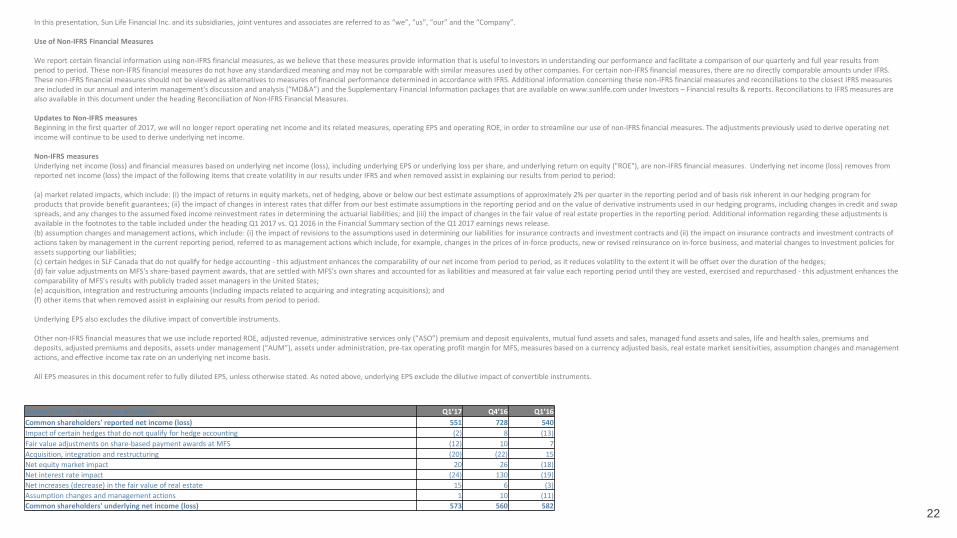
In this presentation, Sun Life Financial Inc. and its subsidiaries, joint ventures and associates are referred to as “we”, “us”, “our” and the “Company”.
Use of Non-IFRS Financial Measures
We report certain financial information using non-IFRS financial measures, as we believe that these measures provide information that is useful to investors in understanding our performance and facilitate a comparison of our quarterly and full year results from period to period. These non-IFRS financial measures do not have any standardized meaning and may not be comparable with similar measures used by other companies. For certain non-IFRS financial measures, there are no directly comparable amounts under IFRS. These non-IFRS financial measures should not be viewed as alternatives to measures of financial performance determined in accordance with IFRS. Additional information concerning these non-IFRS financial measures and reconciliations to the closest IFRS measures are included in our annual and interim management's discussion and analysis (“MD&A”) and the Supplementary Financial Information packages that are available on www.sunlife.com under Investors – Financial results & reports. Reconciliations to IFRS measures are also available in this document under the heading Reconciliation of Non-IFRS Financial Measures.
Updates to Non-IFRS measuresBeginning in the first quarter of 2017, we will no longer report operating net income and its related measures, operating EPS and operating ROE, in order to streamline our use of non-IFRS financial measures. The adjustments previously used to derive operating net income will continue to be used to derive underlying net income.
Non-IFRS measuresUnderlying net income (loss) and financial measures based on underlying net income (loss), including underlying EPS or underlying loss per share, and underlying return on equity ("ROE"), are non-IFRS financial measures. Underlying net income (loss) removes from reported net income (loss) the impact of the following items that create volatility in our results under IFRS and when removed assist in explaining our results from period to period:
(a) market related impacts, which include: (i) the impact of returns in equity markets, net of hedging, above or below our best estimate assumptions of approximately 2% per quarter in the reporting period and of basis risk inherent in our hedging program for products that provide benefit guarantees; (ii) the impact of changes in interest rates that differ from our best estimate assumptions in the reporting period and on the value of derivative instruments used in our hedging programs, including changes in credit and swap spreads, and any changes to the assumed fixed income reinvestment rates in determining the actuarial liabilities; and (iii) the impact of changes in the fair value of real estate properties in the reporting period. Additional information regarding these adjustments is available in the footnotes to the table included under the heading Q1 2017 vs. Q1 2016 in the Financial Summary section of the Q1 2017 earnings news release.(b) assumption changes and management actions, which include: (i) the impact of revisions to the assumptions used in determining our liabilities for insurance contracts and investment contracts and (ii) the impact on insurance contracts and investment contracts of actions taken by management in the current reporting period, referred to as management actions which include, for example, changes in the prices of in-force products, new or revised reinsurance on in-force business, and material changes to investment policies for assets supporting our liabilities;(c) certain hedges in SLF Canada that do not qualify for hedge accounting - this adjustment enhances the comparability of our net income from period to period, as it reduces volatility to the extent it will be offset over the duration of the hedges;(d) fair value adjustments on MFS's share-based payment awards, that are settled with MFS’s own shares and accounted for as liabilities and measured at fair value each reporting period until they are vested, exercised and repurchased - this adjustment enhances the comparability of MFS’s results with publicly traded asset managers in the United States;(e) acquisition, integration and restructuring amounts (including impacts related to acquiring and integrating acquisitions); and(f) other items that when removed assist in explaining our results from period to period.
Underlying EPS also excludes the dilutive impact of convertible instruments.
Other non-IFRS financial measures that we use include reported ROE, adjusted revenue, administrative services only (“ASO”) premium and deposit equivalents, mutual fund assets and sales, managed fund assets and sales, life and health sales, premiums and deposits, adjusted premiums and deposits, assets under management (“AUM”), assets under administration, pre-tax operating profit margin for MFS, measures based on a currency adjusted basis, real estate market sensitivities, assumption changes and management actions, and effective income tax rate on an underlying net income basis.
All EPS measures in this document refer to fully diluted EPS, unless otherwise stated. As noted above, underlying EPS exclude the dilutive impact of convertible instruments.
Reconciliation of Net Income Measures Q1’17 Q4’16 Q1’16Common shareholders' reported net income (loss) 551 728 540Impact of certain hedges that do not qualify for hedge accounting (2) 8 (13)Fair value adjustments on share-based payment awards at MFS (12) 10 7Acquisition, integration and restructuring (20) (22) 15Net equity market impact 20 26 (18)Net interest rate impact (24) 130 (19)Net increases (decrease) in the fair value of real estate 15 6 (3)Assumption changes and management actions 1 10 (11)Common shareholders' underlying net income (loss) 573 560 582
22

Forward-Looking Statements
From time to time, the Company makes written or oral forward-looking statements within the meaning of certain securities laws, including the “safe harbour” provisions of the United States Private Securities Litigation Reform Act of 1995 and applicable Canadian securities legislation. Forward-looking statements contained in this presentation include (i) statements relating to our strategies, (ii) growth initiatives and other business objectives, (iii) statements that are predictive in nature or that depend upon or refer to future events or conditions, and (iv) statements that include words such as “aim”, “anticipate”, “assumption”, “believe”, “could”, “estimate”, “expect”, “goal”, “initiatives”, “intend”, “may”, “objective”, “outlook”, “plan”, “project”, “seek”, “should”, “strategy”, “strive”, “target”, “will”, and similar expressions. Forward-looking statements include the information concerning our possible or assumed future results of operations. These statements represent our current expectations, estimates, and projections regarding future events and are not historical facts. Forward-looking statements are not a guarantee of future performance and involve risks and uncertainties that are difficult to predict. Future results and shareholder value may differ materially from those expressed in these forward-looking statements due to, among other factors, the risk factors set out in SLF Inc.’s 2016 AIF under the heading Risk Factors and the factors detailed in SLF Inc.’s other filings with Canadian and U.S. securities regulators, which are available for review at www.sedar.com and www.sec.gov, respectively.
Risk FactorsImportant risk factors that could cause our assumptions and estimates, and expectations and projections to be inaccurate and our actual results or events to differ materially from those expressed in or implied by the forward-looking statements contained in this presentation, are set out below. The realization of our forward-looking statements, essentially depends on our business performance which, in turn, is subject to many risks. Factors that could cause actual results to differ materially from expectations include, but are not limited to: credit risks - related to issuers of securities held in our investment portfolio, debtors, structured securities, reinsurers, counterparties, other financial institutions and other entities; market risks - related to the performance of equity markets; changes or volatility in interest rates or credit spreads or swap spreads; real estate investments; and fluctuations in foreign currency exchange rates; insurance risks - related to mortality, morbidity, longevity and policyholder behaviour; product design and pricing; the impact of higher-than-expected future expenses; and the availability, cost and effectiveness of reinsurance; business and strategic risks - related to global economic and political conditions; changes in distribution channels or Client behaviour including risks relating to market conduct by intermediaries and agents; the impact of competition; the design and implementation of business strategies; changes in the legal or regulatory environment, including capital requirements and tax laws; tax matters, including estimates and judgments used in calculating taxes; the performance of our investments and investment portfolios managed for Clients such as segregated and mutual funds; our international operations, including our joint ventures; market conditions that affect our capital position or ability to raise capital; downgrades in financial strength or credit ratings; and the impact of mergers, acquisitions and divestitures; operational risks - related to breaches or failure of information system security and privacy, including cyber-attacks; our ability to attract and retain employees; the execution and integration of mergers, acquisitions and divestitures; legal, regulatory compliance and market conduct, including the impact of regulatory inquiries and investigations; our information technology infrastructure; a failure of information systems and Internet-enabled technology; dependence on third-party relationships, including outsourcing arrangements; business continuity; model errors; information management; the environment, environmental laws and regulations and third-party policies; and liquidity risks - the possibility that we will not be able to fund all cash outflow commitments as they fall due.
The Company does not undertake any obligation to update or revise its forward-looking statements to reflect events or circumstances after the date of this presentation or to reflect the occurrence of unanticipated events, except as required by law.
23
Material Assumptions and Risk Factors
The Company’s medium-term financial objectives are forward looking non-IFRS financial measures and do not constitute guidance. Our ability to achieve those objectives is dependent on the Company’s success in achieving the growth initiatives, business objectives and productivity and expense targets that will be described in the Investor Day presentations and on certain other key assumptions that include:
1. no significant changes in the level of interest rates; 2. average total equity market return of approximately 8% per annum; 3. credit experience in line with best estimate actuarial assumptions; 4. no significant changes in the level of our regulatory capital requirements; 5. no significant changes to our effective tax rate; 6. no significant change in the number of shares outstanding; 7. other key assumptions include: no material changes to our hedging program, hedging costs that are consistent with our best estimate assumptions, no material assumption changes including updates to the
economic scenario generator and no material accounting standard changes, and 8. our best estimate actuarial assumptions used in determining our insurance and investment contract liabilities.
Our medium-term financial objectives are also based on best estimate actuarial assumptions as at December 31, 2016. Our underlying ROE is dependent upon capital levels and options for deployment of excess capital. Our objectives do not reflect the indirect effects of interest rate and equity market movements including the potential impacts on goodwill or the current valuation allowance on deferred tax assets as well as other items that may be non-operational in nature.
Important risk factors that could cause our assumptions and estimates, and expectations and projections in the Investor Day Presentations to be inaccurate and our actual results or events to differ materially from those expressed in or implied by forward-looking statements, including our medium-term financial objectives are set out below. The realization of our forward-looking statements, including our ability to meet our medium-term financial objectives, essentially depends on our business performance which, in turn, is subject to many risks. Factors that could cause actual results to differ materially from expectations include, but are not limited to: credit risks - related to issuers of securities held in our investment portfolio, debtors, structured securities, reinsurers, counterparties, other financial institutions and other entities; market risks - related to the performance of equity markets; changes or volatility in interest rates or credit spreads or swap spreads; real estate investments; and fluctuations in foreign currency exchange rates; insurance risks - related to mortality, morbidity, longevity and policyholder behaviour; product design and pricing; the impact of higher-than-expected future expenses; and the availability, cost and effectiveness of reinsurance; business and strategic risks - related to global economic and political conditions; changes in distribution channels or Client behaviour including risks relating to market conduct by intermediaries and agents; the impact of competition; the design and implementation of business strategies; changes in the legal or regulatory environment, including capital requirements and tax laws; tax matters, including estimates and judgments used in calculating taxes; the performance of our investments and investment portfolios managed for Clients such as segregated and mutual funds; our international operations, including our joint ventures; market conditions that affect our capital position or ability to raise capital; downgrades in financial strength or credit ratings; and the impact of mergers, acquisitions and divestitures; operational risks - related to breaches or failure of information system security and privacy, including cyber-attacks; our ability to attract and retain employees; the execution and integration of mergers, acquisitions and divestitures; legal, regulatory compliance and market conduct, including the impact of regulatory inquiries and investigations; our information technology infrastructure; a failure of information systems and Internet-enabled technology; dependence on third-party relationships, including outsourcing arrangements; business continuity; model errors; information management; the environment, environmental laws and regulations and third-party policies; and liquidity risks – the possibility that we will not be able to fund all cash outflow commitments as they fall due.
24