bmj open · for peer review only 3 abstract objective: information on adverse pregnancy outcomes is...
TRANSCRIPT

For peer review only
Weekly miscarriage rates in a community-based prospective
cohort study in rural western Kenya
Journal: BMJ Open
Manuscript ID bmjopen-2016-011088
Article Type: Research
Date Submitted by the Author: 11-Jan-2016
Complete List of Authors: Dellicour, stephanie; Liverpool School of Tropical Medicine, Clinical Sciences Aol, George; Kenya Medical Research Institute Centre for Global Health Research Ouma, Peter; Kenya Medical Research Institute Centre for Global Health Research Yan, Nicole; Liverpool School of Tropical Medicine Bigogo, Godfrey; Kenya Medical Research Institute Centre for Global Health
Research Hamel, Mary; Centers for Disease Control and Prevention Office of Infectious Diseases Burton, Deron; Centers for Disease Control and Prevention Oneko, Martina; Kenya Medical Research Institute Centre for Global Health Research Breiman, Robert; Emory University , Global Health Institute Slutsker, Laurence; Centers for Disease Control and Prevention Feikin, Daniel; Centers for Disease Control and Prevention Kariuki, Simon; Kenya Medical Research Institute Centre for Global Health Research
Odhiambo, Frank; Kenya Medical Research Institute Centre for Global Health Research Calip, Gregory; University of Illinois at Chicago Stergachis, Andreas; University of Washington School of Public Health Laserson, Kayla; Centers for Disease Control and Prevention ter Kuile, Feiko; Liverpool School of Tropical Medicine Desai, Meghna; Centers for Disease Control and Prevention
<b>Primary Subject Heading</b>:
Public health
Secondary Subject Heading: Obstetrics and gynaecology, Epidemiology
Keywords: Miscarriage, rate, prospective cohort, Kenya, sub-Saharan Africa
For peer review only - http://bmjopen.bmj.com/site/about/guidelines.xhtml
BMJ Open on 10 M
arch 2019 by guest. Protected by copyright.
http://bmjopen.bm
j.com/
BM
J Open: first published as 10.1136/bm
jopen-2016-011088 on 15 April 2016. D
ownloaded from

For peer review only
1
Weekly miscarriage rates in a community-based prospective cohort
study in rural western Kenya
Authors
Stephanie Dellicour*, Liverpool School of Tropical Medicine, Liverpool, UK, email:
George Aol, Kenya Medical Research Institute Centre for Global Health Research, Kisumu, Kenya,
email: [email protected]
Peter Ouma, Kenya Medical Research Institute Centre for Global Health Research, Kisumu, Kenya,
email: [email protected]
Nicole Yan, Liverpool School of Tropical Medicine, Liverpool, UK, email: [email protected]
Godfrey Bigogo, Kenya Medical Research Institute Centre for Global Health Research, Kisumu, Kenya,
email: [email protected]
Mary J. Hamel, Centers for Disease Control and Prevention, Atlanta GA, USA, email: [email protected]
Deron C. Burton, Centers for Disease Control and Prevention, Atlanta GA, USA, email: [email protected]
Martina Oneko, Kenya Medical Research Institute Centre for Global Health Research, Kisumu, Kenya,
email: [email protected]
Robert F. Breiman, Global Health Institute, Emory University, Atlanta GA, USA, email:
Laurence Slutsker, Centers for Disease Control and Prevention, Atlanta GA, USA, email:
Daniel Feikin, Centers for Disease Control and Prevention, Atlanta GA, USA, email: [email protected]
Simon Kariuki, Kenya Medical Research Institute Centre for Global Health Research, Kisumu, Kenya,
email: [email protected]
Frank Odhiambo, Kenya Medical Research Institute Centre for Global Health Research, Kisumu,
Kenya, email: [email protected]
Greg Calip, Pharmacy Systems, Outcomes and Policy Department, University of Illinois at Chicago,
USA, email: [email protected]
Andy Stergachis, Departments of Pharmacy and Global Health, Schools of Pharmacy and Public
Health, University of Washington, Seattle, USA, email: [email protected]
Kayla F. Laserson, Centers for Disease Control and Prevention, Atlanta GA, USA and India, email:
Page 1 of 21
For peer review only - http://bmjopen.bmj.com/site/about/guidelines.xhtml
BMJ Open
123456789101112131415161718192021222324252627282930313233343536373839404142434445464748495051525354555657585960
on 10 March 2019 by guest. P
rotected by copyright.http://bm
jopen.bmj.com
/B
MJ O
pen: first published as 10.1136/bmjopen-2016-011088 on 15 A
pril 2016. Dow
nloaded from

For peer review only
2
Feiko O. ter Kuile, Liverpool School of Tropical Medicine, Liverpool, UK, email:
Meghna Desai, Centers for Disease Control and Prevention, Atlanta GA, USA, email: [email protected]
*Corresponding author
Dr Stephanie Dellicour
Liverpool School of Tropical Medicine
Pembroke Place
Liverpool L3 5QA, UK
Tel: +44(0)151 705 3346
E-mail: [email protected]
Page 2 of 21
For peer review only - http://bmjopen.bmj.com/site/about/guidelines.xhtml
BMJ Open
123456789101112131415161718192021222324252627282930313233343536373839404142434445464748495051525354555657585960
on 10 March 2019 by guest. P
rotected by copyright.http://bm
jopen.bmj.com
/B
MJ O
pen: first published as 10.1136/bmjopen-2016-011088 on 15 A
pril 2016. Dow
nloaded from

For peer review only
3
Abstract Objective: Information on adverse pregnancy outcomes is important to monitor the impact of public
health interventions. Miscarriage is a challenging endpoint to ascertain and there is scarce
information on its rate in low income countries. The objective was to estimate the background rate
and cumulative probability of miscarriage in rural western Kenya.
Design: This was a population-based prospective cohort
Participants and Setting: Women of childbearing age were followed prospectively to identify
pregnancies and ascertain their outcomes in Siaya County, western Kenya. The cohort study was
carried out in 33 adjacent villages under health and demographic surveillance.
Outcome measure: Miscarriage
Results: Between 2011 and 2013, among 5,536 women of childbearing age, 1,453 pregnancies were
detected and 1,134 were included in the analysis. The rate of miscarriage over the first 28 weeks of
gestation was 16.4 per 100 pregnancies (95% CI: 13.3- 20.4) and the cumulative probability was
18.9%. The weekly miscarriage rate declined steadily with increasing gestation until approximately
20 weeks. Known risk factors for miscarriage were confirmed such as maternal age, gravidity,
occupation, household wealth and HIV infection.
Conclusion: This is the first report of weekly miscarriage rates in a rural African setting in the context
of high HIV and malaria prevalence. Future studies should consider the involvement of community
health workers to identify pregnancy cohort of early gestation for better data on the actual number
of pregnancies and the assessment of miscarriage.
Key words Miscarriage, rate, prospective cohort, Kenya, sub-Saharan Africa
Strengths and limitations of this study
• This study identified pregnancies early from the general population in a rural setting in
western Kenya and refusal rate was low (6%).
• The study is strengthened by the use of survival analysis with left truncation and the life
table method to estimate background rate and cumulative probability of miscarriage
respectively.
• Misclassification between spontaneous and induced abortion cannot be ruled out, which is a
limitation of the present study. Given estimates were within the expected range and that
known risk factors for miscarriages could be confirmed, this is unlikely to have had
substantial effect on the estimates.
• Estimates for the rate of miscarriage in early week of gestation were less precise due to the
low numbers of pregnancies detected <6 weeks gestation.
Page 3 of 21
For peer review only - http://bmjopen.bmj.com/site/about/guidelines.xhtml
BMJ Open
123456789101112131415161718192021222324252627282930313233343536373839404142434445464748495051525354555657585960
on 10 March 2019 by guest. P
rotected by copyright.http://bm
jopen.bmj.com
/B
MJ O
pen: first published as 10.1136/bmjopen-2016-011088 on 15 A
pril 2016. Dow
nloaded from

For peer review only
4
Background Miscarriage is a critical indicator of embryotoxicity and an important outcome for the study of
embryotoxic effects of environmental, occupational and medication risks [1-3]. Furthermore it is a
relevant endpoint to track the progress of reproductive health programs and their impact on
maternal health. Without accounting for miscarriage, maternal and reproductive health related
indicators miss a significant number of unreported pregnancies that are often not seen by the health
system and are not recorded. For instance, indicators for antenatal care coverage is based on the
total number of women who had a live birth in a specific time period not accounting for up to 30% of
pregnancies that are lost either to miscarriage or stillbirth [4, 5]. This may lead to unrepresentative
estimates of access and utilization of health care for high risk pregnancies ending in miscarriage or
stillbirth. Despite this being a significant reproductive health outcome, data on miscarriage rates in
low and middle income countries is scarce. Studies from industrialised countries report rates of
miscarriage in clinically recognised pregnancies (i.e. from five gestational weeks following the last
menstrual period (LMP)) that vary between 11% and 22% [6-9].
Miscarriage is a challenging endpoint to ascertain and accurate rates of miscarriage difficult to
estimate. Crude rate estimates (i.e. dividing the number of miscarriages by the total number of
pregnancies under study) are appropriate when it is possible to detect and enroll pregnancies from
the time of conception from a representative sample of the population. Most miscarriages occur
early in pregnancy prior to clinical detection of pregnancy [10]; the rapidly decreasing risk of
miscarriage across the first trimester of pregnancy highlights the influence of gestational weeks at
time of pregnancy detection in study or program settings on the estimated miscarriage rates.
Therefore rate estimates should account for left truncation and estimates should account, as far as it
is possible, for the actual number of pregnancies under observation at each specific gestational week
[11-13]. Few studies have ascertained pregnancies close to the time of conception by enrolling
participants that are planning to conceive and consent to regular pregnancy tests [7, 8, 14]. Since a
significant proportion of pregnancies are unplanned[15], data from such population may have
limited generalizability. Other studies recruiting women from antenatal clinics miss pregnancy loss
occurring before initiation of antenatal care (ANC) and may also be prone to selection bias as women
presenting early for antenatal care may represent higher risk pregnancies than women presenting
later[11]. A low proportion of women initiate ANC in their first trimester in sub-Saharan Africa,
recent estimates varied between 11%-54% [16-18]. The methodological constraints for measuring
this outcome require early pregnancy detection and prospective follow up from a population-based
representative sample of all women of childbearing age (WOCBA) to minimise selection bias. There
are no published data on such studies in low income countries. The study presented here describes
the rate of miscarriage and associated risk factors in a community based prospective cohort study of
WOCBA in rural western Kenya.
Methods
Overview of study design
A prospective cohort of pregnant women was enrolled within a pharmacovigilance study to assess
the risk of inadvertent first trimester exposures to artemisinin combination therapy (being reported
elsewhere[19]) between February 2011 and February 2012. Pregnancies were identified as early as
Page 4 of 21
For peer review only - http://bmjopen.bmj.com/site/about/guidelines.xhtml
BMJ Open
123456789101112131415161718192021222324252627282930313233343536373839404142434445464748495051525354555657585960
on 10 March 2019 by guest. P
rotected by copyright.http://bm
jopen.bmj.com
/B
MJ O
pen: first published as 10.1136/bmjopen-2016-011088 on 15 A
pril 2016. Dow
nloaded from

For peer review only
5
possible through health facility and community-based strategies (described below), and followed
prospectively (i.e. before the pregnancy outcome was known) to document pregnancy outcome.
Study site
The study area was located in Siaya County, lying northeast of Lake Victoria in Nyanza Province,
western Kenya. The cohort study was carried out in 33 adjacent villages under the Kenya Medical
Research Institute-Centers for Disease Control and Prevention (KEMRI-CDC) health and demographic
surveillance system area (KEMRI-CDC HDSS [20]). Nyanza Province has a high burden of disease and
health indicators that are worse than overall Kenyan national statistics.[21] Malaria transmission is
perennial and holo-endemic with peaks following the two rainy seasons. An annual cross-sectional
survey in this area showed parasitaemia of 42% in under-5 years old, 60% in 5-14 years old and 20%
in over 14 year old (unpublished KEMRI/CDC data for 2010). Whereas the national HIV prevalence is
6.3% (4% for men and 8% for women), the prevalence for Nyanza Province is close to double, around
14% (11% for men and 16% for women).[22]
Community mobilization and formative research
The acceptability of community-based pregnancy testing was unknown but important for this study.
Community mobilisation activities included a series of meetings over several months with the
District Medical Officer for Health, village chiefs, district officers and counsellors, the community
advisory board was set up by KEMRI-CDC, and community members to introduce and get feedback
on the proposed study plans. “Baraza” (community meetings) were held in all 33 villages within the
study area. Study brochures were also distributed through the community meetings and at the
central health facility. Formative research involving ten focus group discussions was carried out with
the aim to explore the socio-cultural context around pregnancy and to investigate acceptability of
proposed study procedures (reported elsewhere [23, 24]).
Recruitment of WOCBA and pregnancy detection
Following community mobilisation, door-to-door enrolment was carried out to inform eligible
WOCBA. All women age 15-49 years resident in households within the defined HDSS catchment area
and participating in a population-based disease surveillance project (PBIDS) [25, 26] were eligible for
enrolment. Women were excluded if they refused to participate, were unable to provide informed
consent due to mental, physical or social inability or if they refused to be followed up to the end of
pregnancy. Enrolment was active throughout the study period whereby newly eligible women (who
turned 15 years of age during the study period or in-migrant joining PBIDS) were invited to join the
study.
WOCBA who consented to participate were asked if they might be pregnant and offered a pregnancy
test at the time of enrolment and again approximately every three months thereafter by village-
based community interviewers. Any participant with a detected pregnancy was referred to the
antenatal clinic at the referral health facility, Lwak Hospital, where trained study nurses confirmed
the pregnancy and offered free ANC. Additionally, all pregnant patients presenting at Lwak Hospital
were assessed for study eligibility by a study nurse and enrolled if all selection criteria were met.
Gestational age assessment
Gestational age was assessed using multiple methods, including ultrasound scans at the first
antenatal visit at Lwak ANC (for participants presenting before 24 weeks); reported first day of LMP;
reported gestational age at the time of pregnancy loss; Ballard scoring for live-births captured within
Page 5 of 21
For peer review only - http://bmjopen.bmj.com/site/about/guidelines.xhtml
BMJ Open
123456789101112131415161718192021222324252627282930313233343536373839404142434445464748495051525354555657585960
on 10 March 2019 by guest. P
rotected by copyright.http://bm
jopen.bmj.com
/B
MJ O
pen: first published as 10.1136/bmjopen-2016-011088 on 15 A
pril 2016. Dow
nloaded from

For peer review only
6
3 days of delivery [27] ; and, fundal height measurements recorded at ANC. Not all methods were
available for all pregnancies since some were not seen at ANC (no fundal height or ultrasound
measurement available) or were seen at ANC but beyond 24 weeks. The Ballard score was only
available for live-births seen within three days of delivery. Furthermore, some participants could not
recall their LMP or, in some instances, had not resumed their menses since their previous pregnancy.
For this analysis, gestational age was determined using the most accurate measurement available
for each participant. Methods in order of decreasing accuracy were: ultrasound scan taken before 24
weeks gestation, Ballard estimates, LMP or reported gestation at time of pregnancy loss and lastly
gestational age derived from fundal height assessment.
Risk factors
Obstetric history and ANC laboratory information collected routinely at antenatal booking
(haemoglobin level, HIV and syphilis testing, and malaria microscopy) were extracted from the ANC
records at Lwak Hospital or antenatal cards by study nurses. Demographic characteristics and
medical history, including illnesses and drug used during the current pregnancy was collected
through interviews at each study visit at ANC and at the time of pregnancy outcome follow up.
Household level wealth quintiles were obtained from data collected routinely through the HDSS
(such as occupation of household head, primary source of drinking water, use of cooking fuel, in-
house assets [e.g. radio and television] and livestock) which were calculated as a weighted average
using multiple correspondence analysis [28].
Pregnancy outcome
Pregnancy outcomes were assessed using a combination of health facility and home-based follow-
ups. The latter is particularly relevant for miscarriages, because the vast majority of these events
occur in the community and not in the health facilities. Village-based staff received monthly lists of
participants with estimated delivery dates in their respective catchment area. Study nurses were
notified of pregnancy outcomes by village-based staff and follow ups were done either at home or at
the health facility. A detailed structured questionnaire about the delivery and outcome was
administered face-to-face. Pregnancy outcomes captured included: pregnancy losses (miscarriages,
induced abortions and stillbirths), live-births, and major congenital malformations detectable at
birth by surface examination. We defined miscarriage, also called spontaneous abortion, as a
pregnancy that ends spontaneously before 28 weeks gestation as per the World Health Organization
definition of fetus viability [29]. A fetal death after viable gestational age is defined as a stillbirth.
Data analysis
Analyses were performed using Stata v12.1 (StataCorp LP, College Station, Texas). Survival analysis
with left truncation was used to estimate the miscarriage rate by gestational week to account for
delayed pregnancy detection and the range in gestational ages at the time of pregnancy detection.
Left truncation was used to account for survival bias as the average gestational age that pregnancies
were detected was around 13 weeks and only pregnancies that survived the early weeks of gestation
(the highest risk of miscarriage) were followed prospectively[12, 30]. The life table methods were
used to calculate the cumulative probability of survival and cumulative probability of miscarriage.
Standard methods were used to calculate probability of miscarriage by gestational week [6]. In brief,
the miscarriage rate during the specific week of gestation was converted to probability using the
formula: (Miscarriage Rate)/(1+ (Miscarriage Rate x 0.5)). The remaining risk of miscarriage by
gestational week was calculated by subtracting the probability of surviving the remaining weeks
Page 6 of 21
For peer review only - http://bmjopen.bmj.com/site/about/guidelines.xhtml
BMJ Open
123456789101112131415161718192021222324252627282930313233343536373839404142434445464748495051525354555657585960
on 10 March 2019 by guest. P
rotected by copyright.http://bm
jopen.bmj.com
/B
MJ O
pen: first published as 10.1136/bmjopen-2016-011088 on 15 A
pril 2016. Dow
nloaded from
For peer review only
7
from 1. The probability of fetal survival during the remaining weeks was the product of the
probability of survival for week x and the probability of survival for week x+1.
Ethical review and consent
The study was reviewed and approved by the institutional review boards of CDC (No. 5889), KEMRI
(No. 1752) and the Liverpool School of Tropical Medicine (No. 09.70). Written informed consent or
assent was obtained from each participant including consent to linking individual data to PBIDS and
HDSS data.
Results
Participant enrolment and study uptake
Between February 15th 2011 and February 15th 2013, 5,536 (94% of 5911 WOCBA approached)
consented to participate and 1,453 pregnancies among these women were detected; about 10% of
participants were detected as pregnant at the time of enrolment. Refusal to take part in the study
was low at 6% of screened participants, as were refusals to take pregnancy tests during follow up
home visits (2%). Out of the 1,453 identified pregnancies, 1,134 (78%) were included in the data
analysis for miscarriage; 319 were excluded because pregnancy detection occurred beyond 28 weeks
gestation (219) or at the time of pregnancy outcome (33), lack of information on gestational age of
exposure (21), loss to follow up immediately after pregnancy detection (41), or inconsistent
pregnancy end dates (5) (figure 1). The 1,134 pregnancies involved a total of 1,079 women, 55 of
whom had two pregnancies and 1,024 who had one pregnancy during the study period.
Overall, 62% of deliveries took place at a health facility, and 25% of identified miscarriages were
cared for at a health facility. Sixty seven percent of pregnancy outcomes were captured less than
one week after the end of pregnancy; however, for miscarriage this proportion was only 20%. The
median number of days between outcome and follow up was 3 overall (range: 0-755) and 24 (range:
0-602) for miscarriage. This reflects the fact that follow ups were arranged at the convenience of
participants and to ensure suitable amount of time between the event and home visit by study staff.
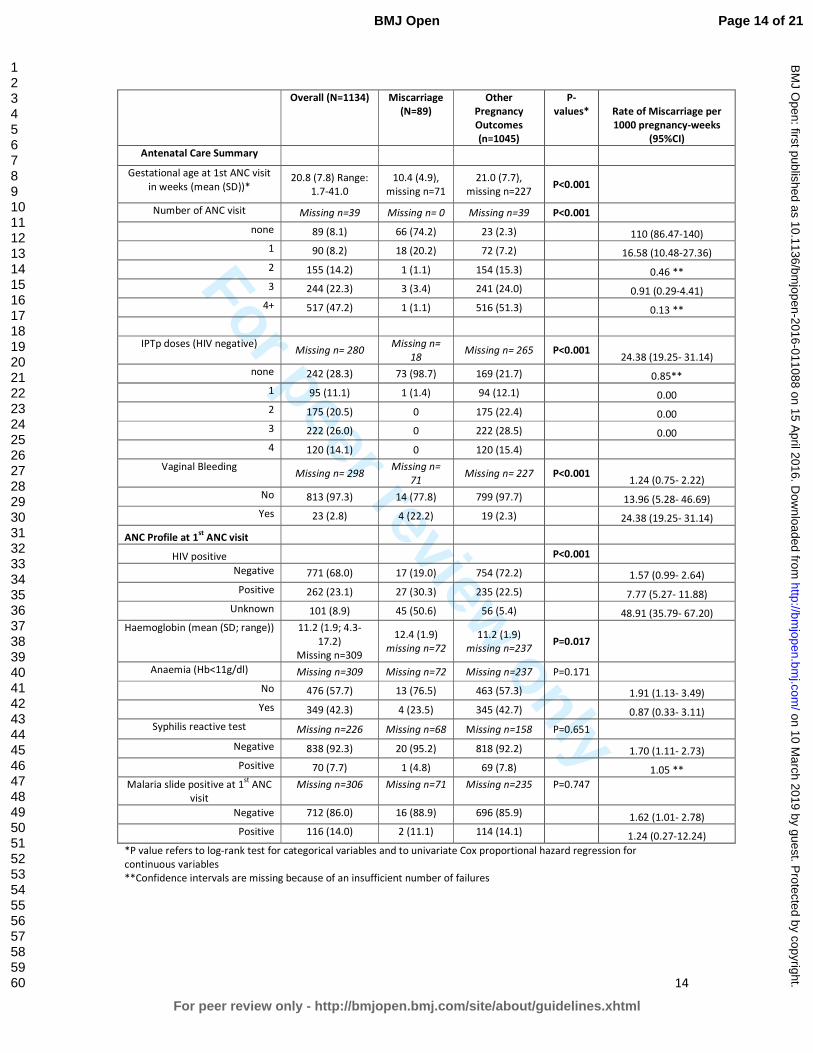
Participant characteristics and risk factors for miscarriage
The mean gestational age at time of pregnancy detection was 13.3 weeks (standard deviation [sd]
6.9) and median was 12.1 weeks. The mean maternal age was 26.1 years with women who
miscarried being slightly older (29.5 [sd=8] years mean age vs 25.8 years [sd=7]) (Table 1). Overall
the vast majority were married (79%) and about half of the women had completed primary
education, but few had completed secondary school, with no significant difference between the
groups. Farming was the main income generating activity for a higher proportion of women who
miscarried compared to those with other pregnancy outcomes. There was a statistically significant
difference in wealth between groups, with women who miscarried generally poorer than those with
other pregnancy outcomes (Table 1). A higher proportion of miscarriage cases occurred in
multigravid women with four or more pregnancies and about 25% of cases reported having a
previous miscarriage (compared to 13% for other pregnancy outcomes). Only 26% of women who
miscarried had any history of antenatal care (compared to 98% in the other group) which may reflect
the fact that most miscarriages occur before the average gestational age (21 weeks) when women
initiate ANC in this area. Consequently very few received any intermittent preventive treatment of
malaria in pregnancy and an HIV test result was not available for over half of the miscarriage cases
Page 7 of 21
For peer review only - http://bmjopen.bmj.com/site/about/guidelines.xhtml
BMJ Open
123456789101112131415161718192021222324252627282930313233343536373839404142434445464748495051525354555657585960
on 10 March 2019 by guest. P
rotected by copyright.http://bm
jopen.bmj.com
/B
MJ O
pen: first published as 10.1136/bmjopen-2016-011088 on 15 A
pril 2016. Dow
nloaded from

For peer review only
8
(since HIV tests are offered during first ANC visit). However, among those with known HIV status
(44), 30% were HIV positive compared to 23% among those with other pregnancy outcomes.
Cumulative probability of miscarriage and rate per gestational week
There were 89 (7.9%) miscarriages among the 1,134 pregnancies included in the analysis. The mean
gestational age at the time of miscarriage was 14.4 weeks (SD: 5.7) and the median was 13 weeks
(range: 4.3-28); 75% of miscarriages occurred by 18 weeks. Overall the rate of miscarriage was 0.59
per 100 pregnancy-weeks (95%CI: 0.47- 0.73) calculated by survival analysis with left truncation and
the rate of miscarriage over the first 28 weeks of pregnancy estimated at 16.4 per 100 pregnancy
(95% CI: 13.3- 20.4). The cumulative probability of miscarriage was 18.9%. The weekly miscarriage
rate declined steadily with increasing gestation (see Figure 2 and Table 2 for miscarriage weekly
rates and probabilities) until approximately 16 to 20 weeks, after which it remained steady at
approximately 0.3 per 100 pregnancy-weeks. Figure 3 shows the cumulative pregnancy survival
probabilities per gestation week.
Discussion
This study provides the first description of the miscarriage rate in this rural Kenyan population in the
context of high malaria and HIV prevalence; there are very little data on miscarriage background rate
for sub-Saharan Africa in general. The cumulative probability of miscarriages by 28 weeks gestation
accounting for staggered pregnancy detection in our study population was 18.9%, and the
probability by week declined from 16 weeks onward. The true rate is likely to be higher as
information from very early pregnancies (e.g. < 6 weeks gestation) was not captured and the
average gestational age of pregnancy detection was 13.3 weeks, which meant that only 57% of
pregnancies were detected during the highest risk period for miscarriage (the 1st trimester).
However, the rate of 19% is similar to that reported by McGready et al. from the Thai-Burmese
border (20%) [31] and consistent with that observed in other prospective studies in non-malarious
areas, which ranges from 10% to 22% [6, 7, 9, 14]. Known risk factors for miscarriages were
confirmed in this population, including older maternal age [32], more than three previous
pregnancies[33], having a previous pregnancy loss [34], HIV infection [35, 36], occupation [2, 3] and
lower household wealth[37].
Acceptability of pregnancy testing was surprisingly high and refusal to take a pregnancy test
following enrolment remained around 2% throughout the home-based surveys. In this community,
engaging trained village based staff to offer pregnancy tests through regular home-visits worked well
as reflected by the high acceptance rate (94%) and low loss to follow up (8%). Since initiation of this
study, other studies have used trained fieldworkers (both male and female) to do pregnancy
detection and reported similar success. For future studies of miscarriage, we recommend working
with the community to identify the most suitable approach to identify early pregnancy. Particular
attention should be given to adolescent girls, and adequate youth-friendly referral services should
be identified. Community health workers now being deployed in many sub-Saharan African
countries [38] could play a key role in early pregnancy detection, thus providing better data on the
actual number of pregnancies for programmatic planning and monitoring as well as referring
pregnant women to initiate ANC in the first trimester.
A few limitations should be noted. Despite our best effort to capture pregnancy early, the relatively
low numbers of pregnancy detected before 12 weeks gestation (508) generate moderately imprecise
Page 8 of 21
For peer review only - http://bmjopen.bmj.com/site/about/guidelines.xhtml
BMJ Open
123456789101112131415161718192021222324252627282930313233343536373839404142434445464748495051525354555657585960
on 10 March 2019 by guest. P
rotected by copyright.http://bm
jopen.bmj.com
/B
MJ O
pen: first published as 10.1136/bmjopen-2016-011088 on 15 A
pril 2016. Dow
nloaded from

For peer review only
9
estimates and wide confidence intervals particularly in early weeks (<6 weeks gestation). Depending
on the gestational age ascertainment method used there could have been more or less
measurement error leading to misclassification of time at entry and exit in the cohort, and therefore
miscarriage rate in a specific gestation week. Lastly, there is risk that induced abortions were
misclassified as miscarriage or as lost to follow up. Kenya has strict laws on induced abortion, and it
is only permitted if, according to a trained health professional, there is a need for emergency
treatment, or the life or health of the mother is in danger, or if permitted by any other written law.
Due to restrictive laws and stigmatization, underreporting is common. Nine induced abortions (<1%)
were reported in this study which is much lower than a reported expected ratio of 30 abortions per
100 births for Kenya [39]. However it is probable that women consenting to participate in the study
would be at lower risk of seeking induced abortion by accepting to be followed up through
pregnancy. This could lead to selection bias but the refusal rate was low at 5% and therefore this is
unlikely to affect estimates substantially.
Conclusion
This prospective cohort study in WOCBA provides the first estimates of weekly miscarriage rates in a
rural African setting in the context of high HIV and malaria prevalence. This information should be
valuable to researchers and program managers for resource planning, to monitor trends and impact
of interventions as well as to clinicians in gauging miscarriage rates at a given gestational week. We
have demonstrated the feasibility of conducting a community based pregnancy cohort in a resource-
constrained setting for analysing the outcome of pregnancies with respect to miscarriage risk.
List of Abbreviations
ANC, antenatal care; CDC, US Centers for Disease Control and Prevention; HDSS, health and
demographic surveillance system; KEMRI, Kenya Medical Research Institute; LMP, last menstrual
period; PBIDS, population-based infectious disease surveillance
Competing interest
The authors declare that they have no competing interests.
Acknowledgements
The work presented in this paper was performed under the KEMRI and CDC Collaboration in western
Kenya. We are very grateful to all participants for taking part in the study. We wish to thank the
EMEP study team for their perseverance and hard work. Furthermore we wish to thank the Asembo
District health and medical team and the Lwak Mission Hospital Board for their support. We also
wish to thank Dr. John Williamson and Jane Bruce for the statistical support and advice. KEMRI-CDC
HDSS is a member of the INDEPTH Network. The findings and conclusions in this paper are those of
the authors and do not necessarily represent the views of the US Centers for Disease Control and
Prevention. This paper is published with the permission of the KEMRI Director.
Authors contribution
Conceived and designed the experiments: SD FtK AS LS MJH. Conducted field work: SD GA PO MO
GB. Analyzed the data: SD GC. Contributed data/analysis tools: GB DF RFB SK DB NY FO FtK.
Interpreted the data: SD, DB, RFB, MJH, LS, DF, SK, KL, AS, MD, FtK. Wrote the first draft of the
manuscript: SD FtK MD. All authors reviewed, revised and approved the final version of the
manuscript.
Page 9 of 21
For peer review only - http://bmjopen.bmj.com/site/about/guidelines.xhtml
BMJ Open
123456789101112131415161718192021222324252627282930313233343536373839404142434445464748495051525354555657585960
on 10 March 2019 by guest. P
rotected by copyright.http://bm
jopen.bmj.com
/B
MJ O
pen: first published as 10.1136/bmjopen-2016-011088 on 15 A
pril 2016. Dow
nloaded from
For peer review only
10
Funding
This work was partly supported by the Malaria in Pregnancy (MiP) Consortium, which is funded
through a grant from the Bill and Melinda Gates Foundation to the Liverpool School of Tropical
Medicine, UK and partly by the US Centers for Disease Control and Prevention (CDC), Division of
Parasitic Diseases and Malaria through a cooperative agreement with Kenya Medical Research
Institute (KEMRI), Center for Global Health Research (CGHR), Kisumu, Kenya. The funders had no role
in study design, data collection and analysis, decision to publish, or preparation of the manuscript.
Data sharing statement
Additional data are available by emailing the KEMRI/CDC Malaria Branch data manager:
References
1. Goldstein DJ, Sundell KL, DeBrota DJ, Offen WW: Determination of pregnancy outcome risk
rates after exposure to an intervention. Clinical pharmacology and therapeutics 2001,
69(1):7-13.
2. Kline JK: Maternal occupation: effects on spontaneous abortions and malformations.
Occup Med 1986, 1(3):381-403.
3. Kumar S: Occupational, environmental and lifestyle factors associated with spontaneous
abortion. Reproductive sciences 2011, 18(10):915-930.
4. Millennium Development Goals Indicators
[http://mdgs.un.org/unsd/mdg/Metadata.aspx?IndicatorId=0&SeriesId=762]
5. World Health Organization: Reproductive Health Indicators: Guidelines for their
generation, interpretation and analysis for global monitoring. . In. Geneva: World Health
Organization; 2006.
6. Avalos LA, Galindo C, Li D-K: A Systematic Review to Calculate Background Miscarriage
Rates using Life Table Analysis. Birth Defects Research (Part A) 2012, 94(417).
7. Wilcox AJ, Weinberg CR, O'Connor JF, Baird DD, Schlatterer JP, Canfield RE, Armstrong EG,
Nisula BC: Incidence of early loss of pregnancy. N Engl J Med 1988, 319(4):189-194.
8. Zinaman MJ, Clegg ED, Brown CC, O'Connor J, Selevan SG: Estimates of human fertility and
pregnancy loss. Fertil Steril 1996, 65(3):503-509.
9. Ellish NJ, Saboda K, O'Connor J, Nasca PC, Stanek EJ, Boyle C: A prospective study of early
pregnancy loss. Hum Reprod 1996, 11(2):406-412.
10. Regan L, Rai R: Epidemiology and the medical causes of miscarriage. Bailliere's best practice
& research Clinical obstetrics & gynaecology 2000, 14(5):839-854.
11. Goldhaber MK, Fireman BH: The fetal life table revisited: spontaneous abortion rates in
three Kaiser Permanente cohorts. Epidemiology 1991, 2(1):33-39.
12. Howards PP, Hertz-Picciotto I, Poole C: Conditions for bias from differential left truncation.
Am J Epidemiol 2007, 165(4):444-452.
13. Margulis AV, Mittleman MA, Glynn RJ, Holmes LB, Hernandez-Diaz S: Effects of gestational
age at enrollment in pregnancy exposure registries. Pharmacoepidemiol Drug Saf 2015,
24(4):343-352.
14. Wang X, Chen C, Wang L, Chen D, Guang W, French J: Conception, early pregnancy loss, and
time to clinical pregnancy: a population-based prospective study. Fertil Steril 2003,
79(3):577-584.
15. Singh S, Sedgh G, Hussain R: Unintended pregnancy: worldwide levels, trends, and
outcomes. Studies in family planning 2010, 41(4):241-250.
16. Central Statistical Agency [Ethiopia], ICF International: Ethiopia Demographic and Health
Survey 2011. In. Addis Ababa, Ethiopia and Calverton, Maryland, USA: Central Statistical
Agency and ICF International; 2012.
Page 10 of 21
For peer review only - http://bmjopen.bmj.com/site/about/guidelines.xhtml
BMJ Open
123456789101112131415161718192021222324252627282930313233343536373839404142434445464748495051525354555657585960
on 10 March 2019 by guest. P
rotected by copyright.http://bm
jopen.bmj.com
/B
MJ O
pen: first published as 10.1136/bmjopen-2016-011088 on 15 A
pril 2016. Dow
nloaded from

For peer review only
11
17. Ghana Statistical Service (GSS), Ghana Health Service (GHS), ICF Macro: Ghana Demographic
and Health Survey 2008. In. Accra, Ghana: GSS, GHS, and ICF Macro; 2009.
18. Pell C, Menaca A, Were F, Afrah NA, Chatio S, Manda-Taylor L, Hamel MJ, Hodgson A, Tagbor
H, Kalilani L et al: Factors affecting antenatal care attendance: results from qualitative
studies in Ghana, Kenya and Malawi. PLoS One 2013, 8(1):e53747.
19. Dellicour S, Desai M, Aol G, Oneko M, Ouma P, Bigogo G, Burton D, Breiman RF, Hamel M,
Slutsker L et al: Risks of miscarriage and inadvertent exposure to artemisinin derivatives in
the first trimester of pregnancy: a prospective study in western Kenya. In preparation.
20. Odhiambo FO, Laserson KF, Sewe M, Hamel MJ, Feikin DR, Adazu K, Ogwang S, Obor D,
Amek N, Bayoh N et al: Profile: the KEMRI/CDC Health and Demographic Surveillance
System--Western Kenya. Int J Epidemiol 2012, 41(4):977-987.
21. Kenya National Bureau of Statistics (KNBS) and ICF Macro: Kenya Demographic and Health
Survey 2008-09. Calverton, Maryland, USA.
http://www.measuredhs.com/pubs/pdf/FR229/FR229.pdf; 2011.
22. Kenya National Bureau of Statistics (KNBS), Macro I: Kenya Demographic and Health Survey
2008-09. In. Edited by Macro KaI. Calverton, Maryland; 2010.
23. Dellicour S, Desai M, Mason L, Odidi B, Aol G, Phillips-Howard PA, Laserson KF, Ter Kuile FO:
Exploring risk perception and attitudes to miscarriage and congenital anomaly in rural
Western kenya. PLoS One 2013, 8(11):e80551.
24. Mason L., Dellicour S., Ter Kuile F., Ouma P., Phillips-Howard P., Were F., K. L, M. D: Barriers
and facilitators to antenatal and delivery care in western Kenya: a qualitative study. BMC
Pregnancy and Childbirth 2015, 15(26).
25. Bigogo G, Audi A, Aura B, Aol G, Breiman RF, Feikin DR: Health-seeking patterns among
participants of population-based morbidity surveillance in rural western Kenya:
implications for calculating disease rates. Int J Infect Dis 2010, 14(11):e967-973.
26. Feikin DR, Audi A, Olack B, Bigogo GM, Polyak C, Burke H, Williamson J, Breiman RF:
Evaluation of the optimal recall period for disease symptoms in home-based morbidity
surveillance in rural and urban Kenya. Int J Epidemiol 2010, 39(2):450-458.
27. Ballard JL, Khoury JC, Wedig K, Wang L, Eilers-Walsman BL, Lipp R: New Ballard Score,
expanded to include extremely premature infants. The Journal of pediatrics 1991,
119(3):417-423.
28. McKenzie D: Measuring inequality with asset indicators. Journal of Population Economics
2005, 18(2):229.
29. World Health Organization: Spontaneous and Induced Abortion: Report of a WHO scientific
group. In: WHO Technical Report Series. vol. 461. Geneva; 1970.
30. Meister R, Schaefer C: Statistical methods for estimating the probability of spontaneous
abortion in observational studies--analyzing pregnancies exposed to coumarin derivatives.
Reprod Toxicol 2008, 26(1):31-35.
31. McGready R, Lee SJ, Wiladphaingern J, Ashley EA, Rijken MJ, Boel M, Simpson JA, Paw MK,
Pimanpanarak M, Mu O et al: Adverse effects of falciparum and vivax malaria and the
safety of antimalarial treatment in early pregnancy: a population-based study. Lancet
Infect Dis 2012, 12(5):388-396.
32. Smith KE, Buyalos RP: The profound impact of patient age on pregnancy outcome after
early detection of fetal cardiac activity. Fertil Steril 1996, 65(1):35-40.
33. Kline J: I. An epidemiological review of the role of gravidity in spontaneous abortion. Early
Hum Dev 1978, 1(4):337-344.
34. Regan L, Braude PR, Trembath PL: Influence of past reproductive performance on risk of
spontaneous abortion. BMJ 1989, 299(6698):541-545.
35. Brocklehurst P, French R: The association between maternal HIV infection and perinatal
outcome: a systematic review of the literature and meta-analysis. Br J Obstet Gynaecol
1998, 105(8):836-848.
Page 11 of 21
For peer review only - http://bmjopen.bmj.com/site/about/guidelines.xhtml
BMJ Open
123456789101112131415161718192021222324252627282930313233343536373839404142434445464748495051525354555657585960
on 10 March 2019 by guest. P
rotected by copyright.http://bm
jopen.bmj.com
/B
MJ O
pen: first published as 10.1136/bmjopen-2016-011088 on 15 A
pril 2016. Dow
nloaded from

For peer review only
12
36. Temmerman M, Lopita MI, Sanghvi HC, Sinei SK, Plummer FA, Piot P: The role of maternal
syphilis, gonorrhoea and HIV-1 infections in spontaneous abortion. International journal of
STD & AIDS 1992, 3(6):418-422.
37. Norsker FN, Espenhain L, S AR, Morgen CS, Andersen PK, Nybo Andersen AM:
Socioeconomic position and the risk of spontaneous abortion: a study within the Danish
National Birth Cohort. BMJ open 2012, 2(3).
38. McCord GC, Liu A, Singh P: Deployment of community health workers across rural sub-
Saharan Africa: financial considerations and operational assumptions. Bulletin of the World
Health Organization 2013, 91(4):244-253B.
39. African Population and Health Research Center, Ministry of Health Kenya, Ipas, Guttmacher
Institute: Incidence and Complications of Unsafe Abortion in Kenya: Key Findings of a
National Study. In. Nairobi, Kenya; 2013.
Page 12 of 21
For peer review only - http://bmjopen.bmj.com/site/about/guidelines.xhtml
BMJ Open
123456789101112131415161718192021222324252627282930313233343536373839404142434445464748495051525354555657585960
on 10 March 2019 by guest. P
rotected by copyright.http://bm
jopen.bmj.com
/B
MJ O
pen: first published as 10.1136/bmjopen-2016-011088 on 15 A
pril 2016. Dow
nloaded from

For peer review only
13
Table 1. Participant characteristics according to pregnancy outcomes (number and percentage in brackets or otherwise
specified).
Overall
(N=1134) Miscarriage (N=89)
Other Pregnancy
Outcomes (n=1045)
P-
values*
Rate of Miscarriage
per 1000 pregnancy-
weeks (95%CI)
Gestational age at
detection in weeks (mean
(SD))
13.3 (6.9;
0-27.9) 7.8 (4.4) 13.7 (6.9) P=0.094
Age in years (mean (SD)) 26.1 (6.8) 29.5 (7.9) 25.8 (6.6) P<0.001
Age categories
P<0.001
15-20 285 (25.1) 14 (15.7) 271 (25.9) 3.77 (2.28- 6.71)
21-25 287 (25.3) 14 (15.7) 273 (26.1) 3.47 (2.02- 6.47)
26-30 255 (22.5) 16 (18.0) 239 (22.9) 4.52 (2.81- 7.71)
31-35 179 (15.8) 21 (23.6) 158 (15.1) 8.81 (5.87-13.79)
>35 128 (11.3) 24 (27.0) 104 (10.0) 15.47 (10.26- 24.18)
Education level Missing n=
18 Missing n= 2 Missing n= 16 P=0.634
None/ Primary not
completed 495 (44.4) 38 (43.7) 457 (44.4)
5.66 (4.10- 8.04)
Primary completed 533 (47.8) 44 (50.6) 489 (47.5) 6.26 (4.70- 8.51)
Secondary completed 88 (7.9) 5 (5.8) 83 (8.1) 4.11 (1.39- 17.15)
Occupation Missing n=
31 Missing n= 3 Missing n=28 P<0.001
Not working 379 (34.4) 22 (25.6) 357 (35.1) 4.70 (3.15- 7.32)
Farming 369 (33.5) 39 (45.4) 330 (32.5) 7.39 (5.37- 10.42)
Small business/Skilled
Labour/Salaried 335 (30.4) 19 (22.1) 316 (31.1)
4.16 (2.69- 6.79)
Other 20 (1.8) 6 (7.0) 14 (1.4) 27.38 (11.81- 70.63)
Marital Status Missing n=
18 Missing n= 2 Missing n=16 P=0.224
Single 240 (21.5) 22 (25.3) 218 (21.2) 7.33 (4.81- 11.67)
Married 876
(78.51) 65 (74.7) 811 (78.8)
5.44 (4.26- 7.05)
Household wealth
quintiles
Missing n=
54 Missing n= 1 Missing n=53 P=0.011
poorest 105 (9.7) 18 (20.5) 87 (8.8) 13.55 (8.25- 23.39)
very poor 158 (14.6) 9 (10.2) 149 (15.0) 4.30 (2.28- 9.05)
poor 220 (20.4) 16 (18.2) 204 (25.6) 5.34 (3.24- 9.40)
less poor 269 (24.9) 22 (25.0) 247 (24.9) 6.04 (4.06- 9.37)
least poor 328 (30.4) 23 (26.1) 305 (30.8) 5.14 (3.40- 8.11)
Gravidity Missing n=
16
Missing n= 0 Missing n= 16 P<0.001
Primigravid 219 (19.6) 17 (19.3) 202 (19.6) 6.24 (3.93- 10.47)
1-3 pregnancies 525 (47.0) 23 (26.1) 502 (48.8) 3.10 (2.09- 4.81)
4+ pregnancies 374 (33.5) 49 (55.1) 325 (31.6) 10.20 (7.72- 13.70)
Previous pregnancy loss 160 (14.3),
Missing
n=17
22 (25.0),
Missing n= 1
138 (13.4) ,
Missing n= 16
P=0.001 11.07 (7.38- 17.25)
Page 13 of 21
For peer review only - http://bmjopen.bmj.com/site/about/guidelines.xhtml
BMJ Open
123456789101112131415161718192021222324252627282930313233343536373839404142434445464748495051525354555657585960
on 10 March 2019 by guest. P
rotected by copyright.http://bm
jopen.bmj.com
/B
MJ O
pen: first published as 10.1136/bmjopen-2016-011088 on 15 A
pril 2016. Dow
nloaded from
For peer review only
14
Overall (N=1134) Miscarriage
(N=89)
Other
Pregnancy
Outcomes
(n=1045)
P-
values* Rate of Miscarriage per
1000 pregnancy-weeks
(95%CI)
Antenatal Care Summary
Gestational age at 1st ANC visit
in weeks (mean (SD))* 20.8 (7.8) Range:
1.7-41.0
10.4 (4.9),
missing n=71
21.0 (7.7),
missing n=227 P<0.001
Number of ANC visit Missing n=39 Missing n= 0 Missing n=39 P<0.001
none 89 (8.1) 66 (74.2) 23 (2.3) 110 (86.47-140)
1 90 (8.2) 18 (20.2) 72 (7.2) 16.58 (10.48-27.36)
2 155 (14.2) 1 (1.1) 154 (15.3) 0.46 **
3 244 (22.3) 3 (3.4) 241 (24.0) 0.91 (0.29-4.41)
4+ 517 (47.2) 1 (1.1) 516 (51.3) 0.13 **
IPTp doses (HIV negative) Missing n= 280
Missing n=
18 Missing n= 265 P<0.001
24.38 (19.25- 31.14)
none 242 (28.3) 73 (98.7) 169 (21.7) 0.85**
1 95 (11.1) 1 (1.4) 94 (12.1) 0.00
2 175 (20.5) 0 175 (22.4) 0.00
3 222 (26.0) 0 222 (28.5) 0.00
4 120 (14.1) 0 120 (15.4)
Vaginal Bleeding Missing n= 298
Missing n=
71 Missing n= 227 P<0.001
1.24 (0.75- 2.22)
No 813 (97.3) 14 (77.8) 799 (97.7) 13.96 (5.28- 46.69)
Yes 23 (2.8) 4 (22.2) 19 (2.3) 24.38 (19.25- 31.14)
ANC Profile at 1st
ANC visit
HIV positive P<0.001
Negative 771 (68.0) 17 (19.0) 754 (72.2) 1.57 (0.99- 2.64)
Positive 262 (23.1) 27 (30.3) 235 (22.5) 7.77 (5.27- 11.88)
Unknown 101 (8.9) 45 (50.6) 56 (5.4) 48.91 (35.79- 67.20)
Haemoglobin (mean (SD; range)) 11.2 (1.9; 4.3-
17.2)
Missing n=309
12.4 (1.9)
missing n=72
11.2 (1.9)
missing n=237 P=0.017
Anaemia (Hb<11g/dl) Missing n=309 Missing n=72 Missing n=237 P=0.171
No 476 (57.7) 13 (76.5) 463 (57.3) 1.91 (1.13- 3.49)
Yes 349 (42.3) 4 (23.5) 345 (42.7) 0.87 (0.33- 3.11)
Syphilis reactive test Missing n=226 Missing n=68 Missing n=158 P=0.651
Negative 838 (92.3) 20 (95.2) 818 (92.2) 1.70 (1.11- 2.73)
Positive 70 (7.7) 1 (4.8) 69 (7.8) 1.05 **
Malaria slide positive at 1st
ANC
visit
Missing n=306 Missing n=71 Missing n=235 P=0.747
Negative 712 (86.0) 16 (88.9) 696 (85.9) 1.62 (1.01- 2.78)
Positive 116 (14.0) 2 (11.1) 114 (14.1) 1.24 (0.27-12.24)
*P value refers to log-rank test for categorical variables and to univariate Cox proportional hazard regression for
continuous variables
**Confidence intervals are missing because of an insufficient number of failures
Page 14 of 21
For peer review only - http://bmjopen.bmj.com/site/about/guidelines.xhtml
BMJ Open
123456789101112131415161718192021222324252627282930313233343536373839404142434445464748495051525354555657585960
on 10 March 2019 by guest. P
rotected by copyright.http://bm
jopen.bmj.com
/B
MJ O
pen: first published as 10.1136/bmjopen-2016-011088 on 15 A
pril 2016. Dow
nloaded from

For peer review only
15
Table 2. Table of weekly miscarriage rate, cumulative probabilities of survival and of miscarriage and remaining risk of miscarriage at each gestation week.
Gestational
week
Pregnancies
Detected
during week
Pregnancy-
Weeks at
Risk
Miscarriage Induced
abortion
Loss to follow
up &
withdrawals
Weekly miscarriage
rate per 1000
pregnancy-weeks
(95%CI)
Probability of
miscarriage per
gestational week
Probability of
survival per
gestational
week
Cumulative
probability
of survival
Cumulative
probability of
miscarriage
Remaining
probability of
miscarriage
<4 48 32.3 0 1 1 0 0.000 1.000 1.000 0.000 0.189
4 42 67.4 2 0 0 29.66 (7.42- 120) 0.029 0.971 0.971 0.029 0.189
5 77 127.6 2 0 0 15.68 (3.92- 62.69) 0.016 0.984 0.956 0.044 0.165
6 79 200.1 5 0 0 24.98 (10.4- 60.02) 0.025 0.975 0.932 0.068 0.152
7 69 276.9 2 3 0 7.22 (1.81- 28.88) 0.007 0.993 0.925 0.075 0.130
8 71 334.1 3 1 1 8.98 (2.9- 27.84) 0.009 0.991 0.917 0.083 0.124
9 63 397.7 6 0 0 15.09 (6.78- 33.58) 0.015 0.985 0.903 0.097 0.116
10 59 451 7 0 0 15.52 (7.4- 32.56) 0.015 0.985 0.889 0.111 0.103
11 57 502.6 6 1 1 11.94 (5.36- 26.57) 0.012 0.988 0.879 0.121 0.088
12 52 548.3 12 1 1 21.89 (12.43- 38.54) 0.022 0.978 0.860 0.140 0.078
13 41 583.4 3 1 0 5.14 (1.66- 15.94) 0.005 0.995 0.855 0.145 0.057
14 52 626.6 4 0 1 6.38 (2.4- 17.01) 0.006 0.994 0.850 0.150 0.052
15 40 667.9 9 0 0 13.47 (7.01- 25.9) 0.013 0.987 0.839 0.161 0.046
16 43 703.1 2 0 0 2.84 (0.71- 11.37) 0.003 0.997 0.836 0.164 0.033
17 44 739.9 5 1 0 6.76 (2.81- 16.24) 0.007 0.993 0.831 0.169 0.030
18 30 769.1 5 0 0 6.5 (2.71- 15.62) 0.006 0.994 0.825 0.175 0.024
19 33 796.4 2 0 0 2.51 (0.63- 10.04) 0.003 0.997 0.823 0.177 0.018
20 26 823.9 4 0 1 4.86 (1.82- 12.94) 0.005 0.995 0.819 0.181 0.015
21 33 852.1 1 0 1 1.17 (0.17- 8.33) 0.001 0.999 0.818 0.182 0.010
22 23 873.4 0 0 1 0 0.000 1.000 0.818 0.182 0.009
23 36 905.6 1 0 0 1.1 (0.16- 7.84) 0.001 0.999 0.817 0.183 0.009
24 30 937.3 0 0 0 0 0.000 1.000 0.817 0.183 0.008
25 20 960.1 2 0 0 2.08 (0.52- 8.33) 0.002 0.998 0.816 0.184 0.008
26 38 994.4 4 0 0 4.02 (1.51- 10.72) 0.004 0.996 0.812 0.188 0.006
27 28 1016.9 2 0 12 1.97 (0.49- 7.86) 0.002 0.998 0.811 0.189 0.002
Page 15 of 21
For peer review only - http://bmjopen.bmj.com/site/about/guidelines.xhtml
BMJ Open
123456789101112131415161718192021222324252627282930313233343536373839404142434445464748495051525354555657585960
on 10 March 2019 by guest. Protected by copyright. http://bmjopen.bmj.com/ BMJ Open: first published as 10.1136/bmjopen-2016-011088 on 15 April 2016. Downloaded from

For peer review only
16
Figures
Figure 1. Study participant flow diagram from screening to inclusion in data analysis for miscarriage.
Figure 2. Miscarriage rate per 1000 pregnancy-week by week of gestation with upper and lower
estimates of 95% confidence interval.
Figure 3. Miscarriage Kaplan Meier survival curve by gestational week.
Page 16 of 21
For peer review only - http://bmjopen.bmj.com/site/about/guidelines.xhtml
BMJ Open
123456789101112131415161718192021222324252627282930313233343536373839404142434445464748495051525354555657585960
on 10 March 2019 by guest. P
rotected by copyright.http://bm
jopen.bmj.com
/B
MJ O
pen: first published as 10.1136/bmjopen-2016-011088 on 15 A
pril 2016. Dow
nloaded from

For peer review only
Figure 1. Study participant flow diagram from screening to inclusion in data analysis for miscarriage. 297x420mm (300 x 300 DPI)
Page 17 of 21
For peer review only - http://bmjopen.bmj.com/site/about/guidelines.xhtml
BMJ Open
123456789101112131415161718192021222324252627282930313233343536373839404142434445464748495051525354555657585960
on 10 March 2019 by guest. P
rotected by copyright.http://bm
jopen.bmj.com
/B
MJ O
pen: first published as 10.1136/bmjopen-2016-011088 on 15 A
pril 2016. Dow
nloaded from

For peer review only
Figure 2. Miscarriage rate per 1000 pregnancy-week by week of gestation with upper and lower estimates of 95% confidence interval.
190x107mm (300 x 300 DPI)
Page 18 of 21
For peer review only - http://bmjopen.bmj.com/site/about/guidelines.xhtml
BMJ Open
123456789101112131415161718192021222324252627282930313233343536373839404142434445464748495051525354555657585960
on 10 March 2019 by guest. P
rotected by copyright.http://bm
jopen.bmj.com
/B
MJ O
pen: first published as 10.1136/bmjopen-2016-011088 on 15 A
pril 2016. Dow
nloaded from

For peer review only
Figure 3. Miscarriage Kaplan Meier survival curve by gestational week.
190x107mm (300 x 300 DPI)
Page 19 of 21
For peer review only - http://bmjopen.bmj.com/site/about/guidelines.xhtml
BMJ Open
123456789101112131415161718192021222324252627282930313233343536373839404142434445464748495051525354555657585960
on 10 March 2019 by guest. P
rotected by copyright.http://bm
jopen.bmj.com
/B
MJ O
pen: first published as 10.1136/bmjopen-2016-011088 on 15 A
pril 2016. Dow
nloaded from

For peer review only
1
STROBE Statement—checklist of items that should be included in reports of observational studies Item
No Recommendation
Check
Title and abstract 1 (a) Indicate the study’s design with a commonly used term in the title or the
abstract
√ p.1
(b) Provide in the abstract an informative and balanced summary of what was
done and what was found
√ p.3
Introduction
Background/rationale 2 Explain the scientific background and rationale for the investigation being
reported
√ p.4
Objectives 3 State specific objectives, including any prespecified hypotheses NA
Methods
Study design 4 Present key elements of study design early in the paper √ p.4
Setting 5 Describe the setting, locations, and relevant dates, including periods of
recruitment, exposure, follow-up, and data collection
√ p.5
Participants 6 (a) Cohort study—Give the eligibility criteria, and the sources and methods of
selection of participants. Describe methods of follow-up
Case-control study—Give the eligibility criteria, and the sources and methods of
case ascertainment and control selection. Give the rationale for the choice of
cases and controls
Cross-sectional study—Give the eligibility criteria, and the sources and methods
of selection of participants
√ p.5
(b) Cohort study—For matched studies, give matching criteria and number of
exposed and unexposed
Case-control study—For matched studies, give matching criteria and the number
of controls per case
NA
Variables 7 Clearly define all outcomes, exposures, predictors, potential confounders, and
effect modifiers. Give diagnostic criteria, if applicable
√ p.6
Data sources/
measurement
8* For each variable of interest, give sources of data and details of methods of
assessment (measurement). Describe comparability of assessment methods if
there is more than one group
√ p.6
Bias 9 Describe any efforts to address potential sources of bias √ p.6
Study size 10 Explain how the study size was arrived at NA
Quantitative variables 11 Explain how quantitative variables were handled in the analyses. If applicable,
describe which groupings were chosen and why
NA
Statistical methods 12 (a) Describe all statistical methods, including those used to control for
confounding
√ p.6
(b) Describe any methods used to examine subgroups and interactions NA
(c) Explain how missing data were addressed √ p.6
(d) Cohort study—If applicable, explain how loss to follow-up was addressed
Case-control study—If applicable, explain how matching of cases and controls
was addressed
Cross-sectional study—If applicable, describe analytical methods taking account
of sampling strategy
√ p.6
(e) Describe any sensitivity analyses NA
Continued on next page
Page 20 of 21
For peer review only - http://bmjopen.bmj.com/site/about/guidelines.xhtml
BMJ Open
123456789101112131415161718192021222324252627282930313233343536373839404142434445464748495051525354555657585960
on 10 March 2019 by guest. P
rotected by copyright.http://bm
jopen.bmj.com
/B
MJ O
pen: first published as 10.1136/bmjopen-2016-011088 on 15 A
pril 2016. Dow
nloaded from

For peer review only
2
Results
Participants 13* (a) Report numbers of individuals at each stage of study—eg numbers potentially eligible,
examined for eligibility, confirmed eligible, included in the study, completing follow-up,
and analysed
√ p.7
(b) Give reasons for non-participation at each stage √ p.7
(c) Consider use of a flow diagram √ Fig 1
Descriptive
data
14* (a) Give characteristics of study participants (eg demographic, clinical, social) and
information on exposures and potential confounders
√ p.7 &
table 1
(b) Indicate number of participants with missing data for each variable of interest √ table 1
(c) Cohort study—Summarise follow-up time (eg, average and total amount)
Outcome data 15* Cohort study—Report numbers of outcome events or summary measures over time √ p.8
Case-control study—Report numbers in each exposure category, or summary measures of
exposure
NA
Cross-sectional study—Report numbers of outcome events or summary measures NA
Main results 16 (a) Give unadjusted estimates and, if applicable, confounder-adjusted estimates and their
precision (eg, 95% confidence interval). Make clear which confounders were adjusted for
and why they were included
NA
(b) Report category boundaries when continuous variables were categorized NA
(c) If relevant, consider translating estimates of relative risk into absolute risk for a
meaningful time period
NA
Other analyses 17 Report other analyses done—eg analyses of subgroups and interactions, and sensitivity
analyses
NA
Discussion
Key results 18 Summarise key results with reference to study objectives √ p.8
Limitations 19 Discuss limitations of the study, taking into account sources of potential bias or
imprecision. Discuss both direction and magnitude of any potential bias
√ p.8-9
Interpretation 20 Give a cautious overall interpretation of results considering objectives, limitations,
multiplicity of analyses, results from similar studies, and other relevant evidence
√ p.8-9
Generalisability 21 Discuss the generalisability (external validity) of the study results √ p.8-9
Other information
Funding 22 Give the source of funding and the role of the funders for the present study and, if
applicable, for the original study on which the present article is based
√ p.9
*Give information separately for cases and controls in case-control studies and, if applicable, for exposed and
unexposed groups in cohort and cross-sectional studies.
Note: An Explanation and Elaboration article discusses each checklist item and gives methodological background and
published examples of transparent reporting. The STROBE checklist is best used in conjunction with this article (freely
available on the Web sites of PLoS Medicine at http://www.plosmedicine.org/, Annals of Internal Medicine at
http://www.annals.org/, and Epidemiology at http://www.epidem.com/). Information on the STROBE Initiative is
available at www.strobe-statement.org.
Page 21 of 21
For peer review only - http://bmjopen.bmj.com/site/about/guidelines.xhtml
BMJ Open
123456789101112131415161718192021222324252627282930313233343536373839404142434445464748495051525354555657585960
on 10 March 2019 by guest. P
rotected by copyright.http://bm
jopen.bmj.com
/B
MJ O
pen: first published as 10.1136/bmjopen-2016-011088 on 15 A
pril 2016. Dow
nloaded from

For peer review only
Weekly miscarriage rates in a community-based prospective
cohort study in rural western Kenya
Journal: BMJ Open
Manuscript ID bmjopen-2016-011088.R1
Article Type: Research
Date Submitted by the Author: 08-Mar-2016
Complete List of Authors: Dellicour, stephanie; Liverpool School of Tropical Medicine, Clinical Sciences Aol, George; Kenya Medical Research Institute Centre for Global Health Research Ouma, Peter; Kenya Medical Research Institute Centre for Global Health Research Yan, Nicole; Liverpool School of Tropical Medicine Bigogo, Godfrey; Kenya Medical Research Institute Centre for Global Health
Research Hamel, Mary; Centers for Disease Control and Prevention Office of Infectious Diseases Burton, Deron; Centers for Disease Control and Prevention Oneko, Martina; Kenya Medical Research Institute Centre for Global Health Research Breiman, Robert; Emory University , Global Health Institute Slutsker, Laurence; Centers for Disease Control and Prevention Feikin, Daniel; Centers for Disease Control and Prevention Kariuki, Simon; Kenya Medical Research Institute Centre for Global Health Research
Odhiambo, Frank; Kenya Medical Research Institute Centre for Global Health Research Calip, Gregory; University of Illinois at Chicago Stergachis, Andreas; University of Washington School of Public Health Laserson, Kayla; Centers for Disease Control and Prevention ter Kuile, Feiko; Liverpool School of Tropical Medicine Desai, Meghna; Centers for Disease Control and Prevention
<b>Primary Subject Heading</b>:
Public health
Secondary Subject Heading: Obstetrics and gynaecology, Epidemiology
Keywords: Miscarriage, rate, prospective cohort, Kenya, sub-Saharan Africa
For peer review only - http://bmjopen.bmj.com/site/about/guidelines.xhtml
BMJ Open on 10 M
arch 2019 by guest. Protected by copyright.
http://bmjopen.bm
j.com/
BM
J Open: first published as 10.1136/bm
jopen-2016-011088 on 15 April 2016. D
ownloaded from

For peer review only
1
Weekly miscarriage rates in a community-based prospective cohort
study in rural western Kenya
Authors
Stephanie Dellicour*, Liverpool School of Tropical Medicine, Liverpool, UK, email:
George Aol, Kenya Medical Research Institute Centre for Global Health Research, Kisumu, Kenya,
email: [email protected]
Peter Ouma, Kenya Medical Research Institute Centre for Global Health Research, Kisumu, Kenya,
email: [email protected]
Nicole Yan, Liverpool School of Tropical Medicine, Liverpool, UK, email: [email protected]
Godfrey Bigogo, Kenya Medical Research Institute Centre for Global Health Research, Kisumu, Kenya,
email: [email protected]
Mary J. Hamel, Centers for Disease Control and Prevention, Atlanta GA, USA, email: [email protected]
Deron C. Burton, Centers for Disease Control and Prevention, Atlanta GA, USA, email: [email protected]
Martina Oneko, Kenya Medical Research Institute Centre for Global Health Research, Kisumu, Kenya,
email: [email protected]
Robert F. Breiman, Global Health Institute, Emory University, Atlanta GA, USA, email:
Laurence Slutsker, Centers for Disease Control and Prevention, Atlanta GA, USA, email:
Daniel Feikin, Centers for Disease Control and Prevention, Atlanta GA, USA, email: [email protected]
Simon Kariuki, Kenya Medical Research Institute Centre for Global Health Research, Kisumu, Kenya,
email: [email protected]
Frank Odhiambo, Kenya Medical Research Institute Centre for Global Health Research, Kisumu,
Kenya, email: [email protected]
Greg Calip, Pharmacy Systems, Outcomes and Policy Department, University of Illinois at Chicago,
USA, email: [email protected]
Andy Stergachis, Departments of Pharmacy and Global Health, Schools of Pharmacy and Public
Health, University of Washington, Seattle, USA, email: [email protected]
Kayla F. Laserson, Centers for Disease Control and Prevention, Atlanta GA, USA and India, email:
Page 1 of 25
For peer review only - http://bmjopen.bmj.com/site/about/guidelines.xhtml
BMJ Open
123456789101112131415161718192021222324252627282930313233343536373839404142434445464748495051525354555657585960
on 10 March 2019 by guest. P
rotected by copyright.http://bm
jopen.bmj.com
/B
MJ O
pen: first published as 10.1136/bmjopen-2016-011088 on 15 A
pril 2016. Dow
nloaded from

For peer review only
2
Feiko O. ter Kuile, Liverpool School of Tropical Medicine, Liverpool, UK, email:
Meghna Desai, Centers for Disease Control and Prevention, Atlanta GA, USA, email: [email protected]
*Corresponding author
Dr Stephanie Dellicour
Liverpool School of Tropical Medicine
Pembroke Place
Liverpool L3 5QA, UK
Tel: +44(0)151 705 3346
E-mail: [email protected]
Page 2 of 25
For peer review only - http://bmjopen.bmj.com/site/about/guidelines.xhtml
BMJ Open
123456789101112131415161718192021222324252627282930313233343536373839404142434445464748495051525354555657585960
on 10 March 2019 by guest. P
rotected by copyright.http://bm
jopen.bmj.com
/B
MJ O
pen: first published as 10.1136/bmjopen-2016-011088 on 15 A
pril 2016. Dow
nloaded from

For peer review only
3
Abstract Objective: Information on adverse pregnancy outcomes is important to monitor the impact of public
health interventions. Miscarriage is a challenging endpoint to ascertain and there is scarce
information on its rate in low income countries. The objective was to estimate the background rate
and cumulative probability of miscarriage in rural western Kenya.
Design: This was a population-based prospective cohort
Participants and Setting: Women of childbearing age were followed prospectively to identify
pregnancies and ascertain their outcomes in Siaya County, western Kenya. The cohort study was
carried out in 33 adjacent villages under health and demographic surveillance.
Outcome measure: Miscarriage
Results: Between 2011 and 2013, among 5,536 women of childbearing age, 1,453 pregnancies were
detected and 1,134 were included in the analysis. The cumulative probability was 18.9%. The weekly
miscarriage rate declined steadily with increasing gestation until approximately 20 weeks. Known
risk factors for miscarriage such as maternal age, gravidity, occupation, household wealth and HIV
infection were confirmed.
Conclusion: This is the first report of weekly miscarriage rates in a rural African setting in the context
of high HIV and malaria prevalence. Future studies should consider the involvement of community
health workers to identify pregnancy cohort of early gestation for better data on the actual number
of pregnancies and the assessment of miscarriage.
Key words Miscarriage, rate, prospective cohort, Kenya, sub-Saharan Africa
Strengths and limitations of this study
• This study identified pregnancies early from the general population in a rural setting in
western Kenya and refusal rate was low (6%).
• The study is strengthened by the use of survival analysis with left truncation and the life
table method to estimate weekly background rates and cumulative probability of
miscarriage respectively.
• Misclassification between spontaneous and induced abortion cannot be ruled out, which is a
limitation of the present study. Given estimates were within the expected range and that
known risk factors for miscarriages could be confirmed, this is unlikely to have had
substantial effect on the estimates.
• Estimates for the rate of miscarriage in early week of gestation were less precise due to the
low numbers of pregnancies detected <6 weeks gestation.
Page 3 of 25
For peer review only - http://bmjopen.bmj.com/site/about/guidelines.xhtml
BMJ Open
123456789101112131415161718192021222324252627282930313233343536373839404142434445464748495051525354555657585960
on 10 March 2019 by guest. P
rotected by copyright.http://bm
jopen.bmj.com
/B
MJ O
pen: first published as 10.1136/bmjopen-2016-011088 on 15 A
pril 2016. Dow
nloaded from

For peer review only
4
Background Miscarriage is the most common adverse pregnancy outcome with aggravating emotional
consequences for affected individuals and families. It is also a critical indicator of embryotoxicity and
an important outcome for the study of embryotoxic effects of environmental, occupational and
medication risks [1-3]. Furthermore it is a relevant endpoint to track the progress of reproductive
health programs and their impact on maternal health. Without accounting for miscarriage, maternal
and reproductive health related indicators miss a significant number of unreported pregnancies that
are often not seen by the health system and are not recorded. For instance, indicators for antenatal
care coverage is based on the total number of women who had a live birth in a specific time period
not accounting for up to 30% of pregnancies that are lost either to miscarriage or stillbirth [4, 5]. This
may lead to unrepresentative estimates of access and utilization of health care for high risk
pregnancies ending in miscarriage or stillbirth. Despite this being a significant reproductive health
outcome, data on miscarriage rates in low and middle income countries is scarce. Studies from
industrialised countries report rates of miscarriage in clinically recognised pregnancies (i.e. from five-
six gestational weeks following the last menstrual period (LMP), the common gestational age for
pregnancy recognition) that vary between 11% and 22% [6-9]. When taking into account early
miscarriage for pregnancies diagnosed by human chorionic gonadotropin (HCG) or ultrasound before
the appearance of fetal heart activity, reported rates are closer to 30% [7].
Miscarriage is a challenging endpoint to ascertain and accurate rates of miscarriage difficult to
estimate. There are methodological complexities of conducting studies to assess miscarriage rate
[10] which relate to the difficulties in identifying a representative sample of pregnancies at time of
conception; the confirmation of suspected pregnancy and the determination of the exact timing of
pregnancy loss. To accurately capture all pregnancy losses in a population, a study needs to be able
to identify pregnancies from the time of conception and follow them prospectively. Early pregnancy
losses, which occur before a pregnancy is usually recognised (i.e. <5-6 weeks gestation), can only be
detected by frequently repeated highly sensitive pregnancy tests.
Few studies have been designed to detect such early pregnancy loss and ascertained pregnancies
close to the time of conception by enrolling participants that are planning to conceive and consent
to regular pregnancy tests [7-9, 11-13]. Since a significant proportion of pregnancies are
unplanned[14], data from these studies may have limited generalizability. Other studies recruiting
women from antenatal clinics miss pregnancy loss occurring before initiation of antenatal care (ANC)
and may also be prone to selection bias as women presenting early for antenatal care may represent
higher risk pregnancies than women presenting later[15]. The assigned timing of miscarriage is
usually based on the time of clinical recognition of pregnancy loss however fetal death may have
occurred weeks before [16].
Studies of miscarriage in low and middle income countries face additional challenges as most
miscarriages occur without any contact with the formal healthcare system and are not registered. As
pregnant women usually present for antenatal care late in pregnancy (with an estimated 11%-54%
of women initiating ANC in the first trimester [17-19] and most presenting late in the second
trimester), health facility based recruitment and data collection strategies are inappropriate. In such
settings the study of miscarriage requires a community based approach taking into account the
different cultural and superstitious beliefs that may affect pregnancy disclosure and detection [19-
Page 4 of 25
For peer review only - http://bmjopen.bmj.com/site/about/guidelines.xhtml
BMJ Open
123456789101112131415161718192021222324252627282930313233343536373839404142434445464748495051525354555657585960
on 10 March 2019 by guest. P
rotected by copyright.http://bm
jopen.bmj.com
/B
MJ O
pen: first published as 10.1136/bmjopen-2016-011088 on 15 A
pril 2016. Dow
nloaded from

For peer review only
5
21]. Furthermore reliable data on gestational age is difficult to obtain as ultrasound scans are rarely
available and date of last menstrual period may not be reliable in settings with limited literacy [22,
23]. There is also a higher risk of misclassification of induced abortions as spontaneous abortions as
the former are illegal in most of these settings. The methodological constraints for measuring this
outcome require early pregnancy detection and prospective follow up from a population-based
representative sample of all women of childbearing age (WOCBA) to minimise selection bias. There
are no published data on such studies in low income countries. The study presented here describes
the rate of miscarriage and associated risk factors in a community based prospective cohort study of
WOCBA in rural western Kenya.
Methods
Overview of study design
A prospective cohort of pregnant women was enrolled within a pharmacovigilance study to assess
the risk of inadvertent first trimester exposures to artemisinin combination therapy (being reported
elsewhere[24]) between February 2011 and February 2013. Pregnancies were identified as early as
possible through health facility and community-based strategies (described below), and followed
prospectively (i.e. before the pregnancy outcome was known) to document pregnancy outcome.
Study site
The study area was located in Siaya County, lying northeast of Lake Victoria in Nyanza Province,
western Kenya. The cohort study was carried out in 33 adjacent villages under the Kenya Medical
Research Institute-Centers for Disease Control and Prevention (KEMRI-CDC) health and demographic
surveillance system area (KEMRI-CDC HDSS [25]). Nyanza Province has a high burden of disease and
health indicators that are worse than overall Kenyan national statistics.[26] Malaria transmission is
high with parasitaemia of 20% in over 14 year old (unpublished KEMRI/CDC data for 2010). Whereas
the national HIV prevalence is 6.3% (4% for men and 8% for women), the prevalence for Nyanza
Province is close to double, around 14% (11% for men and 16% for women).[27] The total fertility
rate in the area was 5.4 and around a third of currently married women age 15-49 used a modern
contraceptive method according to a health and demographic survey in 2008-9[26].
Community mobilization and formative research
The acceptability of community-based pregnancy testing was unknown but important for this study.
Community mobilisation activities included a series of meetings over several months with the
District Medical Officer for Health, village chiefs, district officers and counsellors, the community
advisory board was set up by KEMRI-CDC, and community members to introduce and get feedback
on the proposed study plans. “Baraza” (community meetings) were held in all 33 villages within the
study area. Study brochures were also distributed through the community meetings and at the
central health facility. Formative research involving ten focus group discussions was carried out with
the aim to explore the socio-cultural context around pregnancy and to investigate acceptability of
proposed study procedures (reported elsewhere [28, 29]).
Recruitment of WOCBA and pregnancy detection
Following community mobilisation, door-to-door enrolment was carried out to inform eligible
WOCBA. All women age 15-49 years resident in households within the defined HDSS catchment area
and participating in a population-based disease surveillance project (PBIDS) [30, 31] were eligible for
Page 5 of 25
For peer review only - http://bmjopen.bmj.com/site/about/guidelines.xhtml
BMJ Open
123456789101112131415161718192021222324252627282930313233343536373839404142434445464748495051525354555657585960
on 10 March 2019 by guest. P
rotected by copyright.http://bm
jopen.bmj.com
/B
MJ O
pen: first published as 10.1136/bmjopen-2016-011088 on 15 A
pril 2016. Dow
nloaded from

For peer review only
6
enrolment. Women were excluded if they refused to participate, were unable to provide informed
consent due to mental, physical or social inability or if they refused to be followed up to the end of
pregnancy. Enrolment was active throughout the study period whereby newly eligible women (who
turned 15 years of age during the study period or in-migrant joining PBIDS) were invited to join the
study.
WOCBA who consented to participate were asked if they might be pregnant and offered a pregnancy
test at the time of enrolment if they were not visibly pregnant and again approximately every three
months from October 2011 onwards by village-based community interviewers. Any participant with
a detected pregnancy was referred to the antenatal clinic at the referral health facility, Lwak
Hospital, where trained study nurses confirmed the pregnancy through ultrasound or examination
and auscultation for gestations >24 weeks and offered free ANC. Additionally, all pregnant patients
presenting at Lwak Hospital ANC were assessed for study eligibility by a study nurse and enrolled if
all selection criteria were met.
Gestational age assessment
Gestational age was assessed using multiple methods, including ultrasound scans at the first
antenatal visit at Lwak ANC (for participants presenting before 24 weeks); reported first day of LMP;
reported gestational age at the time of pregnancy loss; Ballard scoring for live-births captured within
3 days of delivery [32] ; and, fundal height measurements recorded at ANC. Not all methods were
available for all pregnancies since some were not seen at ANC (no fundal height or ultrasound
measurement available) or were seen at ANC but beyond 24 weeks. The Ballard score was only
available for live-births seen within three days of delivery. Furthermore, some participants could not
recall their LMP or, in some instances, had not resumed their menses since their previous pregnancy.
For this analysis, gestational age was determined using the most accurate measurement available
for each participant. Methods in order of decreasing accuracy were: ultrasound scan taken before 24
weeks gestation, Ballard estimates, LMP or reported gestation at time of pregnancy loss and lastly
gestational age derived from fundal height assessment.
Risk factors
Obstetric history and ANC laboratory information collected routinely at antenatal booking
(haemoglobin level, HIV and syphilis testing, and malaria microscopy) were extracted from the ANC
records at Lwak Hospital or antenatal cards by study nurses. Demographic characteristics was
collected through interviews at ANC or at the time of pregnancy outcome follow up if the
participant was not seen at ANC. Household level wealth quintiles were obtained from data
collected routinely through the HDSS (such as occupation of household head, primary source of
drinking water, use of cooking fuel, in-house assets [e.g. radio and television] and livestock) which
were calculated as a weighted average using multiple correspondence analysis [33].
Pregnancy outcome
Pregnancy outcomes were assessed using a combination of health facility and home-based follow-
ups. The latter is particularly relevant for miscarriages, because the vast majority of these events
occur in the community and not in the health facilities. Village-based staff received monthly lists of
participants with estimated delivery dates in their respective catchment area. Study nurses were
notified of pregnancy outcomes by village-based staff and follow ups were done either at home or at
the health facility. A detailed structured questionnaire about the delivery and outcome was
Page 6 of 25
For peer review only - http://bmjopen.bmj.com/site/about/guidelines.xhtml
BMJ Open
123456789101112131415161718192021222324252627282930313233343536373839404142434445464748495051525354555657585960
on 10 March 2019 by guest. P
rotected by copyright.http://bm
jopen.bmj.com
/B
MJ O
pen: first published as 10.1136/bmjopen-2016-011088 on 15 A
pril 2016. Dow
nloaded from

For peer review only
7
administered face-to-face. Pregnancy outcomes captured included: pregnancy losses (miscarriages,
induced abortions and stillbirths), live-births, and major congenital malformations detectable at
birth by surface examination. We defined miscarriage, also called spontaneous abortion, as a
pregnancy that ends spontaneously before 28 weeks gestation as per the World Health Organization
definition of fetus viability [34]. A fetal death after viable gestational age is defined as a stillbirth.
Data analysis
Analyses were performed using Stata v12.1 (StataCorp LP, College Station, Texas). Survival analysis
with left truncation was used to estimate the miscarriage rate by gestational week to account for
delayed pregnancy detection and the range in gestational ages at the time of pregnancy detection.
Crude rate estimates (i.e. dividing the number of miscarriages by the total number of pregnancies
under study) are appropriate when it is possible to detect and enrol pregnancies from the time of
conception. Most miscarriages occur early in pregnancy prior to clinical detection of pregnancy [35];
the rapidly decreasing risk of miscarriage across the first trimester of pregnancy highlights the
influence of gestational weeks at time of pregnancy detection in study or program settings on the
estimated miscarriage rates. Therefore rate estimates should account for left truncation (early
pregnancy) and, as far as it is possible, for the actual number of pregnancies under observation at
each specific gestational week [15, 36, 37]. Left truncation was used to account for survival bias as
the average gestational age that pregnancies were detected was around 13 weeks and only
pregnancies that survived the early weeks of gestation (the highest risk of miscarriage) were
followed prospectively[36, 38]. The life table methods were used to calculate the cumulative
probability of survival and cumulative probability of miscarriage. Standard methods were used to
calculate probability of miscarriage by gestational week [6]. In brief, the miscarriage rate during the
specific week of gestation was converted to probability using the formula: (Miscarriage Rate)/(1+
(Miscarriage Rate x 0.5)). The remaining risk of miscarriage by gestational week was calculated by
subtracting the probability of surviving the remaining weeks from 1. The probability of fetal survival
during the remaining weeks was the product of the probability of survival for week x and the
probability of survival for week x+1. Cox proportional hazard regression models with left truncation
were fitted to estimate the effect of risk factors on miscarriage.[36].
Ethical review and consent
The study was reviewed and approved by the institutional review boards of CDC (No. 5889), KEMRI
(No. 1752) and the Liverpool School of Tropical Medicine (No. 09.70). Written informed consent or
assent was obtained from each participant including consent to linking individual data to PBIDS and
HDSS data.
Results
Participant enrolment and study uptake
Between February 15th 2011 and February 15th 2013, 5,536 (94% of 5911 WOCBA approached)
consented to participate and 1,453 pregnancies among these women were detected; about 10% of
participants were detected as pregnant at the time of enrolment. Refusal to take part in the study
was low at 6% of screened participants, as were refusals to take pregnancy tests during follow up
home visits (2%). Out of the 1,453 identified pregnancies, 1,134 (78%) were included in the data
analysis for miscarriage; 319 were excluded because pregnancy detection occurred beyond 28 weeks
gestation (219) or at the time of pregnancy outcome (33), lack of information on gestational age
Page 7 of 25
For peer review only - http://bmjopen.bmj.com/site/about/guidelines.xhtml
BMJ Open
123456789101112131415161718192021222324252627282930313233343536373839404142434445464748495051525354555657585960
on 10 March 2019 by guest. P
rotected by copyright.http://bm
jopen.bmj.com
/B
MJ O
pen: first published as 10.1136/bmjopen-2016-011088 on 15 A
pril 2016. Dow
nloaded from

For peer review only
8
(21), loss to follow up immediately after pregnancy detection (41), or inconsistent pregnancy end
dates (5) (figure 1). The 1,134 pregnancies involved a total of 1,079 women, 55 of whom had two
pregnancies and 1,024 who had one pregnancy during the study period. Figure 2 depicts the number
of pregnancies detected by the different strategies.
Overall, 62% of deliveries took place at a health facility, and 25% of identified miscarriages were
cared for at a health facility. Sixty seven percent of pregnancy outcomes were captured less than
one week after the end of pregnancy; however, for miscarriage this proportion was only 20%. The
median number of days between outcome and follow up was 3 overall (range: 0-755) and 24 (range:
0-602) for miscarriage. This reflects the fact that follow ups were arranged at the convenience of
participants and to ensure suitable amount of time between the event and home visit by study staff.
Participant characteristics and risk factors for miscarriage
The mean gestational age at time of pregnancy detection was 13.3 weeks (standard deviation [sd]
6.9) and median was 12.1 weeks. The mean gestational age at time of detection decreased over the
study period with the introduction of 3 monthly home visits (Figure 2). The mean maternal age was
26.1 years with women who miscarried being slightly older (29.5 [sd=8] years mean age vs 25.8 years
[sd=7]) (Table 1). Overall the vast majority were married (79%) and about half of the women had
completed primary education, but few had completed secondary school, with no significant
difference between the groups. Farming was the main income generating activity for a higher
proportion of women who miscarried compared to those with other pregnancy outcomes. There
was a statistically significant difference in wealth between groups, with women who miscarried
generally poorer than those with other pregnancy outcomes (Table 1). A higher proportion of
miscarriage cases occurred in multigravid women with four or more pregnancies and about 25% of
cases reported having a previous miscarriage (compared to 13% for other pregnancy outcomes).
Only 26% of women who miscarried had any history of antenatal care (compared to 98% in the other
group) which may reflect the fact that most miscarriages occur before the average gestational age
(21 weeks) when women initiate ANC in this area. Consequently very few received any intermittent
preventive treatment of malaria in pregnancy and an HIV test result was not available for over half
of the miscarriage cases (since HIV tests are offered during first ANC visit). However, among those
with known HIV status (44), 30% of those who miscarried were HIV positive compared to 23% among
those with other pregnancy outcomes.
Cumulative probability of miscarriage and rate per gestational week
There were 89 (7.9%) miscarriages among the 1,134 pregnancies included in the analysis. The mean
gestational age at the time of miscarriage was 14.4 weeks (SD: 5.7) and the median was 13 weeks
(range: 4.3-28); 75% of miscarriages occurred by 18 weeks. The cumulative probability of miscarriage
calculated through the life-table method was 18.9%.Overall the rate of miscarriage was 0.59 per
100 pregnancy-weeks (95%CI: 0.47- 0.73) calculated by survival analysis with left truncation. The
weekly miscarriage rate declined steadily with increasing gestation (see Figure 3 and Table 2 for
miscarriage weekly rates and probabilities) until approximately 16 to 20 weeks, after which it
remained steady at approximately 0.3 per 100 pregnancy-weeks. Figure 4 shows the cumulative
pregnancy survival probabilities per gestation week.
Page 8 of 25
For peer review only - http://bmjopen.bmj.com/site/about/guidelines.xhtml
BMJ Open
123456789101112131415161718192021222324252627282930313233343536373839404142434445464748495051525354555657585960
on 10 March 2019 by guest. P
rotected by copyright.http://bm
jopen.bmj.com
/B
MJ O
pen: first published as 10.1136/bmjopen-2016-011088 on 15 A
pril 2016. Dow
nloaded from

For peer review only
9
Discussion
This study provides the first description of the miscarriage rate in this rural Kenyan population in the
context of high malaria and HIV prevalence; there are very little data on miscarriage background rate
for sub-Saharan Africa in general. The cumulative probability of miscarriages by 28 weeks gestation
accounting for staggered pregnancy detection in our study population was 18.9%, and the
probability by week declined from 16 weeks onward. The true rate is likely to be higher as
information from very early pregnancies (e.g. < 6 weeks gestation) was not captured and the
average gestational age of pregnancy detection was 13.3 weeks, which meant that only 57% of
pregnancies were detected during the highest risk period for miscarriage (the 1st trimester).
However, this represents a more accurate estimate of the risk of miscarriage than the crude
prevalence of 7.9% as pregnancies were not observed from the time of conception and entered the
study at different gestational ages[6, 10, 15]. The rate of 19% is similar to that reported by
McGready et al. from the Thai-Burmese border (20%) [39] and consistent with that observed in
other prospective studies in non-malarious areas, which ranges from 10% to 22%. Known risk factors
for miscarriages were confirmed in this population, including older maternal age [40], more than
three previous pregnancies[41], having a previous pregnancy loss [42], HIV infection [43, 44],
occupation [2, 3] and lower household wealth[45].
Acceptability of pregnancy testing was surprisingly high and refusal to take a pregnancy test
following enrolment remained around 2% throughout the home-based surveys. Women in this
setting are usually reluctant to disclose their pregnancy status due to cultural and superstitious
beliefs about pregnancy disclosure. This has been recognised as one of the reasons for delay in
seeking antenatal care[19, 21]. Women are worried about gossip, witchcraft particularly in the early
stage of pregnancy, being accused of boastfulness and embarrassment in case of later pregnancy
loss. For unmarried and/or young girls, pregnancy is not disclosed due to fear of social
repercussions. Before initiation of the study, no information was available on the acceptability of
pregnancy tests in a similar rural community; our formative research indicated very few women
were even aware such tests existed. In this community, engaging trained village based staff to offer
pregnancy tests through regular home-visits worked well as reflected by the high acceptance rate
(94%) and low loss to follow up (8%). Since initiation of this study, other studies have used trained
fieldworkers (both male and female) to do pregnancy detection and reported similar success. For
future studies of miscarriage, we recommend working with the community to identify the most
suitable approach to identify early pregnancy. Community health workers now being deployed in
many sub-Saharan African countries [46] could play a key role in early pregnancy detection, thus
providing better data on the actual number of pregnancies for programmatic planning and
monitoring as well as referring pregnant women to initiate ANC in the first trimester.
A few limitations should be noted. Despite our best effort to capture pregnancy early, the relatively
low numbers of pregnancy detected before 12 weeks gestation (508) generate moderately imprecise
estimates and wide confidence intervals particularly in early (<6 weeks) gestation. Depending on the
gestational age ascertainment method used there could have been more or less measurement error
leading to misclassification of time at entry and exit in the cohort, and therefore miscarriage rate in a
specific gestation week. There could have been error in the estimation of gestation at the time of
miscarriage since this was largely self-reported sometimes months after the event. There is risk that
induced abortions were misclassified as miscarriage or as lost to follow up. Kenya has strict laws on
Page 9 of 25
For peer review only - http://bmjopen.bmj.com/site/about/guidelines.xhtml
BMJ Open
123456789101112131415161718192021222324252627282930313233343536373839404142434445464748495051525354555657585960
on 10 March 2019 by guest. P
rotected by copyright.http://bm
jopen.bmj.com
/B
MJ O
pen: first published as 10.1136/bmjopen-2016-011088 on 15 A
pril 2016. Dow
nloaded from

For peer review only
10
induced abortion, and it is only permitted if, according to a trained health professional, there is a
need for emergency treatment, or the life or health of the mother is in danger, or if permitted by
any other written law. Due to restrictive laws and stigmatization, underreporting is common. Nine
induced abortions (<1%) were reported in this study which is much lower than a reported expected
ratio of 30 abortions per 100 births for Kenya [47]. However it is probable that women consenting to
participate in the study would be at lower risk of seeking induced abortion by accepting to be
followed up through pregnancy. This could lead to selection bias but the refusal rate was low at 5%
and therefore this is unlikely to affect estimates substantially. Lastly, as HIV and malaria are known
risk factors for miscarriage [39, 43, 44, 48] and are highly prevalent in this area, this may influence
generalizability of study findings to areas with differing disease burden.
Conclusion
This prospective cohort study in WOCBA provides the first estimates of weekly miscarriage rates in a
rural African setting in the context of high HIV and malaria prevalence. This information should be
valuable to researchers and program managers for resource planning, to monitor trends and impact
of interventions as well as to clinicians in gauging miscarriage rates at a given gestational week. We
have demonstrated the feasibility of conducting a community based pregnancy cohort in a resource-
constrained setting for analysing the outcome of pregnancies with respect to miscarriage risk.
List of Abbreviations
ANC, antenatal care; CDC, US Centers for Disease Control and Prevention; HDSS, health and
demographic surveillance system; KEMRI, Kenya Medical Research Institute; LMP, last menstrual
period; PBIDS, population-based infectious disease surveillance
Competing interest
The authors declare that they have no competing interests.
Acknowledgements
The work presented in this paper was performed under the KEMRI and CDC Collaboration in western
Kenya. We are very grateful to all participants for taking part in the study. We wish to thank the
EMEP study team for their perseverance and hard work, particularly: Jane Oiro, Teresa Aluoch,
Elizabeth Aballa, Emily Ayanga, Everlyne Oteyo, Everline Ochola, Faith Samo, Eric Onyango and
Joshua Auko. Furthermore we wish to thank the Asembo District health and medical team and the
Lwak Mission Hospital Board for their support. We also wish to thank Dr. John Williamson and Jane
Bruce for the statistical support and advice. KEMRI-CDC HDSS is a member of the INDEPTH Network.
The findings and conclusions in this paper are those of the authors and do not necessarily represent
the views of the US Centers for Disease Control and Prevention. This paper is published with the
permission of the KEMRI Director.
Authors contribution
Conceived and designed the experiments: SD FtK AS LS MJH. Conducted field work: SD GA PO MO
GB. Analyzed the data: SD GC. Contributed data/analysis tools: GB DF RFB SK DB NY FO FtK.
Interpreted the data: SD, DB, RFB, MJH, LS, DF, SK, KL, AS, MD, FtK. Wrote the first draft of the
manuscript: SD FtK MD. All authors reviewed, revised and approved the final version of the
manuscript.
Page 10 of 25
For peer review only - http://bmjopen.bmj.com/site/about/guidelines.xhtml
BMJ Open
123456789101112131415161718192021222324252627282930313233343536373839404142434445464748495051525354555657585960
on 10 March 2019 by guest. P
rotected by copyright.http://bm
jopen.bmj.com
/B
MJ O
pen: first published as 10.1136/bmjopen-2016-011088 on 15 A
pril 2016. Dow
nloaded from

For peer review only
11
Funding
This work was partly supported by the Malaria in Pregnancy (MiP) Consortium, which is funded
through a grant from the Bill and Melinda Gates Foundation to the Liverpool School of Tropical
Medicine, UK and partly by the US Centers for Disease Control and Prevention (CDC), Division of
Parasitic Diseases and Malaria through a cooperative agreement with Kenya Medical Research
Institute (KEMRI), Center for Global Health Research (CGHR), Kisumu, Kenya. The funders had no role
in study design, data collection and analysis, decision to publish, or preparation of the manuscript.
Data sharing statement
The anonymised dataset will be available upon request from the data manager at KEMRI:
References
1. Goldstein DJ, Sundell KL, DeBrota DJ, Offen WW: Determination of pregnancy outcome risk
rates after exposure to an intervention. Clinical pharmacology and therapeutics 2001,
69(1):7-13.
2. Kline JK: Maternal occupation: effects on spontaneous abortions and malformations.
Occup Med 1986, 1(3):381-403.
3. Kumar S: Occupational, environmental and lifestyle factors associated with spontaneous
abortion. Reproductive sciences 2011, 18(10):915-930.
4. Millennium Development Goals Indicators
[http://mdgs.un.org/unsd/mdg/Metadata.aspx?IndicatorId=0&SeriesId=762]
5. World Health Organization: Reproductive Health Indicators: Guidelines for their
generation, interpretation and analysis for global monitoring. . In. Geneva: World Health
Organization; 2006.
6. Avalos LA, Galindo C, Li D-K: A Systematic Review to Calculate Background Miscarriage
Rates using Life Table Analysis. Birth Defects Research (Part A) 2012, 94(417).
7. Wilcox AJ, Weinberg CR, O'Connor JF, Baird DD, Schlatterer JP, Canfield RE, Armstrong EG,
Nisula BC: Incidence of early loss of pregnancy. N Engl J Med 1988, 319(4):189-194.
8. Zinaman MJ, Clegg ED, Brown CC, O'Connor J, Selevan SG: Estimates of human fertility and
pregnancy loss. Fertil Steril 1996, 65(3):503-509.
9. Ellish NJ, Saboda K, O'Connor J, Nasca PC, Stanek EJ, Boyle C: A prospective study of early
pregnancy loss. Hum Reprod 1996, 11(2):406-412.
10. Modvig J, Schmidt L, Damsgaard MT: Measurement of total risk of spontaneous abortion:
the virtue of conditional risk estimation. Am J Epidemiol 1990, 132(6):1021-1038.
11. Wang X, Chen C, Wang L, Chen D, Guang W, French J: Conception, early pregnancy loss, and
time to clinical pregnancy: a population-based prospective study. Fertil Steril 2003,
79(3):577-584.
12. Eskenazi B, Gold EB, Lasley BL, Samuels SJ, Hammond SK, Wight S, O'Neill Rasor M, Hines CJ,
Schenker MB: Prospective monitoring of early fetal loss and clinical spontaneous abortion
among female semiconductor workers. American journal of industrial medicine 1995,
28(6):833-846.
13. Sweeney AM, Meyer MR, Aarons JH, Mills JL, LaPorte RE: Evaluation of methods for the
prospective identification of early fetal losses in environmental epidemiology studies. Am J
Epidemiol 1988, 127(4):843-850.
14. Singh S, Sedgh G, Hussain R: Unintended pregnancy: worldwide levels, trends, and
outcomes. Studies in family planning 2010, 41(4):241-250.
15. Goldhaber MK, Fireman BH: The fetal life table revisited: spontaneous abortion rates in
three Kaiser Permanente cohorts. Epidemiology 1991, 2(1):33-39.
Page 11 of 25
For peer review only - http://bmjopen.bmj.com/site/about/guidelines.xhtml
BMJ Open
123456789101112131415161718192021222324252627282930313233343536373839404142434445464748495051525354555657585960
on 10 March 2019 by guest. P
rotected by copyright.http://bm
jopen.bmj.com
/B
MJ O
pen: first published as 10.1136/bmjopen-2016-011088 on 15 A
pril 2016. Dow
nloaded from

For peer review only
12
16. S. M: Timing of gestational arrest prior to miscarriage. Nashville, Tennessee: Vanderbilt
University; 2014.
17. Central Statistical Agency [Ethiopia], ICF International: Ethiopia Demographic and Health
Survey 2011. In. Addis Ababa, Ethiopia and Calverton, Maryland, USA: Central Statistical
Agency and ICF International; 2012.
18. Ghana Statistical Service (GSS), Ghana Health Service (GHS), ICF Macro: Ghana Demographic
and Health Survey 2008. In. Accra, Ghana: GSS, GHS, and ICF Macro; 2009.
19. Pell C, Menaca A, Were F, Afrah NA, Chatio S, Manda-Taylor L, Hamel MJ, Hodgson A, Tagbor
H, Kalilani L et al: Factors affecting antenatal care attendance: results from qualitative
studies in Ghana, Kenya and Malawi. PLoS One 2013, 8(1):e53747.
20. Haws RA, Mashasi I, Mrisho M, Schellenberg JA, Darmstadt GL, Winch PJ: "These are not
good things for other people to know": how rural Tanzanian women's experiences of
pregnancy loss and early neonatal death may impact survey data quality. Social science &
medicine 2010, 71(10):1764-1772.
21. Stokes E, Dumbaya I, Owens S, Brabin L: The right to remain silent: a qualitative study of
the medical and social ramifications of pregnancy disclosure for Gambian women. BJOG :
an international journal of obstetrics and gynaecology 2008, 115(13):1641-1647; discussion
1647.
22. Verhoeff FH, Milligan P, Brabin BJ, Mlanga S, Nakoma V: Gestational age assessment by
nurses in a developing country using the Ballard method, external criteria only. Annals of
tropical paediatrics 1997, 17(4):333-342.
23. White LJ, Lee SJ, Stepniewska K, Simpson JA, Dwell SL, Arunjerdja R, Singhasivanon P, White
NJ, Nosten F, McGready R: Estimation of gestational age from fundal height: a solution for
resource-poor settings. Journal of the Royal Society, Interface / the Royal Society 2012,
9(68):503-510.
24. Dellicour S, Desai M, Aol G, Oneko M, Ouma P, Bigogo G, Burton D, Breiman RF, Hamel M,
Slutsker L et al: Risks of miscarriage and inadvertent exposure to artemisinin derivatives in
the first trimester of pregnancy: a prospective study in western Kenya. In preparation.
25. Odhiambo FO, Laserson KF, Sewe M, Hamel MJ, Feikin DR, Adazu K, Ogwang S, Obor D,
Amek N, Bayoh N et al: Profile: the KEMRI/CDC Health and Demographic Surveillance
System--Western Kenya. Int J Epidemiol 2012, 41(4):977-987.
26. Kenya National Bureau of Statistics (KNBS) and ICF Macro: Kenya Demographic and Health
Survey 2008-09. Calverton, Maryland, USA.
http://www.measuredhs.com/pubs/pdf/FR229/FR229.pdf; 2011.
27. Kenya National Bureau of Statistics (KNBS), Macro I: Kenya Demographic and Health Survey
2008-09. In. Edited by Macro KaI. Calverton, Maryland; 2010.
28. Dellicour S, Desai M, Mason L, Odidi B, Aol G, Phillips-Howard PA, Laserson KF, Ter Kuile FO:
Exploring risk perception and attitudes to miscarriage and congenital anomaly in rural
Western kenya. PLoS One 2013, 8(11):e80551.
29. Mason L., Dellicour S., Ter Kuile F., Ouma P., Phillips-Howard P., Were F., K. L, M. D: Barriers
and facilitators to antenatal and delivery care in western Kenya: a qualitative study. BMC
Pregnancy and Childbirth 2015, 15(26).
30. Bigogo G, Audi A, Aura B, Aol G, Breiman RF, Feikin DR: Health-seeking patterns among
participants of population-based morbidity surveillance in rural western Kenya:
implications for calculating disease rates. Int J Infect Dis 2010, 14(11):e967-973.
31. Feikin DR, Audi A, Olack B, Bigogo GM, Polyak C, Burke H, Williamson J, Breiman RF:
Evaluation of the optimal recall period for disease symptoms in home-based morbidity
surveillance in rural and urban Kenya. Int J Epidemiol 2010, 39(2):450-458.
32. Ballard JL, Khoury JC, Wedig K, Wang L, Eilers-Walsman BL, Lipp R: New Ballard Score,
expanded to include extremely premature infants. The Journal of pediatrics 1991,
119(3):417-423.
Page 12 of 25
For peer review only - http://bmjopen.bmj.com/site/about/guidelines.xhtml
BMJ Open
123456789101112131415161718192021222324252627282930313233343536373839404142434445464748495051525354555657585960
on 10 March 2019 by guest. P
rotected by copyright.http://bm
jopen.bmj.com
/B
MJ O
pen: first published as 10.1136/bmjopen-2016-011088 on 15 A
pril 2016. Dow
nloaded from

For peer review only
13
33. McKenzie D: Measuring inequality with asset indicators. Journal of Population Economics
2005, 18(2):229.
34. World Health Organization: Spontaneous and Induced Abortion: Report of a WHO scientific
group. In: WHO Technical Report Series. vol. 461. Geneva; 1970.
35. Regan L, Rai R: Epidemiology and the medical causes of miscarriage. Bailliere's best practice
& research Clinical obstetrics & gynaecology 2000, 14(5):839-854.
36. Howards PP, Hertz-Picciotto I, Poole C: Conditions for bias from differential left truncation.
Am J Epidemiol 2007, 165(4):444-452.
37. Margulis AV, Mittleman MA, Glynn RJ, Holmes LB, Hernandez-Diaz S: Effects of gestational
age at enrollment in pregnancy exposure registries. Pharmacoepidemiol Drug Saf 2015,
24(4):343-352.
38. Meister R, Schaefer C: Statistical methods for estimating the probability of spontaneous
abortion in observational studies--analyzing pregnancies exposed to coumarin derivatives.
Reprod Toxicol 2008, 26(1):31-35.
39. McGready R, Lee SJ, Wiladphaingern J, Ashley EA, Rijken MJ, Boel M, Simpson JA, Paw MK,
Pimanpanarak M, Mu O et al: Adverse effects of falciparum and vivax malaria and the
safety of antimalarial treatment in early pregnancy: a population-based study. Lancet
Infect Dis 2012, 12(5):388-396.
40. Smith KE, Buyalos RP: The profound impact of patient age on pregnancy outcome after
early detection of fetal cardiac activity. Fertil Steril 1996, 65(1):35-40.
41. Kline J: I. An epidemiological review of the role of gravidity in spontaneous abortion. Early
Hum Dev 1978, 1(4):337-344.
42. Regan L, Braude PR, Trembath PL: Influence of past reproductive performance on risk of
spontaneous abortion. BMJ 1989, 299(6698):541-545.
43. Brocklehurst P, French R: The association between maternal HIV infection and perinatal
outcome: a systematic review of the literature and meta-analysis. Br J Obstet Gynaecol
1998, 105(8):836-848.
44. Temmerman M, Lopita MI, Sanghvi HC, Sinei SK, Plummer FA, Piot P: The role of maternal
syphilis, gonorrhoea and HIV-1 infections in spontaneous abortion. International journal of
STD & AIDS 1992, 3(6):418-422.
45. Norsker FN, Espenhain L, S AR, Morgen CS, Andersen PK, Nybo Andersen AM:
Socioeconomic position and the risk of spontaneous abortion: a study within the Danish
National Birth Cohort. BMJ open 2012, 2(3).
46. McCord GC, Liu A, Singh P: Deployment of community health workers across rural sub-
Saharan Africa: financial considerations and operational assumptions. Bulletin of the World
Health Organization 2013, 91(4):244-253B.
47. African Population and Health Research Center, Ministry of Health Kenya, Ipas, Guttmacher
Institute: Incidence and Complications of Unsafe Abortion in Kenya: Key Findings of a
National Study. In. Nairobi, Kenya; 2013.
48. Desai M, ter Kuile FO, Nosten F, McGready R, Asamoa K, Brabin B, Newman RD:
Epidemiology and burden of malaria in pregnancy. Lancet Infect Dis 2007, 7(2):93-104.
Page 13 of 25
For peer review only - http://bmjopen.bmj.com/site/about/guidelines.xhtml
BMJ Open
123456789101112131415161718192021222324252627282930313233343536373839404142434445464748495051525354555657585960
on 10 March 2019 by guest. P
rotected by copyright.http://bm
jopen.bmj.com
/B
MJ O
pen: first published as 10.1136/bmjopen-2016-011088 on 15 A
pril 2016. Dow
nloaded from

For peer review only
14
Table 1. Participants’ characteristics and risk factors for miscarriage
Overall (N=1134) Miscarriage (N=89) Other Pregnancy
Outcomes (n=1045) Hazard Ratio (95%CI) P-values
Gestational age at pregnancy detection in weeks
(mean (SD)) 13.3 (6.9; 0-27.9) 7.8 (4.4) 13.7 (6.9) 0.94 (0.88, 1.01) 0.094
Age in years (mean (SD)) 26.1 (6.8) 29.5 (7.9) 25.8 (6.6) 1.08 (1.04, 1.11) <0.001
Age categories <0.001
15-20 285 (25.1) 14 (15.7) 271 (25.9) 1
21-25 287 (25.3) 14 (15.7) 273 (26.1) 0.9 (0.42, 1.9)
26-30 255 (22.5) 16 (18.0) 239 (22.9) 1.14 (0.57, 2.3)
31-35 179 (15.8) 21 (23.6) 158 (15.1) 2.31 (1.2, 4.44)
>35 128 (11.3) 24 (27.0) 104 (10.0) 4.02 (2.08, 7.76)
Education level 0.713
None/ Primary not completed 495 (44.4) 38 (43.7) 457 (44.4) 1
Primary completed 533 (47.8) 44 (50.6) 489 (47.5) 1.07 (0.69, 1.66)
Secondary completed 88 (7.9) 5 (5.8) 83 (8.1) 0.69 (0.23, 2.04)
Missing 18 2 16
Occupation <0.001
Not working 379 (34.4) 22 (25.6) 357 (35.1) 1
Farming 369 (33.5) 39 (45.4) 330 (32.5) 1.47 (0.88, 2.45)
Small business/Skilled Labour/Salaried 335 (30.4) 19 (22.1) 316 (31.1) 0.88 (0.48, 1.6)
Other 20 (1.8) 6 (7.0) 14 (1.4) 5.15 (2.15, 12.34)
Missing 31 2 16
Marital Status 0.224
Page 14 of 25
For peer review only - http://bmjopen.bmj.com/site/about/guidelines.xhtml
BMJ Open
123456789101112131415161718192021222324252627282930313233343536373839404142434445464748495051525354555657585960
on 10 March 2019 by guest. Protected by copyright. http://bmjopen.bmj.com/ BMJ Open: first published as 10.1136/bmjopen-2016-011088 on 15 April 2016. Downloaded from

For peer review only
15
Overall (N=1134) Miscarriage (N=89) Other Pregnancy
Outcomes (n=1045) Hazard Ratio (95%CI) P-values
Single 240 (21.5) 22 (25.3) 218 (21.2) 1
Married 876 (78.51) 65 (74.7) 811 (78.8) 0.74 (0.46, 1.2)
Missing 18 2 16
Household wealth quintiles 0.024
poorest 105 (9.7) 18 (20.5) 87 (8.8) 1
very poor 158 (14.6) 9 (10.2) 149 (15.0) 0.33 (0.15, 0.75)
poor 220 (20.4) 16 (18.2) 204 (25.6) 0.4 (0.2, 0.81)
less poor 269 (24.9) 22 (25.0) 247 (24.9) 0.47 (0.25, 0.88)
least poor 328 (30.4) 23 (26.1) 305 (30.8) 0.39 (0.21, 0.74)
Missing 54 1 53
Gravidity <0.001
Primigravid 219 (19.6) 17 (19.3) 202 (19.6) 1
1-3 pregnancies 525 (47.0) 23 (26.1) 502 (48.8) 0.49 (0.26, 0.91)
4+ pregnancies 374 (33.5) 49 (55.1) 325 (31.6) 1.63 (0.95, 2.79)
Missing 16 0 16
Previous pregnancy loss 160 (14.3), 22 (25.0), 138 (13.4) , 2.23 (1.4, 3.56)
0.001 Missing n=17 Missing n= 1 Missing n= 16
Antenatal Care Summary
Gestational age at 1st ANC visit in weeks (mean (SD)) 20.8 (7.8) Range:
1.7-41.0
10.4 (4.9), missing
n=71
21.0 (7.7), missing
n=227 0.85 (0.79, 0.91) <0.001
Number of ANC visit <0.001
none 89 (8.1) 66 (74.2) 23 (2.3) 1
1 90 (8.2) 18 (20.2) 72 (7.2) 0.17 (0.1, 0.29)
2 155 (14.2) 1 (1.1) 154 (15.3) 0 (0, 0.03)
3 244 (22.3) 3 (3.4) 241 (24.0) 0.01 (0, 0.03)
4+ 517 (47.2) 1 (1.1) 516 (51.3) 0 (0, 0.01)
Page 15 of 25
For peer review only - http://bmjopen.bmj.com/site/about/guidelines.xhtml
BMJ Open
123456789101112131415161718192021222324252627282930313233343536373839404142434445464748495051525354555657585960
on 10 March 2019 by guest. Protected by copyright. http://bmjopen.bmj.com/ BMJ Open: first published as 10.1136/bmjopen-2016-011088 on 15 April 2016. Downloaded from

For peer review only
16
Overall (N=1134) Miscarriage (N=89) Other Pregnancy
Outcomes (n=1045) Hazard Ratio (95%CI) P-values
Missing 39 0 39
IPTp doses (HIV negative) <0.001
none 242 (28.3) 73 (98.7) 169 (21.7) 1
1 95 (11.1) 1 (1.4) 94 (12.1) 0.04 (0.01, 0.31)
2 175 (20.5) 0 175 (22.4) 0 (0, 0)
3 222 (26.0) 0 222 (28.5) 0 (0, 0)
4 120 (14.1) 0 120 (15.4) 0 (0, 0)
Missing 280 18 265 0 (0, 0)
Vaginal Bleeding <0.001
No 813 (97.3) 14 (77.8) 799 (97.7) 1
Yes 23 (2.8) 4 (22.2) 19 (2.3) 11.57 (4, 33.46)
Missing 298 71 227
ANC Profile at 1st
ANC visit
HIV positive <0.001
Negative 771 (68.0) 17 (19.0) 754 (72.2) 1
Positive 262 (23.1) 27 (30.3) 235 (22.5) 4.83 (2.62, 8.9)
Unknown 101 (8.9) 45 (50.6) 56 (5.4) 25.83 (14.7, 45.39)
Haemoglobin (mean (SD; range)) 11.2 (1.9; 4.3-17.2) 12.4 (1.9) 11.2 (1.9) 1.31 (1.05, 1.63)
0.017 Missing n=309 missing n=72 missing n=237
Anaemia (Hb<11g/dl) 0.184
No 476 (57.7) 13 (76.5) 463 (57.3) 1
Yes 349 (42.3) 4 (23.5) 345 (42.7) 0.47 (0.15, 1.44)
Missing 309 72 237
Syphilis reactive test 0.750
Negative 838 (92.3) 20 (95.2) 818 (92.2) 1
Page 16 of 25
For peer review only - http://bmjopen.bmj.com/site/about/guidelines.xhtml
BMJ Open
123456789101112131415161718192021222324252627282930313233343536373839404142434445464748495051525354555657585960
on 10 March 2019 by guest. Protected by copyright. http://bmjopen.bmj.com/ BMJ Open: first published as 10.1136/bmjopen-2016-011088 on 15 April 2016. Downloaded from

For peer review only
17
Overall (N=1134) Miscarriage (N=89) Other Pregnancy
Outcomes (n=1045) Hazard Ratio (95%CI) P-values
Positive 70 (7.7) 1 (4.8) 69 (7.8) 0.79 (0.18, 3.47)
Missing 226 68 158
Malaria slide positive at 1st
ANC visit 0.651
Negative 712 (86.0) 16 (88.9) 696 (85.9) 1
Positive 116 (14.0) 2 (11.1) 114 (14.1) 0.63 (0.09, 4.61)
Missing 306 71 235
Page 17 of 25
For peer review only - http://bmjopen.bmj.com/site/about/guidelines.xhtml
BMJ Open
123456789101112131415161718192021222324252627282930313233343536373839404142434445464748495051525354555657585960
on 10 March 2019 by guest. Protected by copyright. http://bmjopen.bmj.com/ BMJ Open: first published as 10.1136/bmjopen-2016-011088 on 15 April 2016. Downloaded from

For peer review only
18
Table 2. Table of weekly miscarriage rate, cumulative probabilities of survival and of miscarriage and remaining risk of miscarriage at each gestation week.
Gestational
week
Pregnancies
Detected
during week
Pregnancy-
Weeks at
Risk
Miscarriage Induced
abortion
Loss to follow
up &
withdrawals
Weekly miscarriage
rate per 1000
pregnancy-weeks
(95%CI)
Probability of
miscarriage per
gestational week
Probability of
survival per
gestational
week
Cumulative
probability
of survival
Cumulative
probability of
miscarriage
Remaining
probability of
miscarriage
<4 48 32.3 0 1 1 0 0.000 1.000 1.000 0.000 0.189
4 42 67.4 2 0 0 29.66 (7.42- 120) 0.029 0.971 0.971 0.029 0.189
5 77 127.6 2 0 0 15.68 (3.92- 62.69) 0.016 0.984 0.956 0.044 0.165
6 79 200.1 5 0 0 24.98 (10.4- 60.02) 0.025 0.975 0.932 0.068 0.152
7 69 276.9 2 3 0 7.22 (1.81- 28.88) 0.007 0.993 0.925 0.075 0.130
8 71 334.1 3 1 1 8.98 (2.9- 27.84) 0.009 0.991 0.917 0.083 0.124
9 63 397.7 6 0 0 15.09 (6.78- 33.58) 0.015 0.985 0.903 0.097 0.116
10 59 451 7 0 0 15.52 (7.4- 32.56) 0.015 0.985 0.889 0.111 0.103
11 57 502.6 6 1 1 11.94 (5.36- 26.57) 0.012 0.988 0.879 0.121 0.088
12 52 548.3 12 1 1 21.89 (12.43- 38.54) 0.022 0.978 0.860 0.140 0.078
13 41 583.4 3 1 0 5.14 (1.66- 15.94) 0.005 0.995 0.855 0.145 0.057
14 52 626.6 4 0 1 6.38 (2.4- 17.01) 0.006 0.994 0.850 0.150 0.052
15 40 667.9 9 0 0 13.47 (7.01- 25.9) 0.013 0.987 0.839 0.161 0.046
16 43 703.1 2 0 0 2.84 (0.71- 11.37) 0.003 0.997 0.836 0.164 0.033
17 44 739.9 5 1 0 6.76 (2.81- 16.24) 0.007 0.993 0.831 0.169 0.030
18 30 769.1 5 0 0 6.5 (2.71- 15.62) 0.006 0.994 0.825 0.175 0.024
19 33 796.4 2 0 0 2.51 (0.63- 10.04) 0.003 0.997 0.823 0.177 0.018
20 26 823.9 4 0 1 4.86 (1.82- 12.94) 0.005 0.995 0.819 0.181 0.015
21 33 852.1 1 0 1 1.17 (0.17- 8.33) 0.001 0.999 0.818 0.182 0.010
22 23 873.4 0 0 1 0 0.000 1.000 0.818 0.182 0.009
23 36 905.6 1 0 0 1.1 (0.16- 7.84) 0.001 0.999 0.817 0.183 0.009
24 30 937.3 0 0 0 0 0.000 1.000 0.817 0.183 0.008
25 20 960.1 2 0 0 2.08 (0.52- 8.33) 0.002 0.998 0.816 0.184 0.008
26 38 994.4 4 0 0 4.02 (1.51- 10.72) 0.004 0.996 0.812 0.188 0.006
27 28 1016.9 2 0 12 1.97 (0.49- 7.86) 0.002 0.998 0.811 0.189 0.002
Page 18 of 25
For peer review only - http://bmjopen.bmj.com/site/about/guidelines.xhtml
BMJ Open
123456789101112131415161718192021222324252627282930313233343536373839404142434445464748495051525354555657585960
on 10 March 2019 by guest. Protected by copyright. http://bmjopen.bmj.com/ BMJ Open: first published as 10.1136/bmjopen-2016-011088 on 15 April 2016. Downloaded from

For peer review only
19
Figures
Figure 1. Study participant flow diagram from screening to inclusion in data analysis for miscarriage.
Figure 2. Number of pregnancies detected according different recruitment strategies and mean
gestational age at time of pregnancy detection over study period. Pregnancy detection strategies
included: antenatal clinic at the designated study facility (ANC); enrolment in the pharmacovigilance
cohort study (enrolment); participant seeking pregnancy tests from study staff (passive detection) or
through 3-monthly home visits by study staff offering pregnancy tests (active detection).
Figure 3. Miscarriage rate per 1000 pregnancy-week by week of gestation with upper and lower
estimates of 95% confidence interval.
Figure 4. Miscarriage Kaplan Meier survival curve by gestational week.
Page 19 of 25
For peer review only - http://bmjopen.bmj.com/site/about/guidelines.xhtml
BMJ Open
123456789101112131415161718192021222324252627282930313233343536373839404142434445464748495051525354555657585960
on 10 March 2019 by guest. P
rotected by copyright.http://bm
jopen.bmj.com
/B
MJ O
pen: first published as 10.1136/bmjopen-2016-011088 on 15 A
pril 2016. Dow
nloaded from

For peer review only
Figure 1. Study participant flow diagram from screening to inclusion in data analysis for miscarriage. 297x420mm (300 x 300 DPI)
Page 20 of 25
For peer review only - http://bmjopen.bmj.com/site/about/guidelines.xhtml
BMJ Open
123456789101112131415161718192021222324252627282930313233343536373839404142434445464748495051525354555657585960
on 10 March 2019 by guest. P
rotected by copyright.http://bm
jopen.bmj.com
/B
MJ O
pen: first published as 10.1136/bmjopen-2016-011088 on 15 A
pril 2016. Dow
nloaded from

For peer review only
Number of pregnancies detected according different recruitment strategies and mean gestational age at time of pregnancy detection over study period. Pregnancy detection strategies included: antenatal clinic at the designated study facility (ANC); enrolment in the pharmacovigilance cohort study (enrolment); participant seeking pregnancy tests from study staff (passive detection) or through 3-monthly home visits by study
staff offering pregnancy tests (active detection). 190x107mm (300 x 300 DPI)
Page 21 of 25
For peer review only - http://bmjopen.bmj.com/site/about/guidelines.xhtml
BMJ Open
123456789101112131415161718192021222324252627282930313233343536373839404142434445464748495051525354555657585960
on 10 March 2019 by guest. P
rotected by copyright.http://bm
jopen.bmj.com
/B
MJ O
pen: first published as 10.1136/bmjopen-2016-011088 on 15 A
pril 2016. Dow
nloaded from

For peer review only
Miscarriage rate per 1000 pregnancy-week by week of gestation with upper and lower estimates of 95% confidence interval.
190x107mm (300 x 300 DPI)
Page 22 of 25
For peer review only - http://bmjopen.bmj.com/site/about/guidelines.xhtml
BMJ Open
123456789101112131415161718192021222324252627282930313233343536373839404142434445464748495051525354555657585960
on 10 March 2019 by guest. P
rotected by copyright.http://bm
jopen.bmj.com
/B
MJ O
pen: first published as 10.1136/bmjopen-2016-011088 on 15 A
pril 2016. Dow
nloaded from

For peer review only
Miscarriage Kaplan Meier survival curve by gestational week.
190x107mm (300 x 300 DPI)
Page 23 of 25
For peer review only - http://bmjopen.bmj.com/site/about/guidelines.xhtml
BMJ Open
123456789101112131415161718192021222324252627282930313233343536373839404142434445464748495051525354555657585960
on 10 March 2019 by guest. P
rotected by copyright.http://bm
jopen.bmj.com
/B
MJ O
pen: first published as 10.1136/bmjopen-2016-011088 on 15 A
pril 2016. Dow
nloaded from

For peer review only
1
STROBE Statement—checklist of items that should be included in reports of observational studies Item
No Recommendation
Check
Title and abstract 1 (a) Indicate the study’s design with a commonly used term in the title or the
abstract
√ p.1
(b) Provide in the abstract an informative and balanced summary of what was
done and what was found
√ p.3
Introduction
Background/rationale 2 Explain the scientific background and rationale for the investigation being
reported
√ p.4
Objectives 3 State specific objectives, including any prespecified hypotheses NA
Methods
Study design 4 Present key elements of study design early in the paper √ p.4
Setting 5 Describe the setting, locations, and relevant dates, including periods of
recruitment, exposure, follow-up, and data collection
√ p.5
Participants 6 (a) Cohort study—Give the eligibility criteria, and the sources and methods of
selection of participants. Describe methods of follow-up
Case-control study—Give the eligibility criteria, and the sources and methods of
case ascertainment and control selection. Give the rationale for the choice of
cases and controls
Cross-sectional study—Give the eligibility criteria, and the sources and methods
of selection of participants
√ p.5-6
(b) Cohort study—For matched studies, give matching criteria and number of
exposed and unexposed
Case-control study—For matched studies, give matching criteria and the number
of controls per case
NA
Variables 7 Clearly define all outcomes, exposures, predictors, potential confounders, and
effect modifiers. Give diagnostic criteria, if applicable
√ p.6-7
Data sources/
measurement
8* For each variable of interest, give sources of data and details of methods of
assessment (measurement). Describe comparability of assessment methods if
there is more than one group
√ p.6-7
Bias 9 Describe any efforts to address potential sources of bias √ p.6-7
Study size 10 Explain how the study size was arrived at NA
Quantitative variables 11 Explain how quantitative variables were handled in the analyses. If applicable,
describe which groupings were chosen and why
NA
Statistical methods 12 (a) Describe all statistical methods, including those used to control for
confounding
√ p.7
(b) Describe any methods used to examine subgroups and interactions NA
(c) Explain how missing data were addressed √ p.7
(d) Cohort study—If applicable, explain how loss to follow-up was addressed
Case-control study—If applicable, explain how matching of cases and controls
was addressed
Cross-sectional study—If applicable, describe analytical methods taking account
of sampling strategy
√ p.6-7
(e) Describe any sensitivity analyses NA
Continued on next page
Page 24 of 25
For peer review only - http://bmjopen.bmj.com/site/about/guidelines.xhtml
BMJ Open
123456789101112131415161718192021222324252627282930313233343536373839404142434445464748495051525354555657585960
on 10 March 2019 by guest. P
rotected by copyright.http://bm
jopen.bmj.com
/B
MJ O
pen: first published as 10.1136/bmjopen-2016-011088 on 15 A
pril 2016. Dow
nloaded from

For peer review only
2
Results
Participants 13* (a) Report numbers of individuals at each stage of study—eg numbers potentially eligible,
examined for eligibility, confirmed eligible, included in the study, completing follow-up,
and analysed
√ p.7 -8
(b) Give reasons for non-participation at each stage √ p.7-8
(c) Consider use of a flow diagram √ Fig 1
Descriptive
data
14* (a) Give characteristics of study participants (eg demographic, clinical, social) and
information on exposures and potential confounders
√ p.8 &
table 1
(b) Indicate number of participants with missing data for each variable of interest √ table 1
(c) Cohort study—Summarise follow-up time (eg, average and total amount)
Outcome data 15* Cohort study—Report numbers of outcome events or summary measures over time √ p.8
Case-control study—Report numbers in each exposure category, or summary measures of
exposure
NA
Cross-sectional study—Report numbers of outcome events or summary measures NA
Main results 16 (a) Give unadjusted estimates and, if applicable, confounder-adjusted estimates and their
precision (eg, 95% confidence interval). Make clear which confounders were adjusted for
and why they were included
NA
(b) Report category boundaries when continuous variables were categorized NA
(c) If relevant, consider translating estimates of relative risk into absolute risk for a
meaningful time period
NA
Other analyses 17 Report other analyses done—eg analyses of subgroups and interactions, and sensitivity
analyses
NA
Discussion
Key results 18 Summarise key results with reference to study objectives √ p.8
Limitations 19 Discuss limitations of the study, taking into account sources of potential bias or
imprecision. Discuss both direction and magnitude of any potential bias
√ p.9-10
Interpretation 20 Give a cautious overall interpretation of results considering objectives, limitations,
multiplicity of analyses, results from similar studies, and other relevant evidence
√ p.9-10
Generalisability 21 Discuss the generalisability (external validity) of the study results √ p.10
Other information
Funding 22 Give the source of funding and the role of the funders for the present study and, if
applicable, for the original study on which the present article is based
√ p.11
*Give information separately for cases and controls in case-control studies and, if applicable, for exposed and
unexposed groups in cohort and cross-sectional studies.
Note: An Explanation and Elaboration article discusses each checklist item and gives methodological background and
published examples of transparent reporting. The STROBE checklist is best used in conjunction with this article (freely
available on the Web sites of PLoS Medicine at http://www.plosmedicine.org/, Annals of Internal Medicine at
http://www.annals.org/, and Epidemiology at http://www.epidem.com/). Information on the STROBE Initiative is
available at www.strobe-statement.org.
Page 25 of 25
For peer review only - http://bmjopen.bmj.com/site/about/guidelines.xhtml
BMJ Open
123456789101112131415161718192021222324252627282930313233343536373839404142434445464748495051525354555657585960
on 10 March 2019 by guest. P
rotected by copyright.http://bm
jopen.bmj.com
/B
MJ O
pen: first published as 10.1136/bmjopen-2016-011088 on 15 A
pril 2016. Dow
nloaded from