bmc genomics biomed central - home - springer · biomed central page 1 of 21 ... bmc genomics...
TRANSCRIPT
BioMed CentralBMC Genomics
ss
Open AcceResearch articleGene expression profiling of intestinal regeneration in the sea cucumberPablo A Ortiz-Pineda1, Francisco Ramírez-Gómez1, Judit Pérez-Ortiz1, Sebastián González-Díaz1, Francisco Santiago-De Jesús1, Josue Hernández-Pasos1, Cristina Del Valle-Avila1, Carmencita Rojas-Cartagena1, Edna C Suárez-Castillo2, Karen Tossas1, Ana T Méndez-Merced3, José L Roig-López1, Humberto Ortiz-Zuazaga4 and José E García-Arrarás*1Address: 1University of Puerto Rico, Rio Piedras, Department of Biology, San Juan, PR, USA, 2Yale University, Department of Molecular, Cellular and Developmental Biology, New Haven, CT, USA, 3Universidad del Este- SUAGM, School of Science and Technology, Carolina, PR, USA and 4University of Puerto Rico, HPCf, High Performance Computing facility, San Juan, PR, USA
Email: Pablo A Ortiz-Pineda - [email protected]; Francisco Ramírez-Gómez - [email protected]; Judit Pérez-Ortiz - [email protected]; Sebastián González-Díaz - [email protected]; Francisco Santiago-De Jesús - [email protected]; Josue Hernández-Pasos - [email protected]; Cristina Del Valle-Avila - [email protected]; Carmencita Rojas-Cartagena - [email protected]; Edna C Suárez-Castillo - [email protected]; Karen Tossas - [email protected]; Ana T Méndez-Merced - [email protected]; José L Roig-López - [email protected]; Humberto Ortiz-Zuazaga - [email protected]; José E García-Arrarás* - [email protected]
* Corresponding author
AbstractBackground: Among deuterostomes, the regenerative potential is maximally expressed inechinoderms, animals that can quickly replace most injured organs. In particular, sea cucumbers areexcellent models for studying organ regeneration since they regenerate their digestive tract afterevisceration. However, echinoderms have been sidelined in modern regeneration studies partiallybecause of the lack of genome-wide profiling approaches afforded by modern genomic tools.
For the last decade, our laboratory has been using the sea cucumber Holothuria glaberrima to dissectthe cellular and molecular events that allow for such amazing regenerative processes. We havealready established an EST database obtained from cDNA libraries of normal and regeneratingintestine at two different regeneration stages. This database now has over 7000 sequences.
Results: In the present work we used a custom-made microchip from Agilent with 60-mer probesfor these ESTs, to determine the gene expression profile during intestinal regeneration. Here wecompared the expression profile of animals at three different intestinal regeneration stages (3-, 7-and 14-days post evisceration) against the profile from normal (uneviscerated) intestines. Thenumber of differentially expressed probes ranged from 70% at p < 0.05 to 39% at p < 0.001.Clustering analyses show specific profiles of expression for early (first week) and late (secondweek) regeneration stages. We used semiquantitative reverse transcriptase polymerase chainreaction (RT-PCR) to validate the expression profile of fifteen microarray detected differentiallyexpressed genes which resulted in over 86% concordance between both techniques. Most of thedifferentially expressed ESTs showed no clear similarity to sequences in the databases and might
Published: 8 June 2009
BMC Genomics 2009, 10:262 doi:10.1186/1471-2164-10-262
Received: 23 January 2009Accepted: 8 June 2009
This article is available from: http://www.biomedcentral.com/1471-2164/10/262
© 2009 Ortiz-Pineda et al; licensee BioMed Central Ltd. This is an Open Access article distributed under the terms of the Creative Commons Attribution License (http://creativecommons.org/licenses/by/2.0), which permits unrestricted use, distribution, and reproduction in any medium, provided the original work is properly cited.
Page 1 of 21(page number not for citation purposes)
BMC Genomics 2009, 10:262 http://www.biomedcentral.com/1471-2164/10/262
represent novel genes associated with regeneration. However, other ESTs were similar to genesknown to be involved in regeneration-related processes, wound healing, cell proliferation,differentiation, morphological plasticity, cell survival, stress response, immune challenge, andneoplastic transformation. Among those that have been validated, cytoskeletal genes, such as actins,and developmental genes, such as Wnt and Hox genes, show interesting expression profiles duringregeneration.
Conclusion: Our findings set the base for future studies into the molecular basis of intestinalregeneration. Moreover, it advances the use of echinoderms in regenerative biology, animals thatbecause of their amazing properties and their key evolutionary position, might provide importantclues to the genetic basis of regenerative processes.
BackgroundAll living organisms exhibit, to some extent, regenerativeproperties that allow them to deal with environmentalevents, physical trauma or diseases. Regenerative capaci-ties have been studied in terms of stem cell recruitment,cell dedifferentiation, proliferation and migration, provi-sion of specific regulatory/trophic factors, and expressionor re-expression of the developmental program in adultanimals [1]. However, the molecular/genetic basis ofregeneration remains obscure.
Central to regeneration studies is the choice of the modelorganism, since metazoan species can show large variabil-ity in their regenerative capacities. In general, the ability toreplace complex body parts decreases as one moves fromthe basal to the more highly derived taxa. However, evenwithin the same phylum, not all animals are able to regen-erate body parts, and not all tissues within a body can beequally repaired [2,3]. One problem in elucidating themolecular basis of regeneration has been that organismswith high regenerative capacities do not lend themselveseasily to traditional experimental genetics. Only recentlyhas progress been made to make possible the use of someof these model systems to dissect the genetic basis ofregeneration [4]. Among these, invertebrate systems suchas Hydra and planaria, and vertebrates, such as ascidiansand amphibian urodeles, have gained particular atten-tion. Nonetheless, regeneration research remains under-populated, and there are whole phyla of organisms,showing very interesting regenerative behaviors where lit-tle molecular research has been performed [5]
Among deuterostomes, the regenerative potential is max-imally expressed in echinoderms, animals that canquickly replace most injured organs. In particular, seacucumbers (holothurians) are excellent models for study-ing organ regeneration since they can regenerate many oftheir organs and appendages. Our laboratory has beenusing an echinoderm, Holothuria glaberrima as a modelorganism for the last decade to dissect the process of howthe digestive tract regenerates once it is eliminated byauto-evisceration. We have shown that following eviscer-
ation the new intestine regenerates from the free end ofthe remaining mesentery [6]. Initially, the mesenterial tipthickens forming a continuous rod-like structure thatextends from the esophagus to the cloaca. During the sec-ond regeneration week, luminal epithelial cells from theesophagus and from the cloaca migrate into this tube,forming the mucosal layer and giving rise to the intestinallumen. We have performed extensive studies at the cellu-lar level showing the involvement of cell division, dedif-ferentiation, and migration in the regeneration of theintestine [6-11] as well as of events associated with theremodeling of the extracellular matrix [12].
We have also used the sea cucumber to explore the role ofthe genes that allow for such extraordinary regenerativeprocesses [13]. Our approach has been to focus on targetgenes that have been associated with regenerative proc-esses or identified in the regenerating tissues [14,15]. Sim-ilar gene by gene approaches have been used to studyregeneration processes in other echinoderms, particularlyin brittle stars and crinoids [16-20]. However, the regener-ative capacities of the echinoderms have yet to beexplored systematically using a large number of moleculartools [21]. In fact, one of the reasons that echinodermshave been sidelined in modern regeneration studies is thelack of genome-wide profiling approaches afforded bymodern genomics [21]
We have now overcome this problem by determining theprofile of gene activity during intestinal regeneration in H.glaberrima using microarray technology. For this, microar-ray slides were made using over 7000 ESTs that we previ-ously identified from normal and regenerating intestinecDNA libraries [13]. Here we compare the gene expressionprofile of animals at 3, 7 and 14 days of regeneration, fol-lowing the evisceration process typical of these organisms.Results show a large number of differentially expressedgenes associated with intestinal regeneration. Some ofthese genes are homologues to metazoan genes associatedwith regenerative processes while many others might benovel sequences with little or no similarities to sequencesin the databanks. To explore our results, we have focused
Page 2 of 21(page number not for citation purposes)
BMC Genomics 2009, 10:262 http://www.biomedcentral.com/1471-2164/10/262
on those sequences that are differentially expressed duringearly intestinal regeneration and that are associated withevents previously shown to occur at the cellular level,namely developmental processes, cytoskeletal transfor-mations and extracellular matrix remodeling. Our resultsmake available the first overview of gene expression pat-terns in the regenerating intestine. More importantly, ourresults provide the basis for molecular studies aimed atexploring the molecular basis of regeneration in a groupof animals that because of their remarkable properties andtheir key evolutionary position will provide importantclues to the genetic basis of regenerative processes.
ResultsTechnical AnalysesTechnical analysis showed that the microarrays performedas expected. First, the intensities of the 536 internal con-trols of the Agilent array perfectly matched the expectedones as shown in the regression model [see additional file1]. Second, no significant variation was observed betweenraw data and normalized MA plots [Additional file 2],which means that there was no significant dye bias. Third,dye swap results showed extremely high similarity in theirlabeling pattern [additional file 3]. Since the dye swapswere made with different animal samples (biological dye-swaps), this implies that not only did dyes produced sim-ilar results, but that results from animals at the sameregeneration stage were equivalent. Fourth, analyses ofgenes spotted in duplicate within the same array (techni-cal replicates) showed almost identical fold changes, evi-dencing the strong reproducibility of our data.
Gene expression profilesA. Venn DiagramsMicroarray results showed dramatic differences in geneexpression between regenerating and normal intestineand also among animals at different regeneration stages.Of the 14352 H. glaberrima probes in our microarray,5915 showed similar expression in all groups, includingnormal (uneviscerated) and 3-, 7- and 14-days post-evis-ceration (dpe) regenerating intestines.
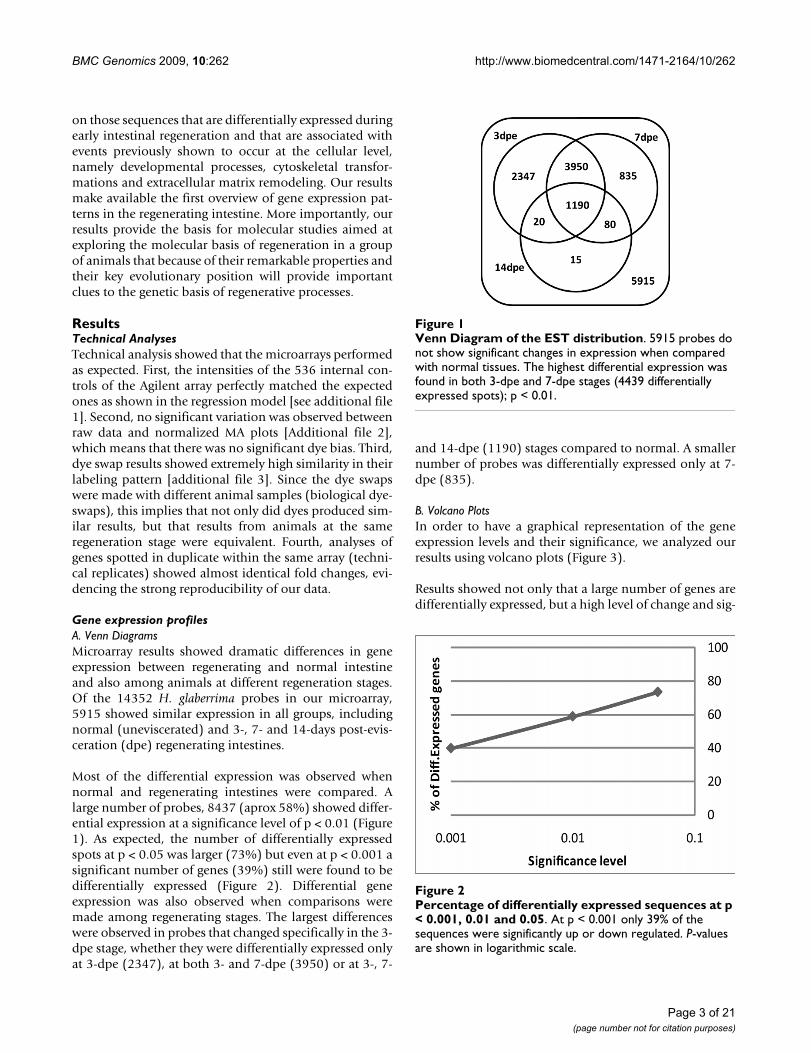
Most of the differential expression was observed whennormal and regenerating intestines were compared. Alarge number of probes, 8437 (aprox 58%) showed differ-ential expression at a significance level of p < 0.01 (Figure1). As expected, the number of differentially expressedspots at p < 0.05 was larger (73%) but even at p < 0.001 asignificant number of genes (39%) still were found to bedifferentially expressed (Figure 2). Differential geneexpression was also observed when comparisons weremade among regenerating stages. The largest differenceswere observed in probes that changed specifically in the 3-dpe stage, whether they were differentially expressed onlyat 3-dpe (2347), at both 3- and 7-dpe (3950) or at 3-, 7-
and 14-dpe (1190) stages compared to normal. A smallernumber of probes was differentially expressed only at 7-dpe (835).
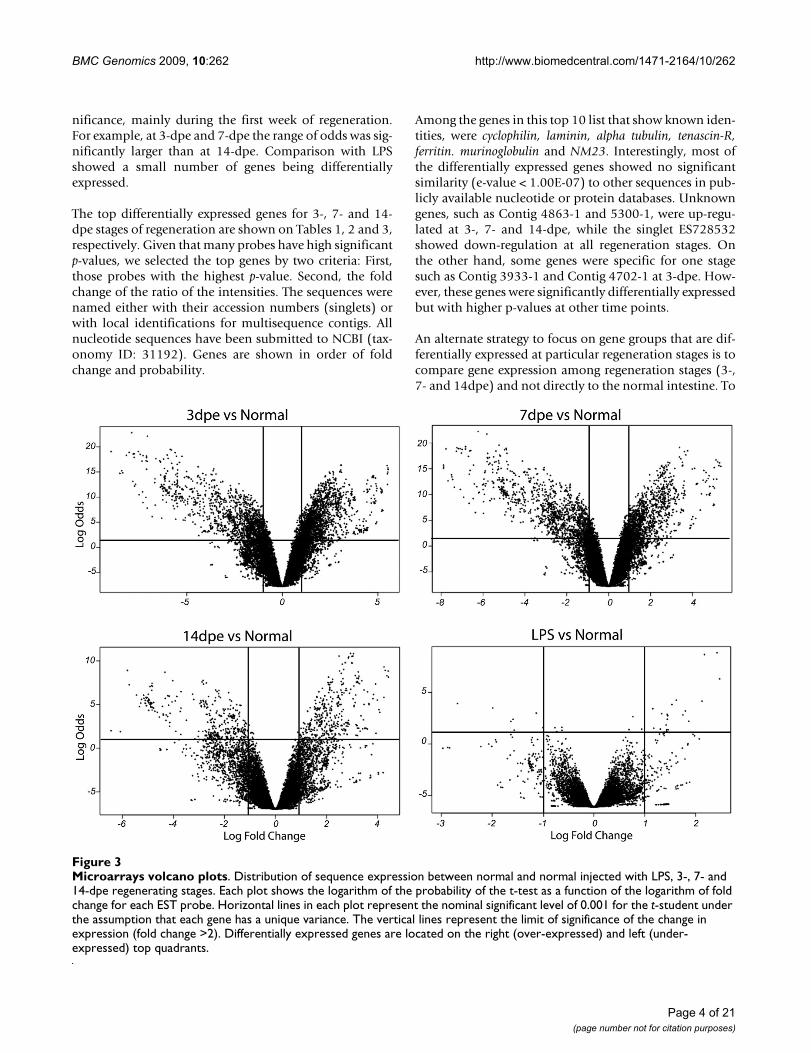
B. Volcano PlotsIn order to have a graphical representation of the geneexpression levels and their significance, we analyzed ourresults using volcano plots (Figure 3).
Results showed not only that a large number of genes aredifferentially expressed, but a high level of change and sig-
Venn Diagram of the EST distributionFigure 1Venn Diagram of the EST distribution. 5915 probes do not show significant changes in expression when compared with normal tissues. The highest differential expression was found in both 3-dpe and 7-dpe stages (4439 differentially expressed spots); p < 0.01.
Percentage of differentially expressed sequences at p < 0.001, 0.01 and 0.05Figure 2Percentage of differentially expressed sequences at p < 0.001, 0.01 and 0.05. At p < 0.001 only 39% of the sequences were significantly up or down regulated. P-values are shown in logarithmic scale.
Page 3 of 21(page number not for citation purposes)
BMC Genomics 2009, 10:262 http://www.biomedcentral.com/1471-2164/10/262
nificance, mainly during the first week of regeneration.For example, at 3-dpe and 7-dpe the range of odds was sig-nificantly larger than at 14-dpe. Comparison with LPSshowed a small number of genes being differentiallyexpressed.
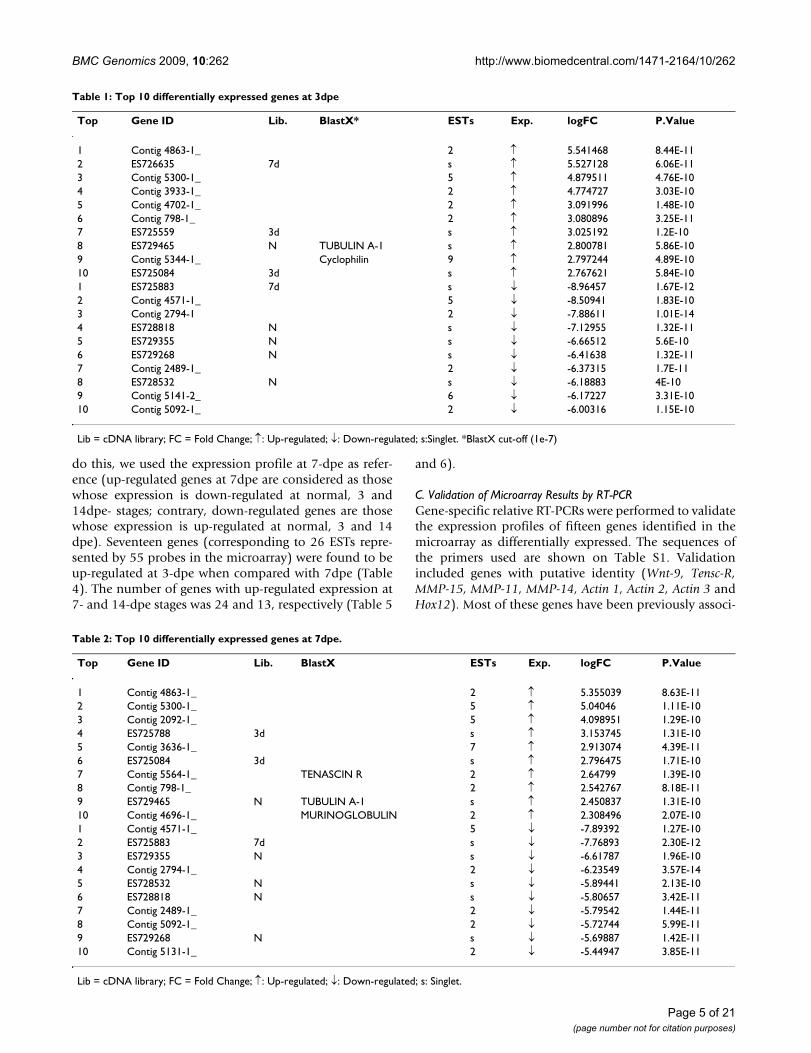
The top differentially expressed genes for 3-, 7- and 14-dpe stages of regeneration are shown on Tables 1, 2 and 3,respectively. Given that many probes have high significantp-values, we selected the top genes by two criteria: First,those probes with the highest p-value. Second, the foldchange of the ratio of the intensities. The sequences werenamed either with their accession numbers (singlets) orwith local identifications for multisequence contigs. Allnucleotide sequences have been submitted to NCBI (tax-onomy ID: 31192). Genes are shown in order of foldchange and probability.
Among the genes in this top 10 list that show known iden-tities, were cyclophilin, laminin, alpha tubulin, tenascin-R,ferritin. murinoglobulin and NM23. Interestingly, most ofthe differentially expressed genes showed no significantsimilarity (e-value < 1.00E-07) to other sequences in pub-licly available nucleotide or protein databases. Unknowngenes, such as Contig 4863-1 and 5300-1, were up-regu-lated at 3-, 7- and 14-dpe, while the singlet ES728532showed down-regulation at all regeneration stages. Onthe other hand, some genes were specific for one stagesuch as Contig 3933-1 and Contig 4702-1 at 3-dpe. How-ever, these genes were significantly differentially expressedbut with higher p-values at other time points.
An alternate strategy to focus on gene groups that are dif-ferentially expressed at particular regeneration stages is tocompare gene expression among regeneration stages (3-,7- and 14dpe) and not directly to the normal intestine. To
Microarrays volcano plotsFigure 3Microarrays volcano plots. Distribution of sequence expression between normal and normal injected with LPS, 3-, 7- and 14-dpe regenerating stages. Each plot shows the logarithm of the probability of the t-test as a function of the logarithm of fold change for each EST probe. Horizontal lines in each plot represent the nominal significant level of 0.001 for the t-student under the assumption that each gene has a unique variance. The vertical lines represent the limit of significance of the change in expression (fold change >2). Differentially expressed genes are located on the right (over-expressed) and left (under-expressed) top quadrants.
Page 4 of 21(page number not for citation purposes)
BMC Genomics 2009, 10:262 http://www.biomedcentral.com/1471-2164/10/262
Table 1: Top 10 differentially expressed genes at 3dpe
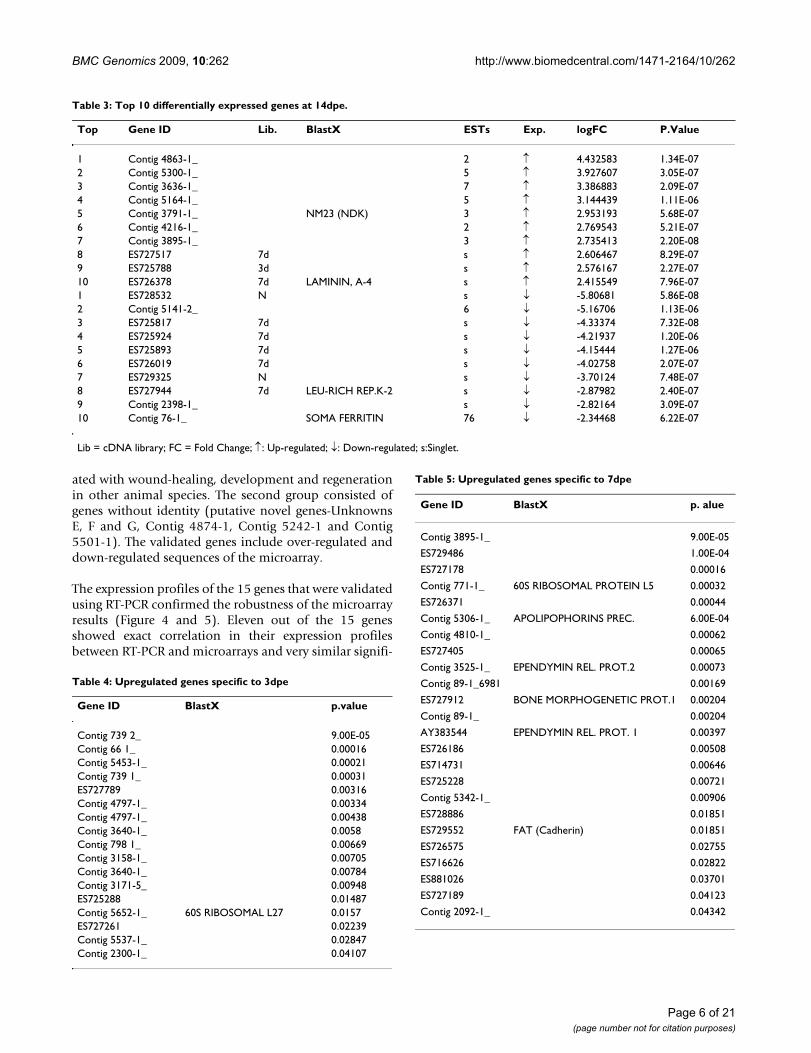
do this, we used the expression profile at 7-dpe as refer-ence (up-regulated genes at 7dpe are considered as thosewhose expression is down-regulated at normal, 3 and14dpe- stages; contrary, down-regulated genes are thosewhose expression is up-regulated at normal, 3 and 14dpe). Seventeen genes (corresponding to 26 ESTs repre-sented by 55 probes in the microarray) were found to beup-regulated at 3-dpe when compared with 7dpe (Table4). The number of genes with up-regulated expression at7- and 14-dpe stages was 24 and 13, respectively (Table 5
and 6).
C. Validation of Microarray Results by RT-PCRGene-specific relative RT-PCRs were performed to validatethe expression profiles of fifteen genes identified in themicroarray as differentially expressed. The sequences ofthe primers used are shown on Table S1. Validationincluded genes with putative identity (Wnt-9, Tensc-R,MMP-15, MMP-11, MMP-14, Actin 1, Actin 2, Actin 3 andHox12). Most of these genes have been previously associ-
Top Gene ID Lib. BlastX* ESTs Exp. logFC P.Value
1 Contig 4863-1_ 2 ↑ 5.541468 8.44E-112 ES726635 7d s ↑ 5.527128 6.06E-113 Contig 5300-1_ 5 ↑ 4.879511 4.76E-104 Contig 3933-1_ 2 ↑ 4.774727 3.03E-105 Contig 4702-1_ 2 ↑ 3.091996 1.48E-106 Contig 798-1_ 2 ↑ 3.080896 3.25E-117 ES725559 3d s ↑ 3.025192 1.2E-108 ES729465 N TUBULIN A-1 s ↑ 2.800781 5.86E-109 Contig 5344-1_ Cyclophilin 9 ↑ 2.797244 4.89E-1010 ES725084 3d s ↑ 2.767621 5.84E-101 ES725883 7d s ↓ -8.96457 1.67E-122 Contig 4571-1_ 5 ↓ -8.50941 1.83E-103 Contig 2794-1 2 ↓ -7.88611 1.01E-144 ES728818 N s ↓ -7.12955 1.32E-115 ES729355 N s ↓ -6.66512 5.6E-106 ES729268 N s ↓ -6.41638 1.32E-117 Contig 2489-1_ 2 ↓ -6.37315 1.7E-118 ES728532 N s ↓ -6.18883 4E-109 Contig 5141-2_ 6 ↓ -6.17227 3.31E-1010 Contig 5092-1_ 2 ↓ -6.00316 1.15E-10
Lib = cDNA library; FC = Fold Change; ↑: Up-regulated; ↓: Down-regulated; s:Singlet. *BlastX cut-off (1e-7)
Table 2: Top 10 differentially expressed genes at 7dpe.
Top Gene ID Lib. BlastX ESTs Exp. logFC P.Value
1 Contig 4863-1_ 2 ↑ 5.355039 8.63E-112 Contig 5300-1_ 5 ↑ 5.04046 1.11E-103 Contig 2092-1_ 5 ↑ 4.098951 1.29E-104 ES725788 3d s ↑ 3.153745 1.31E-105 Contig 3636-1_ 7 ↑ 2.913074 4.39E-116 ES725084 3d s ↑ 2.796475 1.71E-107 Contig 5564-1_ TENASCIN R 2 ↑ 2.64799 1.39E-108 Contig 798-1_ 2 ↑ 2.542767 8.18E-119 ES729465 N TUBULIN A-1 s ↑ 2.450837 1.31E-1010 Contig 4696-1_ MURINOGLOBULIN 2 ↑ 2.308496 2.07E-101 Contig 4571-1_ 5 ↓ -7.89392 1.27E-102 ES725883 7d s ↓ -7.76893 2.30E-123 ES729355 N s ↓ -6.61787 1.96E-104 Contig 2794-1_ 2 ↓ -6.23549 3.57E-145 ES728532 N s ↓ -5.89441 2.13E-106 ES728818 N s ↓ -5.80657 3.42E-117 Contig 2489-1_ 2 ↓ -5.79542 1.44E-118 Contig 5092-1_ 2 ↓ -5.72744 5.99E-119 ES729268 N s ↓ -5.69887 1.42E-1110 Contig 5131-1_ 2 ↓ -5.44947 3.85E-11
Lib = cDNA library; FC = Fold Change; ↑: Up-regulated; ↓: Down-regulated; s: Singlet.
Page 5 of 21(page number not for citation purposes)
BMC Genomics 2009, 10:262 http://www.biomedcentral.com/1471-2164/10/262
ated with wound-healing, development and regenerationin other animal species. The second group consisted ofgenes without identity (putative novel genes-UnknownsE, F and G, Contig 4874-1, Contig 5242-1 and Contig5501-1). The validated genes include over-regulated anddown-regulated sequences of the microarray.
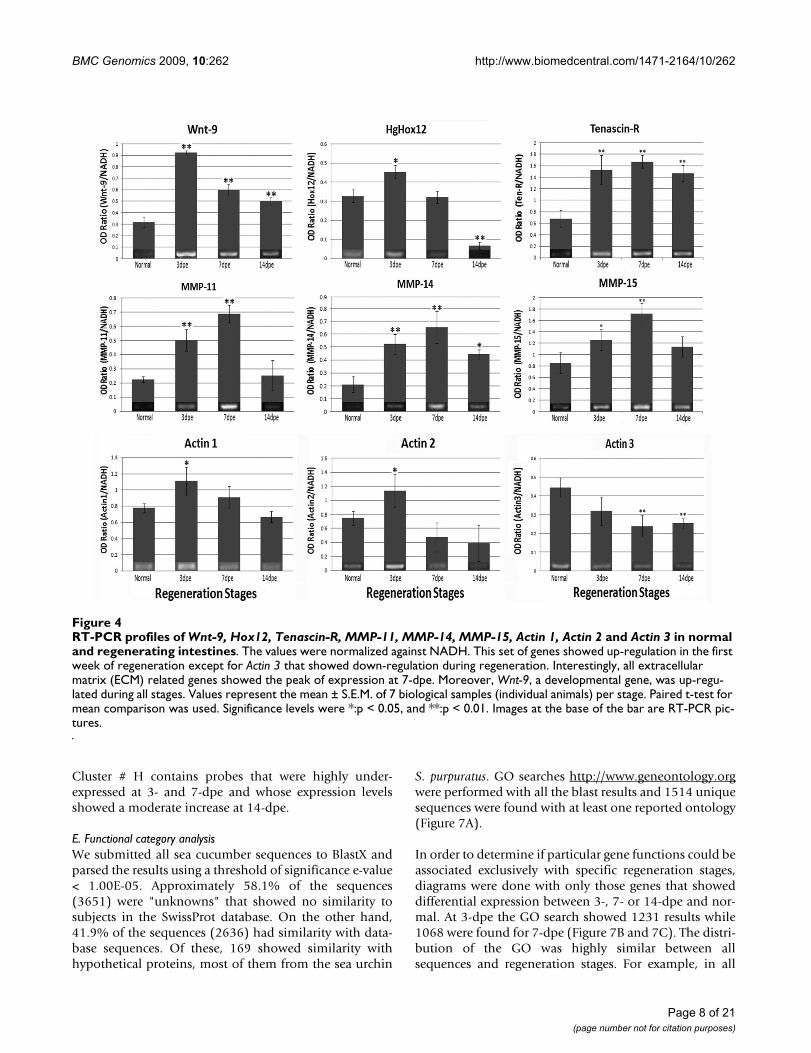
The expression profiles of the 15 genes that were validatedusing RT-PCR confirmed the robustness of the microarrayresults (Figure 4 and 5). Eleven out of the 15 genesshowed exact correlation in their expression profilesbetween RT-PCR and microarrays and very similar signifi-
Table 3: Top 10 differentially expressed genes at 14dpe.
Top Gene ID Lib. BlastX ESTs Exp. logFC P.Value
1 Contig 4863-1_ 2 ↑ 4.432583 1.34E-072 Contig 5300-1_ 5 ↑ 3.927607 3.05E-073 Contig 3636-1_ 7 ↑ 3.386883 2.09E-074 Contig 5164-1_ 5 ↑ 3.144439 1.11E-065 Contig 3791-1_ NM23 (NDK) 3 ↑ 2.953193 5.68E-076 Contig 4216-1_ 2 ↑ 2.769543 5.21E-077 Contig 3895-1_ 3 ↑ 2.735413 2.20E-088 ES727517 7d s ↑ 2.606467 8.29E-079 ES725788 3d s ↑ 2.576167 2.27E-0710 ES726378 7d LAMININ, A-4 s ↑ 2.415549 7.96E-071 ES728532 N s ↓ -5.80681 5.86E-082 Contig 5141-2_ 6 ↓ -5.16706 1.13E-063 ES725817 7d s ↓ -4.33374 7.32E-084 ES725924 7d s ↓ -4.21937 1.20E-065 ES725893 7d s ↓ -4.15444 1.27E-066 ES726019 7d s ↓ -4.02758 2.07E-077 ES729325 N s ↓ -3.70124 7.48E-078 ES727944 7d LEU-RICH REP.K-2 s ↓ -2.87982 2.40E-079 Contig 2398-1_ s ↓ -2.82164 3.09E-0710 Contig 76-1_ SOMA FERRITIN 76 ↓ -2.34468 6.22E-07
Lib = cDNA library; FC = Fold Change; ↑: Up-regulated; ↓: Down-regulated; s:Singlet.
Table 4: Upregulated genes specific to 3dpe
Gene ID BlastX p.value
Contig 739 2_ 9.00E-05Contig 66 1_ 0.00016Contig 5453-1_ 0.00021Contig 739 1_ 0.00031ES727789 0.00316Contig 4797-1_ 0.00334Contig 4797-1_ 0.00438Contig 3640-1_ 0.0058Contig 798 1_ 0.00669Contig 3158-1_ 0.00705Contig 3640-1_ 0.00784Contig 3171-5_ 0.00948ES725288 0.01487Contig 5652-1_ 60S RIBOSOMAL L27 0.0157ES727261 0.02239Contig 5537-1_ 0.02847Contig 2300-1_ 0.04107
Table 5: Upregulated genes specific to 7dpe
Gene ID BlastX p. alue
Contig 3895-1_ 9.00E-05
ES729486 1.00E-04
ES727178 0.00016
Contig 771-1_ 60S RIBOSOMAL PROTEIN L5 0.00032
ES726371 0.00044
Contig 5306-1_ APOLIPOPHORINS PREC. 6.00E-04
Contig 4810-1_ 0.00062
ES727405 0.00065
Contig 3525-1_ EPENDYMIN REL. PROT.2 0.00073
Contig 89-1_6981 0.00169
ES727912 BONE MORPHOGENETIC PROT.1 0.00204
Contig 89-1_ 0.00204
AY383544 EPENDYMIN REL. PROT. 1 0.00397
ES726186 0.00508
ES714731 0.00646
ES725228 0.00721
Contig 5342-1_ 0.00906
ES728886 0.01851
ES729552 FAT (Cadherin) 0.01851
ES726575 0.02755
ES716626 0.02822
ES881026 0.03701
ES727189 0.04123
Contig 2092-1_ 0.04342
Page 6 of 21(page number not for citation purposes)
BMC Genomics 2009, 10:262 http://www.biomedcentral.com/1471-2164/10/262
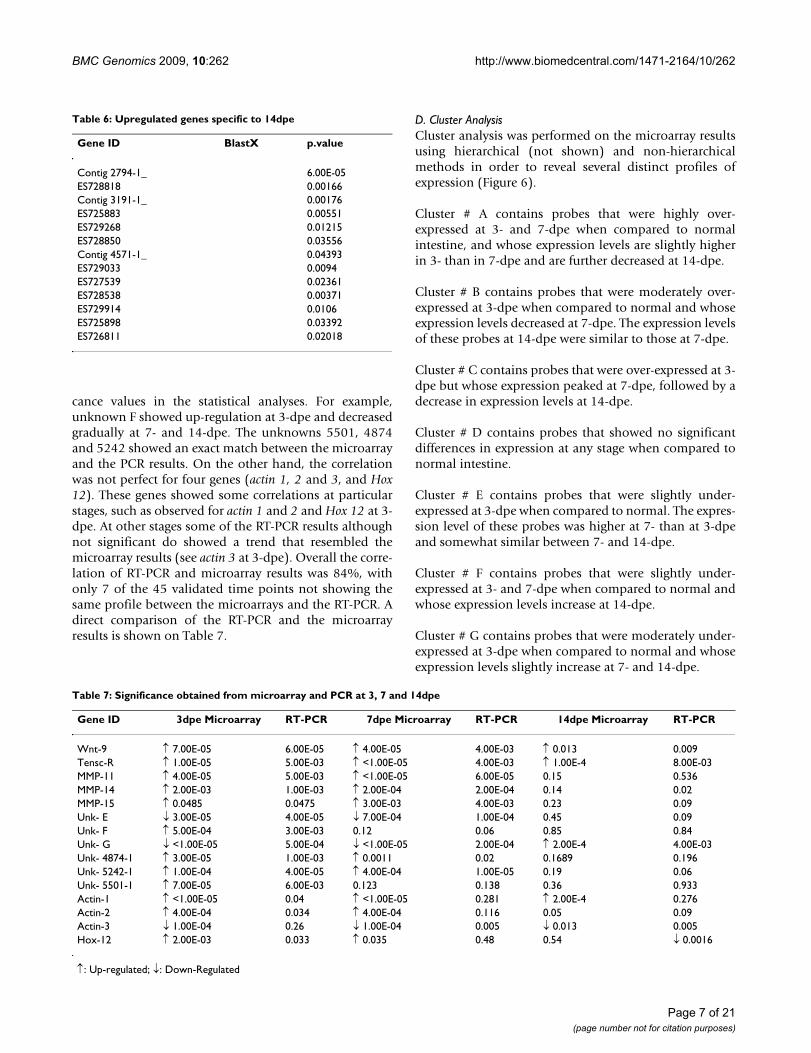
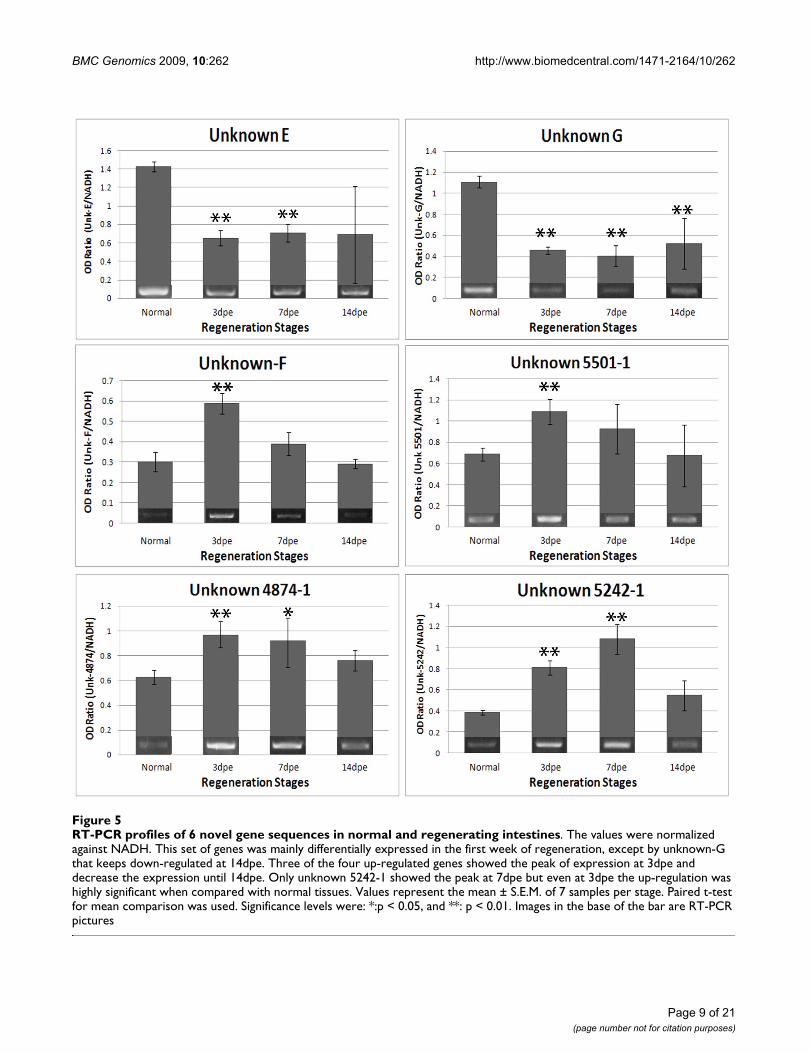
cance values in the statistical analyses. For example,unknown F showed up-regulation at 3-dpe and decreasedgradually at 7- and 14-dpe. The unknowns 5501, 4874and 5242 showed an exact match between the microarrayand the PCR results. On the other hand, the correlationwas not perfect for four genes (actin 1, 2 and 3, and Hox12). These genes showed some correlations at particularstages, such as observed for actin 1 and 2 and Hox 12 at 3-dpe. At other stages some of the RT-PCR results althoughnot significant do showed a trend that resembled themicroarray results (see actin 3 at 3-dpe). Overall the corre-lation of RT-PCR and microarray results was 84%, withonly 7 of the 45 validated time points not showing thesame profile between the microarrays and the RT-PCR. Adirect comparison of the RT-PCR and the microarrayresults is shown on Table 7.
D. Cluster AnalysisCluster analysis was performed on the microarray resultsusing hierarchical (not shown) and non-hierarchicalmethods in order to reveal several distinct profiles ofexpression (Figure 6).
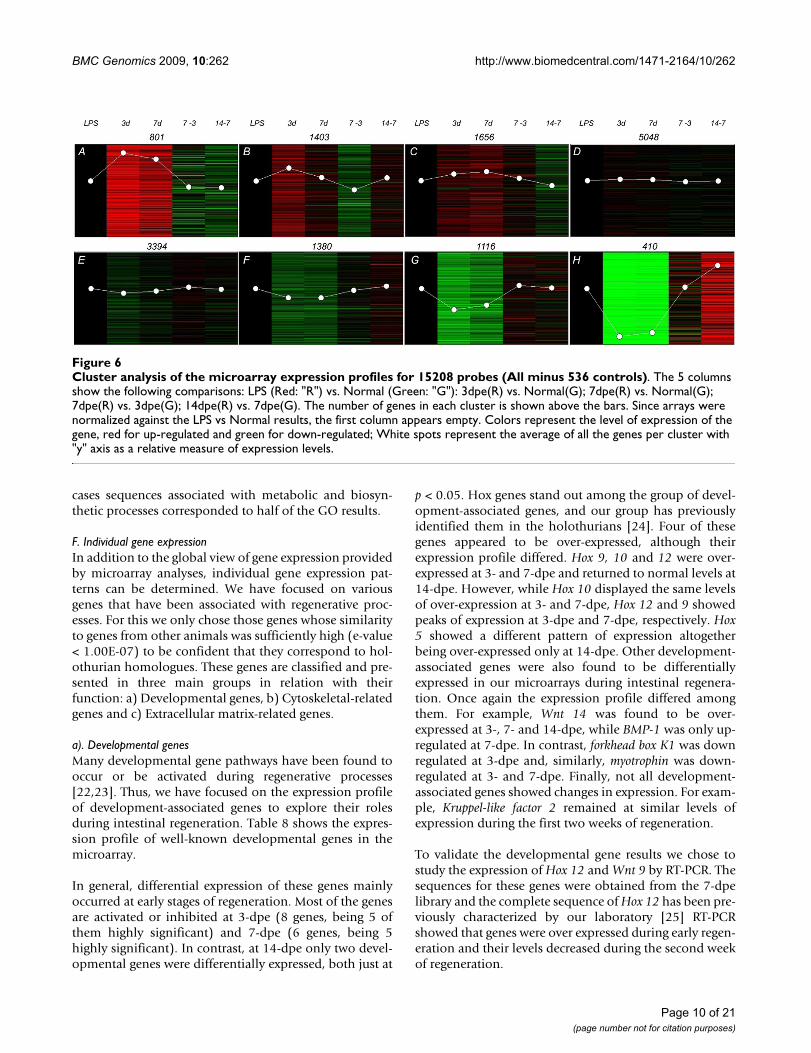
Cluster # A contains probes that were highly over-expressed at 3- and 7-dpe when compared to normalintestine, and whose expression levels are slightly higherin 3- than in 7-dpe and are further decreased at 14-dpe.
Cluster # B contains probes that were moderately over-expressed at 3-dpe when compared to normal and whoseexpression levels decreased at 7-dpe. The expression levelsof these probes at 14-dpe were similar to those at 7-dpe.
Cluster # C contains probes that were over-expressed at 3-dpe but whose expression peaked at 7-dpe, followed by adecrease in expression levels at 14-dpe.
Cluster # D contains probes that showed no significantdifferences in expression at any stage when compared tonormal intestine.
Cluster # E contains probes that were slightly under-expressed at 3-dpe when compared to normal. The expres-sion level of these probes was higher at 7- than at 3-dpeand somewhat similar between 7- and 14-dpe.
Cluster # F contains probes that were slightly under-expressed at 3- and 7-dpe when compared to normal andwhose expression levels increase at 14-dpe.
Cluster # G contains probes that were moderately under-expressed at 3-dpe when compared to normal and whoseexpression levels slightly increase at 7- and 14-dpe.
Table 6: Upregulated genes specific to 14dpe
Gene ID BlastX p.value
Contig 2794-1_ 6.00E-05ES728818 0.00166Contig 3191-1_ 0.00176ES725883 0.00551ES729268 0.01215ES728850 0.03556Contig 4571-1_ 0.04393ES729033 0.0094ES727539 0.02361ES728538 0.00371ES729914 0.0106ES725898 0.03392ES726811 0.02018
Table 7: Significance obtained from microarray and PCR at 3, 7 and 14dpe
Gene ID 3dpe Microarray RT-PCR 7dpe Microarray RT-PCR 14dpe Microarray RT-PCR
Wnt-9 ↑ 7.00E-05 6.00E-05 ↑ 4.00E-05 4.00E-03 ↑ 0.013 0.009Tensc-R ↑ 1.00E-05 5.00E-03 ↑ <1.00E-05 4.00E-03 ↑ 1.00E-4 8.00E-03MMP-11 ↑ 4.00E-05 5.00E-03 ↑ <1.00E-05 6.00E-05 0.15 0.536MMP-14 ↑ 2.00E-03 1.00E-03 ↑ 2.00E-04 2.00E-04 0.14 0.02MMP-15 ↑ 0.0485 0.0475 ↑ 3.00E-03 4.00E-03 0.23 0.09Unk- E ↓ 3.00E-05 4.00E-05 ↓ 7.00E-04 1.00E-04 0.45 0.09Unk- F ↑ 5.00E-04 3.00E-03 0.12 0.06 0.85 0.84Unk- G ↓ <1.00E-05 5.00E-04 ↓ <1.00E-05 2.00E-04 ↑ 2.00E-4 4.00E-03Unk- 4874-1 ↑ 3.00E-05 1.00E-03 ↑ 0.0011 0.02 0.1689 0.196Unk- 5242-1 ↑ 1.00E-04 4.00E-05 ↑ 4.00E-04 1.00E-05 0.19 0.06Unk- 5501-1 ↑ 7.00E-05 6.00E-03 0.123 0.138 0.36 0.933Actin-1 ↑ <1.00E-05 0.04 ↑ <1.00E-05 0.281 ↑ 2.00E-4 0.276Actin-2 ↑ 4.00E-04 0.034 ↑ 4.00E-04 0.116 0.05 0.09Actin-3 ↓ 1.00E-04 0.26 ↓ 1.00E-04 0.005 ↓ 0.013 0.005Hox-12 ↑ 2.00E-03 0.033 ↑ 0.035 0.48 0.54 ↓ 0.0016
↑: Up-regulated; ↓: Down-Regulated
Page 7 of 21(page number not for citation purposes)
BMC Genomics 2009, 10:262 http://www.biomedcentral.com/1471-2164/10/262
Cluster # H contains probes that were highly under-expressed at 3- and 7-dpe and whose expression levelsshowed a moderate increase at 14-dpe.
E. Functional category analysisWe submitted all sea cucumber sequences to BlastX andparsed the results using a threshold of significance e-value< 1.00E-05. Approximately 58.1% of the sequences(3651) were "unknowns" that showed no similarity tosubjects in the SwissProt database. On the other hand,41.9% of the sequences (2636) had similarity with data-base sequences. Of these, 169 showed similarity withhypothetical proteins, most of them from the sea urchin
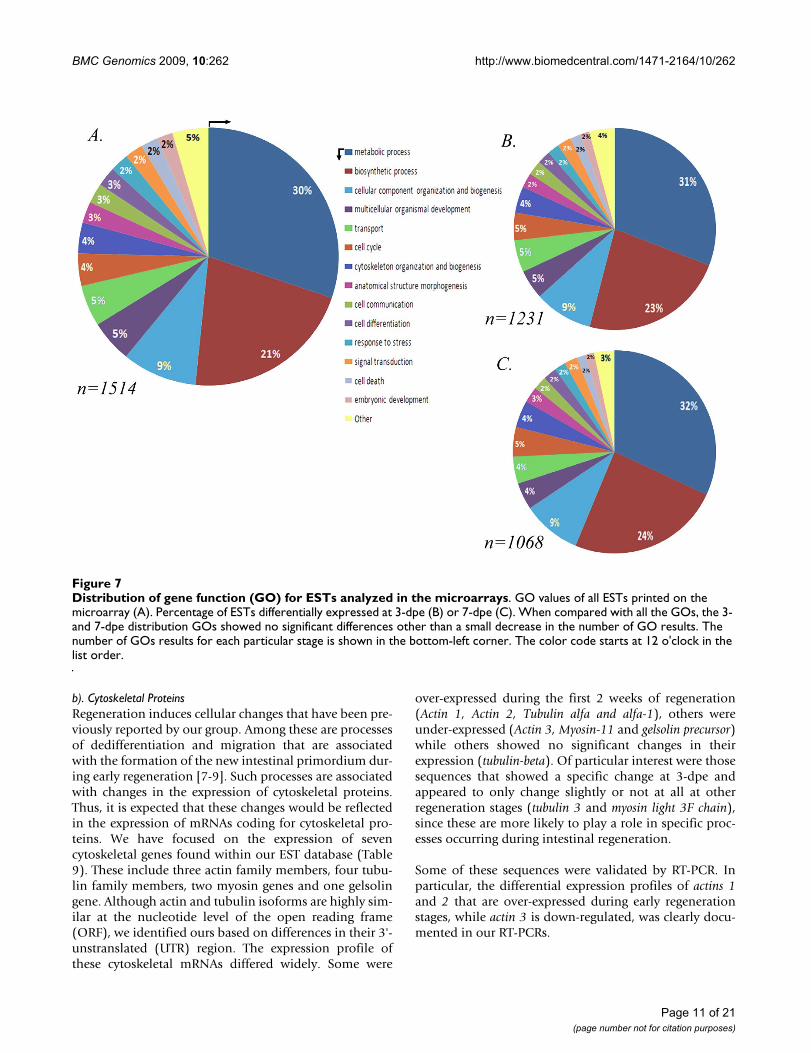
S. purpuratus. GO searches http://www.geneontology.orgwere performed with all the blast results and 1514 uniquesequences were found with at least one reported ontology(Figure 7A).
In order to determine if particular gene functions could beassociated exclusively with specific regeneration stages,diagrams were done with only those genes that showeddifferential expression between 3-, 7- or 14-dpe and nor-mal. At 3-dpe the GO search showed 1231 results while1068 were found for 7-dpe (Figure 7B and 7C). The distri-bution of the GO was highly similar between allsequences and regeneration stages. For example, in all
RT-PCR profiles of Wnt-9, Hox12, Tenascin-R, MMP-11, MMP-14, MMP-15, Actin 1, Actin 2 and Actin 3 in normal and regenerating intestinesFigure 4RT-PCR profiles of Wnt-9, Hox12, Tenascin-R, MMP-11, MMP-14, MMP-15, Actin 1, Actin 2 and Actin 3 in normal and regenerating intestines. The values were normalized against NADH. This set of genes showed up-regulation in the first week of regeneration except for Actin 3 that showed down-regulation during regeneration. Interestingly, all extracellular matrix (ECM) related genes showed the peak of expression at 7-dpe. Moreover, Wnt-9, a developmental gene, was up-regu-lated during all stages. Values represent the mean ± S.E.M. of 7 biological samples (individual animals) per stage. Paired t-test for mean comparison was used. Significance levels were *:p < 0.05, and **:p < 0.01. Images at the base of the bar are RT-PCR pic-tures.
Page 8 of 21(page number not for citation purposes)
BMC Genomics 2009, 10:262 http://www.biomedcentral.com/1471-2164/10/262
Page 9 of 21(page number not for citation purposes)
RT-PCR profiles of 6 novel gene sequences in normal and regenerating intestinesFigure 5RT-PCR profiles of 6 novel gene sequences in normal and regenerating intestines. The values were normalized against NADH. This set of genes was mainly differentially expressed in the first week of regeneration, except by unknown-G that keeps down-regulated at 14dpe. Three of the four up-regulated genes showed the peak of expression at 3dpe and decrease the expression until 14dpe. Only unknown 5242-1 showed the peak at 7dpe but even at 3dpe the up-regulation was highly significant when compared with normal tissues. Values represent the mean ± S.E.M. of 7 samples per stage. Paired t-test for mean comparison was used. Significance levels were: *:p < 0.05, and **: p < 0.01. Images in the base of the bar are RT-PCR pictures
BMC Genomics 2009, 10:262 http://www.biomedcentral.com/1471-2164/10/262
cases sequences associated with metabolic and biosyn-thetic processes corresponded to half of the GO results.
F. Individual gene expressionIn addition to the global view of gene expression providedby microarray analyses, individual gene expression pat-terns can be determined. We have focused on variousgenes that have been associated with regenerative proc-esses. For this we only chose those genes whose similarityto genes from other animals was sufficiently high (e-value< 1.00E-07) to be confident that they correspond to hol-othurian homologues. These genes are classified and pre-sented in three main groups in relation with theirfunction: a) Developmental genes, b) Cytoskeletal-relatedgenes and c) Extracellular matrix-related genes.
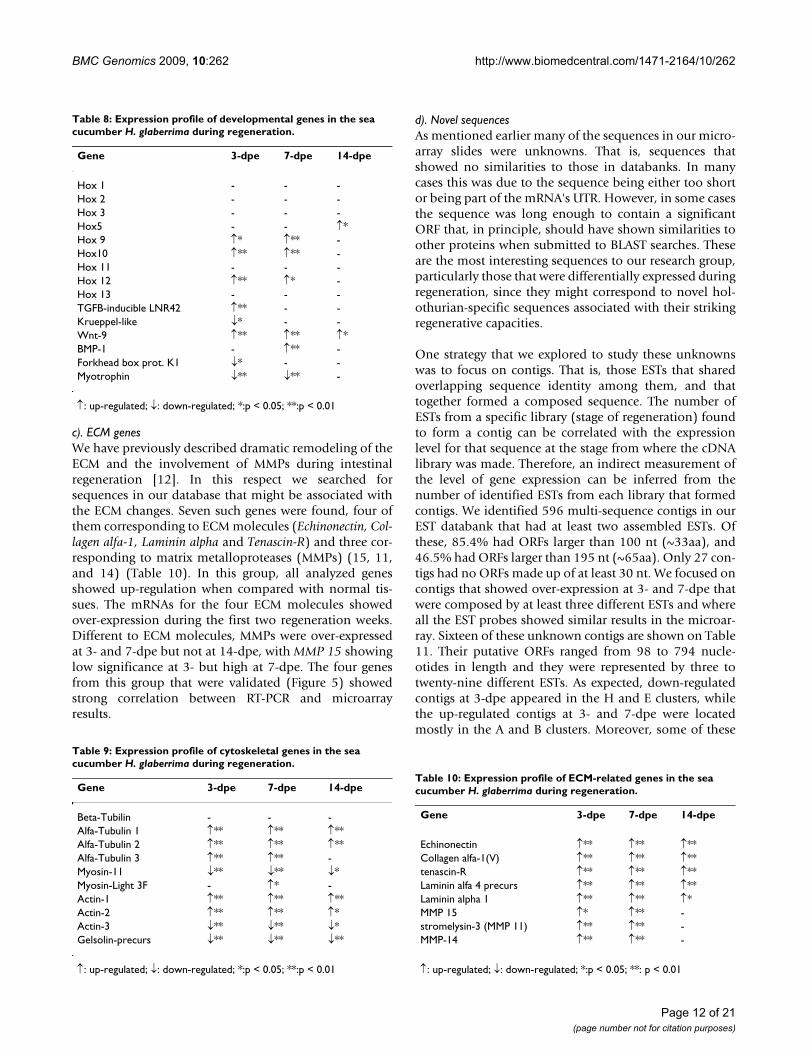
a). Developmental genesMany developmental gene pathways have been found tooccur or be activated during regenerative processes[22,23]. Thus, we have focused on the expression profileof development-associated genes to explore their rolesduring intestinal regeneration. Table 8 shows the expres-sion profile of well-known developmental genes in themicroarray.
In general, differential expression of these genes mainlyoccurred at early stages of regeneration. Most of the genesare activated or inhibited at 3-dpe (8 genes, being 5 ofthem highly significant) and 7-dpe (6 genes, being 5highly significant). In contrast, at 14-dpe only two devel-opmental genes were differentially expressed, both just at
p < 0.05. Hox genes stand out among the group of devel-opment-associated genes, and our group has previouslyidentified them in the holothurians [24]. Four of thesegenes appeared to be over-expressed, although theirexpression profile differed. Hox 9, 10 and 12 were over-expressed at 3- and 7-dpe and returned to normal levels at14-dpe. However, while Hox 10 displayed the same levelsof over-expression at 3- and 7-dpe, Hox 12 and 9 showedpeaks of expression at 3-dpe and 7-dpe, respectively. Hox5 showed a different pattern of expression altogetherbeing over-expressed only at 14-dpe. Other development-associated genes were also found to be differentiallyexpressed in our microarrays during intestinal regenera-tion. Once again the expression profile differed amongthem. For example, Wnt 14 was found to be over-expressed at 3-, 7- and 14-dpe, while BMP-1 was only up-regulated at 7-dpe. In contrast, forkhead box K1 was downregulated at 3-dpe and, similarly, myotrophin was down-regulated at 3- and 7-dpe. Finally, not all development-associated genes showed changes in expression. For exam-ple, Kruppel-like factor 2 remained at similar levels ofexpression during the first two weeks of regeneration.
To validate the developmental gene results we chose tostudy the expression of Hox 12 and Wnt 9 by RT-PCR. Thesequences for these genes were obtained from the 7-dpelibrary and the complete sequence of Hox 12 has been pre-viously characterized by our laboratory [25] RT-PCRshowed that genes were over expressed during early regen-eration and their levels decreased during the second weekof regeneration.
Cluster analysis of the microarray expression profiles for 15208 probes (All minus 536 controls)Figure 6Cluster analysis of the microarray expression profiles for 15208 probes (All minus 536 controls). The 5 columns show the following comparisons: LPS (Red: "R") vs. Normal (Green: "G"): 3dpe(R) vs. Normal(G); 7dpe(R) vs. Normal(G); 7dpe(R) vs. 3dpe(G); 14dpe(R) vs. 7dpe(G). The number of genes in each cluster is shown above the bars. Since arrays were normalized against the LPS vs Normal results, the first column appears empty. Colors represent the level of expression of the gene, red for up-regulated and green for down-regulated; White spots represent the average of all the genes per cluster with "y" axis as a relative measure of expression levels.
Page 10 of 21(page number not for citation purposes)
BMC Genomics 2009, 10:262 http://www.biomedcentral.com/1471-2164/10/262
b). Cytoskeletal ProteinsRegeneration induces cellular changes that have been pre-viously reported by our group. Among these are processesof dedifferentiation and migration that are associatedwith the formation of the new intestinal primordium dur-ing early regeneration [7-9]. Such processes are associatedwith changes in the expression of cytoskeletal proteins.Thus, it is expected that these changes would be reflectedin the expression of mRNAs coding for cytoskeletal pro-teins. We have focused on the expression of sevencytoskeletal genes found within our EST database (Table9). These include three actin family members, four tubu-lin family members, two myosin genes and one gelsolingene. Although actin and tubulin isoforms are highly sim-ilar at the nucleotide level of the open reading frame(ORF), we identified ours based on differences in their 3'-unstranslated (UTR) region. The expression profile ofthese cytoskeletal mRNAs differed widely. Some were
over-expressed during the first 2 weeks of regeneration(Actin 1, Actin 2, Tubulin alfa and alfa-1), others wereunder-expressed (Actin 3, Myosin-11 and gelsolin precursor)while others showed no significant changes in theirexpression (tubulin-beta). Of particular interest were thosesequences that showed a specific change at 3-dpe andappeared to only change slightly or not at all at otherregeneration stages (tubulin 3 and myosin light 3F chain),since these are more likely to play a role in specific proc-esses occurring during intestinal regeneration.
Some of these sequences were validated by RT-PCR. Inparticular, the differential expression profiles of actins 1and 2 that are over-expressed during early regenerationstages, while actin 3 is down-regulated, was clearly docu-mented in our RT-PCRs.
Distribution of gene function (GO) for ESTs analyzed in the microarraysFigure 7Distribution of gene function (GO) for ESTs analyzed in the microarrays. GO values of all ESTs printed on the microarray (A). Percentage of ESTs differentially expressed at 3-dpe (B) or 7-dpe (C). When compared with all the GOs, the 3- and 7-dpe distribution GOs showed no significant differences other than a small decrease in the number of GO results. The number of GOs results for each particular stage is shown in the bottom-left corner. The color code starts at 12 o'clock in the list order.
Page 11 of 21(page number not for citation purposes)
BMC Genomics 2009, 10:262 http://www.biomedcentral.com/1471-2164/10/262
c). ECM genesWe have previously described dramatic remodeling of theECM and the involvement of MMPs during intestinalregeneration [12]. In this respect we searched forsequences in our database that might be associated withthe ECM changes. Seven such genes were found, four ofthem corresponding to ECM molecules (Echinonectin, Col-lagen alfa-1, Laminin alpha and Tenascin-R) and three cor-responding to matrix metalloproteases (MMPs) (15, 11,and 14) (Table 10). In this group, all analyzed genesshowed up-regulation when compared with normal tis-sues. The mRNAs for the four ECM molecules showedover-expression during the first two regeneration weeks.Different to ECM molecules, MMPs were over-expressedat 3- and 7-dpe but not at 14-dpe, with MMP 15 showinglow significance at 3- but high at 7-dpe. The four genesfrom this group that were validated (Figure 5) showedstrong correlation between RT-PCR and microarrayresults.
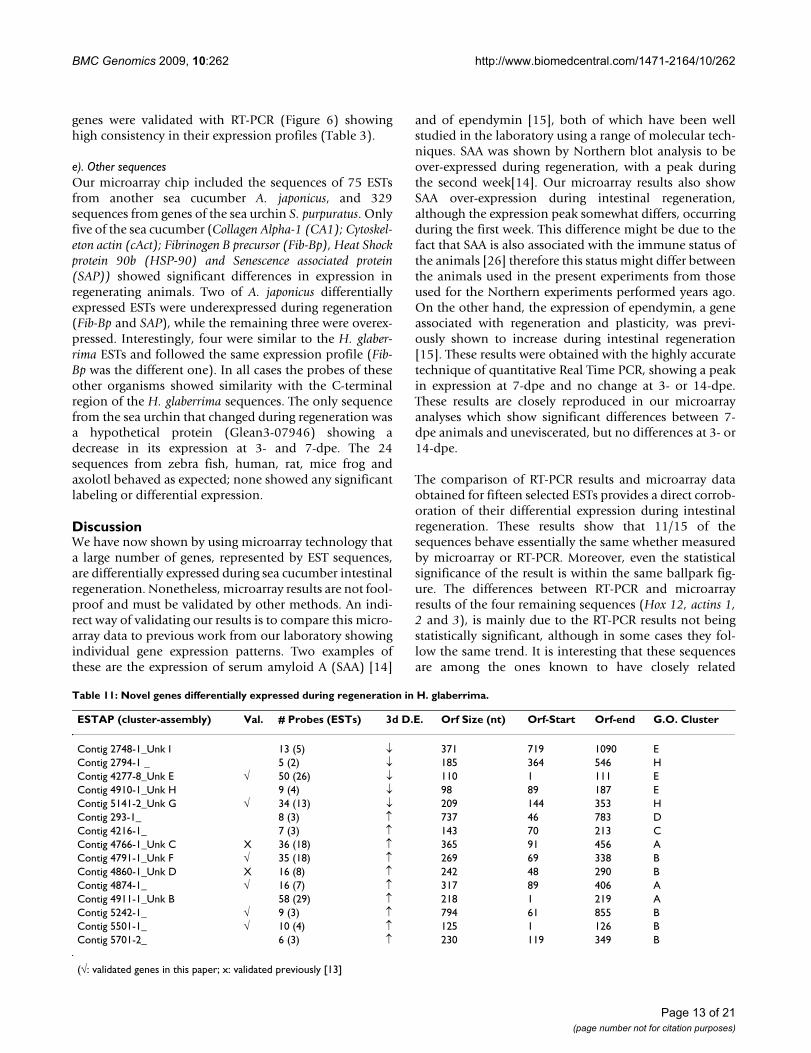
d). Novel sequencesAs mentioned earlier many of the sequences in our micro-array slides were unknowns. That is, sequences thatshowed no similarities to those in databanks. In manycases this was due to the sequence being either too shortor being part of the mRNA's UTR. However, in some casesthe sequence was long enough to contain a significantORF that, in principle, should have shown similarities toother proteins when submitted to BLAST searches. Theseare the most interesting sequences to our research group,particularly those that were differentially expressed duringregeneration, since they might correspond to novel hol-othurian-specific sequences associated with their strikingregenerative capacities.
One strategy that we explored to study these unknownswas to focus on contigs. That is, those ESTs that sharedoverlapping sequence identity among them, and thattogether formed a composed sequence. The number ofESTs from a specific library (stage of regeneration) foundto form a contig can be correlated with the expressionlevel for that sequence at the stage from where the cDNAlibrary was made. Therefore, an indirect measurement ofthe level of gene expression can be inferred from thenumber of identified ESTs from each library that formedcontigs. We identified 596 multi-sequence contigs in ourEST databank that had at least two assembled ESTs. Ofthese, 85.4% had ORFs larger than 100 nt (~33aa), and46.5% had ORFs larger than 195 nt (~65aa). Only 27 con-tigs had no ORFs made up of at least 30 nt. We focused oncontigs that showed over-expression at 3- and 7-dpe thatwere composed by at least three different ESTs and whereall the EST probes showed similar results in the microar-ray. Sixteen of these unknown contigs are shown on Table11. Their putative ORFs ranged from 98 to 794 nucle-otides in length and they were represented by three totwenty-nine different ESTs. As expected, down-regulatedcontigs at 3-dpe appeared in the H and E clusters, whilethe up-regulated contigs at 3- and 7-dpe were locatedmostly in the A and B clusters. Moreover, some of these
Table 8: Expression profile of developmental genes in the sea cucumber H. glaberrima during regeneration.
Gene 3-dpe 7-dpe 14-dpe
Hox 1 - - -Hox 2 - - -Hox 3 - - -Hox5 - - ↑*Hox 9 ↑* ↑** -Hox10 ↑** ↑** -Hox 11 - - -Hox 12 ↑** ↑* -Hox 13 - - -TGFB-inducible LNR42 ↑** - -Krueppel-like ↓* - -Wnt-9 ↑** ↑** ↑*BMP-1 - ↑** -Forkhead box prot. K1 ↓* - -Myotrophin ↓** ↓** -
↑: up-regulated; ↓: down-regulated; *:p < 0.05; **:p < 0.01
Table 9: Expression profile of cytoskeletal genes in the sea cucumber H. glaberrima during regeneration.
Gene 3-dpe 7-dpe 14-dpe
Beta-Tubilin - - -Alfa-Tubulin 1 ↑** ↑** ↑**Alfa-Tubulin 2 ↑** ↑** ↑**Alfa-Tubulin 3 ↑** ↑** -Myosin-11 ↓** ↓** ↓*Myosin-Light 3F - ↑* -Actin-1 ↑** ↑** ↑**Actin-2 ↑** ↑** ↑*Actin-3 ↓** ↓** ↓*Gelsolin-precurs ↓** ↓** ↓**
↑: up-regulated; ↓: down-regulated; *:p < 0.05; **:p < 0.01
Table 10: Expression profile of ECM-related genes in the sea cucumber H. glaberrima during regeneration.
Gene 3-dpe 7-dpe 14-dpe
Echinonectin ↑** ↑** ↑**Collagen alfa-1(V) ↑** ↑** ↑**tenascin-R ↑** ↑** ↑**Laminin alfa 4 precurs ↑** ↑** ↑**Laminin alpha 1 ↑** ↑** ↑*MMP 15 ↑* ↑** -stromelysin-3 (MMP 11) ↑** ↑** -MMP-14 ↑** ↑** -
↑: up-regulated; ↓: down-regulated; *:p < 0.05; **: p < 0.01
Page 12 of 21(page number not for citation purposes)
BMC Genomics 2009, 10:262 http://www.biomedcentral.com/1471-2164/10/262
genes were validated with RT-PCR (Figure 6) showinghigh consistency in their expression profiles (Table 3).
e). Other sequencesOur microarray chip included the sequences of 75 ESTsfrom another sea cucumber A. japonicus, and 329sequences from genes of the sea urchin S. purpuratus. Onlyfive of the sea cucumber (Collagen Alpha-1 (CA1); Cytoskel-eton actin (cAct); Fibrinogen B precursor (Fib-Bp), Heat Shockprotein 90b (HSP-90) and Senescence associated protein(SAP)) showed significant differences in expression inregenerating animals. Two of A. japonicus differentiallyexpressed ESTs were underexpressed during regeneration(Fib-Bp and SAP), while the remaining three were overex-pressed. Interestingly, four were similar to the H. glaber-rima ESTs and followed the same expression profile (Fib-Bp was the different one). In all cases the probes of theseother organisms showed similarity with the C-terminalregion of the H. glaberrima sequences. The only sequencefrom the sea urchin that changed during regeneration wasa hypothetical protein (Glean3-07946) showing adecrease in its expression at 3- and 7-dpe. The 24sequences from zebra fish, human, rat, mice frog andaxolotl behaved as expected; none showed any significantlabeling or differential expression.
DiscussionWe have now shown by using microarray technology thata large number of genes, represented by EST sequences,are differentially expressed during sea cucumber intestinalregeneration. Nonetheless, microarray results are not fool-proof and must be validated by other methods. An indi-rect way of validating our results is to compare this micro-array data to previous work from our laboratory showingindividual gene expression patterns. Two examples ofthese are the expression of serum amyloid A (SAA) [14]
and of ependymin [15], both of which have been wellstudied in the laboratory using a range of molecular tech-niques. SAA was shown by Northern blot analysis to beover-expressed during regeneration, with a peak duringthe second week[14]. Our microarray results also showSAA over-expression during intestinal regeneration,although the expression peak somewhat differs, occurringduring the first week. This difference might be due to thefact that SAA is also associated with the immune status ofthe animals [26] therefore this status might differ betweenthe animals used in the present experiments from thoseused for the Northern experiments performed years ago.On the other hand, the expression of ependymin, a geneassociated with regeneration and plasticity, was previ-ously shown to increase during intestinal regeneration[15]. These results were obtained with the highly accuratetechnique of quantitative Real Time PCR, showing a peakin expression at 7-dpe and no change at 3- or 14-dpe.These results are closely reproduced in our microarrayanalyses which show significant differences between 7-dpe animals and uneviscerated, but no differences at 3- or14-dpe.
The comparison of RT-PCR results and microarray dataobtained for fifteen selected ESTs provides a direct corrob-oration of their differential expression during intestinalregeneration. These results show that 11/15 of thesequences behave essentially the same whether measuredby microarray or RT-PCR. Moreover, even the statisticalsignificance of the result is within the same ballpark fig-ure. The differences between RT-PCR and microarrayresults of the four remaining sequences (Hox 12, actins 1,2 and 3), is mainly due to the RT-PCR results not beingstatistically significant, although in some cases they fol-low the same trend. It is interesting that these sequencesare among the ones known to have closely related
Table 11: Novel genes differentially expressed during regeneration in H. glaberrima.
ESTAP (cluster-assembly) Val. # Probes (ESTs) 3d D.E. Orf Size (nt) Orf-Start Orf-end G.O. Cluster
Contig 2748-1_Unk I 13 (5) ↓ 371 719 1090 EContig 2794-1 _ 5 (2) ↓ 185 364 546 HContig 4277-8_Unk E √ 50 (26) ↓ 110 1 111 EContig 4910-1_Unk H 9 (4) ↓ 98 89 187 EContig 5141-2_Unk G √ 34 (13) ↓ 209 144 353 HContig 293-1_ 8 (3) ↑ 737 46 783 DContig 4216-1_ 7 (3) ↑ 143 70 213 CContig 4766-1_Unk C X 36 (18) ↑ 365 91 456 AContig 4791-1_Unk F √ 35 (18) ↑ 269 69 338 BContig 4860-1_Unk D X 16 (8) ↑ 242 48 290 BContig 4874-1_ √ 16 (7) ↑ 317 89 406 AContig 4911-1_Unk B 58 (29) ↑ 218 1 219 AContig 5242-1_ √ 9 (3) ↑ 794 61 855 BContig 5501-1_ √ 10 (4) ↑ 125 1 126 BContig 5701-2_ 6 (3) ↑ 230 119 349 B
(√: validated genes in this paper; x: validated previously [13]
Page 13 of 21(page number not for citation purposes)
BMC Genomics 2009, 10:262 http://www.biomedcentral.com/1471-2164/10/262
sequences in the genome (multiple actin genes and Hoxgenes), thus suggesting that the lack of correlation at somestages might be due to primers hybridizing with othersequences and increasing the background noise, makingthe RT-PCR results less sensitive than the microarray.
• Why do so many genes show differential expression?One of the most striking results from our microarrayexperiments, is that a high percentage of the spotted ESTswere found to be differentially expressed. Even when con-sidering a very high level of significance (p < 0.001) morethan a third of the ESTs showed differential expression.This contrasts with other regeneration studies where asmaller number of genes were found. For example, instudies of zebrafish heart regeneration, only about 5% ofthe assayed genes were found to be differentially regulated[27] and between 8 and 14% in studies of liver regenera-tion in rodents [28,29].
The reasons for these differences might be due to two fac-tors. First, most of our ESTs were obtained from cDNAlibraries of regenerating intestine, thus the original poolof ESTs is probably biased toward those genes that arehighly expressed in regenerating tissues. This was con-firmed by the results themselves: the set of probes differ-entially expressed at 3dpe and 7dpe were 81.25% fromthe 3- and 7-dpe libraries and only 18.75% from the Nor-mal library. In contrast, 42% of the down-regulatedsequences come from the Normal library. Second, theprocess of intestinal regeneration that we are studying iscomplex and involves organogenesis, not merely woundhealing. Furthermore, the intestine is an organ with mul-tiple cell types and embryological origins. The intestinehas components of the three embryonic germ layers, theenteric nervous system being an ectodermal derivative,the luminal epithelium an endodermal derivative and themuscular layer and submucosa being mesodermal deriva-tives. Therefore, when compared to a process such as heartor liver regeneration, where fewer cell types or more lim-ited regeneration is involved, a larger number of genesmight be necessary to be modulated to achieve the forma-tion of the new intestine. Moreover, in the study of zebrafish heart, regeneration was limited to the ventricle andonly to a portion of the organ since only 20% of the ven-tricle was removed. This contrasts largely from our studiesin the sea cucumber where the new intestine must be com-pletely formed from the remaining mesentery. In fact, alarge number of differentially expressed genes was alsofound in another organism with high regenerative poten-tial, the salamander Ambyostoma mexicanum. In this spe-cies when the tail, including the spinal cord segment isamputated, 76% of the genes in the microarray were dif-ferentially expressed [30]. It is interesting that they alsofound that even when increasing the stringency of the sta-tistical analyses the number of differentially expressed
genes (35%) was still significant. Thus, regeneration indeuterostomes imply the upregulation and downregula-tion of a large number of genes, making the search for"master regeneration genes", much more difficult thananticipated.
In view of this difficulty, we have developed certain strat-egies aimed at singling out those genes that might playimportant or crucial roles in regeneration. First, is to focuson genes that are differentially expressed at the 3-dpestage. Previous experiments from our laboratory haveshown that the cellular processes associated with intesti-nal regeneration occur early in intestinal regeneration. By7-dpe, the blastema-like structure that will be the primor-dium for the new intestine is already formed [6]. Thus,genes associated with initiating regeneration must be reg-ulated earlier than at 7-dpe. In this respect, some of themost likely candidates will be those genes that are differ-entially expressed between the 3- and 7-dpe stages. Sec-ond, focus on those genes that are most highlydifferentially expressed, such as those that were identifiedon our Top ten analyses. Third, look at sequences thatform contigs. Although the presence of multiple contigsmight be explained by several factors (some of them tech-nique-related), they could be reflecting the abundance ofgene expression in the original cDNA libraries, and there-fore at the stage from where the library was made. Fourth,is to aim at those genes that have been previously associ-ated with organogenesis in other species (see the follow-ing section). Finally, we expect that novel genes associatedwith regeneration will be characterized from our data.Thus, those sequences, and in particular those contigs thatshow ORFs with no similarity to sequences in databasesare the strongest candidates to be pursued.
• How do microarray results correlate with organogenesis processes that occur during embryonic development?Developmental GenesThe finding of genes associated with embryonic develop-ment being differentially expressed during regeneration isnot surprising since developmental gene pathways havebeen found to occur or be activated during regenerativeprocesses [22,23]. Thus, these genes and signaling path-ways provide excellent targets to study the molecularevents of intestinal regeneration.
One of the most studied groups of genes is the Hox genes,which encode transcription factors that specify the bodyaxis during embryonic development. Hox genes havebeen implicated in various regeneration processes, includ-ing the regeneration of amphibian tails and limbs [31-33], hydra [34], rat liver [35], and zebrafish tail [36]among others. This expression can be spatially or tempo-rally specific in regenerating tissues [37,38]. It is particu-larly interesting that Hox12 had previously been found in
Page 14 of 21(page number not for citation purposes)
BMC Genomics 2009, 10:262 http://www.biomedcentral.com/1471-2164/10/262
our regenerating intestine cDNA library and that there issome evidence for homeobox gene involvement in echin-oderm regeneration [20]. The finding that the most poste-rior genes (Hox 9, 10 and 12) are the ones that showed anincrease in expression during intestinal regeneration coin-cides with findings in the mammalian digestive tractwhere Hox genes are known to be expressed in a rostral-caudal gradient, and the Hox genes near the 5' end areexpressed in the posterior digestive tract, i.e. intestine[39]. These are the same genes that when mutated causedefects in the development of the posterior digestive tract[40,41].
Similarly, the finding that a Wnt homologue (Wnt-9) wasoverexpressed in the regenerating intestine during the firsttwo weeks of regeneration coincides with published dataon this molecular family. Wnt molecules are extracellularmolecules that bind to their receptors and activate a sign-aling pathway that includes other known proteins, such asB-catenin. In recent years, Wnt pathways have beenincreasingly associated with regenerative phenomena.Wnt was found to be involved in blastema formation ofthe regenerating limbs of anuran tadpoles [42] and in lensregeneration in newts [43]. In mammals, Wnt has beenstudied in bone [44], hair follicle [45] and deer antlerregeneration [46] among others. Liver regeneration wasretarded in the absence of beta-catenin [47]. Wnt appar-ently plays a key role in the control of intestinal stem cellproliferation and differentiation [48]. Thus, it will be ofgreat interest when the holothurian Wnt-9 expression islocalized to determine which intestinal cell types areexpressing this protein. Wnt pathways have also beeninvolved in other invertebrate regeneration models. Inplanaria, Wnt is necessary for proper brain pattern forma-tion [49] and B-catenin for antero-posterior axis forma-tion during regeneration [50].
Lastly, the family of bone morphogenetic proteins (BMPs)has been increasingly associated with regenerative phe-nomena. In newts, BMPs have been associated with thepotential of the ventral iris to regenerate a new lens [51].And in zebrafish, at least three members of the BMP fam-ily have been associated with fin regeneration [52]. Inhi-bition of BMP activity using the BMP antagonist, noggin,caused a reduction in blastema cell proliferation and areduction in bone matrix deposition. Similarly, in experi-ments using transgenic Xenopus tadpole with increasenoggin expression, both tail and limb regeneration wereinhibited [53]. Finally, BMP has been shown to be essen-tial for the correct establishment of the dorso-ventral axisduring planarian regeneration [54,55]. BMPs have alsobeen associated with normal gastrointestinal tract devel-opment in vertebrates, and alterations in their expressioncaused morphological abnormalities in the intestinal tis-sues ([56,57]). BMP have also been shown to be required
for proper cloaca formation [58]. Therefore, the overex-pression of BMP during intestinal regeneration observedin our system is consistent with its role in the proper for-mation of the digestive tract organs.
• How do microarray results correlate with cellular processes that occur during intestinal regeneration?In order to understand how changes in gene expressionare associated with changes at the tissue and organ levelsit is important to have a clear understanding of the cellu-lar events that underlie the regenerative process. For thisreason, our laboratory has described the intestinal regen-eration process in H. glaberrima from the cellular perspec-tive [6-12]. Two events in particular are to be highlightedin view of their possible association with the differentialgene expression profile, one is the change in cytoskeletalproteins and the second the remodeling of the extracellu-lar matrix.
Cytoskeletal ProteinsPrevious studies from our laboratory have shown dra-matic changes in the cytoskeleton of cells in the regenerat-ing intestine. Many of these changes were associated withde-differentiation of the mesenterial muscle during theinitial regeneration stages and with the processes of myo-genesis, innervation and luminal epithelial formation inlater regenerative stages [6,8,10,11]. In fact, during theregenerative process muscle cells actively extrude theircontractile apparatus as spindle-like structures (SLSs) [8].This has also been shown in other echinoderm regenera-tive phenomena [1,59]. We can speculate that the under-expression of some actin and myosin isoforms is associ-ated with this dedifferentiation process. Similarly, theover expression of some actin isoforms could be associ-ated with the migration of cells into the regenerating tis-sue [7,9], or with the eventual differentiation of cells fromcommitted precursors [11]. Nonetheless, these hypothe-ses will need to be verified in future experiments using insitu hybridization and immunochemical analyses.
One of the most interesting findings is the under expres-sion of gelsolin in early regenerative stages. Results byCowin and colleagues [60] have shown that gelsolinmRNA was upregulated and gelsolin protein was associ-ated with actin filaments in the fetal skin of embryonicday 19 rats, but not at embryonic day 17. This is the agegap when fetal wounds properties change from being scar-free to scar-forming. In culture, skin from 17 day embry-onic rats can epithelialize an excisional wound in culture,but this ability is lost by embryonic day 19. Thus, our find-ing of a correlation between gelsolin gene under-expres-sion and early intestinal regeneration suggests thatgelsolin might play an important inhibitory role in theprocess of wound healing and regeneration.
Page 15 of 21(page number not for citation purposes)
BMC Genomics 2009, 10:262 http://www.biomedcentral.com/1471-2164/10/262
ECMOne of the events that is common to most regenerativeprocesses is the remodeling of the extracellular matrix.These changes, which have been well studied particularlyduring epithelial wound healing, involve the replacementof the ECM by a transient ECM that facilitates the cellularevents associated with the regenerative response [61]. Inthe holothurian intestinal system we have previouslyshown a dramatic extracellular remodeling during theearly stages of regeneration [12]. During this time colla-gen and laminin immunoreactivities disappear from themesentery that gives rise to the new organ. Similarly thereis a rise in the activity of MMPs that coincides with themajor changes in the ECM. Moreover, we showed thatinhibition of MMPs at this time point causes an inhibitionof the regeneration process [12]. At the microscopic level,the changes of ECM and MMP activity coincide with anincrease presence of phagocytic amoebocytes in the regen-erating areas [8]. Therefore, the differential expression ofvarious molecules associated with ECM remodeling, par-ticularly the MMPs provide specific targets to define theirrole in the regeneration process.
• How do our results serve to advance the regeneration field?The cellular and molecular processes of organ regenera-tion have received increasing attention in recent years [5].In fact, the question of what controls organ regenera-tion? has been highlighted as one of the top scientificissues that deserves to be studied with high priority [62].However, organ regeneration remains one of the leastunderstood biological processes, particularly at themolecular level. Progress toward characterizing the molec-ular basis of regenerative processes has been modest for atleast three reasons [63,64]. First, the regenerative capacityof most vertebrate animals is relatively limited [3], so pop-ular biomedical models are not very useful. For example,some mammalian tissues (e.g., intestinal epithelia) andorgans (e.g., skin and liver) can readily regenerate, butothers, like heart and nervous tissues, have little or noregenerative capacity. Second, although development is aprocess closely akin to regeneration, most animals usedextensively to study the molecular aspects of development(worms, fruitflies, zebrafish, chickens and mice) lackrobust regenerative capacities. Third, those animals withremarkable regenerative capacities, such as coelenterates,flatworms, tunicates, newts and echinoderms have beenlittle studied at the molecular/genetic level [1,20,65].
This has started to change and ongoing projects promise abright future for the identification of regeneration-associ-ated genes. Among the studies/models that need to behighlighted in terms of EST/genomic are those in amphib-ians [30,66,67], zebrafish [27,68,69], ascidians [70,71]planaria [4,55,72-77] and Hydra [78-81]. However, the
only echinoderm studies are those of the sea urchingenome [82], which ironically is the echinoderm groupwith the least regenerative capacities [83].
Analyses of regeneration-associated genes in multiplemodels will lead to important comparative studies amongspecies with highly developed regenerative capacities orbetween closely related species where good and poorregenerators are found. The importance of comparativestudies using a large range of animal models was high-lighted by Sanchez Alvarado and Tsonis [4] who describedthe differences and similarities in the regeneration mech-anisms among diverse animal species. Other investigatorspointed out that the echinoderms were largely excludedfrom this analysis [84], a fact explained by one of theauthors [21] as being due to the lack of modern moleculartools to study the regeneration phenomena. Nonetheless,all investigators agreed that the application of genome-wide profiling approaches (as well as other tools) to theechinoderms would provide significant contributions tothe understanding of regeneration. Thus, the presentresults represent an important step toward the molecularstudy of the amazing regenerative capacities of echino-derms and more specifically toward their use to betterunderstand how organs can be regenerated.
ConclusionDespite the apparent simplicity of the echinoderms, herewe show that the organ regeneration is a complex processthat involves the up-regulation and down-regulation ofthousands of genes. Consistent with previous findings,these genes have been reported as involved in regenera-tion, development, ECM rearrangement, cytoskeletonreorganization and wound healing such as Wnt-9, BMP-1,Hox12, Tubulin, Tens-R, MMPs and gelsolin respectively.Moreover, a large number of unknown genes were alsofound to be differentially expressed at different stages ofregeneration and might represent novel genes. Finally,here we show that intestine regeneration in the seacucumber is a novel and important model for studies toidentify and characterize the molecular basis of regenera-tive processes.
MethodsMicrochip preparationWe have used the Agilent platform to design, perform andanalyze custom-made H. glaberrima arrays. For this weused the "eArray" server from Agilent to design 60-merprobes that were synthesized on the microarray. A designwith 15744 spots on each array and 8 arrays per slide wasselected. All sequences from the cDNA libraries of normaland regenerating intestines were represented at least twice.Thus, 14352 (91.2%) probes were from 6287 cleansequences from H. glaberrima. We also spotted othersequences. These sequences represented genes associated
Page 16 of 21(page number not for citation purposes)
BMC Genomics 2009, 10:262 http://www.biomedcentral.com/1471-2164/10/262
to development, regeneration, proliferation, wound heal-ing and growth. This pool included 150 probes from thesea cucumber Apostichopus japonicus (reported by Zheng etal. 2006), 8 from other holothurians that could be foundin the NCBI database and 658 from the sea urchin S. pur-putatus (whose genome was recently sequenced [82]).Finally, 40 probes were from vertebrate organisms includ-ing mice, zebrafish and axolotl. Technical controls were536 (3.4%).
Animals and treatmentsAdult sea cucumbers (10~12 cm long) were collectedfrom the north-eastern rocky shores of Puerto Rico. Ani-mals were eviscerated at day 0, by intra-coelomic injectionof 0.35 M KCl. They were left undisturbed in the aquariato allow regeneration for 3, 7 and 14 days. At each time-point, animals were anesthetized by immersion in ice-cold sea water for 45 min. A dorsal incision was made tocompletely expose the internal cavity and allow the dis-section of the intestinal primordium (3-, 7- or 14-dpe).After dissection, the regenerating intestines were placed inRNAlater® (Applied biosystems/Ambion, Austin TX) solu-tion for RNA extraction. Uneviscerated (normal) animalswere used as controls. One group was injected once with1 mg lipopolysaccharides (LPS) diluted in 0.5 mL filteredsea water as reported by [85]. Intestines of the LPS treatedanimals were dissected 48 hrs after injection.
RNA ExtractionRNA was extracted using a combination of the [86]method using Tri-reagent® (N.93289, Sigma, St Louis,MO) and the RNAeasy mini kit from Quiagen (Valencia,CA) The concentration and integrity of RNA were deter-mined using the NanoDrop-1000 Spectrophotometer(NanoDrop Technologies, Rockland, DE) and the 2100Bioanalyzer (Agilent) with an RNA 6000 Nano LabChip®
Kit at the Functional Genomics Research center (FGRc -UPR, Puerto Rico).
Synthesis and labeling of cRNARNA samples were amplified and labeled using the LowInput Fluorescent Linear Amplification kit (Agilent).Briefly, cDNA was first synthesized combining 300 ng ofRNA with T7 promoter primers, 5× First Strand Buffer, 0.1M DTT, 10 mM dNTP mix, MMLV RT and RNaseOUT.This reaction mix was incubated at 40°C for 2 h. Then,cRNA synthesis and dye incorporation were performed asfollows: cDNA of the first reaction was combined withcyanine-3-CTP (Cy3, 10 mM) or cyanine 5-CTP (Cy5,10mM) and the Transcription Master Mix (4× transcriptionbuffer, 0.1 M DTT, NTP mix, 50% PEG, RNAseOUT, inor-ganic pyrophosphase and T7 RNA polymerase) at 40°Cfor 2 h. The fluorescently labeled cRNA products werepurified using RNeasy mini spin columns (QIAGEN),subsequently analyzed for yield and dye incorporation
using the NanoDrop, and finally stored at -80°C untilneeded. Only samples that presented a concentration ofmore than 8 pmol/mg (measurement representing effi-ciency of dye incorporation) were used for hybridizationas recommended by the manufacturer.
Hybridization & ScanningCy3 and Cy5-labeled cRNAs were combined, fragmented,and hybridized to an 8 × 15K 60-mer oligo microarray(Agilent) for 17.5 h at 60°C with continuing rotation at 4rpm. After hybridization, slide arrays were subjected totwo successive washes (wash solution 1: 6× SSPE, 0.005%N-Lauroylsarcosine, and wash solution 2: 0.06× SSPE,0.005% N-Lauroylsarcosine) and dried with the Stabiliza-tion and Drying Solution (Agilent). Arrays were immedi-ately scanned in a G250B Microarray Scanner (Agilent) toobtain fluorescence intensities and Cy5/Cy3 ratios foreach gene on the array (see below). Scanning parameterswere used as recommended by the manufacturer. The res-olution settings for scanning were 5 μm using minimum(10%) and maximum (100%) Photo Multiplier Tubedetection sensitivities.
Microarray Experimental DesignThe experimental design consisted of comparisonsbetween Normal (non-eviscerated) intestinal tissues and3-, 7-, and 14-dpe regenerating intestines. To determinedifferences in gene expression between regenerating stageswe also compared directly 3- vs. 7-dpe and 7- vs. 14-dpe(Figure 8). Comparisons were also made between theintestinal tissues of normal and immune activated ani-mals (injected LPS). There were only 48 genes differen-tially expressed between normal and LPS-immuneactivated intestines and these genes will be discussed else-where. (F. Ramirez-Gomez et al. in prep.) These geneswere subtracted from the regeneration profile to ensurethat genes associated with the regeneration phenomenonwere not differentially expressed due any possibleimmune activation (e.g., because of bacterial invasionduring the evisceration process).
Technically, for each comparison, the microarray experi-ment was done twice, one using different biological sam-ples, each consisting of a sample pool from 3 animals. Ofthe two biological replicates one was always performed asa dye-swap in order to correct any dye bias.
Microarray data analysisMicroarray data was extracted with Agilent's FeatureExtraction software (version 5.1) and analyzed using theLimma package of Bioconductor. The data discussed inthis publication have been deposited in NCBI's GeneExpression Omnibus [87] and are accessible through GEOSeries accession number GSE16182 http://www.ncbi.nlm.nih.gov/geo/query/
Page 17 of 21(page number not for citation purposes)
BMC Genomics 2009, 10:262 http://www.biomedcentral.com/1471-2164/10/262
acc.cgi?acc=GSE16182. The analysis of the microarraydata consisted of the following steps: 1) within-array andbetween-array normalizations; 2) fitting the data to a lin-ear model; and 3) computing differential gene expression.For normalization purposes [88] MA-plots were generatedrepresenting the (R, G) data (R = red for Cy5 and G = greenfor Cy3), in which the log ratio of R versus G (M value =log2 R/G) was plotted against the overall intensity of eachspot (A value = log2 (R + G)/2. Within-array normaliza-tion was first applied and M-values were normalizedwithin each array using the Global Loess Normalizationmethod. Aquantile normalization was then applied to theA-values as a method for between-array normalization, toassure that the intensities and log-ratios had similar distri-butions across arrays. To estimate the average M-value foreach gene and assess differential gene expression, a simplelinear model was fit to the data, and M-value averages andstandard deviations for each gene were obtained. To findgenes with significant expression changes betweengroups, empirical Bayes statistics were applied to the databy moderating the standard errors of the estimated M-val-ues. P-values were obtained from the moderated t-statisticand corrected for multiple testing with the [89] method.The null hypothesis, that there is no differential expres-sion of genes between regeneration stages compared withnormal tissues, was rejected for p-values lower than 0.05.Thus, the change in expression is given by the fold changewhile the believability of the change is given by the odds.Alternative to this method, the GenePix Pro 6.0.1.26 andAcuity 4.0.0.60 software (from Molecular Devices, Sunny-vale CA) was also used to analyze gene expression values(log ratios) and perform clustering analyses. Methodsused to visualize the expression profiles included hierar-
chical [90] and non-hierarchical clustering such as Self-Organizing Maps (SOM, [91]).
Gene expression analysisThe differential expression of the genes of interest wassemi-quantitatively determined by gene-specific relativeRT-PCR. Primers were designed for optimal performanceusing the Primer3 and Net primer web-servers [see addi-tional file 4 for the list of primer sequences]. All primerswere synthesized by AlphaDNA (Montreal, Canada).PCRs were performed in the Mastercycler ep (Eppendorf,Westbury, NY) using the Promega's Taq-Polimerase kit(Madison, USA). Cycling conditions for the amplifiedproducts were as follow: 94°C × 1 min, 55°C (± 3°C) × 1min, 72°C × 1 min; all performed for 35~40 cycles. Opti-cal densities of the PCR products were measured usingPhotoshop (Adobe). Values were extracted for back-ground and then normalized against NADH-dehydroge-nase unit 5 (NADH, 241 bp). Each stage of regenerationwas analyzed with at least an N = 7, each sample repre-sented the intestine of one individual. Statistical test ofmean comparison was carried in R http://cran.r-project.org under the null hypothesis that there is no dif-ferential expression between different stages of regenera-tion and normal tissues. Significance of the paired t-testwas assumed at p < 0.05.
List of abbreviationscDNA: complementary DNA; EST: Expressed sequencetag; Dpe: Days post evisceration; RT-PCR: reverse tran-scriptase polymerase chain reaction; LPS: lipopolysaccha-rides; MMP: Matrix metalloproteases; GO: GeneOntology; ORF: Open Reading Frame; UTR: Untranslatedregion; mRNA: Messenger RNA; SLS: spindle like struc-ture; ECM: Extra-Cellular Matrix.
Authors' contributionsPOP designed and carried out the study, analyzed andinterpreted the data, and drafted the manuscript. FRGhelped in the design and participated in the molecularexperiments. CRC, JRL, ESC, ATMM and KT participatedin cDNA library construction, EST characterization andanalysis and gene identification and sequencing. JPO,SGD, FSD, JH, and CDA performed most of the validationexperiments and participated in the analysis of data. HOZhelped in bioinformatics analysis. JEGA conceived thestudy, participated in its design, data analyses and helpedin the manuscript preparation. All authors have givenfinal approval of the version to be published.
Microarray experimental designFigure 8Microarray experimental design. Normal (Nml) and regenerating intestines at 3, 7 and 14 dpe (days post-eviscer-ation) were compared among them. Each experiment was replicated as a dye swap with different biological samples. LPS treated tissues where used to normalize the expression for immune activated genes. Arrows show direct compari-sons.
Page 18 of 21(page number not for citation purposes)
BMC Genomics 2009, 10:262 http://www.biomedcentral.com/1471-2164/10/262
Additional material
AcknowledgementsThis work was supported by NIH (1SC1GM084770-01), NSF (IBN-0110692) and NIH- (S06GM08102). We also acknowledge partial support from NIH INBRE (P20RR16470), DEGI-PBDT (doctoral dissertation fel-lowship to F. Ramírez-Gómez and E. Suarez-Castillo), the Sequencing and Genotyping facility of the UPR and the University of Puerto Rico.
References1. Candia Carnevali MD, Bonasoro F: Introduction to the biology of
regeneration in echinoderms. Microsc Res Tech 2001,55(6):365-368.
2. Brockes JP: Amphibian limb regeneration: rebuilding a com-plex structure. Science 1997, 276(5309):81-87.
3. Tsonis PA: Regeneration in vertebrates. Dev Biol 2000,221(2):273-284.
4. Sanchez Alvarado A, Tsoni PA: Bridging the regeneration gap:genetic insights from diverse animal models. Nat Rev Genet2006, 7(11):873-884.
5. Slack JM: Regeneration research today. Dev Dyn 2003,226(2):162-166.
6. Garcia-Arraras JE, Estrada-Rodgers L, Santiago R, Torres II, Diaz-Miranda L, Torres-Avillan I: Cellular mechanisms of intestineregeneration in the sea cucumber, Holothuria glaberrimaSelenka (Holothuroidea:Echinodermata). J Exp Zool 1998,281(4):288-304.
7. Cabrera-Serrano A, Garcia-Arraras JE: RGD-containing peptidesinhibit intestinal regeneration in the sea cucumber Holothu-ria glaberrima. Dev Dyn 2004, 231(1):171-178.
8. Candelaria AG, Murray G, File SK, Garcia-Arraras JE: Contributionof mesenterial muscle dedifferentiation to intestine regener-ation in the sea cucumber Holothuria glaberrima. Cell TissueRes 2006, 325(1):55-65.
9. Garcia-Arraras JE, Schenk C, Rodrigues-Ramirez R, Torres II, Valen-tin G, Candelaria AG: Spherulocytes in the echinoderm Hol-othuria glaberrima and their involvement in intestinalregeneration. Dev Dyn 2006, 235(12):3259-3267.
10. Garcia-Arraras JE, Torres-Avillan I: Developmental expression ofgalanin-like immunoreactivity by members of the avian sym-pathoadrenal cell lineage. Cell Tissue Res 1999, 295(1):33-41.
11. Murray G, Garcia-Arraras JE: Myogenesis during holothurianintestinal regeneration. Cell Tissue Res 2004, 318(3):515-524.
12. Quinones JL, Rosa R, Ruiz DL, Garcia-Arraras JE: Extracellularmatrix remodeling and metalloproteinase involvement dur-ing intestine regeneration in the sea cucumber Holothuriaglaberrima. Dev Biol 2002, 250(1):181-197.
13. Rojas-Cartagena C, Ortiz-Pineda P, Ramirez-Gomez F, Suarez-Cas-tillo EC, Matos-Cruz V, Rodriguez C, Ortiz-Zuazaga H, Garcia-Arra-ras JE: Distinct profiles of expressed sequence tags duringintestinal regeneration in the sea cucumber Holothuria gla-berrima. Physiol Genomics 2007, 31(2):203-215.
14. Santiago P, Roig-Lopez JL, Santiago C, Garcia-Arraras JE: Serumamyloid A protein in an echinoderm: its primary structureand expression during intestinal regeneration in the seacucumber Holothuria glaberrima. J Exp Zool 2000,288(4):335-344.
15. Suarez-Castillo EC, Medina-Ortiz WE, Roig-Lopez JL, Garcia-ArrarasJE: Ependymin, a gene involved in regeneration and neuro-plasticity in vertebrates, is overexpressed during regenera-tion in the echinoderm Holothuria glaberrima. Gene 2004,334:133-143.
16. Bannister R, McGonnell IM, Graham A, Thorndyke MC, Beesley PW:Afuni, a novel transforming growth factor-beta gene isinvolved in arm regeneration by the brittle star Amphiurafiliformis. Dev Genes Evol 2005, 215(8):393-401.
17. Bannister SR, Powell CA: Foreign body reaction to anorganicbovine bone and autogenous bone with platelet-rich plasmain guided bone regeneration. J Periodontol 2008,79(6):1116-1120.
18. Patruno M, McGonnell I, Graham A, Beesley P, Candia Carnevali MD,Thorndyke M: Anbmp2/4 is a new member of the transform-ing growth factor-beta superfamily isolated from a crinoidand involved in regeneration. Proc Biol Sci 2003,270(1522):1341-1347.
19. Patruno M, Smertenko A, Candia Carnevali MD, Bonasoro F, BeesleyPW, Thorndyke MC: Expression of transforming growth factorbeta-like molecules in normal and regenerating arms of thecrinoid Antedon mediterranea: immunocytochemical andbiochemical evidence. Proc Biol Sci 2002, 269(1502):1741-1747.
20. Thorndyke MC, Chen WC, Beesley PW, Patruno M: Molecularapproach to echinoderm regeneration. Microsc Res Tech 2001,55(6):474-485.
21. Sanchez Alvarado A: Stem cells and the Planarian Schmidteamediterranea. C R Biol 2007, 330(67):498-503.
22. Carlson ME, O'Connor MS, Hsu M, Conboy IM: Notch signalingpathway and tissue engineering. Front Biosci 2007, 12:5143-5156.
23. Stocum DL: Stem cells in CNS and cardiac regeneration. AdvBiochem Eng Biotechnol 2005, 93:135-159.
24. Mendez AT, Roig-Lopez JL, Santiago P, Santiago C, Garcia-Arraras JE:Identification of Hox Gene Sequences in the Sea CucumberHolothuria glaberrima Selenka (Holothuroidea: Echinoder-mata). Mar Biotechnol (NY) 2000, 2(3):231-240.
25. Mendez AT: Characterization of homeobox genes in the seacucumber, Holothuria glaberrima Selenka (holothuroi-dea:Echinodermata) and expression during the regenerationof gastrointestinal tract. San Juan: University of Puerto Rico;2001.
26. Santiago-Cardona PG, Berrios CA, Ramirez F, Garcia-Arraras JE:Lipopolysaccharides induce intestinal serum amyloid Aexpression in the sea cucumber Holothuria glaberrima. DevComp Immunol 2003, 27(2):105-110.
27. Lien CL, Schebesta M, Makino S, Weber GJ, Keating MT: Geneexpression analysis of zebrafish heart regeneration. PLoS Biol2006, 4(8):e260.
28. Arai M, Yokosuka O, Chiba T, Imazeki F, Kato M, Hashida J, Ueda Y,Sugano S, Hashimoto K, Saisho H, et al.: Gene expression profilingreveals the mechanism and pathophysiology of mouse liverregeneration. J Biol Chem 2003, 278(32):29813-29818.
Additional file 1Microarray internal controls performance. Numerical and graphical representation of the internal control signals.Click here for file[http://www.biomedcentral.com/content/supplementary/1471-2164-10-262-S1.zip]
Additional file 2Normalization procedure. Example of two random selected arrays before and after normalization.Click here for file[http://www.biomedcentral.com/content/supplementary/1471-2164-10-262-S2.zip]
Additional file 3Dye-swap hybridization. Bottom left corner of one array and the same corner in the corresponding dye-swap microarrayClick here for file[http://www.biomedcentral.com/content/supplementary/1471-2164-10-262-S3.zip]
Additional file 4Primers. List of primers used for validation.Click here for file[http://www.biomedcentral.com/content/supplementary/1471-2164-10-262-S4.pdf]
Page 19 of 21(page number not for citation purposes)
BMC Genomics 2009, 10:262 http://www.biomedcentral.com/1471-2164/10/262
29. Fukuhara Y, Hirasawa A, Li XK, Kawasaki M, Fujino M, Funeshima N,Katsuma S, Shiojima S, Yamada M, Okuyama T, et al.: Gene expres-sion profile in the regenerating rat liver after partial hepate-ctomy. J Hepatol 2003, 38(6):784-792.
30. Monaghan JR, Walker JA, Page RB, Putta S, Beachy CK, Voss SR:Early gene expression during natural spinal cord regenera-tion in the salamander Ambystoma mexicanum. J Neurochem2007, 101(1):27-40.
31. Beauchemin M, Noiseux N, Tremblay M, Savard P: Expression ofHox A11 in the limb and the regeneration blastema of adultnewt. Int J Dev Biol 1994, 38(4):641-649.
32. Carlson ER: Bone grafting the jaws in the 21st century: the useof platelet-rich plasma and bone morphogenetic protein.Alpha Omegan 2000, 93(3):26-30.
33. Savard P, Gates PB, Brockes JP: Position dependent expression ofa homeobox gene transcript in relation to amphibian limbregeneration. Embo J 1988, 7(13):4275-4282.
34. Schummer M, Scheurlen I, Schaller C, Galliot B: HOM/HOX home-obox genes are present in hydra (Chlorohydra viridissima)and are differentially expressed during regeneration. Embo J1992, 11(5):1815-1823.
35. Mizuta I, Ogasawara N, Yoshikawa H, Sakoyama Y: Identification ofhomeobox genes expressed during the process of rat liverregeneration after partial hepatectomy. Biochem Genet 1996,34(1–2):1-15.
36. Thummel R, Ju M, Sarras MP Jr, Godwin AR: Both Hoxc13orthologs are functionally important for zebrafish tail finregeneration. Dev Genes Evol 2007, 217(6):413-420.
37. Brown R, Brockes JP: Identification and expression of a regen-eration-specific homeobox gene in the newt limb blastema.Development 1991, 111(2):489-496.
38. Beck F, Tata F, Chawengsaksophak K: Homeobox genes and gutdevelopment. Bioessays 2000, 22(5):431-441.
39. Kawazoe Y, Sekimoto T, Araki M, Takagi K, Araki K, Yamamura K:Region-specific gastrointestinal Hox code during murineembryonal gut development. Dev Growth Differ 2002,44(1):77-84.
40. Wolgemuth DJ, Behringer RR, Mostoller MP, Brinster RL, PalmiterRD: Transgenic mice overexpressing the mouse homoe-obox-containing gene Hox1.4 – exhibit abnormal gut devel-opment. Nature 1989, 337(6206):464-467.
41. Kondo T, Dolle P, Zakany J, Duboule D: Function of posteriorHoxD genes in the morphogenesis of the anal sphincter.Development 1996, 122(9):2651-2659.
42. Yokoyama H, Ogino H, Stoick-Cooper CL, Grainger RM, Moon RT:Wnt/beta-catenin signaling has an essential role in the initia-tion of limb regeneration. Dev Biol 2007, 306(1):170-178.
43. Hayashi T, Mizuno N, Takada R, Takada S, Kondoh H: Determina-tive role of Wnt signals in dorsal iris-derived lens regenera-tion in newt eye. Mech Dev 2006, 123(11):793-800.
44. Kim JB, Leucht P, Lam K, Luppen C, Ten Berge D, Nusse R, Helms JA:Bone regeneration is regulated by wnt signaling. J Bone MinerRes 2007, 22(12):1913-1923.
45. Ito M, Yang Z, Andl T, Cui C, Kim N, Millar SE, Cotsarelis G: Wnt-dependent de novo hair follicle regeneration in adult mouseskin after wounding. Nature 2007, 447(7142):316-320.
46. Mount JG, Muzylak M, Allen S, Althnaian T, McGonnell IM, Price JS:Evidence that the canonical Wnt signalling pathway regu-lates deer antler regeneration. Dev Dyn 2006,235(5):1390-1399.
47. Tan X, Behari J, Cieply B, Michalopoulos GK, Monga SP: Conditionaldeletion of beta-catenin reveals its role in liver growth andregeneration. Gastroenterology 2006, 131(5):1561-1572.
48. Yen TH, Wright NA: The gastrointestinal tract stem cell niche.Stem Cell Rev 2006, 2(3):203-212.
49. Kobayashi C, Saito Y, Ogawa K, Agata K: Wnt signaling isrequired for antero-posterior patterning of the planarianbrain. Dev Biol 2007, 306(2):714-724.
50. Gurley KA, Rink JC, Sanchez Alvarado A: Beta-catenin defineshead versus tail identity during planarian regeneration andhomeostasis. Science 2008, 319(5861):323-327.
51. Grogg MW, Call MK, Okamoto M, Vergara MN, Del Rio-Tsonis K,Tsonis PA: BMP inhibition-driven regulation of six-3 underliesinduction of newt lens regeneration. Nature 2005,438(7069):858-862.
52. Smith A, Avaron F, Guay D, Padhi BK, Akimenko MA: Inhibition ofBMP signaling during zebrafish fin regeneration disrupts fingrowth and scleroblasts differentiation and function. Dev Biol2006, 299(2):438-454.
53. Beck CW, Christen B, Barker D, Slack JM: Temporal requirementfor bone morphogenetic proteins in regeneration of the tailand limb of Xenopus tadpoles. Mech Dev 2006, 123(9):674-688.
54. Molina MD, Salo E, Cebria F: The BMP pathway is essential forre-specification and maintenance of the dorsoventral axis inregenerating and intact planarians. Dev Biol 2007,311(1):79-94.
55. Reddien PW, Bermange AL, Kicza AM, Sanchez Alvarado A: BMPsignaling regulates the dorsal planarian midline and isneeded for asymmetric regeneration. Development 2007,134(22):4043-4051.
56. Batts LE, Polk DB, Dubois RN, Kulessa H: Bmp signaling isrequired for intestinal growth and morphogenesis. Dev Dyn2006, 235(6):1563-1570.
57. De Santa Barbara P, Williams J, Goldstein AM, Doyle AM, Nielsen C,Winfield S, Faure S, Roberts DJ: Bone morphogenetic proteinsignaling pathway plays multiple roles during gastrointesti-nal tract development. Dev Dyn 2005, 234(2):312-322.
58. Pyati UJ, Cooper MS, Davidson AJ, Nechiporuk A, Kimelman D: Sus-tained Bmp signaling is essential for cloaca development inzebrafish. Development 2006, 133(11):2275-2284.
59. Dolmatov I: Regeneration of the aquapharyngeal complex inthe holothurian Eupentacta fraudatrix (Holothuroidea, Den-drochirota). Monogr Dev Biol 1992, 23:40-50.
60. Cowin AJ, Hatzirodos N, Teusner JT, Belford DA: Differentialeffect of wounding on actin and its associated proteins, pax-illin and gelsolin, in fetal skin explants. J Invest Dermatol 2003,120(6):1118-1129.
61. Martin P: Wound healing – aiming for perfect skin regenera-tion. Science 1997, 276(5309):75-81.
62. Davenport RJ: What controls organ regeneration? Science 2005,309(5731):84.
63. Sanchez Alvarado A: Regeneration in the metazoans: why doesit happen? Bioessays 2000, 22(6):578-590.
64. Sanchez Alvarado A: Regeneration and the need for simplermodel organisms. Philos Trans R Soc Lond B Biol Sci 2004,359(1445):759-763.
65. Brockes JP, Kumar A: Plasticity and reprogramming of differen-tiated cells in amphibian regeneration. Nat Rev Mol Cell Biol2002, 3(8):566-574.
66. Habermann B, Bebin AG, Herklotz S, Volkmer M, Eckelt K, Pehlke K,Epperlein HH, Schackert HK, Wiebe G, Tanaka EM: AnAmbystoma mexicanum EST sequencing project: analysis of17,352 expressed sequence tags from embryonic and regen-erating blastema cDNA libraries. Genome Biol 2004, 5(9):R67.
67. Putta S, Smith JJ, Walker JA, Rondet M, Weisrock DW, Monaghan J,Samuels AK, Kump K, King DC, Maness NJ, et al.: From biomedi-cine to natural history research: EST resources for ambysto-matid salamanders. BMC Genomics 2004, 5(1):54.
68. Andreasen EA, Mathew LK, Lohr CV, Hasson R, Tanguay RL: Arylhydrocarbon receptor activation impairs extracellularmatrix remodeling during zebra fish fin regeneration. ToxicolSci 2007, 95(1):215-226.
69. Cameron DA, Gentile KL, Middleton FA, Yurco P: Gene expressionprofiles of intact and regenerating zebrafish retina. Mol Vis2005, 11:775-791.
70. Azumi K, Takahashi H, Miki Y, Fujie M, Usami T, Ishikawa H, KitayamaA, Satou Y, Ueno N, Satoh N: Construction of a cDNA microar-ray derived from the ascidian Ciona intestinalis. Zoolog Sci2003, 20(10):1223-1229.
71. Rinkevi Y, Douekch J, Haber O, Rinkevich B, Reshef R: Urochordatewhole body regeneration inaugurates a diverse innateimmune signaling profile. Dev Biol 2007, 312(1):131-146.
72. Mineta K, Nakazawa M, Cebria F, Ikeo K, Agata K, Gojobori T: Ori-gin and evolutionary process of the CNS elucidated by com-parative genomics analysis of planarian ESTs. Proc Natl AcadSci USA 2003, 100(13):7666-7671.
73. Nakazawa M, Cebria F, Mineta K, Ikeo K, Agata K, Gojobori T:Search for the evolutionary origin of a brain: planarian braincharacterized by microarray. Mol Biol Evol 2003, 20(5):784-791.
Page 20 of 21(page number not for citation purposes)
BMC Genomics 2009, 10:262 http://www.biomedcentral.com/1471-2164/10/262
Publish with BioMed Central and every scientist can read your work free of charge
"BioMed Central will be the most significant development for disseminating the results of biomedical research in our lifetime."
Sir Paul Nurse, Cancer Research UK
Your research papers will be:
available free of charge to the entire biomedical community
peer reviewed and published immediately upon acceptance
cited in PubMed and archived on PubMed Central
yours — you keep the copyright
Submit your manuscript here:http://www.biomedcentral.com/info/publishing_adv.asp
BioMedcentral
74. Newmark PA, Sanchez Alvarado A: Not your father's planarian:a classic model enters the era of functional genomics. Nat RevGenet 2002, 3(3):210-219.
75. Rossi L, Salvetti A, Marincola FM, Lena A, Deri P, Mannini L, BatistoniR, Wang E, Gremigni V: Deciphering the molecular machineryof stem cells: a look at the neoblast gene expression profile.Genome Biol 2007, 8(4):R62.
76. Zayas RM, Hernandez A, Habermann B, Wang Y, Stary JM, NewmarkPA: The planarian Schmidtea mediterranea as a model forepigenetic germ cell specification: analysis of ESTs from thehermaphroditic strain. Proc Natl Acad Sci USA 2005,102(51):18491-18496.
77. Cebria F, Kudome T, Nakazawa M, Mineta K, Ikeo K, Gojobori T,Agata K: The expression of neural-specific genes reveals thestructural and molecular complexity of the planarian centralnervous system. Mech Dev 2002, 116(1–2):199-204.
78. Chera S, Kaloulis K, Galliot B: The cAMP response elementbinding protein (CREB) as an integrative HUB selector inmetazoans: clues from the hydra model system. Biosystems2007, 87(2–3):191-203.
79. Galliot B, Miljkovic-Licina M, de Rosa R, Chera S: Hydra, a niche forcell and developmental plasticity. Semin Cell Dev Biol 2006,17(4):492-502.
80. Galliot B, Miljkovic-Licina M, Ghila L, Chera S: RNAi gene silencingaffects cell and developmental plasticity in hydra. C R Biol2007, 330(6–7):491-497.
81. Stout T, McFarland T, Appukuttan B: Suppression subtractivehybridization identifies novel transcripts in regeneratingHydra littoralis. J Biochem Mol Biol 2007, 40(2):286-289.
82. Sea-Urchin-Genome-Sequence-Consortium: The genome of thesea urchin Strongylocentrotus purpuratus. Science 2006,314(5801):941-952.
83. Dubois P, Ameye L: Regeneration of spines and pedicellariae inechinoderms: a review. Microsc Res Tech 2001, 55(6):427-437.
84. Dupont S, Thorndyke MC: Growth or differentiation? Adaptiveregeneration in the brittlestar Amphiura filiformis. J Exp Biol2006, 209(Pt 19):3873-3881.
85. Ramirez-Gomez F, Ortiz-Pineda PA, Rojas-Cartagena C, Suarez-Cas-tillo EC, Garcia-Arraras JE: Immune-related genes associatedwith intestinal tissue in the sea cucumber Holothuria glaber-rima. Immunogenetics 2008, 60(1):57-71.
86. Chomczynski P: A reagent for the single-step simultaneous iso-lation of RNA, DNA and proteins from cell and tissue sam-ples. Biotechniques 1993, 15(3):532-534. 536-537.
87. Edgar R, Domrachev M, Lash AE: Gene Expression Omnibus:NCBI gene expression and hybridization array data reposi-tory. Nucleic Acids Res 2002, 30(1):207-210.
88. Smyth GK, Speed T: Normalization of cDNA microarray data.Methods 2003, 31(4):265-273.
89. Benjamini Y, Hochber Y: Controlling the false discovery rate: apractical and powerful approach to multiple testing. J R StatSoc 1995, 57:289-300.
90. Eisen MB, Spellman PT, Brown PO, Botstein D: Cluster analysisand display of genome-wide expression patterns. Proc NatlAcad Sci USA 1998, 95(25):14863-14868.
91. Kohonen T: Cortical maps. Nature 1990, 346(6279):24.
Page 21 of 21(page number not for citation purposes)