bmc genomics biomed central - home - springer · biomed central page 1 of 12 (page number not for...
TRANSCRIPT
BioMed CentralBMC Genomics
ss
Open AcceMethodology articleEvaluation of reference-based two-color methods for measurement of gene expression ratios using spotted cDNA microarraysBernardo R Peixoto1, Ricardo ZN Vêncio2, Camila M Egidio3, Luisa Mota-Vieira4, Sergio Verjovski-Almeida3 and Eduardo M Reis*3Address: 1Departamento de Matemática, Universidade dos Açores, 9501-801 Ponta Delgada, Açores, Portugal., 2BIOINFO-USP, Núcleo de Pesquisa em Bioinformática, Instituto de Matemática e Estatística, Universidade de São Paulo, 05508-090 São Paulo, SP, Brasil., 3Departamento de Bioquímica, Instituto de Química, Universidade de São Paulo, 05508-900 São Paulo, SP, Brasil. and 4Unidade de Genética e Patologia Moleculares, Hospital do Divino Espírito Santo, 9500-370 Ponta Delgada, Açores, Portugal.
Email: Bernardo R Peixoto - [email protected]; Ricardo ZN Vêncio - [email protected]; Camila M Egidio - [email protected]; Luisa Mota-Vieira - [email protected]; Sergio Verjovski-Almeida - [email protected]; Eduardo M Reis* - [email protected]
* Corresponding author
AbstractBackground: Spotted cDNA microarrays generally employ co-hybridization of fluorescently-labeled RNAtargets to produce gene expression ratios for subsequent analysis. Direct comparison of two RNA samples in thesame microarray provides the highest level of accuracy; however, due to the number of combinatorial pair-wisecomparisons, the direct method is impractical for studies including large number of individual samples (e.g., tumorclassification studies). For such studies, indirect comparisons using a common reference standard have been thepreferred method. Here we evaluated the precision and accuracy of reconstructed ratios from three indirectmethods relative to ratios obtained from direct hybridizations, herein considered as the gold-standard.
Results: We performed hybridizations using a fixed amount of Cy3-labeled reference oligonucleotide (RefOligo)against distinct Cy5-labeled targets from prostate, breast and kidney tumor samples. Reconstructed ratiosbetween all tissue pairs were derived from ratios between each tissue sample and RefOligo. Reconstructed ratioswere compared to (i) ratios obtained in parallel from direct pair-wise hybridizations of tissue samples, and to (ii)reconstructed ratios derived from hybridization of each tissue against a reference RNA pool (RefPool). Toevaluate the effect of the external references, reconstructed ratios were also calculated directly from intensityvalues of single-channel (One-Color) measurements derived from tissue sample data collected in the RefOligoexperiments. We show that the average coefficient of variation of ratios between intra- and inter-slide replicatesderived from RefOligo, RefPool and One-Color were similar and 2 to 4-fold higher than ratios obtained in directhybridizations. Correlation coefficients calculated for all three tissue comparisons were also similar. In addition,the performance of all indirect methods in terms of their robustness to identify genes deemed as differentiallyexpressed based on direct hybridizations, as well as false-positive and false-negative rates, were found to becomparable.
Conclusion: RefOligo produces ratios as precise and accurate as ratios reconstructed from a RNA pool, thusrepresenting a reliable alternative in reference-based hybridization experiments. In addition, One-Colormeasurements alone can reconstruct expression ratios without loss in precision or accuracy. We conclude thatboth methods are adequate options in large-scale projects where the amount of a common reference RNA poolis usually restrictive.
Published: 24 February 2006
BMC Genomics 2006, 7:35 doi:10.1186/1471-2164-7-35
Received: 26 September 2005Accepted: 24 February 2006
This article is available from: http://www.biomedcentral.com/1471-2164/7/35
© 2006 Peixoto et al; licensee BioMed Central Ltd. This is an Open Access article distributed under the terms of the Creative Commons Attribution License (http://creativecommons.org/licenses/by/2.0), which permits unrestricted use, distribution, and reproduction in any medium, provided the original work is properly cited.
Page 1 of 12(page number not for citation purposes)

BMC Genomics 2006, 7:35 http://www.biomedcentral.com/1471-2164/7/35
BackgroundGene expression studies using either oligonucleotides orspotted cDNA microarray platforms are based mainly ondata generated in single or dual-channel analysis. Whileindustrially manufactured oligonucleotide arrays (e.g.Agilent Whole Genome 44 k Oligoarray and CodeLinkWhole Genome Bioarray) have optimized protocols thatperform well on both single and dual-channel microarrayexperimental designs, custom made spotted cDNA or oli-gonucleotide microarrays have been mainly employed intwo-channel designs [1]. Single-channel (one-color)experiments probe one RNA sample per hybridization,whereas dual-channel (two-color) experiments generatespot signal intensity values from two different RNA sam-ples, each labeled with one of two cyanine dyes (Cy3 orCy5), followed by simultaneous hybridization. After sub-traction of background signal, absolute intensity values,derived from each channel, are often used to calculateexpression ratios for subsequent analysis. The ratio of thesignal intensities obtained from the two channels is a rel-ative measure of gene expression of the correspondinggene probe. Ratiometric data analysis minimizes varioussources of variation related to the construction andhybridization of the microarrays, thus providing the high-est level of precision in the comparison of gene expressionprofiles from two different RNA samples [2].
While direct hybridization of two experimental RNA sam-ples in the same slide is highly desirable, indirect compar-ison through the co-hybridization of a test sampletogether with a common reference standard is the mostused experimental design [3,4]. Relating each experimen-tal sample to a common reference standard facilitates thecomparison of ratios across datasets [4]. Several types ofreference samples based on commercial Universal refer-ence RNA [5], genomic DNA [6-8] or PCR products repre-senting the collection of cDNA clones printed on the chip[9,10] have been proposed, but no single universal refer-ence standard is widely adopted, seriously impeding crosscomparisons between different studies. The compositionand properties of the selected reference sample must beaddressed properly, because it raises issues concerning theexperimental design, the goal of the study and the longterm comparability of the data. For example, a problemassociated to the use of a reference RNA in tumor profilingstudies is the requirement of a large amount of high-qual-ity reference sample to allow comparison across multipledatasets [11-13]. Pooling of equal amounts of RNA fromtest tumor samples is impractical in prospective studies,because samples collected after the construction of thepool would not be represented, precluding adequate com-parison of recently collected samples. Cell lines may inprinciple be an unlimited source of a reference RNA.Indeed several tumor profiling studies have employedsuch a method [11,12,14]. However, the biological varia-
bility inherent to cells cultivated in different batchesrequires that all RNA used to generate the reference poolbe prepared prior to the beginning of the hybridizations.As an alternative to reference-based designs, theoreticaland experimental work have shown that other types oftwo-channel designs, namely loop-designs, may produceprecise estimates of differential gene expression comparedto a design based on a common RNA reference [15]. How-ever, Dobbin and Simon [16] have demonstrated that forexperiments aiming to discover clusters within a collec-tion of samples (class discovery), a common goal of can-cer profiling studies, the reference design is more robustthan the loop design. According to these authors, variablequality of individual arrays may have a greater impact oncluster analysis when a loop design is used. This consider-ation is particularly significant in studies using in-housespotted-cDNA microarrays, in which uneven qualitybetween slides of different batches may limit the loopapproach.
In this study we designed a set of experiments to evaluatethe precision and accuracy of gene expression ratiosderived from two-color microarray hybridizations usingeach of three tumor tissue RNA samples and two differentexternal references: (i) a pooled tumor RNA sample (Ref-Pool) that was labeled in parallel with the test tissue sam-ple; and (ii) a 27-mer reference oligonucleotide(RefOligo) complementary to every feature of the arraywhich was labeled by chemically coupling of a fluorescentnucleotide. The RefOligo method was originally proposedby Dudley et al. to control intensity ratios of gene expres-sion studies in yeast [17], a system with much lower geneexpression complexity. Here, ratios derived from thedirect pair-wise hybridizations of human tissue sampleswere taken as the gold-standard against which ratiosderived from reconstructed measurements were com-pared. These external-reference based ratios were alsocompared to ratios reconstructed from one-color meas-urements. The results are discussed based on the strengthsand weaknesses of each of the three indirect experimentaldesigns.
Results and discussionExperimental designRNA isolated from three types of human tumor tissues(prostate, breast and kidney) was used to generate fluores-cent targets for microarray hybridizations. Finding differ-entially expressed genes among different cancer tissuesand cell lines and identifying gene expression signaturesfor each of them is a frequent task in the study of humangene expression using microarrays [11,18,19]. In addi-tion, comparative gene expression profiling amongtumors derived from different organs are revealing com-mon gene signatures with highly significant correlation toclinical behavior of the cancer [20]. Tissue-derived fluo-
Page 2 of 12(page number not for citation purposes)

BMC Genomics 2006, 7:35 http://www.biomedcentral.com/1471-2164/7/35
rescent targets were co-hybridized with each of two differ-ent types of external references; in one set of experiments,a fixed amount of a 27-mer 5'-end Cy3-labeled syntheticoligonucleotide (RefOligo; Figure 1A) was co-hybridizedwith Cy5-labeled cDNA targets derived from RNA of eachtissue (Figure 1B). In parallel, Cy5-labeled cDNA targetsderived from each tissue were co-hybridized to Cy3-labeled targets from a reference RNA pool (RefPool) (Fig-ure 1B). RefPool was assembled from equimolar amounts
of RNA isolated from each of the three tumor tissues. Tworeplicate hybridizations were performed for each tissue,using either RefOligo or RefPool as an external reference(Figure 1B – indirect hybridizations). In turn, each repli-cate slide had two replicate cDNA arrays spotted on them,thus generating four intensity measurements for eachexperiment. In addition, RNA aliquots from each tissuewere labeled with either Cy3 or Cy5 and hybridizeddirectly to each other. A replicate hybridization with dye-
Schematic representation of the experimental designFigure 1Schematic representation of the experimental design. (A) Human cDNA inserts that were cloned into pUC18 vector were amplified by PCR with vector universal primers in such a way that each PCR-amplified cDNA probe spotted on the array contained a common 5'-end sequence derived from the vector. The RefOligo consisted of a synthetic Cy3-labeled 27-mer oli-gonucleotide (marked with green asterisks) that is complementary to the 5'-end vector sequence present in each cDNA probe. This RefOligo common reference was co-hybridized to the arrays along with Cy5-labeled tissue-derived targets (marked with red asterisks). (B) Overview of the experimental design including direct and indirect hybridizations. Filled squares represent fluorescent targets derived either from test RNAs (B, Breast; K, Kidney; P, Prostate), or from two types of external references, RefPool (Rp) or RefOligo (Ro). Arrows indicate co-hybridized target RNAs -- arrow head indicate the target labeled with Cy3, whereas the arrow tail indicate the target labeled with Cy5. The number of replicate hybridizations performed with each paired sample is indicated in the small circles.
Page 3 of 12(page number not for citation purposes)
BMC Genomics 2006, 7:35 http://www.biomedcentral.com/1471-2164/7/35
reversal was performed for each pair of tissues (Figure 1B– direct hybridizations), again generating four intensitymeasurements. Gene expression log-ratios between eachpair of tissues were reconstructed using either RefOligo orRefPool reference values and compared to ratios obtainedfrom direct hybridizations, which we considered herein asthe gold-standard. To evaluate the effect of the externalreferences, we compared RefOligo and RefPool ratios toratios reconstructed from single-channel measurements(One-Color). One-Color ratios were calculated directlyfrom intensity measurements of Cy5-labeled targets fromthe tissue samples that were co-hybridized in RefOligoexperiments. It has been proposed that intensity measure-ments obtained from spotted oligonucleotide arrays arenot affected by co-hybridized targets [21]. Nonetheless,we opted to obtaining One-Color intensity measurementfrom RefOligo hybridizations, instead of from RefPool, toensure that Cy5 intensity values would not be affected bytargets labeled with Cy3 that would compete for the sameprobe sequence in the array.
A detailed description of data normalization, filtering andaveraging of replicates is described in the Methods sec-tion. Intensity ratios for Kidney vs. Breast comparison aredepicted in Figure 2 as MA-plots. It can be seen that ratiosresulting from all three reconstructed methods, i.e. RefO-ligo, RefPool and One-Color analyses, are more dispersedthan those from the direct comparison. Similar resultswere obtained for the other two tissue comparisons [seeAdditional file 1]. Correlation of log-ratios between thetwo forward and two reverse labeled replicates for eachdirect comparison was determined, and a high degree ofcorrelation was observed (Kidney vs. Breast 0.937; Pros-tate vs. Breast 0.872; Prostate vs. Kidney 0.945). Thisresult suggests that there is no significant residual biasassociated with the use of two different fluorophores (Cy3or Cy5) in the direct comparisons that might have pre-cluded the use of only Cy5-labeled tissue samples for indi-rect comparisons, where we always labeled the referencewith Cy3. Nonetheless, we can not rule out the possibilitythat the use of a dye-swap design in the direct hybridiza-tions may have caused some compression in the directratios as compared to the reconstructed ones. All spots
detected only in one channel (the other channel intensitybeing below the background) were excluded from furtheranalyses. Total number of valid gene expression ratios isshown in Table 1. When an intensity-based filter cutoff of2 standard deviations (SD) above local background wasapplied, a comparable fraction of ratios (~30 %) wereselected in each reconstructed method, whereas in directhybridizations only 20 % of the ratios were selected(Table 1). On average, arrays hybridized with Cy5-labeledtargets derived from individual tissues showed lower non-specific background and produced a slightly larger frac-tion of valid intensity measurements when compared toCy3-labeled targets derived from the same RNA samples(data not shown). This would explain the lower fractionof valid ratios in the direct comparisons, where a numberof transcripts having an expression level near detectioncutoff in one tissue would eliminate those genes from theanalysis when labeled with Cy3. On the other hand, whenCy3-labeled tissue-derived targets were used as referencein the RefPool comparisons, this effect would not prevailin all situations because the abundance of low-expressionmessages could be compensated by its eventual higherexpression in one of the other two tissues represented inthe three-tissue pool. The homogeneous hybridization toall probes in the array obtained with the synthetic refer-ence oligonucleotide would have a similar compensatoryeffect in the RefOligo analyses.
Performance among indirect hybridization methodsTo estimate the precision of RefOligo and RefPool inreconstructing ratios obtained in direct hybridizations wecalculated the coefficient of variation (CV) for intra- slidereplicates (Figure 3, left panel). We found that when allratios are used, the average CV of ratios reconstructedfrom indirect hybridizations are comparable (RefOligo,43.1; RefPool, 44.2) and ~2-fold higher than thatobtained in direct hybridizations (Direct, 23.6; Figure 3,left panel, blue bars). This result is in line with the datafrom Dudley and colleagues (2002), which showed thatthe average CV of replicate ratios reconstructed from a ref-erence oligonucleotide is about twice that for direct ratios[17]. Ratios reconstructed from One-Color measurementsshowed CV values comparable to reference designs (One-
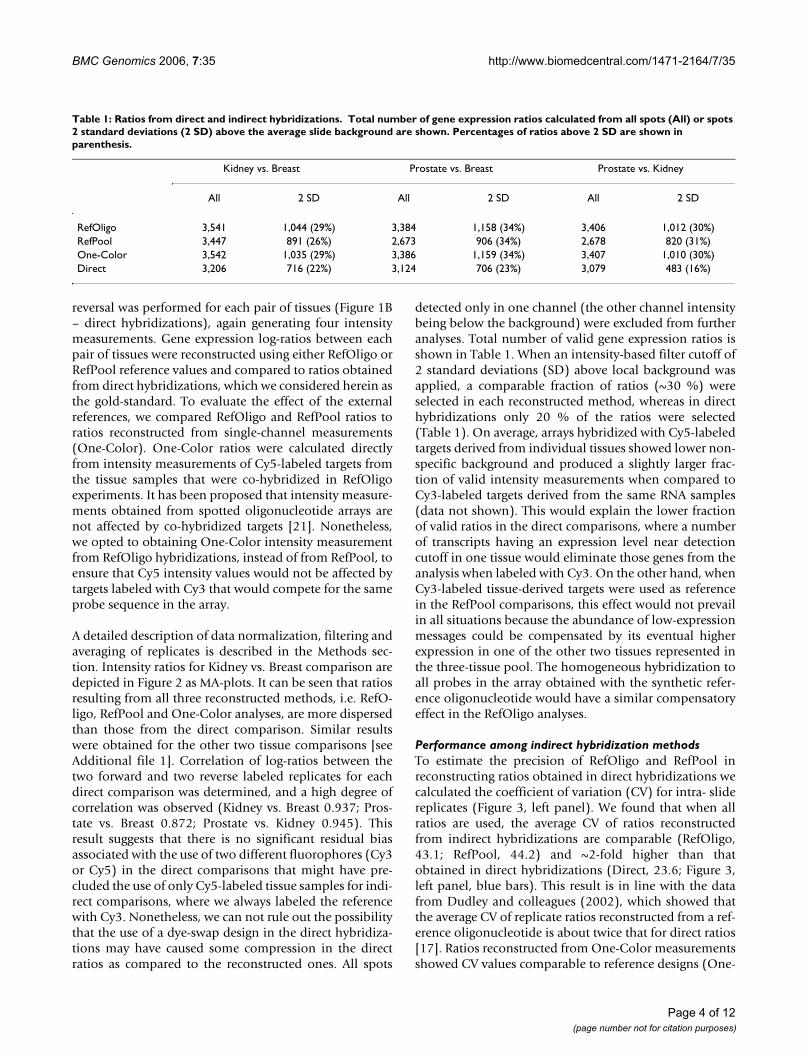
Table 1: Ratios from direct and indirect hybridizations. Total number of gene expression ratios calculated from all spots (All) or spots 2 standard deviations (2 SD) above the average slide background are shown. Percentages of ratios above 2 SD are shown in parenthesis.
Kidney vs. Breast Prostate vs. Breast Prostate vs. Kidney
All 2 SD All 2 SD All 2 SD
RefOligo 3,541 1,044 (29%) 3,384 1,158 (34%) 3,406 1,012 (30%)RefPool 3,447 891 (26%) 2,673 906 (34%) 2,678 820 (31%)One-Color 3,542 1,035 (29%) 3,386 1,159 (34%) 3,407 1,010 (30%)Direct 3,206 716 (22%) 3,124 706 (23%) 3,079 483 (16%)
Page 4 of 12(page number not for citation purposes)

BMC Genomics 2006, 7:35 http://www.biomedcentral.com/1471-2164/7/35
Color, 43.2). When we applied intensity filters to selectonly spots 1 or 2 SD above the local slide background, weobserved a consistent decrease in the average CV for bothdirect and reconstructed ratios (Figure 3, left panel, redand yellow bars). While CVs from direct ratios decreasedup to 50 %, CVs from reconstructed ratios decreasedapproximately 30 % (Figure 3, left panel). Average CV forinter-slide replicates was also comparable for all recon-structed ratios (RefOligo, 38.1; RefPool, 45.8; One-Color,38.4; Figure 3, right panel). Noteworthy, we observed nodifference between the averages of intra- and inter-slideCVs (Figure 3). As all hybridizations were performedusing slides from the same batch and were executed inparallel, we think that this may explain the similar valuesof CV among intra- and inter-slide replicates. The high
correlations of raw intensities that we observed betweenintra- (average of 0.945 ± 0.019) or inter-slide spot repli-cates (average of 0.934 ± 0.068) across all tissue compari-sons support this notion. Taken together, these resultsindicate that the precision of all indirect measurementsare comparable and that One-Color measurements aresufficient to reconstruct ratios as precise as those obtainedfrom external references. Precision of reconstructed ratioswas also evaluated in terms of the average variance of allvalid expression ratios measured across the range ofexpression intensities (Figure 4). While all indirect meas-urements showed similar profiles, it is apparent that vari-ances of reconstructed ratios are higher than that observedfor direct ratios, particularly in the low intensity range(Figure 4). We also observed that variances from One-
MA–scatterplots for direct and reconstructed ratiosFigure 2MA–scatterplots for direct and reconstructed ratios. Normalized intensity ratios for Kidney vs. Breast comparison from all technical replicates is shown. The yellow dots display the log2 intensity ratio (M) as a function of the log2 intensity product (A) for each gene on the array. Spots that were excluded from further analyses (with intensities below the local back-ground plus 2 SD) are shown in gray. Green lines show the credibility interval thresholds (see Methods) used for estimation of differentially expressed genes.
Page 5 of 12(page number not for citation purposes)

BMC Genomics 2006, 7:35 http://www.biomedcentral.com/1471-2164/7/35
Color ratios show a similar profile of variation as thatobtained from RefOligo and RefPool (Figure 4).
The accuracy of indirect methods was estimated by corre-lation analysis between direct ratios and reconstructedratios. Representative scatter plots between direct andreconstructed ratios are shown in Figure 5. Pearson's cor-relation among different tissue comparisons ranged from0.26 to 0.56 and 0.31 to 0.58 for log-ratios reconstructedfrom RefOligo and RefPool, respectively (Table 2 – Pear-son). A similar range of Pearson correlation values wasobtained for log-ratios from One-Color measurements(0.28 to 0. 53). All Pearson correlations were statisticallysignificant (p-value for rejecting Ho: r = 0 near zero). Verysimilar results were obtained by using non-parametricSpearman's rank-correlation (Table 2 – Spearman). Thisresult indicates that the RefOligo approach producesexpression measurements as accurate as those obtainedwith a common RNA reference. It also provides evidencethat gene expression ratios as accurate as those obtainedfrom reference-based designs can be reconstructed fromOne-Color measurements collected from different slides.
Precision of indirect hybridization methods to reconstruct direct measurementsThe ability of each indirect method to identify the sameset of genes found in the direct comparisons was evalu-
ated. Genes differentially expressed in the direct hybridi-zations between each pair of tumor tissues were selectedusing 95 % credibility intervals for differential expression[22], and were taken as the standard gene set (see Methodsfor details). Concordance and discordance among genesets identified by direct and reconstructed ratios were rep-resented as Venn diagrams (Figure 6). On average, a simi-lar fraction of concordant genes, i.e., genes that were alsoidentified in the correspondent direct hybridization, wasidentified as differentially expressed by each indirectmethod (RefOligo: average of 58 % among the three pair-wise tissue comparisons; RefPool: average of 63 %; One-Color: average of 60 %). It is noteworthy that all threeindirect methods detected a small fraction (15 to 18 %) ofthe standard set of differentially expressed genes. Also,RefOligo, RefPool and One-Color identified similar frac-tions of false-positive genes, i.e. genes present in recon-structed ratios but not in the standard set (RefOligo:average of 42 %; RefPool: average of 37 %; One-Color:average of 40 %). To document whether the high rate offalse positives in the RefOligo analysis was due to condi-tions inherent to our system or is a general feature of theRefOligo method, we estimated the number of false posi-tives using data produced by Dudley et al. (2002). As itwas not possible to estimate credibility intervals based onself-self ratios, in this case we used a 2-fold change thresh-old to select genes differentially expressed between yeast
Precision of direct versus reconstructed ratios as determined by the average coefficient of variance (CV) of intra- and inter-slide replicatesFigure 3Precision of direct versus reconstructed ratios as determined by the average coefficient of variance (CV) of intra- and inter-slide replicates. Average CV of expression ratios derived from intra-slide spot replicates (left panel) or inter-slides (right panel) obtained in direct hybridizations or in indirect hybridizations (RefOligo, RefPool, One-Color). CVs were calculated using all ratios (blue bars), ratios calculated from spots that were one (red bars) or two (yellow bars) standard deviations above the local background. Standard errors from pair-wise comparisons of three tissues (Prostate vs. Breast, Pros-tate vs. Kidney or Breast vs. Kidney) are shown.
Page 6 of 12(page number not for citation purposes)

BMC Genomics 2006, 7:35 http://www.biomedcentral.com/1471-2164/7/35
cells grown either in glucose or galactose. Using this crite-rion, we found that approximately 62 % of the genes iden-tified as differentially expressed by ratios reconstructedfrom a reference oligonucleotide in that work were false-positives (data not shown). The high number of false-pos-itives identified by reconstructed ratios may, in part, beexplained by the limited number of technical replicatestested in the present work. We speculate that the inclusionof more technical replicates, or even biological replicates,may contribute to decrease the number of false-positivegenes. In spite of the limitations pointed above, spottedcDNA microarray analysis is a powerful tool to identifycandidate genes in comparative gene expression studies incancer. Validation of differential expression by independ-ent methods such as quantitative RT-PCR will remain as anecessary further step to confirm them as true tumor-asso-ciated molecular markers.
ConclusionData presented here show that RefOligo is a reliable alter-native to a RNA pool in reference-based hybridizationexperiments when studying organisms with a complextranscriptome such as humans. The implication of ourresults is that the unlimited availability of an inexpensive(~US$ 0.30 per hybridization), chemically synthesizedreference oligonucleotide makes its use very convenient inlarge-scale projects where the availability of an RNA poolis usually restrictive. The RefOligo method enables an effi-cient and flexible experimental design because one mayrelate expression measurements to a common reference(dual-channel) or, alternatively, use intensity values only
(single-channel) [17]. As the RefOligo is complementaryto every array element, fluorescent signal derived frombound RefOligo can be used to assess spot quality andfacilitates array griddling by image processing software.We speculate that RefOligo will improve comparison ofdata obtained from different batches of spotted arrays, bycorrecting for small variations in spot morphology and inthe amount of spotted DNA across batches. Moreover, sig-nal intensities of bound reference oligonucleotide mole-cules correlate well with the amount of cDNA probespresent in each spot [23], suggesting that expression ratiosreconstructed from RefOligo may accurately reflect theabsolute abundance of each transcript present in the RNApopulation [17].
Another important conclusion of our study is that use ofOne-Color ratios does not compromise precision morethan other currently used methods based on indirectmeasurements. This observation is in line with recent evi-dence showing that gene classifiers based on intensitymeasurements may outperform ratio-based classifiers[24]. Intra- and inter-slide expression intensity valuesobtained with One-Color correlates well and revealacceptable number of false positives as compared to refer-ence-based methods. Given that direct measurements indatasets containing large number of individual samples(e.g., tumor classification studies) is impractical, One-Color based analysis allows direct comparison of meas-urements across all samples, with a considerable reduc-tion in costs since it eliminates the requirement oflabeling a reference sample
Variance of reconstructed expression ratios along the range of expression intensitiesFigure 4Variance of reconstructed expression ratios along the range of expression intensities. Each panel shows a different pair-wise tissue comparison. The graphs show the variance of log2-ratios (Y axis) from all technical replicates that was calcu-lated by using a sliding window of 1.5, moving 0.4 at each step along the range of average expression log2-intensities A (X axis).
Page 7 of 12(page number not for citation purposes)

BMC Genomics 2006, 7:35 http://www.biomedcentral.com/1471-2164/7/35
MethodsTissue samplesProstate, kidney and breast tumor samples were obtainedfrom freshly-frozen tissue collections maintained by Insti-tuto Nacional de Câncer, Rio de Janeiro (prostate adeno-carcinomas, renal cell carcinomas) and Unidade deGenética e Patologia Moleculares, Hospital do DivinoEspírito Santo, Portugal (breast adenocarcinomas). Allsamples were collected between 1999 and 2002 withinformed consent from patients submitted to surgery, andwere snap-frozen in liquid nitrogen within 10 min fromresection. All samples were examined by a pathologist ateach Institution, and, in the case of prostate, hematoxylin/eosin stained micro-sections obtained from each side ofthe frozen blocks were used to grossly delimit the spatialdistribution of the tumor mass. If necessary, tissue blockswere further dissected to warrant that at least 70% of thesection used for RNA extraction was composed of malig-nant cells. Macro-dissected tumor samples were returnedto liquid nitrogen until use.
RNA isolationTotal RNA was isolated with TRIzol (Invitrogene) usingthe protocol recommended by the manufacturer. For eachtissue, aliquots of RNA isolated from 5 patient sampleswere pooled, in order to minimize the effect of biologicaldiversity within each set of tissue samples, as well as to cir-
cumvent the problem of limited amounts of RNA availa-ble from each individual tumor sample. A reference RNApool (RefPool) was assembled by combining equalamounts of RNA from each one of the three tumor tissues.The amount and quality of each RNA sample was verifiedon an Agilent 2100 Bioanalyser.
Target labeling and hybridizationRNA samples were labeled with either Cy3- or Cy5-labeled nucleotides (CyScribe first-strand cDNA labelingkit, Amersham Biosciences, Piscataway, NJ), using 10 µgof DNAse-treated RNA and a mixture of oligo-dT and 9-mer random oligonucleotides.
For the indirect hybridizations, Cy5-labeled cDNA targetsderived from RNA of each tissue were co-hybridized toeither a fixed amount (100 pmol) of a 27-mer 5'-end Cy3-labeled reference oligonucleotide (RefOligo; 5'-CATGAT-TACGAATTCGAGCTCGGTACC-3', Sigma Aldrich Inc.),or to Cy3-labeled cDNA targets from the reference RNApool (RefPool) labeled as described above with CyScribefirst-strand cDNA labeling kit (Amersham Biosciences,Piscataway, NJ). The 27-mer RefOligo has no sequencesimilarity to any human expressed sequence available inGenBank. For RefOligo and RefPool, two replicate hybrid-izations were performed for each tissue. For direct hybrid-izations, fluorescently-labeled targets derived from each
Correlation between direct and reconstructed ratiosFigure 5Correlation between direct and reconstructed ratios. Ratio plots from Kidney vs. Breast comparisons are shown. Upper panels: scatter plots between direct ratios and each of the three reconstructed ratios (RefOligo, RefPool, One-Color). Lower panels: scatter plots between the reconstructed ratios. Ratio plots for the remaining tissue comparisons are shown as supplementary material [see Additional file 2]. In all cases, only ratios from spots with intensity values 2 SD above the average slide background were used.
Page 8 of 12(page number not for citation purposes)

BMC Genomics 2006, 7:35 http://www.biomedcentral.com/1471-2164/7/35
test tissue sample were combined pair-wise. A replicatehybridization with dye-reversal was performed for eachpair of tissues.
Targets were evaporated in a Speedvac, resuspended inhybridization solution (50% formamide, 25% AmershamMicroarray Hybridization Buffer V.2, 25% H2O) andmanually hybridized for 16 h at 42°C to microarray slidescontaining 4,608 different cDNA probes, each spotted induplicate on either half of the slide. A detailed descriptionof the spotted cDNA microarray platform used is pre-sented elsewhere [25]. Following hybridization, slideswere washed (1.0× SSC, 0.2% SDS 10 min. at 55°C, 0.1×SSC, 0.2% SDS 10 min. at 55°C, 0.1× SSC, 0.2% SDS 10min. at 55°C, 0.1× SSC 1 min. at RT, 0.1× SSC 1 min atRT, dH2O 10 sec. at RT) and dried with a N2 stream. Proc-essed slides were scanned with a PMT setting of 700 V(GenIII Scanner – Amersham Biosciences) and back-ground-subtracted artifact-removed median intensities ofboth Cy3 and Cy5 emissions were extracted for each spotfrom raw images using ArrayVision V.7.2 software (Imag-ing Research Inc., Ontario, Canada).
Data normalization, filtering and averaging of replicatesTo correct for systematic biases on the data originatedfrom small differences in the labeling and/or detectionefficiencies between the fluorescent dyes, both direct andreconstructed expression ratios were logged (base 2) andnormalized using a locally weighted linear regression(LOWESS) algorithm [2,26] implemented as scripts writ-ten in R language [27]. Unless indicated, only spots whosebackground-subtracted intensities measured in bothchannels were 2 standard deviations above the local back-ground (defined for each sub-array by a set of plant cDNAnegative control probes) were considered in the analysis.For indirect ratio reconstructions, LOWESS normalizationwas performed in the M vs. A space, where:
and
A = log2 [test sample 1(cy5)]/2 + log2 [test sample 2(cy5)]/2
As there were 2 technical replicates for each indirecthybridization, and each cDNA probe was deposited induplicate in each slide, 8 possible reconstructed expres-sion ratio values could be generated for a given cDNAprobe: K1L/B1L, K1R/B1R, K1L/B2L, K1R/B2R, K2L/B1L,K2R/B1R, K2L/B2L and K2R/B2R, where K and B denoteKidney and Breast for example, 1 and 2 denote differenthybridizations and R and L denote the right and left spotsets from each slide, respectively. Final ratio values wasobtained by taking the median value of all 8 reconstructedratios for each cDNA probe, for RefOligo, RefPool andOne-Color comparisons.
For direct hybridizations, LOWESS normalization wasperformed by combining log2 ratios from dye-swap repli-cate experiments as described in [26]. For direct hybridi-zations, LOWESS normalization was performed in the Mvs. A space where:
Mdir = 0.5 * log2(cy5/cy3 * cy3'/cy5') =
= 0.5 * log2(sample 1 (cy5)/sample2(cy3) * sample1(cy3')/sample 2(cy5'))
and
A = 0.25 * log2(Samaple 1(cy3) * sample 1(cy5) * sample2(cy3) * sample 2(cy5))
Raw and processed data files from direct and indirecthybridizations are available at author's website [28].
Mtest sample 1 cy5 reference cy3
test sample 2 rec = log( )/ ( )
2 (( )/ ( )cy5 reference cy3
Table 2: Correlation coefficient analysis between direct and reconstructed expression ratios. Only ratios from spots with intensity values 2 SD above the average slide background were used to calculate Pearson's correlations or Spearman's rank-correlations. The number of intensity values used in each correlation analysis is shown (n). All Pearson correlation values were statistically significant (p-value for rejecting Ho: r = 0 << 10-5).
Kidney vs. Breast Prostate vs. Breast Prostate vs. Kidney
Pearson Spearman n Pearson Spearman n Pearson Spearman n
Direct vs. RefOligo
0.47 0.45 672 0.56 0.53 671 0.26 0.22 464
Direct vs. RefPool
0.48 0.43 643 0.58 0.57 632 0.31 0.19 445
Direct vs. One-Color
0.45 0.42 669 0.53 0.49 671 0.28 0.25 464
Page 9 of 12(page number not for citation purposes)

BMC Genomics 2006, 7:35 http://www.biomedcentral.com/1471-2164/7/35
Statistical analysesPrecision of intra-slide replicates from direct or recon-structed ratios was estimated by calculating, for each tis-sue comparison, the average coefficient of variance (CV)of the two replicated spots representing the same cDNAthat are present in the microarrays. Final average intra-slide CV +/- SD from RefOligo or RefPool was calculatedfrom the average intra-slide CV of each method measuredin each tissue comparison. Average inter-slide CV was esti-mated by calculating the average CV of reconstructedratios measured across the same spots in different slides.
To evaluate the variance of expression log2-ratios recon-structed from RefOligo or RefPool along the range ofexpression intensities, MA-plots were generated for eachhybridization method (for each tissue comparison) usingM and A values calculated from all replicates as definedabove. For this analysis, the 2 SD intensity filter was notapplied to access the variance on the entire range of inten-
sities. Next, a sliding window of 1.5, moving 0.4 at eachstep, was used to calculate the variance of reconstructedratios M along the range of expression intensities A (Xaxis). These analyses were performed using scripts writtenin R [29]. The R scripts used in all analyses described inthe present work are available at author's website [28].
To evaluate the accuracy of expression ratios reconstructedfrom RefOligo, RefPool and One-Color measurements, aset of genes differentially expressed between each pair oftissues based on the direct hybridizations was identified,and was defined as the gold-standard set. Genes that weredifferentially expressed in the pair-wise tissue compari-sons were selected with the statistical approach describedin [22]. In short, the HTself method classifies an expres-sion ratio as significant or not according to an experimen-tally derived intensity-dependent fold-change cutoff [22].These cutoffs are obtained from experiments where fluo-rescent targets derived from the same RNA and labeled
Comparison of genes identified as differentially expressed in direct and reconstructed ratiosFigure 6Comparison of genes identified as differentially expressed in direct and reconstructed ratios. Each of the three pair-wise tissue comparisons is shown at the left, center or right panels as indicated at the top of the figure. Genes identified as differentially expressed by direct and indirect methods were selected based on 95 % credibility intervals (see Methods). Upper panels: genes identified by the RefOligo analysis are compared to those identified in RefPool and Direct analyses, and displayed as unions and intersections using Venn diagrams. Lower panels: genes identified by the One-Color analysis are compared. The total number of genes identified by each method is indicated in parenthesis.
Page 10 of 12(page number not for citation purposes)

BMC Genomics 2006, 7:35 http://www.biomedcentral.com/1471-2164/7/35
with either Cy3 or Cy5 are co-hybridized to the samemicroarray. For direct comparisons we performed twoself-self direct hybridizations for each tissue. Thus, 6 rep-licate ratios for each spotted probe were generated: K1L/K2L, K1R/K2R, P1L/P2L, P1R/P2R, B1L/B2L, B1R/B2R,where K, P and B denote Kidney, Prostate and BreastRNAs, 1 and 2 denote either Cy3 or Cy5 dye labeling, andR and L denote the right and left array sets from each slide,respectively. This procedure yielded the experimental nulldistribution of the differential expression significance testsince, by definition, there is no differential expression inthe self-self dataset (see details in [22]). Concerning theaccuracy of the gold-standard, it should be noted that thisset of genes was selected by applying a statistical approachbased on self-self hybridizations using a single RNAlabeled with both Cy3 and Cy5. Therefore, any compres-sion on the ratios due to systematic dye effects would alsobe present in the ratio cut-offs derived from these self-selfexperiments, thus cancelling out most of the possible biasin selecting the gold-standard set of genes. To derive a nulldistribution for the indirect comparisons, pseudo self-selfratios were reconstructed from replicate RefOligo, RefPooland One-Color data derived from the same RNA obtainedfrom separate arrays. A total of 6 self-self ratios were thusgenerated for each RefOligo, RefPool and One-Color data-set. Next, we created 95% credibility intervals for bothdirect and indirect self-self log2-ratios [see Additional file3]. These intervals were used to classify a given gene as dif-ferentially expressed if its replicate ratios in the pair-wisetissue comparisons were consistently (> 50%) outside thecredibility interval thresholds. To be stringent we consid-ered in this test only genes with more than 4 valid recon-structed ratios for the indirect dataset and only genes withall valid ratios for the direct dataset. Concordance and dis-cordance among gene sets identified by direct and recon-structed ratios were represented as Venn diagrams.
Authors' contributionsEMR and BRP conceived the initial idea, the experimentaldesign, supervised the work, performed statistical analysisand wrote the manuscript. RZNV contributed with theexperimental design and the development of R scripts fordata processing and for the identification of differentiallyexpressed genes using the HTself method. CE helped withnucleic acid isolation and performed all labeling andhybridization experiments. LMV articulated the collectionof tumor samples along with detailed ethical guidelines.SVA contributed to the experimental design and to thewriting of the manuscript and provided the facilities (wetlab and informatics) for execution of the experimentalwork. All authors read and approved the final manuscript.
Additional material
AcknowledgementsThe authors are grateful to Drs. Vitor Carneiro, Victor Santos, Teresa Eloi and Laura de Fez Sayas from Hospital do Divino Espírito Santo, Portugal, and to Drs. Marcello Barcinski and Franz Campos from Instituto Nacional de Câncer, Rio de Janeiro for providing tumor tissues and RNA samples. We thank Dr. Ricardo DeMarco for valuable suggestions and critically read-ing the manuscript. B.R.P. is recipient of a postdoctoral fellowship from Sci-ence and Technology Foundation, Portugal. This work was mostly supported by a grant from Fundação de Amparo a Pesquisa do Estado de São Paulo, Brasil (FAPESP) to S.V.A. Additional resources were provided by a grant from Luso-American Foundation to B.R.P (Ref. L-V-383/2002); and fellowships from Conselho Nacional de Desenvolvimento Científico e Tec-nológico (CNPq) and FAPESP.
References1. Churchill GA: Fundamentals of experimental design for cDNA
microarrays. Nat Genet 2002, 32 Suppl:490-495.2. Quackenbush J: Microarray data normalization and transfor-
mation. Nat Genet 2002, 32 Suppl:496-501.3. Kerr MK, Churchill GA: Experimental design for gene expres-
sion microarrays. Biostatistics 2001, 2:183-201.4. Yang YH, Speed T: Design issues for cDNA microarray experi-
ments. Nat Rev Genet 2002, 3:579-588.5. Neben K, Korshunov A, Benner A, Wrobel G, Hahn M, Kokocinski F,
Golanov A, Joos S, Lichter P: Microarray-based screening formolecular markers in medulloblastoma revealed STK15 asindependent predictor for survival. Cancer Res 2004,64:3103-3111.
6. Kim H, Zhao B, Snesrud EC, Haas BJ, Town CD, Quackenbush J: Useof RNA and genomic DNA references for inferred compari-sons in DNA microarray analyses. Biotechniques 2002,33:924-930.
7. Williams BA, Gwirtz RM, Wold BJ: Genomic DNA as a cohybrid-ization standard for mammalian microarray measurements.Nucleic Acids Res 2004, 32:e81.
8. Gadgil M, Lian W, Gadgil C, Kapur V, Hu WS: An analysis of theuse of genomic DNA as a universal reference in two channelDNA microarrays. BMC Genomics 2005, 6:66.
9. Gorreta F, Barzaghi D, VanMeter AJ, Chandhoke V, Del Giacco L:Development of a new reference standard for microarrayexperiments. Biotechniques 2004, 36:1002-1009.
Additional file 1MA-scatterplots from direct and reconstructed ratios.Click here for file[http://www.biomedcentral.com/content/supplementary/1471-2164-7-35-S1.tiff]
Additional file 2Correlation between direct and reconstructed ratios.Click here for file[http://www.biomedcentral.com/content/supplementary/1471-2164-7-35-S2.tiff]
Additional file 3Determination of intensity-dependent credibility intervals for differ-ential gene expression in direct and indirect comparisons.Click here for file[http://www.biomedcentral.com/content/supplementary/1471-2164-7-35-S3.tiff]
Page 11 of 12(page number not for citation purposes)

BMC Genomics 2006, 7:35 http://www.biomedcentral.com/1471-2164/7/35
Publish with BioMed Central and every scientist can read your work free of charge
"BioMed Central will be the most significant development for disseminating the results of biomedical research in our lifetime."
Sir Paul Nurse, Cancer Research UK
Your research papers will be:
available free of charge to the entire biomedical community
peer reviewed and published immediately upon acceptance
cited in PubMed and archived on PubMed Central
yours — you keep the copyright
Submit your manuscript here:http://www.biomedcentral.com/info/publishing_adv.asp
BioMedcentral
10. Sterrenburg E, Turk R, Boer JM, van Ommen GB, den Dunnen JT: Acommon reference for cDNA microarray hybridizations.Nucleic Acids Res 2002, 30:e116.
11. Alizadeh AA, Eisen MB, Davis RE, Ma C, Lossos IS, Rosenwald A,Boldrick JC, Sabet H, Tran T, Yu X, Powell JI, Yang L, Marti GE, MooreT, Hudson JJ, Lu L, Lewis DB, Tibshirani R, Sherlock G, Chan WC,Greiner TC, Weisenburger DD, Armitage JO, Warnke R, Levy R,Wilson W, Grever MR, Byrd JC, Botstein D, Brown PO, Staudt LM:Distinct types of diffuse large B-cell lymphoma identified bygene expression profiling. Nature 2000, 403:503-511.
12. Perou CM, Sorlie T, Eisen MB, van de Rijn M, Jeffrey SS, Rees CA, Pol-lack JR, Ross DT, Johnsen H, Akslen LA, Fluge O, Pergamenschikov A,Williams C, Zhu SX, Lonning PE, Borresen-Dale AL, Brown PO, Bot-stein D: Molecular portraits of human breast tumours. Nature2000, 406:747-752.
13. van 't Veer LJ, Dai H, van de Vijver MJ, He YD, Hart AA, Mao M,Peterse HL, van der Kooy K, Marton MJ, Witteveen AT, Schreiber GJ,Kerkhoven RM, Roberts C, Linsley PS, Bernards R, Friend SH: Geneexpression profiling predicts clinical outcome of breast can-cer. Nature 2002, 415:530-536.
14. Garber ME, Troyanskaya OG, Schluens K, Petersen S, Thaesler Z,Pacyna-Gengelbach M, van de Rijn M, Rosen GD, Perou CM, WhyteRI, Altman RB, Brown PO, Botstein D, Petersen I: Diversity of geneexpression in adenocarcinoma of the lung. Proc Natl Acad Sci US A 2001, 98:13784-13789.
15. Vinciotti V, Khanin R, D'Alimonte D, Liu X, Cattini N, Hotchkiss G,Bucca G, de Jesus O, Rasaiyaah J, Smith CP, Kellam P, Wit E: Anexperimental evaluation of a loop versus a reference designfor two-channel microarrays. Bioinformatics 2005, 21:492-501.
16. Dobbin K, Simon R: Comparison of microarray designs for classcomparison and class discovery. Bioinformatics 2002,18:1438-1445.
17. Dudley AM, Aach J, Steffen MA, Church GM: Measuring absoluteexpression with microarrays with a calibrated referencesample and an extended signal intensity range. Proc Natl AcadSci USA 2002, 99:7554-7559.
18. Ramaswamy S, Ross KN, Lander ES, Golub TR: A molecular signa-ture of metastasis in primary solid tumors. Nat Genet 2003,33:49-54.
19. Petersen D, Chandramouli GV, Geoghegan J, Hilburn J, Paarlberg J,Kim CH, Munroe D, Gangi L, Han J, Puri R, Staudt L, Weinstein J, Bar-rett JC, Green J, Kawasaki ES: Three microarray platforms: ananalysis of their concordance in profiling gene expression.BMC Genomics 2005, 6:63.
20. Glinsky GV, Berezovska O, Glinskii AB: Microarray analysis iden-tifies a death-from-cancer signature predicting therapy fail-ure in patients with multiple types of cancer. J Clin Invest 2005,115:1503-1521.
21. t Hoen PA, Turk R, Boer JM, Sterrenburg E, de Menezes RX, vanOmmen GJ, den Dunnen JT: Intensity-based analysis of two-col-our microarrays enables efficient and flexible hybridizationdesigns. Nucleic Acids Res 2004, 32:e41.
22. Vencio RZ, Koide T: HTself: Self-Self Based Statistical Test forLow Replication Microarray Studies. DNA Res 2005,12:211-214.
23. Rouse RJ, Espinoza CR, Niedner RH, Hardiman G: Development ofa microarray assay that measures hybridization stoichiome-try in moles. Biotechniques 2004, 36:464-470.
24. Attoor S, Dougherty ER, Chen Y, Bittner ML, Trent JM: Which isbetter for cDNA-microarray-based classification: ratios ordirect intensities. Bioinformatics 2004, 20:2513-2520.
25. Reis EM, Nakaya HI, Louro R, Canavez FC, Flatschart AV, AlmeidaGT, Egidio CM, Paquola AC, Machado AA, Festa F, Yamamoto D,Alvarenga R, da Silva CC, Brito GC, Simon SD, Moreira-Filho CA,Leite KR, Camara-Lopes LH, Campos FS, Gimba E, Vignal GM, El-Dorry H, Sogayar MC, Barcinski MA, da Silva AM, Verjovski-AlmeidaS: Antisense intronic non-coding RNA levels correlate to thedegree of tumor differentiation in prostate cancer. Oncogene2004, 23:6684-6692.
26. Yang YH, Dudoit S, Luu P, Lin DM, Peng V, Ngai J, Speed TP: Nor-malization for cDNA microarray data: a robust compositemethod addressing single and multiple slide systematic vari-ation. Nucleic Acids Res 2002, 30:e15.
27. Koide T, Zaini PA, Moreira LM, Vencio RZ, Matsukuma AY, DurhamAM, Teixeira DC, El-Dorry H, Monteiro PB, da Silva AC, Verjovski-Almeida S, da Silva AM, Gomes SL: DNA microarray-based
genome comparison of a pathogenic and a nonpathogenicstrain of Xylella fastidiosa delineates genes important forbacterial virulence. J Bacteriol 2004, 186:5442-5449.
28. Supplementary information at author's website [http://verjo19.iq.usp.br/gec/en/publications/Peixoto_et_al/]
29. The R Project for Statistical Computing [http://www.r-project.org/]
Page 12 of 12(page number not for citation purposes)