bmc genomics biomed central - core.ac.uk · amit u sinha†1, vivek kaimal†2,4 ... factors that...
TRANSCRIPT

BioMed CentralBMC Genomics
ss
Open AcceResearch articleDissecting microregulation of a master regulatory networkAmit U Sinha†1, Vivek Kaimal†2,4, Jing Chen2,4 and Anil G Jegga*3,4Address: 1Department of Computer Science, University of Cincinnati, Ohio, USA, 2Department of Biomedical Engineering, University of Cincinnati, Ohio, USA, 3Department of Pediatrics, University of Cincinnati College of Medicine, Ohio, USA and 4Division of Biomedical Informatics, Cincinnati Children's Hospital Medical Center, Ohio, USA
Email: Amit U Sinha - [email protected]; Vivek Kaimal - [email protected]; Jing Chen - [email protected]; Anil G Jegga* - [email protected]
* Corresponding author †Equal contributors
AbstractBackground: The master regulator p53 tumor-suppressor protein through coordination ofseveral downstream target genes and upstream transcription factors controls many pathwaysimportant for tumor suppression. While it has been reported that some of the p53's functions aremicroRNA-mediated, it is not known as to how many other microRNAs might contribute to thep53-mediated tumorigenesis.
Results: Here, we use bioinformatics-based integrative approach to identify and prioritize putativep53-regulated miRNAs, and unravel the miRNA-based microregulation of the p53 masterregulatory network. Specifically, we identify putative microRNA regulators of a) transcriptionfactors that are upstream or downstream to p53 and b) p53 interactants. The putative p53-miRsand their targets are prioritized using current knowledge of cancer biology and literature-reportedcancer-miRNAs.
Conclusion: Our predicted p53-miRNA-gene networks strongly suggest that coordinatedtranscriptional and p53-miR mediated networks could be integral to tumorigenesis and theunderlying processes and pathways.
BackgroundThe p53 tumor suppressor gene has been implicated as amaster regulator of genomic stability, cell cycle, apoptosis,and DNA repair [1,2]. p53 is known to act as both tran-scriptional activator and repressor of expression of specificgenes [3]. Studies of p53-mediated repression have shownthat both genes that modulate apoptotic responses andgenes that promote cell cycle progression can be repressedby p53 [4].
MicroRNAs (miRNAs or miRs) are small non-codingRNAs typically of 21–25 nucleotides in length andreported to be involved in the regulation of a variety of
biological processes, including development, cell death,cell proliferation, hematopoiesis and nervous systemspatterning [5]. miRNAs enforce posttranscriptional silenc-ing through the RNA interference pathway [6]. Currentlymore than 450 human miRNAs have been identified anddeposited in the miRBase [7]. Computational predictionof miRNA targets reveal that each human miRNA canpotentially target several genes [8,9], underscoring theimportance of these tiny noncoding RNAs in gene regula-tion.
Several previous studies have identified ten positive ornegative feedback loops in the p53 pathway (reviewed in
Published: 23 February 2008
BMC Genomics 2008, 9:88 doi:10.1186/1471-2164-9-88
Received: 17 September 2007Accepted: 23 February 2008
This article is available from: http://www.biomedcentral.com/1471-2164/9/88
© 2008 Sinha et al; licensee BioMed Central Ltd. This is an Open Access article distributed under the terms of the Creative Commons Attribution License (http://creativecommons.org/licenses/by/2.0), which permits unrestricted use, distribution, and reproduction in any medium, provided the original work is properly cited.
Page 1 of 19(page number not for citation purposes)

BMC Genomics 2008, 9:88 http://www.biomedcentral.com/1471-2164/9/88
[10]). All of these networks or circuits are autoregulatoryin that they are either induced by p53 activity at the tran-scriptional level, transcriptionally repressed by p53 or areregulated by p53-induced proteins [10]. Recently, fiveindependent studies have shown that p53 upregulatesmiR-34a in response to DNA damage leading to cell cyclearrest and apoptosis [11-15]. In light of these reports andbased on the growing evidence that microRNAs them-selves act to either promote cancer or to stop cancer spread[16-19], it is reasonable to conceive that the tumor sup-pressor p53 might be involved in this microRNA-relatednetwork in cancer cells. In support of this, two miRNAs(miR-372 and miR-373) were found to function as onco-genes in human testicular germ cell tumors, probably bynumbing the p53 pathway and thereby allowing tumori-genesis [20]. Yang et al recently suggested that analysis ofmicroRNA regulation in the transcriptional network ofthe p53 gene can reveal relationships between oncogenicmicroRNAs and p53 [21]. We therefore sought to exploreif there are other microRNAs that are components of thep53 regulatory network. In an earlier study (Kaimal andSinha et al., unpublished), scanning the 474 human miR-NAs for putative p53 sites, we identified 143 miRNAs thathave at least one p53 site (using p53MH algorithm [22])and are predicted to target at least one known gene. Wetermed these 143 miRNAs as p53-miRs (Kaimal and Sinhaet al., unpublished). In the current study, apart from cor-relating these putative p53-miRs with the upstream regula-tors and downstream targets of p53, we prioritize ourpredictions using (a) literature reported differentiallyexpressed miRNAs in cancer; (b) miRNAs reported asinduced or repressed following p53 activation [11]; and(c) miRNA targets that are functionally enriched with bio-logical processes like apoptosis, cell cycle.
Results and discussionPrediction of p53-miRs and the target genesA significant fraction of human intergenic miRNAs arereported to possess TSS sites within 2 kb of the pre-miRNA[23]. Although it is accepted that intronic miRNAs aregenerally transcribed along with their host genes [24], TSSpredictions have shown them to lie predominantly in theregion from -2 kb to -6 kb [23]. Hence, we limited oursearch space to 10 kb flanking regions of the miRNAs.Determination of exact pri-miRNA transcript lengthshowever is possible only through experimental work.
We used p53MH [22], an algorithm that identifies p53-responsive genes in the human and mouse genome, toidentify putative p53-binding site within miRNAs (seeMethods). Out of 474 human miRNAs analyzed, 227 hadat least one putative p53 site (and a total of 319 p53 sites;some miRNAs have multiple p53 sites) within their flank-ing regions of 10 kb (Additional File 1). Of the 319 p53sites, 5 sites were overlapping with exonic region and we
did not consider these for further analysis. The 314 p53sites (Additional File 2) occur within 10 kb flankingsequences of 223 miRNAs. We identified two p53 bindingsites in mir-34a; however neither of these corresponds tothe experimental validated p53 site [12] in mir-34a. Thisis because in the current analysis we limit the miRNAflanking sequence search space to 10 kb only while theexperimentally validated p53 site in mir-34a occurs atapproximately 30 kb upstream to mir-34a [12].
To predict target genes of the 223 miRNAs, we used MAMIserver [25], which has compilation of five [8,9,26-28] tar-get prediction algorithms. A recent study showed thatabout 82% of unique miRNA-target pairs are predicted byonly a single algorithm [19]. Therefore, a combination ofpredictions from all algorithms might provide a muchmore comprehensive list of putative miRNA-target pairsthan do any single prediction. 154/223 miRNAs are pre-dicted to target at least one gene while 69/223 have nopredicted targets. The 154 miRNAs mapped to 143 miR-NAs. This is because some of the miRNAs have more thanone predicted hairpin precursor sequences. For examplemir-135a has two predicted hairpin precursors (mir-135a-1 on chromosome 3 and mir-135a-2 on chromosome 12).The targets are however based on mir-135a only. Thus,our final set consists of 143 miRNAs; each of which has atleast one p53 site and is predicted to target at least oneknown gene. We call these 143 miRNAs as p53-miRs.There were 12497 genes predicted as targets of these 143p53-miRs! Assuming that most of these predicted targetsare purely speculative (false positive rate of at least 4 ofthese algorithms was estimated to be 20–30% [29]), wesought to integrate multiple types of data resources andexplore as to what number of p53-miRs could be targetingcancer-related genes.
MicroRNAs associated with p53 upstream and downstream genesTranscriptional networks commonly contain positive-and negative-feedback loops, which provide robustnessand fine-tuning to gene programs [30,31]. Recent studieshave suggested a possible coordinated transcriptional andmiRNA-mediated regulation as a recurrent motif toenhance the robustness of gene regulation in mammaliangenomes [32-35]. It was also reported that miRNAs pre-dominantly target positive regulatory motifs, highly con-nected scaffolds and most downstream networkcomponents such as signaling transcription factors, butless frequently target negative regulatory motifs, commoncomponents of basic cellular machines and mostupstream network components such as ligands [32].Using the p53 master regulatory network as a case study,we investigated the potential crosstalk between the miR-NAs and the p53 transcriptional network itself involvingtranscription factors upstream and downstream to p53. At
Page 2 of 19(page number not for citation purposes)

BMC Genomics 2008, 9:88 http://www.biomedcentral.com/1471-2164/9/88
least four possible scenarios can be envisaged for theupstream regulators (Figures 1A–D) and downstream tar-gets (Figures 1E–H) of p53.
We downloaded the known upstream transcription factor(TF) regulators and downstream target TFs of p53 fromthe p53 KnowledgeBase [36]. For the 23 upstream regula-tors and 48 downstream TFs of p53, we then extracted theputative miRNA regulators using MAMI server [25], whichhas compilation of five target prediction algorithms[8,9,26-28]. Since each of these five miRNA target predic-tion approaches generates an unpredictable number of
false positives (an estimate puts it at 20–30% [29]), weintersected the results to identify the genes commonlypredicted by at least two of the five algorithms [8,9,26-28](see Table 1; for a complete list, see Additional file 3).Although it is important to confirm that a miRNA is not apotential regulatory miRNA of a specific gene by using dif-ferent bioinformatics algorithms [37], there are severalexperimentally validated microRNA target genes that arenot predicted by more than one of the current predictionalgorithms. For instance the experimentally validated mir-21-PTEN miRNA-target pair [38] is not predicted by anyof the five algorithms (listed in Methods and used inMAMI compilation). To overcome this, we also checkedthe TarBase [39] which has experimentally validatedmicroRNA targets irrespective of the computational pre-dictions.
Based on MAMI predictions, a total of 242 different miR-NAs suppress p53 regulators or targets. Of these, 115(~48%) are p53-miRs (Figure 2A). Some of the p53-miRs(32/143; Figure 2B) are found to exclusively target p53upstream activators (13/143 p53-miRs; Figure 3A) orrepressors (5/143; Figure 3B) or downstream activators(9/143; Figure 3C) or repressors (5/143; Figure 3D). Inter-estingly, many of these miRNAs have been reported as dif-ferentially expressed in various cancerous tissues or celllines (see last column in Table 1).
miRNAs upstream and downstream to p53: coherent and incoherent circuitsIf there is a common upstream TF that regulates both themiRNA and its target gene, ideally, the transcription of themiRNAs and their targets should be oppositely regulatedby this common upstream TF. For example, p53 which isknown to repress the transcription of IER3 [40] maysimultaneously activate the transcription of mir-142 (pre-dicted to target IER3) that may further inhibit IER3 post-transcriptionally. This is a coherent model for alldownstream targets that are repressed by p53. Previousgenome-scale studies have in fact shown that predictedtarget transcripts of several tissue-specific miRNAs tend tobe expressed at a lower level in tissues where the miRNAsare expressed [41,42].
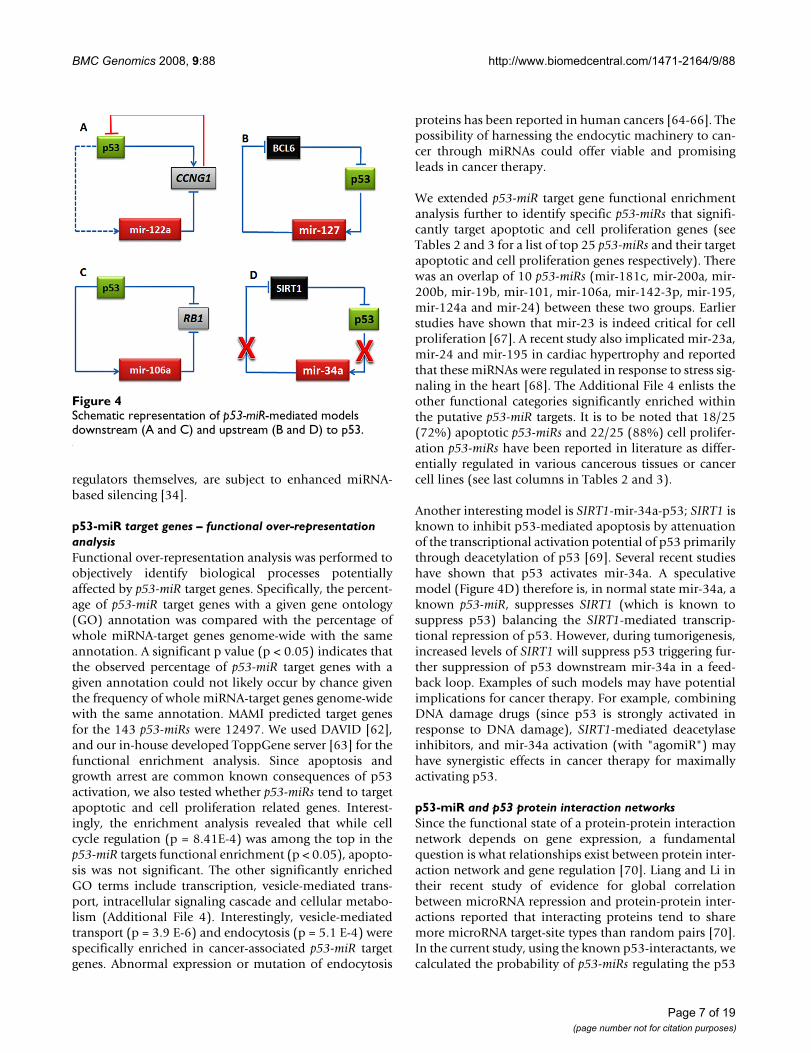
Alternately, a common TF (p53 in this case) can activate adownstream target gene and also a miRNA which thensuppresses the downstream target gene. A well knownexample is the experimentally confirmed microregulatorynetwork comprising miR-17-5p and E2F1 – both of whichare transcriptionally activated by c-Myc in human cells[43]. We report a similar example of mir-122a, a putativep53-miR suppressing CCNG1, a downstream target of p53.CCNG1 is a known transcriptional target (activator) of thep53 tumor suppressor protein [44] and it was recentlyreported that mir-122a (predicted as p53-miR in our anal-
Four possible scenarios for the upstream regulators (A-D) and downstream targets (E-H) of p53Figure 1Four possible scenarios for the upstream regulators (A-D) and downstream targets (E-H) of p53. For the downstream coherent models, the p53 action on downstream target gene and miRNA is opposite (F and H). In case of downstream incoherent models (E and G), the p53 action on downstream target gene and miRNA is same. There may be a sequential gap in the activation time of the target gene and miRNA facil-itating maintenance of steady states.
Page 3 of 19(page number not for citation purposes)

BMC Genomics 2008, 9:88 http://www.biomedcentral.com/1471-2164/9/88
ysis) has an inverse correlation with cyclin G1 expressionin primary liver carcinomas [45]. In other words, p53 acti-vates CCNG1 and also mir-122a which in turn suppressesCCNG1. This is an incoherent model. Adding to this com-plexity further, it is also reported that CCNG1 negativelyregulates the stabilization of p53 in a possible negativefeedback loop [46] (Figure 4A). Thus, the regulatory net-work wherein p53 activates a downstream target and amiR (which target the downstream target) simultaneouslyappears "inefficient". However, feedforward loops havethe potential to provide temporal control, because expres-sion of the ultimate target may depend on the accumula-
tion of adequate levels of master regulator and thesecondary regulators [47]. Therefore, if we consider asequential gap in the activation time of the target genesand the miRNA, then this downstream p53-gene and p53-miR regulation appears coherent. Feedforward loops mayprovide a form of multistep ultrasensitivity [48], as anydeviation from the p53's steady state would drive thedownstream targets and miRNA (p53-miR) away fromtheir steady states in the same direction. p53-miRs couldtherefore tune the production rate of the downstream p53target gene opposite to the direction of p53's fluctuation.Such noise buffering probably helps to maintain target
Table 1: p53-miRs (microRNAs which have a conserved p53 binding site in their flanking 10 kb genomic sequence) which putatively target known transcription factors that are either upstream or downstream to p53 network (based on p53 knowledge base [36]) (A: activator; R: Repressor; U: uncharacterized). Only those targets are shown that are predicted as miRNA targets by 2 or more than two algorithms. miRNAs that are in bold represent miRNAs induced more than 1.5 fold (p < 0.05) after p53 activation [11]. The last column indicates whether a miRNA has been reported in literature as differentially expressed in cancer or cancer cell lines.
miRNA TF TargetScanS miRanda microT miRtarget picTar Relation to p53 (Interaction Type) [20]
Differentially expressed in cancer
hsa-miR-183 EGR1 + + - + - Upstream (A) Yeshsa-miR-26b HOXA5 + - - + - Upstream (A) Yeshsa-miR-96 HOXA5 + - - + - Upstream (A) Yeshsa-miR-376a HOXA5 - + + - - Upstream (A) Nohsa-miR-376b HOXA5 - + + - - Upstream (A) Nohsa-miR-181c FOS + + - + - Upstream (A/R) Yeshsa-miR-222 FOS + + - - - Upstream (A/R) Yeshsa-miR-101 FOS + + - + - Upstream (A/R) Nohsa-miR-10a BCL6 + + - - - Upstream (R) Yeshsa-miR-124a KLF4 + - - + - Upstream (R) Yeshsa-miR-148a KLF4 + + + + - Upstream (R) Yeshsa-miR-32 KLF4 + + - + - Upstream (R) Yeshsa-miR-34a KLF4 + - - + - Upstream (R) Yeshsa-miR-7 KLF4 + - - + - Upstream (R) Yeshsa-miR-508 KLF4 - + - + - Upstream (R) Nohsa-miR-155 CEBPB + + + - - Upstream (U) Yeshsa-miR-27a BTG2 + + + - - Downstream (A) Yeshsa-miR-32 BTG2 + + - - - Downstream (A) Yeshsa-miR-27a CCNG1 + - - + - Downstream (A) Yeshsa-miR-122a CCNG1 + + - + - Downstream (A) Yeshsa-miR-33 EEF1A1 + + - - - Downstream (A) Nohsa-miR-502 GADD45A - + - + - Downstream (A) Nohsa-miR-19b IGFBP3 + + - - - Downstream (A) Yeshsa-miR-29a MMP2 - + - + - Downstream (A) Yeshsa-miR-29b MMP2 - + - + - Downstream (A) Yeshsa-miR-29c MMP2 - + - + - Downstream (A) Yeshsa-miR-128b PLK2 + + - + + Downstream (A) Yeshsa-miR-200b PLK2 + + - + - Downstream (A) Yeshsa-miR-200c PLK2 + + - + - Downstream (A) Yeshsa-miR-27a PLK2 + + - + + Downstream (A) Yeshsa-miR-30b SERPINE1 + + + + - Downstream (A) Yeshsa-miR-30c SERPINE1 + + + + - Downstream (A) Yeshsa-miR-34a SERPINE1 + - - + - Downstream (A) Yeshsa-miR-192 RB1 + + - - - Downstream (A/R) Yeshsa-miR-200b ANLN + + - - - Downstream (R) Yeshsa-miR-200c ANLN + + - - - Downstream (R) Yeshsa-miR-142-3p IER3 - + - + - Downstream (R) Yeshsa-miR-124a SCD + - - + - Downstream (R) Yes
Page 4 of 19(page number not for citation purposes)

BMC Genomics 2008, 9:88 http://www.biomedcentral.com/1471-2164/9/88
Page 5 of 19(page number not for citation purposes)
Heat map representation of p53-miRs and their target genes relative to the p53 networkFigure 2Heat map representation of p53-miRs and their target genes relative to the p53 network. 115 p53-miRs are predicted to target transcription factors that are either p53 regulators (upstream) or p53 targets (downstream) (A).

BMC Genomics 2008, 9:88 http://www.biomedcentral.com/1471-2164/9/88
protein homeostasis and ensures more uniform expres-sion [49] of the p53 downstream target genes within a cellpopulation. Additionally, since the level of p53-miRdefines the p53 downstream target's translation rate, theircoexpression may allow p53-miR to fine-tune the down-stream target's steady state. Thus, p53-miRs acting on p53downstream targets could significantly shorten theresponse delay, leading to more effective noise buffering,as well as precise definition and maintenance of steadystates.
We found two entries in TarBase (database of experimen-tally validated microRNA target genes) [39] which are rel-evant and could be interesting to p53 network (a) mir-127targeting BCL6 [50], an upstream repressor of p53 [51](Figure 4B) and (b) mir-106a reported to suppress RB1[52]. A previous study has shown that mir-106a is inducedmore than 1.5 fold (p < 0.05) after p53 activation [11].p53 is known to suppress RB1 transcription through inhi-bition of the basal promoter activity [53]. Additionally,posttranscriptionally, p53 might suppress RB1 further byinducing mir-106a, a known suppressor of RB1 (Figure4C).
As a master transcriptional regulator, p53 is also known totrans-repress genes including those affecting signalingpathways such as cell proliferation, apoptosis andcytoskeleton organization [54,55]. Although, the mecha-nism(s) of repression is often unclear and may not bedependent on site-specific DNA-binding activity [54-57],the responsiveness of some genes to p53 can be indirect inthat target genes (transactivated or transrepressed) mightbe other transcription factors [55,58] or microRNAs,which then modulate downstream responses to p53 sign-aling. We, therefore, hypothesize that in case of p53downstream targets, the foremost activated positive feed-back in a coupled feedback circuit can rapidly induce the"on" state transition of the signaling system (p53 activat-ing downstream target genes), and that then anotherdelayed positive feedback (p53 suppressing miRNAs thattarget p53 downstream target genes) robustly maintainsthis "on" state. Finally, the most delayed negative feed-back reinstates the system in the original "off " state, pre-venting any further excessive response specific to theapplied stimulus.
Loss of p53 expression in some tumors has also beenshown to occur through inhibition of transcription of thep53 gene itself [51,59,60]. For example, mir-31, one ofthe p53-miRs predicted to suppress the upstream activator(YY1) of p53, is reported to be upregulated in colorectalcancer [61]. Shalgi et al recently reported that the extent ofmiR mediated regulation varies extensively among differ-ent genes, some of which, especially those who serve as
Heat map representation of p53-miRs and their target genes relative to the p53 networkFigure 3Heat map representation of p53-miRs and their target genes relative to the p53 network. Panels A, B, C and D depict p53-miRs exclusively targeting p53 upstream activators, upstream repressors, downstream activators and downstream repres-sors respectively along with their predicted target transcrip-tion factors.
Page 6 of 19(page number not for citation purposes)
BMC Genomics 2008, 9:88 http://www.biomedcentral.com/1471-2164/9/88
regulators themselves, are subject to enhanced miRNA-based silencing [34].
p53-miR target genes – functional over-representation analysisFunctional over-representation analysis was performed toobjectively identify biological processes potentiallyaffected by p53-miR target genes. Specifically, the percent-age of p53-miR target genes with a given gene ontology(GO) annotation was compared with the percentage ofwhole miRNA-target genes genome-wide with the sameannotation. A significant p value (p < 0.05) indicates thatthe observed percentage of p53-miR target genes with agiven annotation could not likely occur by chance giventhe frequency of whole miRNA-target genes genome-widewith the same annotation. MAMI predicted target genesfor the 143 p53-miRs were 12497. We used DAVID [62],and our in-house developed ToppGene server [63] for thefunctional enrichment analysis. Since apoptosis andgrowth arrest are common known consequences of p53activation, we also tested whether p53-miRs tend to targetapoptotic and cell proliferation related genes. Interest-ingly, the enrichment analysis revealed that while cellcycle regulation (p = 8.41E-4) was among the top in thep53-miR targets functional enrichment (p < 0.05), apopto-sis was not significant. The other significantly enrichedGO terms include transcription, vesicle-mediated trans-port, intracellular signaling cascade and cellular metabo-lism (Additional File 4). Interestingly, vesicle-mediatedtransport (p = 3.9 E-6) and endocytosis (p = 5.1 E-4) werespecifically enriched in cancer-associated p53-miR targetgenes. Abnormal expression or mutation of endocytosis
proteins has been reported in human cancers [64-66]. Thepossibility of harnessing the endocytic machinery to can-cer through miRNAs could offer viable and promisingleads in cancer therapy.
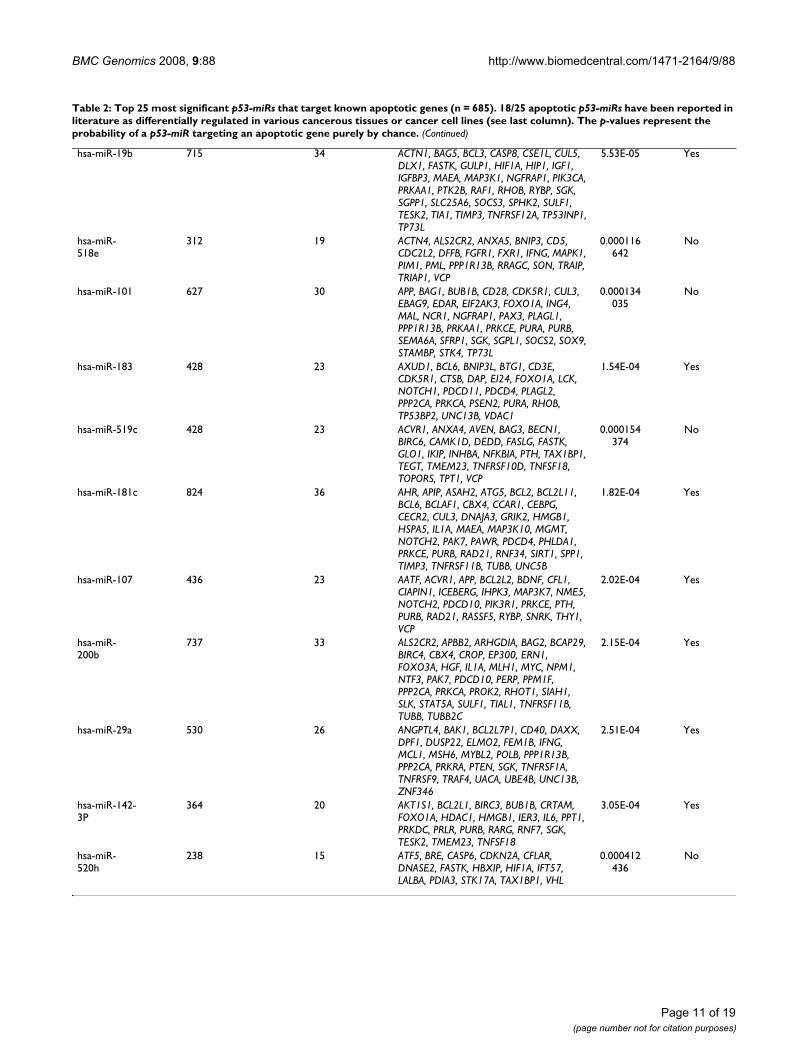
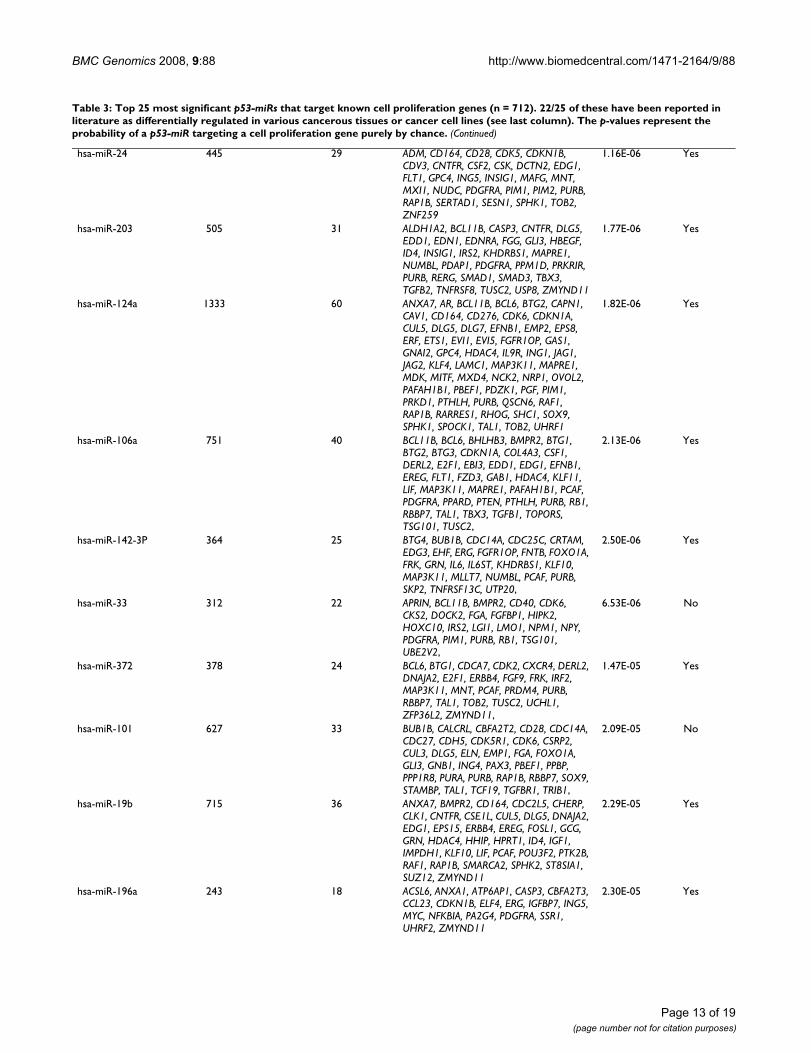
We extended p53-miR target gene functional enrichmentanalysis further to identify specific p53-miRs that signifi-cantly target apoptotic and cell proliferation genes (seeTables 2 and 3 for a list of top 25 p53-miRs and their targetapoptotic and cell proliferation genes respectively). Therewas an overlap of 10 p53-miRs (mir-181c, mir-200a, mir-200b, mir-19b, mir-101, mir-106a, mir-142-3p, mir-195,mir-124a and mir-24) between these two groups. Earlierstudies have shown that mir-23 is indeed critical for cellproliferation [67]. A recent study also implicated mir-23a,mir-24 and mir-195 in cardiac hypertrophy and reportedthat these miRNAs were regulated in response to stress sig-naling in the heart [68]. The Additional File 4 enlists theother functional categories significantly enriched withinthe putative p53-miR targets. It is to be noted that 18/25(72%) apoptotic p53-miRs and 22/25 (88%) cell prolifer-ation p53-miRs have been reported in literature as differ-entially regulated in various cancerous tissues or cancercell lines (see last columns in Tables 2 and 3).
Another interesting model is SIRT1-mir-34a-p53; SIRT1 isknown to inhibit p53-mediated apoptosis by attenuationof the transcriptional activation potential of p53 primarilythrough deacetylation of p53 [69]. Several recent studieshave shown that p53 activates mir-34a. A speculativemodel (Figure 4D) therefore is, in normal state mir-34a, aknown p53-miR, suppresses SIRT1 (which is known tosuppress p53) balancing the SIRT1-mediated transcrip-tional repression of p53. However, during tumorigenesis,increased levels of SIRT1 will suppress p53 triggering fur-ther suppression of p53 downstream mir-34a in a feed-back loop. Examples of such models may have potentialimplications for cancer therapy. For example, combiningDNA damage drugs (since p53 is strongly activated inresponse to DNA damage), SIRT1-mediated deacetylaseinhibitors, and mir-34a activation (with "agomiR") mayhave synergistic effects in cancer therapy for maximallyactivating p53.
p53-miR and p53 protein interaction networksSince the functional state of a protein-protein interactionnetwork depends on gene expression, a fundamentalquestion is what relationships exist between protein inter-action network and gene regulation [70]. Liang and Li intheir recent study of evidence for global correlationbetween microRNA repression and protein-protein inter-actions reported that interacting proteins tend to sharemore microRNA target-site types than random pairs [70].In the current study, using the known p53-interactants, wecalculated the probability of p53-miRs regulating the p53
Schematic representation of p53-miR-mediated models downstream (A and C) and upstream (B and D) to p53Figure 4Schematic representation of p53-miR-mediated models downstream (A and C) and upstream (B and D) to p53.
Page 7 of 19(page number not for citation purposes)

BMC Genomics 2008, 9:88 http://www.biomedcentral.com/1471-2164/9/88
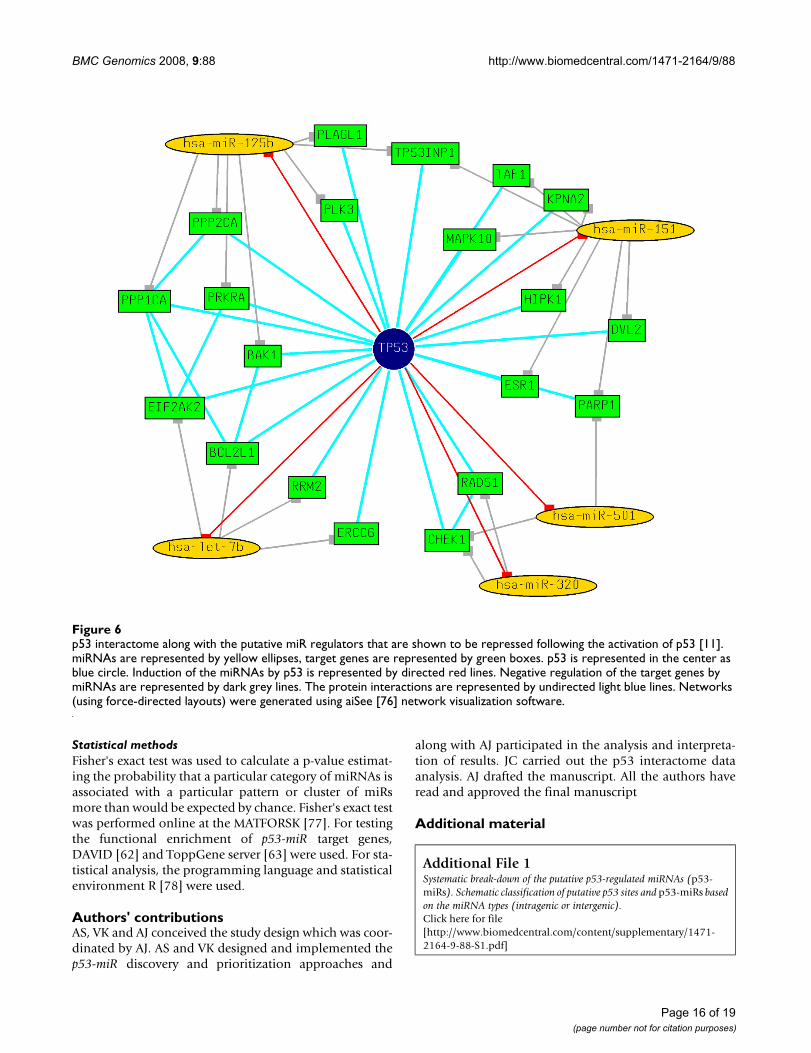
interactants. We mined the BioGRID database [71], andcurrently there are 141 known interactants of p53. Sur-prisingly, 114 of these 141 p53-interactants were pre-dicted to be regulated by p53-miRs and were shown to bestatistically significant (p = 1.41e-21) (see Additional File5 for details). Using the known data of miRNAs inducedor repressed following p53 activation [11], we further fil-tered the p53-miRs that could be associated with the p53interactome. Figures 5 and 6 show the p53 interactomealong with the putative p53-miR regulators that are shownto be induced or repressed [11] respectively following theactivation of p53.
ConclusionIn conclusion, our bioinformatic-based analysis yieldedseveral putative regulatory circuits that involve p53 andmicroRNAs along with their target genes. Although thesepredicted networks need to be experimentally validated toascertain a bona fide regulatory relationship, it is stillexciting to speculate that these p53-miRs may be critical totumorigenesis through their regulation of the p53 masterregulatory network. We strongly believe that our resultssubstantially expand the hitherto little known repertoireof miRNAs in p53 regulatory network. It can be antici-pated that further characterization of our predicted p53-miRs and their target genes will improve our understand-ing of the underlying processes of cancer, tumorigenesis,and ultimately impact response to therapy.
MethodsHuman miRNA genomic analysisThe human miRNAs analyzed in this study (474 in total)were derived from the miRNA registry release 9.2 (May2007; Genome Assembly NCBI-36 [72]). The genomicsequences, including 10 kb flanking sequences 5' and 3'for each of the miRNAs, were downloaded using TableBrowser from the UCSC Golden Path [73].
Out of a total 474 human miRNAs analyzed, 100 microR-NAs were part of a cluster (2 or more miRNAs occurringtogether on the genome). In all, there were 100 miRNAsorganized into 37 clusters (see Additional Files 6 and 7 fordetails). The cluster definitions were based on thosedefined by Yu et al [74]. The nearest neighboring geneinformation (gene name, distance from the nearestmiRNA, orientation with respect to the host or neighbor-ing gene) for each of the miRNA was extracted from thepublic database RefFlat provided by the UCSC GoldenPath [73].
Screening miRNA genomic sequences for p53 binding sitesThe genomic sequences (10 kb flanking region, 5' and 3')of the 474 human miRNAs were scanned for potentialp53-binding motifs using the p53MH algorithm [22].Briefly, p53-binds to a specific sequence comprised of two
decamers (RRRCWWGYYY) separated by 0–13 bp [75].Nearly all established human response element sequences(REs) have at least one mismatch in this degeneratesequence [55]. The computer algorithm p53MH identifiespotential p53-binding sites by a scoring system based onthe percentage of similarity to a consensus sequence. Weset the parameter conditions to include the followingrestrictions: (i) a p53MH score ≥ 85%, and (ii) the spacerbetween the 10-bp motifs is ≤ 4 bp. Although p53 isknown to bind to sites with a spacer as high as 13 bp [75],for the current analysis we considered 4 bp spacer as themaximum limit because majority of the validated p53binding sites are reported to have a spacer less than 4 bp(see Additional Files 1 and 2 for the putative p53-miR dis-tribution).
p53 upstream and downstream activators and repressorsThe group of TFs that act upstream to p53 either as activa-tors or repressors and the p53 target genes involved in spe-cific p53 downstream effects (activator or repressor) weredownloaded from the compiled and curated dataset of thep53 knowledge-base [36]. We also mined the BioGRIDdatabase [71] for all known p53 interactants.
p53-miR targetsWe used MAMI [25] to download the predicted targets forthe p53-miRs. MAMI has a compilation of target predic-tion tools, DIANA-microT (version 5/05) [26], miRanda(version 4/06) [8], TargetScanS (version 4/05) [9], miR-target (version 3/06) [28] and PicTar (version 5/05) [27].The miRNAs are based on miRs registry version 8.1 (5/06).
Functional annotation and prioritization of p53-miRsTo annotate the p53-miRs and to identify/prioritize p53-miRs that might have potential implications in tumorigen-esis we performed functional enrichment analysis andalso intersected our predictions with cancer-associatedmiRNAs. Specifically, we used (a) literature reported dif-ferentially expressed miRNAs in cancer; (b) miRNAsreported as induced or repressed following p53 activation;and (c) miRNA targets that were functionally enrichedwith biological processes like apoptosis, cell cycle, etc.
Known tumor suppressor and oncogenic microRNAsWe manually compiled the list of microRNAs that werereported in literature as differentially expressed (up- ordown-regulated) in various cancers in human (AdditionalFile 8).
miRNAs induced or repressed following p53 activationWe intersected our predicted p53-miRs with the data fromTarasov et al [11] to identify potential p53 induced/repressed miRNAs. Following a genome-wide screen formicroRNAs regulated by the transcription factor encoded
Page 8 of 19(page number not for citation purposes)

BMC Genomics 2008, 9:88 http://www.biomedcentral.com/1471-2164/9/88
Table 2: Top 25 most significant p53-miRs that target known apoptotic genes (n = 685). 18/25 apoptotic p53-miRs have been reported in literature as differentially regulated in various cancerous tissues or cancer cell lines (see last column). The p-values represent the probability of a p53-miR targeting an apoptotic gene purely by chance.
miRNA Total Number of Predicted Targets
Apoptosis Genes (n = 685) Genes p-value Cancer miRNA
hsa-miR-30b 1054 64 ABL1, ACTN1, ACVR1, ARHGEF6, ATG5, BCL2, BCL2L11, BCL6, BDNF, BECN1, BIRC6, BNIP3L, CASP3, CLCF1, CUL2, EBAG9, ELMO1, FOXO3A, FXR1, GAS2, GCLC, HSPA5, IFI16, IFNG, IHPK3, IL1A, JAG2, MAGI3, MAL, MAP3K5, MNT, MYBL2, NOTCH1, PAK1, PAK7, PAWR, PAX3, PDCD10, PDCD5, PIK3R2, PLAGL2, PPP2R1B, PRLR, PSEN2, RARG, RASA1, RHOB, RNF7, SGK3, SIAH2, SIRT1, SMNDC1, SNCA, SOCS3, SON, SOX9, TESK2, TIA1, TIMP3, TNFSF9, TP53INP1, UNC5C, UNC5D, VCP
1.50E-12 Yes
hsa-miR-30c 1040 61 ABL1, ACTN1, ACVR1, ARHGEF6, ATG5, BCL2, BCL2L11, BCL6, BDNF, BECN1, BNIP3L, CASP3, CLCF1, CUL2, EBAG9, ELMO1, FOXO3A, FXR1, GAS2, GCLC, HSPA5, IFI16, IHPK3, IL1A, JAG2, MAGI3, MAL, MAP3K5, MNT, MYBL2, NOTCH1, PAK1, PAK7, PAWR, PAX3, PDCD10, PDCD5, PIK3R2, PLAGL2, PPP2R1B, PRLR, PSEN2, RARG, RASA1, RHOB, RNF7, SGK3, SIAH2, SIRT1, SMNDC1, SNCA, SOCS3, SON, SOX9, TIA1, TIMP3, TNFSF9, TP53INP1, UNC5C, UNC5D, VCP
2.16E-11 Yes
hsa-miR-30d 1034 57 ABL1, ACTN1, ACVR1, ARHGEF6, ATG5, BCL2, BCL2L11, BCL6, BDNF, BECN1, BNIP3L, CARD8, CASP3, CLCF1, CUL2, EBAG9, ELMO1, FOXO3A, FXR1, GAS2, HSPA5, IFI16, IHPK3, IL1A, IL31RA, JAG2, MAL, MAP3K5, MNT, MYBL2, NOTCH1, PAK1, PAK7, PAWR, PAX3, PDCD10, PIK3R2, PLAGL2, PPP2R1B, PRLR, PSEN2, RARG, RASA1, RHOB, SGK3, SIAH2, SIRT1, SMNDC1, SOCS3, SON, SOX9, TIMP3, TNFSF9, TP53INP1, UNC5C, UNC5D, VCP
1.03E-09 Yes
hsa-miR-495 389 31 ACTN2, AKT1, ATOH1, AVEN, BAG4, CARD6, CASP2, CTNNAL1, DDX41, DIDO1, EEF1E1, EIF2AK2, FOXO3A, IAPP, IGFBP3, MTL5, NOTCH2, OPA1, PAWR, PDCD10, PHLPP, PIM2, RTN4, SGK, SMNDC1, SOX9, STK17A, TGFB2, TMEM23, TNFRSF9, TXNDC5
2.17E-09 No
hsa-miR-106a 751 44 ACIN1, ACVR1B, APBB2, APP, BCL2L11, BCL2L2, BCL6, BIRC4, BNIP2, BTG1, CASP6, CASP8, CDKN1A, CFLAR, COL4A3, DAPK2, DEDD, DNASE2, DNM2, E2F1, EGLN3, EP300, FASTK, FOXL2, HIF1A, INHBA, LALBA, MAP3K5, PAK7, PIK3R1, PLAGL2, PPARD, PPP2CA, PTEN, PURB, SQSTM1, STK17B, TAOK2, TAX1BP1, TIMP3, TMEM23, TNFRSF21, TOPORS, TP53INP1
1.54E-08 Yes
Page 9 of 19(page number not for citation purposes)

BMC Genomics 2008, 9:88 http://www.biomedcentral.com/1471-2164/9/88
hsa-miR-124a 1333 62 ACTN4, AHR, AKT1S1, ANXA5, APBB2, APPBP1, ARHGDIA, AXIN1, BAG3, BCL2L11, BCL6, BECN1, CCL2, CDKN1A, CUL5, DHCR24, DNM2, DPF2, ERN1, FXR1, GAS2, GLO1, HIP1, HTATIP2, IHPK2, JAG2, LITAF, MITF, NR4A1, PDCD10, PDCD6, PEA15, PEG3, PIK3CA, PIM1, PLAGL2, PPM1F, PPP1R13L, PROC, PURB, RAF1, RARG, RASSF5, RFFL, RHOT1, RIPK2, RP6-213H19.1, SEMA6A, SFRP5, SGK, SGPL1, SGPP1, SH3KBP1, SIRT1, SLK, SOX9, SPHK1, STK4, TMEM23, TP53INP1, TRIB3, ZDHHC16
1.06E-07 Yes
hsa-miR-20b 751 42 ACIN1, ACVR1B, APBB2, APP, BCL2L11, BCL2L2, BCL6, BIRC4, BNIP2, BTG1, CASP6, CASP8, CASP8AP2, CDKN1A, COL4A3, DAPK2, DEDD, DNASE2, DNM2, E2F1, EGLN3, EP300, FASTK, FOXL2, HIF1A, IKIP, LALBA, MAP3K5, PAK7, PIK3R1, PLAGL2, PPP1R13L, PPP2CA, PTEN, PURB, SQSTM1, TAOK2, TIMP3, TMEM23, TNFRSF21, TOPORS, TP53INP1,
1.18E-07 No
hsa-miR-24 445 30 ACVR1B, ADAMTSL4, ADORA1, BCL2L11, BCL2L12, BCL2L2, CARD10, CD28, CDK5, CIDEA, CLCF1, CSF2, FASLG, IHPK2, LALBA, MNT, PAK7, PCSK9, PEA15, PIM1, PIM2, PURB, RARG, RASA1, SPHK1, TMEM23, TNFRSF19, TNFRSF1B, TP53INP1, TRAF7,
1.66E-07 Yes
hsa-miR-27a 579 32 ANXA5, AXUD1, BAG2, BIRC4, BNIP3L, BTG1, CDK5R1, CFDP1, EI24, FAIM, FOXO1A, HIP1, IFNG, IGF1, IL10, JMY, MITF, MLH1, NEK6, NGFR, NGFRAP1, PHB, PLAGL2, PRKRA, RASSF5, RYBP, SAP30BP, SEMA6A, SERINC3, SFRP1, TMEM23, ZNF443
4.86E-06 Yes
hsa-miR-195 766 38 ALOX12, APP, ARHGDIA, BAG5, BCAP29, BCL2, BCL2L2, BDNF, BFAR, CARD10, CBX4, CD28, CD40, CDK5R1, CUL2, DEDD, MNT, PAK7, PCBP4, PDCD4, PIM1, PLAGL1, PPP2R1A, PTH, PURB, RAD9A, RAF1, RASSF5, RIPK2, RYBP, SEMA6A, SGK, SIAH1, SNCA, SNRK, SON, UBE4B, ZDHHC16,
8.00E-06 Yes
hsa-miR-182 485 28 ACVR1, ARHGDIA, BAG4, BCL2, BCL2L12, BDNF, CFL1, CUL5, ELMO1, EP300, FOXO3A, FXR1, MITF, NCKAP1, NPM1, PIK3R1, PRKCE, RARG, RASA1, RNF130, RRAGA, RTN4, SERPINB2, TMEM23, TOPORS, TP53INP1, UNC5D, ZAK
8.50E-06 No
hsa-miR-153 464 27 ACTN4, ACVR1B, APBB2, APP, ATF5, ATG5, BCL2, CIB1, FOXO1A, GRIK2, IGF1R, LCK, MAP3K7, MITF, POU4F1, PRKAA1, RASA1, RTN4, SGK3, SH3KBP1, SIRT1, SNCA, SOCS2, SPHK2, TESK2, TIAL1, TP53INP1
1.06E-05 Yes
hsa-miR-200a 634 33 APBB2, ATF5, BAG2, CROP, CUL3, FOXO3A, HGF, IL1A, MAL, MAP3K7, MSH2, NME1, PAX3, PDCD4, PERP, PHLPP, PLAGL2, POU4F1, PPP2CA, PRKCE, SEMA6A, SIAH1, SIRT1, SON, STAT5A, STAT5B, TESK2, TGFB2, TIAL1, TP53INP1, TXNL1, UBE4B, UNC5C
1.20E-05 Yes
hsa-miR-141 413 24 ACVR1B, ALB, APBB2, BAG2, BCL10, DCC, EBAG9, FOXO3A, HMGB1, IL1A, NME1, PAK1, PDCD4, PERP, PHLPP, PPP2CA, PTK2B, SIAH1, SMNDC1, SNCA, SON, STAT5A, TGFB2, TP53INP1
3.32E-05 Yes
Table 2: Top 25 most significant p53-miRs that target known apoptotic genes (n = 685). 18/25 apoptotic p53-miRs have been reported in literature as differentially regulated in various cancerous tissues or cancer cell lines (see last column). The p-values represent the probability of a p53-miR targeting an apoptotic gene purely by chance. (Continued)
Page 10 of 19(page number not for citation purposes)
BMC Genomics 2008, 9:88 http://www.biomedcentral.com/1471-2164/9/88
hsa-miR-19b 715 34 ACTN1, BAG5, BCL3, CASP8, CSE1L, CUL5, DLX1, FASTK, GULP1, HIF1A, HIP1, IGF1, IGFBP3, MAEA, MAP3K1, NGFRAP1, PIK3CA, PRKAA1, PTK2B, RAF1, RHOB, RYBP, SGK, SGPP1, SLC25A6, SOCS3, SPHK2, SULF1, TESK2, TIA1, TIMP3, TNFRSF12A, TP53INP1, TP73L
5.53E-05 Yes
hsa-miR-518e
312 19 ACTN4, ALS2CR2, ANXA5, BNIP3, CD5, CDC2L2, DFFB, FGFR1, FXR1, IFNG, MAPK1, PIM1, PML, PPP1R13B, RRAGC, SON, TRAIP, TRIAP1, VCP
0.000116642
No
hsa-miR-101 627 30 APP, BAG1, BUB1B, CD28, CDK5R1, CUL3, EBAG9, EDAR, EIF2AK3, FOXO1A, ING4, MAL, NCR1, NGFRAP1, PAX3, PLAGL1, PPP1R13B, PRKAA1, PRKCE, PURA, PURB, SEMA6A, SFRP1, SGK, SGPL1, SOCS2, SOX9, STAMBP, STK4, TP73L
0.000134035
No
hsa-miR-183 428 23 AXUD1, BCL6, BNIP3L, BTG1, CD3E, CDK5R1, CTSB, DAP, EI24, FOXO1A, LCK, NOTCH1, PDCD11, PDCD4, PLAGL2, PPP2CA, PRKCA, PSEN2, PURA, RHOB, TP53BP2, UNC13B, VDAC1
1.54E-04 Yes
hsa-miR-519c 428 23 ACVR1, ANXA4, AVEN, BAG3, BECN1, BIRC6, CAMK1D, DEDD, FASLG, FASTK, GLO1, IKIP, INHBA, NFKBIA, PTH, TAX1BP1, TEGT, TMEM23, TNFRSF10D, TNFSF18, TOPORS, TPT1, VCP
0.000154374
No
hsa-miR-181c 824 36 AHR, APIP, ASAH2, ATG5, BCL2, BCL2L11, BCL6, BCLAF1, CBX4, CCAR1, CEBPG, CECR2, CUL3, DNAJA3, GRIK2, HMGB1, HSPA5, IL1A, MAEA, MAP3K10, MGMT, NOTCH2, PAK7, PAWR, PDCD4, PHLDA1, PRKCE, PURB, RAD21, RNF34, SIRT1, SPP1, TIMP3, TNFRSF11B, TUBB, UNC5B
1.82E-04 Yes
hsa-miR-107 436 23 AATF, ACVR1, APP, BCL2L2, BDNF, CFL1, CIAPIN1, ICEBERG, IHPK3, MAP3K7, NME5, NOTCH2, PDCD10, PIK3R1, PRKCE, PTH, PURB, RAD21, RASSF5, RYBP, SNRK, THY1, VCP
2.02E-04 Yes
hsa-miR-200b
737 33 ALS2CR2, APBB2, ARHGDIA, BAG2, BCAP29, BIRC4, CBX4, CROP, EP300, ERN1, FOXO3A, HGF, IL1A, MLH1, MYC, NPM1, NTF3, PAK7, PDCD10, PERP, PPM1F, PPP2CA, PRKCA, PROK2, RHOT1, SIAH1, SLK, STAT5A, SULF1, TIAL1, TNFRSF11B, TUBB, TUBB2C
2.15E-04 Yes
hsa-miR-29a 530 26 ANGPTL4, BAK1, BCL2L7P1, CD40, DAXX, DPF1, DUSP22, ELMO2, FEM1B, IFNG, MCL1, MSH6, MYBL2, POLB, PPP1R13B, PPP2CA, PRKRA, PTEN, SGK, TNFRSF1A, TNFRSF9, TRAF4, UACA, UBE4B, UNC13B, ZNF346
2.51E-04 Yes
hsa-miR-142-3P
364 20 AKT1S1, BCL2L1, BIRC3, BUB1B, CRTAM, FOXO1A, HDAC1, HMGB1, IER3, IL6, PPT1, PRKDC, PRLR, PURB, RARG, RNF7, SGK, TESK2, TMEM23, TNFSF18
3.05E-04 Yes
hsa-miR-520h
238 15 ATF5, BRE, CASP6, CDKN2A, CFLAR, DNASE2, FASTK, HBXIP, HIF1A, IFT57, LALBA, PDIA3, STK17A, TAX1BP1, VHL
0.000412436
No
Table 2: Top 25 most significant p53-miRs that target known apoptotic genes (n = 685). 18/25 apoptotic p53-miRs have been reported in literature as differentially regulated in various cancerous tissues or cancer cell lines (see last column). The p-values represent the probability of a p53-miR targeting an apoptotic gene purely by chance. (Continued)
Page 11 of 19(page number not for citation purposes)

BMC Genomics 2008, 9:88 http://www.biomedcentral.com/1471-2164/9/88
Table 3: Top 25 most significant p53-miRs that target known cell proliferation genes (n = 712). 22/25 of these have been reported in literature as differentially regulated in various cancerous tissues or cancer cell lines (see last column). The p-values represent the probability of a p53-miR targeting a cell proliferation gene purely by chance.
miRNA Total Number of Predicted Targets
Cell Proliferation Genes (n = 712)
Genes p-value Cancer miRNA
hsa-miR-23a 656 44 ALDH1A2, BCL11B, CBFA2T2, CBFA2T3, CDC6, CDK5R1, CFDP1, CSE1L, CTNNBIP1, CUL3, CXCL5, ELF4, ELF5, EPS15, GPC4, HDGFRP3, HOXA3, IHH, IL11, IL6R, IRF2, KITLG, LRP5, MAPRE1, MDK, MET, MLLT7, NAP1L1, NOTCH2, NPM1, NR6A1, ODZ1, OPRM1, PRKRIR, PTK2B, RAP1B, SMAD3, SPOCK1, STAT5B, TGFA, TOB2, TRIB1, TUSC2, ZAK
8.42E-10 Yes
hsa-miR-92 614 41 ADM, AGGF1, APRIN, BMPR2, BRCA1, BTG2, CBFA2T3, CDC27, CDK6, CDKN1C, CTNNBIP1, CUL3, CXCL5, DERL2, DLG5, EDG1, EPS8, GDF11, HHIP, IGF1R, INSIG1, IRS2, KLF4, LBX1, MITF, NCK2, NF1, NOTCH1, NOX4, PAFAH1B1, PAX3, PCAF, RAP1B, RBM9, SPHK2, TBX3, TCFL5, TOB1, TOB2, UTP20, ZAK
3.64E-09 Yes
hsa-miR-32 630 39 ADM, AGGF1, APRIN, BMPR2, BTG2, BTLA, CBFA2T3, CDK6, CDKN1C, CHRM5, CTNNBIP1, CUL3, CXCL5, EDD1, EDG1, EPS8, EVI5, GDF11, HHIP, INSIG1, IRS2, KLF4, LBX1, MITF, NCK2, NOTCH1, NOX4, PAFAH1B1, PAX3, PCAF, RAP1B, RBM9, SPHK2, TBX3, TCFL5, TOB1, TOB2, TTK, ZAK
6.67E-08 Yes
hsa-miR-200b 737 42 APRIN, BAP1, BCL11B, BHLHB3, CD274, CDC25B, CNOT8, CNTFR, CTBP2, EDNRA, EPS8, ETS1, EVI5, GAB1, GLI3, HDAC4, HELLS, HGF, IL1A, KHDRBS1, KLF10, KLF4, LAMC1, LRP1, LRPAP1, MAFG, MAPRE1, MXD4, MYC, NCK2, NDN, NPM1, PCAF, POU3F2, PROK2, PTHLH, RAP1B, SESN1, SHC1, STAT5A, SUZ12, TOB1
2.02E-07 Yes
hsa-miR-200c 751 42 APRIN, BAP1, BCL11B, BHLHB3, BIN1, CD274, CNOT8, CNTFR, CTBP2, EDNRA, EPS8, ETS1, EVI5, GAB1, GLI3, GNAT1, HDAC4, HELLS, HGF, KHDRBS1, KLF10, KLF4, LAMC1, LRP1, LRPAP1, MAFG, MAPRE1, MXD4, MYC, NCK2, NDN, NPM1, PCAF, POU3F2, PROK2, PTHLH, RAP1B, SCG2, SESN1, SHC1, STAT5A, TOB1
3.33E-07 Yes
hsa-miR-195 766 42 ALOX12, AXIN2, BAI1, BDNF, BHLHB3, BIN1, BTG2, CBFA2T3, CD164, CD28, CD40, CDC25A, CDC27, CDK5R1, CHEK1, CUL2, DNAJA2, EFNB1, FGF2, FGF7, FOSL1, HDGF, HOXA3, LAMC1, MAPRE1, MNT, MTCP1, NF2, PAFAH1B1, PDAP1, PIM1, POU3F2, PPAP2A, PPM1D, PRDM4, PRKCD, PTHLH, PURB, RAF1, RARRES1, SESN1, SPEG
5.60E-07 Yes
hsa-miR-10a 230 20 BCAR1, BCL6, BDNF, CDK4, CTNNBIP1, FLT1, HDAC4, HOXA3, ID4, IFNAR2, JARID2, KLF11, KLF4, MAPRE1, PAFAH1B1, PURB, SERTAD1, SHC1, TRAIP, ZMYND11
7.09E-07 Yes
hsa-miR-10b 237 20 BCAR1, BCL6, BDNF, CDK4, CNOT8, CTNNBIP1, FLT1, HDAC4, HOXA3, ID4, IFNAR2, JARID2, KLF11, KLF4, MAPRE1, PAFAH1B1, PURB, SHC1, TRAIP, ZMYND11
1.14E-06 Yes
Page 12 of 19(page number not for citation purposes)
BMC Genomics 2008, 9:88 http://www.biomedcentral.com/1471-2164/9/88
hsa-miR-24 445 29 ADM, CD164, CD28, CDK5, CDKN1B, CDV3, CNTFR, CSF2, CSK, DCTN2, EDG1, FLT1, GPC4, ING5, INSIG1, MAFG, MNT, MXI1, NUDC, PDGFRA, PIM1, PIM2, PURB, RAP1B, SERTAD1, SESN1, SPHK1, TOB2, ZNF259
1.16E-06 Yes
hsa-miR-203 505 31 ALDH1A2, BCL11B, CASP3, CNTFR, DLG5, EDD1, EDN1, EDNRA, FGG, GLI3, HBEGF, ID4, INSIG1, IRS2, KHDRBS1, MAPRE1, NUMBL, PDAP1, PDGFRA, PPM1D, PRKRIR, PURB, RERG, SMAD1, SMAD3, TBX3, TGFB2, TNFRSF8, TUSC2, USP8, ZMYND11
1.77E-06 Yes
hsa-miR-124a 1333 60 ANXA7, AR, BCL11B, BCL6, BTG2, CAPN1, CAV1, CD164, CD276, CDK6, CDKN1A, CUL5, DLG5, DLG7, EFNB1, EMP2, EPS8, ERF, ETS1, EVI1, EVI5, FGFR1OP, GAS1, GNAI2, GPC4, HDAC4, IL9R, ING1, JAG1, JAG2, KLF4, LAMC1, MAP3K11, MAPRE1, MDK, MITF, MXD4, NCK2, NRP1, OVOL2, PAFAH1B1, PBEF1, PDZK1, PGF, PIM1, PRKD1, PTHLH, PURB, QSCN6, RAF1, RAP1B, RARRES1, RHOG, SHC1, SOX9, SPHK1, SPOCK1, TAL1, TOB2, UHRF1
1.82E-06 Yes
hsa-miR-106a 751 40 BCL11B, BCL6, BHLHB3, BMPR2, BTG1, BTG2, BTG3, CDKN1A, COL4A3, CSF1, DERL2, E2F1, EBI3, EDD1, EDG1, EFNB1, EREG, FLT1, FZD3, GAB1, HDAC4, KLF11, LIF, MAP3K11, MAPRE1, PAFAH1B1, PCAF, PDGFRA, PPARD, PTEN, PTHLH, PURB, RB1, RBBP7, TAL1, TBX3, TGFB1, TOPORS, TSG101, TUSC2,
2.13E-06 Yes
hsa-miR-142-3P 364 25 BTG4, BUB1B, CDC14A, CDC25C, CRTAM, EDG3, EHF, ERG, FGFR1OP, FNTB, FOXO1A, FRK, GRN, IL6, IL6ST, KHDRBS1, KLF10, MAP3K11, MLLT7, NUMBL, PCAF, PURB, SKP2, TNFRSF13C, UTP20,
2.50E-06 Yes
hsa-miR-33 312 22 APRIN, BCL11B, BMPR2, CD40, CDK6, CKS2, DOCK2, FGA, FGFBP1, HIPK2, HOXC10, IRS2, LGI1, LMO1, NPM1, NPY, PDGFRA, PIM1, PURB, RB1, TSG101, UBE2V2,
6.53E-06 No
hsa-miR-372 378 24 BCL6, BTG1, CDCA7, CDK2, CXCR4, DERL2, DNAJA2, E2F1, ERBB4, FGF9, FRK, IRF2, MAP3K11, MNT, PCAF, PRDM4, PURB, RBBP7, TAL1, TOB2, TUSC2, UCHL1, ZFP36L2, ZMYND11,
1.47E-05 Yes
hsa-miR-101 627 33 BUB1B, CALCRL, CBFA2T2, CD28, CDC14A, CDC27, CDH5, CDK5R1, CDK6, CSRP2, CUL3, DLG5, ELN, EMP1, FGA, FOXO1A, GLI3, GNB1, ING4, PAX3, PBEF1, PPBP, PPP1R8, PURA, PURB, RAP1B, RBBP7, SOX9, STAMBP, TAL1, TCF19, TGFBR1, TRIB1,
2.09E-05 No
hsa-miR-19b 715 36 ANXA7, BMPR2, CD164, CDC2L5, CHERP, CLK1, CNTFR, CSE1L, CUL5, DLG5, DNAJA2, EDG1, EPS15, ERBB4, EREG, FOSL1, GCG, GRN, HDAC4, HHIP, HPRT1, ID4, IGF1, IMPDH1, KLF10, LIF, PCAF, POU3F2, PTK2B, RAF1, RAP1B, SMARCA2, SPHK2, ST8SIA1, SUZ12, ZMYND11
2.29E-05 Yes
hsa-miR-196a 243 18 ACSL6, ANXA1, ATP6AP1, CASP3, CBFA2T3, CCL23, CDKN1B, ELF4, ERG, IGFBP7, ING5, MYC, NFKBIA, PA2G4, PDGFRA, SSR1, UHRF2, ZMYND11
2.30E-05 Yes
Table 3: Top 25 most significant p53-miRs that target known cell proliferation genes (n = 712). 22/25 of these have been reported in literature as differentially regulated in various cancerous tissues or cancer cell lines (see last column). The p-values represent the probability of a p53-miR targeting a cell proliferation gene purely by chance. (Continued)
Page 13 of 19(page number not for citation purposes)

BMC Genomics 2008, 9:88 http://www.biomedcentral.com/1471-2164/9/88
hsa-miR-26b 633 33 ADM, BCL6, BTG1, CDC27, CDC2L5, CDK6, CKS2, DLG5, DNAJA2, ENPEP, EPS15, ERBB4, HGF, HIPK2, HOXD13, IGF1, IL6, JAG1, KLF10, KLF4, LIF, MITF, MXI1, PAWR, PBEF1, PDGFRA, PIM1, PRKCD, PRKCQ, PTEN, SMAD1, SMAD4, TOB1,
2.52E-05 Yes
hsa-miR-196b 245 18 ACSL6, ANXA1, ATP6AP1, CBFA2T3, CCL23, CDKN1B, ELF4, ERG, FOXN1, IGFBP7, ING5, MYC, NF2, NFKBIA, PA2G4, PDGFRA, SSR1, ZMYND11
2.57E-05 Yes
hsa-miR-9 737 36 ARHGEF2, BCL6, BIN1, BTG2, CBFA2T2, CNTFR, COL18A1, CUL4A, CXCR4, EDD1, ERG, ETS1, FGF5, FOXO1A, HDAC4, HES1, ID4, INSIG1, KITLG, LEPRE1, LIFR, NAP1L1, NOTCH2, NOX4, NRP1, ODZ1, PDGFC, PMP22, POU3F2, PPARD, RAP1B, RBM9, SHC1, TBC1D8, TGFBI, UHRF1
4.29E-05 Yes
hsa-miR-29b 541 29 BAX, BCL11B, CAV2, CD40, CDC7, CREG1, DUSP22, EPS15, FRAT2, FSCN1, GAB1, HDAC4, INSIG1, JARID2, LAMC1, MAFG, NASP, PDGFB, PDGFC, PINX1, PMP22, PPM1D, PRKRA, PTEN, SETDB1, SMARCA2, SPEG, TNFRSF9, UHRF2
4.71E-05 Yes
hsa-miR-200a 634 32 APRIN, ATP8A2, BAP1, BIN1, CD274, CDC14A, CDC25A, CDC25B, CDC2L5, CDK6, CSF3, CTBP2, CTNNB1, CUL3, FLT1, GAB1, HDAC4, HGF, IL1A, IRS2, JAG1, NME1, NRP1, PAX3, PBEF1, POU3F2, PRKD1, SCG2, STAT4, STAT5A, STAT5B, TGFB2
6.15E-05 Yes
hsa-miR-34a 666 33 AREG, ARX, BCL11B, BCL6, CBFA2T3, CD28, CD3E, CDC25A, CSF1R, EFNB1, ENPP7, FOSL1, GFER, GNAI2, IL6R, JAG1, KITLG, KLF4, LGI1, MET, MOV10L1, NOTCH1, NOTCH2, NUMBL, PDGFRA, PGF, PRKD1, PURB, SPEG, TGFBI, TOB2, TOPORS, UHRF2
6.76E-05 Yes
hsa-miR-181c 824 38 ABI1, ADAMTS1, ADM, ARHGEF2, BCL6, BMPR2, CALCRL, CBFA2T2, CBFA2T3, CKS1B, CUL3, EDG1, EPS15, ERF, ERG, ETS1, FLT1, IL1A, IRS2, LIF, LMO1, NOTCH2, NR6A1, PAFAH1B1, PAWR, PCAF, PDAP1, PDGFRA, PRDM4, PRKCD, PURB, RAP1B, RBBP7, TGFBI, TGFBR1, TGFBR2, USP8, VIP
8.89E-05 Yes
Table 3: Top 25 most significant p53-miRs that target known cell proliferation genes (n = 712). 22/25 of these have been reported in literature as differentially regulated in various cancerous tissues or cancer cell lines (see last column). The p-values represent the probability of a p53-miR targeting a cell proliferation gene purely by chance. (Continued)
Page 14 of 19(page number not for citation purposes)

BMC Genomics 2008, 9:88 http://www.biomedcentral.com/1471-2164/9/88
by the p53 tumor suppressor gene, the authors reportedthat after p53-activation the abundance of thirty-fourmiRNAs was significantly increased, whereas sixteen miR-NAs were suppressed [11].
p53-miR target genes – Functional enrichmentFunctional over-representation analysis was performed toobjectively identify biological processes potentiallyaffected by p53-miR target genes. Specifically, the percent-age of p53-miR target genes with a given gene ontology(GO) or pathway annotation was compared with the per-centage of all miRNA-target genes genome-wide with thesame annotation. A significant p value (p < 0.05) indicatesthat the observed percentage of p53-miR target genes witha given annotation could not likely occur by chance given
the frequency of miRNA-target genes genome-wide withthe same annotation. For functional enrichment analysis,we used DAVID [62] and ToppGene [63].
p53-miR and p53-interactant gene networksp53-miR and p53-interactant gene networks were gener-ated using aiSee [76] with force-directed layouts. The GDL(Graphics Description Language) files, generated by alocally-implemented JAVA GDL library, were used asinput to aiSee to create SVG (Scalable Vector Graphics)network graphs. The p53-related interactions were down-loaded from BioGRID [71].
p53 interactome along with the putative miR regulators that are shown to be induced following the activation of p53 [11]Figure 5p53 interactome along with the putative miR regulators that are shown to be induced following the activation of p53 [11]. miR-NAs are represented by yellow ellipses, target genes are represented by green boxes. p53 is represented in the center as blue circle. Induction of the miRNAs by p53 is represented by directed red lines. Negative regulation of the target genes by miRNAs are represented by dark grey lines. The protein interactions are represented by undirected light blue lines. Networks (using force-directed layouts) were generated using aiSee [76] network visualization software.
Page 15 of 19(page number not for citation purposes)
BMC Genomics 2008, 9:88 http://www.biomedcentral.com/1471-2164/9/88
Statistical methodsFisher's exact test was used to calculate a p-value estimat-ing the probability that a particular category of miRNAs isassociated with a particular pattern or cluster of miRsmore than would be expected by chance. Fisher's exact testwas performed online at the MATFORSK [77]. For testingthe functional enrichment of p53-miR target genes,DAVID [62] and ToppGene server [63] were used. For sta-tistical analysis, the programming language and statisticalenvironment R [78] were used.
Authors' contributionsAS, VK and AJ conceived the study design which was coor-dinated by AJ. AS and VK designed and implemented thep53-miR discovery and prioritization approaches and
along with AJ participated in the analysis and interpreta-tion of results. JC carried out the p53 interactome dataanalysis. AJ drafted the manuscript. All the authors haveread and approved the final manuscript
Additional material
Additional File 1Systematic break-down of the putative p53-regulated miRNAs (p53-miRs). Schematic classification of putative p53 sites and p53-miRs based on the miRNA types (intragenic or intergenic).Click here for file[http://www.biomedcentral.com/content/supplementary/1471-2164-9-88-S1.pdf]
p53 interactome along with the putative miR regulators that are shown to be repressed following the activation of p53 [11]Figure 6p53 interactome along with the putative miR regulators that are shown to be repressed following the activation of p53 [11]. miRNAs are represented by yellow ellipses, target genes are represented by green boxes. p53 is represented in the center as blue circle. Induction of the miRNAs by p53 is represented by directed red lines. Negative regulation of the target genes by miRNAs are represented by dark grey lines. The protein interactions are represented by undirected light blue lines. Networks (using force-directed layouts) were generated using aiSee [76] network visualization software.
Page 16 of 19(page number not for citation purposes)
BMC Genomics 2008, 9:88 http://www.biomedcentral.com/1471-2164/9/88
AcknowledgementsThis study was supported by the State of Ohio Computational Medicine Center (ODD TECH 04–042) and NCI UO1 CA84291-07 (Mouse Models of Human Cancer Consortium). The authors also acknowledge the support of Drs. Bruce Aronow (Division of Biomedical Informatics, Cincinnati Chil-dren's Hospital Medical Center) and Raj Bhatnagar (Department of Com-puter Science, University of Cincinnati).
References1. Heinrichs S, Deppert W: Apoptosis or growth arrest: modula-
tion of the cellular response to p53 by proliferative signals.Oncogene 2003, 22(4):555-571.
2. Sionov RV, Haupt Y: The cellular response to p53: the decisionbetween life and death. Oncogene 1999, 18(45):6145-6157.
3. Dickins RA, Hemann MT, Zilfou JT, Simpson DR, Ibarra I, Hannon GJ,Lowe SW: Probing tumor phenotypes using stable and regu-lated synthetic microRNA precursors. Nat Genet 2005,37(11):1289-1295.
4. Spurgers KB, Gold DL, Coombes KR, Bohnenstiehl NL, Mullins B,Meyn RE, Logothetis CJ, McDonnell TJ: Identification of cell cycleregulatory genes as principal targets of p53-mediated tran-scriptional repression. J Biol Chem 2006, 281(35):25134-25142.
5. Ambros V: MicroRNA pathways in flies and worms: growth,death, fat, stress, and timing. Cell 2003, 113(6):673-676.
6. Bartel DP: MicroRNAs: genomics, biogenesis, mechanism,and function. Cell 2004, 116(2):281-297.
7. Griffiths-Jones S: miRBase: the microRNA sequence database.Methods Mol Biol 2006, 342:129-138.
8. John B, Enright AJ, Aravin A, Tuschl T, Sander C, Marks DS: HumanMicroRNA targets. PLoS Biol 2004, 2(11):e363.
9. Lewis BP, Shih IH, Jones-Rhoades MW, Bartel DP, Burge CB: Predic-tion of mammalian microRNA targets. Cell 2003,115(7):787-798.
10. Harris SL, Levine AJ: The p53 pathway: positive and negativefeedback loops. Oncogene 2005, 24(17):2899-2908.
11. Tarasov V, Jung P, Verdoodt B, Lodygin D, Epanchintsev A, MenssenA, Meister G, Hermeking H: Differential Regulation of microR-NAs by p53 Revealed by Massively Parallel Sequencing: miR-34a is a p53 Target That Induces Apoptosis and G(1)-arrest.Cell Cycle 2007, 6(13):.
12. Chang TC, Wentzel EA, Kent OA, Ramachandran K, Mullendore M,Lee KH, Feldmann G, Yamakuchi M, Ferlito M, Lowenstein CJ, ArkingDE, Beer MA, Maitra A, Mendell JT: Transactivation of miR-34aby p53 Broadly Influences Gene Expression and PromotesApoptosis. Mol Cell 2007, 26(5):745-752.
13. Raver-Shapira N, Marciano E, Meiri E, Spector Y, Rosenfeld N, Mosk-ovits N, Bentwich Z, Oren M: Transcriptional Activation of miR-34a Contributes to p53-Mediated Apoptosis. Mol Cell 2007,26(5):731-743.
14. He L, He X, Lim LP, de Stanchina E, Xuan Z, Liang Y, Xue W, ZenderL, Magnus J, Ridzon D, Jackson AL, Linsley PS, Chen C, Lowe SW,Cleary MA, Hannon GJ: A microRNA component of the p53tumour suppressor network. Nature 2007.
15. Bommer GT, Gerin I, Feng Y, Kaczorowski AJ, Kuick R, Love RE, ZhaiY, Giordano TJ, Qin ZS, Moore BB, Macdougald OA, Cho KR, FearonER: p53-Mediated Activation of miRNA34 Candidate Tumor-Suppressor Genes. Curr Biol 2007.
16. He L, Thomson JM, Hemann MT, Hernando-Monge E, Mu D, Good-son S, Powers S, Cordon-Cardo C, Lowe SW, Hannon GJ, HammondSM: A microRNA polycistron as a potential human oncogene.Nature 2005, 435(7043):828-833.
17. Hammond SM: MicroRNAs as tumor suppressors. Nat Genet2007, 39(5):582-583.
18. Zhang B, Pan X, Cobb GP, Anderson TA: microRNAs as onco-genes and tumor suppressors. Dev Biol 2007, 302(1):1-12.
19. Wu W, Sun M, Zou GM, Chen J: MicroRNA and cancer: Currentstatus and prospective. Int J Cancer 2007, 120(5):953-960.
20. Voorhoeve PM, le Sage C, Schrier M, Gillis AJ, Stoop H, Nagel R, LiuYP, van Duijse J, Drost J, Griekspoor A, Zlotorynski E, Yabuta N, DeVita G, Nojima H, Looijenga LH, Agami R: A genetic screen impli-cates miRNA-372 and miRNA-373 as oncogenes in testiculargerm cell tumors. Cell 2006, 124(6):1169-1181.
21. Yang Y, Tantoso E, Chua GH, Yeo ZX, Ng FS, Wong ST, Chung CW,Li KB: In silico analysis of p53 using the P53 Knowledgebase:mutations, polymorphisms, microRNAs and pathways. In Sil-ico Biol 2007, 7(1):61-75.
Additional File 2Genomic coordinates of putative p53 sites within 10 kb flanking regions of human miRNAs. Chromosome cooridnates (based on Human Mar. 2006 – hg18 – assembly) of putative p53 sites in the flanking 10 kb regions of human microRNAs.Click here for file[http://www.biomedcentral.com/content/supplementary/1471-2164-9-88-S2.pdf]
Additional File 3Putative miRNAs regulating known 23 upstream regulators and 48 down-stream TFs of p53. For the known 23 upstream regulators and 48 down-stream TFs of p53 (based on p53 Knowledgebase; http://p53.bii.a-star.edu.sg), putative miRs regulating them were extracted using MAMI server and the database http://mami.med.harvard.edu/.Click here for file[http://www.biomedcentral.com/content/supplementary/1471-2164-9-88-S3.pdf]
Additional File 4Functional enrichment (based on GO and pathways) in target genes of 143 p53-miRs. Results of functional over-representation analysis, per-formed to objectively identify biological processes potentially affected by p53-miR target genes.Click here for file[http://www.biomedcentral.com/content/supplementary/1471-2164-9-88-S4.pdf]
Additional File 5Details of Fisher's exact test used to test whether p53-miRs tend to target p53-interactants. Fisher's exact test was used to calculate the probability of p53-miRs regulating the p53 interactants (downloaded from the BioG-RID database).Click here for file[http://www.biomedcentral.com/content/supplementary/1471-2164-9-88-S5.pdf]
Additional File 6Systematic break-down of the 474 human miRNAs based on their genomic location. Classification of the known 474 human miRNAs based on their genomic location (intergenic or intragenic/intronic).Click here for file[http://www.biomedcentral.com/content/supplementary/1471-2164-9-88-S6.pdf]
Additional File 7Details of the 474 human miRNAs analyzed. Additional details of genomic locations of the 474 human miRNAs analyzed (whether part of a cluster, i.e., 2 or more miRNAs occurring together on the genome; or located in the intergenic or intragenic/intronic regions of known genes).Click here for file[http://www.biomedcentral.com/content/supplementary/1471-2164-9-88-S7.pdf]
Additional File 8Manually compiled list of miRNAs that are reported in the literature as either up or down regulated in various human cancers or cancer cell lines. This file has a list of miRNAs that are reported in the literature as either up or down regulated in various human cancers or cancer cell lines. These "can-cer-associated" miRNAs were used to prioritize putative p53-miR targets.Click here for file[http://www.biomedcentral.com/content/supplementary/1471-2164-9-88-S8.pdf]
Page 17 of 19(page number not for citation purposes)
BMC Genomics 2008, 9:88 http://www.biomedcentral.com/1471-2164/9/88
22. Hoh J, Jin S, Parrado T, Edington J, Levine AJ, Ott J: The p53MHalgorithm and its application in detecting p53-responsivegenes. Proc Natl Acad Sci U S A 2002, 99(13):8467-8472.
23. Saini HK, Griffiths-Jones S, Enright AJ: Genomic analysis of humanmicroRNA transcripts. Proc Natl Acad Sci U S A 2007,104(45):17719-17724.
24. Rodriguez A, Griffiths-Jones S, Ashurst JL, Bradley A: Identificationof mammalian microRNA host genes and transcriptionunits. Genome Res 2004, 14(10A):1902-1910.
25. MAMI [http://mami.med.harvard.edu/]26. Kiriakidou M, Nelson PT, Kouranov A, Fitziev P, Bouyioukos C,
Mourelatos Z, Hatzigeorgiou A: A combined computational-experimental approach predicts human microRNA targets.Genes Dev 2004, 18(10):1165-1178.
27. Krek A, Grun D, Poy MN, Wolf R, Rosenberg L, Epstein EJ, MacMe-namin P, da Piedade I, Gunsalus KC, Stoffel M, Rajewsky N: Combi-natorial microRNA target predictions. Nat Genet 2005,37(5):495-500.
28. Wang X, Wang X: Systematic identification of microRNA func-tions by combining target prediction and expression profil-ing. Nucleic Acids Res 2006, 34(5):1646-1652.
29. Bentwich I: Prediction and validation of microRNAs and theirtargets. FEBS Lett 2005, 579(26):5904-5910.
30. Arias AM, Hayward P: Filtering transcriptional noise duringdevelopment: concepts and mechanisms. Nat Rev Genet 2006,7(1):34-44.
31. Milo R, Shen-Orr S, Itzkovitz S, Kashtan N, Chklovskii D, Alon U:Network motifs: simple building blocks of complex net-works. Science 2002, 298(5594):824-827.
32. Cui Q, Yu Z, Purisima EO, Wang E: Principles of microRNA reg-ulation of a human cellular signaling network. Mol Syst Biol2006, 2:46.
33. Cui Q, Yu Z, Pan Y, Purisima EO, Wang E: MicroRNAs preferen-tially target the genes with high transcriptional regulationcomplexity. Biochem Biophys Res Commun 2007, 352(3):733-738.
34. Shalgi R, Lieber D, Oren M, Pilpel Y: Global and Local Architec-ture of the Mammalian microRNA-Transcription FactorRegulatory Network. PLoS Comput Biol 2007, 3(7):e131.
35. Tsang J, Zhu J, van Oudenaarden A: MicroRNA-mediated feed-back and feedforward loops are recurrent network motifs inmammals. Mol Cell 2007, 26(5):753-767.
36. Lim YP, Lim TT, Chan YL, Song AC, Yeo BH, Vojtesek B, CoomberD, Rajagopal G, Lane D: The p53 knowledgebase: an integratedinformation resource for p53 research. Oncogene 2007,26(11):1517-1521.
37. Hua Z, Lv Q, Ye W, Wong CK, Cai G, Gu D, Ji Y, Zhao C, Wang J,Yang BB, Zhang Y: MiRNA-Directed Regulation of VEGF andOther Angiogenic Factors under Hypoxia. PLoS ONE 2006,1:e116.
38. Meng F, Henson R, Wehbe-Janek H, Ghoshal K, Jacob ST, Patel T:MicroRNA-21 regulates expression of the PTEN tumor sup-pressor gene in human hepatocellular cancer. Gastroenterology2007, 133(2):647-658.
39. Sethupathy P, Corda B, Hatzigeorgiou AG: TarBase: A compre-hensive database of experimentally supported animal micro-RNA targets. Rna 2006, 12(2):192-197.
40. Im HJ, Pittelkow MR, Kumar R: Divergent regulation of thegrowth-promoting gene IEX-1 by the p53 tumor suppressorand Sp1. J Biol Chem 2002, 277(17):14612-14621.
41. Farh KK, Grimson A, Jan C, Lewis BP, Johnston WK, Lim LP, BurgeCB, Bartel DP: The widespread impact of mammalian MicroR-NAs on mRNA repression and evolution. Science 2005,310(5755):1817-1821.
42. Sood P, Krek A, Zavolan M, Macino G, Rajewsky N: Cell-type-spe-cific signatures of microRNAs on target mRNA expression.Proc Natl Acad Sci U S A 2006, 103(8):2746-2751.
43. O'Donnell KA, Wentzel EA, Zeller KI, Dang CV, Mendell JT: c-Myc-regulated microRNAs modulate E2F1 expression. Nature2005, 435(7043):839-843.
44. Okamoto K, Beach D: Cyclin G is a transcriptional target of thep53 tumor suppressor protein. Embo J 1994, 13(20):4816-4822.
45. Gramantieri L, Ferracin M, Fornari F, Veronese A, Sabbioni S, Liu CG,Calin GA, Giovannini C, Ferrazzi E, Grazi GL, Croce CM, Bolondi L,Negrini M: Cyclin G1 is a target of miR-122a, a microRNA fre-quently down-regulated in human hepatocellular carcinoma.Cancer Res 2007, 67(13):6092-6099.
46. Ohtsuka T, Ryu H, Minamishima YA, Ryo A, Lee SW: Modulation ofp53 and p73 levels by cyclin G: implication of a negative feed-back regulation. Oncogene 2003, 22(11):1678-1687.
47. Lee TI, Rinaldi NJ, Robert F, Odom DT, Bar-Joseph Z, Gerber GK,Hannett NM, Harbison CT, Thompson CM, Simon I, Zeitlinger J, Jen-nings EG, Murray HL, Gordon DB, Ren B, Wyrick JJ, Tagne JB, VolkertTL, Fraenkel E, Gifford DK, Young RA: Transcriptional regulatorynetworks in Saccharomyces cerevisiae. Science 2002,298(5594):799-804.
48. Goldbeter A, Koshland DE Jr.: Ultrasensitivity in biochemicalsystems controlled by covalent modification. Interplaybetween zero-order and multistep effects. J Biol Chem 1984,259(23):14441-14447.
49. Bartel DP, Chen CZ: Micromanagers of gene expression: thepotentially widespread influence of metazoan microRNAs.Nat Rev Genet 2004, 5(5):396-400.
50. Saito Y, Liang G, Egger G, Friedman JM, Chuang JC, Coetzee GA,Jones PA: Specific activation of microRNA-127 with downreg-ulation of the proto-oncogene BCL6 by chromatin-modify-ing drugs in human cancer cells. Cancer Cell 2006, 9(6):435-443.
51. Phan RT, Dalla-Favera R: The BCL6 proto-oncogene suppressesp53 expression in germinal-centre B cells. Nature 2004,432(7017):635-639.
52. Volinia S, Calin GA, Liu CG, Ambs S, Cimmino A, Petrocca F, VisoneR, Iorio M, Roldo C, Ferracin M, Prueitt RL, Yanaihara N, Lanza G,Scarpa A, Vecchione A, Negrini M, Harris CC, Croce CM: A micro-RNA expression signature of human solid tumors definescancer gene targets. Proc Natl Acad Sci U S A 2006,103(7):2257-2261.
53. Shiio Y, Yamamoto T, Yamaguchi N: Negative regulation of Rbexpression by the p53 gene product. Proc Natl Acad Sci U S A1992, 89(12):5206-5210.
54. Ho J, Benchimol S: Transcriptional repression mediated by thep53 tumour suppressor. Cell Death Differ 2003, 10(4):404-408.
55. Menendez D, Inga A, Jordan JJ, Resnick MA: Changing the p53master regulatory network: ELEMENTary, my dear MrWatson. Oncogene 2007, 26(15):2191-2201.
56. Ho JS, Ma W, Mao DY, Benchimol S: p53-Dependent transcrip-tional repression of c-myc is required for G1 cell cycle arrest.Mol Cell Biol 2005, 25(17):7423-7431.
57. Zhai W, Comai L: Repression of RNA polymerase I transcrip-tion by the tumor suppressor p53. Mol Cell Biol 2000,20(16):5930-5938.
58. Xu H, El-Gewely MR: Differentially expressed downstreamgenes in cells with normal or mutated p53. Oncol Res 2003,13(6-10):429-436.
59. Kang JH, Kim SJ, Noh DY, Park IA, Choe KJ, Yoo OJ, Kang HS: Meth-ylation in the p53 promoter is a supplementary route tobreast carcinogenesis: correlation between CpG methyla-tion in the p53 promoter and the mutation of the p53 genein the progression from ductal carcinoma in situ to invasiveductal carcinoma. Lab Invest 2001, 81(4):573-579.
60. Raman V, Martensen SA, Reisman D, Evron E, Odenwald WF, JaffeeE, Marks J, Sukumar S: Compromised HOXA5 function canlimit p53 expression in human breast tumours. Nature 2000,405(6789):974-978.
61. Bandres E, Cubedo E, Agirre X, Malumbres R, Zarate R, Ramirez N,Abajo A, Navarro A, Moreno I, Monzo M, Garcia-Foncillas J: Identi-fication by Real-time PCR of 13 mature microRNAs differen-tially expressed in colorectal cancer and non-tumoraltissues. Mol Cancer 2006, 5:29.
62. Sherman BT, Huang DW, Tan Q, Guo Y, Bour S, Liu D, Stephens R,Baseler MW, Lane HC, Lempicki RA: DAVID Knowledgebase: agene-centered database integrating heterogeneous geneannotation resources to facilitate high-throughput genefunctional analysis. BMC Bioinformatics 2007, 8(1):426.
63. Chen J, Xu H, Aronow BJ, Jegga AG: Improved human diseasecandidate gene prioritization using mouse phenotype. BMCBioinformatics 2007, 8(1):392.
64. Bonaccorsi L, Nosi D, Muratori M, Formigli L, Forti G, Baldi E:Altered endocytosis of epidermal growth factor receptor inandrogen receptor positive prostate cancer cell lines. J MolEndocrinol 2007, 38(1-2):51-66.
65. Floyd S, De Camilli P: Endocytosis proteins and cancer: a poten-tial link? Trends Cell Biol 1998, 8(8):299-301.
Page 18 of 19(page number not for citation purposes)

BMC Genomics 2008, 9:88 http://www.biomedcentral.com/1471-2164/9/88
Publish with BioMed Central and every scientist can read your work free of charge
"BioMed Central will be the most significant development for disseminating the results of biomedical research in our lifetime."
Sir Paul Nurse, Cancer Research UK
Your research papers will be:
available free of charge to the entire biomedical community
peer reviewed and published immediately upon acceptance
cited in PubMed and archived on PubMed Central
yours — you keep the copyright
Submit your manuscript here:http://www.biomedcentral.com/info/publishing_adv.asp
BioMedcentral
66. Polo S, Pece S, Di Fiore PP: Endocytosis and cancer. Curr Opin CellBiol 2004, 16(2):156-161.
67. Kawasaki H, Taira K: Functional analysis of microRNAs duringthe retinoic acid-induced neuronal differentiation of humanNT2 cells. Nucleic Acids Res Suppl 2003:243-244.
68. van Rooij E, Sutherland LB, Liu N, Williams AH, McAnally J, GerardRD, Richardson JA, Olson EN: A signature pattern of stress-responsive microRNAs that can evoke cardiac hypertrophyand heart failure. Proc Natl Acad Sci U S A 2006,103(48):18255-18260.
69. Luo J, Nikolaev AY, Imai S, Chen D, Su F, Shiloh A, Guarente L, GuW: Negative control of p53 by Sir2alpha promotes cell sur-vival under stress. Cell 2001, 107(2):137-148.
70. Liang H, Li WH: MicroRNA regulation of human protein pro-tein interaction network. Rna 2007, 13(9):1402-1408.
71. Stark C, Breitkreutz BJ, Reguly T, Boucher L, Breitkreutz A, Tyers M:BioGRID: a general repository for interaction datasets.Nucleic Acids Res 2006, 34(Database issue):D535-9.
72. Human miRNA registry [ftp://ftp.sanger.ac.uk/pub/mirbase/sequences/CURRENT/genomes/hsa.gff]
73. Kuhn RM, Karolchik D, Zweig AS, Trumbower H, Thomas DJ,Thakkapallayil A, Sugnet CW, Stanke M, Smith KE, Siepel A, Rosen-bloom KR, Rhead B, Raney BJ, Pohl A, Pedersen JS, Hsu F, HinrichsAS, Harte RA, Diekhans M, Clawson H, Bejerano G, Barber GP,Baertsch R, Haussler D, Kent WJ: The UCSC genome browserdatabase: update 2007. Nucleic Acids Res 2007, 35(Databaseissue):D668-73.
74. Yu J, Wang F, Yang GH, Wang FL, Ma YN, Du ZW, Zhang JW:Human microRNA clusters: genomic organization andexpression profile in leukemia cell lines. Biochem Biophys ResCommun 2006, 349(1):59-68.
75. el-Deiry WS, Kern SE, Pietenpol JA, Kinzler KW, Vogelstein B: Defi-nition of a consensus binding site for p53. Nat Genet 1992,1(1):45-49.
76. aiSee [http://www.aisee.com]77. MATFORSK [http://www.langsrud.com/fisher.htm]78. R programming language and statistical environment [http:/
/www.r-project.org]
Page 19 of 19(page number not for citation purposes)