bmc bioinformatics biomed central - gene-quantification.de · biomed central page 1 of 16 (page...
TRANSCRIPT
BioMed CentralBMC Bioinformatics
ss
Open AcceMethodology articleStatistical significance of quantitative PCRYann Karlen1, Alan McNair1, Sébastien Perseguers2, Christian Mazza3 and Nicolas Mermod*1Address: 1Institute of Biotechnology, University of Lausanne, 1015 Lausanne, Switzerland, 2Max-Planck-Institute für Quantenoptik, 85748 Garching, Germany and 3Department of Mathematics, University of Fribourg, CH-1700 Fribourg, Switzerland
Email: Yann Karlen - [email protected]; Alan McNair - [email protected]; Sébastien Perseguers - [email protected]; Christian Mazza - [email protected]; Nicolas Mermod* - [email protected]
* Corresponding author
AbstractBackground: PCR has the potential to detect and precisely quantify specific DNA sequences, butit is not yet often used as a fully quantitative method. A number of data collection and processingstrategies have been described for the implementation of quantitative PCR. However, they can beexperimentally cumbersome, their relative performances have not been evaluated systematically,and they often remain poorly validated statistically and/or experimentally. In this study, weevaluated the performance of known methods, and compared them with newly developed dataprocessing strategies in terms of resolution, precision and robustness.
Results: Our results indicate that simple methods that do not rely on the estimation of theefficiency of the PCR amplification may provide reproducible and sensitive data, but that they donot quantify DNA with precision. Other evaluated methods based on sigmoidal or exponentialcurve fitting were generally of both poor resolution and precision. A statistical analysis of theparameters that influence efficiency indicated that it depends mostly on the selected amplicon andto a lesser extent on the particular biological sample analyzed. Thus, we devised various strategiesbased on individual or averaged efficiency values, which were used to assess the regulatedexpression of several genes in response to a growth factor.
Conclusion: Overall, qPCR data analysis methods differ significantly in their performance, and thisanalysis identifies methods that provide DNA quantification estimates of high precision, robustnessand reliability. These methods allow reliable estimations of relative expression ratio of two-fold orhigher, and our analysis provides an estimation of the number of biological samples that have to beanalyzed to achieve a given precision.
BackgroundQuantitative PCR is used widely to detect and quantifyspecific DNA sequences in scientific fields that range fromfundamental biology to biotechnology and forensic sci-ences. For instance, microarray and other genomic
approaches require fast and reliable validation of smalldifferences in DNA amounts in biological samples withhigh throughput methods such as quantitative PCR. How-ever, there is currently a gap between the analysis of themathematical and statistical basis of quantitative PCR and
Published: 20 April 2007
BMC Bioinformatics 2007, 8:131 doi:10.1186/1471-2105-8-131
Received: 22 September 2006Accepted: 20 April 2007
This article is available from: http://www.biomedcentral.com/1471-2105/8/131
© 2007 Karlen et al; licensee BioMed Central Ltd. This is an Open Access article distributed under the terms of the Creative Commons Attribution License (http://creativecommons.org/licenses/by/2.0), which permits unrestricted use, distribution, and reproduction in any medium, provided the original work is properly cited.
Page 1 of 16(page number not for citation purposes)

BMC Bioinformatics 2007, 8:131 http://www.biomedcentral.com/1471-2105/8/131
its actual implementation by experimental laboratoryusers [1]. While qPCR has been the object of probabilisticmathematical modelling, these methods have not oftenbeen employed for the treatment of actual measurements.Therefore, the validity of the assumptions or simplifica-tions on which these models are based is often unclear. Atthe other extreme, the treatment of laboratory measure-ments is often fairly empirical in nature, and the validityor reproducibility of the assay remains usually poorlycharacterized from an experimental and/or theoreticalbasis. Thus, practical qPCR methods usually do not allowmathematically validated measurements, nor the determi-nation of the statistical degree of confidence of the derivedconclusions. Consequently qPCR results have been ques-tioned [2,3], with the consequence that semi-quantitativemethods (e.g. end-point PCR) remain widely used.
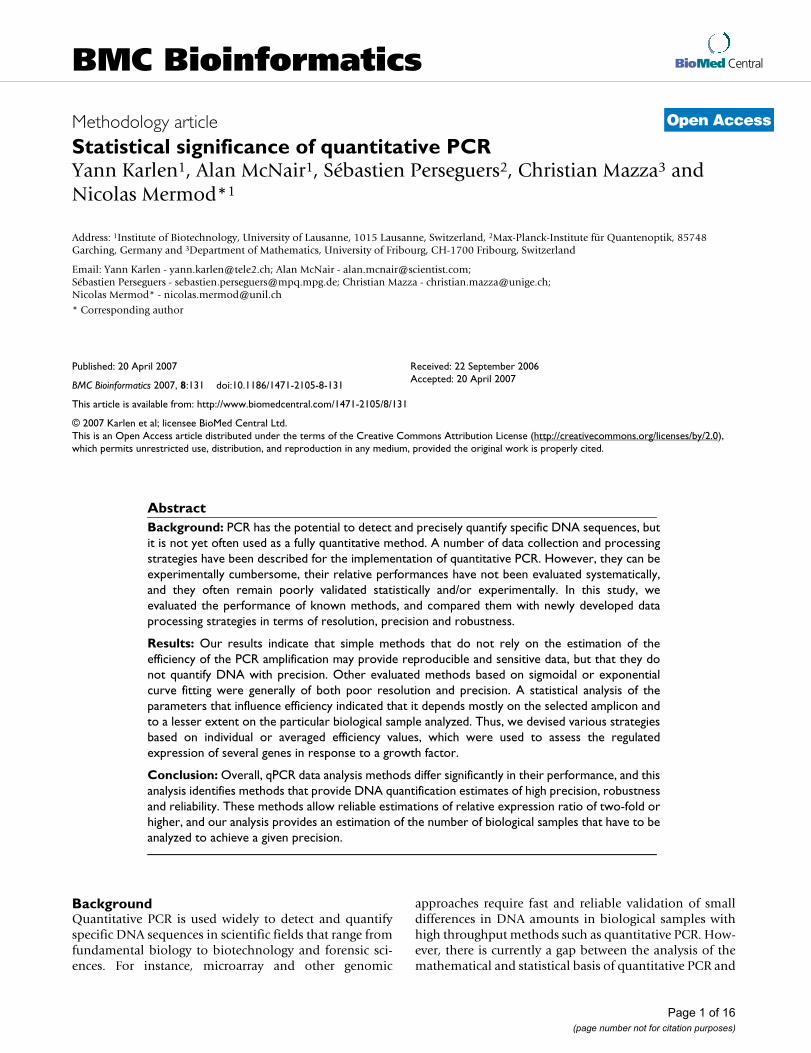
Quantitative PCR amplifications performed in the pres-ence of a DNA-binding fluorescent dye are typically repre-sented in the form of a plot as shown in Figure 1A, wherethe measured fluorescence is represented as a function ofthe PCR cycle number. An assumption that is common toall qPCR methods is that the fluorescence is directly corre-lated to the amount of double stranded DNA present inthe amplification reaction [4]. The amplification curvesare sigmoid shaped and can be split into three phases.Phase I (Figure 1A) represents the lag phase in which noamplification can be detected over the background fluo-rescence and statistical noise. This phase is used to evalu-ate the baseline fluorescent "noise". Phase II correspondsto the early cycles at which detectable fluorescence levelsstart to build up following an exponential behaviourdescribed by the equation inserted in Figure 1A. On a logscale graph, this corresponds to the linear phase, illustrat-ing the exponential dynamic of the PCR amplification(Figure 1B). During the later phase of the reaction, orphase III, the DNA concentration no longer increasesexponentially and it finally reaches a plateau. This is clas-sically attributed to the fact that one or more of the reac-tants become limiting or to the inhibition ofamplification by the accumulation of the PCR productitself [5].
In a perfectly efficient PCR reaction, the amount or copynumber of DNA molecules would double at each cyclebut, due to a number of factors, this is rarely the case inexperimental conditions. Therefore the PCR efficiency canrange between 2, corresponding to the doubling of theDNA concentration at each cycle, to a value of 1, if noamplification occurs (Eq. 1 in methods). Furthermore, theefficiency of DNA amplification is not constant through-out the entire PCR reaction. The efficiency value cannot bemeasured during phase I, but it may be suboptimal duringthe first cycles because of the low concentration of theDNA template and/or sampling errors linked to the sto-
chastic process by which the amplification enzymes mayreplicate only part of the available DNA molecules [6].Quantitative PCR is used under the assumption that thesestochastic processes are the same for all amplifications,which may be statistically correct for N0 values that arelarge enough so that sampling errors become negligible[7]. The efficiency reaches a more or less constant andmaximal value that may approach 2 in the exponentialamplification of phase II, and it finally drops to a value of1 during phase III. This implies that any appropriate ana-lytical method should focus on phase II of the amplifica-tion where the amplification kinetic is exponential.Therefore, the first step in any qPCR analysis is the identi-fication of phase II, which is more conveniently per-formed when data are represented on a log scale (Figure1B).
Another assumption of qPCR is that the quantity of PCRproduct in the exponential phase is proportional to theinitial amount of target DNA. This is exploited by choos-ing arbitrarily a fluorescence threshold with the conditionthat it lies within the exponential phase of the reaction.When fluorescence crosses this value, the cycle is termedthe "Threshold cycle" (Ct) or "Crossing Point", and thehigher the Ct, the smaller the initial amount of DNA. Thisis illustrated in Figure 1B, which displays qPCR amplifica-tions performed on serial dilutions of a cDNA sample.
One of the first and simple methods to process qPCR dataremains a set of calculations based solely on Ct values andis currently known as the ΔCt method [8,9]. However, assuch, this method assumes that all amplification efficien-cies are equal to 2 or at least equal between all reactions.Therefore it does not take into consideration possible var-iations of amplification efficiencies from one sequence orsample to the other. Thus, the ΔCt method may not accu-rately estimate relative DNA amounts from one conditionor one sequence to the other. Consequently, other meth-ods of data processing have been developed to estimatethe efficiency of individual PCR amplifications [10-13].Alternatively, amplification curves can be directly fittedwith sigmoid [14] or exponential functions (Methods sec-tion, Eq. 6 and Eq. 8) in order to derive the originalamount of template DNA (Eq. 7 and Eq. 9).
Methods to estimate amplification efficiency can begrouped in two approaches, both of which rely on the log-linearization of the amplification plot. The most com-monly used method requires generating serial dilutions ofa given sample and performing multiple PCR reactions oneach dilution [10,12]. The Ct values are then plotted ver-sus the log of the dilution (Figure 2A) and a linear regres-sion is performed (Eq. 4) from which the mean efficiencycan be derived (Eq. 5). As stated above, this approach isonly valid if the Ct values are measured from the exponen-
Page 2 of 16(page number not for citation purposes)
BMC Bioinformatics 2007, 8:131 http://www.biomedcentral.com/1471-2105/8/131
tial phase of the PCR reaction and if the efficiency is iden-tical between amplifications.
The other method currently used to measure efficiency isbased on Eq. 3, which associates an efficiency value witheach PCR reaction [12]. This approach has been auto-mated in different programs [15], one of which, termedLinReg PCR [13], was used in this study. LinReg identifythe exponential phase of the reaction by plotting the fluo-rescence on a log scale (Figure 2B). Then a linear regres-sion is performed, leading to the estimation of theefficiency of each PCR reaction.
None of the current qPCR data treatment methods is infact fully assumption-free, and their statistical reliabilityare often poorly characterized. In this study, we evaluatedwhether known mathematical treatment methods mayestimate the amount of DNA in biological samples withprecision and reliability. This led to the development ofnew mathematical data treatment methods, which werealso evaluated. Finally, experimental measurements weresubjected to a statistical analysis, in order to determine thesize of the data set required to achieve significant conclu-sions. Overall, our results indicate that current qPCR dataanalysis methods are often unreliable and/or unprecise.This analysis identifies novels strategies that provide DNA
quantification estimates of high precision, robustness andreliability.
ResultsQuantitative PCR usually relies on the comparison of dis-tinct samples, for instance the comparison of a biologicalsample with a standard curve of known initial concentra-tion, when absolute quantification is required [16], or thecomparison of the expression of a gene to an internalstandard when relative expression is needed. The equationinserted in Figure 1B is used to calculate the ratio of initialtarget DNA of both samples (Eq. 2). The error on the nor-malized ratio depends on the error on the Ct and the erroron the efficiency, and it can be estimated from Eq. 11.However, the range and relative importance of the variouscomponents, and the origin of the error on practical meas-urements remain poorly characterized.
To evaluate the reproducibility of Ct measurements andtheir associated error, we generated a set of 144 PCR reac-tion conditions corresponding to various target DNA,cDNA samples and dilutions (see Additional file 1 for adescription of targeted genes and amplicons). Each ofthese 144 reaction conditions was replicated by perform-ing 4 or 5 independent PCR amplifications. This yielded acomplete dataset of 704 amplification reactions which
Representations of real-time PCR amplification curvesFigure 1Representations of real-time PCR amplification curves. The three phases of the amplification reaction are shown either on a linear scale (panel A) or on a semi-log scale (panel B). Panel A represents a typical amplification curve, while panel B depicts amplification curves generated from serial dilutions of the same sample, either undiluted or diluted 10- or 1000-fold (indicated as 1, 0.1 or 0.001, respectively). During the lag phase (phase I), the fluorescence resulting from DNA amplification is undetectable above noise fluorescence in part A, while in part B, some data points take negative values and are not repre-sented. This phase is used to evaluate the baseline "noise" of the PCR amplification. Exponential amplification of the DNA is detected in phase II (cycles 16 to 23, panel A). This phase of the amplification corresponds to the linear portion of the curve in panel B (closed circles). A threshold value is usually set by the user to cross the log linear portion of the curve, defining the threshold cycle value (Ct). Phase II is followed by a linear or plateau phase as reactants become exhausted (phase III). The inserted equations describe the dynamic of the amplification during phase II.
Page 3 of 16(page number not for citation purposes)

BMC Bioinformatics 2007, 8:131 http://www.biomedcentral.com/1471-2105/8/131
collection of raw data is given in additional file 2. Individ-ual Ct values corresponding to each reaction conditionswere averaged, providing a set of 144 Ct values and theirassociated errors. The standard deviation (SD) shows anincrease of the error with higher Ct values, with SD valuessmaller than 0.2 for Ct up to 30 cycles, and spreading over0.8 for Ct higher than 30 (Additional File 3). Thus, all rep-licates with SD above 0.4 were excluded, which corre-sponds to some of the reactions with Ct above 30 in thisstudy. We conclude that Ct between 15 and 30 can be
reproducibly measured leading to a dynamic range of 105,which is within the 4 to 8 logs dynamic range reported inother studies [17]. In these conditions, Ct value determi-nation is unlikely to be a major source of error when cal-culating normalized ratio of expression. Thus, we thenfocused on the estimation of efficiency.
Estimation of the efficiency of a PCR reactionWe compared estimates of the efficiency obtained fromtwo distinct methods: the generally used serial dilution
Measurement of the efficiency of a PCR reactionFigure 2Measurement of the efficiency of a PCR reaction. A: Estimation of the efficiency using the Serial dilution (SerDil) method. Five dilutions of a cDNA sample were amplified using the fibronectin (FN) amplicon. Each dilution was analyzed with five replicates PCR reactions and each data point represents one Ct value determined as in Figure 1B. Linear regression param-eters and calculation of the efficiency value are shown in the inserted textbox. B: Screenshot of the LinReg PCR program anal-ysis window, which allows the estimation of the efficiency value from each set of amplification curves [13]. Data correspond to one of the reactions performed from the undiluted sample used in part A. C: Comparison of the efficiency values obtained using the Serial dilution and LinReg methods for the FN amplicon. Efficiency values were determined from four independent cDNA samples using the Serial Dilution method as in part A, or the LinReg method as in part B. For each sample, efficiency value were either determined from one linear regression performed on 24 reactions altogether (Serdil) and error bars calcu-lated from the standard deviation on the slope as determined from the linear regression method or the individual efficiency val-ues determined from each of the same 24 PCR reactions (LinReg) were averaged, and error bars represent the standard deviation on the set of values.
A
C
B
Page 4 of 16(page number not for citation purposes)

BMC Bioinformatics 2007, 8:131 http://www.biomedcentral.com/1471-2105/8/131
(Figure 2A) and the alternative LinReg method (Figure2B). With our experimental setup, estimation of the effi-ciency with the serial dilution method requires a set of 24PCR reactions for a given sample and a given amplicon,using serially diluted template DNA. The efficiencyobtained was compared to the average efficiency esti-mated from each of the reactions with the LinReg method.Efficiency estimates are comparable when looking at val-ues given in Figure 2A and 2B, but they differed whencomparing the efficiencies obtained from one of the fourDNA samples (Figure 2C). Thus, we questioned whetherthe two methods provide statistically similar measures ofefficiency, and whether they display similar reproducibil-ity.
The statistical equivalence of the LinReg and serial dilu-tion methods was assessed using an analysis of variance(ANOVA, Table 1), which indicated that the efficiencyaverages are not significantly different between the twomethods except for one amplicon, corresponding to theConnective Tissue Growth Factor (CTGF) cDNA (p <0.05). This may be linked to the fact that this gene isexpressed at very low levels and because of the reducedsize of the data set, as some data had to be discardedbecause signal was undetectable (Ct ≥ 40). Also, someestimates were taken from PCR displaying Ct values in the35 – 40 range. Thus, statistically significant differencebetween the two methods may likely result from thesmaller dataset and/or the use of reactions with Ct valuesoutside of the optimal range. The reproducibility of theLinReg method appears to be overall higher than that ofthe serial dilution method (Figure 2C). An F-test per-formed over the averaged variance of each method indi-cated that for each set of primer, the difference betweenthe variance of the serial dilution and LinReg methods isvery significant, with p-values well below 0.001 (Table 1).
Overall, we conclude that the two methods display com-parable accuracy in measuring efficiency values of a set ofreactions. Statistically, this implies that these methodsprovide acceptable estimator of the efficiency. However,LinReg appears to be more robust, as lower variances wereobtained. Furthermore, LinReg can be mathematically jus-tified when the PCR amplification is in the exponentialphase (see Additional File 4).
Experimental parameters influencing efficiency determinationNext, we wished to determine which of the experimentalvariables may affect the precision of the estimation of effi-ciency. This was evaluated on the complete set of quanti-tative PCR reactions. Figure 3 shows the distribution ofthe efficiencies measured for all reactions. Efficienciesranged from 1.4 to 2.15 with a peak value around 1.85.Theoretically, efficiencies can only take values between 1
and 2, and therefore they are expected to deviate from anormal distribution, as indicated by a Kolmogorov-Smirnoff test (not shown). However, the distributionappears to be sufficiently symmetrical to be considerednormal, such that classical statistical tests can be validlyperformed.
First, we determined if single PCR parameters (amplicons,cDNA samples, Ct value, etc.) may influence the efficiencyvalue by performing a multiple ANOVA test on all values.The first four entries of Table 2 indicate that the efficiencyis most dependent upon the amplicon and relatively lesson cDNA samples, as indicated by high F values, both ofthese effects being highly significant (p < 0.001). How-ever, efficiency was not found to depend on the Ct nor thedilution, showing that efficiency is solely dependent onthe kinetic of the PCR reaction in the exponential phaseand not on the initial condition (i.e. the amount of initialtemplate). Possible interactions between pairs of parame-ters that affect the efficiency (co-dependence) were alsoassessed, showing that amplicon-dependent effects on theefficiency are modulated by the type of sample. Interest-ingly, while the dilution is not significantly influencingthe efficiency, it can significantly modulate the effect ofthe primers and the samples. This is consistent with thepresence of inhibitor(s) in samples that would affect PCRreactions at the highest concentrations. For instance, saltsor competing genomic DNA would be expected inhibitthe interaction of primers and target DNAs differently.None of the other co-dependences were of any signifi-cance. Since the Ct and dilution are not independentparameters, two ANOVA test were run excluding eitherone. The Ct did not have a significant effect on the effi-ciency even when the dilution parameter was not takeninto account. On the other hand, the dilution effect wasnot affecting efficiency significantly by itself but it modu-lated the effect of the amplicon. Either way, these resultsindicate clearly that the Ct has no direct effect on the effi-ciency.
Overall, these results indicate that efficiencies are highlyvariable among PCR reactions and that the main factorthat defines the efficiency of a reaction is the amplicon.This is consistent with the empirical knowledge thatprimer sequences must be carefully designed in quantita-tive PCR to avoid non-productive hybridization eventsthat decrease efficiency, such as primer-dimers or non-specific hybridizations. Efficiency might also dependupon the dilution for a minority of the cDNA samples,indicating that dilute samples should be preferred toobtain reliable efficiency values.
DNA quantification modelsThe models we evaluated in this study can fall into twodifferent groups: being derived from either linear or from
Page 5 of 16(page number not for citation purposes)

BMC Bioinformatics 2007, 8:131 http://www.biomedcentral.com/1471-2105/8/131
non-linear fitting methods. Comparison of qPCR datausing models based on non-linear fitting methods (Eq. 6and Eq. 8) is done simply by calculating the ratio of theinitial amount of target DNA of each amplicon (Eq. 7 andEq. 9) as in the first part of Eq. 2. The standard deviationof the ratio on a pool of replicate is calculated using Eq.10. Note that in this case, errors resulting from the non-linear fitting itself are not considered in the analysis.
Linear fitting methods also allow the estimation of the ini-tial level of fluorescence induced by the target DNA. Forinstance, Eq. 3, upon which the LinReg method relies todetermine efficiency, can also be used to determine F0 asthe intercept to the origin of a linear regression of the logof fluorescence. This figure can then be used to calculaterelative DNA levels (Eq. 2). This calculation method wastermed LRN0.
However, even small errors on the determination of theefficiency will lead to a great dispersion of N0 values dueto the exponential nature of PCR (Eq. 2). Therefore, weconsidered alternative calculation strategies, whereby theefficiency is averaged over several reactions rather thanusing individual values, which should provide morerobust and statistically more coherent estimations. Wetherefore evaluated the use of efficiency values calculatedin three different manners.
As the amplicon sequence is the main contributor to theefficiency, we used the efficiency averaged over all cDNAsamples, dilutions and replicates of a given amplicon, as amore accurate estimator of the real efficiency than indi-vidual values. The error on the efficiency is no longer con-sidered in the calculations of relative DNA concentrations,thus assuming that the estimator is sufficiently precise sothat errors become negligible. This model is termed below(PavrgE)Ct.
Alternatively, the small influence of the sample upon theefficiency was taken into account by averaging the effi-ciencies obtained for each dilutions and replicates of agiven cDNA sample and a given amplicon. Thus, for agiven cDNA sample and amplicon, one efficiency value isobtained from 24 PCR reactions. This value is used in fur-ther calculations, assuming again the average value to bea sufficiently good estimator of the efficiency so that therelative error may not be taken into account. This modelwas named (SavrgE)Ct.
Finally, we tested a model in which the efficiency is esti-mated individually for each set of replicated reactions.This was addressed by averaging the efficiency of each rep-licates of a given amplicon, cDNA sample and dilution.This model is referred below as Ect. These three models aresummarized in Table 3.
Distribution of efficiency values in the complete data setFigure 3Distribution of efficiency values in the complete data set. Efficiency of 704 PCR reactions encompassing different cDNA samples, primers and dilutions are shown as deter-mined using the LinReg method, as done in Figure 2B.
Table 1: Comparison between serial dilution and LinReg for the measurement of efficiency
Amplicon Test of equality* Test of variance**
Cav p = 0.24 p < 0.001CTGF p < 0.001 p < 0.001
Eln p = 1 p < 0.001FN p = 0.65 p < 0.001L27 p = 0.8 p < 0.001Perl p = 1 p < 0.001
PAI-1 p = 0.93 p < 0.001
* Single one-way ANOVA was applied to the complete set of data to assess whether both the Serial dilution and the LinReg methods give similar averaged efficiencies (H0: efficiencies are equal, H1: efficiencies are different): a p-value below 0.05 indicates that measured efficiencies are significantly different. **F-test assessing whether the variance (error) induced by each method is the same [H0: variances are equal, H1: var(serial dilution) > var(LinReg)]: p < 0.001 indicates that the variance obtained with the serial dilution is significantly greater than that of LinReg.
Page 6 of 16(page number not for citation purposes)

BMC Bioinformatics 2007, 8:131 http://www.biomedcentral.com/1471-2105/8/131
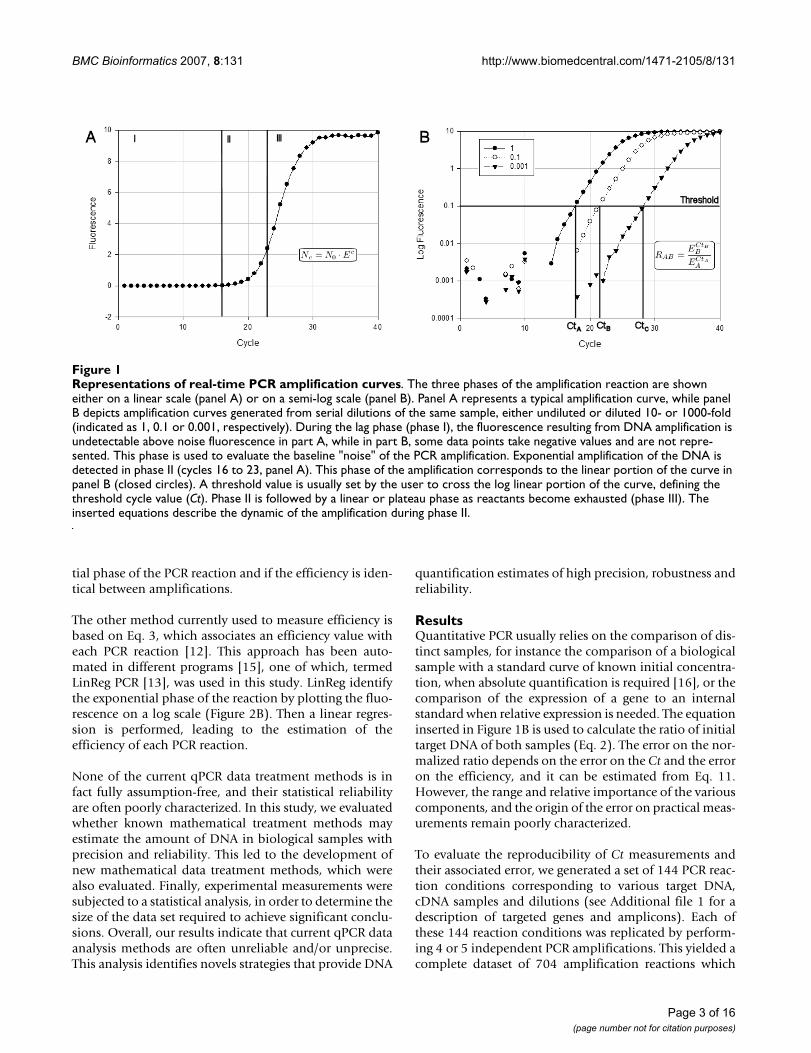
Evaluation of the quantitative PCR calculation modelsThe dilutions of a given sample form a coherent set ofdata, with known concentration relationships betweeneach dilution. Each calculation model was therefore usedon each dilution series, using the undiluted sample fornormalization. All data can be presented as measured rel-ative concentrations, the undiluted dilution taking the rel-ative concentration value of 1, the 10-fold dilution takingthe value of 0.1, the 50-fold dilution a value of 0.02, andso on. The measured relative concentrations for all dilu-tions, samples and primers and the associated errors werecalculated using each model from the complete dataset of704 reactions. For the models giving a direct insight to theinitial N0 values, N0 were averaged for each amplicon andcDNA sample, and they were plotted in comparison withthe expected concentrations relative to the undiluted sam-ples (Figure 4). The models were evaluated on three crite-ria: resolution, precision and robustness.
We defined the resolution as the ability of a model to dis-criminate between two dilutions. Relative concentrationswere compared pair-wise between adjacent dilutions. Typ-ically, it can be seen in Figure 4 that models did not giveuniformly coherent results. For instance, models that do
not rely on explicit efficiency values, such as the sigmoidor exponential models, are unable to discriminatebetween the 0.1 and 0.02 relative concentrations, whichshows a lack of resolution in this range of dilutions. TheΔCt, (PavrgE)Ct and (SavrgE)Ct models performed wellunder this criterion, allowing easy discrimination of the10-fold and 50-fold dilutions in this example.
The resolution was statistically evaluated with a coupledANOVA-LSD t-test, which is a two step analysis of variance(ANOVA) coupled to a t-test run under the Least Signifi-cant Difference method (LSD) [18]. Unsurprisingly, theANOVA test indicated that for all models at least one ofthe measured concentrations differed significantly fromthe others as expected (data not shown). To further assessif all measured concentrations significantly differ fromone another, or if some are undistinguishable, a coupledt-test was performed on pairs of adjacent dilutions in agiven serial dilution series. Results are summarized inTable 4. All models were able to discriminate the undi-luted condition from the 10-fold dilution (highly signifi-cant, p < 0.01). The sigmoid and exponential models didnot discriminate further dilutions. The ΔCt, ECt and LRN0p-value indicate that these models could discriminate the
Table 3: Models for the use of single reaction efficiencies
Grouping of individual efficiencies for average determination
Model Amplicon (7) cDNA (4) Dilutions (5) Replicates (5) Reactions (700)
(PavrgE)Ct * individual pooled pooled pooled 100(SavrgE)Ct individual individual pooled pooled 25
Ect individual individual individual pooled 5
*Each line indicates how single efficiency values are grouped in each of the calculation models. For instance, the (PavrgE)Ct model line indicates that one individual amplicon is chosen out of the 7 available ones, then efficiencies estimated from the different cDNA samples, dilutions and replicates are all pooled, leading to the determination of one efficiency value from 100 reactions. In the (SavrgE)Ct model, individual efficiency values are calculated for each cDNA sample and each amplicon averaging efficiency values from the 5 replicate reactions performed on the 5 dilutions (25 values overall).
Table 2: Parameters influencing the efficiency of qPCR reactions.
Parameter Df F-value p-value
Amplicon 6 219.331 <0.001Sample 10 7.227 <0.001Ct 1 0.646 0.422Dilution 4 2.111 0.078Amplicon:Sample 15 4.525 <0.001Amplicon:Ct 6 1.957 0.07Amplicon:Dilution 20 2.576 <0.001Sample:Ct 10 1.226 0.271Sample:Dilution 37 1.512 0.029Ct: Dilution 4 1.872 0.114Residuals 700
A multiple ANOVA test was performed on efficiencies obtained from 700 reactions. Dependence with amplicon sequence, sample, Ct and dilutions were tested as well as all combinations of co-dependence. Df indicates the degree of freedom. The larger the F-value, or the smaller the p value, the more significant is the effect of the corresponding parameter.
Page 7 of 16(page number not for citation purposes)
BMC Bioinformatics 2007, 8:131 http://www.biomedcentral.com/1471-2105/8/131
10-fold from the 50-fold dilution, but not further dilu-tions. The (SavrgE)Ct and (PavrgE)Ct models were able todiscriminate the 10-fold from the 50-fold dilution andwere at the limit of significance when comparing the 50-fold with the 100 fold dilutions (significant, p < 0.1).Finally, none of the models were able to discriminate the100 fold from the 1000 fold dilution. These comparisonsindicated that (SavrgE)Ct and (PavrgE)Ct models per-formed equally well in this assay, followed by ΔCt, ECt andLRN0, while the sigmoid or exponential models were oflow resolution. These results also illustrate that moredilute samples are generally more difficult to discrimi-nate, as expected from the finding that variance increaseswith higher Ct values (Additional File 3).
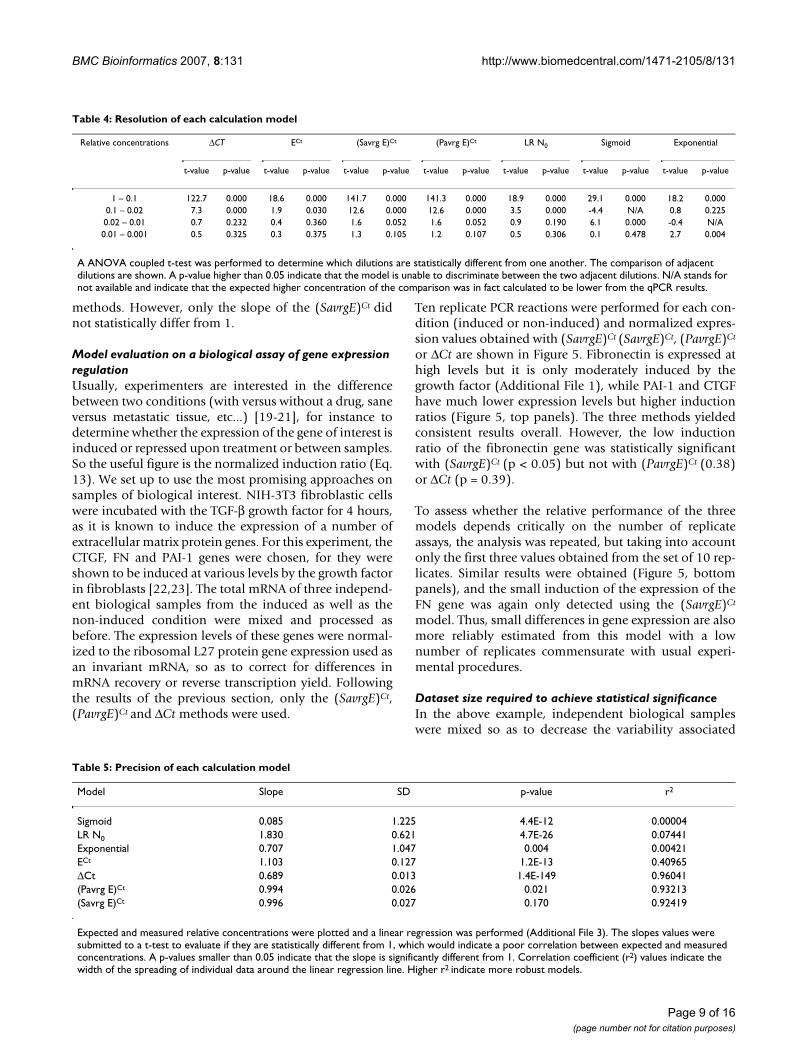
The precision of a model is defined by its ability to pro-vide expected relative concentrations of the known dilu-tions. Again Figure 4 shows that the (PavrgE)Ct and(SavrgE)Ct models provide precise relative concentrationvalues over all dilutions, with the measured relative con-centrations matching the expected ones. Estimationsobtained by the ΔCt model appear to be less reliable, witha systematic under-representation of concentrations. Thisresult is expected since all of our amplicons have efficien-cies that are below 2 (see Additional File 5).
We statistically evaluated the precision of each model byplotting the expected relative concentration against the
measured relative concentration averaged from all prim-ers and samples (Additional File 3). A linear regressionwas done on the data obtained from each model and a t-test was performed to determine if the slope is statisticallydifferent from 1. A low p-value in Table 5 is associated toa high probability that the slope is different from 1, indic-ative of a poor correlation between expected and meas-ured values. As before, the (PavrgE)Ct and (SavrgE)Ct
models outperformed all other models, being more pre-cise than the and sigmoid models, the exponential, ΔCtand LR N0 displaying lowest precision.
Finally, the robustness is related to the variability of theresults obtained from a given model, and it indicateswhether trustable results may be obtained from a smallcollection of data. For instance, a model could be very pre-cise (eg providing a slope of 1) with a large data set, butthe distribution of the points around the regression linecould be very dispersed. Such a model would not berobust as a small data set would not allow precise meas-urements. Thus, the robustness of a model was estimatedfrom the standard deviation of the slope and the relatedcorrelation coefficient of the linear regression (r2), withhigher r2 values indicating more robust models. Threemodels showed high robustness, the ΔCt, (PavrgE)Ct and(SavrgE)Ct, followed by ECt (Table 5). Overall, only twocalculation models combine high resolution, precisionand robustness, namely the (PavrgE)Ct and the (SavrgE)Ct
Comparison of the different calculation models when applied to samples of known relative concentrationsFigure 4Comparison of the different calculation models when applied to samples of known relative concentrations. Each cDNA samples serial dilutions were processed with the indicated models, measured concentration were expressed as relative to the undiluted sample. Then results of all amplicons were averaged for a given model.
Page 8 of 16(page number not for citation purposes)
BMC Bioinformatics 2007, 8:131 http://www.biomedcentral.com/1471-2105/8/131
methods. However, only the slope of the (SavrgE)Ct didnot statistically differ from 1.
Model evaluation on a biological assay of gene expression regulationUsually, experimenters are interested in the differencebetween two conditions (with versus without a drug, saneversus metastatic tissue, etc...) [19-21], for instance todetermine whether the expression of the gene of interest isinduced or repressed upon treatment or between samples.So the useful figure is the normalized induction ratio (Eq.13). We set up to use the most promising approaches onsamples of biological interest. NIH-3T3 fibroblastic cellswere incubated with the TGF-β growth factor for 4 hours,as it is known to induce the expression of a number ofextracellular matrix protein genes. For this experiment, theCTGF, FN and PAI-1 genes were chosen, for they wereshown to be induced at various levels by the growth factorin fibroblasts [22,23]. The total mRNA of three independ-ent biological samples from the induced as well as thenon-induced condition were mixed and processed asbefore. The expression levels of these genes were normal-ized to the ribosomal L27 protein gene expression used asan invariant mRNA, so as to correct for differences inmRNA recovery or reverse transcription yield. Followingthe results of the previous section, only the (SavrgE)Ct,(PavrgE)Ct and ΔCt methods were used.
Ten replicate PCR reactions were performed for each con-dition (induced or non-induced) and normalized expres-sion values obtained with (SavrgE)Ct (SavrgE)Ct, (PavrgE)Ct
or ΔCt are shown in Figure 5. Fibronectin is expressed athigh levels but it is only moderately induced by thegrowth factor (Additional File 1), while PAI-1 and CTGFhave much lower expression levels but higher inductionratios (Figure 5, top panels). The three methods yieldedconsistent results overall. However, the low inductionratio of the fibronectin gene was statistically significantwith (SavrgE)Ct (p < 0.05) but not with (PavrgE)Ct (0.38)or ΔCt (p = 0.39).
To assess whether the relative performance of the threemodels depends critically on the number of replicateassays, the analysis was repeated, but taking into accountonly the first three values obtained from the set of 10 rep-licates. Similar results were obtained (Figure 5, bottompanels), and the small induction of the expression of theFN gene was again only detected using the (SavrgE)Ct
model. Thus, small differences in gene expression are alsomore reliably estimated from this model with a lownumber of replicates commensurate with usual experi-mental procedures.
Dataset size required to achieve statistical significanceIn the above example, independent biological sampleswere mixed so as to decrease the variability associated
Table 4: Resolution of each calculation model
Relative concentrations ΔCT ECt (Savrg E)Ct (Pavrg E)Ct LR N0 Sigmoid Exponential
t-value p-value t-value p-value t-value p-value t-value p-value t-value p-value t-value p-value t-value p-value
1 – 0.1 122.7 0.000 18.6 0.000 141.7 0.000 141.3 0.000 18.9 0.000 29.1 0.000 18.2 0.0000.1 – 0.02 7.3 0.000 1.9 0.030 12.6 0.000 12.6 0.000 3.5 0.000 -4.4 N/A 0.8 0.2250.02 – 0.01 0.7 0.232 0.4 0.360 1.6 0.052 1.6 0.052 0.9 0.190 6.1 0.000 -0.4 N/A0.01 – 0.001 0.5 0.325 0.3 0.375 1.3 0.105 1.2 0.107 0.5 0.306 0.1 0.478 2.7 0.004
A ANOVA coupled t-test was performed to determine which dilutions are statistically different from one another. The comparison of adjacent dilutions are shown. A p-value higher than 0.05 indicate that the model is unable to discriminate between the two adjacent dilutions. N/A stands for not available and indicate that the expected higher concentration of the comparison was in fact calculated to be lower from the qPCR results.
Table 5: Precision of each calculation model
Model Slope SD p-value r2
Sigmoid 0.085 1.225 4.4E-12 0.00004LR N0 1.830 0.621 4.7E-26 0.07441Exponential 0.707 1.047 0.004 0.00421ECt 1.103 0.127 1.2E-13 0.40965ΔCt 0.689 0.013 1.4E-149 0.96041(Pavrg E)Ct 0.994 0.026 0.021 0.93213(Savrg E)Ct 0.996 0.027 0.170 0.92419
Expected and measured relative concentrations were plotted and a linear regression was performed (Additional File 3). The slopes values were submitted to a t-test to evaluate if they are statistically different from 1, which would indicate a poor correlation between expected and measured concentrations. A p-values smaller than 0.05 indicate that the slope is significantly different from 1. Correlation coefficient (r2) values indicate the width of the spreading of individual data around the linear regression line. Higher r2 indicate more robust models.
Page 9 of 16(page number not for citation purposes)

BMC Bioinformatics 2007, 8:131 http://www.biomedcentral.com/1471-2105/8/131
with cell culture and mRNA isolation. Therefore, thisstudy provides the statistical significance that may beexpected just from the intra-assay variability in the qPCRprocess. However, statistical significance will also dependon the inter-assay, or biological variability. To assess thestatistical significance associated to particular conclusionson gene expression regulation, replicates of inductionexperiments are usually generated and, in most experi-mental studies, the number of biological replicates is low,being typically obtained from 3–6 independent biologicalsamples.
Thus, we wished to determine how many biological repli-cates may be necessary to obtain statistically reliableresults, depending upon the variability of the assay (Eq.15). Using the data from the 10 replicates to estimate theintra-assay variability, we found that the standard devia-tion is proportional to the induction ratio value (Addi-tional File 1). This is shown by coefficient of variation(CV) values being conserved for all induction ratios at alevel just below 15%, irrespective of the calculationmethod. Use the set of three replicate assays resulted in
more variable but comparable CV values around or lowerthan 15%, which is in agreement with other publisheddata [17]. However, inter-experiment biological variabil-ity will be specific to each experimental system. The truevariability of the PCR assay (intra-assay and biologicalinter-assay variability) is higher, typically with overall CVvalues ranging around 30% to 50% (own unpublishedresults and [24]). Another parameter influencing thenumber of replicates needed to assess statistical reliabilityis the domain (range) of confidence of the measure. Thisvalue is defined as the largest acceptable error on themeasure and it is set arbitrarily by the experimenter. Thus,setting a domain of 20% indicates that the estimatedinduction should fall within 20% of the real value. It fol-lows that the larger the domain of confidence, the lowerthe number of replicates needed.
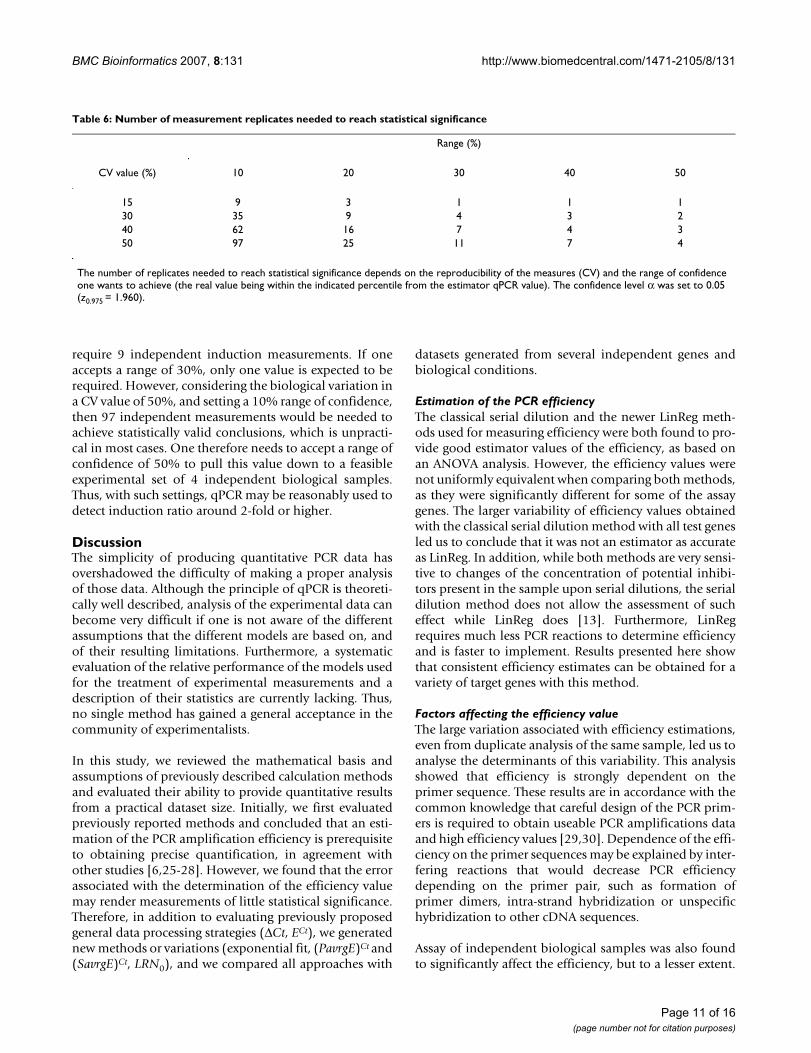
Table 6 provides the number of independent measure-ments that is required to achieve a statistically significantmeasurement from any given induction ratio. Taking theminimal theoretical CV of 15%, obtaining an inductionratio within a domain of 10% of the real value would
Comparison of the (SavrgE)Ct, (PavrgE)Ct and ΔCt methods to quantify gene expression regulationFigure 5Comparison of the (SavrgE)Ct, (PavrgE)Ct and ΔCt methods to quantify gene expression regulation. cDNAs were prepared from RNA extracted from fibroblastic cells induced or not by TGF-β treatment, as described in the Materials and methods. Expression as determined from the mRNA levels of the plasminogen activator inhibitor 1 (PAI-1), fibronectin (FN) and connective tissue growth factor (CTGF) genes were normalized to those of the ribosomal L27 protein, used as an invariant internal reference. Normalized gene expression was calculated using the (SavrgE)Ct, (PavrgE)Ct or the ΔCt methods, as indicated, using either the complete set of 10 replicate assays (top histograms), or using just three measurements (first three assays of the series, bottom histograms). Error bars represent standard deviations on the normalized ratio. A t-test was performed on the normalized gene expression to check whether the expression were statistically different between the induced and the non-induced state (* = p < 0.05, ** = p < 0.001, # = p > 0.1).
Page 10 of 16(page number not for citation purposes)
BMC Bioinformatics 2007, 8:131 http://www.biomedcentral.com/1471-2105/8/131
require 9 independent induction measurements. If oneaccepts a range of 30%, only one value is expected to berequired. However, considering the biological variation ina CV value of 50%, and setting a 10% range of confidence,then 97 independent measurements would be needed toachieve statistically valid conclusions, which is unpracti-cal in most cases. One therefore needs to accept a range ofconfidence of 50% to pull this value down to a feasibleexperimental set of 4 independent biological samples.Thus, with such settings, qPCR may be reasonably used todetect induction ratio around 2-fold or higher.
DiscussionThe simplicity of producing quantitative PCR data hasovershadowed the difficulty of making a proper analysisof those data. Although the principle of qPCR is theoreti-cally well described, analysis of the experimental data canbecome very difficult if one is not aware of the differentassumptions that the different models are based on, andof their resulting limitations. Furthermore, a systematicevaluation of the relative performance of the models usedfor the treatment of experimental measurements and adescription of their statistics are currently lacking. Thus,no single method has gained a general acceptance in thecommunity of experimentalists.
In this study, we reviewed the mathematical basis andassumptions of previously described calculation methodsand evaluated their ability to provide quantitative resultsfrom a practical dataset size. Initially, we first evaluatedpreviously reported methods and concluded that an esti-mation of the PCR amplification efficiency is prerequisiteto obtaining precise quantification, in agreement withother studies [6,25-28]. However, we found that the errorassociated with the determination of the efficiency valuemay render measurements of little statistical significance.Therefore, in addition to evaluating previously proposedgeneral data processing strategies (ΔCt, ECt), we generatednew methods or variations (exponential fit, (PavrgE)Ct and(SavrgE)Ct, LRN0), and we compared all approaches with
datasets generated from several independent genes andbiological conditions.
Estimation of the PCR efficiencyThe classical serial dilution and the newer LinReg meth-ods used for measuring efficiency were both found to pro-vide good estimator values of the efficiency, as based onan ANOVA analysis. However, the efficiency values werenot uniformly equivalent when comparing both methods,as they were significantly different for some of the assaygenes. The larger variability of efficiency values obtainedwith the classical serial dilution method with all test genesled us to conclude that it was not an estimator as accurateas LinReg. In addition, while both methods are very sensi-tive to changes of the concentration of potential inhibi-tors present in the sample upon serial dilutions, the serialdilution method does not allow the assessment of sucheffect while LinReg does [13]. Furthermore, LinRegrequires much less PCR reactions to determine efficiencyand is faster to implement. Results presented here showthat consistent efficiency estimates can be obtained for avariety of target genes with this method.
Factors affecting the efficiency valueThe large variation associated with efficiency estimations,even from duplicate analysis of the same sample, led us toanalyse the determinants of this variability. This analysisshowed that efficiency is strongly dependent on theprimer sequence. These results are in accordance with thecommon knowledge that careful design of the PCR prim-ers is required to obtain useable PCR amplifications dataand high efficiency values [29,30]. Dependence of the effi-ciency on the primer sequences may be explained by inter-fering reactions that would decrease PCR efficiencydepending on the primer pair, such as formation ofprimer dimers, intra-strand hybridization or unspecifichybridization to other cDNA sequences.
Assay of independent biological samples was also foundto significantly affect the efficiency, but to a lesser extent.
Table 6: Number of measurement replicates needed to reach statistical significance
Range (%)
CV value (%) 10 20 30 40 50
15 9 3 1 1 130 35 9 4 3 240 62 16 7 4 350 97 25 11 7 4
The number of replicates needed to reach statistical significance depends on the reproducibility of the measures (CV) and the range of confidence one wants to achieve (the real value being within the indicated percentile from the estimator qPCR value). The confidence level α was set to 0.05 (z0.975 = 1.960).
Page 11 of 16(page number not for citation purposes)

BMC Bioinformatics 2007, 8:131 http://www.biomedcentral.com/1471-2105/8/131
Others have observed that sample to sample variationsmay predominate, which may reflect differences in sam-ple preparation methods and/or distinct biological sys-tems [31]. These effects can be related to cell-specificcontaminants and/or to exogenous contaminants intro-duced during sample preparation that may interfere withthe assay [29,30]. Indeed, use of undiluted reverse tran-scriptase reaction samples was found to decrease effi-ciency values significantly and to increase variabilitybetween samples (YK, unpublished results). However,such effects should be alleviated in dilute samples such asthose used here, and we found that the average efficiencyvalue does not correlate significantly with the dilution fac-tor, at least for the dilution range used in this study. Thisindicates that in the conditions used, the variation associ-ated with the samples does not result primarily fromchemical contaminants that would interfere directly withthe DNA elongation reactions. Interestingly, the efficiencyvalues are not dependent on the measured Ct, whichreflects both the initial DNA concentration in the extractand the dilution ratio, further strengthening the conclu-sion that the concentration of impurities in the sample orthe initial N0 concentration are not the main determinantsof the PCR efficiency. Therefore, the distinct efficienciesobtained from independent samples should also reflectother properties of the sample that are not affected bydilution.
For instance, the presence of damaged or nicked cDNA inthe sample has been shown to affect PCR efficiency [32].This may result in the linear amplification of shorter DNAfragments, as opposed to the exponential amplification ofcorrect length DNA from the undamaged cDNA, and in adecrease of available nucleotides around the Ct cycleaffecting the observed efficiency. In addition, if linearlyamplified truncated DNA strands still contribute a signif-icant proportion of fluorescence at the Ct, increase in flu-orescence would reflect both the efficiency of theamplification of DNA template of correct length (expo-nential amplification) and a lower efficiency value corre-sponding to the amplification of shorter molecules (linearamplification). Similarly, the presence of incompleteelongated cDNAs, base hydrolysis or chemical oxidationalso impairs polymerase progression, leading to the unidi-rectional amplification of shorter products that could alsodecrease PCR efficiency [33]. Variations in the ratio ofnon-functional to functional templates would thusexplain changes in the apparent amplification efficiencyfrom one sample to the next irrespective of the dilution.
Evaluation of various qPCR calculation modelsModels were evaluated under 3 criteria: resolution, preci-sion and robustness. Resolution is a measure of the abilityof a model to discriminate two successive dilutions. Preci-sion is the correlation between measured and expected
concentrations. Finally the robustness is a measure of thedispersion of the measured values around the expectedconcentrations.
Overall, two calculation models stand out: the (PavrgE)Ct
and the (SavrgE)Ct models, as these are among the topscoring methods on the three evaluation criteria. How-ever, (PavrgE)Ct shows a small but statistically significantbias when comparing the obtained and expected values,suggesting that it slightly underestimates the more diluteDNA concentrations. In contrast, results calculated from(SavrgE)Ct cannot be statistically distinguished from theexpected data and are thus of higher precision. In addi-tion, (SavrgE)Ct displayed a higher resolution than(PavrgE)Ct when assessed on biological samples. Thesemodels are followed by ECt, which is of lower but consist-ent resolution, robustness and precision.
The ΔCt model stands apart from all other models. Firstly,because it is the first model ever having being used inautomated quantitative PCR, but also because of its prop-erties as analyzed here. As expected, this model very signif-icantly underestimates actual DNA concentrations, with aclear statistical indication that it is of low precision. How-ever, it mediates the highest robustness value of all meth-ods. Thus, this model is quite unprecise, but it yields veryreproducible results. The ΔCt model may therefore be ofinterest for screening purposes, as its strong robustnessand ease of use makes it ideal to analyze large collectionsof biological samples with few replicates, for instance toscreen for changes in the expression a large number ofgenes, after which a finer analysis on the genes displayinginteresting expression profiles may be performed usingthe (SavrgE)Ct or (PavrgE)Ct models. It must be empha-sized here that if PCR is performed with carefully designedand optimized primers that yield high efficiency [34],then the ΔCt model would be the best model of all. Unfor-tunately obtaining such primers is labour-intensive andcostly, when not impossible.
Finally the sigmoid, exponential and LR N0 models ana-lysed here are least suitable for quantitative PCR analysisas they have a low resolution and/or precision, andbecause they display very low robustness. Improved ver-sions of the original sigmoid model [14] used here hasrecently been reported [35,36], which should result inincreased robustness. In parallel to the sigmoid fittingmethods analyzed here, we also evaluated several othersigmoid fitting algorithms, which performances wereeither similar or even less accurate than the method usedhere (unpublished data). This observation is in accord-ance with Feller's conclusions that different S-shapedcurves can be similarly fitted with various sigmoid models[37], each providing distinct N0 value from its own set ofparameters. Thus sigmoid fit methods such as the logistic
Page 12 of 16(page number not for citation purposes)

BMC Bioinformatics 2007, 8:131 http://www.biomedcentral.com/1471-2105/8/131
model used above are purely descriptive, and biologicalconclusions drawn from the fitting parameters may beunreliable.
Perhaps surprisingly, the exponential fitting method alsoscored with very low performance, despite the expectedexponential nature of DNA amplification by PCR. Thismay result in part from poorly characterized borders ofthe exponential phase, leading to the fitting of experimen-tal points that are already in phase III. Alternatively it mayresult from the possible non-exponential nature of PCRthat would result from both linear and exponential ampli-fication, as discussed above. The exponential and sigmoidmethods are based on descriptive models. They often pro-duce outlier N0 values, suggesting that they might not beaccurate mathematical models of the PCR process [37].Furthermore, these models take into account the earlyPCR cycles that are swamped by fluorescence noise, lead-ing to a large variation in the calculated N0. An additionalexplanation for the inadequate performance of the sig-moid, exponential, and LR N0 models is that they do notexplicitly determine the efficiency value, and thereforecannot make use of average efficiencies obtained fromseveral independent measurements. These observationsthus support the conclusion that the determination of aprecise efficiency value is paramount to the success ofqPCR, and it provides a rational explanation for this phe-nomenon.
ConclusionOverall, three models stand out and may be used prefera-bly depending on the experimental conditions and objec-tives: the ΔCt, (PavrgE)Ct and (SavrgE)Ct models. ΔCt willbe preferred as an initial screening method when manydifferent sequences have to be screened quickly and eco-nomically from few biological samples, but it will notprovide precise estimates, either relative or absolute.(PavrgE)Ct and (SavrgE)Ct rely on an averaged efficiencyvalue, either performed from all data resulting from oneamplicon but irrespective of the biological sample or con-dition, or performed over each sample and amplicon,respectively. Thus, (PavrgE)Ct may be favoured when thesame gene or sequence is to be amplified repeatedly fromvarious biological treatments or specimens, or when fol-lowing changes in the physiological or differentiation sta-tus of a cell population over time, to obtain comparativeor relative estimates. In contrast, when absolute quantifi-cation of DNA and highest precision is needed, and/orwhen multiple sequences must be amplified from fewbiological samples or conditions, (SavrgE)Ct will be themethod of choice, and the statistical analysis provided inthis study will allow the estimation of the dataset sizerequired to achieve a given accuracy.
MethodsCell culture and cDNA preparationPrimary mouse fibroblast and NIH-3T3 mouse fibroblastswere cultured in DMEM supplemented with 10% serum.Cells were exposed to 100 pM TGF-β or to the ethanol car-rier for 4 hours before RNA extraction. Total RNA wasextracted from confluent 75 cm2 culture dish (approx 2million cells) using Trizol reagent (Invitrogen) accordingto the manufacturer's protocol and resuspended in 20 μlRNAse-free water. Reverse transcription was performedwith the GeneAmp Gold RNA PCR Core kit (PE AppliedBiosystem) using 5 μl (approx 2.5 μg) of RNA in a 25 μlfinal volume using oligo-dT as a primer. The resultingcDNA solution was diluted 10-fold in deionized waterand the solution thus obtained was considered as theundiluted sample (1-fold dilution) for the qPCR measure-ments. This final dilution step was found to be necessaryto prevent inhibitory effects on the PCR efficiency thatlikely result from contaminant carry-over (data notshown).
Experimental set of qPCR dataTo statistically qualify the quantitative PCR process and toevaluate the different models, we generated an experimen-tal data set using 7 different amplicons. Expression of thegenes listed in Additional File 1 is controlled by a regula-tory cascade elicited by the treatment of fibroblastic cellswith the Transforming Growth Factor-beta (TGF-β)growth factor. mRNAs from cells that were eitheruntreated or induced by TGF-β were reverse transcribed tocDNA and evaluated by quantitative PCR. These primerpairs amplify portions of the Caveolin (Cav), ConnectiveTissue Growth Factor (CTGF), Elastin (Eln), Fibronectin(FN), Ribosomal protein L27, Perlecan (Perl) and Plas-minogen Activator Inhibitor 1 (PAI-1) murine codingsequences. The primers were designed using the PrimerExpress 1.5a software (PE Applied Biosystem, Foster City,CA, USA) to generate amplicon size ranging between 51and 149 base pairs (Additional File 1), and ampliconswere located towards the 3' end of the coding sequence.
At least 4–8 distinct biological cDNA samples were usedin conjunction with each of the 7 different target genes(amplicon). Each of these samples was serially diluted toobtain 10-fold, 50-fold, 100-fold and for some samples1000-fold dilutions from the undiluted (1-fold) sample.Each of these dilutions was measured in 5 replicate PCRreactions (4 replicates for the 1000× dilutions), using eachof the seven amplicons. This produced a data set of 704reactions. The complete raw data set is given in the Addi-tional File 2. Note that all sample were tested on the samePCR plate for a given amplicon. Thus we only addressedthe intra-plate variability in this article and not the inter-plate variability.
Page 13 of 16(page number not for citation purposes)

BMC Bioinformatics 2007, 8:131 http://www.biomedcentral.com/1471-2105/8/131
Quantitative PCR assaysSYBR green I technology was used for all quantitative PCRreactions, which were assembled using the Eurogentec kitRT-SN10-05 (Seraing, Belgium). Reactions were processedwith 5.9 μl of cDNA samples in 25 μl final volume. Onetip/well was used to distribute samples on the PCR platein order to increase reproducibility of the data. Primerswere all used at a final concentration of 100 nM and thespecificity of the amplification product was verified foreach reaction by examination of the corresponding disso-ciation curve. All PCR reactions were performed on an ABIPrism 7700 Sequence detector (PE Applied Biosystem,Foster City, CA, USA). For all reactions, cycling conditionswere 95°C for 15 min (denaturation) and then 40 cyclesof 95°C 15 sec – 62°C 1 min. Data acquisitions were per-formed with the SDS 1.9.1 software (PE Applied Biosys-tem, Foster City, CA, USA). Baseline limits were set assuggested by the manufacturer (i.e. at least two cyclesbefore the rise of the earliest amplification). Thresholdwas set to lie in the middle of the exponential phase of theamplification plot, so that efficiency values truly reflectthe reaction dynamic at the Ct. Unless otherwise noted inthe text, all efficiency values were determined using theLinReg method [13]. Data resulting from reactions thatdid not reach the threshold within the first 40 cycles (Ct =40) were discarded from the analysis.
EquationsThe full mathematical development of the followingequations can be found in the Additional File 6.
The exponential behaviour of DNA increase in the expo-nential phase is described as follows:
Nc = N0 · Ec (1)where Nc is the amount of PCR DNA product at cycle c; N0the initial amount of target dsDNA and E the PCR reactionefficiency.
When comparing distinct samples, the relative DNA con-centrations can be calculated as:
where RAB represents the initial concentration ratio ofsample A over B. Amplification efficiencies can be meas-ured by taking the log of both side of Eq. 1, which gives alinear function of log Nc = f(c):
log Nc = log N0 + c · log E (3)where the ordinate to the origin gives a direct estimate ofN0, and the slope an estimate of the amplification effi-ciency. But in fact it must be noted that qPCR measures
fluorescence that is proportional to the amount of DNA.Therefore Eq. 3 really measures F0, with F0 = k·N0. But thisis not so important when measuring relative level of DNAsince the ratio of initial fluorescence is equal to the initialratio of target DNA.
When c = Ct, Eq. 3 can be rearranged as:
This expresses Ct as a linear function of (log N0), with a
slope , allowing an estimation of a "mean"
efficiency over all samples:
Alternatively, sigmoid fitting of amplification can be per-formed using Eq. 6
where a, b and x0 are fitting parameters and c is the cyclenumber. The original amount of target DNA is given by:
Exponential fitting can also be performed but it requiresto first trim the data, removing values that are in phase III.Then the remaining data can be fitted using:
Nc = exp[a · (c - x0)] (8)where a and x0 are fitting parameters and c is the cyclenumber. The initial amount of target DNA is given by:
N0 = exp[-a · x0] (9)The propagation of error was determined using a Taylorexpansion to the first order. For the first part of the nor-malized ratio (Eq. 2), this led to:
where ΔRAB is the standard deviation of the ration ofamplicon A over amplicon B, and ΔA0 and ΔB0 the stand-ard deviation of the initial amount of target DNA ofamplicon A and B.
RA
B
E
EAB
BCt
ACt
B
A= =0
0(2)
CtE
NN
ECt= − ⋅ +1
0loglog
log
log(4)
mE
= − 1log
E m=−
101 (5)
Nax c
b
c =+ −⎛
⎝⎜⎞⎠⎟
1 0exp(6)
Na
xb
001
=+ ⎛
⎝⎜⎞⎠⎟
exp(7)
ΔΔ Δ
R RA
A
B
BAB AB= ⋅⎛
⎝⎜
⎞
⎠⎟ +
⎛
⎝⎜
⎞
⎠⎟0
0
20
0
2(10)
Page 14 of 16(page number not for citation purposes)
BMC Bioinformatics 2007, 8:131 http://www.biomedcentral.com/1471-2105/8/131
For the second part of the normalized ratio (Eq. 2), thepropagation of errors is described by:
Standard deviation on the efficiencies calculated with theSerial dilution were evaluated from the standard deviationof the slope of the regression using a Taylor expansion tothe first order for error propagation:
where ΔE is the standard deviation on the efficiency andΔm is the standard deviation of the slope of the regression.
Standard deviation on the efficiencies measured with Lin-Reg were obtained by averaging all efficiencies obtainedfrom the same data set used for the Serial dilution.
When comparing the expression of a gene in differentexperimental conditions, the useful figure is the normal-ized induction ratio:
where I1–2 is the ratio of the expression of the gene ofinterest (induction) between condition 1 and condition 2and RAB(i) is the normalized expression of the gene interest(Eq. 2) in condition i (1 or 2). Note that Eq. 13 is validonly if the gene used for the normalization (internalstandard) has an expression that is invariant with condi-tion 1 and 2 [38]. Error on induction values is given by
See Additional File 6 for the full mathematical develop-ment of Eq. 1 to Eq. 14.
Finally, the number of replicate needed to reach statisticalsignificance can be calculated as follows:
where n is the number of independent replicates,
the normalized reduced value related to significance level
α of the statistical test (here α was set to 0.05, which cor-responds to Z = 1.96) and CV the coefficient of variationrelated to the measured inductions. Range is defined as thelargest acceptable error on the measure, and it is set arbi-trarily by the experimenter. See Additional File 7 for thefull development of Eq. 15.
Authors' contributionsYK carried out the qPCR experiment, performed all of thestatistical tests and wrote the article. AMN carried outsome qPCR experiment. SP programmed the macro forthe non-linear fitting of the amplification plots. CM pro-vided the mathematical validation of the LinReg method.NM provided oversight of the work and helped finalizethe article.
Additional material
Δ Δ ΔR RCt
EE E Ct
Ct
EAB ABA
AA A A
B
B≅ ⋅
⎛
⎝⎜
⎞
⎠⎟ ⋅ ( ) + ( ) ⋅ ( ) +
⎛
⎝⎜
⎞
⎠⎟ ⋅
22 2 2
2
ln ΔΔ ΔE E CtB B B( ) + ( ) ⋅ ( )2 2 2ln
(11)
Δ ΔE E m= ⋅ ⋅( ln )10 2 (12)
IR
RAB
AB1 2
1
2− = ( )
( )(13)
ΔΔ Δ
I IR
R
R
RAB
AB
AB
AB1 2 1 2
1
1
22
2
2
− −= ⋅⎛
⎝⎜⎜
⎞
⎠⎟⎟ +
⎛
⎝⎜⎜
⎞
⎠⎟⎟
( )
( )
( )
( )
(14)
nCV I z
Range I
CV z
Ran
meas
meas
=⋅( ) ⎛
⎝⎜⎞⎠⎟
⋅( )=
⎛⎝⎜
⎞⎠⎟− −
21 2
2
2
21 2
2
α α
gge( )2
(15)
z1 2−α
Additional file 1Additional tables. Additional Table 1: Primer sequences and qPCR data-set description. Additional Table 2: Mean efficiency of each primer set. Additional Table 3: Induction ratio of extracellular matrix gene by TGF-β as assessed from 10 replicate assays. Additional Table 4: Induction ratio of extracellular matrix gene by TGF-β as assessed from 3 replicate assaysClick here for file[http://www.biomedcentral.com/content/supplementary/1471-2105-8-131-S1.pdf]
Additional file 2Complete set of data and macro. Excel file containing all raw qPCR data and the macro used into the present article.Click here for file[http://www.biomedcentral.com/content/supplementary/1471-2105-8-131-S2.ZIP]
Additional file 3Additional Figures. Additional Figure 1: Reproducibility of Ct measure-ments. Additional Figure 2: Precision and Robustness of the different models.Click here for file[http://www.biomedcentral.com/content/supplementary/1471-2105-8-131-S3.pdf]
Additional file 4Mathematical Justification of LinReg. Justification of the LinReg method to estimate PCR efficiency, when PCR is considered as a branch-ing process.Click here for file[http://www.biomedcentral.com/content/supplementary/1471-2105-8-131-S4.pdf]
Additional file 5ΔCt systematic bias. When not fulfilled, the ΔCt assumption of equal efficiency induces a bias in induction estimates. Equations are developed to estimate the bias as a function of the real efficiency.Click here for file[http://www.biomedcentral.com/content/supplementary/1471-2105-8-131-S5.pdf]
Page 15 of 16(page number not for citation purposes)
BMC Bioinformatics 2007, 8:131 http://www.biomedcentral.com/1471-2105/8/131
AcknowledgementsWe thank prof S. Morgenthaler for help with the multi-ANOVA procedure and for helpful comments on the statistical test used herein. The financial support of the Swiss national Science Foundation and from the Etat de Vaud is gratefully acknowledged.
References1. Ailenberg M, Silverman M: Controlled hot start and improved
specificity in carrying out PCR utilizing touch-up and loopincorporated primers (TULIPS). Biotechniques 2000,29(5):1018-20, 1022-4.
2. Etienne W, Meyer MH, Peppers J, Meyer RA Jr.: Comparison ofmRNA gene expression by RT-PCR and DNA microarray.Biotechniques 2004, 36(4):618-20, 622, 624-6.
3. Rajeevan MS, Ranamukhaarachchi DG, Vernon SD, Unger ER: Use ofreal-time quantitative PCR to validate the results of cDNAarray and differential display PCR technologies. Methods 2001,25(4):443-451.
4. Higuchi R, Dollinger G, Walsh PS, Griffith R: Simultaneous ampli-fication and detection of specific DNA sequences. Biotechnol-ogy (N Y) 1992, 10(4):413-417.
5. Wittwer CT, Herrmann MG, Moss AA, Rasmussen RP: Continuousfluorescence monitoring of rapid cycle DNA amplification.Biotechniques 1997, 22(1):130-1, 134-8.
6. Peccoud J, Jacob C: Theoretical uncertainty of measurementsusing quantitative polymerase chain reaction. Biophys J 1996,71(1):101-108.
7. Stolovitzky G, Cecchi G: Efficiency of DNA replication in thepolymerase chain reaction. Proc Natl Acad Sci U S A 1996,93(23):12947-12952.
8. Livak KJ, Schmittgen TD: Analysis of relative gene expressiondata using real-time quantitative PCR and the 2(-Delta DeltaC(T)) Method. Methods 2001, 25(4):402-408.
9. Higuchi R, Fockler C, Dollinger G, Watson R: Kinetic PCR analy-sis: real-time monitoring of DNA amplification reactions.Biotechnology (N Y) 1993, 11(9):1026-1030.
10. Livak KJ: ABI Prism 7700 sequence detection system. UserBulletin 2. P E Applied Biosystems 1997.
11. Liu W, Saint DA: A new quantitative method of real timereverse transcription polymerase chain reaction assay basedon simulation of polymerase chain reaction kinetics. Anal Bio-chem 2002, 302(1):52-59.
12. Gentle A, Anastasopoulos F, McBrien NA: High-resolution semi-quantitative real-time PCR without the use of a standardcurve. Biotechniques 2001, 31(3):502, 504-6, 508.
13. Ramakers C, Ruijter JM, Deprez RH, Moorman AF: Assumption-free analysis of quantitative real-time polymerase chainreaction (PCR) data. Neurosci Lett 2003, 339(1):62-66.
14. Liu W, Saint DA: Validation of a quantitative method for realtime PCR kinetics. Biochem Biophys Res Commun 2002,294(2):347-353.
15. Wong ML, Medrano JF: Real-time PCR for mRNA quantitation.Biotechniques 2005, 39(1):75-85.
16. Bustin SA: Absolute quantification of mRNA using real-timereverse transcription polymerase chain reaction assays. J MolEndocrinol 2000, 25(2):169-193.
17. Schmittgen TD, Zakrajsek BA, Mills AG, Gorn V, Singer MJ, ReedMW: Quantitative reverse transcription-polymerase chainreaction to study mRNA decay: comparison of endpoint andreal-time methods. Anal Biochem 2000, 285(2):194-204.
18. Rosner B: Fundamentals in biostatistics. 5th edit. edition. Dux-bury ed.; 2000:518-520.
19. Pankiewicz R, Karlen Y, Imhof MO, Mermod N: Reversal of thesilencing of tetracycline-controlled genes requires the coor-dinate action of distinctly acting transcription factors. J GeneMed 2005, 7(1):117-132.
20. Ginzinger DG: Gene quantification using real-time quantita-tive PCR: an emerging technology hits the mainstream. ExpHematol 2002, 30(6):503-512.
21. Mackay IM, Arden KE, Nitsche A: Real-time PCR in virology.Nucleic Acids Res 2002, 30(6):1292-1305.
22. Keski-Oja J, Raghow R, Sawdey M, Loskutoff DJ, Postlethwaite AE,Kang AH, Moses HL: Regulation of mRNAs for type-1 plas-minogen activator inhibitor, fibronectin, and type I procolla-gen by transforming growth factor-beta. Divergentresponses in lung fibroblasts and carcinoma cells. J Biol Chem1988, 263(7):3111-3115.
23. Igarashi A, Okochi H, Bradham DM, Grotendorst GR: Regulation ofconnective tissue growth factor gene expression in humanskin fibroblasts and during wound repair. Mol Biol Cell 1993,4(6):637-645.
24. Morrison TB, Weis JJ, Wittwer CT: Quantification of low-copytranscripts by continuous SYBR Green I monitoring duringamplification. Biotechniques 1998, 24(6):954-8, 960, 962.
25. Peccoud J, Jacob C: Statistical estimations of PCR amplificationrates. In Gene Quantification Edited by: ed. FF. Birkhäuser, NewYork;1998:111-128.
26. Raeymaekers L: Quantitative PCR: theoretical considerationswith practical implications. Anal Biochem 1993, 214(2):582-585.
27. Freeman WM, Walker SJ, Vrana KE: Quantitative RT-PCR: pit-falls and potential. Biotechniques 1999, 26(1):112-22, 124-5.
28. Marino JH, Cook P, Miller KS: Accurate and statistically verifiedquantification of relative mRNA abundances using SYBRGreen I and real-time RT-PCR. J Immunol Methods 2003, 283(1-2):291-306.
29. Tichopad A, Didier A, Pfaffl MW: Inhibition of real-time RT-PCRquantification due to tissue-specific contaminants. Mol CellProbes 2004, 18(1):45-50.
30. Tichopad A, Dzidic A, Pfaffl MW: Improving quantitative real-time RT-PCR reproducibility by boosting primer-linkedamplification efficiency . Biotechnology Letters 2002, 24:2053-2056.
31. Stahlberg A, Aman P, Ridell B, Mostad P, Kubista M: Quantitativereal-time PCR method for detection of B-lymphocyte mon-oclonality by comparison of kappa and lambda immunoglob-ulin light chain expression. Clin Chem 2003, 49(1):51-59.
32. Golenberg EM, Bickel A, Weihs P: Effect of highly fragmentedDNA on PCR. Nucleic Acids Res 1996, 24(24):5026-5033.
33. Sikorsky JA, Primerano DA, Fenger TW, Denvir J: Effect of DNAdamage on PCR amplification efficiency with the relativethreshold cycle method. Biochem Biophys Res Commun 2004,323(3):823-830.
34. Yuan JS, Reed A, Chen F, Stewart CN Jr.: Statistical analysis ofreal-time PCR data. BMC Bioinformatics 2006, 7:85.
35. Rutledge RG: Sigmoidal curve-fitting redefines quantitativereal-time PCR with the prospective of developing auto-mated high-throughput applications. Nucleic Acids Res 2004,32(22):e178.
36. Goll R, Olsen T, Cui G, Florholmen J: Evaluation of absolutequantitation by nonlinear regression in probe-based real-time PCR. BMC Bioinformatics 2006, 7:107.
37. Feller W: On the logistic law of growth and its empirical veri-fication in biology. Acta Bioth Ser A 1940, 2:51-66.
38. Sturzenbaum SR, Kille P: Control genes in quantitative molecu-lar biological techniques: the variability of invariance. CompBiochem Physiol B Biochem Mol Biol 2001, 130(3):281-289.
Additional file 6Equation development. Detailed development of all equations 1–14 of the Methods section.Click here for file[http://www.biomedcentral.com/content/supplementary/1471-2105-8-131-S6.pdf]
Additional file 7Statistical significance and required sample size. Presentation of all of the equations leading to the development of eq.15 of the Methods section.Click here for file[http://www.biomedcentral.com/content/supplementary/1471-2105-8-131-S7.pdf]
Page 16 of 16(page number not for citation purposes)