[email protected] mth15_lec-14_sec_3-2_concavity_inflection_.pptx 1 bruce mayer, pe chabot...
TRANSCRIPT

[email protected] • MTH15_Lec-14_sec_3-2_Concavity_Inflection_.pptx1
Bruce Mayer, PE Chabot College Mathematics
Bruce Mayer, PELicensed Electrical & Mechanical Engineer
Chabot Mathematics
§3.2 Concavity
& Inflection

[email protected] • MTH15_Lec-14_sec_3-2_Concavity_Inflection_.pptx2
Bruce Mayer, PE Chabot College Mathematics
Review §
Any QUESTIONS About• §3.1 → Relative Extrema
Any QUESTIONS About HomeWork• §3.1 →
HW-13
3.1
[email protected] • MTH15_Lec-14_sec_3-2_Concavity_Inflection_.pptx3
Bruce Mayer, PE Chabot College Mathematics
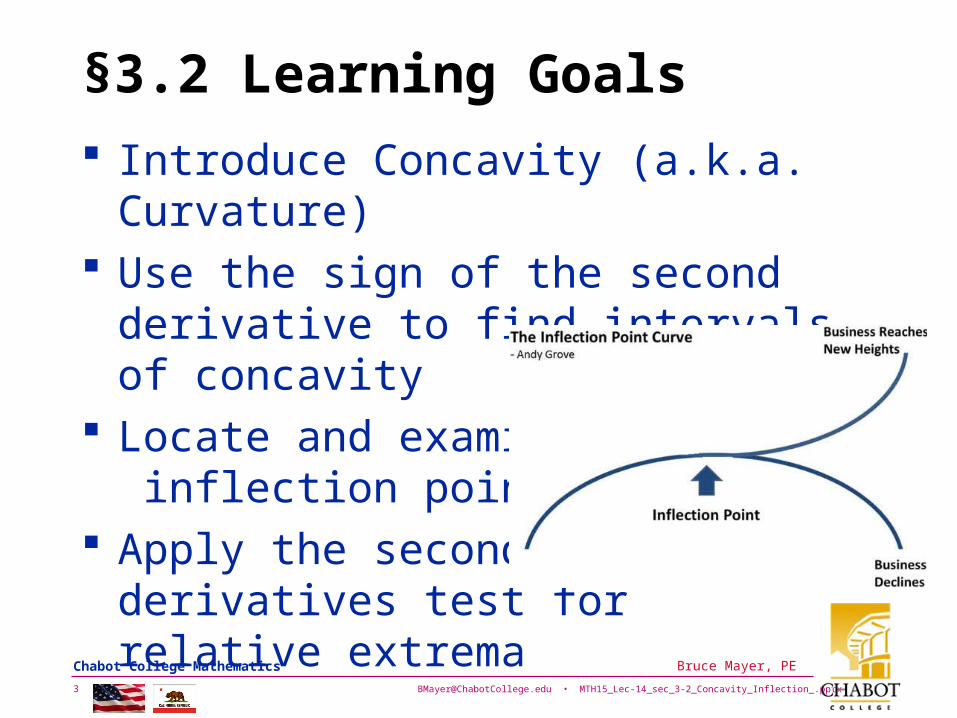
§3.2 Learning Goals
Introduce Concavity (a.k.a. Curvature) Use the sign of the second derivative to
find intervals of concavity Locate and examine
inflection points Apply the second
derivatives test for relative extrema

[email protected] • MTH15_Lec-14_sec_3-2_Concavity_Inflection_.pptx4
Bruce Mayer, PE Chabot College Mathematics
ConCavity Described
Concavity quantifies the Slope-Value Trend (Sign & Magnitude) of a fcn when moving Left→Right on the fcn Graph
1 2 3 4-5
-4
-3
-2
-1
0
1
2
3
Position, x
m =
df/d
x
MTH15 • BLUE
1 2 3 4-5
-4
-3
-2
-1
0
1
2
3
Position, x
MTH15 • RED
m≈+
2.2
m≈0
m≈−1.4
m≈−4.4
m≈−4.4
m≈−1.4
m≈+
2.2

[email protected] • MTH15_Lec-14_sec_3-2_Concavity_Inflection_.pptx5
Bruce Mayer, PE Chabot College Mathematics
MA
TL
AB
Co
de
% Bruce Mayer, PE% MTH-15 •11Jul133% XYfcnGraph6x6BlueGreenBkGndTemplate1306.m% % The datablue =[2.2 0 -1.4 -4.4]red = [-4.4 -1.4 0 2.2]%% the 6x6 Plotaxes; set(gca,'FontSize',12);subplot(1,2,1)bar(blue, 'b'), grid, xlabel('\fontsize{14}Position, x'), ylabel('\fontsize{14}m = df/dx'),... title(['\fontsize{16}MTH15 • BLUE',]), axis([0 5 -5,3])subplot(1,2,2)bar(red, 'r'), grid, xlabel('\fontsize{14}Position, x'), axis([0 5 -5,3]),... title(['\fontsize{16}MTH15 • RED',])set(get(gco,'BaseLine'),'LineWidth',4,'LineStyle',':')
[email protected] • MTH15_Lec-14_sec_3-2_Concavity_Inflection_.pptx6
Bruce Mayer, PE Chabot College Mathematics
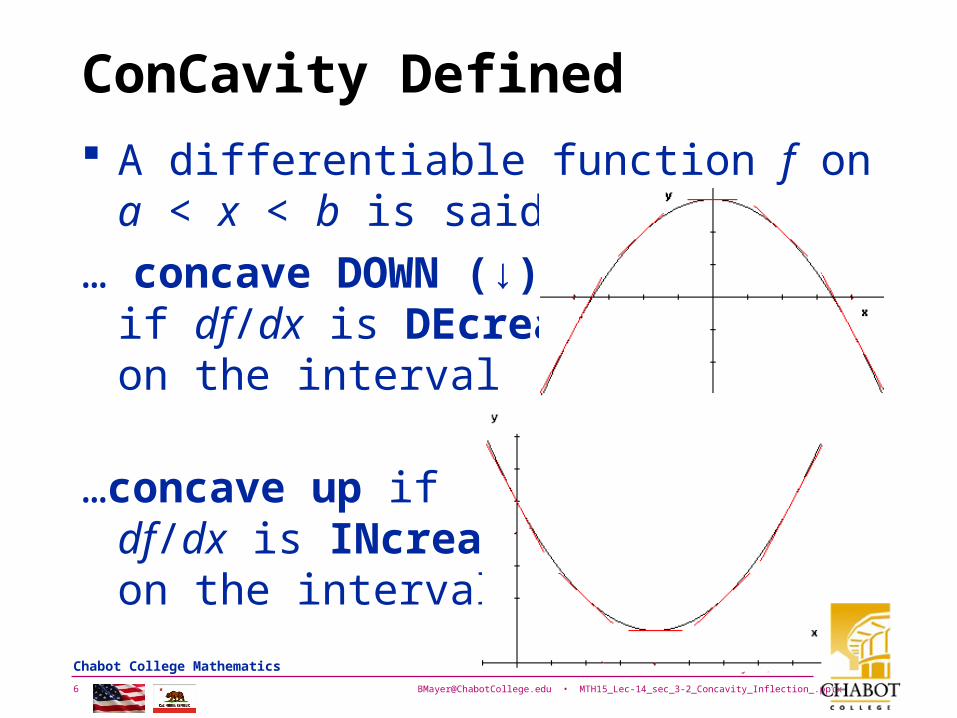
ConCavity Defined
A differentiable function f on a < x < b is said to be:
… concave DOWN (↓) if df/dx is DEcreasing on the interval
…concave up if df/dx is INcreasing on the interval.
[email protected] • MTH15_Lec-14_sec_3-2_Concavity_Inflection_.pptx7
Bruce Mayer, PE Chabot College Mathematics
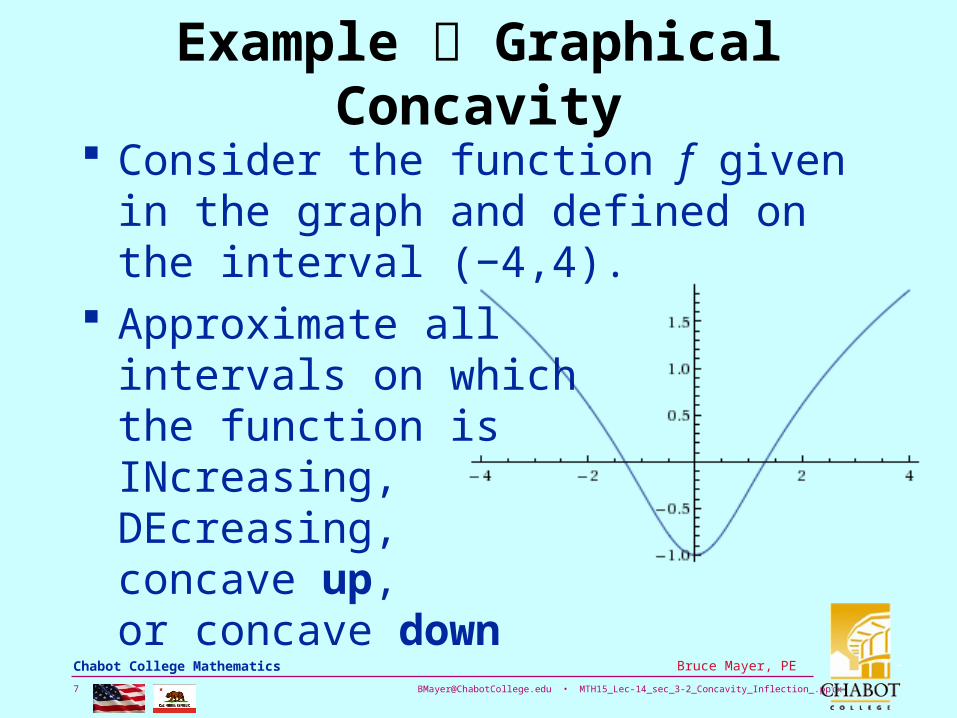
Example Graphical Concavity
Consider the function f given in the graph and defined on the interval (−4,4).
Approximate all intervals on which the function is INcreasing, DEcreasing, concave up, or concave down

[email protected] • MTH15_Lec-14_sec_3-2_Concavity_Inflection_.pptx8
Bruce Mayer, PE Chabot College Mathematics
Example Graphical Concavity
SOLUTION Because we have NO equation for the
function, we need to use our best judgment: • around where the
graph changes directions (increasing/decreasing)
• where the derivative of the graph changes directions (concave up or down).

[email protected] • MTH15_Lec-14_sec_3-2_Concavity_Inflection_.pptx9
Bruce Mayer, PE Chabot College Mathematics
Example Graphical Concavity
To determine where the function is INcreasing, we look for the graph to “Rise to the Right (RR)”
Rising

[email protected] • MTH15_Lec-14_sec_3-2_Concavity_Inflection_.pptx10
Bruce Mayer, PE Chabot College Mathematics
Example Graphical Concavity
Similarly, the function is DEcreasing where the graph “Falls to the Right (FR)”:
Falling

[email protected] • MTH15_Lec-14_sec_3-2_Concavity_Inflection_.pptx11
Bruce Mayer, PE Chabot College Mathematics
Example Graphical Concavity
Conclude that f is increasing on the interval (0,4) and decreasing on the interval (−4,0)
Now ExamineConcavity.
Falling to Rt Rising to Rt
[email protected] • MTH15_Lec-14_sec_3-2_Concavity_Inflection_.pptx12
Bruce Mayer, PE Chabot College Mathematics
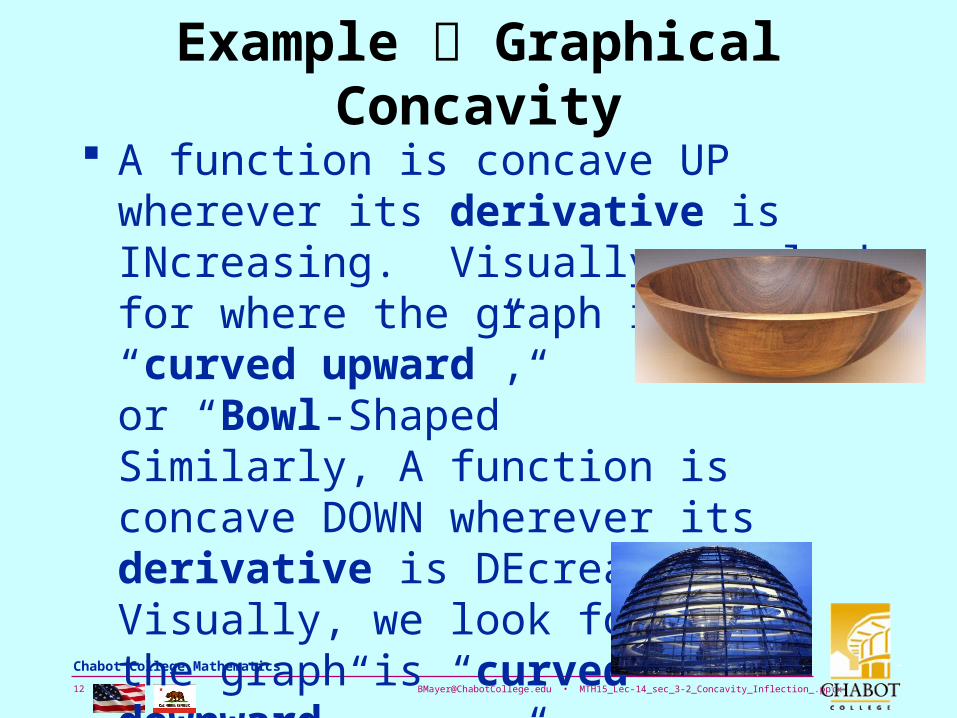
Example Graphical Concavity
A function is concave UP wherever its derivative is INcreasing. Visually, we look for where the graph is“curved upward”, or “Bowl-Shaped”Similarly, A function is concave DOWN wherever its derivative is DEcreasing. Visually, we look for where the graph is “curved downward”, or “Dome-Shaped”

[email protected] • MTH15_Lec-14_sec_3-2_Concavity_Inflection_.pptx13
Bruce Mayer, PE Chabot College Mathematics
Example Graphical Concavity
The graph is “curved UPward” for values of x near zero, and might guess the curvature to be positive between −1 & 1
f is ConCave UP
[email protected] • MTH15_Lec-14_sec_3-2_Concavity_Inflection_.pptx14
Bruce Mayer, PE Chabot College Mathematics
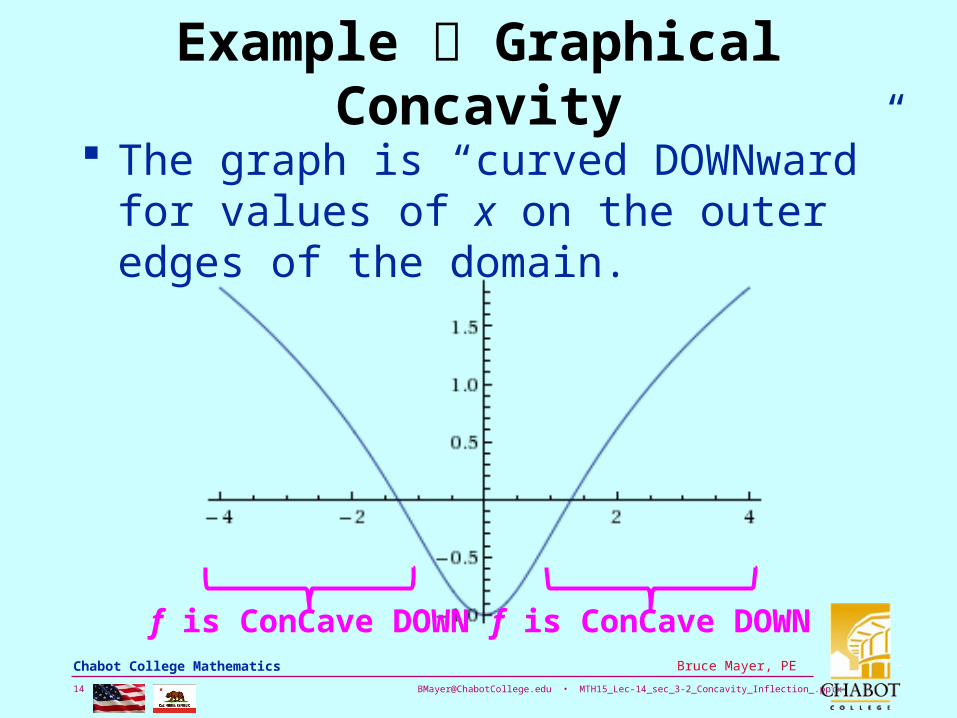
Example Graphical Concavity
The graph is “curved DOWNward” for values of x on the outer edges of the domain.
f is ConCave DOWN f is ConCave DOWN

[email protected] • MTH15_Lec-14_sec_3-2_Concavity_Inflection_.pptx15
Bruce Mayer, PE Chabot College Mathematics
Example Graphical Concavity
Thus the function is concave UP approximately on the interval (−1,1) and concave DOWN on the intervals (−4, −1) & (1,4)
f is ConCave UPf is ConCave DOWN f is ConCave DOWN

[email protected] • MTH15_Lec-14_sec_3-2_Concavity_Inflection_.pptx16
Bruce Mayer, PE Chabot College Mathematics
Inflection Point Defined
A function has an inflection point at x=a if f is continuous and the CONCAVITY of f CHANGES at Pt-a
-2 -1 0 1 2 3 4 5 6 7 8 9-50
-40
-30
-20
-10
0
10
20
30
40
50
x
y =
f(x)
MTH15 • Inflection Point
ConCave DOWN
ConCave UP
InflectionPoint
[email protected] • MTH15_Lec-14_sec_3-2_Concavity_Inflection_.pptx17
Bruce Mayer, PE Chabot College Mathematics
MA
TL
AB
Co
de
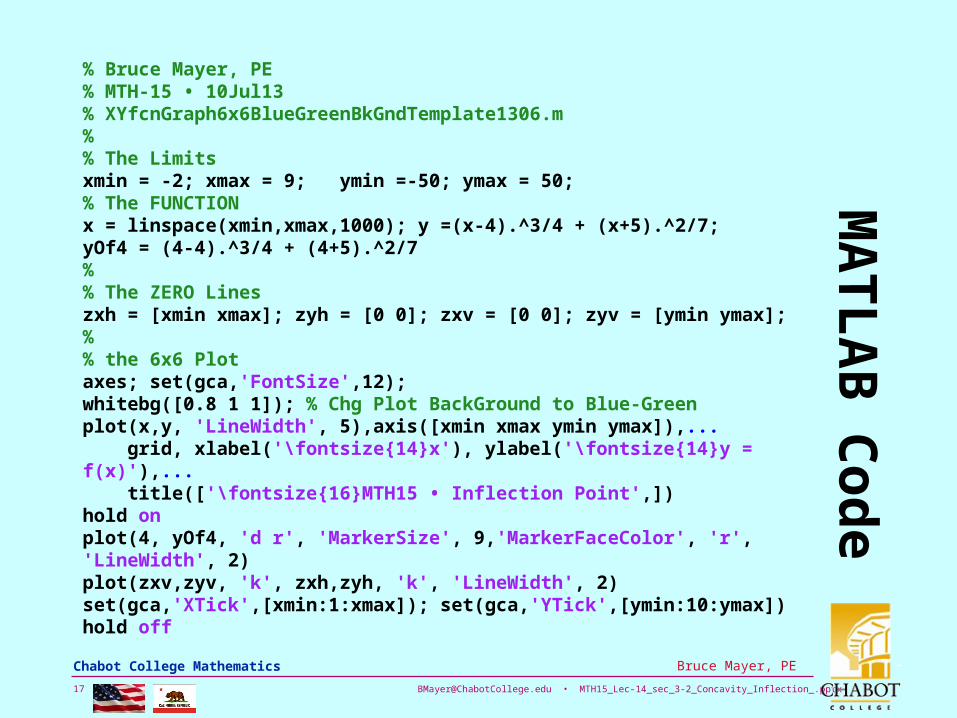
% Bruce Mayer, PE% MTH-15 • 10Jul13% XYfcnGraph6x6BlueGreenBkGndTemplate1306.m%% The Limitsxmin = -2; xmax = 9; ymin =-50; ymax = 50;% The FUNCTIONx = linspace(xmin,xmax,1000); y =(x-4).^3/4 + (x+5).^2/7;yOf4 = (4-4).^3/4 + (4+5).^2/7 % % The ZERO Lineszxh = [xmin xmax]; zyh = [0 0]; zxv = [0 0]; zyv = [ymin ymax];%% the 6x6 Plotaxes; set(gca,'FontSize',12);whitebg([0.8 1 1]); % Chg Plot BackGround to Blue-Greenplot(x,y, 'LineWidth', 5),axis([xmin xmax ymin ymax]),... grid, xlabel('\fontsize{14}x'), ylabel('\fontsize{14}y = f(x)'),... title(['\fontsize{16}MTH15 • Inflection Point',])hold onplot(4, yOf4, 'd r', 'MarkerSize', 9,'MarkerFaceColor', 'r', 'LineWidth', 2)plot(zxv,zyv, 'k', zxh,zyh, 'k', 'LineWidth', 2)set(gca,'XTick',[xmin:1:xmax]); set(gca,'YTick',[ymin:10:ymax])hold off
[email protected] • MTH15_Lec-14_sec_3-2_Concavity_Inflection_.pptx18
Bruce Mayer, PE Chabot College Mathematics
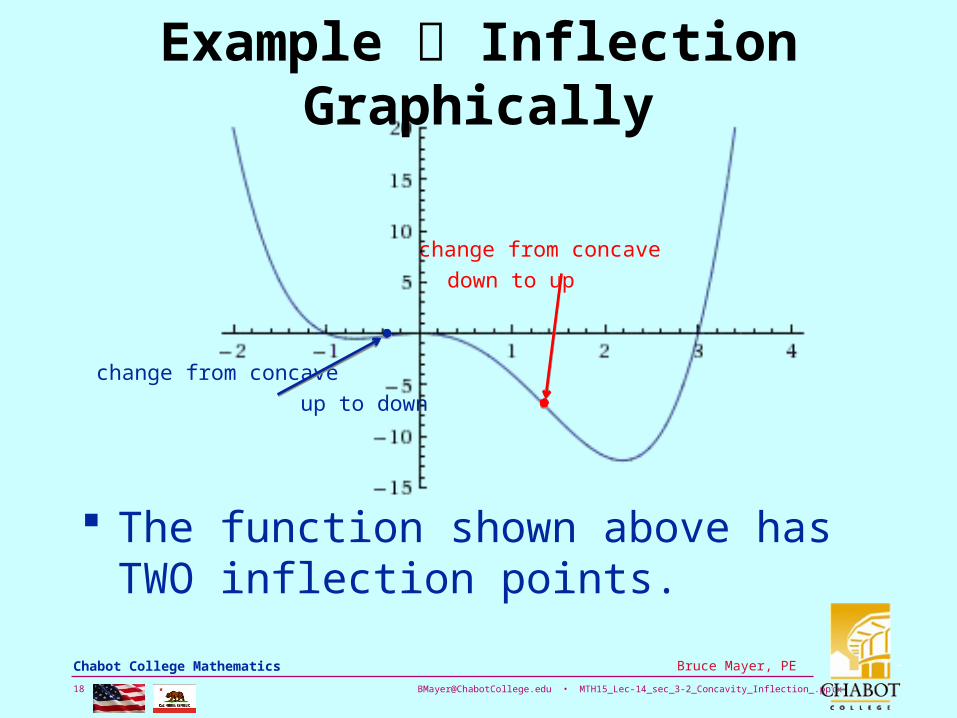
Example Inflection Graphically
The function shown above has TWO inflection points.
change from concave
down to up
change from concave
up to down
[email protected] • MTH15_Lec-14_sec_3-2_Concavity_Inflection_.pptx19
Bruce Mayer, PE Chabot College Mathematics
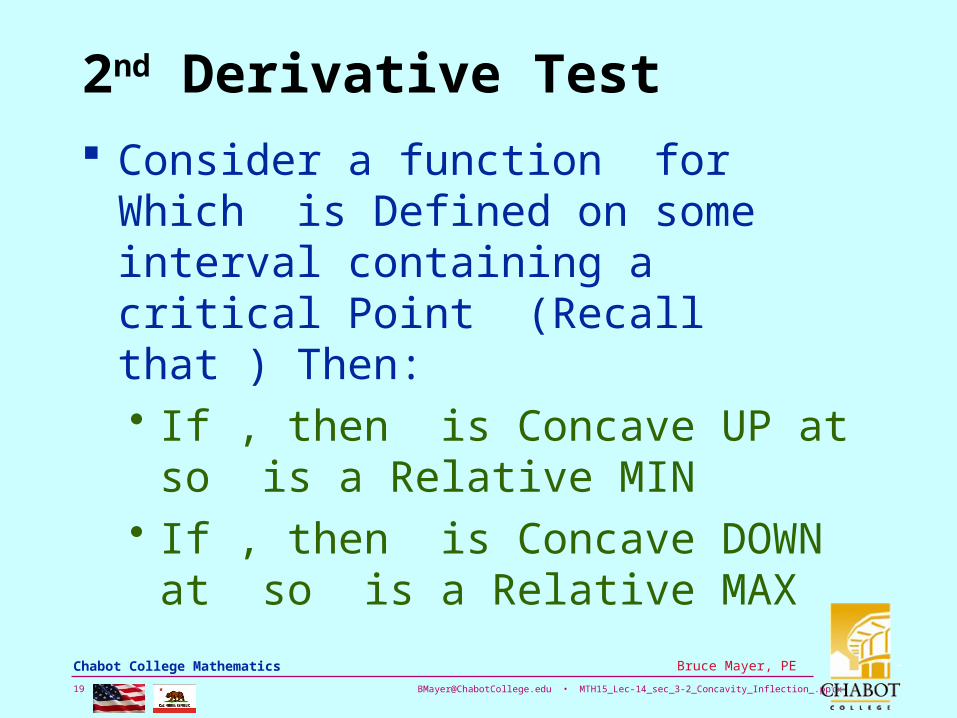
2nd Derivative Test
Consider a function for Which is Defined on some interval containing a critical Point (Recall that ) Then:• If , then is Concave UP at so is a
Relative MIN• If , then is Concave DOWN at so is
a Relative MAX

[email protected] • MTH15_Lec-14_sec_3-2_Concavity_Inflection_.pptx20
Bruce Mayer, PE Chabot College Mathematics
Example Apply 2nd Deriv Test
Use the 2nd Derivative Test to Find and classify all critical points for the Function
SOLUTION Find the
critical points by solving:
1
2
x
xxf
0' xfdx
df
2
2
)1(
12)1(
x
xxx
dx
df

[email protected] • MTH15_Lec-14_sec_3-2_Concavity_Inflection_.pptx21
Bruce Mayer, PE Chabot College Mathematics
Example Apply 2nd Deriv Test
By Zero-Products:
Also need to check for values of x that make the derivative undefined.• ReCall the
1st Derivative: • Thus df/dx is UNdefined for x = −1, But the
ORIGINAL function is ALSO Undefined at the this value– Thus there is NO Critical Point at x = −1
2OR020 xxxx
2
2
)1(
2
x
xx
dx
df

[email protected] • MTH15_Lec-14_sec_3-2_Concavity_Inflection_.pptx22
Bruce Mayer, PE Chabot College Mathematics
Example Apply 2nd Deriv Test
Thus the only critical points are at −2 & 0 Now use the second derivative test to
determine whether each is a MAXimum or MINimum (or if the test is InConclusive):
2
2
2
2
1
2
x
xx
dx
d
dx
yd
4
22
1
1122221
x
xxxxx

[email protected] • MTH15_Lec-14_sec_3-2_Concavity_Inflection_.pptx23
Bruce Mayer, PE Chabot College Mathematics
Example Apply 2nd Deriv Test
Before expanding the BiNomials, note that the numerator and denominator can be simplified by removing a common factor of (x+1) from all terms:
4
22
2
2
1
1122221
x
xxxxx
dx
fd
3
2
2
2
11
222211
xx
xxxxx
dx
fd
3
2
2
2
1
22221
x
xxxx
dx
fd

[email protected] • MTH15_Lec-14_sec_3-2_Concavity_Inflection_.pptx24
Bruce Mayer, PE Chabot College Mathematics
Example Apply 2nd Deriv Test
Now expand BiNomials:
Now Check Value of f’’’(0) & f’’’(−2)
3
22
2
2
1
422222
x
xxxxx
dx
fd3)1(
2
x
210
20''
212
22''
3
0
2
2
3
2
2
2
x
x
dx
fdf
dx
fdf 0
0

[email protected] • MTH15_Lec-14_sec_3-2_Concavity_Inflection_.pptx25
Bruce Mayer, PE Chabot College Mathematics
Example Apply 2nd Deriv Test
The 2nd Derivative is NEGATIVE at x = −2• Thus the orginal fcn is ConCave
DOWN at x = −2, and aRelative MAX exists at this Pt
Conversely, 2nd Derivative is POSITIVE at x = 0• Thus the orginal fcn is ConCave UP at x = 0
and a Relative MIN exists at this Pt
2
2
0
2
2
2
2
2
x
x
dx
fd
dx
fd
[email protected] • MTH15_Lec-14_sec_3-2_Concavity_Inflection_.pptx26
Bruce Mayer, PE Chabot College Mathematics
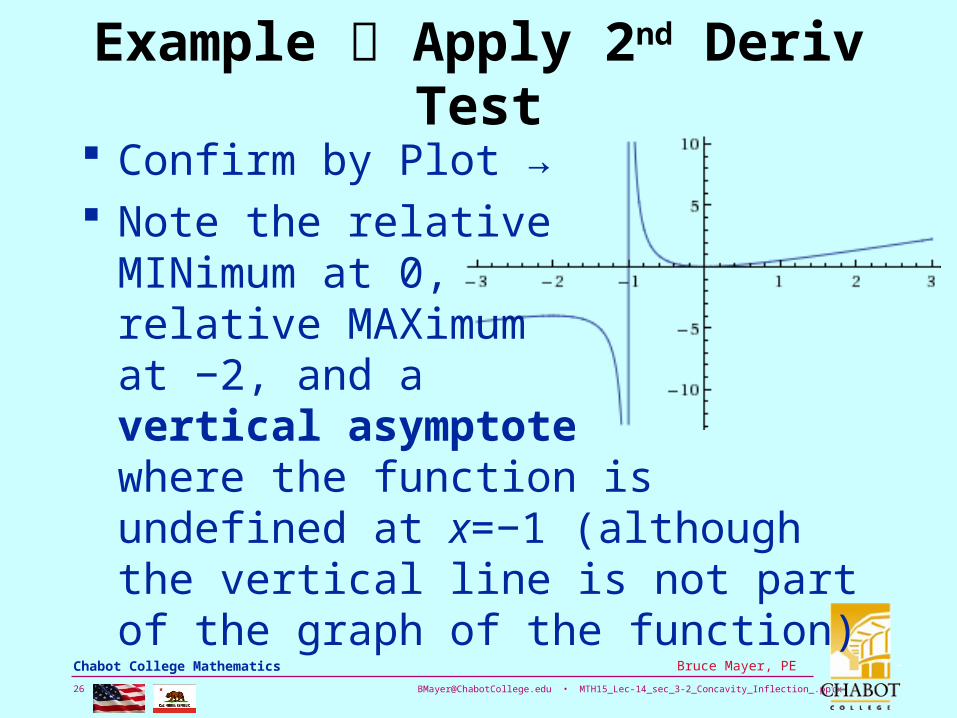
Example Apply 2nd Deriv Test
Confirm by Plot → Note the relative
MINimum at 0, relative MAXimumat −2, and a vertical asymptote where the function is undefined at x=−1 (although the vertical line is not part of the graph of the function)
[email protected] • MTH15_Lec-14_sec_3-2_Concavity_Inflection_.pptx27
Bruce Mayer, PE Chabot College Mathematics
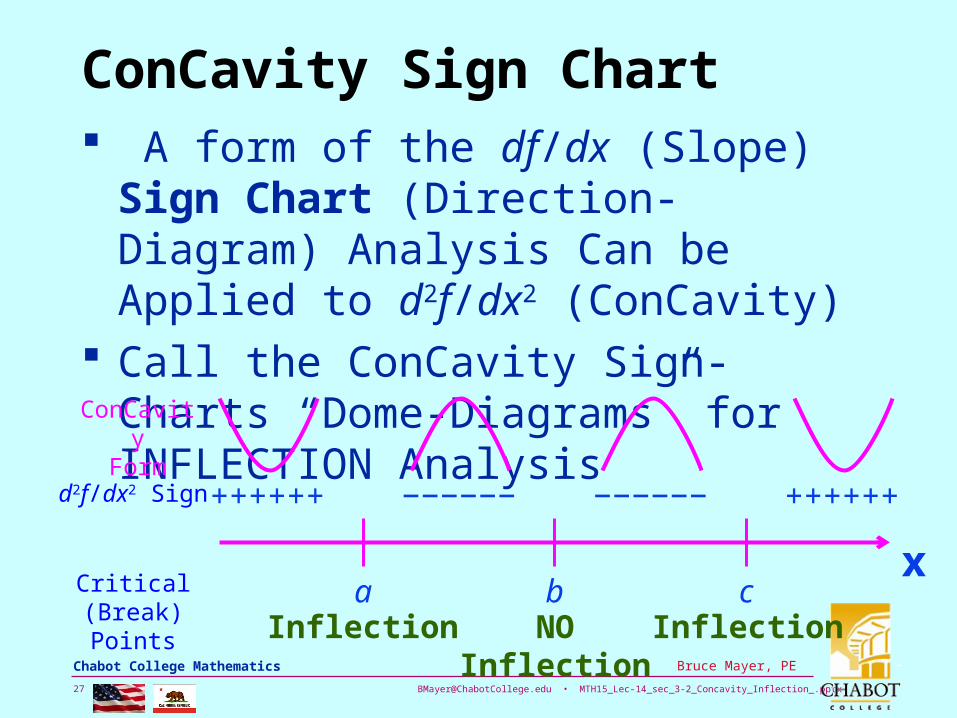
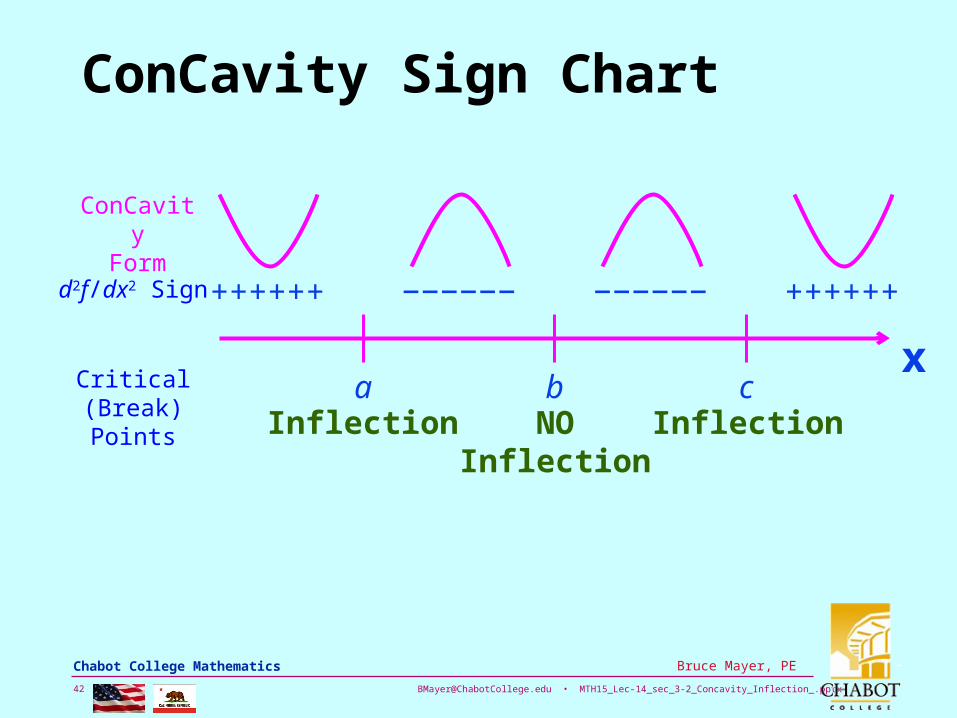
ConCavity Sign Chart A form of the df/dx (Slope) Sign Chart
(Direction-Diagram) Analysis Can be Applied to d2f/dx2 (ConCavity)
Call the ConCavity Sign-Charts “Dome-Diagrams” for INFLECTION Analysis
a b c
−−−−−−++++++ −−−−−− ++++++
x
ConCavityForm
d2f/dx2 Sign
Critical (Break)Points Inflection NO
InflectionInflection
[email protected] • MTH15_Lec-14_sec_3-2_Concavity_Inflection_.pptx28
Bruce Mayer, PE Chabot College Mathematics
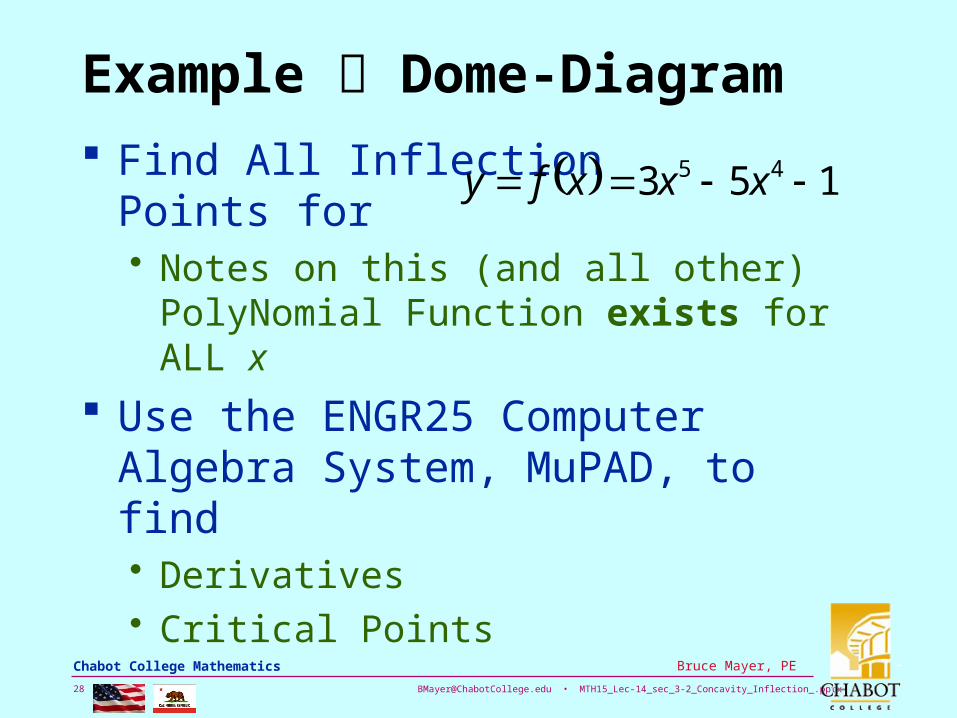
Example Dome-Diagram
Find All Inflection Points for • Notes on this (and all other) PolyNomial
Function exists for ALL x
Use the ENGR25 Computer Algebra System, MuPAD, to find • Derivatives• Critical Points
153 45 xxxfy

[email protected] • MTH15_Lec-14_sec_3-2_Concavity_Inflection_.pptx29
Bruce Mayer, PE Chabot College Mathematics
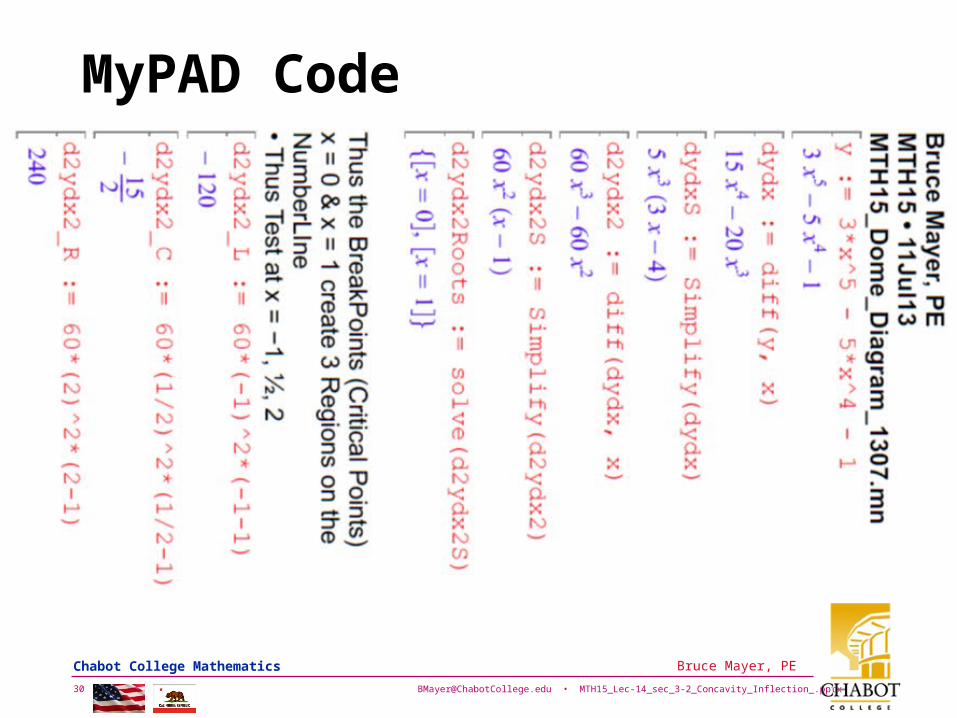
Example Dome-Diagram The Derivatives
The Critical Points
The ConCavity Values Between Break Pts• At x = −1
• At x = ½
• At x = ½
[email protected] • MTH15_Lec-14_sec_3-2_Concavity_Inflection_.pptx30
Bruce Mayer, PE Chabot College Mathematics
MyPAD Code

[email protected] • MTH15_Lec-14_sec_3-2_Concavity_Inflection_.pptx31
Bruce Mayer, PE Chabot College Mathematics
Example Dome-Diagram
Draw Dome-Diagram
The ConCavity Does NOT change at 0, but it DOES at 1• Since Inflection requires Change, the
only Inflection-Pt occurs at x = 1
0 1
−−−−−−−−−−−− ++++++
x
ConCavityForm
d2f/dx2 Sign
Critical (Break)Points NO
InflectionInflection
[email protected] • MTH15_Lec-14_sec_3-2_Concavity_Inflection_.pptx32
Bruce Mayer, PE Chabot College Mathematics
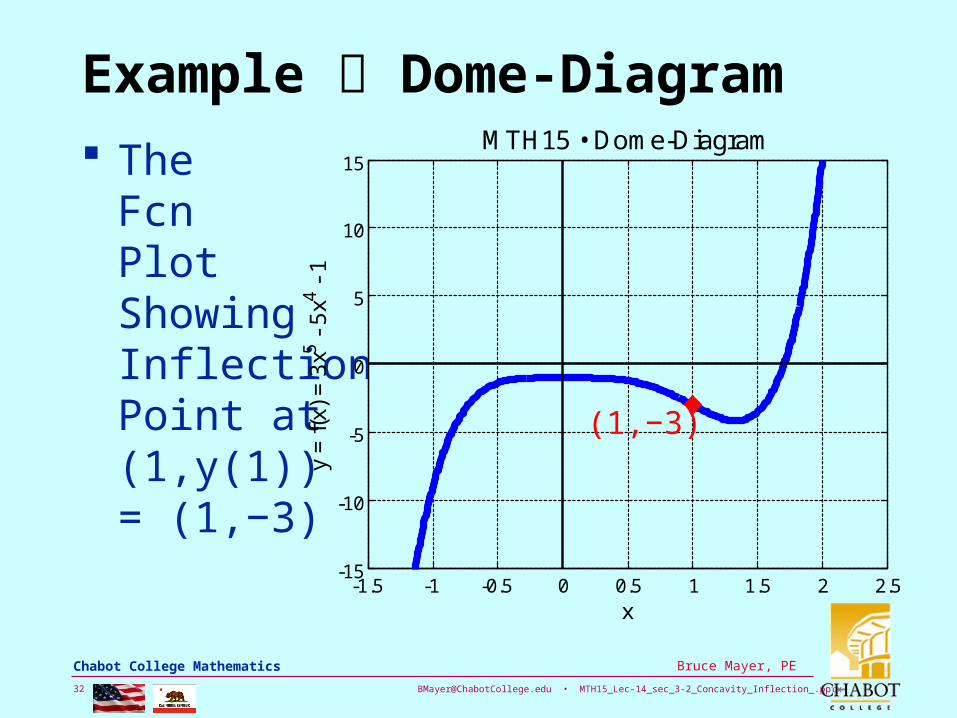
Example Dome-Diagram
TheFcnPlotShowingInflectionPoint at(1,y(1))= (1,−3)
-1.5 -1 -0.5 0 0.5 1 1.5 2 2.5-15
-10
-5
0
5
10
15
x
y =
f(x)
= 3
x5 - 5
x4 - 1
MTH15 • Dome-Diagram
(1,−3)

[email protected] • MTH15_Lec-14_sec_3-2_Concavity_Inflection_.pptx33
Bruce Mayer, PE Chabot College Mathematics
MA
TL
AB
Co
de
% Bruce Mayer, PE% MTH-15 • 11Jul13% XYfcnGraph6x6BlueGreenBkGndTemplate1306.m%% The Limitsxmin = -1.5; xmax = 2.5; ymin =-15; ymax = 15;% The FUNCTIONx = linspace(xmin,xmax,1000); y =3*x.^5 - 5*x.^4 - 1;% % The ZERO Lineszxh = [xmin xmax]; zyh = [0 0]; zxv = [0 0]; zyv = [ymin ymax];%% the 6x6 Plotaxes; set(gca,'FontSize',12);whitebg([0.8 1 1]); % Chg Plot BackGround to Blue-Greenplot(x,y, 'LineWidth', 5),axis([xmin xmax ymin ymax]),... grid, xlabel('\fontsize{14}x'), ylabel('\fontsize{14}y = f(x) = 3x^5 - 5x^4 - 1'),... title(['\fontsize{16}MTH15 • Dome-Diagram',])hold onplot(1,-3, 'd r', 'MarkerSize', 10,'MarkerFaceColor', 'r', 'LineWidth', 2)plot(zxv,zyv, 'k', zxh,zyh, 'k', 'LineWidth', 2)set(gca,'XTick',[xmin:0.5:xmax]); set(gca,'YTick',[ymin:5:ymax])hold off

[email protected] • MTH15_Lec-14_sec_3-2_Concavity_Inflection_.pptx34
Bruce Mayer, PE Chabot College Mathematics
Example Population Growth
A population model finds that the number of people, P, living in a city, in kPeople, t years after the beginning of 2010 will be:
Questions • In what year will the population be
decreasing most rapidly? • What will be the population at that time?
105109 23 ttttP

[email protected] • MTH15_Lec-14_sec_3-2_Concavity_Inflection_.pptx35
Bruce Mayer, PE Chabot College Mathematics
Example Population Growth
SOLUTION: “Decreasing most rapidly” is a phrase
that requires some examination. “Decreasing” suggests a negative derivative.
“Decreasing most rapidly” means a value for which the negative derivative is as negative as possible. In other words, where the derivative is a MIN
[email protected] • MTH15_Lec-14_sec_3-2_Concavity_Inflection_.pptx36
Bruce Mayer, PE Chabot College Mathematics
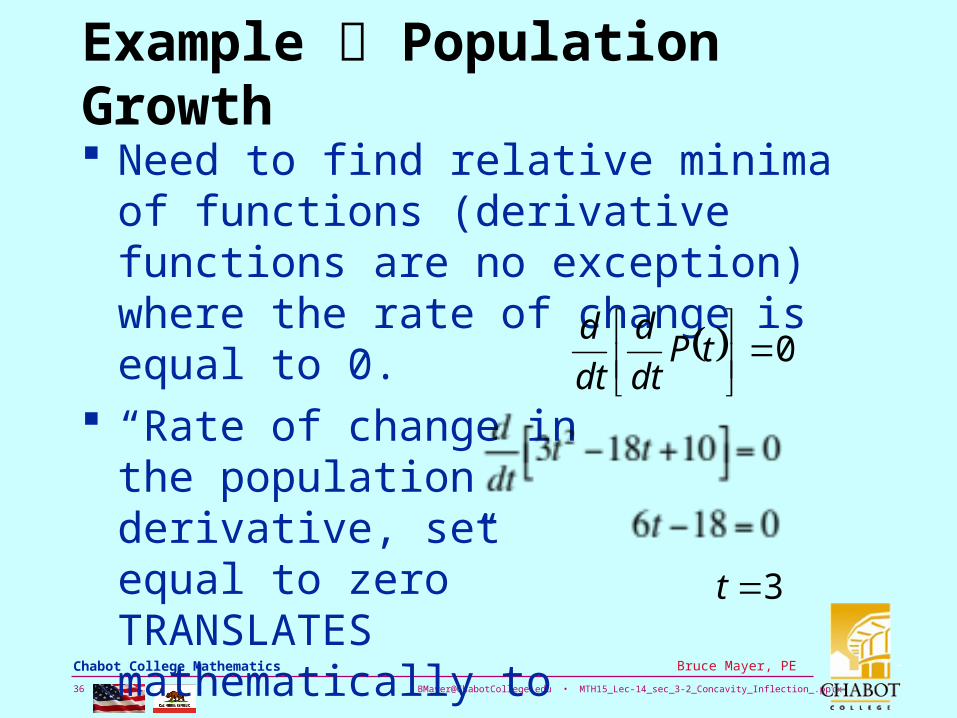
Example Population Growth
Need to find relative minima of functions (derivative functions are no exception) where the rate of change is equal to 0.
“Rate of change in the population derivative, set equal to zero” TRANSLATES mathematically to
0
tPdt
d
dt
d
3t

[email protected] • MTH15_Lec-14_sec_3-2_Concavity_Inflection_.pptx37
Bruce Mayer, PE Chabot College Mathematics
Example Population Growth
The only time at which the second derivative of P is equal to zero is the beginning of 2013.• Need to verify that the derivative is, in fact,
negative at that point:
10183' 2 tttPdt
dP
10)3(18)3(33' 2
3
Pdt
dP
t
171054273'3
Pdt
dP
t
[email protected] • MTH15_Lec-14_sec_3-2_Concavity_Inflection_.pptx38
Bruce Mayer, PE Chabot College Mathematics
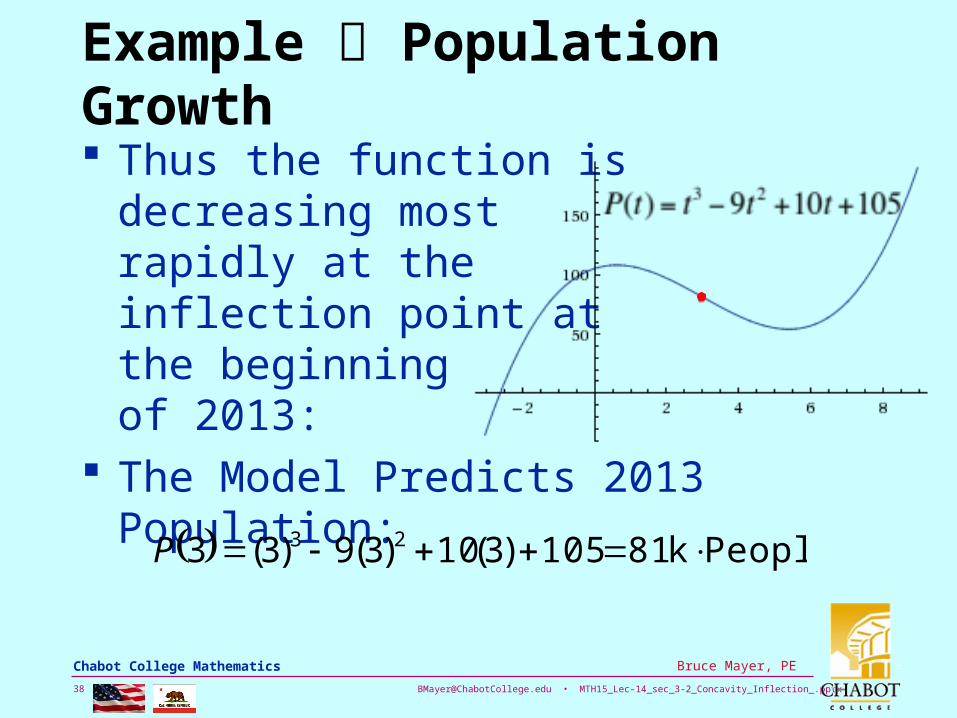
Example Population Growth
Thus the function is decreasing most rapidly at the inflection point at the beginning of 2013:
The Model Predicts 2013 Population:
x
Peoplek 81105)3(10)3(9)3(3 23 P
[email protected] • MTH15_Lec-14_sec_3-2_Concavity_Inflection_.pptx39
Bruce Mayer, PE Chabot College Mathematics
WhiteBoard Work
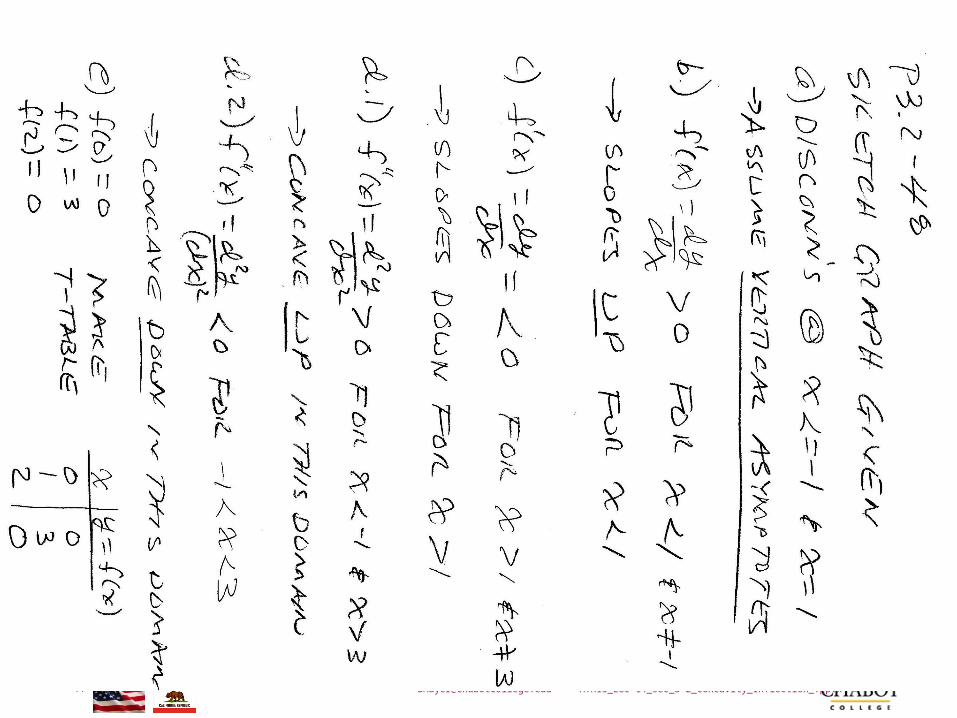
Problems From §3.2• P45 → Sketch Graph using General
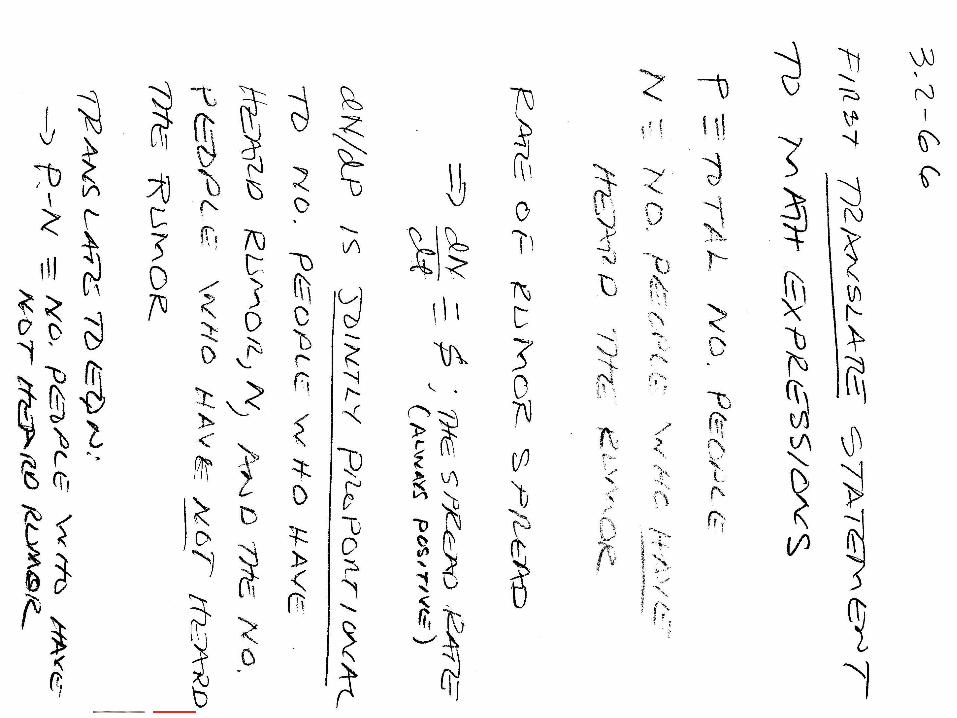
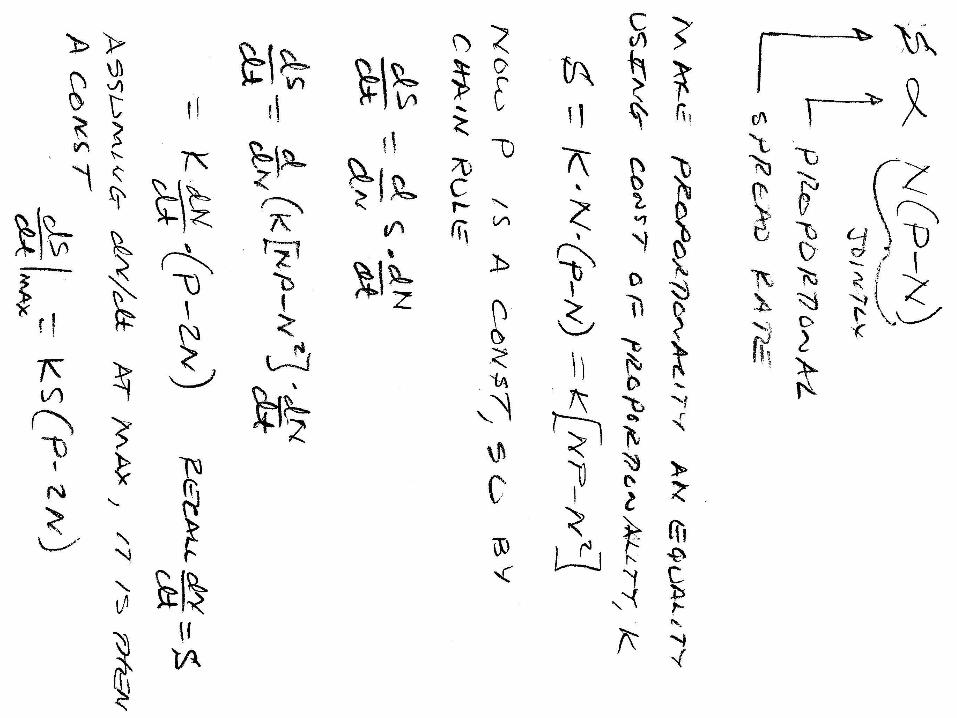
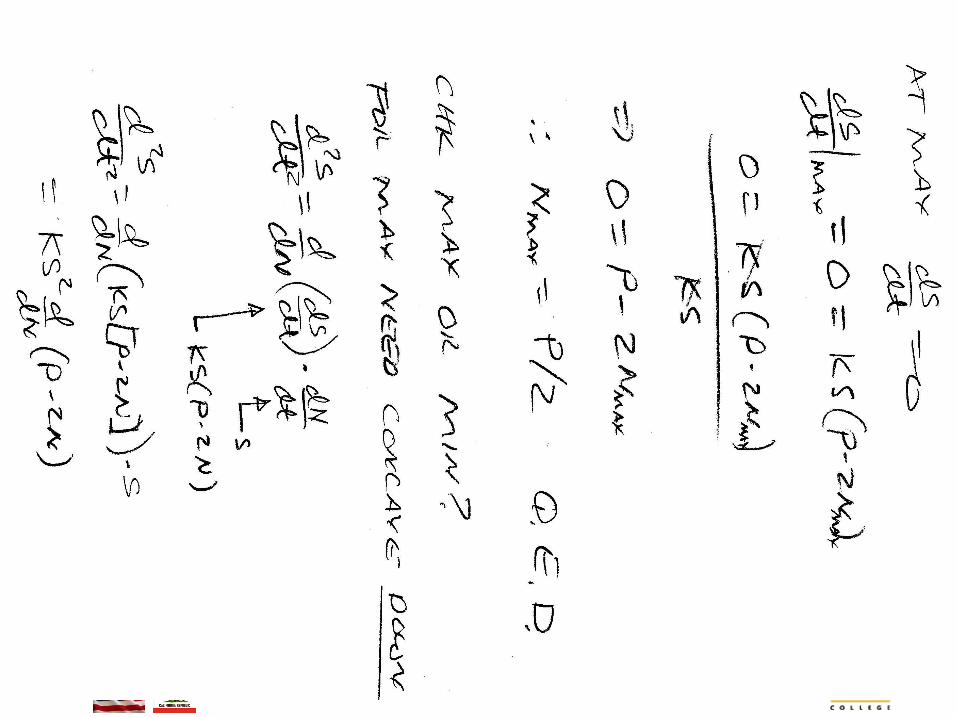
Description• P66 → Spreading a Rumor

[email protected] • MTH15_Lec-14_sec_3-2_Concavity_Inflection_.pptx40
Bruce Mayer, PE Chabot College Mathematics
All Done for Today
RememgeringConCavity:
cUP & frOWN
[email protected] • MTH15_Lec-14_sec_3-2_Concavity_Inflection_.pptx41
Bruce Mayer, PE Chabot College Mathematics
Bruce Mayer, PELicensed Electrical & Mechanical Engineer
Chabot Mathematics
Appendix
–
srsrsr 22
[email protected] • MTH15_Lec-14_sec_3-2_Concavity_Inflection_.pptx42
Bruce Mayer, PE Chabot College Mathematics
ConCavity Sign Chart
a b c
−−−−−−++++++ −−−−−− ++++++
x
ConCavityForm
d2f/dx2 Sign
Critical (Break)Points Inflection NO
InflectionInflection

[email protected] • MTH15_Lec-14_sec_3-2_Concavity_Inflection_.pptx43
Bruce Mayer, PE Chabot College Mathematics
Max/Min Sign Chart
a b c
−−−−−−++++++ −−−−−− ++++++
x
Slope
df/dx Sign
Critical (Break)Points Max NO
Max/MinMin
[email protected] • MTH15_Lec-14_sec_3-2_Concavity_Inflection_.pptx44
Bruce Mayer, PE Chabot College Mathematics

[email protected] • MTH15_Lec-14_sec_3-2_Concavity_Inflection_.pptx45
Bruce Mayer, PE Chabot College Mathematics
[email protected] • MTH15_Lec-14_sec_3-2_Concavity_Inflection_.pptx46
Bruce Mayer, PE Chabot College Mathematics
[email protected] • MTH15_Lec-14_sec_3-2_Concavity_Inflection_.pptx47
Bruce Mayer, PE Chabot College Mathematics
[email protected] • MTH15_Lec-14_sec_3-2_Concavity_Inflection_.pptx48
Bruce Mayer, PE Chabot College Mathematics

[email protected] • MTH15_Lec-14_sec_3-2_Concavity_Inflection_.pptx49
Bruce Mayer, PE Chabot College Mathematics

[email protected] • MTH15_Lec-14_sec_3-2_Concavity_Inflection_.pptx50
Bruce Mayer, PE Chabot College Mathematics