bluetooth bluetoad technology evaluation in sarasota county, florida usa
DESCRIPTION
Bluetooth BlueTOAD Technology Evaluation in Sarasota County, Florida USA. Andy J. Lucyshyn, PE, PTOE Atkins North America. A presentation on the Atkins study which tested the effectiveness of BlueTOAD, a travel-time device that utilizes Bluetooth technology. Agenda. - PowerPoint PPT PresentationTRANSCRIPT

Bluetooth BlueTOAD Technology Evaluation in Sarasota County, Florida USA
Andy J. Lucyshyn, PE, PTOEAtkins North America

2
A presentation on the Atkins study which tested the effectiveness of BlueTOAD, a travel-time device that utilizes Bluetooth technology.

3
Agenda
• Methods of travel-time data collection• Probe vs. point-based
• What is BlueTOAD?
• Evaluating the product:• Distribution, match rates, speeds

4
Methods of Travel-Time Data Collection

5
Methods of Travel-Time Data Collection
● Point-based– Roadside device measures spot speed of passing cars– Spot speeds are averaged to determine travel time between points
● Probe-based– Roadside device reads unique identifier and adds time stamp– Time stamp differential of those unique identifiers provide travel
times
Benefit Point-Based Probe Based
Aging of Data N Y
Issue of Statistical outliers N Y*
More likely to accurately reflect travel conditions N* Y

6
What is BlueTOAD?

7
BlueTOAD Devices
Blue tooth
T ravel-time
O rigin
A nd
D estination

8
Bluetooth Travel-Time Technology
BlueTOAD device detects MAC
address and adds time stamp
Cellular Modem / Ethernet inside
BlueTOAD devices send raw data to TCI
servers
Raw data is processed by TCI (MAC
addresses are matched)
Raw MAC address data is discarded by
TCI to preserve anonymity
Data is calculated (Travel times and origin-destination)
Data is filtered by TCI (statistical outliers
removed)
Data is sent to TCI web server (for client
use) and to client
In-device (on-site) functions
Off-site functions
Client-access
TCI = Traffic Cast International

9
Evaluating the Product

10
Sarasota County Test Location
Test Location

11
Study Purpose and Methodology
● Test Product– Two solar/cellular BlueTOAD devices
● Control– Hi-Star NC-97 Nu-Metric devices
● Spot speeds● Volumes
● Data collected in June 2010● Test components– Data Distribution & Match Rate– Flow Speeds & Travel Times
Fruitville Road at:Honore AveBeneva Rd
~2 miles
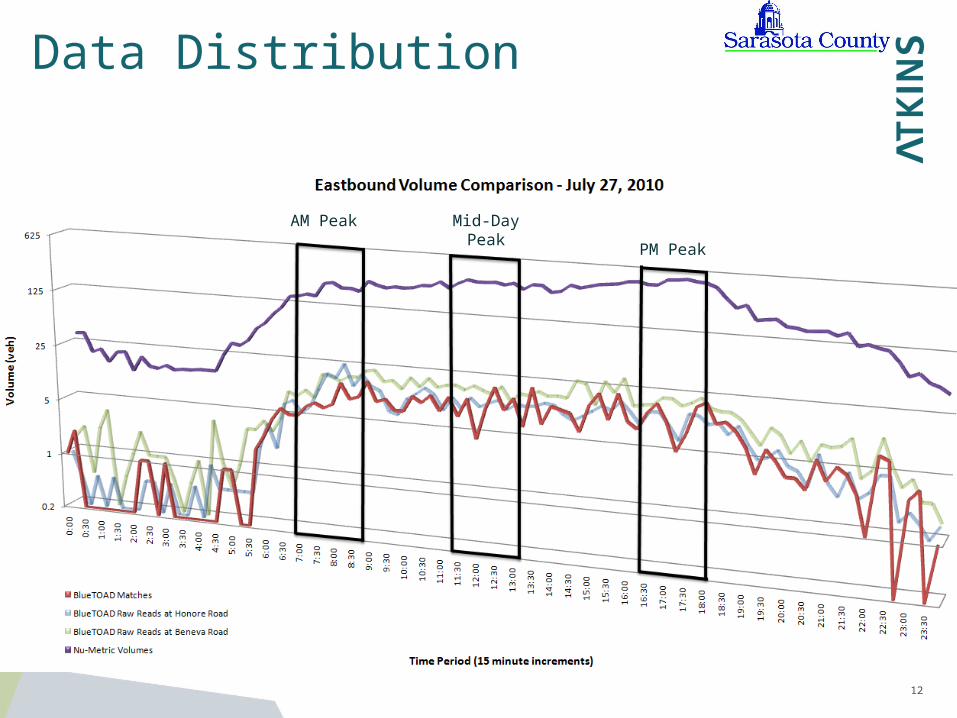
12
Data Distribution
PM Peak
Mid-Day Peak
AM Peak

13
Sample Size for Accurate Readings
Statistical Patterns of Traffic Data and
Sample Size Estimation
Stanley Young, Ph.D., PE Center for
Advanced Transportation
Technology (CATT)University of Maryland
σ = 6.1

14
Sample Size for Accurate Readings
● Sample size (N) = (z2)(σ2)/(H2)– Z is a coefficient of confidence
● Z = 1.96 at a 95% confidence level● Z = 2.475 at a 99% confidence level
– σ = 6.1 (as shown previously)– H = acceptable error range
● 3 mph for traffic operations● 2 mph for before and after studies

15
Match Rates: Match Rate Criteria
Well placed sensors:3%-4% detection rate
Time Increment Before and After Studies Traffic Operations
15 Minutes 9 61 Hour 36 251 Day 864 600
Fruitville Road AADT between Honore Ave and Beneva Rd:~19,000 vehicles

16
Match Rates

17
Match Rates
Total daily average = 3.45%

18
Flow SpeedsAM Peak Mid-Day
Peak
PM Peak

19
Flow Speeds

20
Study Conclusions
● Distribution– Matches evenly distributed across time– Data trend was consistent with Nu-Metric devices– Any inconsistencies are in off-peak intervals
● Match Rates– Achieved between 3-4% (25-36 matches per hour)
● Flow Speeds– Nu-Metric vs. BlueTOAD speeds within 2 mph on average– Nu-Metric vs. BlueTOAD travel-times within 13.8 seconds on
average
Segment: 1.9 miAvg: 42 mphAvg: 2.7 min

21
Contact us
● Andy J. Lucyshyn, PE, PTOE– Atkins North America– [email protected]
● Efrain Duque, PE, PTOE– Sarasota County– [email protected]
● Whitney D’Annunzio, EI– Atkins North America– [email protected]