blue book - vicwater - home · the blue book began in 1999 as a handbook of building construction...
TRANSCRIPT

COLLABORATION: MAKING CITIES BETTER
INSIGHTS ON BUILDINGS, INFRASTRUCTURE AND CONSTRUCTIONAUSTRALIA NEW zEALAND
BLUEBOOK 2013

AECOM
The Blue Book began in 1999 as a handbook of building construction costs. It has since evolved into a broader industry publication, bringing insights that consider the future of the construction industry across Australia and New Zealand. This evolution has been possible as a result of listening to you, our readers, who inform our understanding of changing industry priorities.
Challenging market conditions in recent years have accelerated business and government review of investment decisions and reinforced the need to spend more wisely.
Smarter and more creative business solutions and new ways of working — like Integrated Project Delivery — are being generated through the leveraging of lean processes and increasingly intelligent systems that promote greater connectivity.
Similarly, Building Information Modelling is providing supporting processes and technology that improves collaboration. Our recently launched Global Unite system is providing clients and design teams with an unprecedented level of cost and design benchmarking project knowledge.
In this edition and in the spirit of this collaborative, knowledge-centred approach to our industry, our leaders share their insight on collaboration strategies to improve business performance.
I hope you find the 2013 Blue Book — our 15th edition — of value and, as always, welcome your feedback.
Michael Batchelor Chief Executive Australia New Zealand
Foreword
AECOM has compiled the information in this document from a number of sources. AECOM has not verified that such information is correct, accurate or complete. Whilst every care has been taken in the preparation of this document, AECOM makes no representation or warranty as to the accuracy or completeness of any statement in it including, without limitation, any forecasts. Historical trends are not necessarily a reliable indicator for actual future performance. AECOM accepts no liability or responsibility to any party in respect of this document. This document has been prepared for the purpose of providing general information, without taking account of any particular person’s objectives, situation or needs. You should seek professional advice having regard to your own objectives, situation and needs before taking any action.
© AECOM Australia Pty Ltd

2013BLUE BOOKCONTENTS
AECOM
The Collaboration Challenge 4
Australian Market Conditions 20
New Zealand Market Conditions 36
Cost Data and Market Analysis 44
Global Indicators 62
Building Information Modelling 74
Sustainability 82

Collaboration Strategies to Improve Performance 6
Strategy One: Success Targets 8
Strategy Two: Incentives 10
Strategy Three: Collaborative Environments 12
Strategy Four: Teams 14
Strategy Five: Big Data 16
Strategy Six: Crowd-Solving 18
AECOM 5
1The CollaboraTion Challenge

Businesses and governments have faced challenging conditions in recent years. Delivering more from less has become a global mandate, accelerating structural changes across organisations and society towards improved collaboration.
Findings from our AECOM Global Sentiment Survey 2012 reveal that the Australian buildings market ranks as the most adversarial construction market.
However, the Australian infrastructure market (primarily due to the advancement of alliance contracting) and the New Zealand construction market are cited as leading the world on project collaboration, albeit with significant room for improvement.
This chapter presents six strategies to improve collaboration through management of process, people and data to enhance organisational performance and project delivery.
The core principals of each strategy are provided along with supporting evidence and processes for implementation.
Despite a very strong willingness to collaborate, culture and awareness remain significant barriers to adoption. These strategies will strengthen awareness and unlock the considerable gains that collaboration can bring to your organisational and project performance.
Collaboration Strategies to Improve Performance
DATA
PEOPLE
Collaborative Environments how to get the most out of your workplace design
Big Data leveraging enterprise data to drive a dynamic workforce
Success Targets ensuring everyone is working towards the same vision
However, there is a strong willingness across the globe to improve project collaboration…
…and the two greatest barriers are culture and awareness of alternative strategies.
global Perceptions of Construction Culture
1
2 Incentives integrated Project Delivery establishes the right relationships and incentives to achieve success
3
4 Teams Teams successfully collaborating are greater than the sum of their parts
PROCESS
Crowd-Solving Planning cities based on crowd-sourced user experiences
5
6
Africa
North America
China
South East Asia
New Zealand
Middle East
Europe
Australia − Buildings
Australia − Infrastructure
Adversarial Collaborative
Consultants
Contractors
Private Owners
Public Owners
Negative Positive
New Zealand
Technology
Contracts
Awareness
Culture
Minor Major
Australia
Source: AECOM Global Sentiment Survey
6 The Blue Book 2013 AECOM 7

1 Success Targets
Ensuring everyone is working towards the same vision
Poor project implementation is often cited as the root cause of adverse project outcomes.
To improve the ratio of success to failure there are two questions that must first be asked:
− why does failure occur, and
− what can we do to eliminate it?
This requires going back to the absolute basics of project success. It means clearly understanding, articulating and delivering the objectives that you set out to achieve.
Triggered by this awareness of project failure, Davis Langdon, an AECOM company, developed a process to tackle this — Conditions for Success (C4S) — a hybrid model of value and risk management that is facilitated through a workshop. It provides
a health check on a project and tests the likelihood of meeting the required outcomes.
The model tests the condition of the project against 12 critical success factors from three groups:
1. Why? There is a clear rationale for the project
2. What? The outputs are clearly articulated and understood by all
3. How? The project has systems in place to meet the required outcomes
Delivery of over 150 of these sessions highlights one common theme — that the most important aspect of project success, and the one least often understood is the ‘Why?’.
Feedback consistently indicates that taking additional time to define the purpose of the project, in terms that are tangible and relevant to all, is invaluable.
Measurable outcomes that everyone can work toward need to be agreed.
Avoid complex goals that require unnecessarily complex systems or processes that some in the team might not even understand.
To achieve better outcomes it is important to:
− be clear what success looks like
− make sure all parties have a common understanding of success
− ensure decisions are referenced against predefined outcomes
− use robust processes for managing risks.
Challenges often arise in the disjoint between investment-level thinking and the project delivery phase. Ownership of the project is usually divested to a different part of the organisation, consultants are appointed who haven’t been involved in the project creation stage, and everyone
earnestly proceeds with the job. All too often it seems that the delivery phase loses touch with the real reason for the project.
Issues like scope shift, budget control, and time management start to drift away from the core. Benchmark analysis of the C4S model demonstrates that cost and program often had lower scores indicating that these factors present significant challenges to project teams that require specific capabilities.
Effectively combining value management (the science of aligning decision-making around outcomes), with robust risk management (the science of ensuring you get what you set out to achieve), gives greater odds of success.
Ed Brown Associate Director [email protected]
PROCESS
8 The Blue Book 2013
Why is the construction projectneeded − is the PURPOSE clear?
Why is the solution appropriate − has a thoroughAPPRAISAL been carried out? What are the targets?
What should the project deliver −is the DEFINITION comprehensive?
What is the PRECEDENT − haveexemplar processes and projectsbeen researched?
How is the project structured −are appropriate MANAGEMENTarrangements in place?
How well-suited are the PEOPLEchosen to underatke the project?
How are RISKSindentified and managed?
How do PROGRAM/CONTROLSplans contribute to
project success?
How are goodCOMMUNICATIONS achieved?
How will COSTS and budgetsbe defined and controlled?
How is the DESIGN QUALITY &SUSTAINABILITY described −
what are the expectations?
How appropriate is the chosenPROCUREMENT approach?
WHY?
WHAT?HOW?
AECOM 9
2.5
4.0
3.5
3.0
2.0P
urpo
se
Defi
niti
on
App
rais
al
Pre
cede
nt
Man
agem
ent
Peo
ple
Com
mun
icat
ion
Pro
cure
men
t
Des
ign
Cos
t
Ris
k
Pro
gram
Why? What? How?Cost and Programscored the lowest,showing that theyregularly requiredthe most attentionin workshops
Benchmark analysis of 163 workshops where each success factor was ranked from 1 to 5 based on where greater focus is required to achieve project success
Critical Success Factors Benchmark AnalysisConditions for Success
Source: AECOM

2 Incentives
Integrated Project Delivery (IPD) establishes the right relationships and incentives to achieve success
IPD is a value driven process based on principles that promote collaboration between organisations. Its foundations are built around shared risk and reward, collaborative decision-making, no blame and earlier involvement of key participants and stakeholders.
This delivery method breaks down adversarial relationships and considers decisions in the design phase that reflect the whole-of-life of the project with inputs from owners, architects, consultants, contractors and asset managers from concept to completion while maintaining a competitive tender process.
Collaboration is encouraged through early involvement of all organisations to deliver the project within budget and schedule while meeting or improving upon the project specifications. This process is incentivised through shared profit that is released in tranches upon meeting agreed milestones.
Individual interests are aligned with project interests, thereby encouraging collaboration in order to achieve self-interest goals.
It is imperative that the right organisations and individuals are selected to deliver the project in order to reduce profit-loss. Adversarial behaviour that leads to lesser outcomes must be avoided otherwise all participants may be penalised financially.
Given that financial risk is pinned to collaboration, it is not beyond consideration that psychometric testing of the project team be conducted by the responsible entity seeking to mitigate future conflicts.
Establishing a physical co-location environment where all project participants reside immediately reduces risk associated with silos of information and opens communication. Beneficial use of this space relies on all key project team members participating in decision-making exercises, seeking improvements in design, delivery and cost savings that would not typically be found in the fragmented process of traditional project delivery.
Further identification of construction efficiencies can be achieved through Virtual Design and Construction (VDC), aided by the technology component of Building Information Modelling (BIM). The ability to virtually test sequencing and quickly verify cost impacts from design alternatives enables the project team to refine the project and potentially increase shared profit.
A commonly cited barrier to the adoption of IPD is contracts. IPD continues the evolution of collaborative contracting that began in the UK oil and gas industry in the 1990s and has since evolved through alliance contracting in Australia during the 2000s. The key difference is IPD’s exclusion of liability; this eliminates the threat of being sued.
By removing liability as a distraction, the project team’s vision becomes focused on reward driven innovation.
Team selection also plays an important part in who is selected to participate in a project. If the lead design and build teams waive all potential claims against each other (with the exception of fraud or gross negligence), it becomes increasingly important that the right organisations and people are selected for the project.
Insurance underwriters’ capacity to provide services supporting collaborative delivery models has matured over the past 10 years.
Although this is now understood by the legal and insurance industries leading IPD delivery, there is more limited awareness in the wider construction industry — both from owners and the delivery market.
Mediation proceedings can also be introduced if an issue arises between project teams that would typically escalate to legal proceedings. An agreement between parties regarding the process of mediation is agreed at the commencement of the project and included within the contractual arrangements.
A desire to overcome years of fragmented delivery processes, coupled with a society-wide structural change towards transparency are driving construction markets towards increased collaboration.
Steve Appleby Practice Leader – BIM [email protected]
PROCESS
10 The Blue Book 2013 AECOM 11
Target
Cost
Build Team(Labour and Overheads)
Design Team(Labour and Overheads)
SharedContingency
Shared Profit (Incentive
CompensationLayer)
Compensation Structure Positive Outcome1 Negative Outcome2
1 Positive Outcome – Successful delivery of the project that exceeds set metrics (ie schedule, cost, operation targets, etc) has the capacity to earn the entire shared profit margin.2 Negative Outcome – Projects that fail to meet set metrics could, in worst case scenarios, result in fees associated with labour and overheads being withheld after the shared contingency is expended.
SharedContingency
SharedContingency
Build Team(Labour and Overheads)
Design Team(Labour and Overheads)
Build Team(Labour and Overheads)
Design Team(Labour and Overheads)
Owner’s ContingencyMaintained Separately
Shared Profit (Incentive
CompensationLayer)
Shared Profit (Incentive
CompensationLayer)
Early Planning – Setting Conditions for Success
− goal definition − involvement of key participants
Incentives to Drive Behaviour Change
− Mutual respect and trust − Shared risk and reward − integrated innovation − Collaborative decision-making − open communication − no blame agreement − Provide co-location space
Suitable Project Structure − leadership − Teams − Processes − Technology − lean construction
IPD Incentivising Collaboration
Shared Risk and Reward — Incentivising Collaboration

3 Collaborative Environments
How to get the most out of workplace design
Expression, efficiency and effectiveness are important aspects of the physical workplace. In the event of relocation, consolidation or expansion, a business needs to consider these aspects in choosing the right property and/or building for their new location/project.
A property will support collaborative behaviour when its workplace and design solutions are informed by these three principals.
Every organisation has unique attributes that drive workplace layout and design. Different business sectors place varying levels of importance on expression, efficiency and effectiveness through considerations of branding, mobility and collaboration within their workplaces. AECOM market research shows how different sectors value these features.
Companies put a lot of thought into their workplace because they understand the importance of what the workplace says about the business and the effect it has on productivity.
Although the importance of branding, mobility and collaboration varies for different business sectors it does not preclude forward thinking strategies that identify a need for change.
Branding, mobility and collaboration have direct relationships with workplace layout and design.
In the case of a Banking and Finance business, the level of importance on branding and collaboration within the workplace is a higher priority than mobility.
However, as future workplace trends support an increasingly mobile work style, the value of mobility will rise. This growing importance of mobility would be identified during the Prospective Tenant Profile analysis, suggesting the need for new design features.
Branding refers to how the culture is expressed through physical elements and the way people work. It can excite and unite people through internal workplace narratives that contribute to knowledge management. The use of colour, motifs, furniture, fittings and finishes, and the types of spaces contribute to the quality of interactions.
Mobility allows individuals to choose to work in a range of spaces. Design features include hub spaces, quiet rooms, project rooms, meeting rooms, and traditional desks. Mobility increases the efficiency of how space is used by increasing the proportion of shared rather than individually allocated spaces.
Collaboration is knowledge sharing through effective internal and external networking. Design features provide opportunities for chance encounters, circulation paths that create ‘bump’, interesting spaces, and shared ‘hub’ areas. Effective layout provides visual connection across and between floors in open plans, connecting stairways and voids. Individuals and teams can see activity and work collectively in an efficient and effective manner.
When a Prospective Tenant Profile is applied to a building floor plate, a zoning plan is established that explores the potential for a range of interesting spaces throughout the workplace to support the tenant profile.
These considerations may lead to pockets of interactive zones interspersed among quieter work zones or a natural active zone along intuitive horizontal and vertical circulation paths. A zoning plan provides design consideration to a potential ‘new home’ by taking into account the characteristics of branding, mobility and collaboration in combination with business drivers, such as limited hierarchy, and future aspirations, such as increased mobility.
Rachel Reese Practice Leader – Strategy+ [email protected]
12 The Blue Book 2013 AECOM 13
PEOPLE
Branding
Mobility
Collaboration
Branding
Mobility
Collaboration
Branding
Mobility
Collaboration
Branding
Mobility
Collaboration
Relative Score
Gov
ernm
ent
Telc
o &
ITC
onsu
ltin
g &
Advi
sory
Ban
king
&Fi
nanc
e
Importance of Workplace Attributes by Business Sector
Zone Plan Enhancing CollaborationQuiet rooms positioned away from interaction spaces.
Meeting spaces near core. Support interaction and opportunities to ‘bump’ into others.
Central social hub at arrival point. Supports spontaneous interactions.
Central location for internal stairs.
large contiguous team spaces. allows flexibility and efficiency.
Source: AECOM

4 Teams
Teams successfully collaborating are greater than the sum of their parts
Teamwork should not be viewed as simply a sum of individuals’ skills, where the cost of each new resource results in an equal gain in value for the team. Instead, teams should be more than the sum of their individual parts.
Teams need to go beyond simply pooling their resources; in order to optimise their output, value must be found in collaboration.
How do we unlock this value in collaboration to allow our teams to become more productive?
Collaboration enables businesses to achieve a strategic advantage. It is more than just pooling resources toward a common aim. True collaboration can endow a team with a value offering beyond the sum of its individual components.
AECOM’s Karsten Forsterling, Olympic Bronze Medallist in London 2012, knows firsthand the difference collaboration makes:
By example, I have spent many years rowing, at all levels from school through to the Olympic Games. In rowing, individual performance can be measured by the application of raw physical aerobic power. A race in a single scull is approximately seven minutes from start to finish.
However, put more than one rower in a boat and the race shortens to approximately six minutes as you might expect. In a double scull the race becomes a measure of not only individual power, but communication between rowers, understanding the common movement of the boat and coordination of individual efforts.
These results often surprise people because the addition of resources does not explain the result. How is it that the team becomes more than a collection of individuals? How is it that the whole becomes more than the sum of its parts? Collaboration is the answer.
Collaboration is not a new concept. Many have explored the dynamics and environment required for teams to work well together, such as Thomas Edison1.
His principles are equally relevant in a modern context:
− Collaboration evolves from a shared context of learning, not the mere execution of tasks. Through discovery learning, a collaborative team develops content they hold in common.
− Collaboration is reinforced through casual dialogue rather than stiff agendas; team members engage in regular dialogue.
− Collaboration involves engagement with complex systems. It is complex and simultaneous rather than linear and sequential.
− Collaboration drives collective intelligence to create a team’s knowledge assets and insights.
These knowledge assets are the fundamental value creations of collaborating teams according to Edison. His principles can readily be applied in today’s business world and pave the way toward teams sharing in the profits of collaboration as non-traditional procurement models are embraced.
1Caldicott, SM, Midnight Lunch: the 4 Phases of Team Collaboration Success from Thomas Edison, 2012.
2Zenger, J, Folkman, J and Edinger, SK, How Extraordinary Leaders Double Profits, 2010.
14 The Blue Book 2013 AECOM 15
PEOPLE While team diversity and relationships are important, true collaboration is not possible without the right leader.
The successful traits of these inspiring leaders have been quantified in a recent study2 that gathered data from 300,000 360-degree feedback sessions related to 30,000 managers. This identified a set of successful leadership competencies. These leadership elements work to support and drive the team characteristics necessary for collaboration.
Edison saw the value in true team collaboration. It is critical to the success of businesses today to understand that collaboration can yield strategic advantages and a value offering from the team that goes beyond the sum of its individual components.
Alan Baker Managing Director – Program, Cost, Consultancy [email protected]
4COMPLEXITY
3COHERENCE
2CONTEXT
1CAPACITY
LEADERSHIP ELEMENTS
Develop others
inspire and motivate
Display honesty and integrity
Communicate powerfully
establish stretch goals
Strategic perspective
TEAM ELEMENTS
Collaboration Philosophy#
business application
Note: #Based on Edison’s Collaboration PhilosophySource: AECOM; Caldicott; Zenger, Folkman and Edinger
− Seeing a challenge through the eyes of another discipline
− Creating collegiality
− Project gains from collaborative insights only enabled by the collective intelligence of the team
− incentives drive time and cost savings as teams adapt to challenges in a shared risk and reward setting
− Diverse teams bring new ideas
− Co-location of project teams opens communication channels
− Project meetings that enable multidisciplinary inputs based on mutual respect and trust
− Finding new efficiencies by testing different paths
− greater freedom in non-traditional procurement models removes constraints on the team
− Solutions are achieved through a combination of negotiation and firm leadership
− Developing new context for framing a problem
− being willing to question facts and test creative hypotheses
− inspiring others to go beyond their perceived limitations
− navigating conflict productively
− recognizing how complexity impacts team effectiveness
− Capturing the collective intelligence of a team

5 Big Data
Leveraging enterprise data to drive a dynamic workforce
The rapid growth of data, lower cost data storage, expansion of analytics tools, and business conditions tending towards lower cost and higher value, all support the view that competitive advantage will be achieved through advanced business analytics.
In recent times this level of organisational intelligence has moved from being a fringe concept to the core of future investment decisions.
In this context ‘Big Data’ does not necessarily mean the volume of data but rather the extensiveness of data collection.
Knowledge-based industries are increasingly becoming commoditised by technology and lower cost solutions as did the product-orientated industries following the proliferation of technology and offshoring.
Adaption in knowledge-based industries will be delivered through faster access to the right information and the ability to make decisions rapidly from enterprise-wide knowledge.
Digital collaboration is preventing the loss of organisational memory. The ability to deliver improved services will be challenged by an ageing population and changing demographics. Access to an aggregated wealth of knowledge through data and analytics supports rapid learning and problem solving and better project outcomes with fewer resources.
Organisations that review their information hierarchy and develop strategies to align, store and access interactions between their data sources will realise improved revenue and higher margins.
The most successful companies in history have gathered, analysed, and reacted to data that is essential to survival and function.
Three channels of data must be considered:
1. Operational data – includes finance, human resources
2. Market data – market intelligence and trends
3. Project data – data harvested from projects (aggregated, analysed and made accessible)
However, investment plans should begin at a modest pace with the capacity to be scaled upwards in order to contain the early stage budget.
Through structured common processes and mandates, simple data capture into central systems will support informed decisions.
This information can be analysed using reporting techniques, visualisation and dashboards or integrated into other existing platforms.
This structured information enables the querying of multiple projects and development of unparalleled, unique insights and efficiencies.
Leveraging enterprise data promotes fact-based decision making and lowers reliance on intuition, thereby reducing risk.
Michael Skelton Global Business Intelligence Manager [email protected]
16 The Blue Book 2013 AECOM 17
DATA
Data
Operating Environment
Information
Knowledge
WisdomOrganisation Intelligence
VALUE
Strategic decision-making
Improved ROI
Benchmarked analysis
ACCESSIBILITY / USER INTERFACE
Aggregated accessible information
Structured outputs
OUTPUTS
Forms and reports (Structured)
Operational systems
UnderstandingSimplicityUtility
MysteryComplexityEntropy
INPUTS
Disparate data sources
Unstructured ∞
∞P
eopleP
rocesses and System
s
Sco
pe a
nd P
roje
ct P
lan
Audit Existing Systems and Associated Processes
Cost-Benefit Analysis –Analytics Viability
Scope Core System Specifications
Set-up System and Implement Structured Data Process
Info
rmat
ion
Arch
itec
ture
Str
ateg
ic O
utco
mes
Scope Phased Delivery Plan
Import Existing Data
Capture New Data
Perform Analytical Analysis
Deliver Higher ROILeverage aggregated,
structured, analysed data to improve ROI from evidence base rather than intuition.
Proof of Concept
Rev
iew
and
Ada
pt S
yste
m
and
Pro
cess
Per
form
ance
Effective Information Management Stages
The Process to Deliver Higher ROI on Your Information

6 Crowd-Solving
Planning cities based on crowd-sourced user experiences
Typically architects, engineers and planners work with government agencies, local authorities and developers to plan, design and build cities.
The community — those who will live, work and play in these precincts — are typically only consulted during the options selection stage.
However, early collaboration with communities through crowd-sourced data collection (a process that involves outsourcing tasks to a large group of people) can lead to better outcomes that are accepted and embraced by local communities.
Can we crowd-solve cities as an alternative process for city planning?
By placing people at the centre of decision- making we can provide an alternative solution through crowd-solving cities.
The potential for alternative city planning models and processes raises a number of questions including:
− How can we respond to the mass urbanisation trend structurally and technically?
− How can we make cities that are humanly and socially better for citizens?
Crowd-sourcing is a powerful platform for adaption, innovation, collaboration and participation from a variety of people from different backgrounds and levels of capability.
The benefits of leveraging this data to crowd-solve cities include:
− the data is based on insights known only by local communities
− a greater imperative for planners and decision-making authorities to be accountable
− community engagement begins prior to options generation
− it ensures a holistic approach to city planning.
Access to measured community interests and desires is providing faster and deeper insights into their behaviours.
Mobile technology provides real-time, bottom-up insights into city behaviour.
Coupling crowd-sourced data with open government data enables planning teams and authorities to make the right decisions based on current trends rather than historic beliefs.
Case Study: Berlin
The Dynamic Connections Map is a world-first experiment to crowd-source and crowd-solve optimum bicycle routes using an interactive map and user experiences.
While traditional mapping efforts show current conditions and the type of bicycle infrastructure located on given roads, the Dynamic Connections Map allows riders with varying capability (confident, regular or potential) to assess the current bicycle network, rate streets on bicycle friendliness and, as a result of data processing, unlock the potential future cycling network.
Unique insights are discovered by filtering the data in relation to factors such as: safety, typical rider skill level, frequency of road use and purpose of travel among many other criteria.
Results for the September 2012 survey about Invalidenstrasse, Berlin, were:
− 89 percent of people are confident riders
− 68 percent say the road provides good access to destinations
− 11 percent of bicycle riders feel safe cycling
− 68 percent of bicycle riders feel stressed
This kind of information collaboration between crowd-sourced data and other datasets will continue to enrich planning programs and the liveability of cities.
Rachel Smith Principal Transport Planner [email protected]
Note: This pilot project was undertaken by Rachel Smith and funded by the BMW Guggenheim Lab.
18 The Blue Book 2013
DATA
AECOM 19
Crowd-Sourced Data − User experiences − insight rich data − Community accepted − Firsthand accounts − representative of users
Stored Data − government agencies/
departments − local authorities − City modelling
+
Enriching City Planning Through Information Collaboration
building better Cities
Crowd-Sourcing Data for Bicycle Routes
User selects travel path
Users view of routes − Traffic volumes − Visibility − Potential conflicts
Users main purpose on route − Work − Tertiary education − Cafes / restaurants
Users view on safety − along roads − Through intersections
aggregated, crowd-sourced, information rich map
Users surveyed on key criteria

2AUSTRALIAN MARKET CONDITIONS
Overview 22
Commercial 23
Residential 24
Retail 25
Tourism 26
Industrial 27
Defence, Justice and Local Government 28
Health and Aged Care 29
Education 30
Transportation 31
Energy 32
Water 33
Mining, Oil and Gas 34
AECOM 21

Overview Commercial
Overall Construction Work Done The commercial development sector is yet to see a marked improvement. The value of building approvals in the office sector has remained flat over the past two years, inching up by 1 percent in the year to November 2012. In several cities there has been an increase in supply but not necessarily enough uptake as yet. So the outlook for new development feasibilities is not expected to improve in the short term as competition for tenants intensifies.
The broader direction of the economy will also affect the confidence of developers and demand for new developments. Demand for office space will be
constrained by recent reductions in white collar employment. Recent figures indicate that many services and professional sectors reduced their workforces towards the end of 2012. There has also been an overall reduction in the proportion of white collar workers in the period between 2006 and 2012.
More widespread declines in employment in other sectors will also affect confidence in the services and consulting businesses. These trends in employment are expected to worsen in 2013 if the economy fails to gain strength.
White Collar Employment Contribution to Total Workforce
1990
2000
2005
2006
2011
2012
0
25
125
150
175
200A$b
100
Engineering ConstructionNon-residentialResidential
75
5026%
35%
39%
60%
17%
23%
2012 saw a 26% rise in engineering work, compared to 22% pre-GFC (2006). Engineering work accounted for 60% of activity, compared to only 26% in 1990.
Building Approval Values
2000
2001
2002
2003
2004
2005
2006
2007
2008
2009
2010
2011
0
6
8
10
12
14A$b
2
4
Residential Non-residential
2012
Non-residential approvals are currently 24% below the pre-GFC peak in early 2008
Residential approvals dropped 40% during the downturn of 2000
Residential approvals are trending up and only 10% below the 2010 peak
Non-residential Building Approval Values Compared to 10-Year Average
AC
T
VIC
TAS
WA
NS
W NT
SA
QLD
-14%
4%
-16% -24%-41%
57%
-3%
-39%
-3%
24%
149%
49%
3% 8%
-10% -11%
Value in 2012 compared to
10-year average
Private SectorPublic Sector
The majority of states are well below long term averages for public spending
2012
2006
25.2% -0.5ppt
-0.2 ppt-0.2 ppt
+0.4 ppt -0.1 ppt -0.1 ppt24.5%
Change in Job Numbers from 2006 to 2012
Media &Telecom
-31,547jobs
Financial &Insurance
+26,231jobs
RealEstate
-3,025jobs
Prof &Tech
+146,834jobs
Admin
+38,972jobs
PublicAdmin
+65,790jobs
Source: ABS 8755
Source: ABS 8731
Source: ABS 8731Note: Annual data is for the year to September.
Source: ABS 6291
AECOM 2322 The Blue Book 2013

Residential
There is some speculation about the extent to which the housing market will take up the slack in the economy left by the resources industry. While detached housing remains slow, there has been considerable apartment activity. Perhaps the market is catching up with a change in demand evident in the Grattan Institute’s research into the disparity between Australia’s housing priorities and existing stock.
For example, in the Sydney and Melbourne residential markets, semi-detached housing is preferred by approximately 25 percent of the population but only makes up 12 percent of current stock as recorded in the
2011 Census. There is a similar mismatch in the Melbourne apartment market of four storeys or more; this option is preferred by 14 percent, but only 4 percent of existing dwellings fall into this category.
The current ratio for the number of apartment approvals is well above the 20-year average, however, apartment development has only escalated in some parts of the country. Victoria increased its ratio of apartment approvals over 2012, while the ACT and NT have seen significant jumps in apartment approvals compared to detached housing.
Retail
Although there were some signs of recovery in the retail industry during 2012, turnover remains relatively flat over the longer term. Sales continue to be patchy in different states; Western Australia has seen the most growth, up 9 percent in the first three quarters of 2012, while in Victoria retail sales only grew 3 percent. The industry has been given a slight boost by falling interest rates, the federal government’s carbon price compensation payments, and new major overseas entrants.
In the longer term, the industry will be shaped by further competition and local retailers’ adaptation to online shopping. As Australians currently spend only one-third as much online as US consumers on a per-capita basis and one-fourth as much as shoppers in the UK, considerable expansion is expected in this area over the medium term. The NAB Online Retail Sales Index reports an upward trend in online sales growth, in contrast to the lacklustre performance of traditional retailing. These factors will affect the design and feasibility of new retail developments in the coming years.
1993
1994
1995
1996
1997
1998
1999
2000
2001
2002
2003
2004
2005
2006
2007
2008
2009
2010
2011
15,000
10,000
30,000
35,000
40,000
45,000
20,000
25,000
Number of Apartments Ratio of Apartments (RHS)
2012
30%
25%
20%
15%
10%
5%
0%
The ratio of apartments in new residential approvals is well above the 20-year average of 17% and the 2010 peak was inflated by over 12,000 units from the public sector stimulus
20-Year Average Ratio of Apartment Approvals
Number and Ratio of Apartments in New Residential Approvals
Ratio of Non-house Approvals to Total Dwellings, Selected States
Quarterly Retail Turnover
%
2003
2004
2005
2006
2007
2008
2009
2010
2011
2012
ACT jumps from 40% in October 2009 to 71% in July 2011, while NT sees a similar rise to a peak of 64% in April 2011.
20
30
50
60
70
80
40
NSW QLD ACT VIC NT National Average
1999
2000
2001
2002
2003
2004
2005
2006
2007
2008
2009
2010
2011
30
40
35
55
60
65A$b
45
50
2012
Turnover growth has been relatively flat at 11% over the last 4 years...
...compared to 30% in a similar period between 2000 and 2004.
Source: ABS 8731Note: Data is annualised.
Source: ABS 8501Note: Figures are seasonally adjusted, chain volume measures.
AECOM 2524 The Blue Book 2013

Tourism
During 2012 there was a resurgence in visitors from Asia to Australia, following a lull during the 2009 downturn. South East Asia visitor numbers have risen 45 percent since 2008, particularly from Singapore and Malaysia.
Visitors from New Zealand have eased slightly, but remain well above historical levels. Permanent and long-term arrivals peaked in 2000-2001 as New Zealanders rushed to move to Australia ahead of the legislative changes reducing entitlements.
Following this, short-term visitor levels rose by 56 percent to 2011.
Tourism Research Australia (TRA) estimated in May 2012 that stock growth of 40,000 plus rooms will be required to meet expected demand. However, based on planned growth in supply to 2016, TRA estimates that there will only be a net increase of approximately 17,200 rooms. This leaves a significant opportunity in the tourism development sector to meet this escalating demand.
Industrial
Rising cargo levels and the increased flow of freight are two key indicators of healthy demand for industrial stock in several parts of Australia. Well-leased and well-located industrial assets are expected to continue to be in demand from smaller, private investors in 2013. Investors will also be encouraged while the cost of debt remains low and there is little competition from cash returns and the stock market.
New demand for industrial space is also emerging from growing e-commerce
companies. Online shopping is creating a need for smaller satellite spaces, where customers can access or return purchases. The popularity of online shopping is evident in the level of parcels arriving from offshore. Australian Customs reported an increase from 56 million in 2010-11 to 65 million in 2011-12. Increased participation of local major retailers in the online space will also drive further changes. Developers and owners will benefit from this structural shift in demand.
Tourist Accomodation Revenues and Occupancy
Short-term Visitor Arrivals to Australia
Change in Port Cargo Throughput, by Weight
Origin of Interstate and Intrastate Rail Freight Flows
%
2003
2004
2005
2006
2007
2008
2009
2010
2011
2012
Change in Hotel Revenues (LHS)
Annual Average Occupancy Rate (RHS)
Occupancy rate is at a record level at an annualised average of 66%.
-2
-1
1
2
3
4
0
-3
1999
2000
2001
2002
SydneyOlympics
AsiaDownturn
GFC
58
60
64
66
68
70
62
56
%
54
52
50
70,000
80,000
100,000
110,000
120,000
130,000
140,000
90,000
2003
2004
2005
2006
2007
2008
2009
2010
2011
2012
Oceania
NE Asia
SE Asia visitors have risen 45% since 2008, even though numbers eased during the 2009/10 downturn.
Chinese visitors have risen by 117% since 2009, replacing the downturn in Japanese tourists to keep NE Asian visitor numbersat record levels.
60,000
50,000
40,000
NW Europe
Americas
SE Asia
Source: ABS 8635Note: Revenues annualised and adjusted to 2012 dollars.
Source: ABS 3401
%There has been sustained growth in cargo over the last 2 years, despite a dip in growth following the extreme weather events of late 2010.
5
10
20
25
30
35
15
0
1H-2
008
2H-2
008
1H-2
009
2H-2
009
1H-2
010
2H-2
010
1H-2
011
2H-2
011
1H-2
012
-5
-10
-15
MelbourneSydneyBrisbane Fremantle Source: Ports Australia
2007
–08
0
300
400
500
Million NetTonnes
200
IntermodalBulk
100
2008
–09
2009
–10
2007
–08
2008
–09
2009
–10
2007
–08
2008
–09
2009
–10
NSW
QLD
WA
2007
–08
0
10
15
20
Million NetTonnes
5
2008
–09
2009
–10
2007
–08
2008
–09
2009
–10
VIC
SA Bulk rail freight volumes have risen significantly in the resources states.
Source: Bureau of Transport Infrastructure Economics
AECOM 2726 The Blue Book 2013

Defence, Justice and Local Government
Most levels of government are currently facing big revenue write-downs as a result of reduced tax receipts. Revenue streams such as the resources tax will be weakened by diminished profitability projections. This will result in some reductions or deferrals in government spending.
For example, the federal government recently cut Australia’s defence spending as a share of GDP to its lowest level since 1938; including $1.2 billion in deferred capital facilities spending. As a result, recommended upgrades to existing bases will be delayed in the medium term.
Looking ahead, spending on telecommunications is expected to wind back following the completion of the NBN, but spending on education and health are forecast to remain steady, despite the recent funding of several large hospitals.
At a local government level, there has been a significant rise in spending on local facilities, particularly in growth areas that lack sufficient community infrastructure to service burgeoning populations. However, other expenses have also escalated, resulting in fewer investments in some areas where projects require a large capital outlay.
Health and Aged Care
The key agendas for the health and aged care sectors going into 2013 are the continuation of government funding to develop facilities in growing urban and regional centres, but also continued spending by the private sector. In addition to the major hospital developments occurring in regions such as Hobart, Adelaide, Bendigo and the Gold Coast, an additional 76 projects — mainly upgrades to rural hospitals and health centres — have been allocated funding.
This approach is also supported by state funding that channels money into significant urban centres and large regional cities. For example, the Queensland government has committed $1.3 billion to hospitals across Queensland, including $51 million for regional and remote areas. Private sector investment is also trending upwards; private health sector building approvals more than doubled in the second half of 2012 to $846 million, compared to the same period in the previous year.
The demand for health facilities is also expected to rise in the medium term as the nation’s ageing population escalates. The newly established Aged Care Financing Authority will provide independent advice on pricing and financing issues in the aged care sector. In addition, $3.7 billion will be spent over the next five years to deliver more support in the home and better access to residential care.
Census data from 2011 also demonstrates the likely hotspots for aged care demand based on the current levels of aged care populations. It shows where there is a high concentration of the population over the age of 65, and where the next wave will develop — based on the proportions of the population currently aged between 50 and 64 years.
Local Government ExpendituresA$b
2001
−02
3.5
4.0
5.0
5.5
6.5
7.0
4.5
Housing and Community Amenities
Transport and Communications
Recreation and Culture
General Public Services
Other
2002
−03
2003
−04
2004
−05
2005
−06
2006
−07
2007
−08
2008
−09
2009
−10
2010
−11
3.0
2.5
2.0
Commonwealth Expenditure, Share by Selected Sectors
2001−02 2011−12 2015−16
4
6
14
16
18
20%
12
Defence
Education
10
8
2
0
Transport andCommunications
Health
Housing andCommunity Amenities
Source: ABS 5512
Current and the Next Wave of Demand from Australia’s Ageing Population
Source: Census 2011 Note: Hotspots for ageing populations are based on the proportion of populations aged 65+ or 50 – 54 by SA4 area.
Current demandhotspot (%65+)
Future demandhotspot (%50 − 64)
Mandurah
Wheat Belt
Barossa
South East
North West
Hume
South East
Wide Bay
Mid North Coast
Richmond
Southern Highlands
Coffs Harbour
Central Coast
Capital Region
Source: ABS 5512, Commonwealth Mid-year Economic Outlook
Note: : Forecasts are based on the Commonwealth 2012-13 Mid-year Economic Outlook
AECOM 2928 The Blue Book 2013

Education
Despite the recent stimulus investment, spending is projected to continue in the education sector as the industry keeps pace with changing delivery models and student expectations. The federal government’s Education Investment Fund is one of three Nation-building funds — along with the Building Australia Fund and the Health and Hospitals Fund — and will provide significant funding to this sector.
Recent recipients under the $500 million Regional Round announced at the end of 2012 include new engineering centres enabling the use of 3D scenarios on the Sunshine Coast and Geelong, and a performing arts building in Tasmania. This funding supports the growing educational needs of key regional centre populations.
Given the increases in secondary-aged children in some of these key districts, demand for further education opportunities are expected to rise in the medium term. Census data indicates areas where there is a high proportion of primary and secondary school attendees, pointing to where the next round of higher education demand will come from locally, depending on retention rates.
Current investments in higher education must also respond to a changing landscape in the industry. Universities and training facilities need to be equipped with the latest technology and adapt to different delivery styles.
Transportation
In addition to several key commuter transport projects which are currently slated for development, sea and land freight are two other key areas to be addressed across the nation. Infrastructure Australia’s Land Freight strategy was launched in 2012 to respond to the escalating demand for freight across the nation. Between 2010 and 2030:
− truck traffic is predicted to increase by 50 percent
− rail freight is expected to jump 90 percent
− the number of containers crossing the nation’s wharves will increase by 150 percent.
This freight capacity will be driven by an ongoing expansion in Australia’s exports. In the past five to ten years new markets
have emerged, such as China, Korea and Japan, while others have eased such as the US. The industry will also be helped by the recent introduction of three single national regulators for the freight industry, enabling one set of laws and one set of compliance papers.
In recent years there have been considerable rises in the volume of rail freight flows, particularly in WA. Several additional lines to service the iron ore industry were added by private operators, while in Queensland capacity was added to rail freight services for the coal industry. Beyond the constraints of the higher Australian dollar and commodity price variability, this trend is expected to continue in the medium term.
Top Localities for School Populations
Syd
ney
- B
aulk
ham
Hill
s
6.5
8.5
9.0
9.5
10.0%
8.0
Primary
Secondary
7.5
7.0
Syd
ney
- S
outh
Wes
t
Syd
ney
- O
uter
Sou
th W
est
Syd
ney
- B
lack
tow
n
War
rnam
bool
She
ppar
ton
Mel
bour
ne -
Out
er E
ast
Syd
ney
- O
uter
Wes
t
Mel
bour
ne -
Inne
r E
ast
Cof
fs H
arbo
ur
Hum
e
Mel
bour
ne -
Nor
th W
est
Vict
oria
- N
orth
Wes
t
Mel
bour
ne -
Sou
th E
ast
Demand for further education in tertiary and other instiutions is expected in these areas with a higher level of school attendees.
Source: ABS Census 2011Note: Figures indicate proportion of school attendees by SA4 area.
Note: Percentage measure reflects the real change in export value from 2004 to 2012, in A$.
Top Destinations for Australia’s Exports by Value
US 21%
$73b
$12b $50b $21b
$7b
$8b
-100%
0%
100%
200%
300%
400%
500%
2012
Real Change from 2004 Value of Exports
Values are Australian dollars and adjusted to 2012 dollars. Source: ABS 5368
-100%
0%
100%
200%
300%
400%
Real Change from 2004 Value of Exports
Values are Australian dollars and adjusted to 2012 dollars.
UK 21%
India 88%
China 443%
Taiwan 66%
Japan 83%
Korea 85%
New Zealand 30%
$9b
$8b
$12b
$73b
$21b
$8b
$7b
$50b
Source: AECOM, ABS 5368
AECOM 3130 The Blue Book 2013

Energy
Australia’s demand for energy has decreased in recent years. The 2012 National Electricity Forecasting Report from the Australian Energy Market Operator expects average annual growth to be 1.7 percent (to 2021), down from the 2.3 percent forecast in 2011.
The penetration of rooftop photovoltaic systems and energy efficiency provisions are expected to increase across the 10-year outlook period. Changes in Australia’s consumer market and LNG sector will also considerably influence changes in demand.
The supply side is evolving, and greater investment is expected in renewable generation. A more diverse supply will safeguard against price volatility as the
gas-fired generation market grows. Investment in renewables continues to gain momentum — global investment in 2012 was US$269 billion, boosted by US$68 billion in China and US$44 billion in the US. In Australia, investment in renewables rose 40 percent on 2011 levels to US$6 billion.
The Australian market will also be driven by policies such as the Renewable Energy Target. The Climate Change Authority has recommended that the Large-Scale Renewable Energy Target remain unchanged in order to maintain investment certainty. Renewables and reduced electricity demand have also enabled an 8 percent fall in carbon emissions during the first six months of the carbon price scheme.
Water
In recent years, Australia has seen widespread expenditure on large scale water infrastructure projects. Following this, there is a realisation from regulators, politicians and water authorities that the industry now needs to focus on optimising its existing assets and implementing measures to ensure smarter, fit-for-purpose use of water resources.
One of the key drivers for this shift is the significant increase in consumer prices as the cost of these infrastructure investments are passed on. Despite using less water, households are now paying much more; the average price increased by 33 percent from $0.74 per kilolitre in 2008–09 to $1.03 per kilolitre in 2010–11. Meanwhile, water consumption decreased by 8 percent between 2009–10 and 2010–11 and recycled water use rose by 6 percent — however the
volumes for this remain relatively low. The water industry is now looking to build upon this localised capture and reuse of water by communities.
To this end, many states are now making progress on decentralised wastewater and stormwater initiatives so that this water can be fed back into the community. This will take pressure off potable water supplies and help cities become more resilient. This approach will involve changes to the planning and building regulations to transform community water use, in a similar way to recent energy efficiency measures.
These new approaches in urban and regional cities will ensure healthier urban waterways, greener open spaces, reduced urban heat island effects, future water security, and less reliance on rural water.Forecasts for Average Annual Energy Growth Rates to 2021–22
1.0
3.0
3.5
4.0
4.5%
2.5
2012 Forecasts
2011 Forecasts2.0
1.5
Significant revisions down in terms of the forecast energy growth rates.
0
0.5
NSW QLD SA TAS VIC NationalElectricity
Market
Global Clean Energy Investment
10
50
60
70
80US$b
40
30
20
Investment in clean energy generation remains high, while spending was boosted in 2011 as a result of US stimulus measures.
0
2004
2005
2006
2007
2008
2012
2009
2010
2011
Average Water Prices
2008−09 2009−10 2010−11
1.5
2.0
2.5
3.0A$/kL
1.0
Industries Households
0.5
0
Total
33% rise in household water prices
Source: Australian Energy Market Operator
Note: Percentage change is a measure of GWh per year.
Source: Bloomberg New Energy Finance
Source: ABS 4610
AECOM 3332 The Blue Book 2013

Mining, Oil and Gas
Many in the industry believe that Australia’s peak in mining construction is likely to be 2013. The Bureau of Resources and Energy Economics (BREE) reported that the number of mining and energy projects close to or under construction had fallen to 87 in November 2012 from 98 some six months earlier, while new project sign-offs had also decreased.
However, significant investment will be ongoing even if scaled back due to rising costs and commodity price variability. This will mean several regions around the country will see keen competition for construction labour resources. Projections for labour requirements based on similar projects and industry benchmarking demonstrate hotspots for planned resource industry construction projects.
These estimates have been developed to provide an overview of the total potential
investment and pressure points in labour demand. Sizable projects are planned for operation post-2015 in areas such as Gladstone and Abbot Point in Queensland and Port Hedland and the Carnarvon Basin regions in Western Australia. Suitable approaches will be required to resource these projects, otherwise developers will face considerable downside risks in terms of delays and cost escalation. These areas will also experience the flow-on effects of ongoing investment; accommodation and other amenities will be required to service these new populations.
Of the projects that are committed to go ahead already, there are 12 iron ore projects with a combined value of $26 billion. Once complete, they will produce an additional 239 Mt of iron ore exports per year — a 50 percent increase on iron ore exports from 2011–12 levels.
Beyond gas and iron ore, other commodities are also driving ongoing investment. This will meet the growing demand from emerging nations for more consumer devices and infrastructure projects, such as China’s copper imports for the expansion of its electricity grid. In the Kalgoorlie region there is over $4 billion of planned nickel and cobalt investment in the early stages. Others include $7 billion worth of gold mines, as well as ammonium nitrate plants planned in several states.
Our labour force analysis demonstrates that many large-scale or offshore projects in the gas sector are more labour intensive — often because they are of a mega-scale which makes construction more involved. Some LNG projects have been delayed, such as off the coast in Queensland, as a result of escalating construction costs or other risks.
The gas industry will also face burgeoning competition from other exporters, such as the US. However, local LNG operators have long-term contracts for much of their output to beyond 2030 and these contracts are strengthened by the fact that many of their LNG customers (predominantly from Asia) are also equity holders.
The other differentiator is that Australia’s east coast LNG will be sourced from coal seam methane, while the US market is shale. Coal seam gas is shallower and can usually be extracted without fracturing or forcing the gas to the surface, whereas shale gas extraction requires fracturing so is more expensive to extract. This means that the price of US gas is expected to escalate as shale becomes more popular and it may not pose as significant a threat to the Australian export market.
Construction Labour Factors by Project Type
Source: AECOM, Bureau of Resources and Energy Economics
Source: AECOM, Bureau of Resources and Energy Economics
Note: Figures indicate estimated construction labour demand from resources projects.
Resources Industry Labour Demand Hotspot Areas
Pilbara
Port Hedland
WA Remainder
Mid-west
Carnarvon Basin
Kalgoorlie-LavertonSA Total
VIC Total
NT Total
Offshore
Mt Isa
Wandoan
Abbot Point
Emerald Gladstone
QLD Remainder
NewcastleOrangeNSW Remainder
2012−15
2016+
5
A$m/labour unit
0
Greater labour
intensity during
construction
UraniumGold
Lead, Zinc,Silver
Aluminium, Alumina, Bauxite
NickelIron Ore
OtherCommodities
Infrastructure
Copper
LNG, Gas, Petroleum
5
0
A$m/labour unit
AECOM 3534 The Blue Book 2013

3NEW ZEALAND MARKET CONDITIONS
Outlook 38
Christchurch Rebuild 39
Construction Activity 40
New Zealand Construction Sentiment 41
Transportation 42
Energy 43
AECOM 37

Outlook Christchurch Rebuild
The outlook is more promising in Christchurch; the Christchurch Blueprint, an important step towards delivering the rebuild was released in mid-2012. The New Zealand Treasury’s estimate for the damage to commercial and infrastructure assets from the Canterbury earthquake has also been revised up to around NZ$40 billion.
With a significant amount of demolition work now complete, construction activity in Canterbury is gathering pace, and will have a marked effect on the industry in the short to medium term. Consistently higher numbers of earthquake-related building consents are now being issued. This will see the number of projects entering construction ramp up from the start of 2013.
Despite indicators that the rebuild is gaining momentum, many roadblocks remain including: delays in completion of detailed damage reports, a lack of the required resources to assess ground conditions, land zoning restrictions, and the wait for foundation repair guidelines. On the upside, commitments to the larger anchor projects are expected to improve market certainty and encourage other smaller developments to go ahead.
Progress is marked by the opposing forces of optimism to ‘just get on with it’, and a sense of being ‘bogged down’ in complicated processes involving multiple stakeholders. The complexity of circumstances surrounding the rebuild also means issues of value for money, probity and transparency must remain at the forefront of project procurement and execution processes.
Earthquake-related Building Consents
New Zealand Gross Domestic Product
New Zealand Unemployment Rate
Source: New Zealand Treasury
Source: New Zealand Treasury
Note: Annual average growth rates for production-based real GDP, year to March.
Source: Statistics New Zealand
The ongoing weakness of the international outlook and the relative strength of the New Zealand dollar will continue to curb growth in New Zealand’s economy in 2013, with the bulk of the economy’s growth in the medium term expected to come from residential investment, non-residential investment and stocks.
Much of this will come from the Canterbury rebuild, but some gains are also expected in consumer spending. These gains will be moderate until the labour market recovers. Unemployment projections by the New Zealand Treasury expect the unemployment rate to stay above 6 percent until 2015.
%
2003
2004
2005
2006
2007
2008
2009
2010
2011
2012
The Canterbury rebuild will drive much of the GDP growth in the medium term.
-2
-1
1
2
3
4
0
2001
2002
5
2013
2014
2015
2016
2017
%
2003
2004
2005
2006
2007
2008
2009
2010
2011
2012
The unemployment rate is not expected to move below 5% until 2017.
3.0
3.5
4.5
5.0
5.5
6.0
4.0
2001
2002
6.5
2013
2014
2015
2016
2017
7.0
7.5
Note: Unemployment rate at March quarter, seasonally adjusted.
10
0
40
50
60
20
30
6-Month Moving Average
NZ$m
Value of Consents
Dec
12
Nov
12
Oct
12
Sep
12
Aug
12
Jul 1
2
Jun
12
May
12
Apr
12
Mar
12
Feb
12
Jan
12
Dec
11
Nov
11
Oct
11
Sep
11
Aug
11
Jul 1
1
Jun
11
May
11
Apr
11
Mar
11
Feb
11
Jan
11
Dec
10
Nov
10
Oct
10
Sep
10
AECOM 3938 The Blue Book 2013

Construction Activity
Construction activity data from Statistics New Zealand indicates that while some sectors have made progress, the commercial and residential sectors are yet to show signs of a solid uptake. The residential sector is expected to show some improvement in 2013, compared to the lows of recent years, but much of this will stem from the Canterbury rebuild and repairs to leaky homes. At some point the market will respond to the pent-up demand after years
of below average building rates, but buyers will be constrained by ongoing struggles with affordability.
Our Construction Sentiment Survey shows that the outlook of public authorities and private investors has improved since 2012 in both the infrastructure and buildings markets. However, despite these anticipated improvements in workload, both markets remain cautious that not all prospects will translate into new projects in the near term.
New Zealand Construction Sentiment
While there have been some improvements in outlook, most in the New Zealand construction industry remain cautious as they grapple with dwindling margins and hesitation from investors.
Resourcing remains an issue; firms have been indicating increased difficulty finding suitably skilled labour, suggesting a mismatch between the nation’s unemployed and the skills required for the available construction work. This may be exacerbated
by further insolvencies. Many businesses have secured work at low margins and are open to being caught in an inflationary cost market with little or no capital reserves.
Further margin tightening in 2013 is likely for some parts of the industry, while others will hold steady. The general sentiment is one of tough business conditions. Most anticipate that the industry will have to wait until 2015 before a notable improvement in profitability occurs.
New Zealand Building Work Put in Place
New Zealand Residential Building Consents
Source: Statistics New Zealand
NZ$b
0.8
1.0
1.4
1.6
1.8
1.2
Commercial Factories and Industrial
Hospitals, Nursing Homes
Accommodation Education
0.6
0.4
0.2
1990
1991
1992
1993
1994
1995
1996
1997
1998
1999
2000
2001
2002
2003
2004
2005
2006
2007
2008
2009
2010
2011
2012
0
Miscellaneous
Spending on hospitals, nursing homes, factories and industrial buildings is strengthening, while the commercial sector has also risen slightly
Source: Statistics New ZealandNote: Annual value for the year to September.
‘000
30
40
60
70
80
50
20
10
1991
1992
1993
1994
1995
1996
1997
1998
1999
2000
2001
2002
2003
2004
2005
2006
2007
2008
2009
2010
2011
2012
0
Value (RHS)
NZ$b
3.0
4.0
6.0
7.0
8.0
5.0
2.0
1.0
0
Number (LHS)
The residential construction sector is yet to show signs of a solid recovery
Government investment Christchurch rebuild Economic conditionsPopulation demand Funding availabilityDrive for efficiencyAsset renewalCapital investment cycleEscalating service expectations
Relative Strength of New Investment Drivers
Relative Strengths of Industry Risks
Resources and capability Regulatory and insurance complianceFundingPressure to cut costsInvestor commitmentQualityIncreasing costsRushed delivery
AECOM 4140 The Blue Book 2013
Source: AECOM Construction Sentiment Survey New Zealand

Coal Gas Hydro Geothermal Wind Other
2010 1,933 9,205 24,470 5,551 1,618 625
2030 680 9,885 27,204 12,273 4,361 707
Transportation
The central government’s approach to investing in the transport sector — as set out in the National Infrastructure Plan (2011) — has necessarily undergone some revision based on the tight fiscal environment. The National Infrastructure Unit is expected to release the next edition in 2014, although the overarching vision is over a 20-year timeframe and includes several significant transport projects, such as the Roads of National Significance and the KiwiRail Turnaround Plan.
As part of this infrastructure policy, the 2012–15 National Land Transport Programme includes an investment in excess of NZ$3 billion in the Roads of National Significance. These projects are all underway with completion dates in the next 10 years and construction is scheduled to start on some in 2012–13. Once maintenance is included, roads will account for 77 percent of spending over this 2012–15 period.
There is also an increasing focus on the development of strategic freight networks across the upper North Island, as this region is critical to New Zealand’s economic success. More than 55 percent of New Zealand’s freight travels through the Northland, Auckland, Waikato and Bay of Plenty regions, and these regions generate over 50 percent of New Zealand’s gross domestic product.
Efforts have also been made to streamline the consenting process to reduce uncertainty and regulatory compliance costs. The New Zealand Transport Agency has done significant work to refine scenario modelling to more accurately project likely infrastructure investment and is exploring the possibility of alternative funding sources to meet the scope of infrastructure works required, such as targeted road pricing.
Energy
A leader in renewable energy generation, New Zealand’s energy industry will continue to make progress in this area in an effort to improve energy security and reduce emissions. Recently commissioned plants in geothermal and wind generation combined met 18 percent of New Zealand’s electricity demand in the June quarter 2012.
This diversity of generation options will help keep emissions low during dry years when hydro generation levels are lower, as well as working towards the government’s target of
90 percent renewable generation by 2025. Extensive farming and forestry options mean biomass could also be a source of electricity, heat or biofuels.
In addition to this, the government is working to increase the efficiency of the network by upgrading the transmission grid and using new smart technologies. However, consumers continue to see increases in electricity prices; rising at an average rate of 5.2 percent per annum since 2008.
New Zealand Land Transport Programme — Forecast Expenditure
Source: New Zealand Transport Agency Note: The number in brackets shows the proportion of expenditure relative to the 2012–15 total.
Source: New Zealand Ministry of Economic Development
New
Roa
ds(4
2%)
0.2
1.0
1.2
1.4
1.6NZ$b
0.8
2012−13
2014−15
0.6
0.4
Roa
d M
aint
enan
ce
(15%
)
Roa
d Im
prov
emen
ts
(16%
)
Em
erge
ncy
Roa
d W
orks
(5
%)
Man
agem
ent
and
Pla
nnin
g (2
%)
Pub
lic T
rans
port
(10%
)
Roa
d S
afet
y (1
1%)
Wal
king
and
Cyc
ling
(1%
)0
Spending on roads accounts for 77% of forecast expenditure
2013−14
New Zealand Forecast Change in Electricity Generation, 2010 – 2030
New Zealand Real Annual Average Electricity Prices
Note: Bubble size represents generation in GWh.
Source: New Zealand Ministry of Business, Innovation and Employment Note: Residential prices are inclusive of GST.
%
-50
50
100
150
200
Coal Gas Hydro Geothermal Wind Other-100
2010 GWh0
2030 GWh2010 Level
More generationby 2030
Less generationby 2030
NZ$/GJ
40
50
70
80
60
Residential Industrial Commercial
30
20
10
1990
1991
1992
1993
1994
1995
1996
1997
1998
1999
2000
2001
2002
2003
2004
2005
2006
2007
2008
2009
2010
2011
0
Residential electricity prices increased by 52% between 2000 and 2011...
... while Commercial rose 13% and Industrial 26%
AECOM 4342 The Blue Book 2013

4COST DATAAND MARKET ANALYSIS
Collaboration Drives Global Knowledge for 46 Local Projects
International Building Costs 48
International Building Cost Comparisons 49
Davis Langdon Tender Price Index 50
Major Rates for ANZ 51
Australian Property Market – Commercial Overview 52
Commercial Construction Costs 53
Residential Construction Costs 54
Industrial Construction Costs 55
Retail Construction Costs 56
Health and Aged Care Construction Costs 57
Education Construction Costs 57
Tourism Construction Costs 58
Australian Labour Material Ratios 59
Mining – Shifting Cost Pressures 60
AECOM 45

Capturing and storing data from cost plans gives project teams the knowledge to deliver better project outcomes and minimise project budget risks.
Project developers increasingly need to capture and benchmark cost and design parameters on projects, requiring them to manage vast amounts of data.
Our response to capturing this data and ensuring it is presented in a way that is relevant to individual projects is Global Unite, a tool we have developed to drive evidence-based decision making.
By comparing active projects, these performance indicators go beyond cost and have the potential to influence decisions through information-led design.
Global Data Warehouse
Design and cost data from over 10,000 benchmarked projects centrally stored and globally accessible#.
Automated process that captures all projects by cost management stage.
All historic costs adjusted by location and time to suit your project.
Global Unite System
MeasurementThe latest measurement software allows direct measurement from the design team’s electronic drawings (2D or 3D).
Accurate cost advice can be provided faster than before and by collaborating with the design team, parameters can be set to maximise the potential cost savings.
CostQuantities and costs are measured and compared against the Global Unite benchmark system. When the design is incomplete, Global Unite provides confidence through an extensive evidence-base.
#Increasing daily with every completed cost plan globally.
AECOM 4746 The Blue Book 2013
Collaboration Drives Global Knowledge for Local Projects
University, NSW, 0.98
00
2.5
2.0
1.5
1.0
0.5
5.000 10,000 20,00015,000Floor Area (m2)
Cost Plan Best Fit
Exte
rnal
Wal
l : F
loor
Rat
io
Benchmarking and Analytics
Compare cost and design attributes against local or world’s best practice to better inform project decisions.
Parameters that define a building’s effectiveness or efficiency can be analysed instantly against local or global standards, allowing clients to make informed design decisions consistent with world’s best practice.
Insights gathered by accessing the Global Unite tool have the capacity not only to improve project outcomes for our clients but also to build knowledge and support the advancement of our industry.

International Building CostsUS$/m²
Syd
ney
Auck
land
Bah
rain
Abu
Dha
bi
Doh
a
Hon
g K
ong
Bei
jing
Sin
gapo
re
Kua
la L
umpu
r
Ho
Chi
Min
h
Mum
bai
Ban
gkok
Joha
nnes
burg
Los
Ange
les
San
Fra
ncis
co
New
Yor
k
Lond
on
Residential
Average Multi-unit High Rise
2850 2,270 1,300 1,300 1,500 2,320 685 1,800 515 695 415 875 840 3,800 3,900 4,000 3,330
Luxury Unit High Rise
3280 2,610 1,600 1,710 2,100 2,560 1,050 3,100 1,165 840 550 1,225 1,460 4,550 4,650 4,900 4,950
Individual Prestige Houses
3,420 2,680 1,700 1,810 1,900 3,990 810# 3,000 1,045 640 650 1,010 1,470 3,650 3,750 4,100 6,930
Commercial/Retail
Average Standard Offices High Rise
3180 2,520 1,170 1,450 1,800 2,340 975 2,400 825 820 495 790 1,110 3,850 4,150 4,250 2950**
Prestige Offices High Rise
3600 2,860 1,280 1,700 2,050 2,840 1300# 2,800 1,210 1,240 590 1,035 1,420 4,500 4,700 4,800 3600**
Major Shopping Centre (CBD)
2540 2,020 1,230 1,370 1,250 N/A 1,080 3,200 995 790 550 985 1,100 2,900 3,250 3,350 2,200
Industrial
Light-Duty Factory
680 550 620 630 970 1,340 N/A 1,600 480 395 435 630 380 1,250 1,500 1,250 1,490
Heavy-Duty Factory
860 690 700 850 1,100 1,460 N/A 1,700 570 415 670 N/A 530 1,700 1,930 2,000 2,540
Hotel
3 Star Budget
3280 2,610 1,800 2,280 2,050 2,880 1205* 3100* 1,625 860 1,580 1,410 1,690 2,250 2,350 2,400 2,610
5 Star Luxury 4550 3,610 2,620 3,050 3,350 4,010 1950* 4500* 2,485 1,520 2,760 1,980 2,230 4,800 4,900 5,030 5,100
Resort Style 4130 3,270 3,200 3,300 3,750 N/A N/A 4500* 1,760 1,315 1,480 2,345 2,670 4,900 5,000 N/A N/A
Other
Multi-storey Car Park
890 710 620 540 760 1,000 N/A 780 310 345 215 370 410 940 980 1000 650
District Hospital
4070 3,240 2,450 3,200 3,590 3,500 N/A N/A 1,080 N/A 690 N/A 1,110 7,300 7,500 6,800 4,400
Primary & Secondary Schools
1710 1,350 1,510 1,450 1,250 1,700 N/A 1,400 320 N/A 530 N/A 760 3,200 3,450 3,900 2,010
US$1 = 0.95 1.19 0.37 3.67 3.64 7.98 6.46 1.22 3.14 21,492 54.58 31.58 8.93 1.00 1.00 1.00 0.62
Ex. rate at Dec 2012
AUD NZD BHD AED QAR HKD RMB SGD MYR VND INR THB ZAR USD USD USD GBP
Prices exclude land, site works, professional fees, tenant fitout and equipment. Hotel rate includes FF&E Excl. GST/VAT # Rate includes parking and minimal external works ^ Rate includes raised flooring and ceiling to tenanted areas * Rate includes FF&E ** Up to 12 storeys Source: Davis Langdon Research
International Building Cost Comparisons
4,000
3,500
2,500
2,000
1,500
1,000
500
0
US$/m2
Kua
la L
umpu
r
Bei
jing
Mum
bai
Ban
gkok
Joha
nnes
burg
Bah
rain
Abu
Dha
bi
Doh
a
Sin
gapo
re
Auc
klan
d
Hon
g K
ong
Lond
on
Syd
ney
Los
Ang
eles
San
Fra
ncis
co
New
Yor
k
Ho
Chi
Min
h
Average Multi-unit High Rise Commercial
District Hospital Hotels
Major Shopping Centre (CBD) Industrial
5,000
4,000
3,000
2,000
1,000
0
US$/m2
Ban
gkok
Mum
bai
Kua
la L
umpu
r
Bei
jing
Bah
rain
Joha
nnes
burg
Abu
Dha
bi
Auc
klan
d
Doh
a
Sin
gapo
re
Hon
g K
ong
Syd
ney
Los
Ang
eles
San
Fra
ncis
co
New
Yor
k
Lond
on
Average StandardOffices High Rise
Prestige OfficesHigh Rise
Ho
Chi
Min
h
8,000
7,000
6,000
5,000
4,000
3,000
2,000
1,000
0
US$/m2
Kua
la L
umpu
r
Mum
bai
Joha
nnes
burg
Bah
rain
Hon
g K
ong
Auck
land
Abu
Dha
bi
Lond
on
Doh
a
Syd
ney
New
Yor
k
San
Fra
ncis
co
Los
Ang
eles
5,000
4,000
3,000
2,000
6,000
1,000
0
US$/m2
Mum
bai
Bei
jing
Ban
gkok
Kua
la L
umpu
r
Joha
nnes
burg
Bah
rain
Auck
land
Abu
Dha
bi
Hon
g K
ong
Doh
a
Sin
gapo
re
Lond
on
Los
Ang
eles
Syd
ney
New
Yor
k
5 Star Luxury 3 Star Budget
Fran
cisc
oS
an
Ho
Chi
Min
h
3,500
3,000
2,500
2,000
1,500
1,000
500
0
US$/m2
Mum
bai
Ban
gkok
Kua
la L
umpu
r
Auc
klan
d
Joha
nnes
burg
Doh
a
Bah
rain
Bei
jing
Abu
Dha
bi
Lond
on
Sin
gapo
re
Syd
ney
Los
Ang
eles
San
Fra
ncis
co
New
Yor
k
Ho
Chi
Min
h
3,000
2,000
1,500
1,000
500
0
US$/m2
Mum
bai
Kua
la L
umpu
r
Auc
klan
d
Joha
nnes
burg
Bah
rain
Syd
ney
Abu
Dha
bi
Doh
a
Hon
g K
ong
Sin
gapo
re
Lond
on
Los
Ang
eles
San
Fra
ncis
co
New
Yor
k
Light-Duty FactoryHeavy-Duty Factory
2,500
Ho
Chi
Min
h
Source: Davis Langdon Research
AECOM 4948 The Blue Book 2013

Davis Langdon Tender Price Index
Source: Davis Langdon Research
1st
Qtr
200
4
3rd
Qtr
200
4
1st
Qtr
200
5
3rd
Qtr
200
5
1st
Qtr
200
6
3rd
Qtr
200
6
1st
Qtr
200
7
3rd
Qtr
200
7
1st
Qtr
200
8
3rd
Qtr
200
8
1st
Qtr
200
9
3rd
Qtr
200
9
1st
Qtr
201
0
3rd
Qtr
201
0
1st
Qtr
201
1
3rd
Qtr
201
1
1st
Qtr
201
2
3rd
Qtr
201
2
Brisbane
Melbourne
Cairns
Perth
Canberra
Sydney
Darwin
Townsville
Adelaide
1st
Qtr
201
3
3rd
Qtr
201
3
120
140
160
180
200
220
240
Index
Forecast
Adel
aide
Bri
sban
e
Cai
rns
Can
berr
a
Dar
win
Mel
bour
ne
Pert
h
Syd
ney
Tow
nsvi
lle
2nd Qtr 2007 169 180 167 167 181 189 178 186
3rd Qtr 2007 172 182 171 171 185 194 180 191
4th Qtr 2007 176 183 172 174 188 200 181 192
1st Qtr 2008 180 187 175 180 179 191 206 182 201
2nd Qtr 2008 185 191 178 183 191 194 211 185 211
3rd Qtr 2008 184 191 180 187 194 195 215 189 213
4th Qtr 2008 182 191 180 185 198 190 214 186 212
1st Qtr 2009 183 182 177 183 201 185 206 186 209
2nd Qtr 2009 183 180 174 179 202 185 204 186 205
3rd Qtr 2009 183 178 171 178 204 185 200 186 202
4th Qtr 2009 184 176 170 179 207 182 196 186 201
1st Qtr 2010 184 176 168 180 209 182 197 186 200
2nd Qtr 2010 184 177 168 182 212 184 176 187 200
3rd Qtr 2010 185 177 168 183 215 187 176 188 199
4th Qtr 2010 186 177 168 184 216 191 176 188 199
1st Qtr 2011 187 177 168 187 217 192 176 190 199
2nd Qtr 2011 187 177 168 187 219 193 176 190 200
3rd Qtr 2011 186 177 167 187 220 194 176 191 200
4th Qtr 2011 186 177 169 188 222 194 176 191 201
1st Qtr 2012 185 177 170 188 223 194 176 192 201
2nd Qtr 2012 185 177 170 188 225 194 176 192 201
3rd Qtr 2012 184 177 170 188 226 194 176 192 201
4th Qtr 2012 184 177 170 188 227 194 176 193 200
1st Qtr 2013 186 177 170 191 228 194 176 193 199
2nd Qtr 2013 187 177 170 192 231 195 176 195 199
3rd Qtr 2013 188 178 170 193 234 196 177 196 200
4th Qtr 2013 190 179 170 194 237 197 179 196 200
Major Rates for ANZ
Rates are subcontract rates inclusive of labour and material fixed in position complete, include competitive margins for overhead and profit, and are for projects constructed in the CBD area of average specification and of medium- to high-rise construction.
The rates are net of GST component.
The rates are not intended to be used for tendering and/or the assessment of variations.
The rates are net of preliminaries.
A$ NZ$
Adel
aide
Bri
sban
e
Cai
rns
Can
berr
a
Dar
win
Mel
bour
ne
Pert
h
Syd
ney
Tow
nsvi
lle
Auck
land
Wel
lingt
on
Chr
istc
hurc
h
Basement Excavation m³ $44 $42 $41 $45 $60 $45 $41 $45 $46 $55 $55 $75
Foundation Excavation m³ $82 $80 $78 $85 $110 $85 $77 $85 $88 $85 $90 $115
Imported Structural Fill m³ $92 $89 $87 $95 $125 $95 $86 $95 $98 $95 $95 $130
Concrete in Pad Footing (25 mpa)
m³ $245 $235 $230 $250 $295 $250 $225 $250 $260 $280 $280 $340
Concrete in Wall (32 mpa) m³ $320 $310 $305 $330 $355 $330 $300 $290 $340 $330 $330 $395
Concrete in Suspended Slab (32 mpa)
m³ $280 $275 $265 $290 $330 $290 $265 $280 $300 $290 $290 $350
Formwork to Slab Soffit m² $126 $122 $120 $130 $165 $130 $118 $131 $134 $170 $170 $190
Formwork to Side and Soffit of Beam
m² $141 $136 $133 $145 $186 $145 $132 $146 $149 $145 $145 $215
Precast Wall Panel Architectural with Sand Blast Finish
m² $415 $405 $395 $430 $550 $430 $390 $430 $445 $420 $425 $525
Reinforcement in Beam t $2,720 $2,630 $2,580 $2,810 $2,730 $2,800 $2,540 $2,200 $2,890 $3,000 $3,000 $3,500
Structural Steel in Beam t $6,310 $6,110 $5,980 $6,520 $7,880 $6,500 $5,900 $6,530 $6,700 $6,000 $6,200 $7,620
Structural Steel in Truss t $6,690 $6,490 $6,350 $6,920 $8,400 $6,900 $6,260 $6,930 $7,110 $7,500 $7,500 $8,100
Aluminium Framed Window 6.5 Clear Glass
m² $630 $610 $600 $650 $835 $650 $590 $655 $670 $650 $650 $780
Aluminium Panel Curtain Wall System (including structural system)
m² $875 $845 $830 $900 $1,155 $900 $815 $905 $930 $905 $920 $1,070
Steel Stud Partition (framing)
m² $39 $38 $37 $40 $51 $40 $36 $40 $41 $45 $45 $56
Plasterboard 13 thick to Partition
m² $29 $28 $28 $30 $39 $30 $27 $30 $31 $33 $33 $45
Suspended Mineral Fibre Ceiling Tile
m² $58 $56 $55 $60 $77 $60 $54 $60 $62 $60 $60 $73
Paint on Plasterboard Wall m² $10 $9 $9 $10 $17 $10 $9 $10 $10 $12 $12 $18
Ceramic Tiles to Wall m² $87 $85 $83 $90 $116 $90 $82 $90 $93 $105 $105 $125
Non-slip Vinyl to Wet Areas m² $73 $71 $69 $75 $97 $75 $68 $75 $77 $85 $85 $90
Anti-static Carpet Tile to Office & Admin Areas
m² $58 $56 $55 $60 $77 $60 $54 $60 $62 $65 $65 $75
Anti-static Broadloom Carpet to Office & Admin Areas
m² $56 $55 $53 $58 $75 $58 $53 $58 $60 $55 $55 $69
Aluminium Framed Shopfront
m² $580 $565 $550 $600 $765 $600 $545 $605 $620 $620 $635 $715
Source: Davis Langdon Research
AECOM 5150 The Blue Book 2013

Vacancy Rate %
CBD Stock
Canberra CBD
12
10
8
6
4
2
0
14
162.40
2.20
1.80
1.60
2.00
1.40
1.20
Total Stock(million m2)
VacancyRate %
Jan
02Ju
l 02
Jan
03Ju
l 03
Jan
04Ju
l 04
Jan
05Ju
l 05
Jan
06Ju
l 06
Jan
07Ju
l 07
Jan
08Ju
l 08
Jan
09Ju
l 09
Jan
10Ju
l 10
Jan
11Ju
l 11
Jan
12Ju
l 12
Jan
13
Perth CBD
12
10
8
6
4
2
0
14
161.60
1.50
1.35
1.30
1.40
1.25
1.20
Total Stock(million m2)
VacancyRate %
Jan
02Ju
l 02
Jan
03Ju
l 03
Jan
04Ju
l 04
Jan
05Ju
l 05
Jan
06Ju
l 06
Jan
07Ju
l 07
Jan
08Ju
l 08
Jan
09Ju
l 09
Jan
10Ju
l 10
Jan
11Ju
l 11
Jan
12Ju
l 12
Jan
13
1.55
1.45
Adelaide CBD
12
10
8
6
4
2
0
141.04
1.00
0.94
0.92
0.96
0.90
0.88
Total Stock(million m2)
VacancyRate %
Jan
02Ju
l 02
Jan
03Ju
l 03
Jan
04Ju
l 04
Jan
05Ju
l 05
Jan
06Ju
l 06
Jan
07Ju
l 07
Jan
08Ju
l 08
Jan
09Ju
l 09
Jan
10Ju
l 10
Jan
11Ju
l 11
Jan
12Ju
l 12
Jan
13
Brisbane CBD
10
8
6
4
2
0
122.30
2.00
1.70
1.60
1.80
1.50
1.40
Total Stock(million m2)
VacancyRate %
Jan
02Ju
l 02
Jan
03Ju
l 03
Jan
04Ju
l 04
Jan
05Ju
l 05
Jan
06Ju
l 06
Jan
07Ju
l 07
Jan
08Ju
l 08
Jan
09Ju
l 09
Jan
10Ju
l 10
Jan
11Ju
l 11
Jan
12Ju
l 12
Jan
13
2.10
1.90
Sydney CBD
12
10
8
6
4
2
0
Total Stock(million m2)
VacancyRate %
Jan
02Ju
l 02
Jan
03Ju
l 03
Jan
04Ju
l 04
Jan
05Ju
l 05
Jan
06Ju
l 06
Jan
07Ju
l 07
Jan
08Ju
l 08
Jan
09Ju
l 09
Jan
10Ju
l 10
Jan
11Ju
l 11
Jan
12Ju
l 12
Jan
13
Melbourne CBD
12
10
8
6
4
2
0
4.10
3.70
3.10
2.90
3.30
2.70
2.50
Total Stock(million m2)
VacancyRate %
Jan
02Ju
l 02
Jan
03Ju
l 03
Jan
04Ju
l 04
Jan
05Ju
l 05
Jan
06Ju
l 06
Jan
07Ju
l 07
Jan
08Ju
l 08
Jan
09Ju
l 09
Jan
10Ju
l 10
Jan
11Ju
l 11
Jan
12Ju
l 12
Jan
13
3.90
3.50
2.20 1.02
0.98
4.50
4.30
4.80
4.60
4.30
4.20
4.40
4.10
4.00
4.70
4.50
5.00
4.90
Australian Property Market – Commercial Overview
Net Face Rents ($/sq m) Yields**
Prime 360-540 6.25-7.50
Total Stock (m²) as at Jan 2013 Vacancy Rate (%) as at Jan 2013 *Rents (A$/m²) as at July 2012 **Yields (%) as at July 2012
Source: Property Council of Australia, Knight Frank Research
Commercial Construction Costs A$/m2 NZ$/m2
Adel
aide
Bri
sban
e
Cai
rns
Can
berr
a
Dar
win
Mel
bour
ne
Pert
h
Syd
ney
Tow
nsvi
lle
Auck
land
Wel
lingt
on
Chr
istc
hurc
h
Australasian Overall Building Rates*
Average Standard Offices
- Low Rise 1,050 2,070 2,020 2,210 2,800 2,200 2,200 2,210 2,270 2,200 2,240 2,660
- Medium Rise 2,200 2,440 2,390 2,610 3,250 2,600 2,500 2,610 2,680 2,600 2,650 3,150
- High Rise 2,750 2,820 2,760 3,010 3,650 3,000 3,000 3,010 3,090 3,000 3,050 3,630
High Standard Offices 3,300 3,200 3,130 3,410 4,200 3,400 3,350 3,420 3,510 3,400 3,460 4,080
Engineering Services (Mechanical)
Average Standard Offices
- Low Rise 245 235 230 250 320 250 225 250 260 255 245 305
- Medium Rise 320 310 305 330 425 330 300 330 340 330 340 415
- High Rise 350 340 330 360 460 360 325 360 370 360 360 435
High Standard Offices 415 405 395 430 550 430 390 430 445 435 440 520
Engineering Services (Electrical)
Average Standard Offices
- Low Rise 145 140 140 150 195 150 135 150 155 150 155 185
- Medium Rise 175 170 165 180 230 180 165 180 185 180 185 220
- High Rise 225 215 210 230 295 230 210 230 235 230 235 280
High Standard Offices 260 255 250 270 345 270 245 270 280 270 280 325
Engineering Services (Fire)
Average Standard Offices
- Low Rise 29 28 28 30 39 30 27 30 31 35 35 40
- Medium Rise 78 75 74 80 103 80 73 80 82 85 85 85
- High Rise 78 75 74 80 103 80 73 80 82 85 85 85
High Standard Offices 97 94 92 100 128 100 91 100 103 105 105 110
Commercial Market Overview
Average Prime Net Effective Rents ($A/m2) Prime Yields (%)Sydney 475-675 6.25-7.25
Melbourne 360-540 6.25-7.50
Brisbane 370-520 7.10-8.10
Adelaide 290-350 7.75-8.50
Perth 740-860 7.25-8.75
Canberra 295-325 7.25-7.75
Source: Knight Frank Research at July 2012
Net Face Rents ($/sq m) Yields**
Prime 475-675 6.25-7.25
Net Face Rents ($/sq m) Yields**
Prime 290-350 7.75-8.50
Net Face Rents ($/sq m) Yields**
Prime 370-520 7.10-8.10
Net Face Rents ($/sq m) Yields**
Prime 740-860 7.25-8.75
Net Face Rents ($/sq m) Yields**
Prime 295-325 7.25-7.75
Source: Davis Langdon Research
AECOM 5352 The Blue Book 2013
Vacancy Rate %
CBD Stock
Canberra CBD
12
10
8
6
4
2
0
14
162.40
2.20
1.80
1.60
2.00
1.40
1.20
Total Stock(million m2)
VacancyRate %
Jan
02Ju
l 02
Jan
03Ju
l 03
Jan
04Ju
l 04
Jan
05Ju
l 05
Jan
06Ju
l 06
Jan
07Ju
l 07
Jan
08Ju
l 08
Jan
09Ju
l 09
Jan
10Ju
l 10
Jan
11Ju
l 11
Jan
12Ju
l 12
Jan
13
Perth CBD
12
10
8
6
4
2
0
14
161.60
1.50
1.35
1.30
1.40
1.25
1.20
Total Stock(million m2)
VacancyRate %
Jan
02Ju
l 02
Jan
03Ju
l 03
Jan
04Ju
l 04
Jan
05Ju
l 05
Jan
06Ju
l 06
Jan
07Ju
l 07
Jan
08Ju
l 08
Jan
09Ju
l 09
Jan
10Ju
l 10
Jan
11Ju
l 11
Jan
12Ju
l 12
Jan
13
1.55
1.45
Adelaide CBD
12
10
8
6
4
2
0
141.04
1.00
0.94
0.92
0.96
0.90
0.88
Total Stock(million m2)
VacancyRate %
Jan
02Ju
l 02
Jan
03Ju
l 03
Jan
04Ju
l 04
Jan
05Ju
l 05
Jan
06Ju
l 06
Jan
07Ju
l 07
Jan
08Ju
l 08
Jan
09Ju
l 09
Jan
10Ju
l 10
Jan
11Ju
l 11
Jan
12Ju
l 12
Jan
13
Brisbane CBD
10
8
6
4
2
0
122.30
2.00
1.70
1.60
1.80
1.50
1.40
Total Stock(million m2)
VacancyRate %
Jan
02Ju
l 02
Jan
03Ju
l 03
Jan
04Ju
l 04
Jan
05Ju
l 05
Jan
06Ju
l 06
Jan
07Ju
l 07
Jan
08Ju
l 08
Jan
09Ju
l 09
Jan
10Ju
l 10
Jan
11Ju
l 11
Jan
12Ju
l 12
Jan
132.10
1.90
Sydney CBD
12
10
8
6
4
2
0
Total Stock(million m2)
VacancyRate %
Jan
02Ju
l 02
Jan
03Ju
l 03
Jan
04Ju
l 04
Jan
05Ju
l 05
Jan
06Ju
l 06
Jan
07Ju
l 07
Jan
08Ju
l 08
Jan
09Ju
l 09
Jan
10Ju
l 10
Jan
11Ju
l 11
Jan
12Ju
l 12
Jan
13
Melbourne CBD
12
10
8
6
4
2
0
4.10
3.70
3.10
2.90
3.30
2.70
2.50
Total Stock(million m2)
VacancyRate %
Jan
02Ju
l 02
Jan
03Ju
l 03
Jan
04Ju
l 04
Jan
05Ju
l 05
Jan
06Ju
l 06
Jan
07Ju
l 07
Jan
08Ju
l 08
Jan
09Ju
l 09
Jan
10Ju
l 10
Jan
11Ju
l 11
Jan
12Ju
l 12
Jan
13
3.90
3.50
2.20 1.02
0.98
4.50
4.30
4.80
4.60
4.30
4.20
4.40
4.10
4.00
4.70
4.50
5.00
4.90

Industrial Construction CostsResidential Construction Costs
Industrial Market Overview
Source: Knight Frank Research at July 2012
A$/m2 NZ$/m2
Adel
aide
Bri
sban
e
Cai
rns
Can
berr
a
Dar
win
Mel
bour
ne
Pert
h
Syd
ney
Tow
nsvi
lle
Auck
land
Wel
lingt
on
Chr
istc
hurc
h
Australasian Overall Building Rates*
Multi-unit - Low Rise 1,940 1,880 1,840 2,010 2,500 2,000 1,940 2,010 2,060 2,000 2,030 2,450
(Med. Quality) - High Rise 2,620 2,540 2,480 2,710 3,450 2,700 2,700 2,710 2,780 2,700 2,740 3,280
(High Quality) - Low Rise 2,760 2,680 2,620 2,860 3,650 2,850 2,850 2,860 2,940 2,840 2,900 3,450
(High Quality) - High Rise 3,010 2,910 2,850 3,110 3,970 3,100 3,150 3,120 3,200 3,100 3,160 3,750
Podium Car Parking 825 800 780 850 1,090 850 800 855 875 850 870 1,050
Basement Car Parking 1,200 1,295 1,270 1,385 1,770 1,380 1,200 1,385 1,425 1,375 1,405 1,650
Engineering Services (Mechanical)
Multi-unit - Low Rise 82 80 78 85 109 85 77 85 88 90 90 105
(Med. Quality) - High Rise 225 215 210 230 295 230 210 230 235 240 245 280
(High Quality) - Low Rise 205 195 195 210 270 210 190 210 215 210 215 275
(High Quality) - High Rise 290 280 275 300 385 300 270 300 310 300 305 380
Podium Car Parking N/A N/A N/A N/A N/A N/A N/A N/A N/A N/A N/A N/A
Basement Car Parking 73 71 69 75 97 75 68 75 77 90 90 105
Engineering Services (Electrical)
Multi-unit - Low Rise 107 103 101 110 141 110 100 111 113 115 115 135
(Med. Quality) - High Rise 135 130 130 140 180 140 125 140 145 140 145 170
(High Quality) - Low Rise 195 190 185 200 255 200 180 200 205 200 200 240
(High Quality) - High Rise 245 235 230 250 320 250 225 250 260 250 255 305
Podium Car Parking 49 47 46 50 64 50 45 50 52 55 55 65
Basement Car Parking 49 47 46 50 64 50 45 50 52 55 55 65
Engineering Services (Fire)
Multi-unit - Low Rise 19 19 18 20 25 20 18 20 21 25 25 35
(Med. Quality) - High Rise 87 85 83 90 116 90 82 90 93 93 95 97
(High Quality) - Low Rise 29 28 28 30 39 30 27 30 31 40 40 45
(High Quality) - High Rise 87 85 83 90 116 90 82 90 93 85 90 95
Podium Car Parking 10 9 9 10 13 10 9 10 10 15 15 20
Basement Car Parking 53 52 51 55 70 55 50 55 57 60 60 60
A$/m2 NZ$/m2
Adel
aide
Bri
sban
e
Cai
rns
Can
berr
a
Dar
win
Mel
bour
ne
Pert
h
Syd
ney
Tow
nsvi
lle
Auck
land
Wel
lingt
on
Chr
istc
hurc
h
Australasian Overall Building Rates*
Light Industrial - Low Bay, Tilt Up
630 610 600 650 1,050 650 700 655 670 650 660 790
Heavy Industrial - High Bay, Tilt Up
795 770 755 820 1,260 820 800 825 845 830 840 990
Attached Offices 1,900 2,020 1,980 2,160 2,750 2,150 2,000 2,160 2,220 2,150 2,190 2,600
Engineering Services (Mechanical)
Light Industrial 10 9 9 10 13 10 9 10 10 10 10 20
Attached Offices 245 235 230 250 320 250 225 250 260 250 255 300
Engineering Services (Electrical)
Light Industrial 82 80 78 85 109 85 77 85 88 90 90 105
Attached Offices 146 141 138 150 192 150 136 151 155 155 160 185
Engineering Services (Fire)
Light Industrial 15 14 14 15 19 15 14 15 15 15 15 25
Attached Offices 29 28 28 30 39 30 27 30 31 35 35 45
Prime Net Face Rents ($A/m2) Yields (%)Sydney Prime 95-162 7.75-9.25
Secondary 80-135 8.50-10.00
Business Space / Hi-Tech 170-205 7.75 -8.75
Melbourne Prime 72-130 7.50-8.75
Secondary 59-80 8.5-10.75
Business Space / Hi-Tech 150-250 7.75-8.75
Brisbane Prime 108-115 8.10-9.00
Secondary 87-92 9.0-10.25
Business Space / Hi-Tech 175-225 8.50-9.25
Adelaide Prime 75-130 7.75-9.50
Secondary 50-80 8.75-10.50
Business Space / Hi-Tech 150-210 8.25-9.00
Perth Prime 110-120 8.00-8.75
Secondary 80-85 9.00-10.50
Business Space / Hi-Tech 100-125 8.50-9.50
Source: Davis Langdon Research
Source: Davis Langdon Research
AECOM 5554 The Blue Book 2013

Retail Construction Costs
Prime Net Face Rents ($A/m2) Yields (%)Sydney Regional 1,000-2,000 5.50-6.50
Sub-regional 750-1,000 7.25-8.50
Neighbourhood 500-750 7.25-8.50
Bulky Goods 150-400 8.75-10.75
Melbourne Regional 750-1,500 5.5-6.75
Sub-regional 550-1,250 7.25-8.75
Neighbourhood 450-600 7.25-8.25
Bulky Goods 175-275 9.00-10.50
Brisbane Regional 950-1,200 6.25-7.00
Sub-regional 700-850 7.50-9.50
Neighbourhood 400-600 8.0-9.0
Bulky Goods 180-270 8.50-10.00
Adelaide Regional 1,000-1,700 6.50-7.50
Sub-regional 750-1,250 7.50-8.50
Neighbourhood 200-600 7.50-9.00
Bulky Goods 125-220 8.50-10.00
Perth Regional 1,250-1,750 6.25-7.25
Sub-regional 600-1,000 7.75-8.75
Neighbourhood 400-700 8.25-9.25
Bulky Goods 175-275 8.50-9.50
Retail Market Overview
Source: Knight Frank Research at July 2012
A$/m2 NZ$/m2
Adel
aide
Bri
sban
e
Cai
rns
Can
berr
a
Dar
win
Mel
bour
ne
Pert
h
Syd
ney
Tow
nsvi
lle
Auck
land
Wel
lingt
on
Chr
istc
hurc
h
Australasian Overall Building Rates*
District Centre 1,745 1,690 1,655 1,805 2,300 1,800 1,750 1,810 1,855 1,795 1,835 2,170
Regional Centre 2,330 2,255 2,210 2,405 3,080 2,400 2,300 2,410 2,475 2,395 2,445 2,895
Strip Shopping 1,445 1,400 1,370 1,495 1,900 1,490 1,500 1,495 1,535 1,485 1,515 1,800
Engineering Services (Mechanical)
Local Shopping Centre (No Malls)
250 245 240 260 330 260 235 260 270 265 265 320
Regional Centre 300 290 285 310 400 310 280 310 320 305 310 375
Strip Shopping 185 180 175 190 245 190 170 190 195 195 195 230
Engineering Services (Electrical)
Local Shopping Centre (No Malls)
121 118 115 125 161 125 113 126 129 130 130 155
Regional Centre 126 122 120 130 167 130 118 131 134 135 135 160
Strip Shopping 92 89 87 95 122 95 86 95 98 100 100 120
Engineering Services (Fire)
Local Shopping Centre (No Malls)
78 75 74 80 103 80 73 80 82 80 80 85
Regional Centre 78 75 74 80 103 80 73 80 82 85 85 95
Strip Shopping 29 28 28 30 39 30 27 30 31 35 35 45
Source: Davis Langdon Research
Health and Aged Care Construction CostsA$/m2 NZ$/m2
Adel
aide
Bri
sban
e
Cai
rns
Can
berr
a
Dar
win
Mel
bour
ne
Pert
h
Syd
ney
Tow
nsvi
lle
Auck
land
Wel
lingt
on
Chr
istc
hurc
h
Australasian Overall Building Rates*
District Medical Centre 3,100 3,010 2,940 3,210 4,400 3,200 3,100 3,220 3,300 3,200 3,250 3,850
District Hospital 3,730 3,620 3,540 3,860 5,000 3,850 3,800 3,870 3,970 3,850 3,920 4,650
Nursing Home (incl. a/c) 2,570 2,490 2,440 2,660 3,400 2,650 2,400 2,660 2,730 2,650 2,700 3,200
Engineering Services (Mechanical)
District Medical Centre 390 375 370 400 515 400 365 400 410 380 405 485
District Hospital 600 585 570 620 795 620 560 625 640 620 625 740
Nursing Home 290 280 275 300 385 300 270 300 310 305 290 360
Engineering Services (Electrical)
District Medical Centre 390 375 370 400 515 400 365 400 410 400 405 485
District Hospital 435 425 415 450 580 450 410 450 465 450 460 540
Nursing Home 340 330 320 350 445 350 315 350 360 360 350 420
Engineering Services (Fire)
District Medical Centre 78 75 74 80 103 80 73 80 82 85 85 95
District Hospital 97 94 92 100 128 100 91 100 103 95 100 105
Nursing Home 78 75 74 80 103 80 73 80 82 80 80 90
Source: Davis Langdon Research
Education Construction CostsA$/m2 NZ$/m2
Adel
aide
Bri
sban
e
Cai
rns
Can
berr
a
Dar
win
Mel
bour
ne
Pert
h
Syd
ney
Tow
nsvi
lle
Auck
land
Wel
lingt
on
Chr
istc
hurc
h
Australasian Overall Building Rates*
Education
Primary Schools 1,435 1,390 1,360 1,485 2,100 1,480 1,500 1,485 1,525 1,480 1,520 1,900
Secondary Schools 1,700 1,645 1,610 1,755 2,625 1,750 2,000 1,760 1,805 1,800 1,825 2,200
Engineering Services (Mechanical)
Primary & Secondary Schools
121 118 115 125 161 125 113 126 129 120 140 150
Primary & Secondary Schools (incl. a/c)
245 235 230 250 370 250 225 250 260 255 255 295
Engineering Services (Electrical)
Primary & Secondary Schools
260 255 250 270 345 270 245 270 280 270 275 325
Engineering Services (Fire)
Primary & Secondary Schools
29 28 28 30 39 30 27 30 31 45 45 55
Source: Davis Langdon Research
AECOM 5756 The Blue Book 2013

Tourism Construction Costs A$/m2 NZ$/m2
Adel
aide
Bri
sban
e
Cai
rns
Can
berr
a
Dar
win
Mel
bour
ne
Pert
h
Syd
ney
Tow
nsvi
lle
Auck
land
Wel
lingt
on
Chr
istc
hurc
h
Australasian Overall Building Rates*
Resort 3,780 3,670 3,590 3,910 4,990 3,900 3,540 3,920 4,020 3,890 3,980 4,700
3 Star Budget 3,010 2,910 2,850 3,110 3,970 3,100 3,200 3,120 3,200 3,100 3,160 3,750
5 Star/Luxury 4,170 4,040 3,960 4,310 5,500 4,300 4,500 4,320 4,430 4,290 4,380 5,190
Suburban Motel 2,330 2,260 2,210 2,410 3,070 2,400 2,400 2,410 2,470 2,400 2,450 2,900
Engineering Services (Mechanical)
Resort 330 320 315 340 435 340 310 340 350 340 385 510
3 Star Budget 280 275 265 290 375 290 265 290 300 290 295 350
5 Star/Luxury 415 405 395 430 550 430 390 430 445 430 440 520
Suburban Motel 215 205 200 220 285 220 200 220 225 220 195 265
Engineering Services (Electrical)
Resort 215 205 200 220 285 220 200 220 225 220 225 270
3 Star Budget 194 188 184 200 256 200 182 200 206 206 206 246
5 Star/Luxury 290 280 275 300 385 300 270 300 310 300 305 365
Suburban Motel 145 140 140 150 195 150 135 150 155 150 155 180
Engineering Services (Fire)
Resort 58 56 55 60 77 60 54 60 62 60 60 70
3 Star Budget 78 75 74 80 103 80 73 80 82 75 75 80
5 Star/Luxury 87 85 83 90 116 90 82 90 93 85 90 95
Suburban Motel 29 28 28 30 39 30 27 30 31 30 30 35
Construction Costs Tables (pp 53–58)
*Inclusive of builder’s preliminaries and profit but exclusive of site works, external services, land and interest costs
Mechanical – Rates are for typical base building (excluding fitout) mechanical services commensurate with the standard of building indicated, including, as appropriate, statutory essential mechanical services.
Electrical – Rates are for typical base building (excluding fitout) electrical services commensurate with the standard of building indicated, including light and power; statutory essential services; and, where appropriate, communications, security and MATV backbone systems.
Fire – Rates are for statutory base building (excluding fitout) fire services, including, as appropriate, hydrants, hose reels, alarms and/or sprinklers.
Source: Davis Langdon Research
Australian Labour Material Ratios
Labour Material Plant
Air Conditioning Specialist 35% 65% 0%Bricklayer & Blocklayer 50% 50% 0%Carpenter 45% 55% 0%
Carpet Layer 10% 90% 0%Demolish 85% 5% 10%Drainer 60% 40% 0%Electrical 40% 60% 0%Excavator 38% 10% 52%Fire Service 45% 55% 0%Formworker 70% 30% 0%Glazier 20% 80% 0%In Situ Concreter 25% 75% 0%Joiner 15% 85% 0%Lifts 25% 75% 0%Mason 10% 90% 0%Metalworker 25% 75% 0%
Painter 75% 25% 0%
Paver 75% 25% 0%
Piler 20% 55% 25%
Plasterer 40% 60% 0%
Precast Concreter 20% 80% 0%
Preliminaries 40% 10% 50%
Reinforcement Fixer 20% 80% 0%
Roadworker & External Paver 15% 85% 0%
Structural Steelwork 10% 90% 0%
Suspended Ceiling Fixer 40% 60% 0%
Tiler 55% 45% 0%
Source: Davis Langdon Research
AECOM 5958 The Blue Book 2013

Mining – Shifting Cost Pressures
Australia’s mining industry has recently been affected by fluctuations in key commodity export prices, but it is also responding to broader shifts in the market.
Commodity Prices and Other Market Pressures
Downward pressure, for example from iron ore and thermal coal prices, has affected several greenfield projects, constrained company earnings and caused leadership changes within the major mining houses. Australia’s industry has also been affected by:
− global economic uncertainty related to the European Sovereign Debt Crisis and economic growth in China
− high inventories in global steel and raw materials stocks with low demand
− regulatory and taxation uncertainty following the early announcement of a federal election in September 2013
− increased pressure over environmental impacts, reinstating land
− cost pressures associated with the high Australian dollar coupled with a reduction in productivity.
A number of key projects slated for execution in 2013 have been shelved. As demand has dropped for new projects, expenditure on services to the mining industry has contracted and demand for a different service model has emerged. Rather than requiring the full gamut of design services, companies are seeking tailored advice to extract more value from their business. Businesses also need
help managing local community and environmental concerns — a process that can add several layers of cost and years to a project schedule.
In the meantime, gold and copper remain strong as safe haven commodities. It is anticipated that towards the end of 2013, provided that the European policy makers contain the crisis and Chinese growth accelerates, demand will bring an improvement in commodity prices.
Long-term Industry Shifts
As well as responding to the short-term outlook for commodity prices, the mining industry must also adapt its business model beyond the boom-time. Miners are now in a different earnings climate where continuous greenfield investments no longer stack up — it does not make sense anymore to churn through the high-value extracts then move on to the next location.
There is a new imperative to find new ways to increase returns from existing facilities by reducing operating costs. These brownfield upgrades don’t generate as high a level of instant cashflow, but they are lower risk and require less labour-power.
Miners can also benefit from smarter, more experienced thinking about labour and subcontractor agreements, quality assurance on project and operational outcomes. Innovations such as process automation are already being adopted and the use of new and existing systems and industry data will also build greater profitability.
5 Year Price Trends for Iron Ore, Thermal Coal and Gold
Source: InfoMine.com
220
200
180
160
140
120
100
80
US$/tonne
25 J
un20
10
1 D
ec20
09
21 J
an20
11
19 A
ug20
11
1 Fe
b20
13
16 M
ar20
12
Iron Ore Fines Price
Thermal Coal CAPP Price
160
140
180
120
100
80
60
40
US$/tonne
27 F
eb20
09
4Jan
2008
23 A
pr20
10
20 J
un20
11
10 A
ug20
12
Gold Price
2000
1800
1600
1400
1200
1000
800
600
US$/oz
27 F
eb20
09
4Jan
2008
23 A
pr20
10
20 J
un20
11
10 A
ug20
12
AECOM 6160 The Blue Book 2013

5GLOBAL INDICATORS
Global Growth Index 64
Australia and New Zealand 66
China 67
India 68
United States 69
Europe 70
Middle East 71
Africa 72
South America 73
AECOM 63

Global Growth Index
Note: Market values are estimates for 2011–12 in US$ billion. Bubble size represents the Growth Index Score – indicating the proportion of respondents anticipating construction industry growth in the medium term.
The outlook for the construction industry across the world shows greater recovery in some parts, while others will be slower to bounce back. Our global research examined these trends by talking to local industry decision-makers about where investment will be concentrated. The resulting Global Growth Index encapsulates this sentiment and highlights the hotspots for growth in the medium term.
Region Market Value
Growth Index Score
Canada 134 53
United States 760 35
Sub-Saharan Africa 30 66
Ireland 11 -30
United Kingdom 52 33
Central Europe 183 26
Nordic 41 33
Eastern Europe 91 64
Turkey 81 74
Russia 117 74
Saudi Arabia 33 72
Bahrain 2 13
Qatar 7 76
United Arab Emirates 36 50
India 462 86
Thailand 14 63
Singapore 18 62
Vietnam 30 17
China 1,384 63
Hong Kong 5 54
Philippines 21 74
Malaysia 7 58
Indonesia 180 94
Australia 119 4
New Zealand 10 50
Canada
United States
Sub-Saharan Africa
Ireland
United Kingdom
Nordic
Central Europe
Eastern Europe
Turkey
Russia
New Zealand
Australia
Bahrain
United Arab Emirates
Saudi Arabia
Qatar
China
Hong Kong
Vietnam
Philippines
Malaysia
Indonesia
Singapore
India
Thailand
Source: AECOM Global Sentiment Survey
AECOM 6564 The Blue Book 2013

Australia and New Zealand
While Australia’s economy has fared better than most other advanced economies in recent years, some contraction was witnessed in 2012, particularly in the construction industry. The outlook remains constrained in 2013, but projections for GDP growth to 2015, at an average of 3.2 percent per annum according to the IMF, are still more promising than the average for advanced economies globally.
However, this will be dependent upon the extent of investment in the resources sector and other sectors stepping in to contribute to growth. Uncertainty prior to the election in September 2013 may lead to investor hesitation, while others await greater surety in the labour market and a return of consumer confidence.
New Zealand has seen growth below the annual average for advanced economies in recent years, but is forecast to achieve
higher GDP growth to 2015. Much of this buoyancy will stem from the developments in the Canterbury rebuild and the growing significance of foreign investment to the country’s recovery. The primary export market is also of ongoing importance — the dairy industry is the country’s biggest earner, valued at NZ$12 billion in 2011 — but earnings will be constrained if the higher exchange rate continues.
Of growing importance to both nations is trade with South East Asia. Robust growth is expected across developing Asia from 2013 to 2015, such as in Indonesia (around 6.5 percent) and the Philippines (around 5 percent). Our construction industry research points to clear opportunities in the region — Indonesia and the Philippines rated very highly in terms of growth expectations, alongside the powerhouse economies of India and China in the broader Asia region.
China
China’s provinces are changing rapidly; in the five years to 2011, Jiangsu has seen the biggest leap in its urban population. In the same period, construction more than doubled to meet the needs of this changing economy.
China has also seen a shift away from an export-driven economy to more of a focus on knowledge-based industries. These growing services will change the shape of China’s cities. Their prominence is reflected in the above average annual wage growth in sectors such as finance, retail and education.
Our industry research pointed to considerable growth in road and rail in the south, while energy was likely to see more investment in the west. Water security will be an important focus in Hong Kong as it relies on mainland China for up to 80 percent of its supply.
The openness of China’s market was slowly increasing according to 56 percent of locals in our industry research, however, 18 percent believe foreign entrants still struggle to succeed.
Average Annual GDP Growth
China’s Growing Urban Population and Construction, 2006–2011
Source: IMF
Source: National Bureau of Statistics of China
Note: 1 billion yuan equals approximately US$160 million. Change in ppt refers to the percentage point change in the urban population.
Average Annual Wage Growth in China, 2003–2011
2
3
7
8%
6
2010−12 2013−15
5
4
1
0
Dev
elop
ing
Asi
a
Sub
-Sah
aran
Afr
ica
Lati
n A
mer
ica
and
the
Car
ibbe
an
Eur
opea
nU
nion
Adv
ance
dE
cono
mie
s
Aus
tral
ia
New
Zea
land
The ASEAN region, an important trade partner to Australia and New Zealand, is expected to generate at least 5.7% annual growth to 2015 Of the advanced economies, Australia
and New Zealand are expected to average closer to 3% growth, compared to the average for other nations which is closer to 2%
400
600
1,400
1,600
CNYbillion
1,2002006Construction Value
2011Construction Value
1,000
800
200
0
Bei
jing
Liao
ning
Sha
ngha
i
Jian
gsu
Zhej
iang
Sha
ndon
g
Hen
an
+1.9ppt
+5.1ppt
+0.6ppt
+10.0ppt
+5.8ppt+4.9ppt
+8.1ppt +8.0ppt
+3.5ppt
+7.5ppt
23
78
654
10
109
Hub
ei
Gua
ngdo
ng
Sic
huan
Growth in UrbanPopulation2006−2011 (RHS)
Changein ppt
CNY
10,000
20,000
40,000
50,000
60,000
70,000
30,000
0
The Financial, Wholesale and Retail, Mining, Scientific and Education sectors all saw above average wage growth between 2003 and 201180,000
90,000
2003 Annual Wage2011 Annual Wage
Agr
icul
t.
Min
ing
Man
ufac
t’g
Uti
litie
s
Con
stru
c.
Tran
spor
t
Info
rmat
ion
Who
lesa
lean
d R
etai
l
Hot
els
Fina
ncia
l
Rea
l Est
ate
Leas
ing
Sci
enti
fic
Env
t.
Ser
vice
s
Edu
cati
on
Hea
lth
Cul
ture
Pub
lic
Source: National Bureau of Statistics of ChinaNote: Note: 50,000 CNY is equivalent to approximately US$8,037.
AECOM 6766 The Blue Book 2013

India
India has set a massive target for doubling investment in infrastructure to INR 40.9 trillion (US$906 billion) during the Twelfth Plan period of 2012–2017. By 2030, it is expected to have 13 cities with populations of more than 4 million people and six megacities with populations greater than 10 million (McKinsey). This transformation will require greenfield infrastructure, as well as considerable investments in residential, healthcare and energy supplies, particularly in the North East where more work will be required to raise infrastructure standards.
India’s growing middle class expects more quality services; driving this is a younger aspirational population. The median age in India is 26 years, lower than the world average of 28 years and China’s 35 years. This means that its old-age support ratio — the United Nations measure of demographic ageing and of the degree of dependency of older persons on potential workers — is higher than many other parts of the world where it is expected to continue to decline.
Almost a third of India’s infrastructure spending to 2017 is expected to be in the energy sector. Indian authorities estimate that commercial energy supplies will have to grow at an annual rate of 7 percent to service GDP growth of 9 percent. As a result, India is diversifying its energy generation, such as maximising its hydropower opportunities in the North East; generation was up 14 percent in the year 2011–12.
Our industry research shows that the attractiveness of the Indian market is even more promising than China; 63 percent of industry participants in India see great potential for foreign investors. Regulations have recently been introduced to allow foreign investment in retail and aviation as part of a plan to boost investor sentiment. Some roadblocks still exist, however, such as finding local capabilities to deliver projects, achieving a cost effective mix of offshore and onsite resources.
United States
The US economy is slowly gaining greater momentum. Some spending has begun to filter its way through from the private sector into construction projects and there have been gains from rock-bottom levels in the residential sector. Private investment has increased in the power sector, including oil and gas facilities; spending in this sector was 31 percent higher in 2012 than the previous year and 57 percent above the ten-year average, according to the US Census Bureau. Our industry research also indicates that more sustainable energy use is a top priority for many in the US.
In addition to this energy sector activity, there are promising trends in other sectors such as manufacturing. Construction in this area
increased during 2012 as older plants were replaced and there was greater industry consolidation. Industries such as aerospace, electrical equipment and agricultural machinery updated their plants to keep pace with new technologies. These investments were also driven by US companies deciding to keep operations onshore due to currency fluctuations and lower transportation and energy costs.
Other drivers of growth include very low nominal interest rates, how long the third round of quantitative easing is continued, and public acceptance of new project financing methods. Industry challenges include shrinking margins and the threat of rising labour costs.
Old-age Population Support Ratios, 2012–2050
US Private Construction Value
Source: US Census Bureau
Source: United Nations Note: Ratios are the number of persons 15-64, per person 65+.
4
6
14
16
Supportratio
122012 Ratio
2050 Ratio10
8
2
0
Afr
ica
Asi
a
Eur
ope
Oce
ania
Lati
n A
mer
ica
and
the
Car
ribe
an
Indi
a
Chi
na
Ratios of working-age populations to support ageing populations are decreasing across the world, but India is expected to remain higher than most regions
US Public Construction Value
US Construction Labour Market
Source: US Bureau of Labor Statistics
2004
2005
2006
2007
2008
2010
800
850
1,050
1,100
'000
1,000
950
900
2011
2012
2009
2004
2005
2006
2007
2008
2010
800
1,000
1,800
2,000
'000
1,600
1,400
1,200
2011
2012
2009
2004
2005
2006
2007
2008
2010
1,000
1,500
3,500
4,000
'000
3,000
2,500
2,000
2011
2012
4,500
5,000
2009
2004
2005
2006
2007
2008
2010
0
100
500
600
US$b
400
300
200
2011
2012
700
800
900
1,000
Private construction spendinghas recovered by 33%, but remains12% below the 10-year average
2009
2004
2005
2006
2007
2008
2010
0
50
250
300
US$b
200
150
100
2011
2012
350
400
450
500
Public construction spendingis down 17% on its peak in 2009
2009
Engineering Building Specialty Trades
AECOM 6968 The Blue Book 2013

Europe
Europe’s recovery is still being limited by public sector austerity and private deleveraging, weak exports and a relatively strong Euro, as well as concerns about country-specific vulnerabilities. Thus, while financial conditions appear to have improved and risks have diminished, the fundamental problems of the Eurozone remain.
Construction in the Eurozone and the wider EU is expected to contract this year, but modest growth is forecast for 2014. Our industry research shows the emergence of an east-west and north-south divide across the broader European region, with the best prospects in Russia, Norway, Romania and Turkey. The need to upgrade vital
infrastructure, such as power generation or transport links is expected to drive renewed growth.
While local private sector activity is constrained by low confidence and a lack of project finance, our research indicates that foreign investors still view cities such as London as a safe haven for long-term returns. Foreign entrants find the East increasingly attractive, according to 51 percent of our industry participants, while only 32 percent see the West gaining ground. The World Bank’s rankings show that the obstacles to doing business in Eastern Europe are also fewer compared to other destinations for foreign investment, such as South Asia or Africa.
Middle East
Construction work in the Middle East will be driven by demand from shifting population demographics, several cash-rich governments pursuing infrastructure work and the region’s global sporting events such as the 2022 FIFA World Cup in Qatar. Our industry research shows that social infrastructure, seen as important to maintaining social cohesion, will be one of the biggest opportunities in the buildings market.
Government entities are also focusing on energy and water security, as well as transport projects to remain competitive. Scarce natural water resources and
economic activity have increased the need for additional water capacity. MEED estimates that between 2012 and 2014 there could be US$29.5 billion of water industry projects awarded across Saudi Arabia, United Arab Emirates (UAE), Qatar, Oman, Kuwait and Bahrain.
The financial strength of Saudi Arabia, Qatar and UAE will encourage publicly financed projects. Our research shows that public-private partnerships are more likely to be used for financing in the Middle East, than in Europe and despite a recent drop in foreign investment, the region remains attractive to offshore entrants.
European Building and Infrastructure — Expected Growth
Source: AECOM Global Sentiment Survey
Note: Central covers Germany, France, Austria, Switzerland, Netherlands and Belgium; Nordic covers Norway, Sweden, Finland, and Denmark; and East covers Poland, Romania, Czech Rep, Slovakia and Hungary.
Middle East — Buildings Market Expected Growth
%
-20
0
40
60
80
100
20
-40
UK
Ireland
Central
Nordic
East
RussiaTurkey
NegativeGrowthMarket
HighGrowthMarket
There is a considerable east-west divide in future workload expectations across Europe.
European Construction Market Value 2012
50
250
300
EURbillion
200
150
100
0
Ger
man
y
Fran
ce
Ital
y
UK
Rus
sia
Net
herl
ands
Sw
itze
rlan
d
Pol
and
Bel
gium
Aust
ria
Sw
eden
Finl
and
Turk
ey
Den
mar
k
Por
tuga
l
Cze
ch R
epub
lic
Irel
and
Hun
gary
Spa
in
Slo
vak
Rep
ublic
Nor
way
European Market Appeal to Foreign Investors% Western Europe
20
40
80
100
60
0
-20
-40
IncreasingSteadyDecreasing
Eastern Europe
Openness Atractiveness Openness Atractiveness
%
30
40
60
70
80
90
50
20
LowGrowthMarket
HighGrowthMarket
10
0
Office
Retail
Industrial Education
Healthcare
Tourism & Leisure
Mixed-use
Public Buildings
Residential
Existing Buildings
Source: AECOM Global Sentiment Survey
Middle East Construction Projects Planned or Underway
US$b
Jan
09
Jul 0
9
Jan
10
Jul 1
0
Jan
11
Jul 1
1
Jan
12
Jul 1
2
Jan
13
The value of construction in Saudi Arabia has risen 29% since January 2009, while UAE projects have dropped 51% in value from the 2009 peak.
200
400
800
1,000
1,200
1,400
600
Bahrain Qatar Iraq Kuwait Saudi Arabia
Oman
0
UnitedArab Emirates Source: MEEDSource: Euroconstruct, National Accounts, AECOM Source: AECOM
AECOM 7170 The Blue Book 2013

Africa
Foreign investment, one of the key economic drivers in Africa, has eased somewhat in recent years. Much of this investment traditionally comes from the European Union and North America, so this is unsurprising given the downturn in these regions. In contrast, funding from China and East Asia has risen. Private investment assistance for infrastructure development has also risen; in Nigeria more than US$28 billion has been spent over the last twenty years, as tracked by the World Bank.
While investment is flowing into the region, several roadblocks still exist such as corruption, insufficient infrastructure,
inefficient bureaucracies, and an inadequate workforce. There is great potential for example in the resources sector with significant oil and gas reserves in East Africa but regulatory and infrastructure gaps are currently hindering production.
Our industry research shows that other challenges are holding local developers back in the buildings market, such as difficulty funding projects or government capability to deliver projects. However as momentum builds, further residential and commercial development is having a knock-on effect in other sectors such as retail.
South America
Economic growth in South America has been much stronger in recent years compared to the world’s advanced economies. Foreign investment has increased and the resources and tourism sectors have grown.
Latin America and South Asia have seen consistent growth in private investment assistance in developing infrastructure. Brazil, Argentina and Mexico are among the top five destinations for private infrastructure
investment together with China and India, according to the World Bank.
Renewable projects were one of the main beneficiaries of this investment; the World Bank reports that Brazil garnered the most private investment in renewable generation during 2011. The 2014 FIFA World Cup in Brazil is also driving new development in rail, stadia and airports.
Foreign Direct Investment in Regions, Change 2009–2011
Ease of Doing Business Ranking by Region
Private Participation in Infrastructure
Source: World Bank, PPIAF
Source: IMF
%
100
200
400
500
300
0
Fallinginvestment
Risinginvestment
-100
-200Europe
Change2009−2011
Africa NorthAmerica
SouthAmerica
MiddleEast
EastAsia
Centraland
South Asia
Oceania
Source: World Bank
Easier to doBusiness
Harder to doBusiness
40
60
140Ranking
120
100
80
20
0
OE
CD
Hig
h In
com
e
Eas
t E
uro
/C
entr
al A
sia
Eas
t A
sia
Sou
th A
mer
ica
Mid
dle
Eas
t /
Nor
th A
mer
ica
Sou
th A
sia
Sub
-Sah
aran
Afr
ica
Sub-Saharan Africa is considered the hardest region to do business in, whereas South America and South Asia are considered easier places to do business.
2000
2001
2002
2003
2004
2005
0
10
50
60
70
80US$b
40
TransportTelecomEnergy
30
20
2006
2007
2008
2009
2010
2011
Water andSewerage
258% growth
2000
2001
2002
2003
2004
2005
0
10
50
60
70
80US$b
40
TransportTelecomEnergy
30
20
2006
2007
2008
2009
2010
2011
Investment in South Asia escalatedfrom US$3 billion in 2000 to US$75 billionin 2010, followed by a drop of 45% in 2011
2000
2001
2002
2003
2004
2005
0
5
25
30
35
40US$b
20
15
10
2006
2007
2008
2009
2010
2011
2000
2001
2002
2003
2004
2005
0
5
25
30
35
40US$b
20
15
10
2006
2007
2008
2009
2010
2011
2000
2001
2002
2003
2004
2005
0
5
25
30
35
40US$b
20
15
10
2006
2007
2008
2009
2010
2011
In the past decade, investment in Sub-Saharahas quadrupled, while Latin America andSouth Asia have also seen considerable growth
TransportTelecomEnergy Water and Sewerage
2000
2001
2002
2003
2004
2005
0
5
25
30
35
40US$b
20
15
10
2006
2007
2008
2009
2010
2011
Latin America and the Carribean South Asia
Europe and Central Asia East Asia
Sub-Sahara Africa Middle East and North Africa
US$b Europe Africa North America
South America
Middle East
Central/South Asia East Asia Oceania
Total Investment 2011 13,748 218 3,543 893 98 1,414 3,311 590
AECOM 7372 The Blue Book 2013

6Building information modelling
State of Play 76
BIM Management – Roles and Responsibilities 78
BIM Management 79
The Future of BIM 80
AECOM 75

State of Play
The rate of Building Information Modelling (BIM) adoption across Australia and New Zealand continued to escalate in 2012. However, recent US reports indicate that the number of firms offering BIM services has increased by 400 percent since 2007, with contractors now leading architects. Globally, the BIM market is expected to grow from $1.8 billion in 2012 to $6.5 billion by 2020.
Can the Australian and New Zealand markets overtake these adoption rates? There are indeed many promising signs of greater BIM adoption moving into 2013.
The rise in the number of requests from clients for BIM projects and the increase in industry events with BIM topics point to greater industry interest in Australia and New Zealand. As more projects use BIM through design, construction and operation, the benefits will be better understood by
a wider audience. A sharp increase in the number of BIM projects is anticipated over the next 18 months, constituting a significant market transformation well beyond achievements to date.
It is important to also define what level of adoption is occurring. Our AECOM Global Sentiment Survey research forms a snapshot of where the industry differs in terms of the extent to which BIM is being embraced by local industries. Some markets displayed greater disparity. For example, in the Middle East, Australia and New Zealand, average levels of take-up are closer to BIM Level 1 (where there is no proprietary exchange of formats); however, the industry leaders in these regions are striding ahead to BIM Level 3. In contrast, industry leaders in Europe were not as advanced.
Australia
The Australian Commonwealth Government and buildingSMART have released a strategic report outlining the support needed to drive the construction industry into a new efficient, low-carbon era of BIM. The National Building Information Modelling Initiative (NBI) Report was commissioned by the Built Environment Industry Innovation Council, with the findings presented in Sydney in August 2012. The next stage of the National Initiative is yet to receive federal funding but industry proponents remain positive that this will be forthcoming.
Even though the Commonwealth is yet to mandate BIM, several state governments have begun to implement BIM on their projects. South Australia’s Department of Planning, Transport and Infrastructure (DPTI) is developing BIM guidelines for government agencies, consultants and contractors to ensure that design and documentation occurs based on collaborative working, open standards and in alignment with national standards. DPTI plans to initially implement this strategy on major projects (>$10m) before rolling it out across all projects. From 1 January 2013, NSW’s Health Infrastructure mandated BIM deliverables on all projects over $30 million.
Across the country, there are at least eight state-funded hospital developments underway, either in design or construction, with BIM providing efficiency gains. Another initiative, BIM in Practice, aimed at increasing industry knowledge of BIM was led by the Australian Institute of Architects and Consult Australia. This joint venture pooled experts from across the supply chain to produce a series of brief documents providing everyday advice for those implementing BIM.
New Zealand
New Zealand has also made progress on BIM implementation in 2012. It held the inaugural BIM Summit in New Zealand in 2012, attracting participants from across the industry. The chair of the Productivity Partnership’s Construction Systems Work Stream – a partnership of industry and government, established in 2010 through the Department of Building and Housing – opened the conference with an announcement supporting the roll-out of BIM.
BIM is one element of their plan to encourage widespread use of smart technology to enable knowledge sharing and faster and more efficient construction processes. Productivity Partnership’s National Technical Standards Committee is keen to encourage the faster uptake of smart ways of working in the building and construction sector.
The GeoBuild initiative is one example of this and will bring together three systems:
− Building Information Modelling
− The proposed National Online Consenting System
− A location-based information modelling system being developed in partnership with Land Information New Zealand – a common approach to location information interoperability, allowing the reuse of information in 2D and 3D. It provides users with a graphic representation of underground services, such as sewer pipes and telecom cabling.
The Committee is selecting open industry standards for data for building and location data for all of these systems so that they are interoperable and can be rich sources for data mining.
Bim adoption by region
Source: AECOM Global Sentiment Survey
Level 0
Australia
Asia Relative Strength of Industry Leaders
Typical Industry Level
Middle East
New Zealand
Level 1 Level 2 Level 3
Europe
North America
Level 0 – Unmanaged CAD with pdf files as the main form of data exchange.Level 1 – Managed CAD in 2 or 3D with a collaborative data environment.Level 2 – Managed 3D environment with proprietary exchange formats. May include 4D program and 5D cost data.Level 3 – Fully-open process with a single project model and data exchange using Industry Foundation Classes standards.
AECOM 7776 The Blue Book 2013

BIM Management – Roles and Responsibilities
Bim roles – advisor and model manager The BIM Management Project Timeline explains the difference between a Model Manager and a BIM Advisor or Manager. It is crucial to the success of BIM projects that clients, consultants and contractors all appreciate the differences between how these roles operate together. Further steps are critical to the successful delivery of a BIM project:
Eliminate Confusion
Educating the market is still a significant BIM hurdle. Industry needs to work towards a more coherent definition of BIM so clients are not confused. We need to break down what BIM means to our clients during design, construction, fabrication, maintenance and operations.
Standardisation and best practice guidelines will also help. NATSPEC’s National BIM Guide and a BIM Management plan template provide useful terminology and common standards. The NATSPEC template is a great base document for the management of the BIM process and will help the industry adopt a more uniform approach.
Focus Teams on Client Returns
Overlooking practical details is one of the quickest ways to undo any potential project gains. A model content plan is an excellent way to introduce a project team to the requirements of BIM. This should be established at the start of every
project through a briefing session with the client and project team. This ensures they understand what can and cannot be done in the current market, what the likely costs are going to be and what returns should look like. A further workshop should then be held with the design team on appointment to ensure they understand these client demands.
Get the Procurement Details Right
It is very hard to get value for money with BIM using traditional contractual frameworks and procurement. In the BIM world, a design is produced and all discipline models are merged and, in theory, clashes are resolved ahead of tendering to a contractor. However, when the model is handed over, it includes a string of caveats that are meant to protect authoring parties from litigation. Also, traditional 2D drawings and schedules are still the contractual basis for the tender price. In reality this limits the extent to which the contractor can benefit from the model/s received.
The appointment of project teams must shift from an adversarial environment to one that is incentivised and collaborative in nature. After years of pursuit of the lowest bid, a shared risk/reward process allows room for improved initiatives and innovation by project teams. This cannot be organised in arrears — it must be agreed during the appointment of each team member.
BIM Management
Bim advisor model manager
application of Bim
independent from the design team. Separate engagement.
discipline-led. design team member or subcontractor team member. engaged for design authoring.
Pre
-Con
stru
ctio
n Programming
Cost estimate
energy analysis & Simulation
Stakeholder engagement
Coordination
Visualisation
inception Brief client on suggested Bim scope
report implications of time, roi, cost and metrics.
engage Consultants
Write project brief, consultant scope, Bim deliverables. draft Bim management Plan (BmP)for design period.
Schematic design
Coordination meetings bi-weekly.
Qa model elements.
author discipline specific models. issue to Bim advisor for review and federation.
design development
Brief shortlisted tendering managing Contractors.
attend coordination meetings. resolve any conflicts.
Contract documentation
Prepare BmP for construction.
issue models for costing.
Con
stru
ctio
n Programming
Cost estimate
Clash detection logistics & Scheduling
digital fabrication
Visualisation
ope
rati
on
asset management
Building automation Systems
redevelopment
operations Handover of virtual building deliverables, integrated with facilities management software.
training of fm/o&m staff and production of associated process documentation (security, work order execution, record keeping).
Periodic review and optimization, using captured performance metrics.
LOD - Level of development in the model
lod100 – general/generic dimensions, locations and materials lod200 – Performance criteria to be specified and designed lod300 – manufacturer and/or model specification lod400 – Shop drawings/models, including processes lod500 – as-built data, with performance-related data, manufacturer and model specifications
Source: AECOM
lod100
lod200
lod300
lod400
lod500
AECOM 7978 The Blue Book 2013

The Future of BIM
It is clear that BIM is set to become increasingly relevant in the construction industry, not only for ‘early adopters’ on larger building projects, but for most businesses involved in construction. Companies will have to develop at least a minor degree of BIM capability in order to be considered for public work. The next few years of industry development will be critical as larger construction businesses in particular will be increasingly expected to have developed a significant BIM capability.
The increased take-up will help promote benefits of BIM more widely. Our AECOM Global Sentiment Survey
research demonstrates that many in the industry already understand the significant advantages BIM enables at the design and construction phases of an asset’s development. But there is little understanding of how it can provide value during the asset’s operational life.
To maximise these operational stage benefits, local capability is required early on in the BIM process to ensure sufficient information is incorporated into the model. Otherwise it will not be optimised for long-term use and integration into building automation systems.
What does the future of Bim look like?
industry Perceptions of Bim Benefits by asset Stage
Source: AECOM Global Sentiment Survey
Source: AECOM
Unrealised benefits in the use of BIM to enhance asset management are considerable.
-1.0
-0.5
0
0.5
1.0Significantbenefits
Moderatebenefits
Nobenefit
Design Costing Construction Operations
− industry understands and has defined Bim for design and construction leading to an availability of data to enable industry benchmarks for the cost of construction
− Varying combinations of cloud-based hosting of projects are widespread, early adoption issues (security and data ownership) are resolved
− Bim adoption rate hits 60 percent
− australian government mandates Bim
− australia and new Zealand have established iSo Bim Standard(s)
− Bim protocols well-defined and understood
− mobile computing is prevalent on construction sites
− Project insurance policies cater for Bim and iPd
− Prefabrication and modularisation are standard practice for many building
− augmented reality (ar) makes significant headway in the property industry
− Virtual australia and new Zealand (VanZi) provides a portal to the virtual world
− ground Penetrating radar (gPr) technology used for surveying subterranean assets
− tier-1 design and construction companies offer more whole-of-life services to clients; other organisations resort to collaborative contracting models to compete and offer better service
− Bim integration with building management and computer-aided facility management systems is commonplace
− new material technology continues to impact on what’s possible and associated methodologies
− Collaborative, digital prototyping becomes the new standard for all infrastructure projects, not just buildings
− Bim adoption rate hits 80 percent
− model-based contract deliverables are commonly sought by clients (in addition to drawings)
− advanced data validation tools enable fast and transparent Qa checks
− digital id and sensor technology used for material and equipment transportation, physical properties assessment and construction progress tracking
− robots augment humans in construction (for survey, manufacture, transportation and fabrication), improving productivity and safety
− off-site manufacturing prevalent as companies realise that design for manufacture and assembly is a ‘no brainer’
− design information provided direct through supply chain to manufacturing
− Bim adoption rate hits 90 percent
− emergency services organisations have access to digital building information for better disaster responses
− robotics replace some human workers in construction
2016
2018
2023
AECOM 8180 The Blue Book 2013

7SUSTAINABILITY
Sustainability 84
Rating Tools 85
Sustainability – A Global Understanding 86
Carbon Price 88
Carbon Price – Refridgerants 89
Carbon Price – Opportunities 90
Towards Zero Carbon 91
Existing Buildings – Emerging Trends 92
AECOM 83

Sustainability
Perceptions of sustainability vary by culture and geography. Our industry research comparing local attitudes to sustainability pointed to a huge opportunity in our Australian and New Zealand markets. While many organisations now see sustainability as simply part of a business as usual approach, our research shows that we still have much to achieve.
Industry participants from Australia and New Zealand prioritise economic elements, such as asset performance and whole-of-life costs, but still see plenty of work to be done in terms of environmental and social priorities. In contrast, social considerations are much more prominent in some developing nations and several parts of Asia. An understanding of these differences is becoming more important as many businesses seek to collaborate, invest, and do business with other parts of the world.
This broadening of the scope of sustainability is evident in our local buildings and infrastructure industries. Sustainability rating tools continue to
extend their focus and the carbon price has added another driver to the widespread adoption of resource-efficient approaches. The importance of whole-of-life asset impacts is putting a greater focus on quantifying carbon impacts to identify opportunities for abatement from embodied, construction and operational energy.
This drive to minimise impact and increase the intelligent use of our assets is also coming to the fore in our approach to existing buildings and infrastructure. The revolution of existing buildings has evolved to consider holistic solutions that extend beyond the walls of individual buildings.
In the last decade, efficiency from energy and water was the priority, whereas now, we are looking towards adapting cities to support alternative transport to these revitalised precincts. The growth of building adaptation, improved collaboration spaces, and innovative financing solutions are driving the next wave of building refurbishments.
Rating Tools
GBCA — The Green Building Council of Australia’s Green Star Communities tool approved its first pilot rating tool project in 2013, advancing the design and delivery of more sustainable, productive, resilient and liveable communities. The GBCA has also engaged in beta-testing for the Green Star – Performance rating tool on buildings operational now to ensure the tool is developed to properly evaluate the environmental performance of assets.
NABERS — In 2012, the National Australian Built Environment Rating Scheme released a NABERS Energy Management Guide for Tenants, designed to help office tenants take control of their energy costs and environmental impacts. This is one of several recent initiatives such as the City of Melbourne and Low Carbon Australia’s Building Upgrade Tool, which are designed to promote the benefits of improvements for tenants. Other NABERS developments include the release of the NABERS Energy for Data Centres rating tool in 2013 and the expansion of NABERS into New Zealand.
NZGBC — In addition to the introduction of NABERS, the New Zealand Green Building Council, in conjunction with Christchurch City Council, has also developed BASE
(Building a Sustainable Environment), a simple, introductory-level green building assessment tool for the Christchurch rebuild. In addition to broader benefits for owners and tenants, such as increased occupier satisfaction and improved productivity, there is a strong business case, based on energy-savings alone, for designing and building to BASE standards. Davis Langdon analysed cost impacts for designing and construction to BASE standards and found that for a medium-sized building, it would only add 0.5 percent to the capital costs.
ISCA — The Infrastructure Sustainability Council of Australia continues to make progress in advancing sustainability in the design, construction and operation of Australian infrastructure. As of November 2012, four infrastructure projects had registered with ISCA for an Infrastructure Sustainability (IS) rating, including rail, road, water and waste water.
The IS rating tool currently encompasses six themes and fifteen categories. ISCA also intends to add to the rating tool two extra sustainability themes of Economic Performance and Workforce, each with their own categories.
ISCA Infrastructure Sustainability Rating Tool Framework
Themes Categories
Management and Governance
Management Systems, Procurement & Purchasing, Climate Change Adaptation
Using Resources Energy & Carbon, Water, MaterialsEmissions, Pollution and Waste
Discharges to Air, Land & Water, Land, Waste
Ecology Ecology People & Place Community Health, Wellbeing & Safety, Heritage, Stakeholder Participation,
Urban & Landscape DesignInnovation Innovation
AECOM 8584 The Blue Book 2013

Sustainability – A Global Understanding
Our AECOM Global Sentiment Survey research examined perceptions of sustainability from industry participants in several different parts of the world. We also asked them about the practical application of sustainability principles on projects in the region. In some cases we found discord between participants’ understanding of sustainability and the level of consideration these principles were given on projects in their field.
In New Zealand, there was some conflict between priorities on projects and what sustainability meant from an individual’s perspective. While there is a perception that projects in New Zealand are given a high level of consideration in terms of cultural and social issues (35 percent classified cultural as high in our industry research), these were not very prominent in individuals’ understandings of sustainability.
In many ways, Australian participants had a much more conservative view of how much we consider sustainability on projects. Other parts of the world, such as China and North America, believe that they give a high level of consideration to sustainability principles on their projects, whereas in Australia, this was often seen as more moderate. While
this may be symptomatic of the Australian tendency to understate and downplay certain issues, it does show that many see room for improvement in our approach to sustainability. There is an opportunity in this aspiration to advance our thinking on the social, cultural and environmental elements of sustainability.
The vision of sustainability expressed by participants in certain parts of the world differs considerably. In Asia there is a strong focus on social principles — particularly in China. Developing countries generally place more emphasis on environmental issues, such as managing resources.
Economic concerns are paramount for North American respondents as sustainability considerations are defined by long-term efficiency gains. In the Middle East and Europe, social issues are not as prominent, with more dialogue about the long-term efficiencies of an asset and a focus on energy consumption, and renewable generation in Europe. Australia shared this long-term cost-benefit approach, including the whole-of-life costs for an asset as imperative to sustainable practices.
A Vision of Sustainability – Economic, Environmental and Social Priorities
Social and Cultural Consideration on Projects
Source: AECOM Global Sentiment Survey
In their vision of sustainability, Australian respondents prioritise economic elements, such as asset performance and whole-of-life costs, twice as much as environmental concerns.
New Zealanders have a similar sense of sustainability but with slightly more emphasis on environmental elements such as the use of renewable energy.
HighEconomic
Priority
LowEconomic
Priority
China
Middle East
Australia
North America
Europe
New Zealand
Sub-Sahara Africa
SE AsiaIndia
LowEnvironmentalPriority
HighEnvironmental
Priority
Size RepresentsRelative Strength ofSocial Priority
There is an opportunity to advance our thinking on the social, cultural and environmental elements of sustainability.
Sou
th E
ast
Asi
a
0
20
25
30
35
%
15
High Level ofSocial Consideration
High Level ofCultural Consideration
10
5
Afr
ica
Indi
a
New
Zea
land
Aus
tral
ia
Mid
dle
Eas
t
Eur
ope
Chi
na
Nor
th A
mer
ica
Many believe New Zealand projects give a higher than average level of consideration to cultural issues.
40
Note: Figures indicate the proportion of respondents who classified consideration levels as high.
Source: AECOM Global Sentiment Survey
AECOM 8786 The Blue Book 2013

Carbon Price
On 1 July 2013, the first-year carbon price of AU$23/tonne CO2-e will increase by 2.5 percent in real terms1. In addition, the industry assistance for moderate emissions-intensive industries will reduce from 66 to 65.1 percent and high emissions-intensive industries assistance will reduce from 94.5 to 93.3 percent. The combination of these factors will mean a marginal increase to some input costs for particular materials impacted by the carbon price.
Davis Langdon closely examined the impacts of the carbon price on construction costs at the time of its introduction in 2012. Our research approach provides a comprehensive understanding of carbon price outcomes. The emission intensity of key construction materials is calculated with our purpose-built embodied carbon tool. Next, the carbon pricing mechanism is applied to these affected materials with consideration of any relevant industry assistance. Manufacturers of cement, steel, glass and aluminium are all eligible for the maximum rate of industry assistance;
94.5 percent in the first year of the scheme. This significantly reduces the carbon obligation for these companies.
This systematic, measured approach found that the cost of construction will rise minimally in the first years of the scheme. Finally, it is of fundamental importance to put these calculations in the context of the current market for material manufacturers. Given the current relatively low construction volumes in the Australian market, it is expected that the supply chain will absorb most, if not all, of these additional costs in order to compete for limited work.
In addition to these market factors, there is also some uncertainty about the future of the scheme. If the Labor Government is removed from office in the September 2013 election, and the opposition continues with current plans to repeal the carbon price, the scheme could be removed after 2016 — if and when the Coalition takes control of the Senate.
Carbon Price – Refridgerants
While construction costs in most sectors are largely unaffected by the carbon price, refrigerant costs continue to cause financial stress on projects that are heavily reliant on these (for example: hospitals, pharmaceuticals and food processing facilities). Although the carbon price has only impacted selected refrigerants by ~45 percent (mainly R-134a and R410a), cost increases are being witnessed in the vicinity of 150 to 300 percent due to other external factors — mainly supply of raw materials.
Some gases, including commonly used refrigerants in heating, ventilation and air-conditioning systems and freezers, are subject to an equivalent carbon price through amended regulations targeting ozone-depleting substances (under the Montreal Protocol obligations) and the synthetic greenhouse gases used as their replacement (identified in the Kyoto Protocol). These selected gases do not receive industry assistance.
The application of the carbon price to refrigerant gases is part of an ongoing legacy to eliminate ozone-depleting gases and reduce dependence on gases with high global-warming potential (GWP). The Clean Energy Act 2011 applies an equivalent carbon price through the Ozone Protection and Synthetic Greenhouse Gas Amendment Regulation 2012 to hydrofluorocarbons (HFC), perflurocarbons and sulfur hexafluoride.
The Montreal Protocol targeted the elimination of chlorofluorocarbon (CFC) gases in the first phase, followed by hydrochlorofluorocarbon (HCFC) gases by 2020 (including R-22, which was banned in the European Union in 2010). This resulted in a greater demand for other gases and added pressure to product supply.
The refrigerant gases most commonly used in Australian systems are R-134a and R-410a — both of which are HFC gases and impacted directly by the carbon price, resulting in increases of approximately AU$30 and AU$40 per kilogram respectively. R-22 (HCFC gas) will be phased out by 2016 and is not subject to the carbon price, although a separate levy of AU$3,000 per ozone-depleting potential (ODP) tonne is applied to HCFC gases under the Ozone Protection and Synthetic Greenhouse Gas Amendment Regulation 2012.
At the same time, the cost of refrigerants has become increasingly volatile as the supply and demand balance has shifted dramatically. Additional costs associated with higher supply costs cannot be directly attributed to the carbon price policy. An allowance for this volatility should be considered as part of the effective cost management of projects but excluded from carbon price claims.
Carbon Price Impact on Total Construction Costs2
Ozone Depletion Potential and Global-warming Potential of Refrigerant Gases
Refrigerant Type Typical Refrigerants Ozone Depletion Potential
Global-warming Potential
CFC R-11, R-12, R-113, R-114, R-500, R-502
High High
HCFC R-22 Low HighHFC R-134a, R-410a Zero Moderate-highNatural Carbon dioxide, ammonia,
hydrocarbonsZero Very low
Source: AECOMNote: ODP is ozone depletion potential and GWP is global-warming potential.
Note: 1This is equivalent to 2.5 percent plus annualised inflation. 2Applicable to first-year carbon price mechanism settings.
Roads 0.34%Rail 0.19%Office 0.11%Multi-unit Residential 0.09%Health Facility 0.09%Industrial 0.04%
Carbon price impact excluding refrigeration costs
0.00% 0.05% 0.10% 0.15% 0.20% 0.25% 0.30% 0.35%
Source: AECOM
AECOM 8988 The Blue Book 2013
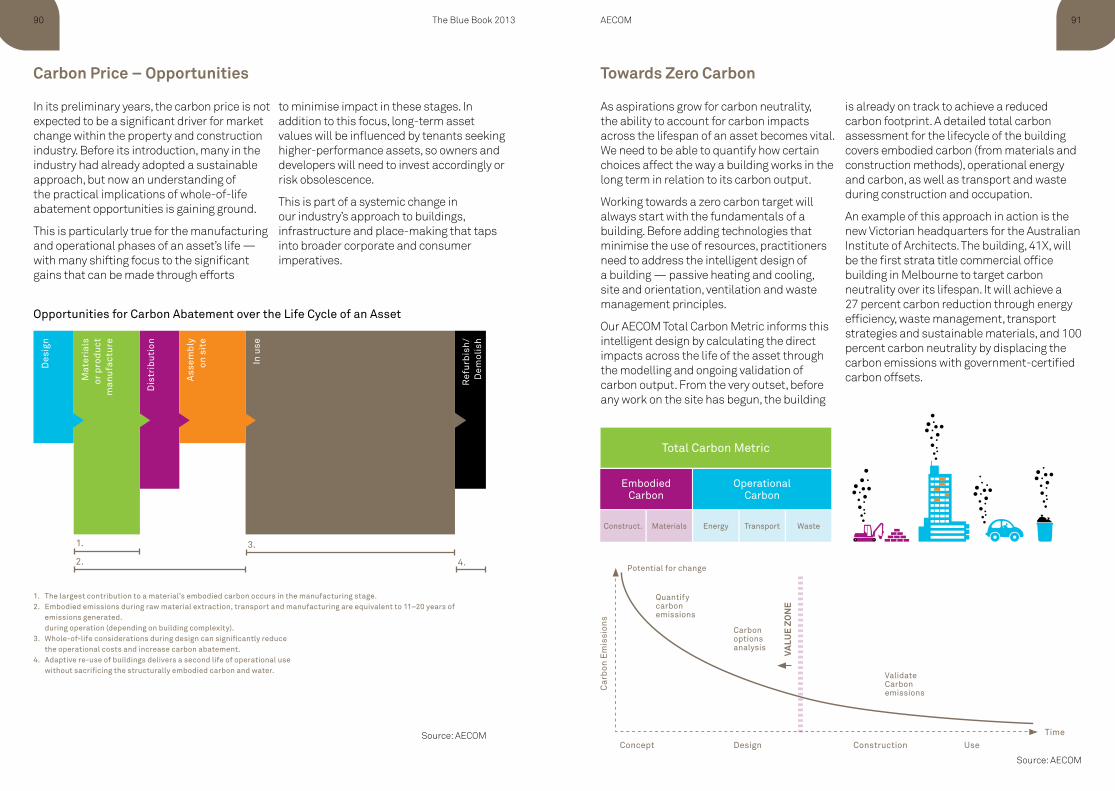
Carbon Price – Opportunities
In its preliminary years, the carbon price is not expected to be a significant driver for market change within the property and construction industry. Before its introduction, many in the industry had already adopted a sustainable approach, but now an understanding of the practical implications of whole-of-life abatement opportunities is gaining ground.
This is particularly true for the manufacturing and operational phases of an asset’s life — with many shifting focus to the significant gains that can be made through efforts
to minimise impact in these stages. In addition to this focus, long-term asset values will be influenced by tenants seeking higher-performance assets, so owners and developers will need to invest accordingly or risk obsolescence.
This is part of a systemic change in our industry’s approach to buildings, infrastructure and place-making that taps into broader corporate and consumer imperatives.
Towards Zero Carbon
As aspirations grow for carbon neutrality, the ability to account for carbon impacts across the lifespan of an asset becomes vital. We need to be able to quantify how certain choices affect the way a building works in the long term in relation to its carbon output.
Working towards a zero carbon target will always start with the fundamentals of a building. Before adding technologies that minimise the use of resources, practitioners need to address the intelligent design of a building — passive heating and cooling, site and orientation, ventilation and waste management principles.
Our AECOM Total Carbon Metric informs this intelligent design by calculating the direct impacts across the life of the asset through the modelling and ongoing validation of carbon output. From the very outset, before any work on the site has begun, the building
is already on track to achieve a reduced carbon footprint. A detailed total carbon assessment for the lifecycle of the building covers embodied carbon (from materials and construction methods), operational energy and carbon, as well as transport and waste during construction and occupation.
An example of this approach in action is the new Victorian headquarters for the Australian Institute of Architects. The building, 41X, will be the first strata title commercial office building in Melbourne to target carbon neutrality over its lifespan. It will achieve a 27 percent carbon reduction through energy efficiency, waste management, transport strategies and sustainable materials, and 100 percent carbon neutrality by displacing the carbon emissions with government-certified carbon offsets.
Opportunities for Carbon Abatement over the Life Cycle of an Asset
Source: AECOM
1. The largest contribution to a material’s embodied carbon occurs in the manufacturing stage.2. Embodied emissions during raw material extraction, transport and manufacturing are equivalent to 11–20 years of
emissions generated. during operation (depending on building complexity).
3. Whole-of-life considerations during design can significantly reduce the operational costs and increase carbon abatement.
4. Adaptive re-use of buildings delivers a second life of operational use without sacrificing the structurally embodied carbon and water.
Des
ign
Dis
trib
utio
n
Ass
emb
ly
on s
ite
In u
se
Ref
urbi
sh/
Dem
olis
h
Mat
eria
ls
or p
rodu
ct
man
ufac
ture
1.
2. 4.
3.
Potential for change
Quantify carbon emissions
Carbon options analysis
Validate Carbon emissions
Concept Design Construction UseTime
Car
bon
Em
issi
ons
VALU
E ZO
NE
Total Carbon Metric
EmbodiedCarbon
Operational Carbon
Materials Energy Transport WasteConstruct.
Source: AECOM
AECOM 9190 The Blue Book 2013

Existing Buildings – Emerging Trends
The revolution of existing buildings has evolved to consider holistic solutions that extend beyond the walls of individual buildings.
In the last decade, efficiency from energy and water was the priority, whereas now, we are looking towards adapting cities to support alternative transport to these revitalised precincts. The growth of building adaptation, improved collaboration spaces, and innovative financing solutions are driving the next wave of building refurbishments.
1 Gensler, Los Angeles 2012
Construction + AdaptationBuilding ‘re-lifing’ is entering a new era. There is an increasing number of buildings being transformed to meet highest and best use, which require adaption of the building. For instance, former office buildings are being converted to residential apartments. This is now being taken one step further with what Gensler1 refers to as ‘hacking buildings’. This extreme approach to ‘hackable’ building refurbishment takes an existing structure and updates it beyond recognition, incorporating a diverse mix of uses in an almost unrecognisable reformed building for the 21st century.
OperationsThere is strong evidence that the Facilities Management industry (those responsible for driving increasingly complex buildings) are beginning to recognise their increased role in achieving efficient operations, and their subsequent need to up-skill to meet this demand. But as the design community delivers ever more sophisticated buildings that stretch the performance envelope (especially with the inclusion of advanced ICT systems), we need the confidence that building owners have access to the skills, capacity, and operational budget to keep these buildings running as they should. Apply this thinking to existing buildings, and many are still struggling to get to the starting point, which is forming a reliable dataset of building performance, sufficiently disaggregated to inform an efficiency strategy.
Source: AECOM
92 The Blue Book 2013
Energy SupplyWhile existing buildings introduce a set of constraints to energy generation not faced by new developments, the market is beginning to focus on a set of previously under-exploited opportunities. With the rising cost of energy, and the introduction of new financing mechanisms, local generation options can be used to transform the performance of existing assets.
TransportAustralia and New Zealand is alert to the need to address transport constraints, and this includes the role of the car in the CBD. Changing demographics, shifting expenditure away from road toward rail infrastructure, using place-making to deal with a growing obesity and health problem, the continued boom of the cycling economy, and the recognition of the need for social inclusion and local interaction at the building level will (or should) start to contribute to a different set of transport requirements when planning buildings and precincts. For example, could we see a re-prioritising of the stairwell over the lift to promote health and wellbeing?
OccupiersBehavioural change represents a significant opportunity to improve building performance. Through staff engagement strategies, new practices can have a significant impact on a building’s energy, water use and waste. These new behaviours are not designed to be altruistic, but rather, represent an opportunity to improve the indoor environment and save on operational costs.
WorkspaceSpaces are being remodelled to enhance expression, efficiency and workplace effectiveness. Organisations are seeking to improve collaboration, brand recognition and mobility within their workspace. Creative solutions are being applied to existing building structures and transforming not only the physical space but also the social interactions of occupants. Through an ever expanding dataset on social behaviour, new models are being developed to improve and redesign the function of offices, retail centres and health facilities.
FinancingAlthough the era of ‘free green money’ has passed, the appetite of lenders to enter this market has increased. Environmental Upgrade Agreements can help improve the rate of return on your investment by securitising the loan against the building, and by allowing the tenant to contribute to the repayment. Another example is on-bill financing, where energy efficiency upgrades are repaid through energy bills. Off balance sheet solutions, like Energy Performance Contracting are now being used to upgrade public assets.
AECOM 93

Notes
92 The Blue Book 2013

aecom.com
AECOM Blue Book 2013 15th Edition © 2013
About AECOMAECOM is a global provider of professional technical and management support services to a broad range of markets, including transportation, facilities, environmental, energy, water and government. With approximately 45,000 employees around the world, AECOM is a leader in all of the key markets that it serves. AECOM provides a blend of global reach, local knowledge, innovation and technical excellence in delivering solutions that create, enhance and sustain the world’s built, natural and social environments. A Fortune 500 company, AECOM serves clients in more than 140 countries and has annual revenue in excess of $8.0 billion.