blood flow in end-to-side anastomoses - argonne … blood flow in end-to-side anastomoses francis...
TRANSCRIPT
1
Blood Flow in End-to-Side Anastomoses Francis Loth,1 Paul F. Fischer,2 and Hisham S. Bassiouny3 1Departments of Mechanical and Industrial Engineering and Bioengineering, University of Illinois at Chicago, Chicago, IL 60607, email: [email protected] 2Division of Mathematics and Computer Science, Argonne National Laboratory, Argonne, IL 60439, email: [email protected] 3Department of Surgery, University of Chicago, Chicago, IL 60637, email: [email protected] Key Words hemodynamics, arterial bypass graft, arteriovenous, transitional flow, shear stress Abstract Blood flow in end-to-side autogenous or prosthetic graft anastomoses is of great interest to biomedical researchers because the biomechanical force profile engendered by blood flow disturbances at such geometric transitions is thought to play a significant role in vascular remodeling and graft failure. Thus, investigators have extensively studied anastomotic blood flow patterns in relationship to graft failure with the objective of enabling design of a more optimal graft anastomotic geometry. In contrast to arterial bifurcations, surgically created anastomoses can be modified to yield a flow environment that improves graft longevity. Understanding blood flow patterns at anastomotic junctions is a challenging problem because of the highly varying and complex three-dimensional nature of the geometry that is subjected to pulsatile and, occasionally, turbulent flow.
2
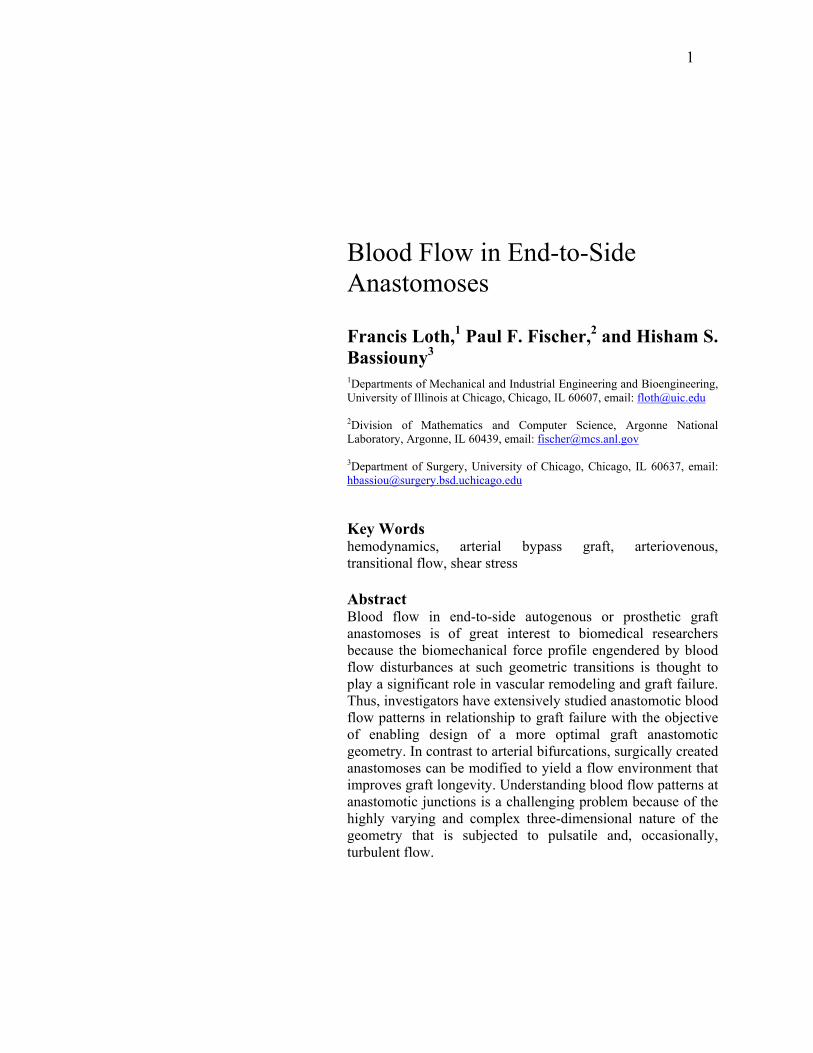
INTRODUCTION A vascular anastomosis is a surgical connection between two vessels that forms a continuous channel in which blood can flow. The anastomosis can be a created in an end-to-end or end-to-side configuration depending on the anatomy and procedure objective. Figure 1 shows a sketch of an end-to-side anastomosis. While the use of bypass grafts did not become routine till the mid-20th century, many of the techniques were developed during an intense period of activity between 1904 and 1906 by Alex Carrel and Charles Guthrie at the University of Chicago. Carrel was awarded the 1912 Nobel Prize in Medicine and Physiology “in recognition of his work on vascular suture and the transplantation of blood vessels and organs” (Friedman 1988). Here, we present an overview of the fluid mechanics of blood flow in end-to-side anastomoses, with a particular emphasis on two distinct surgical reconstructions, namely, arterial bypass (AB) and arteriovenous (AV) grafts, which are illustrated in Figure 2. To set the stage, we highlight some of the basic flow parameters for these cases.
Figure 1. Sketch of end-to-side anastomosis construction from Grevious et al. (2003).
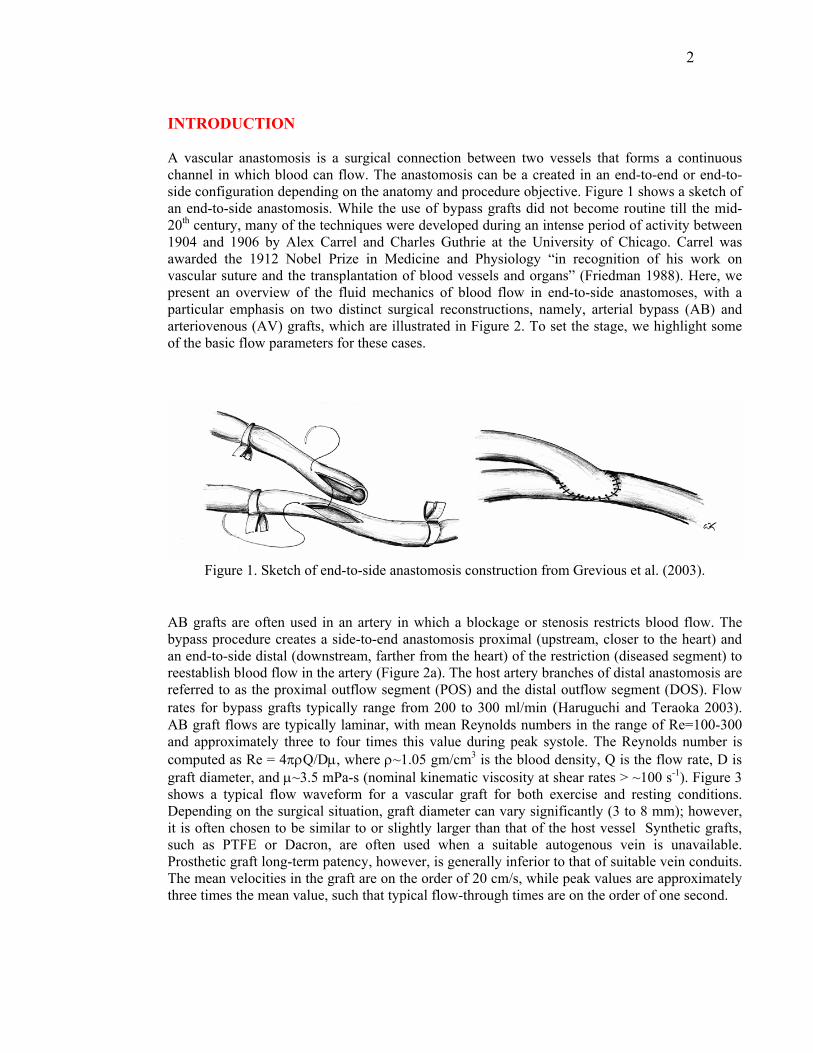
AB grafts are often used in an artery in which a blockage or stenosis restricts blood flow. The bypass procedure creates a side-to-end anastomosis proximal (upstream, closer to the heart) and an end-to-side distal (downstream, farther from the heart) of the restriction (diseased segment) to reestablish blood flow in the artery (Figure 2a). The host artery branches of distal anastomosis are referred to as the proximal outflow segment (POS) and the distal outflow segment (DOS). Flow rates for bypass grafts typically range from 200 to 300 ml/min (Haruguchi and Teraoka 2003). AB graft flows are typically laminar, with mean Reynolds numbers in the range of Re=100-300 and approximately three to four times this value during peak systole. The Reynolds number is computed as Re = 4πρQ/Dµ, where ρ~1.05 gm/cm3 is the blood density, Q is the flow rate, D is graft diameter, and µ~3.5 mPa-s (nominal kinematic viscosity at shear rates > ~100 s-1). Figure 3 shows a typical flow waveform for a vascular graft for both exercise and resting conditions. Depending on the surgical situation, graft diameter can vary significantly (3 to 8 mm); however, it is often chosen to be similar to or slightly larger than that of the host vessel Synthetic grafts, such as PTFE or Dacron, are often used when a suitable autogenous vein is unavailable. Prosthetic graft long-term patency, however, is generally inferior to that of suitable vein conduits. The mean velocities in the graft are on the order of 20 cm/s, while peak values are approximately three times the mean value, such that typical flow-through times are on the order of one second.
3
Figure 2. Geometry and flow configuration for an (a) AB from Grevious et al. (2003) and (b) AV graft from Lee et al. (2005).
Figure 3. Example of the variation in Reynolds number during the cardiac cycle for exercise and resting flow conditions (Lei et al. 1997).
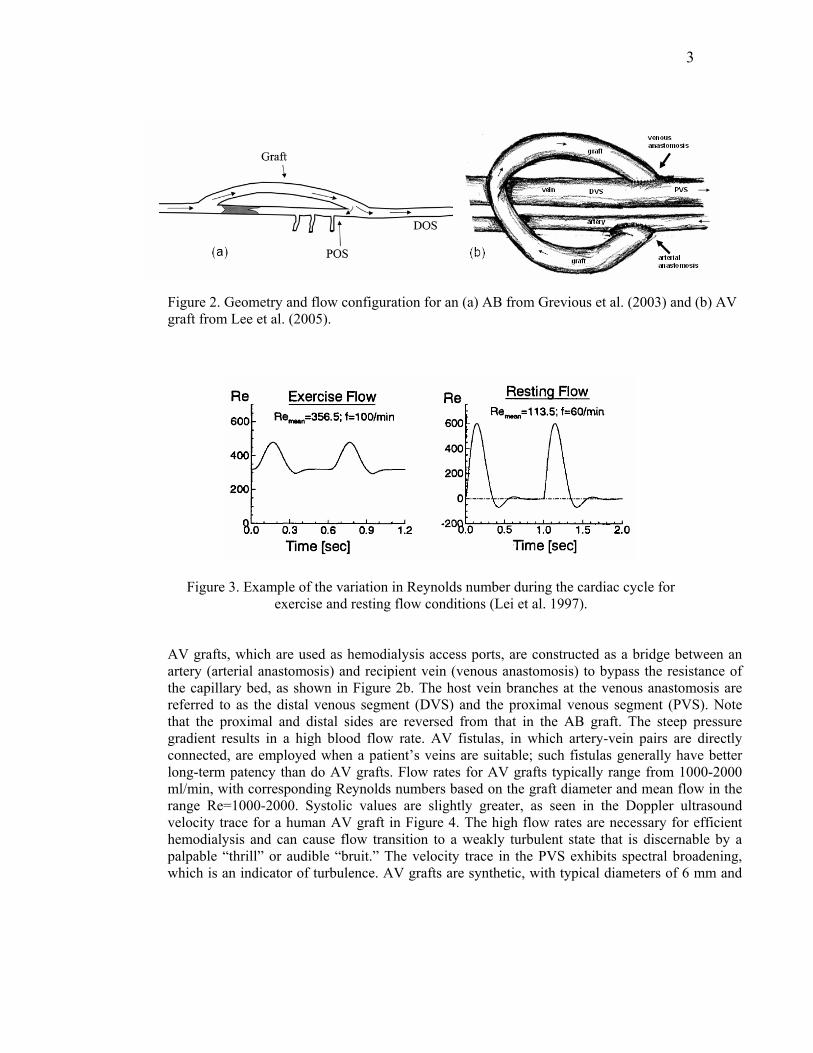
AV grafts, which are used as hemodialysis access ports, are constructed as a bridge between an artery (arterial anastomosis) and recipient vein (venous anastomosis) to bypass the resistance of the capillary bed, as shown in Figure 2b. The host vein branches at the venous anastomosis are referred to as the distal venous segment (DVS) and the proximal venous segment (PVS). Note that the proximal and distal sides are reversed from that in the AB graft. The steep pressure gradient results in a high blood flow rate. AV fistulas, in which artery-vein pairs are directly connected, are employed when a patient’s veins are suitable; such fistulas generally have better long-term patency than do AV grafts. Flow rates for AV grafts typically range from 1000-2000 ml/min, with corresponding Reynolds numbers based on the graft diameter and mean flow in the range Re=1000-2000. Systolic values are slightly greater, as seen in the Doppler ultrasound velocity trace for a human AV graft in Figure 4. The high flow rates are necessary for efficient hemodialysis and can cause flow transition to a weakly turbulent state that is discernable by a palpable “thrill” or audible “bruit.” The velocity trace in the PVS exhibits spectral broadening, which is an indicator of turbulence. AV grafts are synthetic, with typical diameters of 6 mm and
4
lengths of 15–20 cm. Mean velocities are on the order of a few meters per second, and typical flow-through times are on the order of a tenth of a second.
(b)(a)
Figure 4. Color Doppler ultrasound images on a dialysis patient’s AV graft venous anastomosis. Velocity traces are shown for measurements taken near the centerline of the (a) PTFE graft and (b) PVS. Note the significant spectral broadening in the PVS trace (Loth et al. 2003). An anastomosis is essentially a bifurcation. It differs, however, from most naturally occurring blood vessel bifurcations because the angle between the daughter vessels is effectively obtuse. Another important difference between anastomotic and natural bifurcations is the flow division between the daughter branches. The flow division in anastomoses can vary widely and has a significant impact on the hemodynamics. The motivation for studying vascular graft fluid dynamics is that the local hemodynamic environment is thought to play an important role in their long term patency. An understanding of the relationship between graft hemodynamics and intimal hyperplasia (a common cause of graft failure) could lead to optimized graft designs and to improved prediction of graft longevity and patency. Research in this field has employed a range of in vitro and in vivo experimental techniques, including laser Doppler anemometry (LDA), magnetic resonance imaging (MRI), photochromatic dye, Doppler ultrasound, and flow visualization as well as computational fluid dynamics (CFD).
This review describes the influence of some of the fundamental parameters governing blood flow in end-to-side anastomoses. We present the major features typically present in these flows, the methods available for their study, and the relative importance of these features on graft failure. Our primary focus will be on the influence of geometry, flow division, and Reynolds number of Newtonian flow in rigid vessels. To limit the discussion, we focus primarily on AB and AV grafts. End-to-end anastomoses and coronary grafts, which differ in geometry and flow regime, are not discussed. Other review articles that address blood flow include Skalak et al. (1989) and Ku (1997) and more recent articles by Haruguchi and Teraoka (2003), Taylor and Draney (2004), Migliavacca and Dubini (2005), Van Tricht et al. (2005), Lasheras (2007), and Duraiswamy et al. (2007). The remainder of the paper is structured as follows. First, we briefly introduce hypothesized relationships between hemodynamics and graft failure. Next, we describe the principal flow features of AB grafts. We then discuss the major features within the transitional flow environment of AV grafts and consider the importance of asymmetry that is often present in vivo and leads to out-of-plane curvature and helical geometries. We close with conclusions and future research directions in this field.

5
6
RELATIONSHIP BETWEEN GRAFT FAILURE AND HEMODYNAMICS
Intimal hyperplasia (IH), accelerated growth of smooth muscle cells and surrounding matrix, is a major cause of long-term failure of end-to-side vascular grafts (Imparato et al. 1972, Echave et al.1979, LoGerfo et al. 1983, Kohler et al. 1991). It is well accepted that hemodynamics forces play a role in blood vessel remodeling (Ku 1997) and many studies have been conducted to better understand the relationship between blood forces acting on the walls and intimal thickening (IT) in grafts (Rittgers 1978, Sottiurai et al. 1989, Fillinger et al. 1990, Bassiouny 1992, Keynton et al. 2001, Loth et al. 2002, Giordana et al. 2005). The results of these studies demonstrate that hemodynamics, principally wall shear stress (WSS) effects, play a role in the localization of IT. It has been shown that arteries will adapt their size in order to maintain a level of WSS (Kamiya and Tagawa 1980, Zarins et al. 1987). Less understood, however, is the process of IT in end-to-side anastomoses, where the geometry and WSS patterns are more complicated.
There aremany hypotheses describing how WSS triggers a biological response at the cellular level which leads to IT in grafts. While not the focus of the paper, we briefly describe how endothelial cells (ECs), which line the blood flow interface of arteries as a monolayer, are influenced by WSS and how this mechanical stimulus leads to anastomotic IT. Changes in both the mean and pulsatile components of WSS magnitude have a pronounced effect on the morphology and biochemical signaling of ECs. Mechanotransduction, the process by which cells sense and convert the mechanical signal into a biochemical signal, has been the subject of many studies (Gudi et al. 1996, Davies 1995, Tzima et al. 2005). Ultimately, several intracellular signaling pathways are activated by mechanical forces leading to alterations in transcription and translation of genes involved in cellular proliferation, differentiation, growth and apoptosis. ECs that experience complex flow or low WSS can result in aberrant cell function (Tseng et al. 1995). Dysfunctional ECs can fail to secrete biological factors involved in the physiological maintenance of the underlying smooth muscle cells. Furthermore, they can secrete signaling molecules that promote a phenotypical change in smooth muscle cells, leading to their proliferation and migration into the intima where they secrete an excess of extracellular matrix (Kipshidze et al. 2004). This process results in IT or intimal hyperplasia that can reduce the lumen area for blood passage in the form of a stenosis. Ultimate failure of the graft is often by thrombus formation. The thrombus might form as a result of low blood velocity within a graft caused by a flow limiting stenosis or high shear rates caused by a jet-type flow. It is well established that global low WSS is associated with the intimal or neointimal hyperplasia. The relationship was demonstrated clearly for end-to-end grafts by Binns et al. (1989), who measured neointimal thickening on PTFE grafts with diameters of 4, 6, and 8 mm in a canine animal model (40 grafts). They reported that oversized grafts tended to promote low WSS and IH, while undersized grafts led to abnormally high WSS with early thrombosis and graft failure. An in vivo study by Kohler et al. (1991) demonstrated that increased blood flow and WSS resulted in significantly reduced neointimal thickening in the middle of PTFE grafts far from the anastomoses. Correlation of in vitro WSS distributions with IT in the carotid artery bifurcation was established in an paper by Ku et al. (1985). This study outlined some of the WSS parameters that might be relevant, such as the WSS maximum, minimum, and mean. The researchers also introduced the

7
oscillating shear index (OSI), the ratio of the time duration of the retrograde to antegrade directed WSS. They found strong correlation of IT with the inverse of maximum WSS (r = 0.90), inverse of mean WSS (r = 0.82), and OSI (r = 0.82), where r is the linear correlation coefficient, with values close to one implying strong correlation. While anastomotic IT is quite different from IT in the carotid bifurcation, the correlation techniques employed for anastomoses are quite similar.
(a)(c)
(b) (d)
POS DOS
PVSDVS
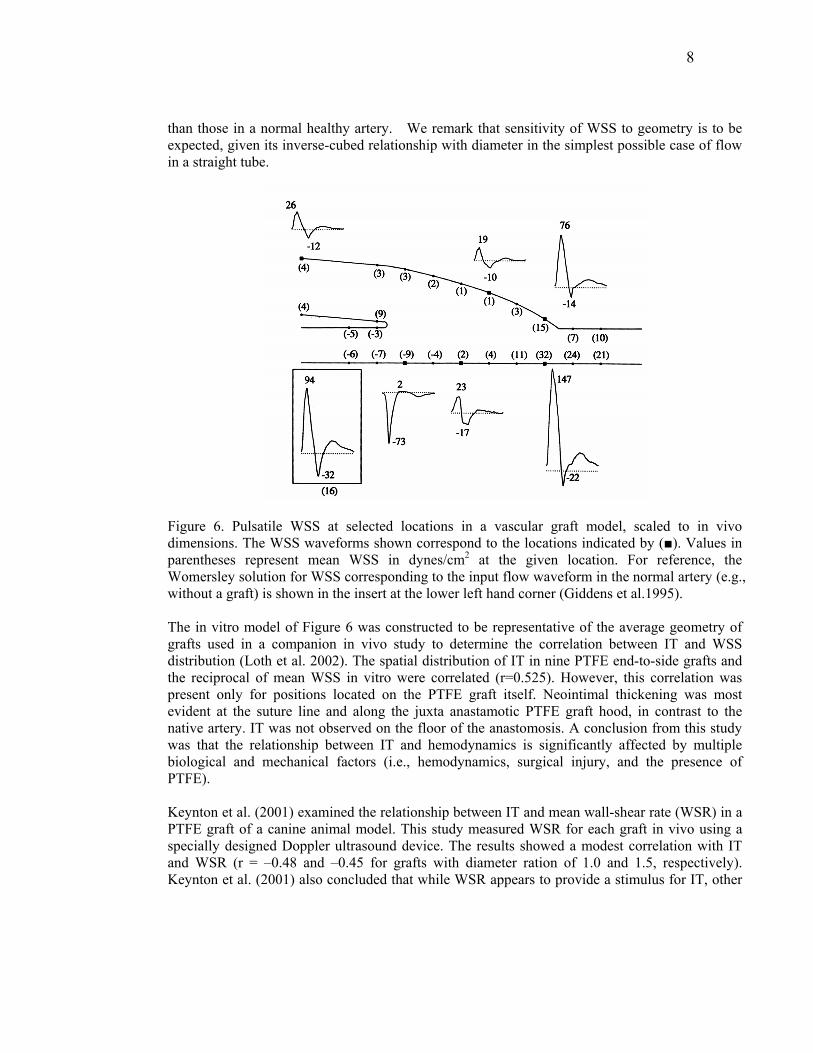
Figure 5. Illustration of typical distributions of IT and flow patterns in (a,c) the distal anastomosis of an AB graft and (b,d) the venous anastomosis of an AV graft. WSS denotes wall shear stress; WSSG, wall shear stress gradient; and OSI, oscillatory shear index (adapted from Haruguchi and Teraoka, 2003). The flow patterns and the spatial WSS distributions in end-to-side anastomoses are complex. Figure 5 illustrates typical scenarios for AB and AV grafts. These sketches show commonly identified locations for IT, namely, the heel, toe, and graft floor. The toe and heel coincide with the suture line, and thus some IT would be expected as a natural healing response to the surgical procedure. However, these areas are also regions of flow separation or high spatial gradients of WSS, which have also been implicated in EC response (DePaola et al. 1992). The floor typically experiences low WSS because of the presence of a stagnation point-type flow created as flow divides between the POS and DOS (or PVS and DVS). The complexity of anastomotic WSS distributions is illustrated in Figure 6, which shows WSS traces obtained from LDA measurements in an upscaled in vitro flow model under pulsatile conditions (Giddens et al. 1995, Taylor et al. 1998, Lei et al. 2001, Loth et al. 2002). The flow split in this case is such that 20% of the flow exited the anastomosis through the DOS and 80% through the POS. The mean and peak Reynolds numbers are 850 and 222, respectively and the graft-to-host diameter ratio is DR=1.6. The mean (time averaged over the cycle) WSS values are given in parentheses at several measurement locations and the maximum and minimum values are indicated on each trace at the given location. The WSS in the anastomosis is generally lower than that which exists in a normal healthy artery except in the toe region. The WSS sign reversal indicates the floor stagnation point and significant WSS gradients are evident on the floor in the vicinity of the toe, where mean and peak WSS values are respectively two and three times higher
8
than those in a normal healthy artery. We remark that sensitivity of WSS to geometry is to be expected, given its inverse-cubed relationship with diameter in the simplest possible case of flow in a straight tube.
Figure 6. Pulsatile WSS at selected locations in a vascular graft model, scaled to in vivo dimensions. The WSS waveforms shown correspond to the locations indicated by (■). Values in parentheses represent mean WSS in dynes/cm2 at the given location. For reference, the Womersley solution for WSS corresponding to the input flow waveform in the normal artery (e.g., without a graft) is shown in the insert at the lower left hand corner (Giddens et al.1995). The in vitro model of Figure 6 was constructed to be representative of the average geometry of grafts used in a companion in vivo study to determine the correlation between IT and WSS distribution (Loth et al. 2002). The spatial distribution of IT in nine PTFE end-to-side grafts and the reciprocal of mean WSS in vitro were correlated (r=0.525). However, this correlation was present only for positions located on the PTFE graft itself. Neointimal thickening was most evident at the suture line and along the juxta anastamotic PTFE graft hood, in contrast to the native artery. IT was not observed on the floor of the anastomosis. A conclusion from this study was that the relationship between IT and hemodynamics is significantly affected by multiple biological and mechanical factors (i.e., hemodynamics, surgical injury, and the presence of PTFE). Keynton et al. (2001) examined the relationship between IT and mean wall-shear rate (WSR) in a PTFE graft of a canine animal model. This study measured WSR for each graft in vivo using a specially designed Doppler ultrasound device. The results showed a modest correlation with IT and WSR (r = –0.48 and –0.45 for grafts with diameter ration of 1.0 and 1.5, respectively). Keynton et al. (2001) also concluded that while WSR appears to provide a stimulus for IT, other
9
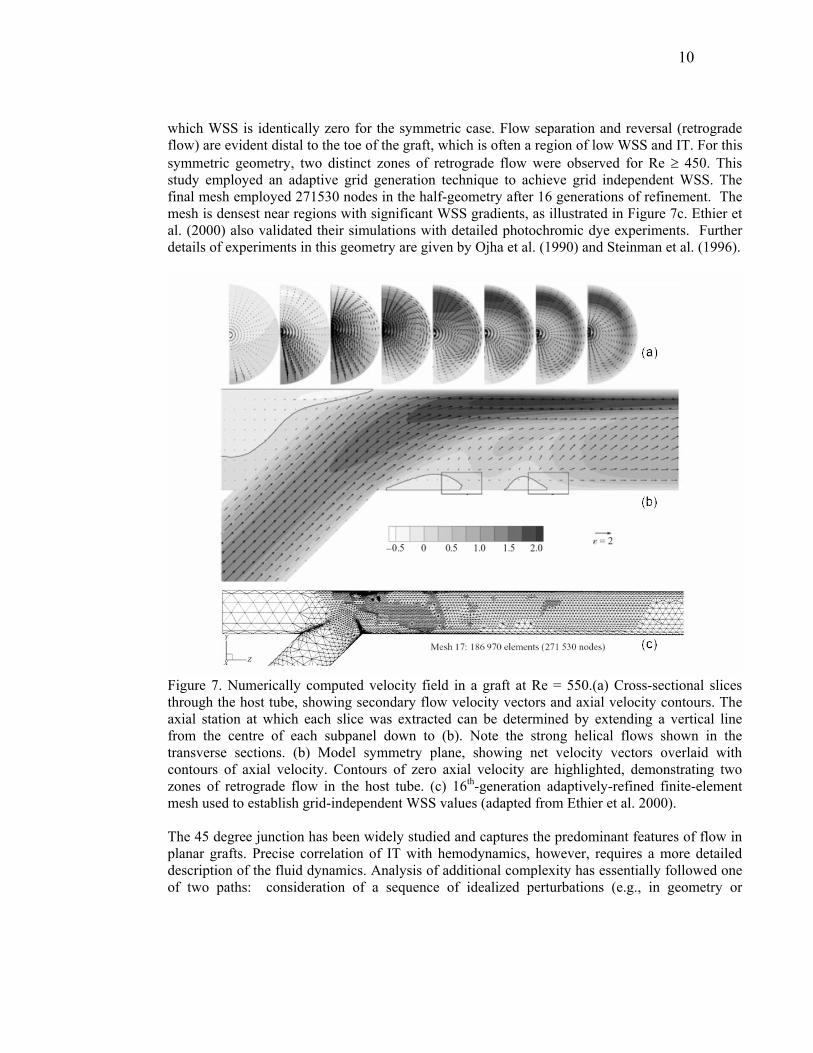
factors are involved. In contrast to the study by Loth et al. (2002), they found significant IT on the floor of the graft for two geometries. AV grafts are similar in geometry to AB grafts; however, one should be cautious when comparing the two (Glagov et al. 1991). Flow conditions in the AV graft are quite different and can produce transition to turbulence. In addition, the host vessel is a vein rather than an artery, and the pressure is significantly lower than in the arterial circuit. Still, as with AB grafts, the main cause of AV graft failure is IH, which is manifested by a stenosis or narrowing of the vein downstream of the graft (Kanterman et al. 1995). While many of the flow features of AB grafts are present in AV grafts, the significantly higher AV graft flow rates increase the overall WSS in the venous anastomosis several times that of the average values in the AB grafts. Thus, other mechanisms in addition to low WSS have been investigated for AV grafts. Fillinger et al. (1989) studied the effect of regulating flow rate in AV grafts in a canine model and found a correlation between the graft Reynolds number and IT (r = 0.915). In a second study, Fillinger et al. (1990) showed a correlation between regions of perivascular tissue vibration with regions of IT (r = 0.92) and hypothesized that the tissue vibration was a result of turbulent flow. The area of most IT occurred near the toe in the PVS. Loth et al. (2003) and Lee et al. (2005) reported measurements of vein-wall vibration on a canine model using laser Doppler vibrometry. They found greater vibration levels in the PVS than the DVS, including vibrations with frequencies greater than 100 Hz that are attributed to (weakly) turbulent flow conditions. While turbulence is implicated in AV grafts, the region of tissue vibration/turbulence is near the graft toe in the PVS which may also be a region of flow separation and thus low WSS. The close proximity of these different hemodynamic variables in the PVS makes correlation studies between hemodynamics and IH in the AV graft particularly difficult. Thus, there is significant interest in understanding the flow patterns within both AB and AV grafts in order to help further elucidate the complex relationship between biomechanical stresses and smooth muscle cell growth leading to IH. While the geometry of AB and AV grafts are similar, the flow conditions can create markedly different flow patterns such as the presence of turbulence in AV grafts. Further studies demonstrating quantitative correlations between hemodynamic variables and IT are required before design requirements for anastomoses can be deduced. FLOW IN ARTERIAL BYPASS GRAFTS The predominant flow features of end-to-side anastomoses are illustrated in Figure 7, which shows the velocity flow field computed numerically by Ethier et al. (2000) under steady flow conditions in an idealized symmetric anastomosis consisting of a 45 degree junction of two tubes. The core of high momentum fluid entering from the graft is skewed toward the graft floor and sets up a pair of counter-rotating Dean vortices in the DOS. The secondary flow is indicated by the vector plots and axial flow distributions in the cross planes of Figure 7a. As the flow propagates through the DOS, the axial peak is redistributed in an arc near the vessel wall in a manner similar to that found when developed flow enters a curved bend. The secondary velocities can be quite high—as much as 70% of the mean graft inlet velocity in the case shown here (Re=550). There is also limited secondary flow in the POS, which is occluded. The floor stagnation point, seen opposite the toe in the midplane plot of Figure 7b, represents a point at
10
which WSS is identically zero for the symmetric case. Flow separation and reversal (retrograde flow) are evident distal to the toe of the graft, which is often a region of low WSS and IT. For this symmetric geometry, two distinct zones of retrograde flow were observed for Re ≥ 450. This study employed an adaptive grid generation technique to achieve grid independent WSS. The final mesh employed 271530 nodes in the half-geometry after 16 generations of refinement. The mesh is densest near regions with significant WSS gradients, as illustrated in Figure 7c. Ethier et al. (2000) also validated their simulations with detailed photochromic dye experiments. Further details of experiments in this geometry are given by Ojha et al. (1990) and Steinman et al. (1996).
Figure 7. Numerically computed velocity field in a graft at Re = 550.(a) Cross-sectional slices through the host tube, showing secondary flow velocity vectors and axial velocity contours. The axial station at which each slice was extracted can be determined by extending a vertical line from the centre of each subpanel down to (b). Note the strong helical flows shown in the transverse sections. (b) Model symmetry plane, showing net velocity vectors overlaid with contours of axial velocity. Contours of zero axial velocity are highlighted, demonstrating two zones of retrograde flow in the host tube. (c) 16th-generation adaptively-refined finite-element mesh used to establish grid-independent WSS values (adapted from Ethier et al. 2000). The 45 degree junction has been widely studied and captures the predominant features of flow in planar grafts. Precise correlation of IT with hemodynamics, however, requires a more detailed description of the fluid dynamics. Analysis of additional complexity has essentially followed one of two paths: consideration of a sequence of idealized perturbations (e.g., in geometry or
11
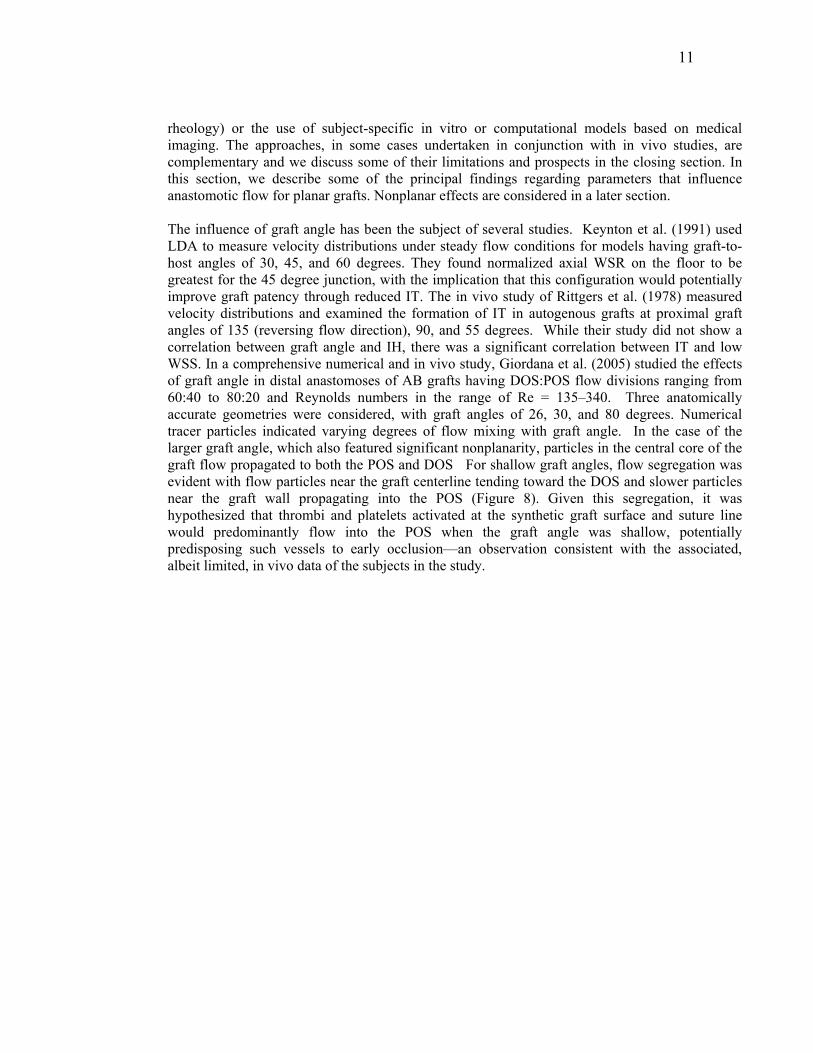
rheology) or the use of subject-specific in vitro or computational models based on medical imaging. The approaches, in some cases undertaken in conjunction with in vivo studies, are complementary and we discuss some of their limitations and prospects in the closing section. In this section, we describe some of the principal findings regarding parameters that influence anastomotic flow for planar grafts. Nonplanar effects are considered in a later section. The influence of graft angle has been the subject of several studies. Keynton et al. (1991) used LDA to measure velocity distributions under steady flow conditions for models having graft-to-host angles of 30, 45, and 60 degrees. They found normalized axial WSR on the floor to be greatest for the 45 degree junction, with the implication that this configuration would potentially improve graft patency through reduced IT. The in vivo study of Rittgers et al. (1978) measured velocity distributions and examined the formation of IT in autogenous grafts at proximal graft angles of 135 (reversing flow direction), 90, and 55 degrees. While their study did not show a correlation between graft angle and IH, there was a significant correlation between IT and low WSS. In a comprehensive numerical and in vivo study, Giordana et al. (2005) studied the effects of graft angle in distal anastomoses of AB grafts having DOS:POS flow divisions ranging from 60:40 to 80:20 and Reynolds numbers in the range of Re = 135–340. Three anatomically accurate geometries were considered, with graft angles of 26, 30, and 80 degrees. Numerical tracer particles indicated varying degrees of flow mixing with graft angle. In the case of the larger graft angle, which also featured significant nonplanarity, particles in the central core of the graft flow propagated to both the POS and DOS For shallow graft angles, flow segregation was evident with flow particles near the graft centerline tending toward the DOS and slower particles near the graft wall propagating into the POS (Figure 8). Given this segregation, it was hypothesized that thrombi and platelets activated at the synthetic graft surface and suture line would predominantly flow into the POS when the graft angle was shallow, potentially predisposing such vessels to early occlusion—an observation consistent with the associated, albeit limited, in vivo data of the subjects in the study.
12
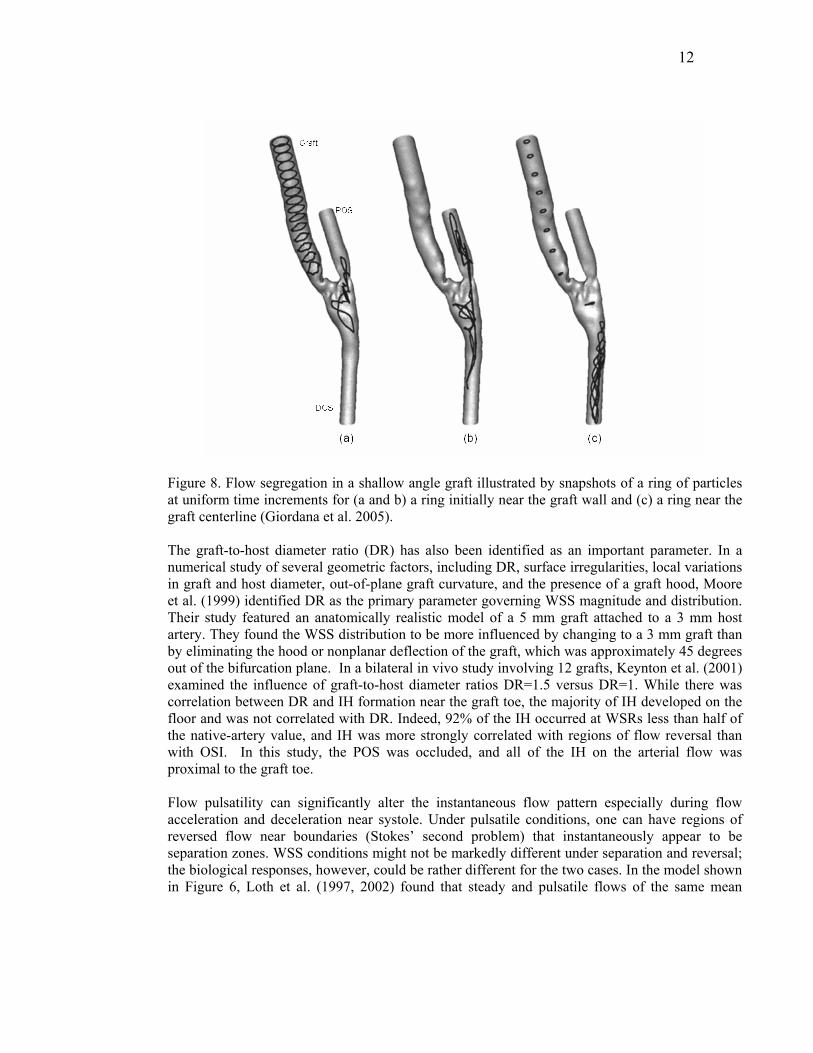
Figure 8. Flow segregation in a shallow angle graft illustrated by snapshots of a ring of particles at uniform time increments for (a and b) a ring initially near the graft wall and (c) a ring near the graft centerline (Giordana et al. 2005). The graft-to-host diameter ratio (DR) has also been identified as an important parameter. In a numerical study of several geometric factors, including DR, surface irregularities, local variations in graft and host diameter, out-of-plane graft curvature, and the presence of a graft hood, Moore et al. (1999) identified DR as the primary parameter governing WSS magnitude and distribution. Their study featured an anatomically realistic model of a 5 mm graft attached to a 3 mm host artery. They found the WSS distribution to be more influenced by changing to a 3 mm graft than by eliminating the hood or nonplanar deflection of the graft, which was approximately 45 degrees out of the bifurcation plane. In a bilateral in vivo study involving 12 grafts, Keynton et al. (2001) examined the influence of graft-to-host diameter ratios DR=1.5 versus DR=1. While there was correlation between DR and IH formation near the graft toe, the majority of IH developed on the floor and was not correlated with DR. Indeed, 92% of the IH occurred at WSRs less than half of the native-artery value, and IH was more strongly correlated with regions of flow reversal than with OSI. In this study, the POS was occluded, and all of the IH on the arterial flow was proximal to the graft toe. Flow pulsatility can significantly alter the instantaneous flow pattern especially during flow acceleration and deceleration near systole. Under pulsatile conditions, one can have regions of reversed flow near boundaries (Stokes’ second problem) that instantaneously appear to be separation zones. WSS conditions might not be markedly different under separation and reversal; the biological responses, however, could be rather different for the two cases. In the model shown in Figure 6, Loth et al. (1997, 2002) found that steady and pulsatile flows of the same mean
13
Reynolds numbers produced similar mean WSS distributions. In a comparison between coronary and femoral artery waveforms, Ethier et al. (1998) found the mean WSS for the two waveforms to be only moderately dissimilar. The temporal and spatial gradients of WSS on the floor of the graft were, however, much larger for the femoral waveform.
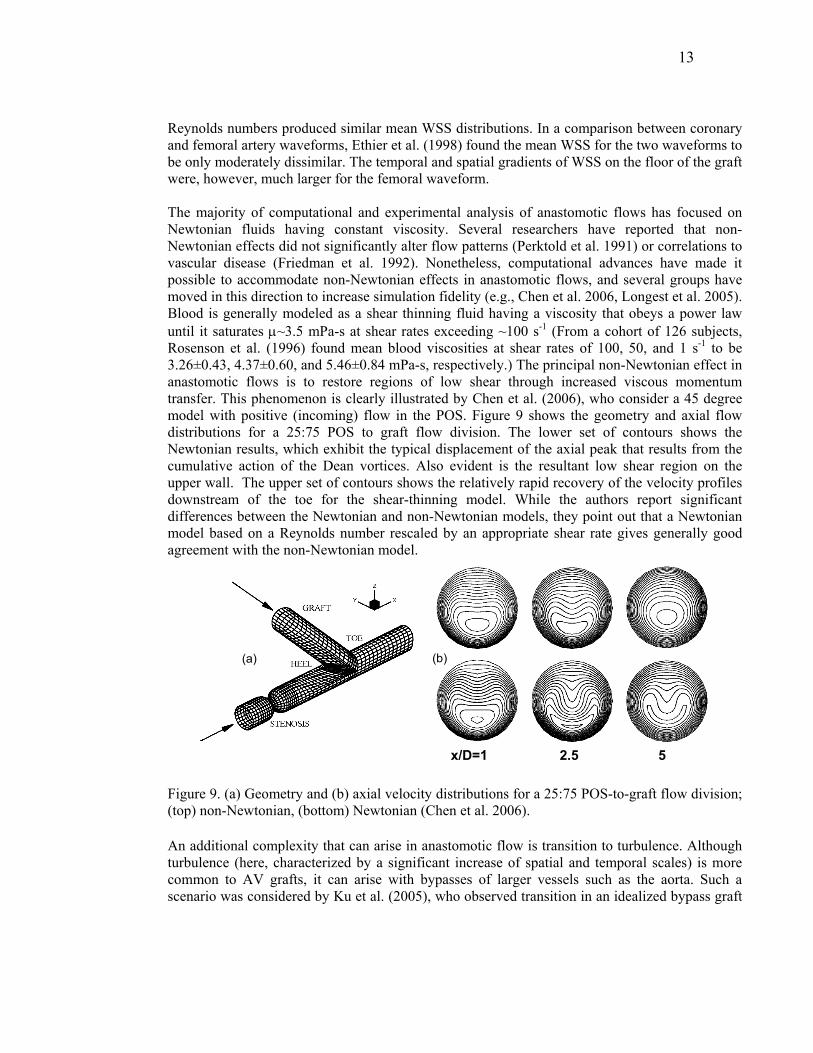
The majority of computational and experimental analysis of anastomotic flows has focused on Newtonian fluids having constant viscosity. Several researchers have reported that non-Newtonian effects did not significantly alter flow patterns (Perktold et al. 1991) or correlations to vascular disease (Friedman et al. 1992). Nonetheless, computational advances have made it possible to accommodate non-Newtonian effects in anastomotic flows, and several groups have moved in this direction to increase simulation fidelity (e.g., Chen et al. 2006, Longest et al. 2005). Blood is generally modeled as a shear thinning fluid having a viscosity that obeys a power law until it saturates µ~3.5 mPa-s at shear rates exceeding ~100 s-1 (From a cohort of 126 subjects, Rosenson et al. (1996) found mean blood viscosities at shear rates of 100, 50, and 1 s-1 to be 3.26±0.43, 4.37±0.60, and 5.46±0.84 mPa-s, respectively.) The principal non-Newtonian effect in anastomotic flows is to restore regions of low shear through increased viscous momentum transfer. This phenomenon is clearly illustrated by Chen et al. (2006), who consider a 45 degree model with positive (incoming) flow in the POS. Figure 9 shows the geometry and axial flow distributions for a 25:75 POS to graft flow division. The lower set of contours shows the Newtonian results, which exhibit the typical displacement of the axial peak that results from the cumulative action of the Dean vortices. Also evident is the resultant low shear region on the upper wall. The upper set of contours shows the relatively rapid recovery of the velocity profiles downstream of the toe for the shear-thinning model. While the authors report significant differences between the Newtonian and non-Newtonian models, they point out that a Newtonian model based on a Reynolds number rescaled by an appropriate shear rate gives generally good agreement with the non-Newtonian model.
x/D=1 2.5 5
(b)(a)
Figure 9. (a) Geometry and (b) axial velocity distributions for a 25:75 POS-to-graft flow division; (top) non-Newtonian, (bottom) Newtonian (Chen et al. 2006).
An additional complexity that can arise in anastomotic flow is transition to turbulence. Although turbulence (here, characterized by a significant increase of spatial and temporal scales) is more common to AV grafts, it can arise with bypasses of larger vessels such as the aorta. Such a scenario was considered by Ku et al. (2005), who observed transition in an idealized bypass graft
14
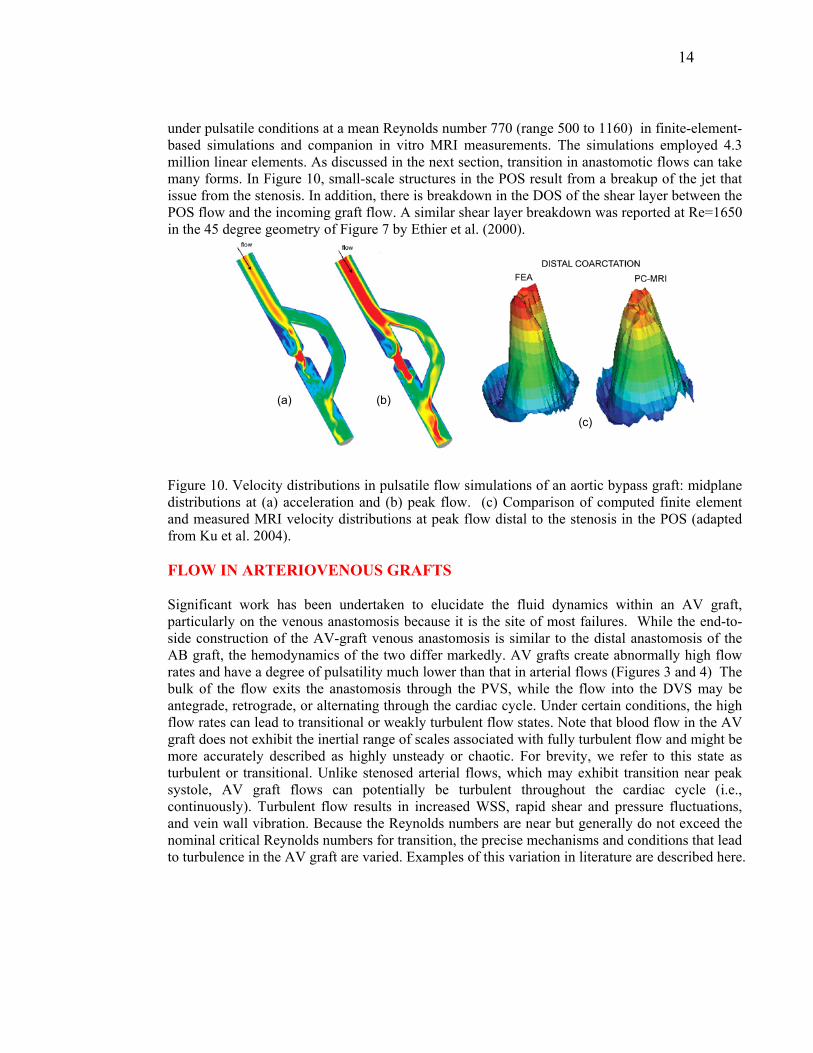
under pulsatile conditions at a mean Reynolds number 770 (range 500 to 1160) in finite-element-based simulations and companion in vitro MRI measurements. The simulations employed 4.3 million linear elements. As discussed in the next section, transition in anastomotic flows can take many forms. In Figure 10, small-scale structures in the POS result from a breakup of the jet that issue from the stenosis. In addition, there is breakdown in the DOS of the shear layer between the POS flow and the incoming graft flow. A similar shear layer breakdown was reported at Re=1650 in the 45 degree geometry of Figure 7 by Ethier et al. (2000).
(c)
(a) (b)
Figure 10. Velocity distributions in pulsatile flow simulations of an aortic bypass graft: midplane distributions at (a) acceleration and (b) peak flow. (c) Comparison of computed finite element and measured MRI velocity distributions at peak flow distal to the stenosis in the POS (adapted from Ku et al. 2004). FLOW IN ARTERIOVENOUS GRAFTS Significant work has been undertaken to elucidate the fluid dynamics within an AV graft, particularly on the venous anastomosis because it is the site of most failures. While the end-to-side construction of the AV-graft venous anastomosis is similar to the distal anastomosis of the AB graft, the hemodynamics of the two differ markedly. AV grafts create abnormally high flow rates and have a degree of pulsatility much lower than that in arterial flows (Figures 3 and 4) The bulk of the flow exits the anastomosis through the PVS, while the flow into the DVS may be antegrade, retrograde, or alternating through the cardiac cycle. Under certain conditions, the high flow rates can lead to transitional or weakly turbulent flow states. Note that blood flow in the AV graft does not exhibit the inertial range of scales associated with fully turbulent flow and might be more accurately described as highly unsteady or chaotic. For brevity, we refer to this state as turbulent or transitional. Unlike stenosed arterial flows, which may exhibit transition near peak systole, AV graft flows can potentially be turbulent throughout the cardiac cycle (i.e., continuously). Turbulent flow results in increased WSS, rapid shear and pressure fluctuations, and vein wall vibration. Because the Reynolds numbers are near but generally do not exceed the nominal critical Reynolds numbers for transition, the precise mechanisms and conditions that lead to turbulence in the AV graft are varied. Examples of this variation in literature are described here.
15
Early studies by Shu et al. (1987) were carried out with a compliant AV loop graft model under pulsatile flow conditions over a Reynolds number range of Re=640-960. At this Reynolds number, flow separation, helical secondary flow patterns, and regions of oscillatory flow identified with flow visualization were not markedly different from those in arterial grafts. There was a small amount of retrograde flow in the DVS but no mention of turbulence. However, in a follow-up study in the same flow rig but under slightly different flow conditions, Shu and Hwang (1988) reported a 100 Hz pressure fluctuation and palpable thrill at the venous anastomosis. Using flow visualization with a dye injection technique, Crawshaw et al. (1980) found flow disturbance in plastic models with inlet angles of 15 and 45 degrees. They showed that flow disturbances were lowest when the inlet angle was small and the DVS was occluded. Hughes and How (1996) visualized flow structures using in vitro models with different anastomosis angles and flow divisions under steady and pulsatile flow conditions. They, too, did not observe any unsteadiness when the DVS was occluded. When approximately one-third of the inlet flow passed upstream into the DVS, however, particles in the PVS were observed to fluctuate radially at Re = 630. Experiments and simulations by Ethier et al. (2000) demonstrated unsteadiness at Re=1650, but not at Re = 1100, in the idealized geometry of Figure 7 with an occluded DVS.
White et al. (1993) examined the effects of Reynolds number (200, 650, 1000) and PVS:DVS flow division (100:0, 80:20, 50:50, 0:100) in two different graft models with two different hood lengths (4D and 8D) and a DR~1. These models were different from that in Figures 6 and 7 in that the cross-sectional area increased greatly upon entry to the anastomosis due to enlargement of the lateral walls of the anastomosis. They found no unsteadiness in the cases considered for both models under steady flow conditions. In the geometry shown in Figure 6, Loth et al. (2003) reported transitional flow at Re=1820. In this case, 11% of the flow came from the DVS flow, resulting in RePVS=3232 in the PVS. Laser Doppler anemometry (LDA) measurements and corresponding simulation results showed good agreement for mean and rms velocity distributions in the symmetry plane, and transition was attributed to hairpin vortex formation and growth in the separated region distal to the toe. At Re=1060 (RePVS=1882), LDA measurements indicated small fluctuations distal to the toe, while the numerical results indicated steady flow.
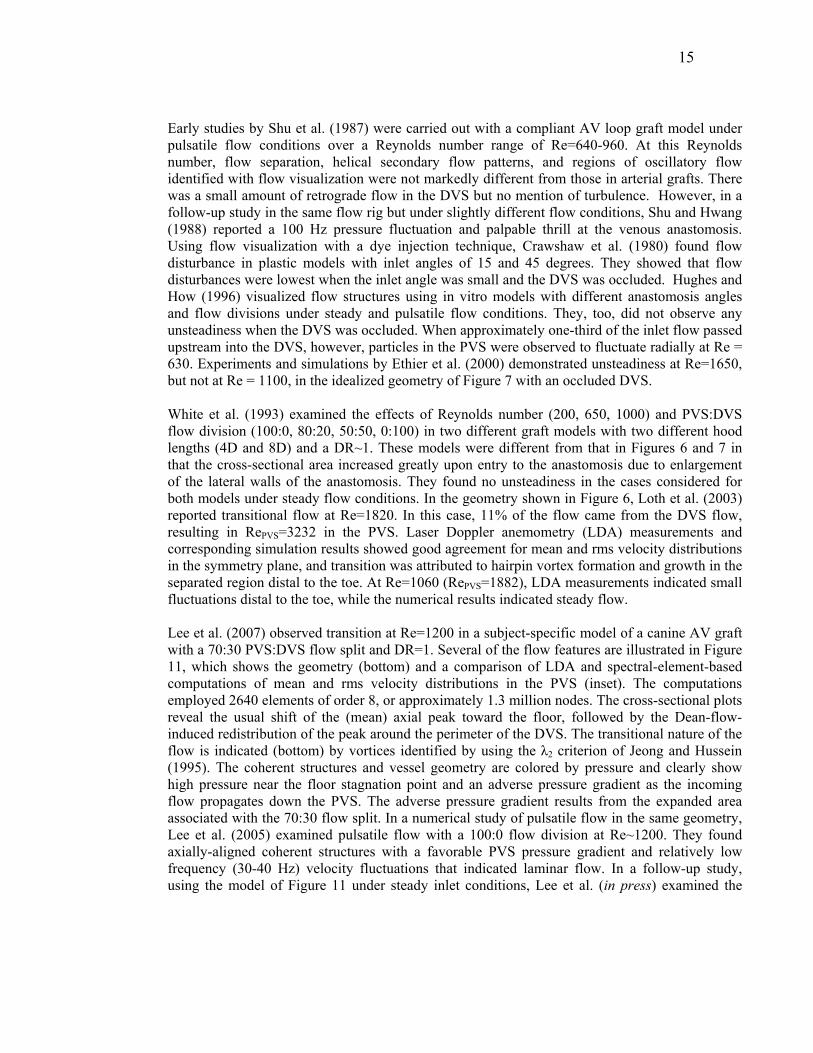
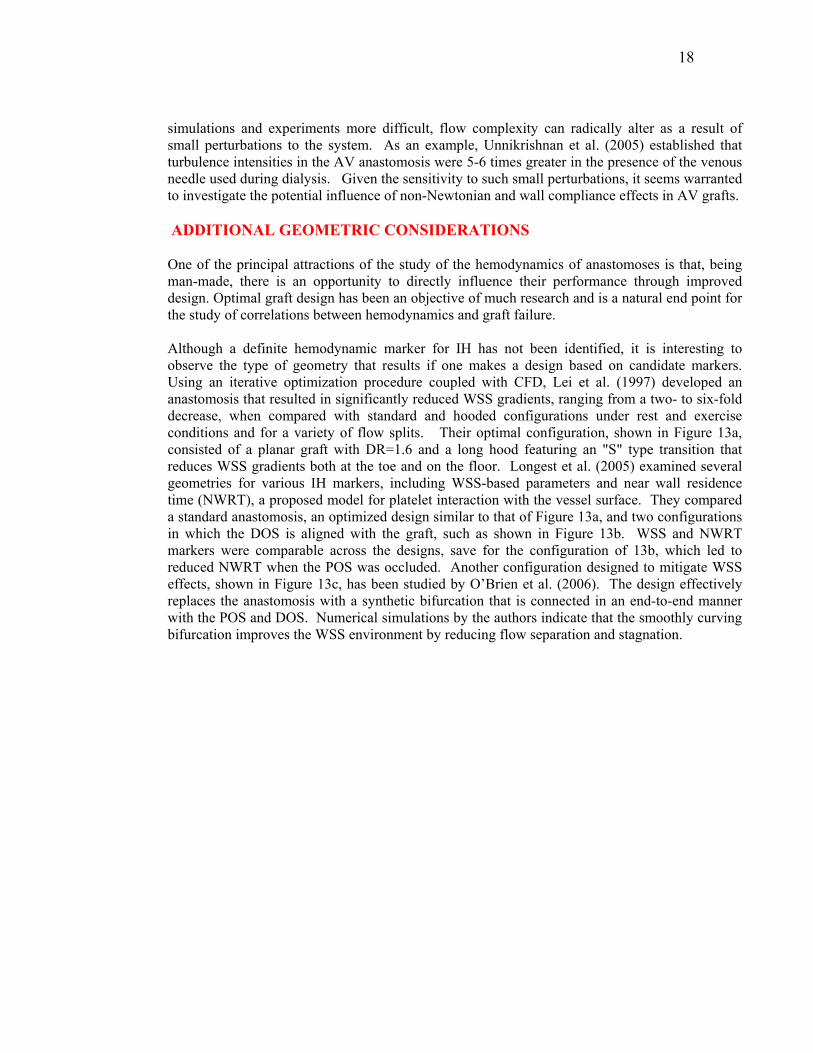
Lee et al. (2007) observed transition at Re=1200 in a subject-specific model of a canine AV graft with a 70:30 PVS:DVS flow split and DR=1. Several of the flow features are illustrated in Figure 11, which shows the geometry (bottom) and a comparison of LDA and spectral-element-based computations of mean and rms velocity distributions in the PVS (inset). The computations employed 2640 elements of order 8, or approximately 1.3 million nodes. The cross-sectional plots reveal the usual shift of the (mean) axial peak toward the floor, followed by the Dean-flow-induced redistribution of the peak around the perimeter of the DVS. The transitional nature of the flow is indicated (bottom) by vortices identified by using the λ2 criterion of Jeong and Hussein (1995). The coherent structures and vessel geometry are colored by pressure and clearly show high pressure near the floor stagnation point and an adverse pressure gradient as the incoming flow propagates down the PVS. The adverse pressure gradient results from the expanded area associated with the 70:30 flow split. In a numerical study of pulsatile flow in the same geometry, Lee et al. (2005) examined pulsatile flow with a 100:0 flow division at Re~1200. They found axially-aligned coherent structures with a favorable PVS pressure gradient and relatively low frequency (30-40 Hz) velocity fluctuations that indicated laminar flow. In a follow-up study, using the model of Figure 11 under steady inlet conditions, Lee et al. (in press) examined the
16
relative importance of flow division and Reynolds number on transition. The results are summarized in Figure 12, which shows rms axial velocity distributions at 3.3 diameters proximal to the toe. While some unsteadiness is indicated for the 100:0 case at Re=1400, it is much weaker than that found for the Re=1000, 85:15 case and for the Re=800, 70:30 case. The findings are striking when one considers that the PVS Reynolds number for the latter case is only RePVS = 560.
Figure 11. Flow in an AV graft at Re=1200 with a 70:30 (PVS:DVS) flow split: (bottom) numerically computed coherent structures and corresponding pressure map; (top) numerical (CFD) versus experimental (LDA) cross-sectional mean and rms velocity distributions (m/s) at x/D = 1.34 (A), 2.34 (B), and 3.34 (C) from Lee et al. (2007).

17
Figure 12. Distribution of the rms of the axial velocity component at one cross-section and in the plane of the bifurcation at Reynolds numbers 800, 1000, 1200, and 1400 and flow division values of 100:0, 85:15, and 70:30 from Lee et al. (in press). It is noteworthy that transition in the model of Figures 11 and 12 is sensitive to flow division at relatively low Reynolds numbers, while transition in the model of Figure 6 was found only at elevated Reynolds numbers (Loth et al. 2003). In addition, the models examined by White et al. (1993) proved to be insensitive to extreme variations of flow division at Reynolds numbers up to 1000. The difference can be explained by the underlying transition mechanisms. Loth et al. (2003) observed transition in the form of hairpin vortex formation resulting from destabilization of the curved shear layer bounding the separated region proximal to the toe, which is a classic high-speed flow transition process. By contrast, transition in Figures 11 and 12 is induced by an adverse pressure gradient; when there is significant DVS flow, the mean velocity in the PVS is reduced. The model geometry examined by White et al. (1993) had a smooth geometrical transition from the graft to DOS and POS and increased cross-sectional area in the anastomosis due to 40% increase in the dimension between the side (lateral) walls of the anastomosis. Thus, flow exiting the enlarged anastomosis has a favorable pressure gradient for all flow divisions because the PVS and DVS combined cross-section area is less than that of the anastomotic region. Additionally, these geometry of these models was far smoother at the graft toe that the geometries in Figures 6, 7, and 11. Thus, while flow division and Reynolds number play an important role in determining if transition will occur, the importance of geometry cannot be neglected. It is clear from the preceding discussion that the transitional nature of AV graft hemodynamics complicates the analysis of its relationship to IT and ultimate graft failure. Not only are
18
simulations and experiments more difficult, flow complexity can radically alter as a result of small perturbations to the system. As an example, Unnikrishnan et al. (2005) established that turbulence intensities in the AV anastomosis were 5-6 times greater in the presence of the venous needle used during dialysis. Given the sensitivity to such small perturbations, it seems warranted to investigate the potential influence of non-Newtonian and wall compliance effects in AV grafts. ADDITIONAL GEOMETRIC CONSIDERATIONS One of the principal attractions of the study of the hemodynamics of anastomoses is that, being man-made, there is an opportunity to directly influence their performance through improved design. Optimal graft design has been an objective of much research and is a natural end point for the study of correlations between hemodynamics and graft failure. Although a definite hemodynamic marker for IH has not been identified, it is interesting to observe the type of geometry that results if one makes a design based on candidate markers. Using an iterative optimization procedure coupled with CFD, Lei et al. (1997) developed an anastomosis that resulted in significantly reduced WSS gradients, ranging from a two- to six-fold decrease, when compared with standard and hooded configurations under rest and exercise conditions and for a variety of flow splits. Their optimal configuration, shown in Figure 13a, consisted of a planar graft with DR=1.6 and a long hood featuring an "S" type transition that reduces WSS gradients both at the toe and on the floor. Longest et al. (2005) examined several geometries for various IH markers, including WSS-based parameters and near wall residence time (NWRT), a proposed model for platelet interaction with the vessel surface. They compared a standard anastomosis, an optimized design similar to that of Figure 13a, and two configurations in which the DOS is aligned with the graft, such as shown in Figure 13b. WSS and NWRT markers were comparable across the designs, save for the configuration of 13b, which led to reduced NWRT when the POS was occluded. Another configuration designed to mitigate WSS effects, shown in Figure 13c, has been studied by O’Brien et al. (2006). The design effectively replaces the anastomosis with a synthetic bifurcation that is connected in an end-to-end manner with the POS and DOS. Numerical simulations by the authors indicate that the smoothly curving bifurcation improves the WSS environment by reducing flow separation and stagnation.

19
(c)
(a)
(b)
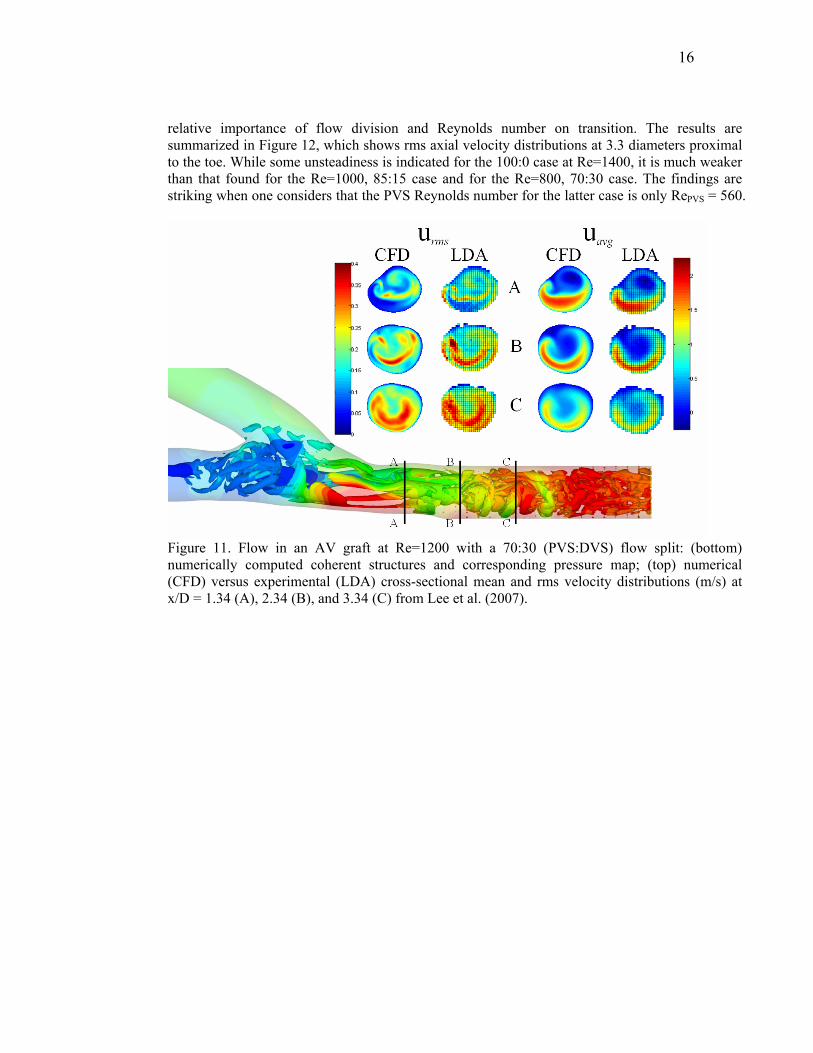
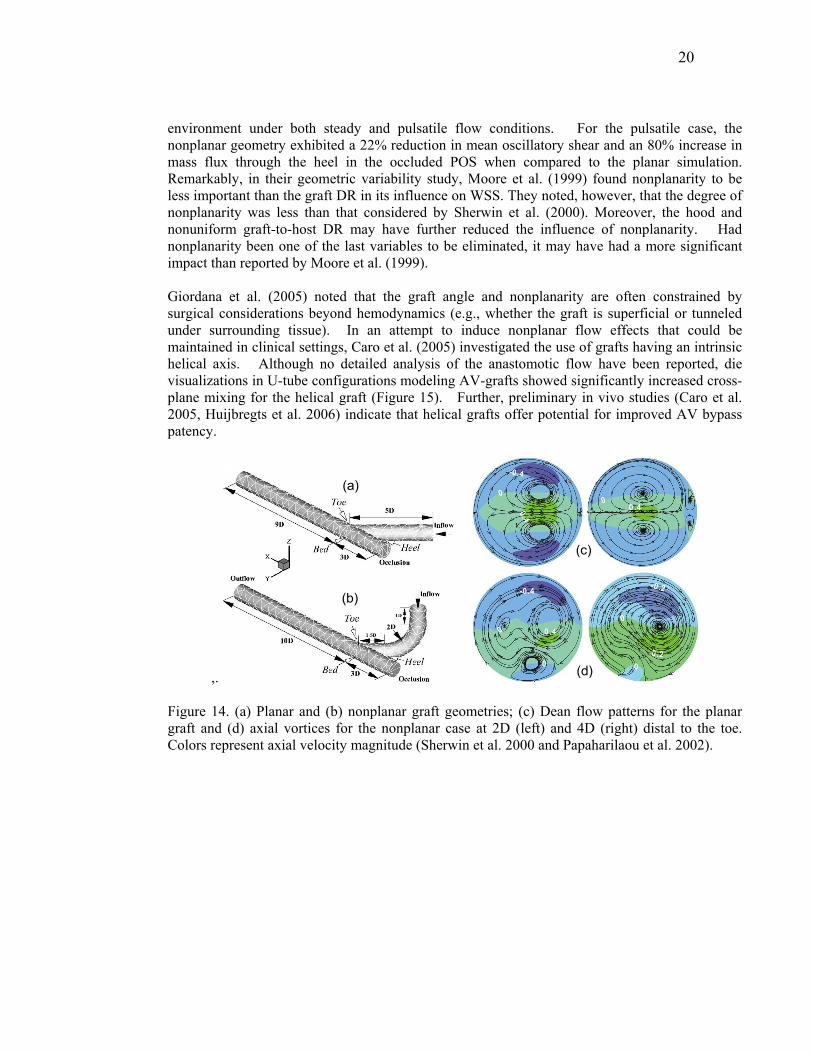
Figure 13 (a) Optimized geometry from Lei et al. (1997) to reduce regions of high WSSG; (b) streamlined AB graft from Longest et al. (2005); (c) novel AB graft configuration designed to reduce stagnation and separation zones (O’Brien et al. 2006). Improved anastomosis design must of course take into account practical issues such as surgical construction. Grafts often feature an extended patch or cuff that effectively provides a hood to ease the flow transition from the graft to the host (Liu et al. 2006). Leuprecht et al. (2002) simulated the fluid and structural responses of anatomically realistic anastomoses. Stagnation-point migration was reduced by the presence of the cuff, which is consistent with the findings of Moore et al. (1999), who found a similar behavior when the DR was increased from 1 to 1.6. Remarkably, Leuprecht et al. (2002) report that WSS markers computed using distensible walls did not qualitatively differ from companion rigid-wall computations. The distensible wall simulations, however, did indicate increased transmural stresses in regions of compliance mismatch (i.e., at the synthetic graft-vein interface), which has been suggested as a cause for IT formation at the suture line (Bassiouny et al. 1992). The preceding discussion has focused on graft configurations that are essentially planar. Though less studied, the prevalence of nonplanarity in blood vessels and its importance on hemodynamics have long been recognized (Caro et al. 1996, Jones et al.1997). The general observations are that out-of-plane curvature may lead to an improved hemodynamic environment that promotes flow mixing and reduces stagnation flow (low shear) regions. Detailed studies of an idealized end-to-side geometry featuring a nonplanar graft were reported for both steady and pulsatile inlet conditions by Sherwin et al. (2000) and Papaharilaou et al. (2002), respectively. The geometry, shown in Figure 14b, is essentially the idealized 45 degree configuration of Figure 7, save that the graft features a 90 degree out-of-plane bend just upstream of the stenosis. The principal effect of nonplanarity is to introduce swirl in the host vessel. The bilaterally symmetric Dean vortices are replaced by a dominant vortex that spirals through the DOS and surrounded by one or two smaller vortices (Figure 14d). The numerical simulations, which were validated by detailed MRI measurements, showed an improved hemodynamic
20
environment under both steady and pulsatile flow conditions. For the pulsatile case, the nonplanar geometry exhibited a 22% reduction in mean oscillatory shear and an 80% increase in mass flux through the heel in the occluded POS when compared to the planar simulation. Remarkably, in their geometric variability study, Moore et al. (1999) found nonplanarity to be less important than the graft DR in its influence on WSS. They noted, however, that the degree of nonplanarity was less than that considered by Sherwin et al. (2000). Moreover, the hood and nonuniform graft-to-host DR may have further reduced the influence of nonplanarity. Had nonplanarity been one of the last variables to be eliminated, it may have had a more significant impact than reported by Moore et al. (1999). Giordana et al. (2005) noted that the graft angle and nonplanarity are often constrained by surgical considerations beyond hemodynamics (e.g., whether the graft is superficial or tunneled under surrounding tissue). In an attempt to induce nonplanar flow effects that could be maintained in clinical settings, Caro et al. (2005) investigated the use of grafts having an intrinsic helical axis. Although no detailed analysis of the anastomotic flow have been reported, die visualizations in U-tube configurations modeling AV-grafts showed significantly increased cross-plane mixing for the helical graft (Figure 15). Further, preliminary in vivo studies (Caro et al. 2005, Huijbregts et al. 2006) indicate that helical grafts offer potential for improved AV bypass patency.
,.
(b)
(a)
(d)
(c)
Figure 14. (a) Planar and (b) nonplanar graft geometries; (c) Dean flow patterns for the planar graft and (d) axial vortices for the nonplanar case at 2D (left) and 4D (right) distal to the toe. Colors represent axial velocity magnitude (Sherwin et al. 2000 and Papaharilaou et al. 2002).

21
Figure 15. Mixing visualization by bolus injection into water flowing (Re=550) in U-tubes (a) a conventional tube; and (b) a helical-shaped tube (amplitude ratio and pitch 0.5D and 6D, respectively) shows much greater mixing after curve for the helical-shaped tube.
SUMMARY AND CONCLUSIONS The flow patterns of end-to-side anastomoses have been described in general and the importance of various geometry changes such as graft-to-host diameter, graft angle, and lack of planarity have been discussed. Reynolds number and flow division, parameters largely controlled by peripheral resistance, have also been shown to play an important role in anastomotic flow dynamics and in transition to turbulence in particular. The differences between AB and AV graft flow dynamics are significant with laminar flows in AB grafts and turbulent flows in AV grafts. Thus, the hemodynamic environment that induces IH may be significantly different in each case. Many of the studies considered herein presented combined CFD and experimental validation data under both laminar (Steinman et al. 1996, Ethier et al. 2000, Lei et al. 2001, Sherwin et al. 2000, Papaharilaou et al. 2002, Taylor and Draney 2004) and weakly turbulent (Loth et al. 2003, Ku et al. 2005, Lee et al. 2007) flow conditions. The level of validation is noteworthy and demonstrates that CFD simulations can faithfully capture the physics of in vitro models and provide more information than experiments alone. The current pace of computational advances and sophistication ensures that carefully conducted numerical simulations will play an important role in future investigations of biological response to hemodynamics. The addition of compliance and non-Newtonian behavior to CFD codes will require additional validation. However, this may present significant challenges since well controlled experiments with compliance and a non-Newtonian fluid may be difficult. The greatest challenge for this field at present is to acquire the spatial distribution of IT in AB or AV grafts. While many studies have been conducted to examine the relationship between hemodynamics and IT, few have presented quantitative correlation between the spatial distribution of both anastomotic IT and measured/simulated hemodynamic parameters (i.e. WSS or tissue vibration). All of these controlled studies were conducted on an animal model where IT was measured at the time of sacrifice (Rittgers et al.
22
1978, Fillinger et al. 1989, Fillinger et al. 1990, Keynton et al. 2001, Loth et al. 2002). In addition, the spatial IT distributions from two from these studies were significantly different in that floor IT was absent from one study (Loth et al. 2002) and present in the other (Keynton et al. 2001). This is not entirely surprising as there were several differences between the two studies (flow conditions, geometry, measurement techniques). Nonetheless, it is clear that further studies quantifying IT distribution are necessary before one can accurately predict the performance of novel graft designs. The accuracy of future simulations is dependent on the acquisition of patient- or subject-specific in vivo conditions such as geometry, flow conditions, blood rheology, and elastic properties of the vessel and surrounding tissue. It would be best to have this information at time intervals such that the geometrical changes can be accessed to provide measurements of the spatial distribution of IT in vivo as it changes with time in addition to hemodynamic changes. This would greatly improve the accuracy of the simulations that provide the distribution of hemodynamic variables in the controlled animal studies. In addition, if measurements could be conducted safely on humans with AB and AV grafts such as with MRI, the biological measurements would be significantly more relevant. Medical imaging technology is improving at a torrid pace, and geometry and flow measurements can already be acquired non-invasively with MRI as demonstrated by Giordana et al. (2005). However, animal studies might be still required to determine the intermediate steps between mechanotransduction and IT. As with any biological study, clinical trials with a large number of subjects would be necessary to obtain statistical significance. Fortunately, because of advances in medical imaging technology and CFD in the past decade the future looks bright for image-based CFD modeling (Steinman 2004). SUMMARY POINTS 1. Flow patterns within end-to-side anastomoses vary greatly depending on the geometry and flow
conditions. 2. While the geometry of AB and AV grafts are similar, the flow conditions can create markedly different
flow patterns. 3. Numerous researchers have shown that CFD simulations can faithfully capture the physics of in vitro
models. 4. The biomechanical environment created by blood flow patterns plays a role in the development of IT
in both AB and AV grafts however, further studies are necessary before anastomotic geometry can be optimized.
FUTURE ISSUES 1. The addition of compliance and non-Newtonian behavior to CFD codes will require additional
validation; however, experiments for this will likely be more difficult. 2. High-resolution measurements of anastomotic geometry and flow conditions in vivo at different time
points after anastomosis construction would allow for greater understanding of the relationship between hemodynamics and graft failure.
ACKNOWLEDGMENTS This work was supported National Institutes of Health, RO1 Research Project Grant (2RO1HL55296-04A2); the Mathematical, Information, and Computational Sciences Division subprogram of the Office of

23
Advanced Scientific Computing Research, Office of Science, U.S. Department of Energy, under Contract DE-AC02-06CH11357. We thank David Smith, Sang-Wook Lee, Bryn Martin, Harish Kanchi, and Gail Pieper for their help in preparing the manuscript and Dr. Susan McCormick for her help in describing mechanotransduction. LITERATURE CITED Bassiouny HS, White S, Glagov S, Choi E, Giddens DP, Zarins CK. 1992. Anastomotic intimal
hyperplasia: Mechanical injury or flow induced. J. Vasc. Surg. 15: 708,16; discussion 716-7 Binns RL, Ku DN, Stewart MT, Ansley JP, Coyle KA. 1989. Optimal graft diameter: Effect of wall shear
stress on vascular healing. J Vasc Surg. 10: 326-37 Caro CG, Doorly DJ, Tarnawski M, Scott KT, Long Q, Dumoulin CL. 1996. Non-planar curvature and
branching of arteries and non-planar-type flow. Proceedings of the Royal Society of London, Series A: Mathematical, Physical and Engineering Sciences. 452: 185-97
Caro CG, Cheshire NJ, Watkins N. 2005. Preliminary comparative study of small amplitude helical and conventional ePTFE arteriovenous shunts in pigs. J. R. Soc. Interface. 2: 261-6
Chen J, Lu X, Wang W. 2006. Non-newtonian effects of blood flow on hemodynamics in distal vascular graft anastomoses. Journal of Biomechanics. 39: 1983-95
Crawshaw HM, Quist WC, Serallach E, Valeri CR, LoGerfo FW. 1980. Flow disturbance at the distal end-to-side anastomosis. effect of patency of the proximal outflow segment and angle of anastomosis. Arch. Surg. 115: 1280-4
Davies PF. 1995. Flow-mediated endothelial mechanotransduction. Physiol Rev. 75: 519-60 DePaola N, Gimbrone, M. A. Jr, Davies PF, Dewey, C. F. Jr. 1992. Vascular endothelium responds to
fluid shear stress gradients. Arterioscler Thromb. 12: 1254-7 Duraiswamy N, Schoephoerster RT, Moreno MR, Moore Jr., James E. 2007. Stented artery flow
patterns and their effects on the artery wall. Annu. Rev. Fluid Mech. 39: 357-82 Echave V, Koornick AR, Haimov M, Jacobson JH,2nd. 1979. Intimal hyperplasia as a complication of
the use of the polytetrafluoroethylene graft for femoral-popliteal bypass. Surgery. 86: 791-8 Ethier RC, Prakash S, Steinman DA, Leask RL, Couch GG, Ojha M. 2000. Steady flow seperation
patterns in a 45 degree junction. J. Fluid Mech. 411: 1-38 Ethier CR, Steinman DA, Zhang X, Karpik SR, Ojha M. 1998. Flow waveform effects on end-to-side
anastomotic flow patterns. J. Biomech. 31: 609-17 Fillinger MF, Reinitz ER, Schwartz RA, Resetarits DE, Paskanik AM, et al. 1990. Graft geometry and
venous intimal-medial hyperplasia in arteriovenous loop grafts. J Vasc Surg. 11: 556-66 Fillinger MF, Reinitz ER, Schwartz RA, Resetarits DE, Paskanik AM, Bredenberg CE. 1989. Beneficial
effects of banding on venous intimal-medial hyperplasia in arteriovenous loop grafts. Am. J. Surg. 158: 87-94
Friedman SG. 1988. Alexis carrel: Jules verne of cardiovascular surgery. Am J Surg. 155: 420-4 Friedman MH, Bargeron CB, Duncan DD, Hutchins GM, Mark FF. 1992. Effects of arterial compliance
and non-newtonian rheology on correlations between intimal thickness and wall shear. J. Biomech. Eng. 114: 317-20
Giddens DP, Tang TD, Loth F. 1995. Fluid mechanics of arterial bifurcation. In Biological Flow, eds. MY Jaffrin, C Caro, 51-68. New York: Plenum Press
Giordana S, Sherwin SJ, Peiro J, Doorly DJ, Crane JS, et al. 2005. Local and global geometric influence on steady flow in distal anastomoses of peripheral bypass grafts. J. Biomech. Eng. 127: 1087-98
Glagov S, Giddens DP, Bassiouny H, Scott W, Zarins CK. 1991. Hemodynamic effects and tissue reactions at graft to vein anastmosis for vascular access. In Vascular Access for Hemodialysis - II, eds. BG Sommer, M Henry, 3-20. Precept Press Inc.
Grevious MA, Loth F, Jones SA, Arslan N, Curi MA, et al. 2003. Technical considerations in the construction of vascular anastomoses. In Biomedical Technology and Devices Handbook, eds. J Moore, G Zouridakis, 1-19. CRC Press
Gudi SR, Clark CB, Frangos JA. 1996. Fluid flow rapidly activates G proteins in human endothelial cells. involvement of G proteins in mechanochemical signal transduction. Circ Res. 79: 834-9
24
Haruguchi H, Teraoka S. 2003. Intimal hyperplasia and hemodynamic factors in arterial bypass and arteriovenous grafts: A review. J Artif Organs. 6: 227-35
Hughes PE, How TV. 1996. Effects of geometry and flow division on flow structures in models of the distal end-to-side anastomosis. J. Biomech. 29: 855-72
Huijbregts HJ, Blankestijn PJ, Caro CG, Cheshire NJ, Hoedt MT, et al. 2006. A helical PTFE arteriovenous access graft to swirl flow across the distal anastomosis: Results of a preliminary clinical study. Eur J Vasc Endovasc Surg. In Press: Corrected Proof
Imparato AM, Bracco A, Kim GE, Zeff R. 1972. Intimal and neointimal fibrous proliferation causing failure of arterial reconstructions. Surgery. 72: 1007-17
Jeong J, Hussain F. 1995. On the identification of a vortex. journal of fluid mechanics. 285: 69-94 Jones SA, Giddens DP, Loth F, Zarins CK, Kajiya F, et al. 1997. In-vivo measurements of blood flow
velocity profiles in canine ilio-femoral anastomotic bypass grafts. J. Biomech. Eng. 119: 30-8 Kamiya A, Togawa T. 1980. Adaptive regulation of wall shear stress to flow change in the canine
carotid artery. Am J Physiol. 139: H14-21 Kanterman RY, Vesely TM, Pilgram TK, Guy BW, Windus DW, Picus D. 1995. Dialysis access grafts:
Anatomic location of venous stenosis and results of angioplasty. Radiology. 195: 135-9 Keynton RS, Evancho MM, Sims RL, Rodway NV, Gobin A, Rittgers SE. 2001. Intimal hyperplasia and
wall shear in arterial bypass graft distal anastomoses: An in vivo model study. J. Biomech. Eng. 123: 464-73
Keynton RS, Rittgers SE, Shu MC. 1991. The effect of angle and flow rate upon hemodynamics in distal vascular graft anastomoses: An in vitro model study. J Biomech Eng. 113: 458-63
Kipshidze N, Dangas G, Tsapenko M, Moses J, Leon MB, et al. 2004. Role of the endothelium in modulating neointimal formation: Vasculoprotective approaches to attenuate restenosis after percutaneous coronary interventions. J Am Coll Cardiol. 44: 733-9
Kohler TR, Kirkman TR, Kraiss LW, Zierler BK, Clowes AW. 1991. Increased blood flow inhibits neointimal hyperplasia in endothelialized vascular grafts. Circ Res. 69: 1557-65
Ku DN, Giddens DP, Zarins CK, Glagov S. 1985. Pulsatile flow and atherosclerosis in the human carotid bifurcation. positive correlation between plaque location and low oscillating shear stress. Arteriosclerosis. 5: 293-302
Ku DN. 1997. Blood flow in arteries. Ann. Rev. Fluid Mech. 29: 399-434 Ku JP, Elkins CJ, Taylor CA. 2005. Comparison of CFD and MRI flow and velocities in an in vitro large
artery bypass graft model. Ann Biomed Eng. 33: 257-69 Lasheras JC. 2007. The biomechanics of arterial aneurysms. Annu. Rev. Fluid Mech. 39: 293-319 Lee S-, Fischer PF, Loth F, Royston TJ, Grogan JK, Bassiouny HS. 2005/8. Flow-induced vein-wall
vibration in an arteriovenous graft. Journal of Fluids and Structures. 20: 837-52 Lee S, Smith DS, Loth F, Fischer PF, Bassiouny HS. 2007. Numerical and experimental simulation of
transitional flow in a blood vessel junction. Numerical Heat Transfer. 51: 1-22 Lee S, Smith DS, Loth F, Fischer PF, Bassiouny HS. Importance of flow division on transition to
turbulence within an arteriovenous graft. Journal of Biomechanics. In Press, Corrected Proof: Lei M, Giddens DP, Jones SA, Loth F, Bassiouny H. 2001. Pulsatile flow in an end-to-side vascular graft
model: Comparison of computations with experimental data. J. Biomech. Eng. 123: 80-7 Lei M, Archie JP, Kleinstreuer C. 1997/4. Computational design of a bypass graft that minimizes wall
shear stress gradients in the region of the distal anastomosis. Journal of Vascular Surgery. 25: 637-46
Leuprecht A, Perktold K, Prosi M, Berk T, Trubel W, Schima H. 2002/2. Numerical study of hemodynamics and wall mechanics in distal end-to-side anastomoses of bypass grafts. J Biomech Eng. 35: 225-36
Liu YH, Hung YN, Hsieh HC, Ko PJ. 2006. Impact of cuffed, expanded polytetrafluoroethylene dialysis grafts on graft outlet stenosis. World J. Surg. 30: 2290-4
LoGerfo FW, Quist WC, Nowak MD, Crawshaw HM, Haudenschild CC. 1983. Downstream anastomotic hyperplasia. A mechanism of failure in dacron arterial grafts. Ann. Surg. 197: 479-83
Longest PW, Kleinstreuer C, Deanda A. 2005. Numerical simulation of wall shear stress and particle-based hemodynamic parameters in pre-cuffed and streamlined end-to-side anastomoses. Ann. Biomed. Eng. 33: 1752-66
25
Loth F, Fischer PF, Arslan N, Bertram CD, Lee SE, et al. 2003. Transitional flow at the venous anastomosis of an arteriovenous graft: Potential activation of the ERK1/2 mechanotransduction pathway. Transactions of the ASME. Journal of Biomechanical Engineering. 125: 49-61
Loth F, Jones SA, Giddens DP, Bassiouny HS, Glagov S, Zarins CK. 1997. Measurements of velocity and wall shear stress inside a PTFE vascular graft model under steady flow conditions. J. Biomech. Eng. 119: 187-94
Loth F, Jones SA, Zarins CK, Giddens DP, Nassar RF, et al. 2002. Relative contribution of wall shear stress and injury in experimental intimal thickening at PTFE end-to-side arterial anastomoses. J Biomech Eng. 124: 44-51
Migliavacca F, Dubini G. 2005. Computational modeling of vascular anastomoses. Biomech. Model. Mechanobiol. 3: 235-50
Moore JA, Steinman DA, Prakash S, Johnston KW, Ethier CR. 1999. A numerical study of blood flow patterns in anatomically realistic and simplified end-to-side anastomoses. J Biomech Eng. 121: 265-72
O'Brien T, Walsh M, McGloughlin T. 2006. Altering end-to-side anastomosis junction hemodynamics: The effects of flow-splitting. Med. Eng. Phys. 28: 727-33
Ojha M, Ethier CR, Johnston KW, Cobbold RS. 1990. Steady and pulsatile flow fields in an end-to-side arterial anastomosis model. J Vasc Surg. 12: 747-53
Papaharilaou Y, Doorly DJ, Sherwin SJ. 2002/9. The influence of out-of-plane geometry on pulsatile flow within a distal end-to-side anastomosis. Journal of Biomechanics. 35: 1225-39
Perktold K, Peter RO, Resch M, Langs G. 1991. Pulsatile non-newtonian blood flow in three-dimensional carotid bifurcation models. A numerical study of flow phenomena under different bifurcation angles. J. Biomed. Eng. 13: 507-15
Rittgers SE, Karayannacos PE, Guy JF, Nerem RM, Shaw GM, et al. 1978. Velocity distribution and intimal proliferation in autologous vein graft in dogs. Circulation. 42: 792-801
Rosenson RS, McCormick A, Uretz EF. 1996. Distribution of blood viscosity values and biochemical correlates in healthy adults. Clin. Chem. 42: 1189-95
Sherwin SJ, Shah O, Doorly DJ, Peiro J, Papaharilaou Y, et al. 2000. The influence of out of plane geometry on the flow within a distal-to-end anastomosis. J Biomech Eng. 122: 86-95
Shu MC, Hwang NH. 1988. Flow phenomena in compliant and noncompliant arteriovenous grafts. ASAIO Trans. 34: 519-23
Shu MC, Noon GP, Hwang NH. 1987. Phasic flow patterns at a hemodialysis venous anastomosis. Biorheology. 24: 711-22
Skalak R, Ozkaya N, Skalak TC. 1989. Biofluid mechanics. Ann. Rev. Fluid Mech. 21: 167-204 Sottiurai VS, Yao JS, Batson RC, Sue SL, Jones R, Nakamura YA. 1989. Distal anastomotic intimal
hyperplasia: Histopathologic character and biogenesis. Ann Vasc Surg. 3: 26-33 Steinman DA. 2004. Image-based computational fluid dynamics: A new paradigm for monitoring
hemodynamics and atherosclerosis. Curr Drug Targets Cardiovasc Haematol Disord. 24: 183-97 Steinman DA, Frayne R, Zhang X-, Rutt BK, Ethier CR. 1996/4. MR measurement and numerical
simulation of steady flow in an end-to-side anastomosis model. Journal of Biomechanics. 29: 537-42
Taylor CA, Darney MT. 2004. Experimental and computational methods in cardiovascular fluid mechanics. Ann. Rev. Fluid Mech. 36: 197-231
Taylor CA, Hughes TJR, Zarins CK. 1998/5/25. Finite element modeling of blood flow in arteries. Computer Methods in Applied Mechanics and Engineering. 158: 155-96
Tseng H, Peterson TE, Berk BC. 1995. Fluid shear stress stimulates mitogen-activated protein kinase in endothelial cells. Circ Res. 77: 869-78
Tzima E, Irani-Tehrani M, Kiosses WB, Dejana E, Schultz DA, et al. 2005. A mechanosensory complex that mediates the endothelial cell response to fluid shear stress. Nature. 7057: 426-31
Unnikrishnan S, Huynh TN, Brott BC, Ito Y, Cheng CH, et al. 2005. Turbulent flow evaluation of the venous needle during hemodialysis. J. Biomech. Eng. 127: 1141-6
Van Tricht I, De Wachter D, Tordoir J, Vanhercke D, Verdonck P. 2005. Experimental analysis of the hemodynamics in punctured vascular access grafts. ASAIO J. 51: 352-9

26
White SS, Zarins CK, Giddens DP, Bassiouny H, Loth F, et al. 1993. Hemodynamic patterns in two models of end-to-side vascular graft anastomoses: Effects of pulsatility, flow division, reynolds number, and hood length. J. Biomech. Eng. 115: 104-11
Zarins CK, Zatina MA, Giddens DP, Ku DN, Glagov S. 1987. Shear stress regulation of artery lumen diameter in experimental atherogenesis. J. Vasc. Surg. 5: 413-20