blomweb reference guide viewer reference...blomweb viewertm reference guide v5.7 r1.0a iii according...
TRANSCRIPT
Blom, ASA. Proprietary and Confidential
BlomWEB ViewerTM v5.7
Reference Guide
_____________________________
Audience: Blom partners, clients and developers
Date Blom Document
Jan 2013 BlomWEB Viewer Reference Guide v5.7 r1.0a.docx

BlomWEB ViewerTM
Reference Guide v5.7 r1.0a
i
Notices
Blom expressly retains all intellectual and other property rights with respect to this document and
all matters set forth herein.
Some technical assertions of capability included herein are estimates based on limited information
gathered from past experience.
The terms, conditions, specifications, and procedures described herein are subject to change in the
sole discretion of Blom, ASA and its affiliates. End-User is responsible for requesting and obtaining
the latest release of these terms, conditions, specifications, and procedures prior to any purchase
or deployment of the products described herein.
Confidentiality
This document and the information contained herein is the proprietary and confidential
information of Blom, ASA. It is provided under contract agreement, and may not be reproduced or
used for purposes outside the scope of such agreement.
Trademarks
Blom’s logo is a registered trademark of Blom, ASA in the Kingdom of Norway and other countries.
Other brands and their products are registered trademarks or trademarks of their respective
holders and should be noted as such.
Copyrights
2013, Blom, ASA All Rights Reserved

BlomWEB ViewerTM
Reference Guide v5.7 r1.0a
ii
Revision History
Document Number Issue Date Reason for Change
BW_RG_1010 Feb 18th , 2011 Original Document
BW_RG_2010 June 27th, 2011 Version 2.0 of the application.
o Reordering of some chapters
o New available URLs for accessing the tool
o Workspace and custom layer capabilities
o Additional tools for uploading shape file data and
customizing the look and feel of the application
o Export user-generated layers as shape files
o Imagery download functionalities availability according to
user permissions
o Integration with BlomURBEX POI contents
o New geocoding provider: Ubiest
o BlomSTREET™ data set added. Proof of concept on
integration and description of navigation.
BW_RG_2011 July 4th, 2011 English rewording
BW_RG_2020 July 7th, 2011 Hi-resolution download function added
BW_RG_2110 Aug 10th, 2011 Added Go-To button on shapefile selection screen
Collapsible categories in POIs
SHP attribute visible on screen (if DBF is provided)
BW_RG_3010 Oct 7th, 2011 Section 2.3 modified to include new geocoding provider and delete
the Decarta geocoding option
Section 3.1 modified to include selection of maps provider.
Section 3.5 modified to include new Demo Scenarios interface
Added section 3.6 to describe Routing capabilities
Section 4 modified to show the new Annotations interface
Section 5.7 modified to include new Vertical Area tool
Section 8.3 added to include new vector symbology editor
New chapter 10 added to describer BlomWEB LiDAR capabilites
Chapter 11 modified to describe measurement methodology on
BlomSTREET™ data.
New Chapter 12 added to describe the custom plug-in capabilities of
BlomWEB
BW_RG_3011 Nov 29th, 2011 Modified Section 2.1 to include the “Remember me” option in the
login page.
Modified Section 3.1.1 as map/geocoding providers may vary now
BlomWEB ViewerTM
Reference Guide v5.7 r1.0a
iii
according to credentials.
New demo scenarios added in Section 3.5.
Modified section 3.6 to redefine routing options.
Added Chapter 13 to include command-line (URL) parameters.
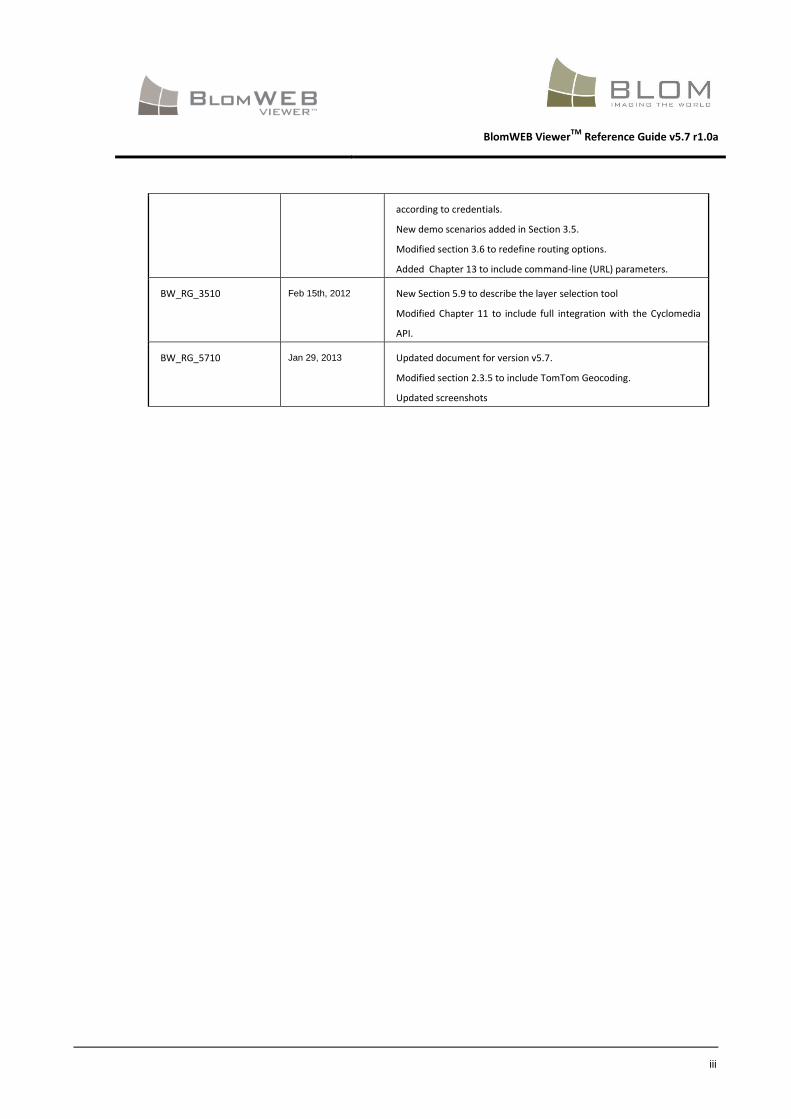
BW_RG_3510 Feb 15th, 2012 New Section 5.9 to describe the layer selection tool
Modified Chapter 11 to include full integration with the Cyclomedia
API.
BW_RG_5710 Jan 29, 2013 Updated document for version v5.7.
Modified section 2.3.5 to include TomTom Geocoding.
Updated screenshots
BlomWEB ViewerTM
Reference Guide v5.7 r1.0a
iv
Table of Contents
1 What is BlomWEB ViewerTM? ...................................................................................... 2
1.1 What is in this document? ........................................................................................ 3
1.2 Accessing BlomWEB ViewerTM .................................................................................. 3
1.3 Supported Platforms ................................................................................................. 3
1.4 Product history .......................................................................................................... 4
1.4.1 Version 1.0 (April 2011) ................................................................................................... 4
1.4.2 Version 2.0 (June 2011) ................................................................................................... 4
1.4.3 Version 3.0 (October 2011) ............................................................................................. 5
1.4.4 Version 3.1 (December 2011) .......................................................................................... 5
1.4.5 Version 3.5 (February 2012) ............................................................................................ 6
1.4.6 Version 5.7 (December 2012) .......................................................................................... 6
1.5 Document Organization ............................................................................................ 6
1.6 For more information................................................................................................ 6
2 BlomWEB ViewerTM Basic Features ............................................................................. 8
2.1 Accessing BlomWEB ViewerTM................................................................................... 8
2.2 BlomWEB ViewerTM Main Features .......................................................................... 9
2.3 Navigating through the Map Interface (2D mode) ................................................. 11
2.3.1 Panning the map ........................................................................................................... 11
2.3.2 Zooming in and out ....................................................................................................... 11
2.3.3 Switching views (ortho – oblique) ................................................................................. 12
2.3.4 Map Locator .................................................................................................................. 15
2.3.5 Searching for an address (geocoding) ........................................................................... 17
2.3.6 Searching by coordinates .............................................................................................. 19
2.3.7 Resizing the screen ........................................................................................................ 20
3 Advanced display and navigation tools ..................................................................... 21
3.1 Map View ................................................................................................................ 21
3.1.1 Selection of Map Provider ............................................................................................. 21
3.2 Hybrid view ............................................................................................................. 23
3.3 Multiview ................................................................................................................ 24
3.4 Display of external WMS services ........................................................................... 26
BlomWEB ViewerTM
Reference Guide v5.7 r1.0a
v
3.5 Demo Scenarios ...................................................................................................... 28
3.6 Routing .................................................................................................................... 31
3.6.1 Selecting a route calculation ......................................................................................... 31
3.6.2 Routing results............................................................................................................... 33
4 Annotation tools ...................................................................................................... 34
4.1 Drawing shapes ...................................................................................................... 34
4.1.1 Drawing points .............................................................................................................. 34
4.1.2 Drawing lines ................................................................................................................. 35
4.1.3 Drawing polygons .......................................................................................................... 36
4.2 Drawing text ........................................................................................................... 36
4.2.1 Drawing text .................................................................................................................. 37
4.3 Exporting annotations ............................................................................................ 37
5 Measurement Tools ................................................................................................. 38
5.1 Length and Length on the ground measurement ................................................... 38
5.2 Area Measurement ................................................................................................. 39
5.3 Bearing Measurement ............................................................................................ 40
5.4 Elevation Measurement .......................................................................................... 41
5.5 Height Measurement .............................................................................................. 41
5.6 Diagonal (Ladder) Measurement ............................................................................ 42
5.7 Vertical Area tool .................................................................................................... 43
5.8 Erase Button ........................................................................................................... 44
5.9 Multiple layers on screen ........................................................................................ 44
6 Map Tools ................................................................................................................ 45
6.1 High Resolution Download tool .............................................................................. 45
6.1.1 Downloading Ortho imagery ......................................................................................... 45
6.1.2 Downloading Oblique imagery ...................................................................................... 46
6.2 Screenshot tool ....................................................................................................... 46
6.3 Reverse Geocoding tool .......................................................................................... 46
6.4 Show Coordinates tool ............................................................................................ 46
6.5 Year Selection tool .................................................................................................. 47
6.5.1 Year selection and MultiView ........................................................................................ 48
BlomWEB ViewerTM
Reference Guide v5.7 r1.0a
vi
6.6 Oblique Selection tool ............................................................................................. 49
6.7 Image Layer Priority tool ........................................................................................ 50
6.8 Overlay Selection tool ............................................................................................. 51
6.9 Points of Interest (POIs) .......................................................................................... 52
7 Additional Tools ....................................................................................................... 54
7.1 Vector Files uploading............................................................................................. 54
7.2 Graphic Profiles Management ................................................................................ 56
7.2.1 Skin selection ................................................................................................................. 56
7.2.2 Changing the logo .......................................................................................................... 57
7.2.3 Selection of map provider ............................................................................................. 57
8 Workspaces and Custom Layers ................................................................................ 58
8.1 Workspaces ............................................................................................................. 58
8.1.1 Workspace Layers .......................................................................................................... 59
8.2 Custom layers ......................................................................................................... 59
8.3 Symbology Edition for Vector Layers ...................................................................... 61
9 BlomURBEX 3DTM View Controls ............................................................................... 62
9.1 Accessing the BlomURBEX 3DTM Viewer ................................................................. 62
9.2 Navigating through the 3D models ........................................................................ 63
9.2.1 Navigation Pad .............................................................................................................. 63
9.2.2 Mouse controls .............................................................................................................. 64
9.2.3 Keyboard controls ......................................................................................................... 64
9.3 Level of Detail (LOD) selection ................................................................................ 64
9.4 Edit Mode ................................................................................................................ 64
9.4.1 Changing textures in the building .................................................................................. 66
9.4.2 Adding new buildings .................................................................................................... 66
10 LiDAR Viewer ........................................................................................................... 67
10.1 Introduction ............................................................................................................ 67
10.2 Accessing LiDAR data .............................................................................................. 67
10.3 Navigating through the LiDAR models ................................................................... 68
10.4 Visualization options ............................................................................................... 68
10.4.1 True Colour .................................................................................................................... 69
BlomWEB ViewerTM
Reference Guide v5.7 r1.0a
vii
10.4.2 Classification-based colour ............................................................................................ 69
10.4.3 Height-based colour ...................................................................................................... 70
10.4.4 Height HSV colour .......................................................................................................... 70
11 BlomSTREET™ data................................................................................................... 71
11.1 Accessing BlomSTREET™ data ................................................................................ 72
11.2 BlomSTREET™ navigation ....................................................................................... 73
11.2.1 The map window ........................................................................................................... 73
11.2.2 The BlomSTREET™ window ........................................................................................... 75
11.3 Measurements on BlomSTREET™ data ................................................................... 75
11.3.1 A note on measurements on BlomSTREET™ data ......................................................... 76
11.3.2 Measuring Points ........................................................................................................... 77
11.3.3 Measuring Lines............................................................................................................. 78
11.3.4 Measuring Heights......................................................................................................... 80
11.3.5 Planar measurements.................................................................................................... 81
11.3.6 Volume measurements ................................................................................................. 81
11.3.7 Export measurements ................................................................................................... 82
11.3.8 Import measurements ................................................................................................... 82
11.3.9 Deleting measurements ................................................................................................ 82
11.4 Map Tools for BlomSTREET™ .................................................................................. 83
11.4.1 Export link ...................................................................................................................... 83
11.4.2 Save snapshot ................................................................................................................ 83
11.4.3 Printing BlomSTREET™ data .......................................................................................... 84
11.5 Reprojecting vector data on BlomSTREET™ ............................................................ 85
12 Custom Plug-ins ....................................................................................................... 86
12.1 Creating a Plug-in ................................................................................................... 86
12.2 Uploading a Plug-in to BlomWEB Viewer™ ............................................................ 86
13 Running BlomWEB Viewer™ from the command line ................................................ 88
13.1 Valid parameters .................................................................................................... 88
13.2 Examples ................................................................................................................. 88
BlomWEB ViewerTM
Reference Guide v5.7 r1.0a
viii
Table of Figures
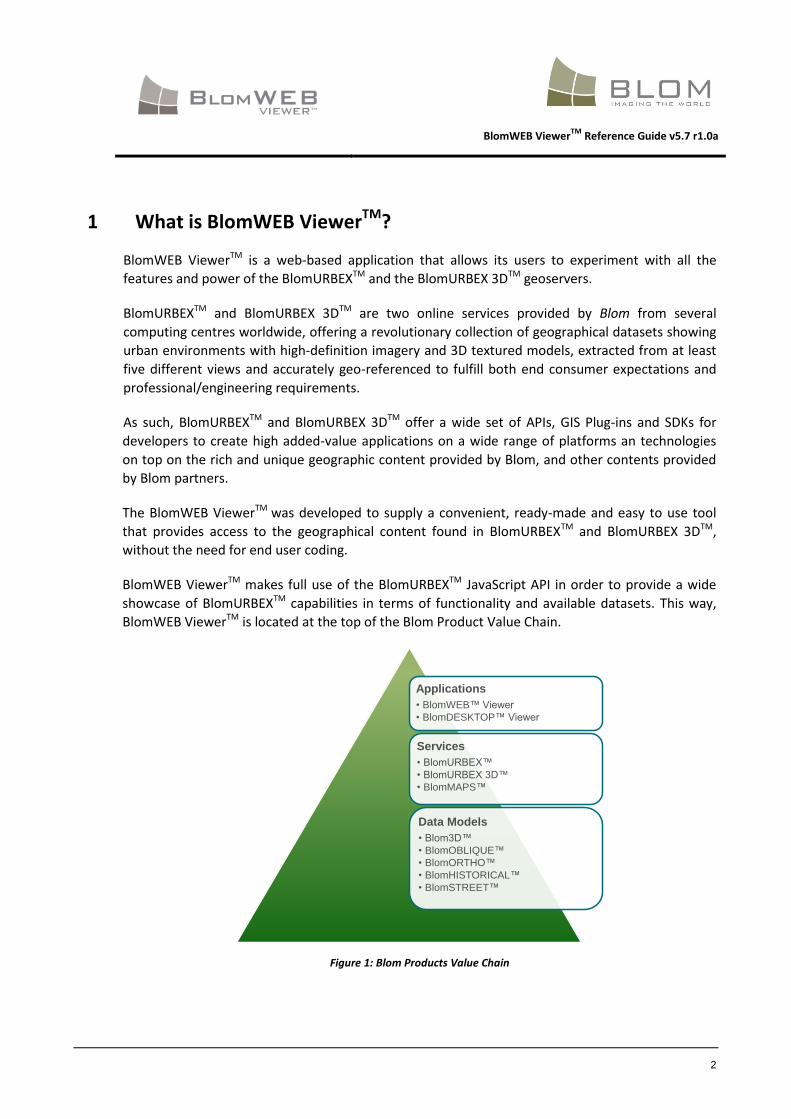
Figure 1: Blom Products Value Chain ..................................................................................... 2
Figure 2: Zoom in action ....................................................................................................... 11
Figure 3: Windowed zoom .................................................................................................... 12
Figure 4: Ortho View to be changed to North View ............................................................. 13
Figure 5: North View ............................................................................................................. 13
Figure 6: South View ............................................................................................................. 14
Figure 7: Natural Oblique Image ........................................................................................... 14
Figure 8: Orthorectified Oblique........................................................................................... 15
Figure 9: Map Locator Window ............................................................................................ 16
Figure 10: Map Locator in “Map” mode ............................................................................... 16
Figure 11: Geocoding Tool .................................................................................................... 17
Figure 12: OSM Geocoder Results ......................................................................................... 17
Figure 13: UbiEst Geocoding Interface ................................................................................. 18
Figure 14: OYM Geocoding Interface ................................................................................... 18
Figure 15: TomTom Geocoding Interface ............................................................................. 19
Figure 16: Coordinates Search .............................................................................................. 19
Figure 17: Hide Tools button ................................................................................................. 20
Figure 18: Additional Tools -> Manage Graphical Profiles ................................................... 21
Figure 19: Map Provider Selection ....................................................................................... 21
Figure 20: Changing to Map View ......................................................................................... 22
Figure 21: Map View ............................................................................................................. 22
Figure 22: Changing to Hybrid View ..................................................................................... 23
Figure 23: Hybrid View .......................................................................................................... 23
Figure 24: View selection control ......................................................................................... 24
Figure 25: Dual View screen with Map and North Oblique ................................................. 24
Figure 26: Multi View with Ortho and 4 Oblique Views ...................................................... 25
Figure 27: 3D Viewer ............................................................................................................. 25
Figure 28: Connect to WMS Server ....................................................................................... 26
Figure 29: WMS Server Selection.......................................................................................... 26
BlomWEB ViewerTM
Reference Guide v5.7 r1.0a
ix
Figure 30: WMS Service displayed on top of Blom Ortho .................................................... 26
Figure 31: Adding a new WMS server .................................................................................. 27
Figure 32: WMS Server Added to the list ............................................................................. 27
Figure 33: Selection of Demo Scenarios ............................................................................... 28
Figure 34: List of Demo Scenarios ......................................................................................... 28
Figure 35: Demo scenario. Rasterized LiDAR Data on the O2 Arena (London) ................... 29
Figure 36: Routing Interface. OYM ....................................................................................... 31
Figure 37: Routing Interface. UbiEst ..................................................................................... 31
Figure 38: Routing Interface. TomTom ................................................................................. 31
Figure 39: Routing options .................................................................................................... 33
Figure 40: Route Calculation ................................................................................................. 33
Figure 41: Annotations Tools ................................................................................................ 34
Figure 42: Annotation colour selection ................................................................................ 34
Figure 43: Drawing Points ..................................................................................................... 35
Figure 44: Drawing Lines ....................................................................................................... 35
Figure 45: Drawing Polygons ................................................................................................ 36
Figure 46: Drawing Text menu .............................................................................................. 36
Figure 47: Drawing texts ....................................................................................................... 37
Figure 48: Measurement Tools ............................................................................................. 38
Figure 49: Length Measurement ........................................................................................... 39
Figure 50: Area Measurement .............................................................................................. 40
Figure 51: Bearing Calculation .............................................................................................. 40
Figure 52: Elevation Measurement ...................................................................................... 41
Figure 53: Height Measurement ........................................................................................... 42
Figure 54: Diagonal Measurement Results .......................................................................... 42
Figure 55: Measuring façade area: Define baseline first… .................................................. 43
Figure 56: …Then continue defining the area ...................................................................... 43
Figure 57: … Finally, double click to get the measurement ................................................. 44
Figure 58: Layer selector ....................................................................................................... 44
Figure 59: Map Tools ............................................................................................................. 45
Figure 60: Year Selection Tool ............................................................................................... 47
BlomWEB ViewerTM
Reference Guide v5.7 r1.0a
x
Figure 61: Year Selection Tool, text mode ............................................................................ 47
Figure 62: Multiview with different imagery years ............................................................. 48
Figure 63: Oblique Views Selection....................................................................................... 49
Figure 64: Image Layer Priority ............................................................................................. 50
Figure 65: Street Layers Overlay selected over Oblique image ........................................... 51
Figure 66: POIs button .......................................................................................................... 52
Figure 67: POIs Window ........................................................................................................ 52
Figure 68: POI database displayed ....................................................................................... 53
Figure 69: Displaying POI information .................................................................................. 53
Figure 70: Additional tools .................................................................................................... 54
Figure 71: Accesing attribute information from vector layer .............................................. 55
Figure 72: Skin selection ....................................................................................................... 56
Figure 73: The new skin applied ........................................................................................... 56
Figure 74: Logo changed ....................................................................................................... 57
Figure 75: Workspace and Custom Layers button ............................................................... 58
Figure 76. Workspace and Custom Layers window ............................................................. 59
Figure 77: Overlays and Custom Layers ................................................................................ 60
Figure 78: Vector Layer Symbology Edition .......................................................................... 61
Figure 79: Vector Symbology changed ................................................................................. 61
Figure 80: 3D View ................................................................................................................ 62
Figure 81: 3D Navigation Pad ................................................................................................ 63
Figure 82: LOD Selection tool (LOD1, LOD2, LOD3, and LOD4) ............................................ 64
Figure 83: 3D Model Selected in the Viewer ........................................................................ 65
Figure 84: Texture Replacement ........................................................................................... 66
Figure 85: External 3D model dropped on the London 3D city model ................................ 66
Figure 86. LiDAR button ........................................................................................................ 67
Figure 87: Selecting the LiDAR area to visualize .................................................................. 68
Figure 88: LiDAR data in true color view .............................................................................. 69
Figure 89: LiDAR data in classification-based view .............................................................. 69
Figure 90: LiDAR data with height-based colour .................................................................. 70
Figure 91: LiDAR data with height HSV colour ..................................................................... 70
BlomWEB ViewerTM
Reference Guide v5.7 r1.0a
xi
Figure 92: Accessing BlomSTREET™ data ............................................................................. 72
Figure 93: BlomSTREET™ demo scenario ............................................................................. 73
Figure 94: The triangle rotates according to the BlomSTREET™ view ................................. 74
Figure 95: BlomSTREET™ mode with three opened BlomSTREET™ windows .................... 74
Figure 96: Date of the BlomSTREET™ image ........................................................................ 75
Figure 97: BlomSTREET™ Measurements Tools ................................................................... 75
Figure 98: Measurement principles (1) ................................................................................ 76
Figure 99: Measurement Principles (2) ................................................................................ 77
Figure 100: Point Measurement. Step 1 ............................................................................... 77
Figure 101: Point Measurement. Step 2 ............................................................................... 78
Figure 102: Line Measurement. Step 1 ................................................................................. 79
Figure 103: Line Measurement. Step 2 ................................................................................. 79
Figure 104: Line Measurement. Step 3. ................................................................................ 80
Figure 105: BlomSTREET™ Height Measurement ................................................................. 81
Figure 106: Map Tools for BlomSTREET™ data .................................................................... 83
Figure 107: Exporting BlomSTREET™ imagery ...................................................................... 84
Figure 108: BlomSTREET™ print options .............................................................................. 84
Figure 109: Vector data over BlomSTREET™ image ............................................................. 85
Figure 110: Plug-in tool ......................................................................................................... 86
Figure 111: Plugin upload window ....................................................................................... 87

BlomWEB ViewerTM
Reference Guide v5.7 r1.0a
1
SECTION 1
BlomWEB ViewerTM Overview
BlomWEB ViewerTM
Reference Guide v5.7 r1.0a
2
1 What is BlomWEB ViewerTM?
BlomWEB ViewerTM is a web-based application that allows its users to experiment with all the
features and power of the BlomURBEXTM and the BlomURBEX 3DTM geoservers.
BlomURBEXTM and BlomURBEX 3DTM are two online services provided by Blom from several
computing centres worldwide, offering a revolutionary collection of geographical datasets showing
urban environments with high-definition imagery and 3D textured models, extracted from at least
five different views and accurately geo-referenced to fulfill both end consumer expectations and
professional/engineering requirements.
As such, BlomURBEXTM and BlomURBEX 3DTM offer a wide set of APIs, GIS Plug-ins and SDKs for
developers to create high added-value applications on a wide range of platforms an technologies
on top on the rich and unique geographic content provided by Blom, and other contents provided
by Blom partners.
The BlomWEB ViewerTM was developed to supply a convenient, ready-made and easy to use tool
that provides access to the geographical content found in BlomURBEXTM and BlomURBEX 3DTM,
without the need for end user coding.
BlomWEB ViewerTM makes full use of the BlomURBEXTM JavaScript API in order to provide a wide
showcase of BlomURBEXTM capabilities in terms of functionality and available datasets. This way,
BlomWEB ViewerTM is located at the top of the Blom Product Value Chain.
Figure 1: Blom Products Value Chain
Applications
• BlomWEB™ Viewer
• BlomDESKTOP™ Viewer
Services
• BlomURBEX™
• BlomURBEX 3D™
• BlomMAPS™
Data Models
• Blom3D™
• BlomOBLIQUE™
• BlomORTHO™
• BlomHISTORICAL™
• BlomSTREET™
BlomWEB ViewerTM
Reference Guide v5.7 r1.0a
3
BlomWEB ViewerTM has been designed to cover two basic needs:
a) Provide a simple yet powerful way to showcase BlomURBEXTM and BlomURBEX 3DTM features to
Blom customers, and also be a demoing tool for the Blom Sales Force.
b) Provide a solid basic core for developers to create vertical web applications using the
BlomURBEXTM JavaScript API.
Future versions of BlomWEB ViewerTM will include additional tools and functionalities and will allow
for greater interface customization capabilities.
1.1 What is in this document?
This document is a reference guide for BlomWEB ViewerTM. It provides a simple but detailed user
manual covering all of its features.
1.2 Accessing BlomWEB ViewerTM
BlomWEB ViewerTM is an online application. It can be accessed from the following URLs1:
http://www.blomurbex.com
http://www.blomwebviewer.com
http://www.blomweb.com
Accessing BlomWEB ViewerTM requires the use of some valid credentials (user and password). The
current version of the tool does not support online creation of credentials, so contact your local
Sales Support representative to obtain a personal set of BlomWEB ViewerTM credentials.
1.3 Supported Platforms
BlomWEB ViewerTM runs on any JavaScript compatible web browser, whatever the operating
system. It has been tested and is supported in Internet Explorer (versions 7 to 9), Mozilla Firefox 3.6
and Google Chrome 8.
Some exceptions must be considered:
BlomURBEX 3DTM is supported only on Windows-based computers
To run BlomURBEX 3DTM viewer on Google Chrome you need to have Mozilla Firefox
installed as some components are shared.
1 The same URL was hosting the previous BlomURBEXTM demo viewer. This old viewer has been substituted with the BlomWEBTM app on
Feb.2011
BlomWEB ViewerTM
Reference Guide v5.7 r1.0a
4
Support for mobile phone web browsers in BlomWEB ViewerTM is limited. The user will be
redirected to a simplified viewer if any of the following strings are detected in the user-
agent:
Android | webOS | iPhone | iPad | iPod | BlackBerry | mobile
1.4 Product history
1.4.1 Version 1.0 (April 2011)
Since the release of the BlomURBEXTM service in 2008, a demo viewer has been available for
accessing the BlomURBEXTM contents. BlomWEB ViewerTM is an evolution of that demo viewer and
version 1.0 has the following new features:
o New Graphical User Interface (GUI)
o New measurement tools
o Blom Geocoding (direct and reverse)
o Coordinate display and coordinates search
o Baselayer control
o Date selection
o Overlay selections
o Display of vector data (Map View)
o Connection to external WMS servers
o Location Map included in the window
o Re-sizable map screen
o Dual and PentaView representation
o Launch of 3D viewer directly from the demo viewer
1.4.2 Version 2.0 (June 2011)
Version 2.0 includes the following new features
o Workspace capabilities allowing user to save and retrieve their configuration

BlomWEB ViewerTM
Reference Guide v5.7 r1.0a
5
o Uploading of vector data
o User storage area to save custom data layers
o Skin capabilities to customize the look and feel of the application
o Image download capabilities
o Export user-generated layers as shape files
o New geocoding provider: UbiEst
o Integration with the BlomURBEX™ POI rendering functions
o New data layer: BlomSTREET™, 360º high-resolution street imagery
1.4.3 Version 3.0 (October 2011)
Version 3.0 includes the following new features
o New geocoding provider added: On Your Maps (OYM).
o DeCarta geocoding service has been removed
o Routing: Routing capabilities added to BlomWEB Viewer™, from two different providers: Ubiest and OYM.
o Full integration of BlomSTREET™ data including measurement capabilities
o New measurement tool in Oblique Images: Vertical Area measurement
o Custom plugins upload ability providing developers with a new interface for customizing BlomWEB Viewer™.
o Map layer switch, providing the capability to select the street map provider between OYM or Ubiest
o Symbology editor for vector layers
o New annotations interface
o LiDAR viewer, allowing users to view and interact with LiDAR data online
1.4.4 Version 3.1 (December 2011)
o New DEMO SCENARIOS: BlomSTEREO and BlomMETRO
o DEMO SCENARIOS and GOOGLE do not appear by default on the user interface.
o The login screen has a REMEMBER ME check box.
o Routing allows to select SHORTEST/FASTEST routes
o Selection of geocoding/routing provider is remembered for future sessions
o Only those GEOCODING/ROUTING providers that the usertoken has permissions to will be showed.
o BlomWEB can be now executed with parameters in the command line:
BlomWEB ViewerTM
Reference Guide v5.7 r1.0a
6
1.4.5 Version 3.5 (February 2012)
o Full integration with the Cyclomedia API for BlomSTREET™ data
1.4.6 Version 5.7 (December 2012)
Version 5.7 includes the following new features
o New geocoding provider added: Open Street Maps (OSM).
o New geocoding and routing provider added: TomTom.
o New map provider: TomTom.
o TODO: more
1.5 Document Organization
This document is divided in three sections.
Section 1 is this introduction, covering an overview of BlomWEB ViewerTM and its role.
Section 2 is the BlomWEB ViewerTM User Guide, detailing all of its features and tools and
providing a simple user manual.
1.6 For more information
The Product Roadmap for BlomWEB ViewerTM detailing the content of future releases of the
product is available separately by request, as well as the Product Factsheet. Contact your local
Blom representative for access to these documents.
If you want to know more about the BlomURBEXTM and BlomURBEX 3DTM features and capabilities,
please refer to their respective Whitepapers, API References and Factsheets.
BlomWEB ViewerTM
Reference Guide v5.7 r1.0a
7
SECTION 2
BlomWEB ViewerTM Reference Guide
BlomWEB ViewerTM
Reference Guide v5.7 r1.0a
8
2 BlomWEB ViewerTM Basic Features
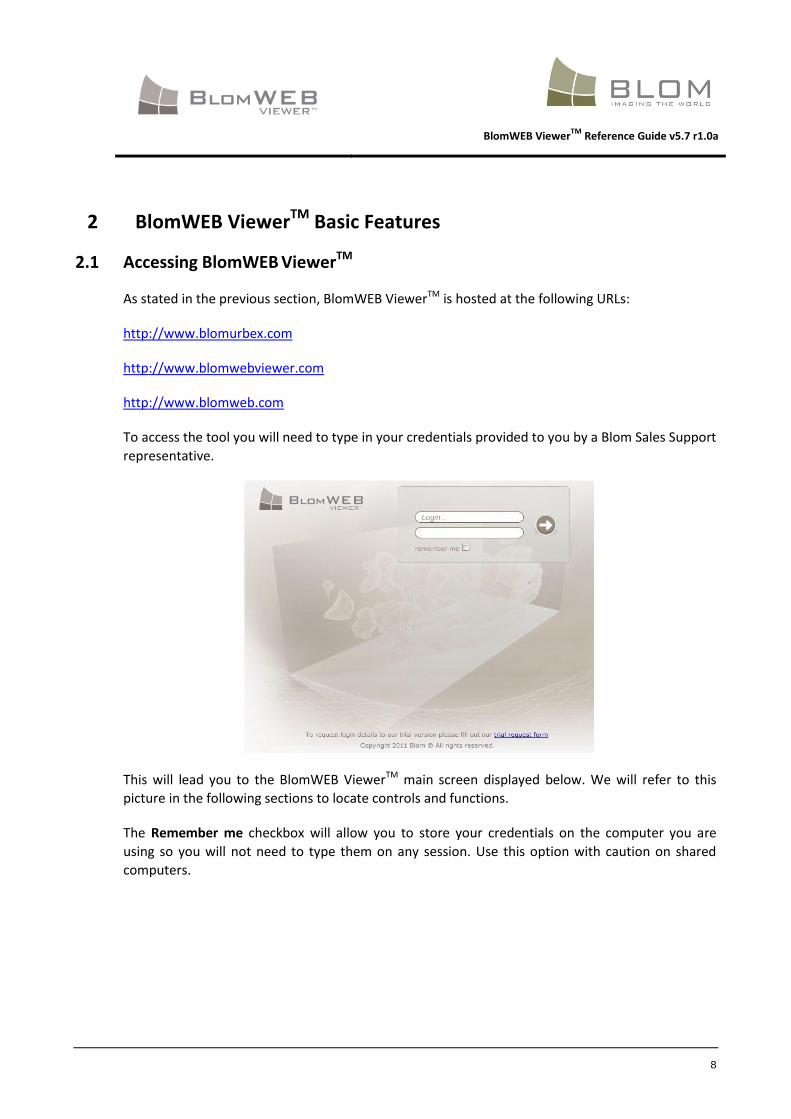
2.1 Accessing BlomWEB ViewerTM
As stated in the previous section, BlomWEB ViewerTM is hosted at the following URLs:
http://www.blomurbex.com
http://www.blomwebviewer.com
http://www.blomweb.com
To access the tool you will need to type in your credentials provided to you by a Blom Sales Support
representative.
This will lead you to the BlomWEB ViewerTM main screen displayed below. We will refer to this
picture in the following sections to locate controls and functions.
The Remember me checkbox will allow you to store your credentials on the computer you are
using so you will not need to type them on any session. Use this option with caution on shared
computers.

BlomWEB ViewerTM
Reference Guide v5.7 r1.0a
9
2.2 BlomWEB ViewerTM Main Features
BlomWEB ViewerTM is a web-based viewer built using the BlomURBEXTM JavaScript API and
BlomURBEX 3DTM API, which provides full access to more than 4000 cities in Europe and
vector map data for all of Europe.
BlomWEB ViewerTM features can be summarized as:
Navigation capabilities: BlomWEB ViewerTM allows users to search information and
navigate through it in several ways.
Geocoding tool
Coordinates search
Zoom and pan
Map Locator
Display of ortho and oblique imagery as well as vector map data.
BlomSTREET™: 360° Spherical Images available as demo scenarios
BlomLIDAR™: LiDAR data available online
Routing capabilities
Extended visualization capabilities: BlomWEB ViewerTM provides features that
enhance the user experience when working with the existing geodata.
Dual View and Multi View
Easy connection to external WMS Servers
Street map overlay on Ortho and Oblique imagery
Quick selection of historical imagery
Multiple Oblique views for every point, easy to select
Base Layer selection capability
BlomWEB ViewerTM
Reference Guide v5.7 r1.0a
10
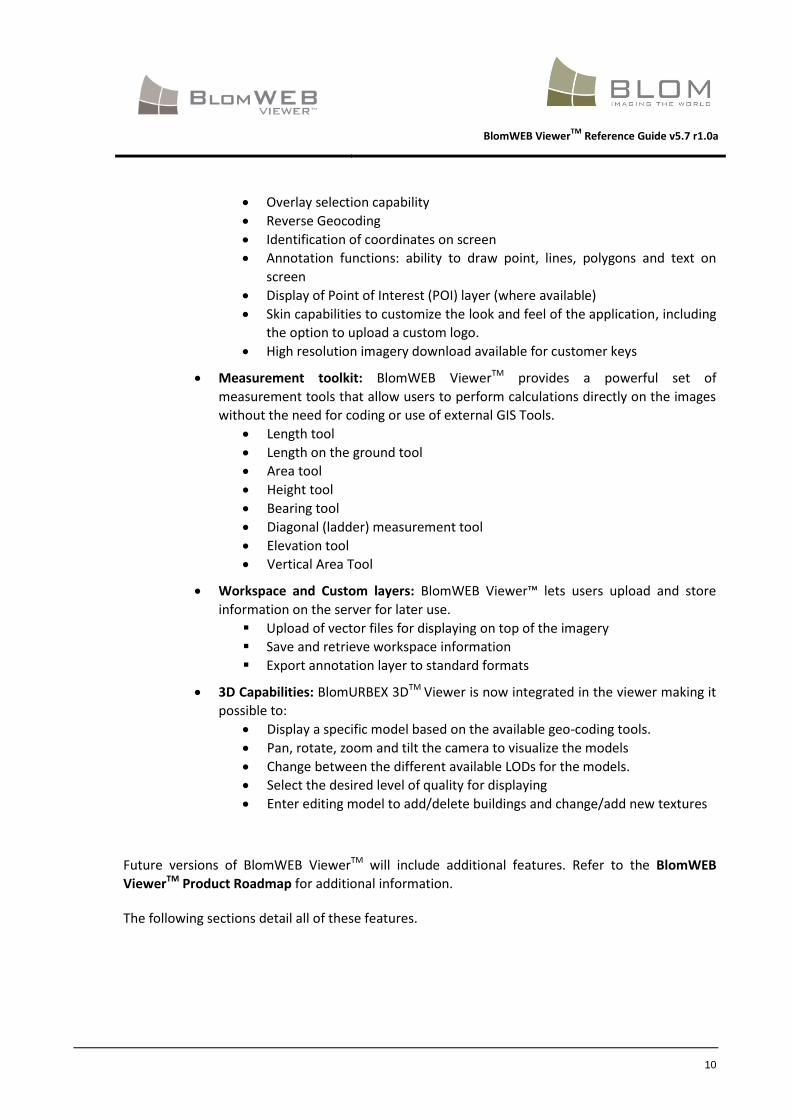
Overlay selection capability
Reverse Geocoding
Identification of coordinates on screen
Annotation functions: ability to draw point, lines, polygons and text on
screen
Display of Point of Interest (POI) layer (where available)
Skin capabilities to customize the look and feel of the application, including
the option to upload a custom logo.
High resolution imagery download available for customer keys
Measurement toolkit: BlomWEB ViewerTM provides a powerful set of
measurement tools that allow users to perform calculations directly on the images
without the need for coding or use of external GIS Tools.
Length tool
Length on the ground tool
Area tool
Height tool
Bearing tool
Diagonal (ladder) measurement tool
Elevation tool
Vertical Area Tool
Workspace and Custom layers: BlomWEB Viewer™ lets users upload and store
information on the server for later use.
Upload of vector files for displaying on top of the imagery
Save and retrieve workspace information
Export annotation layer to standard formats
3D Capabilities: BlomURBEX 3DTM Viewer is now integrated in the viewer making it
possible to:
Display a specific model based on the available geo-coding tools.
Pan, rotate, zoom and tilt the camera to visualize the models
Change between the different available LODs for the models.
Select the desired level of quality for displaying
Enter editing model to add/delete buildings and change/add new textures
Future versions of BlomWEB ViewerTM will include additional features. Refer to the BlomWEB
ViewerTM Product Roadmap for additional information.
The following sections detail all of these features.

BlomWEB ViewerTM
Reference Guide v5.7 r1.0a
11
2.3 Navigating through the Map Interface (2D mode)
The main feature of the BlomWEB ViewerTM is its map screen. This map screen allows the BlomWEB
ViewerTM user to navigate through the geographical contents provided by the BlomURBEXTM
geoserver, zooming and panning the imagery, adding overlays, performing measurements, and
searching and querying for elements and addresses.
This section covers the basic controls for navigating the map control.
2.3.1 Panning the map
To move the image displayed, just left-click with the mouse on any point on the map. The cursor
will change to a cross shape, then you can drag the image to the desired location. New map areas
will be downloaded from the server and shown on screen automatically
2.3.2 Zooming in and out
BlomURBEXTM geographic contents are organized in different zoom levels according to the
resolution of the imagery. For example, standard 10cm urban areas are located at zoom level 20.
There can be additional levels for higher resolution areas.
To change the zoom level of the images displayed you can:
a) Use the mouse-wheel. Scroll upwards to zoom in, and downwards to zoom out.
b) Use the zoom control on the left side of the map. You can click on the ‘+’ or ‘-‘ controls to
produce a level by level zoom, or move the slide for quicker zooming to the desired zoom level.
Figure 2: Zoom in action
c) Press the Shift key and drag and drop with your mouse to draw a rectangle on screen. The map
will zoom to the area selected in the rectangle.
BlomWEB ViewerTM
Reference Guide v5.7 r1.0a
12
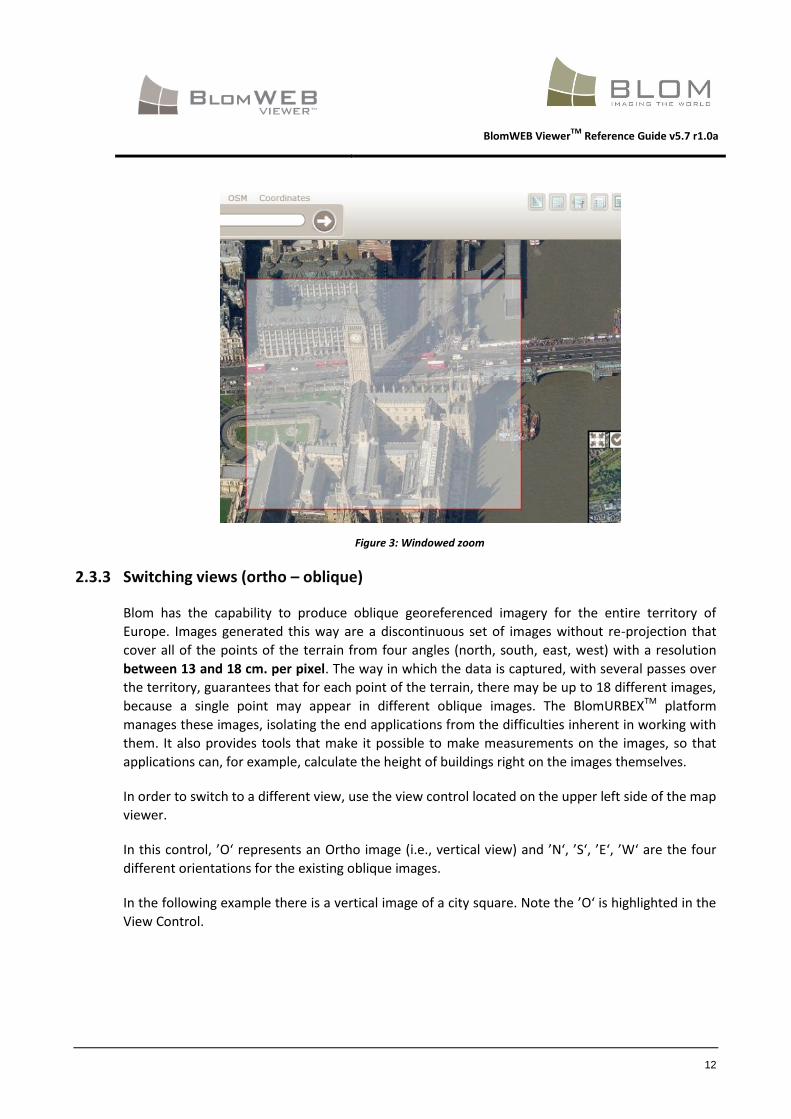
Figure 3: Windowed zoom
2.3.3 Switching views (ortho – oblique)
Blom has the capability to produce oblique georeferenced imagery for the entire territory of
Europe. Images generated this way are a discontinuous set of images without re-projection that
cover all of the points of the terrain from four angles (north, south, east, west) with a resolution
between 13 and 18 cm. per pixel. The way in which the data is captured, with several passes over
the territory, guarantees that for each point of the terrain, there may be up to 18 different images,
because a single point may appear in different oblique images. The BlomURBEXTM platform
manages these images, isolating the end applications from the difficulties inherent in working with
them. It also provides tools that make it possible to make measurements on the images, so that
applications can, for example, calculate the height of buildings right on the images themselves.
In order to switch to a different view, use the view control located on the upper left side of the map
viewer.
In this control, ’O‘ represents an Ortho image (i.e., vertical view) and ’N‘, ’S‘, ’E‘, ’W‘ are the four
different orientations for the existing oblique images.
In the following example there is a vertical image of a city square. Note the ’O‘ is highlighted in the
View Control.

BlomWEB ViewerTM
Reference Guide v5.7 r1.0a
13
Figure 4: Ortho View to be changed to North View
Clicking on the ’N‘ for North View on the View Control, you will directly switch to Natural Oblique
North View, as seen below. Note that the ’N‘ control is highlighted after clicking on it to provide
visual feedback on the current view. The arrow control, on the right, provides the location of the
North according to the current view.
Figure 5: North View
Clicking on other views will change the image accordingly. Below you can see South View for the
same area. Note that the ’S‘ control is now highlighted and the arrow is pointing to the direction of
geographical North.

BlomWEB ViewerTM
Reference Guide v5.7 r1.0a
14
Figure 6: South View
2.3.3.1 A note on Oblique Images
BlomURBEXTM serves two kinds of oblique images: Natural Obliques and Orthorectified Obliques.
Natural Obliques are the unmodified oblique images obtained during the capture process. Natural
Obliques are discontinuous images (there is no mosaicing of the imagery, as there is with the
vertical ones) and when panning around in the map viewer there can appear areas with vertical or
horizontal black strips. This is simply where the oblique image ends. BlomWEB ViewerTM
automatically detects if there is another oblique image in the BlomURBEXTM database that better
covers the current center of the screen, and it will retrieve it and show it on screen providing the
illusion of continuity in the image. When panning oblique images you can sometimes experience a
displacement in the image and this is due to a new oblique image downloaded to replace the
previous one.
Figure 7: Natural Oblique Image
Orthorectified Obliques are a continuous projected mosaic of oblique views. This mosaic provides
a fluid oblique view from 4 angles (North, South, East, and West) with the oblique images
projected, transformed, and orthorectified to correct elevation distortion. The resulting images
show a certain degree of distortion that is noticeable at close-up zoom levels, but with the

BlomWEB ViewerTM
Reference Guide v5.7 r1.0a
15
advantage that they are orthoimages, so they can be easily superimposed on other maps and
processed continuously, making them ideal for use in mobile devices and navigators.
Figure 8: Orthorectified Oblique
Another very important difference between these two sets of oblique images is that Natural
Obliques allow for measurements (see section 0) and this is not possible on Orthorectified
Obliques.
BlomWEB ViewerTM restricts the view of orthorectified obliques to zoom level 16 or lower, to avoid
showing the visible distortion on images at closer zoom levels.
You can visually be aware of the selected oblique set by looking at the “Ortho/Oblique” control on
the upper left side of the map. When Oblique is highlighted, the shown image is a natural oblique
(see Figure 6: South View), otherwise, the control would be highlighted as “Ortho”.
2.3.4 Map Locator
The main map view in BlomWEB ViewerTM includes a smaller window showing a greater extent of
the current view and a red box corresponding to the location of the main view on it. This red box
will appear flat on Vertical (Ortho) views and slightly distorted when showing vertical view, as it will
show the real orientation of the oblique view with relation to the vertical view. An arrow appears in
the map pointing in the direction where the user is looking at in the main window.
This Map Locator window can be hidden/show by clicking on the icon located on its upper left
corner. Current version of BlomWEB ViewerTM does not allow for relocating it on the main viewer.

BlomWEB ViewerTM
Reference Guide v5.7 r1.0a
16
Figure 9: Map Locator Window
The Map Locator can be changed to Map View or Image View by clicking on the “Map” Button
located on the Map Locator window. The Map button will remain highlighted to indicate Map
Mode. Press it again to return to Image Mode.
Figure 10: Map Locator in “Map” mode
The arrow in the Map Locator Window points in the direction that the main viewing window is
facing.
BlomWEB ViewerTM
Reference Guide v5.7 r1.0a
17
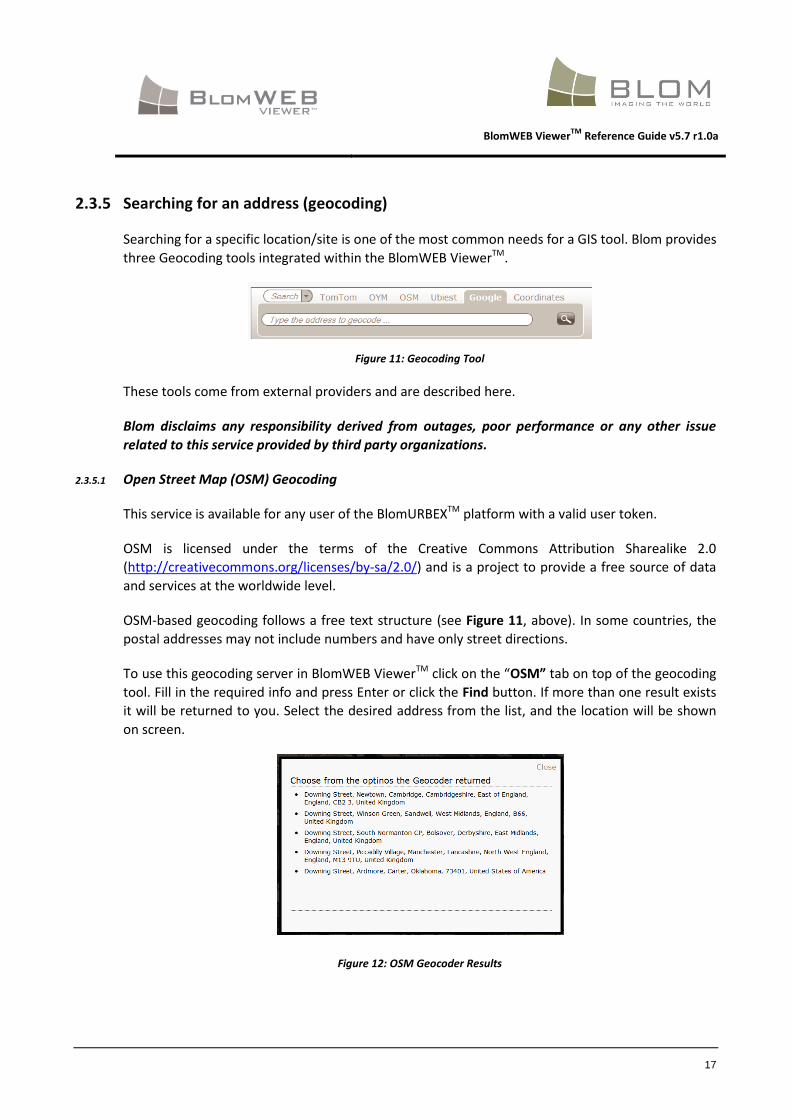
2.3.5 Searching for an address (geocoding)
Searching for a specific location/site is one of the most common needs for a GIS tool. Blom provides
three Geocoding tools integrated within the BlomWEB ViewerTM.
Figure 11: Geocoding Tool
These tools come from external providers and are described here.
Blom disclaims any responsibility derived from outages, poor performance or any other issue
related to this service provided by third party organizations.
2.3.5.1 Open Street Map (OSM) Geocoding
This service is available for any user of the BlomURBEXTM platform with a valid user token.
OSM is licensed under the terms of the Creative Commons Attribution Sharealike 2.0
(http://creativecommons.org/licenses/by-sa/2.0/) and is a project to provide a free source of data
and services at the worldwide level.
OSM-based geocoding follows a free text structure (see Figure 11, above). In some countries, the
postal addresses may not include numbers and have only street directions.
To use this geocoding server in BlomWEB ViewerTM click on the “OSM” tab on top of the geocoding
tool. Fill in the required info and press Enter or click the Find button. If more than one result exists
it will be returned to you. Select the desired address from the list, and the location will be shown
on screen.
Figure 12: OSM Geocoder Results
BlomWEB ViewerTM
Reference Guide v5.7 r1.0a
18
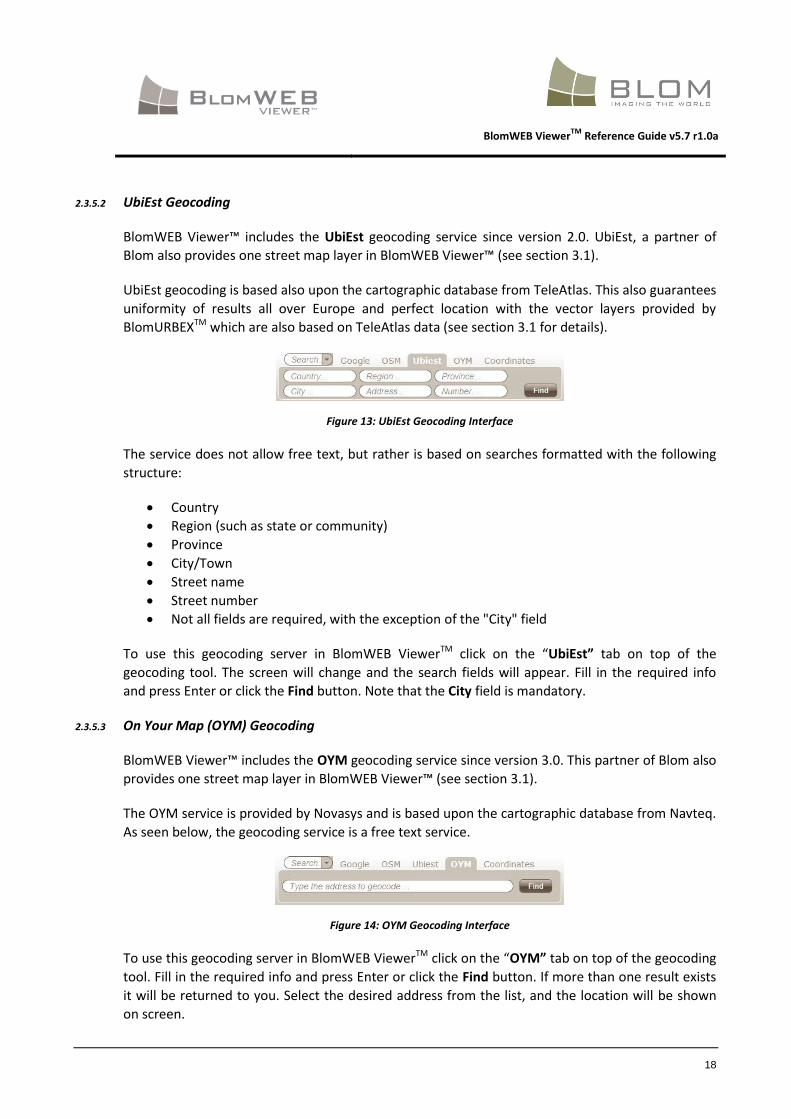
2.3.5.2 UbiEst Geocoding
BlomWEB Viewer™ includes the UbiEst geocoding service since version 2.0. UbiEst, a partner of
Blom also provides one street map layer in BlomWEB Viewer™ (see section 3.1).
UbiEst geocoding is based also upon the cartographic database from TeleAtlas. This also guarantees
uniformity of results all over Europe and perfect location with the vector layers provided by
BlomURBEXTM which are also based on TeleAtlas data (see section 3.1 for details).
Figure 13: UbiEst Geocoding Interface
The service does not allow free text, but rather is based on searches formatted with the following
structure:
Country
Region (such as state or community)
Province
City/Town
Street name
Street number
Not all fields are required, with the exception of the "City" field
To use this geocoding server in BlomWEB ViewerTM click on the “UbiEst” tab on top of the
geocoding tool. The screen will change and the search fields will appear. Fill in the required info
and press Enter or click the Find button. Note that the City field is mandatory.
2.3.5.3 On Your Map (OYM) Geocoding
BlomWEB Viewer™ includes the OYM geocoding service since version 3.0. This partner of Blom also
provides one street map layer in BlomWEB Viewer™ (see section 3.1).
The OYM service is provided by Novasys and is based upon the cartographic database from Navteq.
As seen below, the geocoding service is a free text service.
Figure 14: OYM Geocoding Interface
To use this geocoding server in BlomWEB ViewerTM click on the “OYM” tab on top of the geocoding
tool. Fill in the required info and press Enter or click the Find button. If more than one result exists
it will be returned to you. Select the desired address from the list, and the location will be shown
on screen.
BlomWEB ViewerTM
Reference Guide v5.7 r1.0a
19
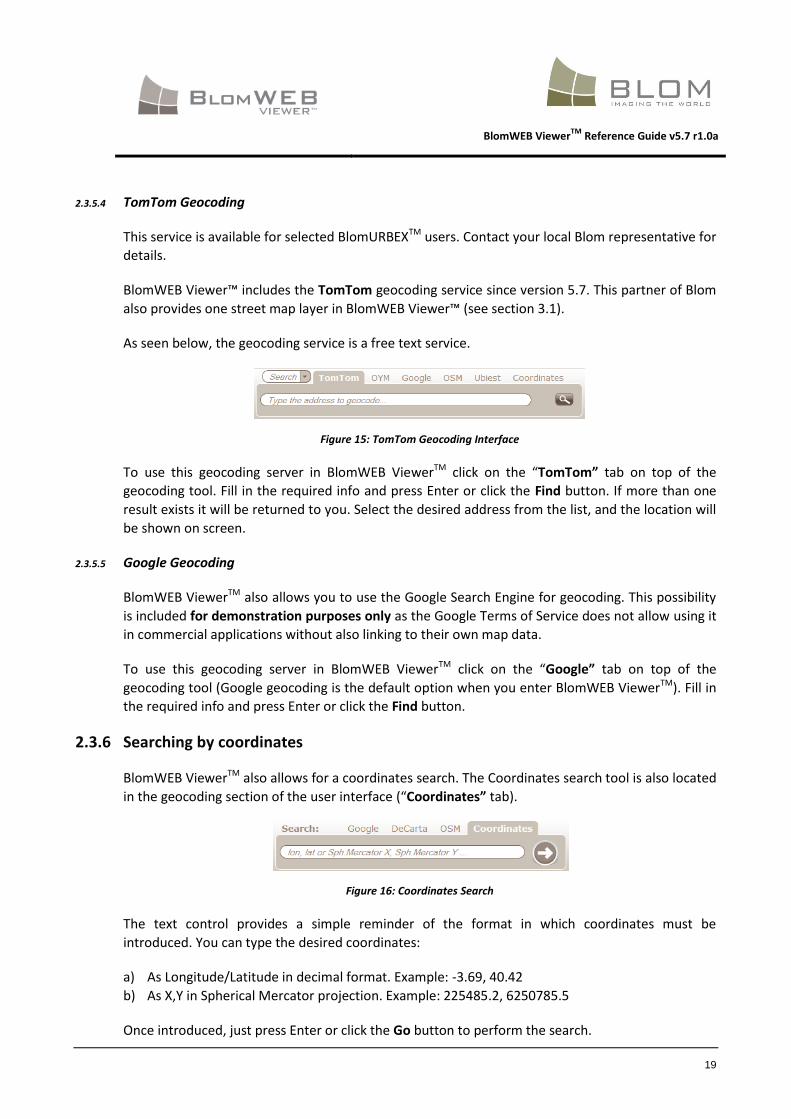
2.3.5.4 TomTom Geocoding
This service is available for selected BlomURBEXTM users. Contact your local Blom representative for
details.
BlomWEB Viewer™ includes the TomTom geocoding service since version 5.7. This partner of Blom
also provides one street map layer in BlomWEB Viewer™ (see section 3.1).
As seen below, the geocoding service is a free text service.
Figure 15: TomTom Geocoding Interface
To use this geocoding server in BlomWEB ViewerTM click on the “TomTom” tab on top of the
geocoding tool. Fill in the required info and press Enter or click the Find button. If more than one
result exists it will be returned to you. Select the desired address from the list, and the location will
be shown on screen.
2.3.5.5 Google Geocoding
BlomWEB ViewerTM also allows you to use the Google Search Engine for geocoding. This possibility
is included for demonstration purposes only as the Google Terms of Service does not allow using it
in commercial applications without also linking to their own map data.
To use this geocoding server in BlomWEB ViewerTM click on the “Google” tab on top of the
geocoding tool (Google geocoding is the default option when you enter BlomWEB ViewerTM). Fill in
the required info and press Enter or click the Find button.
2.3.6 Searching by coordinates
BlomWEB ViewerTM also allows for a coordinates search. The Coordinates search tool is also located
in the geocoding section of the user interface (“Coordinates” tab).
Figure 16: Coordinates Search
The text control provides a simple reminder of the format in which coordinates must be
introduced. You can type the desired coordinates:
a) As Longitude/Latitude in decimal format. Example: -3.69, 40.42
b) As X,Y in Spherical Mercator projection. Example: 225485.2, 6250785.5
Once introduced, just press Enter or click the Go button to perform the search.

BlomWEB ViewerTM
Reference Guide v5.7 r1.0a
20
2.3.7 Resizing the screen
The map screen in BlomWEB ViewerTM resizes itself according to the size of the web browser being
used. This is very useful for projector-based presentations, where maximizing the image area is
desired.
Remember that you can put most web browsers in full-screen mode, which fully maximises the
map viewing area. Usually the F11 key is used for this full-screen mode. Refer to your browser
documentation for details.
You can also press the Hide Tools button located in the upper right part of the screen to hide the
toolbar and gain additional screen size.
Figure 17: Hide Tools button
BlomWEB ViewerTM
Reference Guide v5.7 r1.0a
21
3 Advanced display and navigation tools
3.1 Map View
In addition to its huge collection of hi-resolution georeferenced imagery, BlomWEB ViewerTM has
the possibility to show a cartographic view of any area in Europe.
This data comes from TeleAtlas and Navteq vector data and is provided by UbiEst and OnYourMap
(OYM), two partners of Blom.
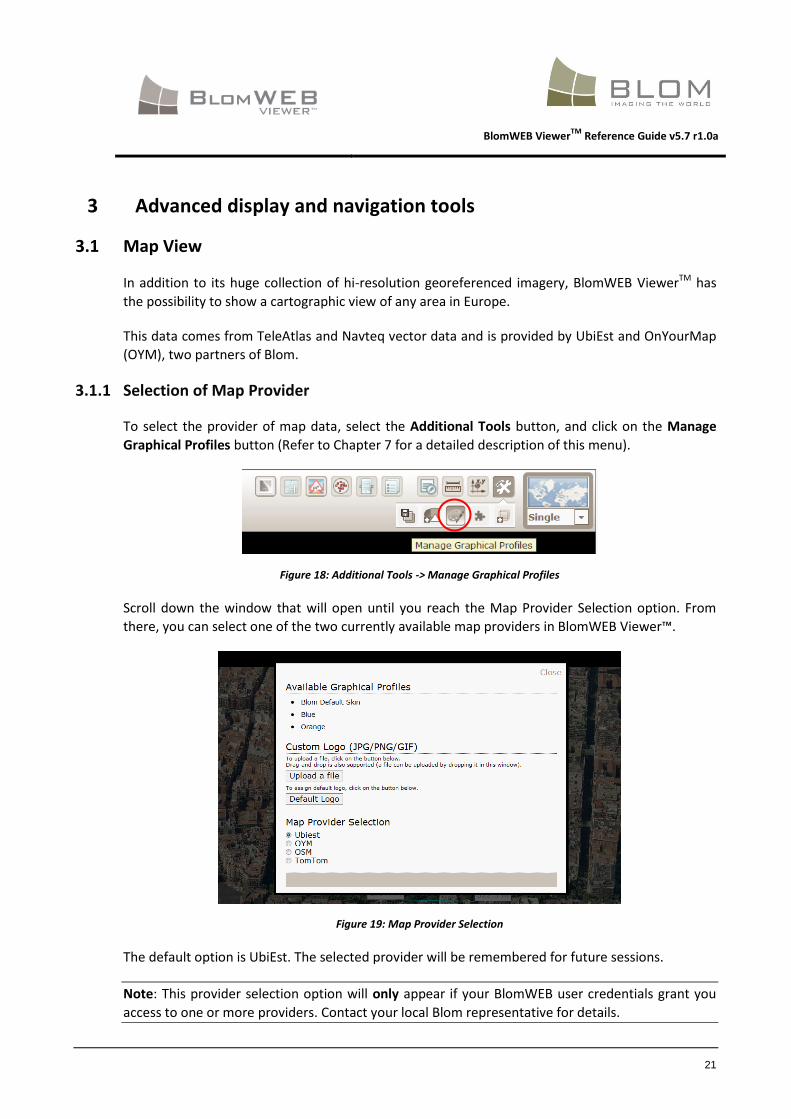
3.1.1 Selection of Map Provider
To select the provider of map data, select the Additional Tools button, and click on the Manage
Graphical Profiles button (Refer to Chapter 7 for a detailed description of this menu).
Figure 18: Additional Tools -> Manage Graphical Profiles
Scroll down the window that will open until you reach the Map Provider Selection option. From
there, you can select one of the two currently available map providers in BlomWEB Viewer™.
Figure 19: Map Provider Selection
The default option is UbiEst. The selected provider will be remembered for future sessions.
Note: This provider selection option will only appear if your BlomWEB user credentials grant you
access to one or more providers. Contact your local Blom representative for details.
BlomWEB ViewerTM
Reference Guide v5.7 r1.0a
22
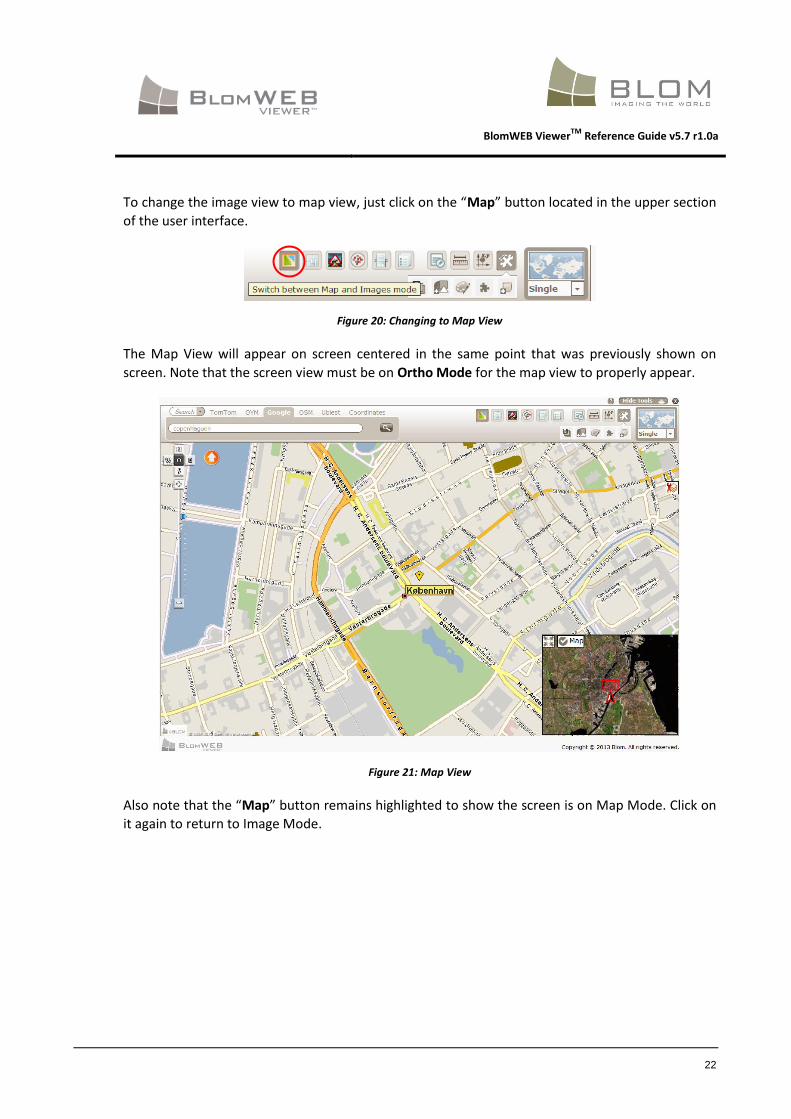
To change the image view to map view, just click on the “Map” button located in the upper section
of the user interface.
Figure 20: Changing to Map View
The Map View will appear on screen centered in the same point that was previously shown on
screen. Note that the screen view must be on Ortho Mode for the map view to properly appear.
Figure 21: Map View
Also note that the “Map” button remains highlighted to show the screen is on Map Mode. Click on
it again to return to Image Mode.

BlomWEB ViewerTM
Reference Guide v5.7 r1.0a
23
3.2 Hybrid view
The TeleAtlas vector data for Europe can be displayed on top of Ortho images creating a Hybrid
View mode.
To change the image view to hybrid view just click on the “Hybrid” button located in the upper
section of the user interface.
Figure 22: Changing to Hybrid View
The Hybrid View will appear on screen centered in the same point that was previously shown on
screen.
Figure 23: Hybrid View
Note that the “Hybrid” button remains highlighted to show the screen is on Hybrid Mode. Click on
it again to return to Image Mode.

BlomWEB ViewerTM
Reference Guide v5.7 r1.0a
24
3.3 Multiview
BlomWEB ViewerTM allows the screen to be split to provide multiple, synchronized, views, . This
way, when you zoom/pan on any view, all other views refresh to the same location.
The multiple/single view is selected from the control shown below, located in the upper right
corner of the interface.
Figure 24: View selection control
Default view in BlomWEB ViewerTM is Single View. Available views are:
Dual View: The Screen is split in two. One view is ortho view and the other is North view.
You can freely change any view to show the desired views. Left view can be changed to
Map view if needed clicking on the Map button.
Figure 25: Dual View screen with Map and North Oblique
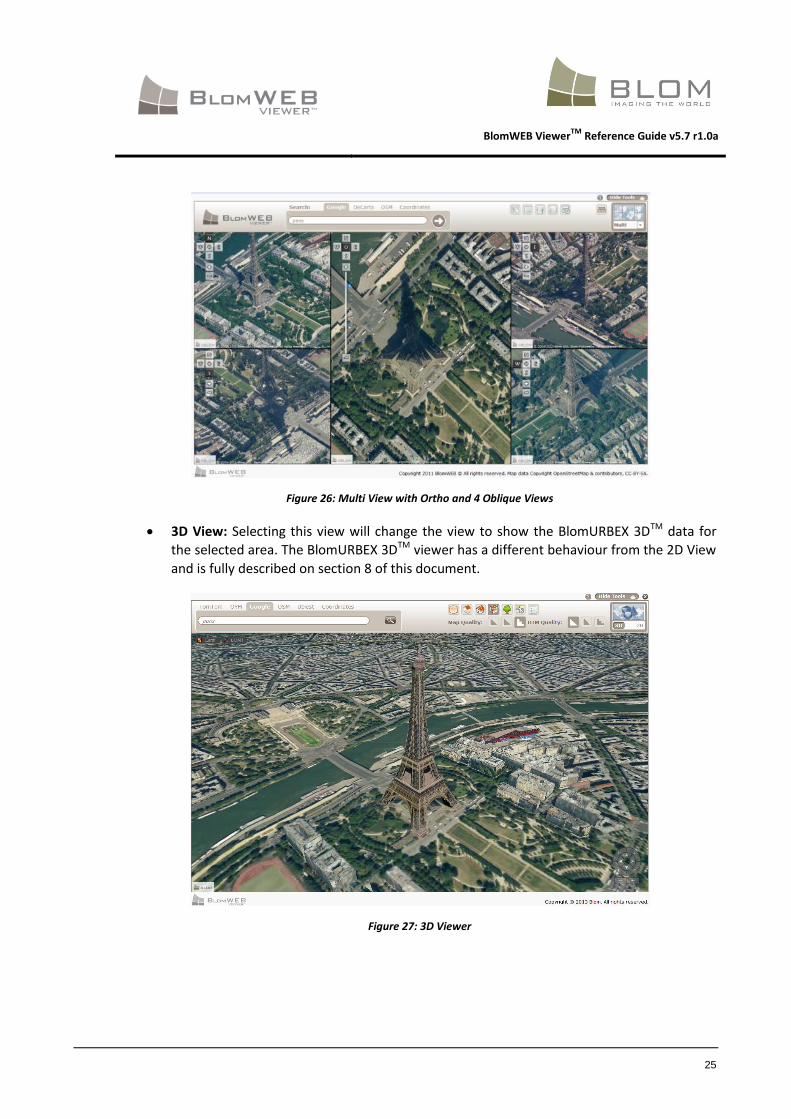
Multi View: The Screen is split in five, showing the ortho view and the four oblique views
for the selected area. You can freely change any view to show the desired views. Central
view can be changed to Map view if needed clicking on the Map button.
BlomWEB ViewerTM
Reference Guide v5.7 r1.0a
25
Figure 26: Multi View with Ortho and 4 Oblique Views
3D View: Selecting this view will change the view to show the BlomURBEX 3DTM data for
the selected area. The BlomURBEX 3DTM viewer has a different behaviour from the 2D View
and is fully described on section 8 of this document.
Figure 27: 3D Viewer
BlomWEB ViewerTM
Reference Guide v5.7 r1.0a
26
3.4 Display of external WMS services
The BlomURBEXTM JavaScript API provides a convenient way to connect to external WMS servers
and display their data on top of BlomURBEXTM imagery.
This API functionality is implemented into BlomWEB ViewerTM, so it is even easier to connect to
external servers.
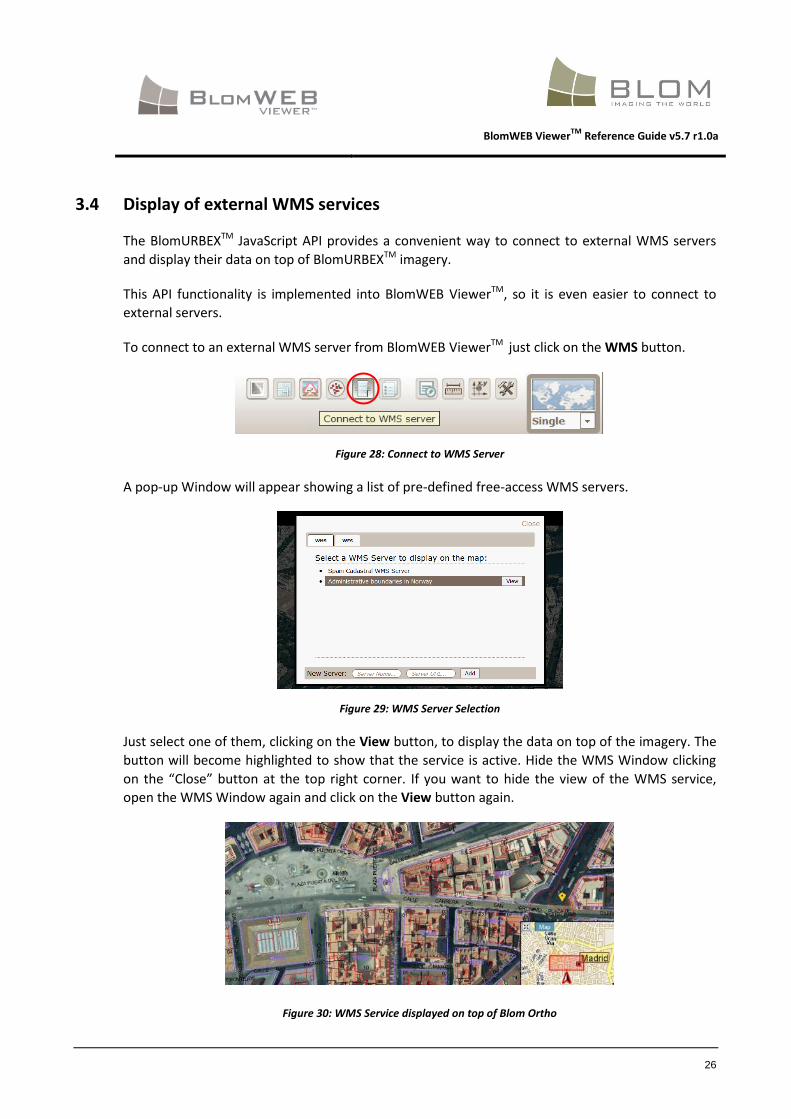
To connect to an external WMS server from BlomWEB ViewerTM just click on the WMS button.
Figure 28: Connect to WMS Server
A pop-up Window will appear showing a list of pre-defined free-access WMS servers.
Figure 29: WMS Server Selection
Just select one of them, clicking on the View button, to display the data on top of the imagery. The
button will become highlighted to show that the service is active. Hide the WMS Window clicking
on the “Close” button at the top right corner. If you want to hide the view of the WMS service,
open the WMS Window again and click on the View button again.
Figure 30: WMS Service displayed on top of Blom Ortho
BlomWEB ViewerTM
Reference Guide v5.7 r1.0a
27
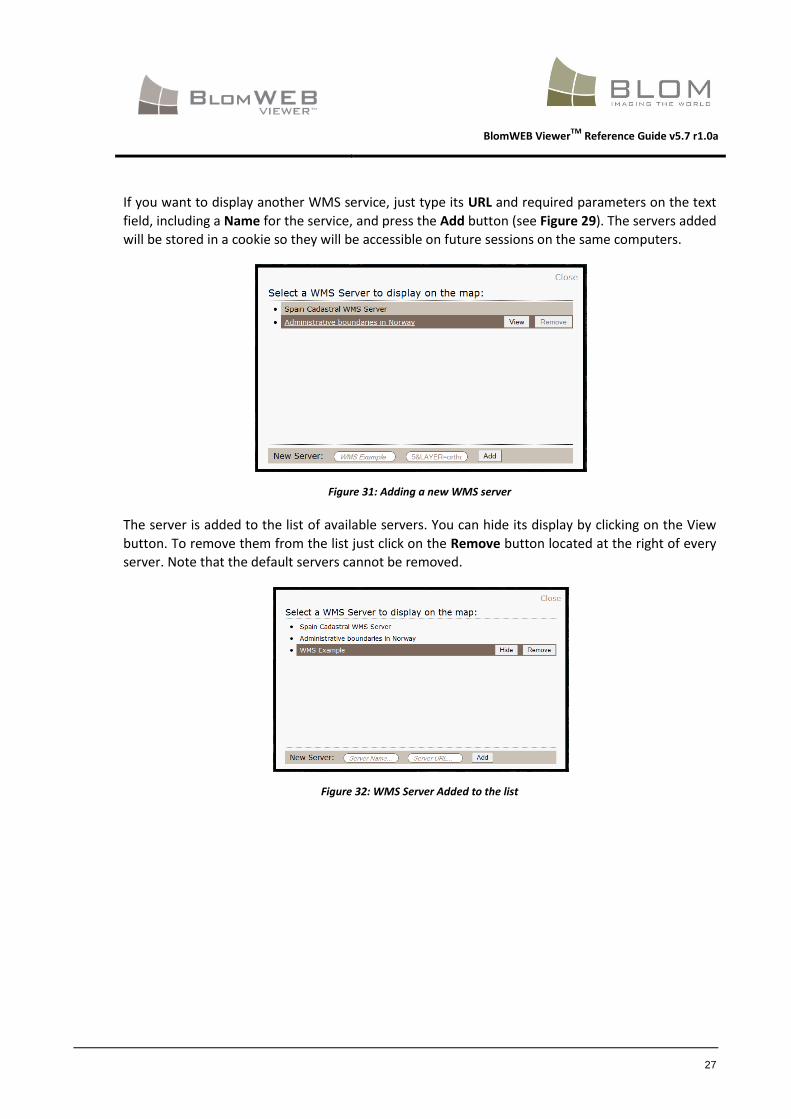
If you want to display another WMS service, just type its URL and required parameters on the text
field, including a Name for the service, and press the Add button (see Figure 29). The servers added
will be stored in a cookie so they will be accessible on future sessions on the same computers.
Figure 31: Adding a new WMS server
The server is added to the list of available servers. You can hide its display by clicking on the View
button. To remove them from the list just click on the Remove button located at the right of every
server. Note that the default servers cannot be removed.
Figure 32: WMS Server Added to the list
BlomWEB ViewerTM
Reference Guide v5.7 r1.0a
28
3.5 Demo Scenarios
BlomWEB ViewerTM includes an easy way to access different demo datasets included in
BlomURBEXTM. These datasets include very high resolution (4cm) imagery on certain areas, LiDAR
demo datasets, BlomSTREET 360° imagery demo datasets or access to a BlomNAVIGATIONTM
example.
Access to these layers can be restricted according to your user credentials. Contact your local Blom
Sales Support representative for additional details.
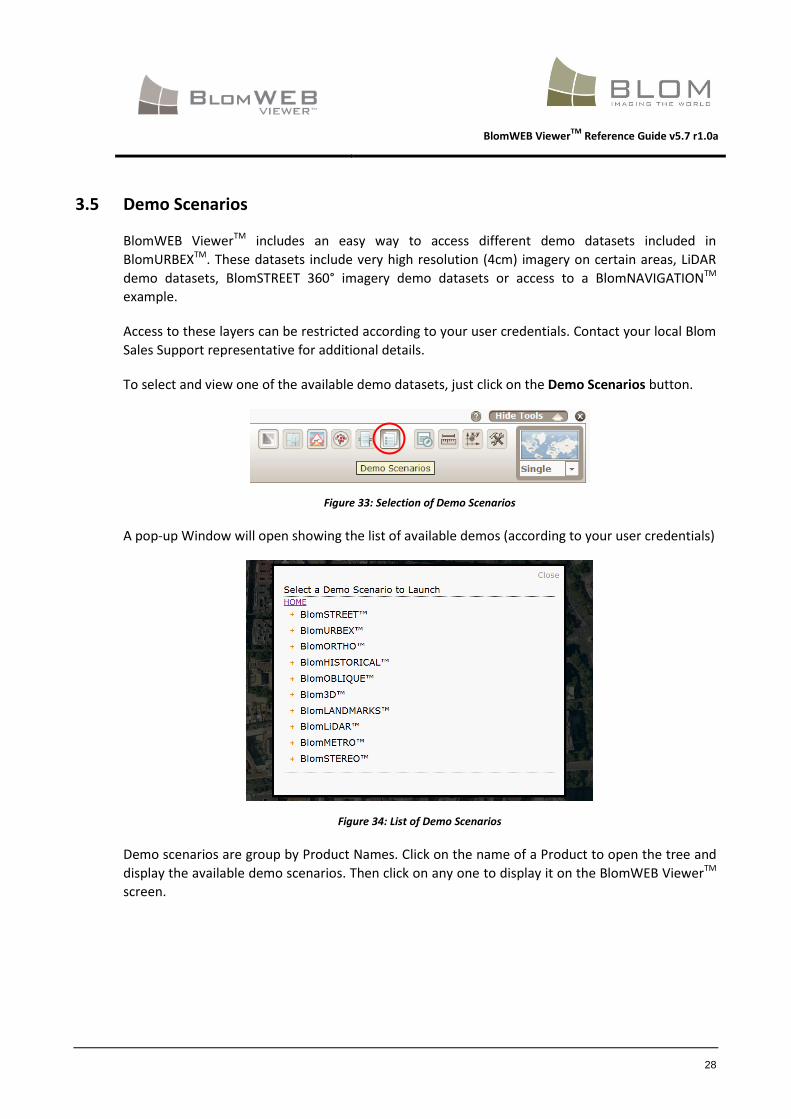
To select and view one of the available demo datasets, just click on the Demo Scenarios button.
Figure 33: Selection of Demo Scenarios
A pop-up Window will open showing the list of available demos (according to your user credentials)
Figure 34: List of Demo Scenarios
Demo scenarios are group by Product Names. Click on the name of a Product to open the tree and
display the available demo scenarios. Then click on any one to display it on the BlomWEB ViewerTM
screen.
BlomWEB ViewerTM
Reference Guide v5.7 r1.0a
29
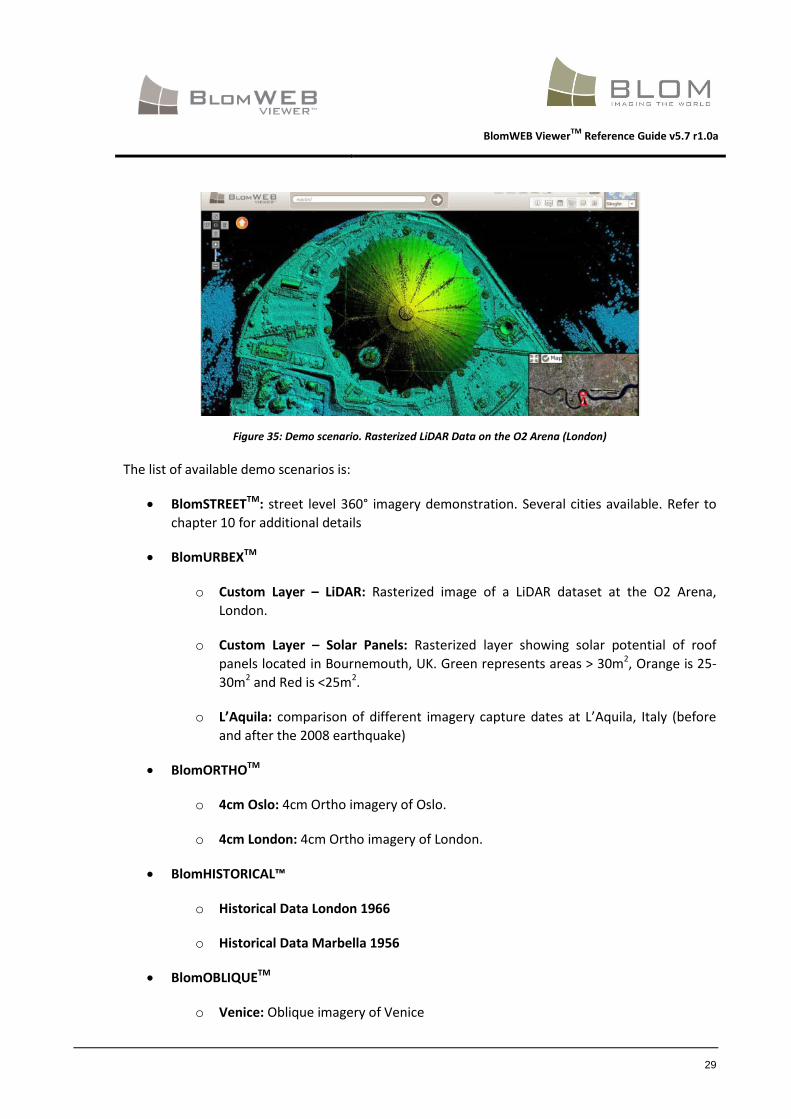
Figure 35: Demo scenario. Rasterized LiDAR Data on the O2 Arena (London)
The list of available demo scenarios is:
BlomSTREETTM: street level 360° imagery demonstration. Several cities available. Refer to
chapter 10 for additional details
BlomURBEXTM
o Custom Layer – LiDAR: Rasterized image of a LiDAR dataset at the O2 Arena,
London.
o Custom Layer – Solar Panels: Rasterized layer showing solar potential of roof
panels located in Bournemouth, UK. Green represents areas > 30m2, Orange is 25-
30m2 and Red is <25m2.
o L’Aquila: comparison of different imagery capture dates at L’Aquila, Italy (before
and after the 2008 earthquake)
BlomORTHOTM
o 4cm Oslo: 4cm Ortho imagery of Oslo.
o 4cm London: 4cm Ortho imagery of London.
BlomHISTORICAL™
o Historical Data London 1966
o Historical Data Marbella 1956
BlomOBLIQUETM
o Venice: Oblique imagery of Venice
BlomWEB ViewerTM
Reference Guide v5.7 r1.0a
30
o Overlay Street Maps: Sample of rasterized TeleAtlas maps over Oblique images in
Madrid.
Blom3DTM
o Koblenz: Blom 3D model of Koblenz, Germany.
o Rostock Ads: Example of advert placement over the 3D model of Rostock.
o Munich Enhanced Urban Attributes: Example of BlomNAVIGATIONTM model over a
section of Munich, Germany.
o Rotterdam: Blom3D model of the city of Rotterdam, Netherlands.
BlomLANDMARKSTM
o Amsterdam: Sample of BlomLANDMARKSTM models located at Amsterdam.
BlomLIDAR™
o Sample LiDAR data from Málaga, Spain
BlomWEB ViewerTM
Reference Guide v5.7 r1.0a
31
3.6 Routing
Since version 3.0, BlomWEB Viewer™ includes routing capabilities, making user able to calculate
the best route between two locations, and obtain a route summary.
This routing service is provided by Blom partners UbiEst and OnYourMap (OYM).
Also, the TomTom routing provider is available for selected BlomWEB Viewer™ users. Contact your
local Blom representative for details.
As such, Blom disclaims any responsibility derived from outages, poor performance or any other
issue related to the service provided by these third party organizations.
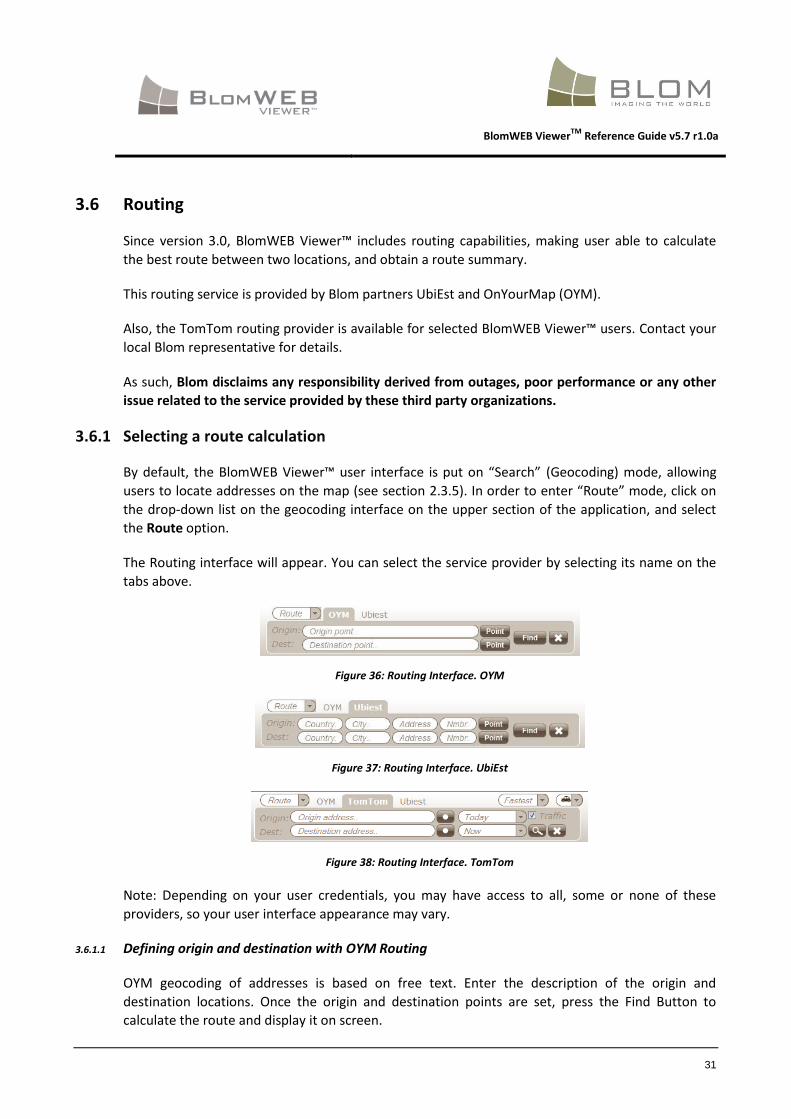
3.6.1 Selecting a route calculation
By default, the BlomWEB Viewer™ user interface is put on “Search” (Geocoding) mode, allowing
users to locate addresses on the map (see section 2.3.5). In order to enter “Route” mode, click on
the drop-down list on the geocoding interface on the upper section of the application, and select
the Route option.
The Routing interface will appear. You can select the service provider by selecting its name on the
tabs above.
Figure 36: Routing Interface. OYM
Figure 37: Routing Interface. UbiEst
Figure 38: Routing Interface. TomTom
Note: Depending on your user credentials, you may have access to all, some or none of these
providers, so your user interface appearance may vary.
3.6.1.1 Defining origin and destination with OYM Routing
OYM geocoding of addresses is based on free text. Enter the description of the origin and
destination locations. Once the origin and destination points are set, press the Find Button to
calculate the route and display it on screen.
BlomWEB ViewerTM
Reference Guide v5.7 r1.0a
32
Additionally, you can click on a point on the map to use it as origin/destination for the route. To do
so, click on the Point button, and then click on a location on the map. The coordinates of the
selected point will be used as origin/destination for the route. Note that the button name will
change to Text. Click on it again to return to text input mode.
3.6.1.2 Defining origin and destination with UbiEst Routing
UbiEst geocoding of addresses is based on formatted fields. You must enter the Country, City,
Address and Number of the origin and destination locations.
Once the origin and destination points are set, press the Find Button to calculate the route and
display it on screen.
Additionally, you can click on a point on the map to use it as origin/destination for the route. To do
so, click on the Point button, and then click on a location on the map. The coordinates of the
selected point will be used as origin/destination for the route. Note that the button name will
change to Text. Click on it again to return to text input mode.
3.6.1.3 Defining origin and destination with TomTom Routing
TomTom geocoding of addresses is based on free text. Enter the description of the origin and
destination locations.
Next, select the day for the desired route calculation: Today, Tomorrow or any day of the week.
Next, select the time of the day for the expected departure: Now or any hour of the day.
Next, check the “Traffic” checkbox if you want to take into account traffic statistics for the selected
day and time, in order to avoid traffic jams.
Then, press the Find Button to calculate the route and display it on screen.
Additionally, you can click on a point on the map to use it as origin/destination for the route. To do
so, click on the Point button, and then click on a location on the map. The coordinates of the
selected point will be used as origin/destination for the route. Note that the button name will
change to Text. Click on it again to return to text input mode.
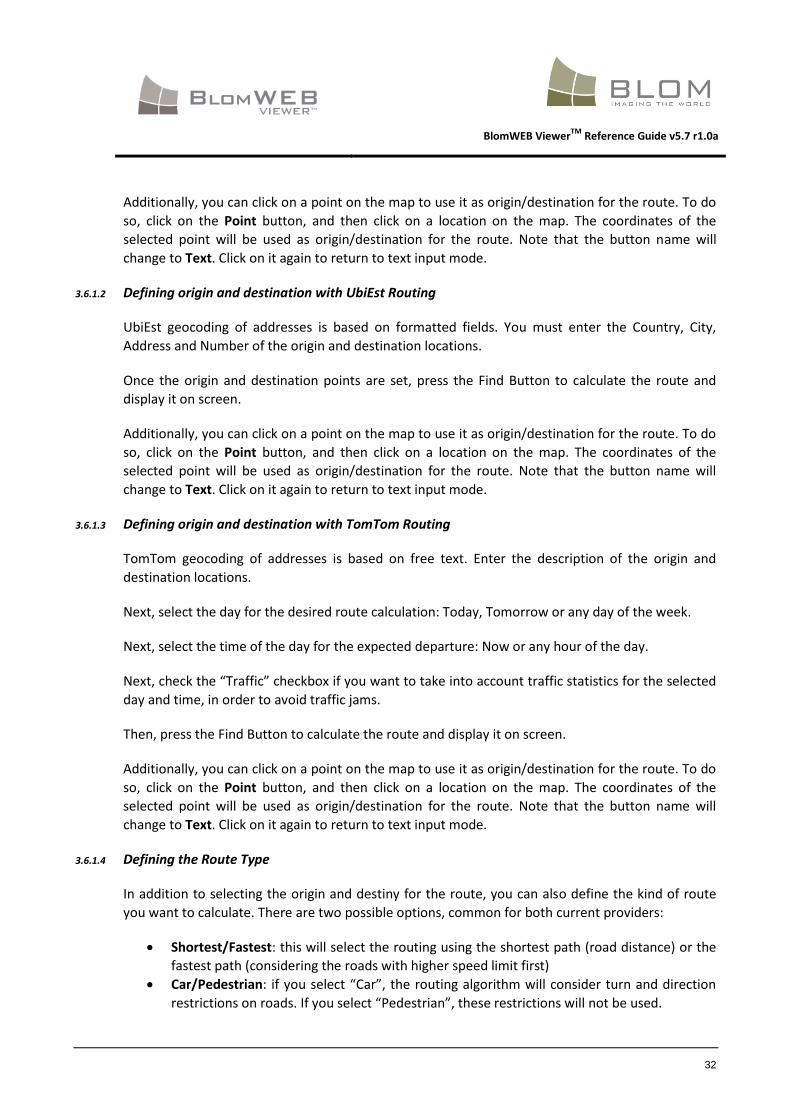
3.6.1.4 Defining the Route Type
In addition to selecting the origin and destiny for the route, you can also define the kind of route
you want to calculate. There are two possible options, common for both current providers:
Shortest/Fastest: this will select the routing using the shortest path (road distance) or the
fastest path (considering the roads with higher speed limit first)
Car/Pedestrian: if you select “Car”, the routing algorithm will consider turn and direction
restrictions on roads. If you select “Pedestrian”, these restrictions will not be used.

BlomWEB ViewerTM
Reference Guide v5.7 r1.0a
33
These options can be selected using the drop-down lists on the upper right part of the routing
interface.
Figure 39: Routing options
3.6.2 Routing results
The result of the requested route will be displayed on screen, at a zoom level able to show the
whole route. You can navigate the imagery using the usual tools and the requested route will
remain on screen. To delete the route use the X button on the routing interface.
Figure 40: Route Calculation
Note that the route summary is shown on the left. On this route summary you can:
Scroll the list up and down by clicking and dragging with the mouse
Hide and Show the Route Summary by clicking on the Route Summary (Hide/Show) text
Go to a given section of the route by double clicking on it on the route summary
BlomWEB ViewerTM
Reference Guide v5.7 r1.0a
34
4 Annotation tools
BlomWEB Viewer™ allows you to draw vector elements and text on top of the imagery. Possible
options are Shapes and Text.
The Annotation tools can be accessed through the annotations button in the top of the screen
Figure 41: Annotations Tools
4.1 Drawing shapes
This is the default option. From the annotations window you can select:
The shape to draw (point, line or polygon)
The colour of the shape
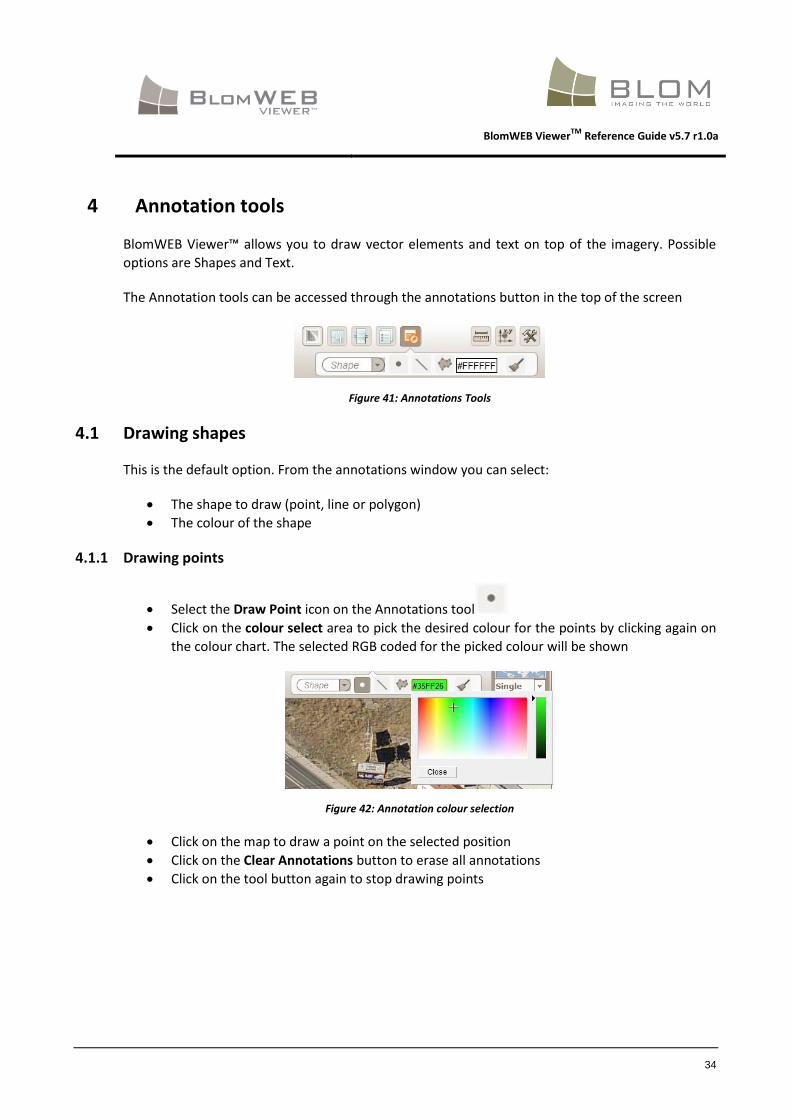
4.1.1 Drawing points
Select the Draw Point icon on the Annotations tool
Click on the colour select area to pick the desired colour for the points by clicking again on
the colour chart. The selected RGB coded for the picked colour will be shown
Figure 42: Annotation colour selection
Click on the map to draw a point on the selected position
Click on the Clear Annotations button to erase all annotations
Click on the tool button again to stop drawing points
BlomWEB ViewerTM
Reference Guide v5.7 r1.0a
35
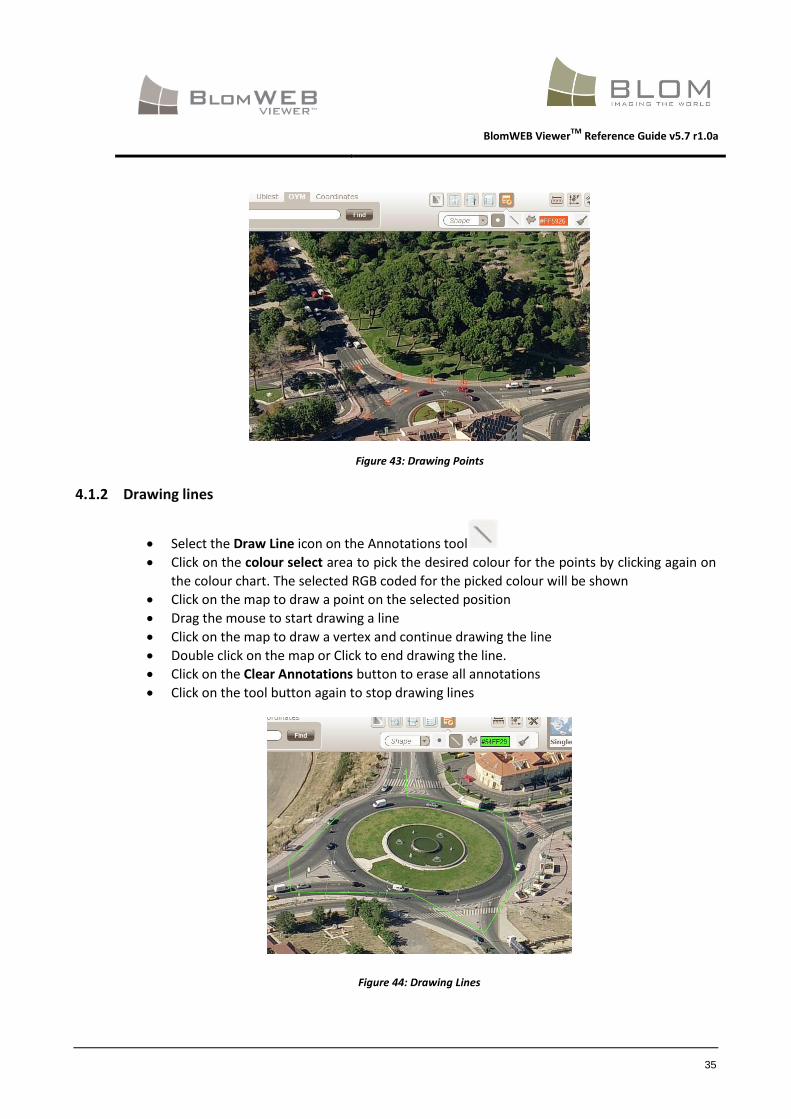
Figure 43: Drawing Points
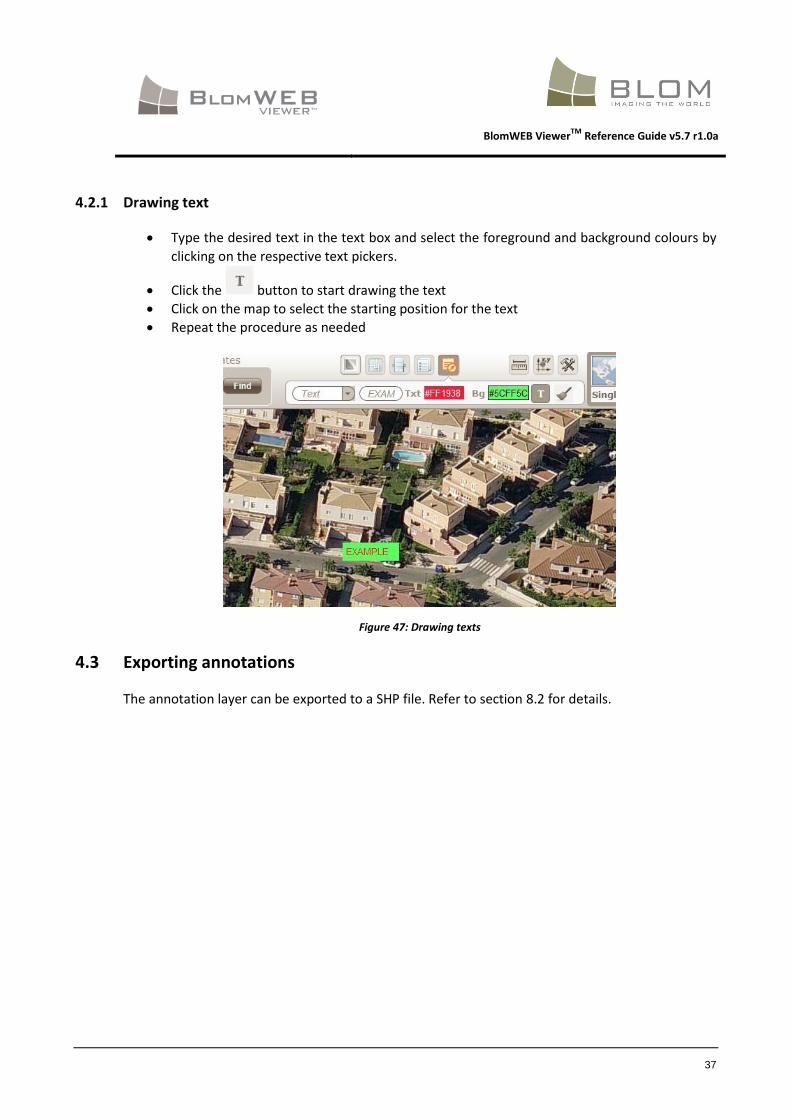
4.1.2 Drawing lines
Select the Draw Line icon on the Annotations tool
Click on the colour select area to pick the desired colour for the points by clicking again on
the colour chart. The selected RGB coded for the picked colour will be shown
Click on the map to draw a point on the selected position
Drag the mouse to start drawing a line
Click on the map to draw a vertex and continue drawing the line
Double click on the map or Click to end drawing the line.
Click on the Clear Annotations button to erase all annotations
Click on the tool button again to stop drawing lines
Figure 44: Drawing Lines

BlomWEB ViewerTM
Reference Guide v5.7 r1.0a
36
4.1.3 Drawing polygons
Select the Draw Line icon on the Annotations tool
Click on the colour select area to pick the desired colour for the points by clicking again on
the colour chart. The selected RGB coded for the picked colour will be shown
Click on the map to draw a point on the selected position
Drag the mouse to start drawing a line
Click on the map to draw a vertex and continue drawing lines. Note that the polygon will
auto-complete
Double click on the map to end drawing the polygon
Figure 45: Drawing Polygons
4.2 Drawing text
Default option in the Annotations tool is Shape. Click on the arrow near the “Shape” text and select
the Text option to change the annotations window to text mode. In this mode you can select:
The text to draw
The colour of the text
The background colour of the text
Figure 46: Drawing Text menu
BlomWEB ViewerTM
Reference Guide v5.7 r1.0a
37
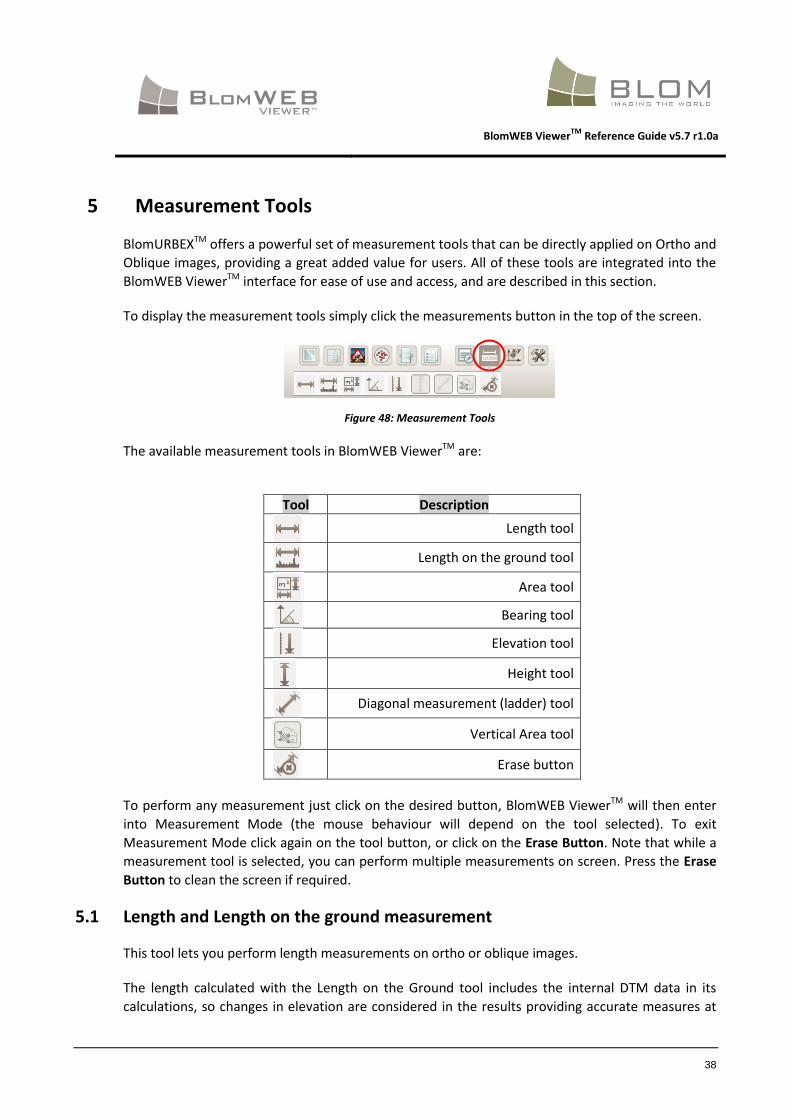
4.2.1 Drawing text
Type the desired text in the text box and select the foreground and background colours by
clicking on the respective text pickers.
Click the button to start drawing the text
Click on the map to select the starting position for the text
Repeat the procedure as needed
Figure 47: Drawing texts
4.3 Exporting annotations
The annotation layer can be exported to a SHP file. Refer to section 8.2 for details.
BlomWEB ViewerTM
Reference Guide v5.7 r1.0a
38
5 Measurement Tools
BlomURBEXTM offers a powerful set of measurement tools that can be directly applied on Ortho and
Oblique images, providing a great added value for users. All of these tools are integrated into the
BlomWEB ViewerTM interface for ease of use and access, and are described in this section.
To display the measurement tools simply click the measurements button in the top of the screen.
Figure 48: Measurement Tools
The available measurement tools in BlomWEB ViewerTM are:
Tool Description
Length tool
Length on the ground tool
Area tool
Bearing tool
Elevation tool
Height tool
Diagonal measurement (ladder) tool
Vertical Area tool
Erase button
To perform any measurement just click on the desired button, BlomWEB ViewerTM will then enter
into Measurement Mode (the mouse behaviour will depend on the tool selected). To exit
Measurement Mode click again on the tool button, or click on the Erase Button. Note that while a
measurement tool is selected, you can perform multiple measurements on screen. Press the Erase
Button to clean the screen if required.
5.1 Length and Length on the ground measurement
This tool lets you perform length measurements on ortho or oblique images.
The length calculated with the Length on the Ground tool includes the internal DTM data in its
calculations, so changes in elevation are considered in the results providing accurate measures at
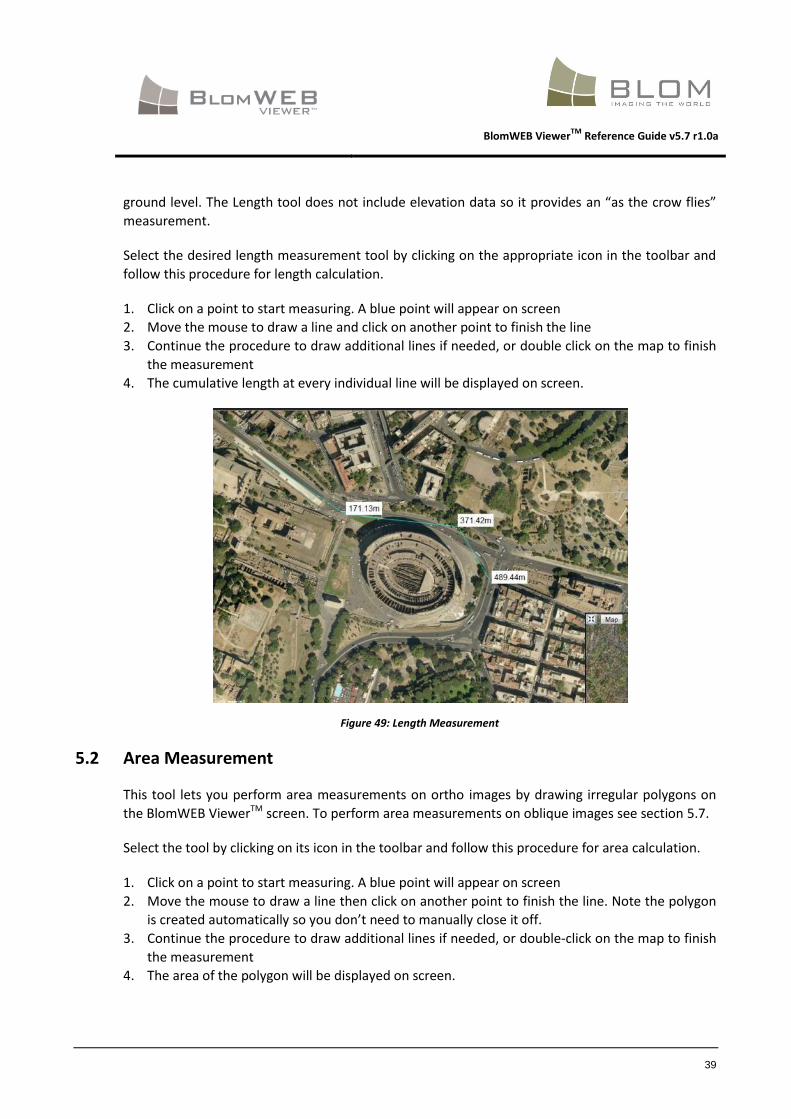
BlomWEB ViewerTM
Reference Guide v5.7 r1.0a
39
ground level. The Length tool does not include elevation data so it provides an “as the crow flies”
measurement.
Select the desired length measurement tool by clicking on the appropriate icon in the toolbar and
follow this procedure for length calculation.
1. Click on a point to start measuring. A blue point will appear on screen
2. Move the mouse to draw a line and click on another point to finish the line
3. Continue the procedure to draw additional lines if needed, or double click on the map to finish
the measurement
4. The cumulative length at every individual line will be displayed on screen.
Figure 49: Length Measurement
5.2 Area Measurement
This tool lets you perform area measurements on ortho images by drawing irregular polygons on
the BlomWEB ViewerTM screen. To perform area measurements on oblique images see section 5.7.
Select the tool by clicking on its icon in the toolbar and follow this procedure for area calculation.
1. Click on a point to start measuring. A blue point will appear on screen
2. Move the mouse to draw a line then click on another point to finish the line. Note the polygon
is created automatically so you don’t need to manually close it off.
3. Continue the procedure to draw additional lines if needed, or double-click on the map to finish
the measurement
4. The area of the polygon will be displayed on screen.

BlomWEB ViewerTM
Reference Guide v5.7 r1.0a
40
Figure 50: Area Measurement
5.3 Bearing Measurement
This tool lets you measure the bearing or azimuth (angle relative to the North) of a line.
Select the tool by clicking on its icon in the toolbar and follow this procedure for bearing
calculation.
1. Click on a point to start measuring. A blue point will appear on screen
2. Move the mouse to draw a line.
3. Click again on the map to finish the measurement
4. The bearing of the resultant line, in sexagesimal degrees, will be displayed on screen.
Figure 51: Bearing Calculation
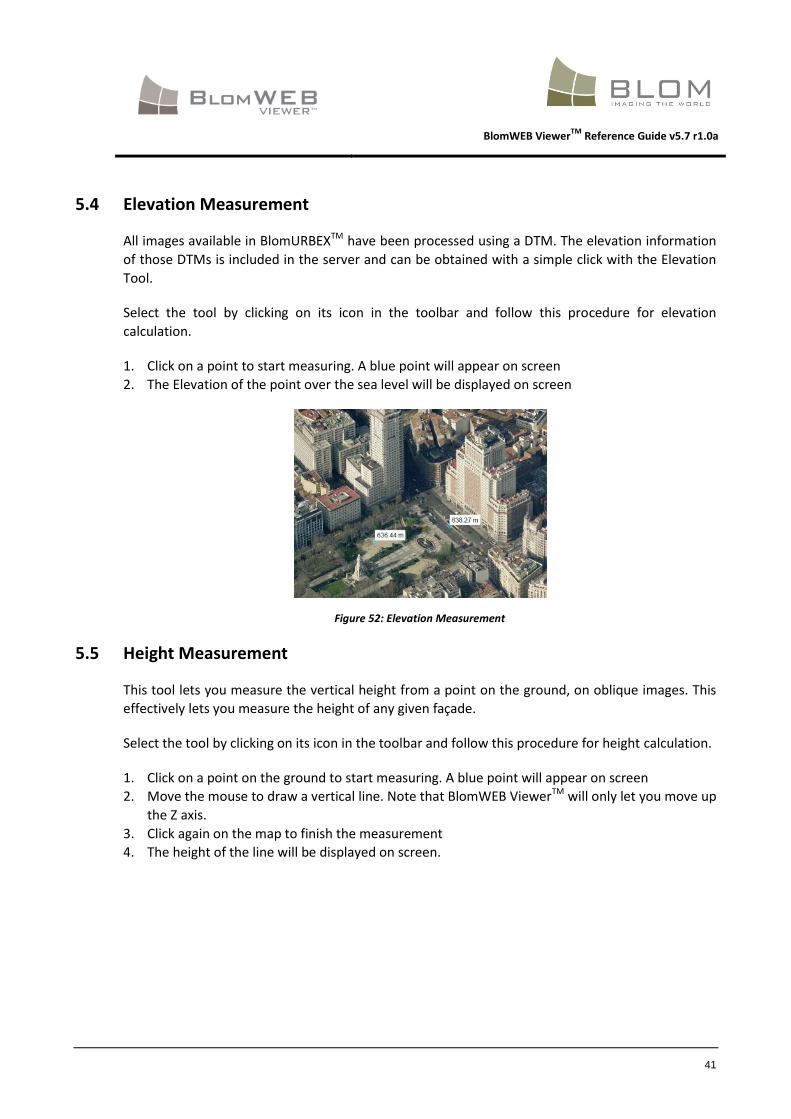
BlomWEB ViewerTM
Reference Guide v5.7 r1.0a
41
5.4 Elevation Measurement
All images available in BlomURBEXTM have been processed using a DTM. The elevation information
of those DTMs is included in the server and can be obtained with a simple click with the Elevation
Tool.
Select the tool by clicking on its icon in the toolbar and follow this procedure for elevation
calculation.
1. Click on a point to start measuring. A blue point will appear on screen
2. The Elevation of the point over the sea level will be displayed on screen
Figure 52: Elevation Measurement
5.5 Height Measurement
This tool lets you measure the vertical height from a point on the ground, on oblique images. This
effectively lets you measure the height of any given façade.
Select the tool by clicking on its icon in the toolbar and follow this procedure for height calculation.
1. Click on a point on the ground to start measuring. A blue point will appear on screen
2. Move the mouse to draw a vertical line. Note that BlomWEB ViewerTM will only let you move up
the Z axis.
3. Click again on the map to finish the measurement
4. The height of the line will be displayed on screen.
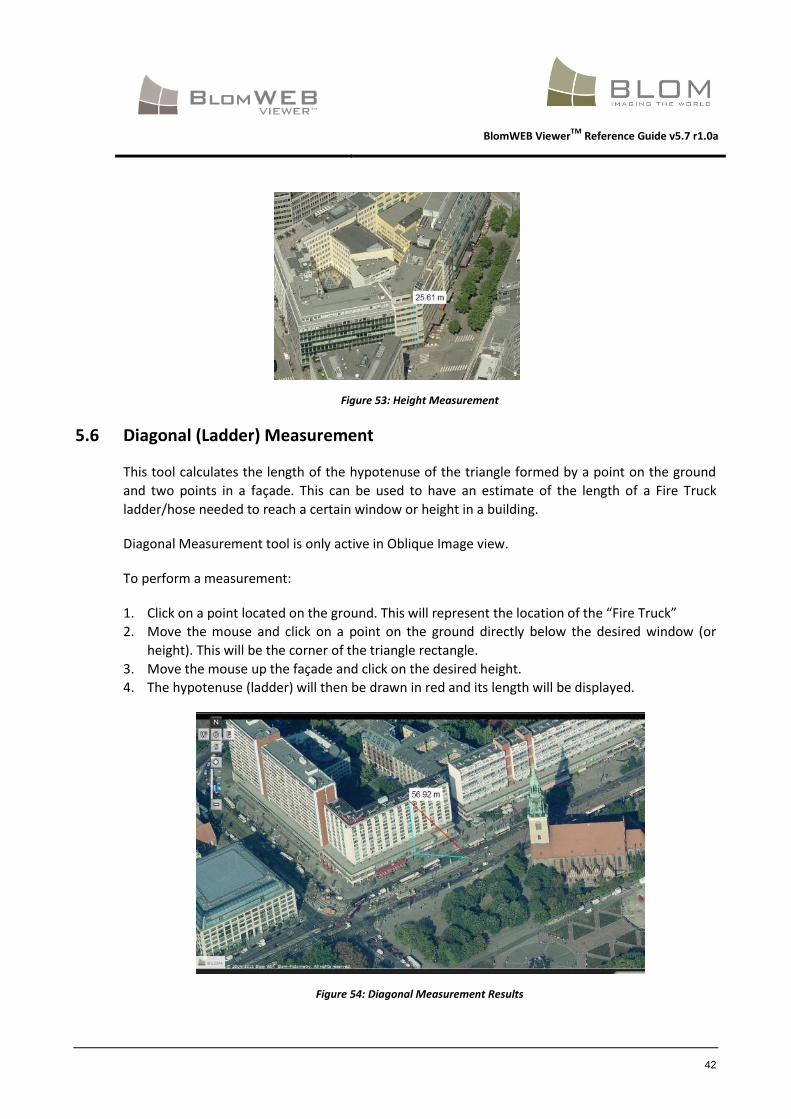
BlomWEB ViewerTM
Reference Guide v5.7 r1.0a
42
Figure 53: Height Measurement
5.6 Diagonal (Ladder) Measurement
This tool calculates the length of the hypotenuse of the triangle formed by a point on the ground
and two points in a façade. This can be used to have an estimate of the length of a Fire Truck
ladder/hose needed to reach a certain window or height in a building.
Diagonal Measurement tool is only active in Oblique Image view.
To perform a measurement:
1. Click on a point located on the ground. This will represent the location of the “Fire Truck”
2. Move the mouse and click on a point on the ground directly below the desired window (or
height). This will be the corner of the triangle rectangle.
3. Move the mouse up the façade and click on the desired height.
4. The hypotenuse (ladder) will then be drawn in red and its length will be displayed.
Figure 54: Diagonal Measurement Results
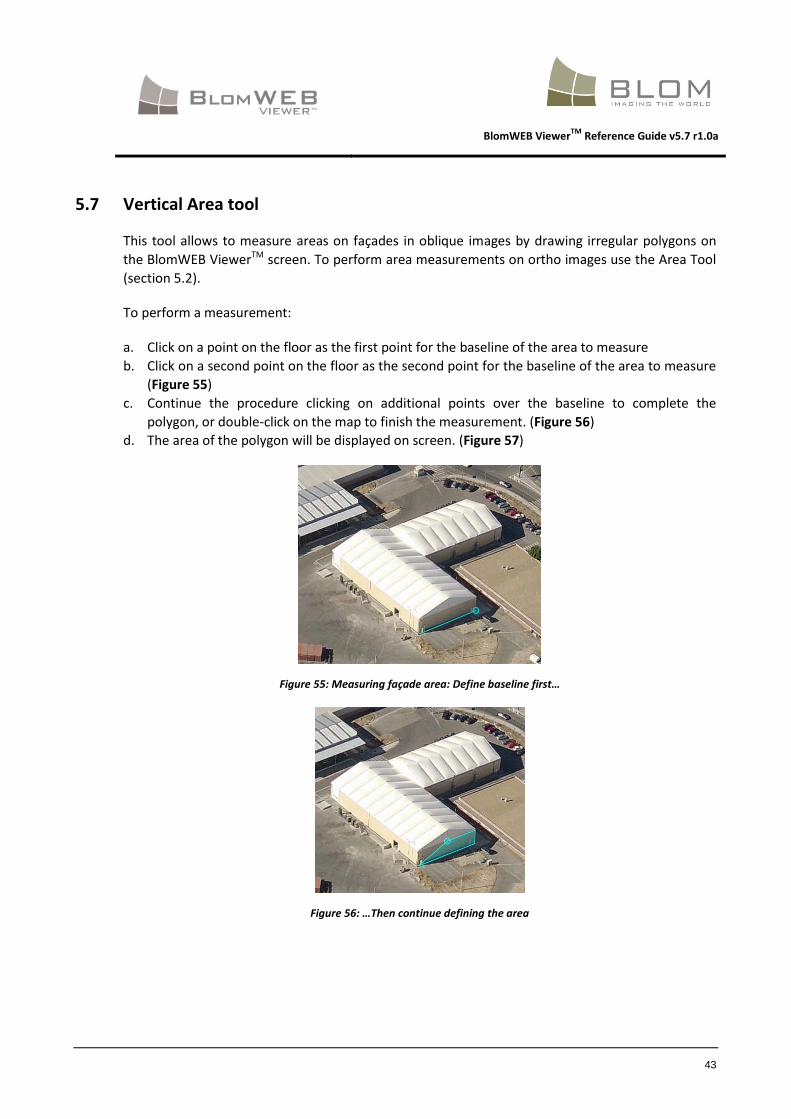
BlomWEB ViewerTM
Reference Guide v5.7 r1.0a
43
5.7 Vertical Area tool
This tool allows to measure areas on façades in oblique images by drawing irregular polygons on
the BlomWEB ViewerTM screen. To perform area measurements on ortho images use the Area Tool
(section 5.2).
To perform a measurement:
a. Click on a point on the floor as the first point for the baseline of the area to measure
b. Click on a second point on the floor as the second point for the baseline of the area to measure
(Figure 55)
c. Continue the procedure clicking on additional points over the baseline to complete the
polygon, or double-click on the map to finish the measurement. (Figure 56)
d. The area of the polygon will be displayed on screen. (Figure 57)
Figure 55: Measuring façade area: Define baseline first…
Figure 56: …Then continue defining the area
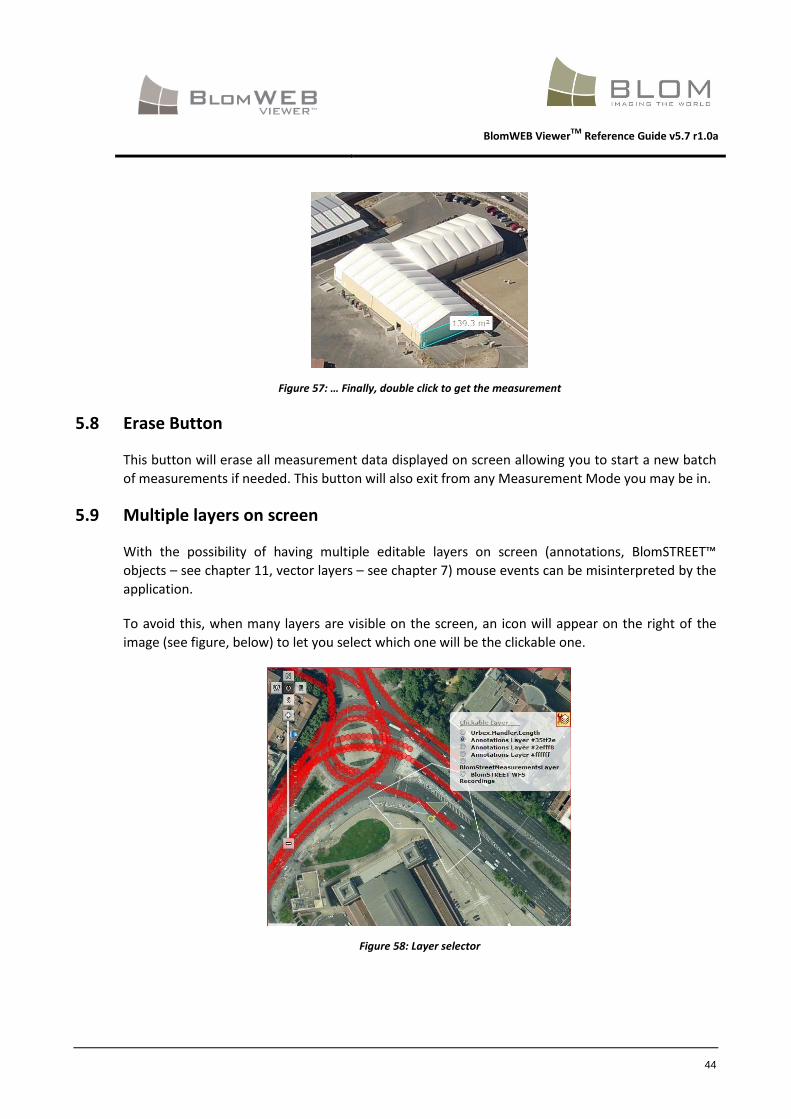
BlomWEB ViewerTM
Reference Guide v5.7 r1.0a
44
Figure 57: … Finally, double click to get the measurement
5.8 Erase Button
This button will erase all measurement data displayed on screen allowing you to start a new batch
of measurements if needed. This button will also exit from any Measurement Mode you may be in.
5.9 Multiple layers on screen
With the possibility of having multiple editable layers on screen (annotations, BlomSTREET™
objects – see chapter 11, vector layers – see chapter 7) mouse events can be misinterpreted by the
application.
To avoid this, when many layers are visible on the screen, an icon will appear on the right of the
image (see figure, below) to let you select which one will be the clickable one.
Figure 58: Layer selector
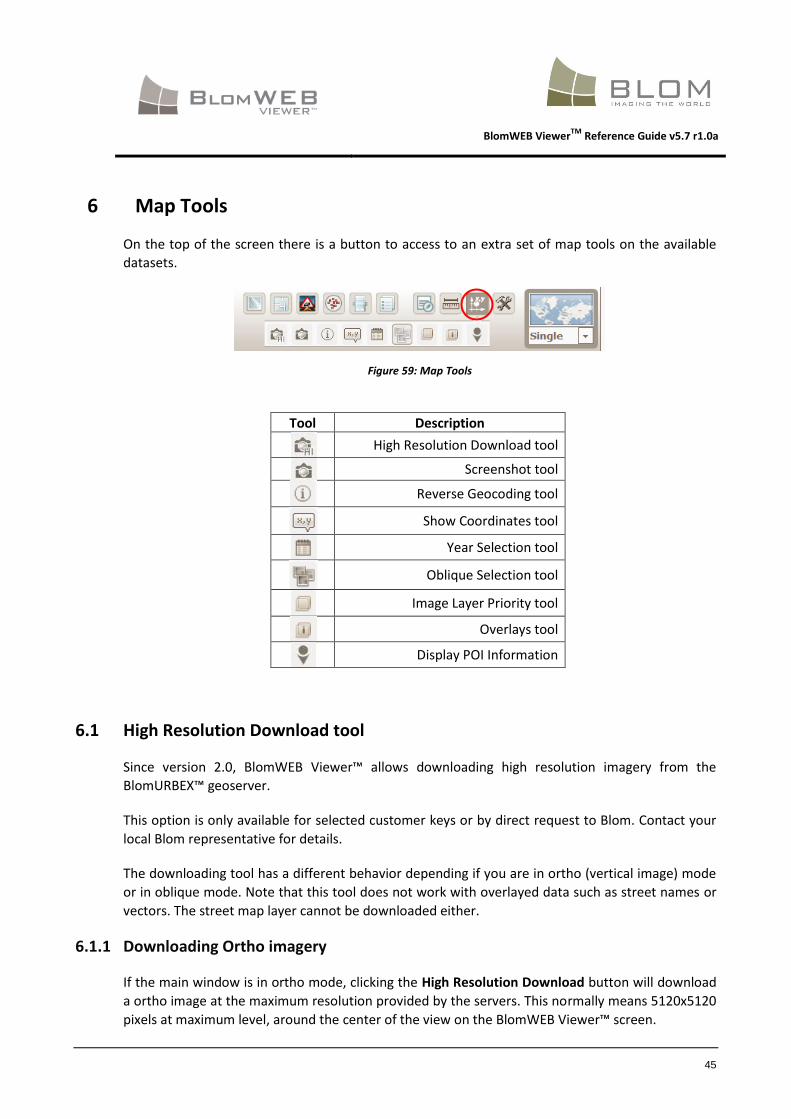
BlomWEB ViewerTM
Reference Guide v5.7 r1.0a
45
6 Map Tools
On the top of the screen there is a button to access to an extra set of map tools on the available
datasets.
Figure 59: Map Tools
Tool Description
High Resolution Download tool
Screenshot tool
Reverse Geocoding tool
Show Coordinates tool
Year Selection tool
Oblique Selection tool
Image Layer Priority tool
Overlays tool
Display POI Information
6.1 High Resolution Download tool
Since version 2.0, BlomWEB Viewer™ allows downloading high resolution imagery from the
BlomURBEX™ geoserver.
This option is only available for selected customer keys or by direct request to Blom. Contact your
local Blom representative for details.
The downloading tool has a different behavior depending if you are in ortho (vertical image) mode
or in oblique mode. Note that this tool does not work with overlayed data such as street names or
vectors. The street map layer cannot be downloaded either.
6.1.1 Downloading Ortho imagery
If the main window is in ortho mode, clicking the High Resolution Download button will download
a ortho image at the maximum resolution provided by the servers. This normally means 5120x5120
pixels at maximum level, around the center of the view on the BlomWEB Viewer™ screen.
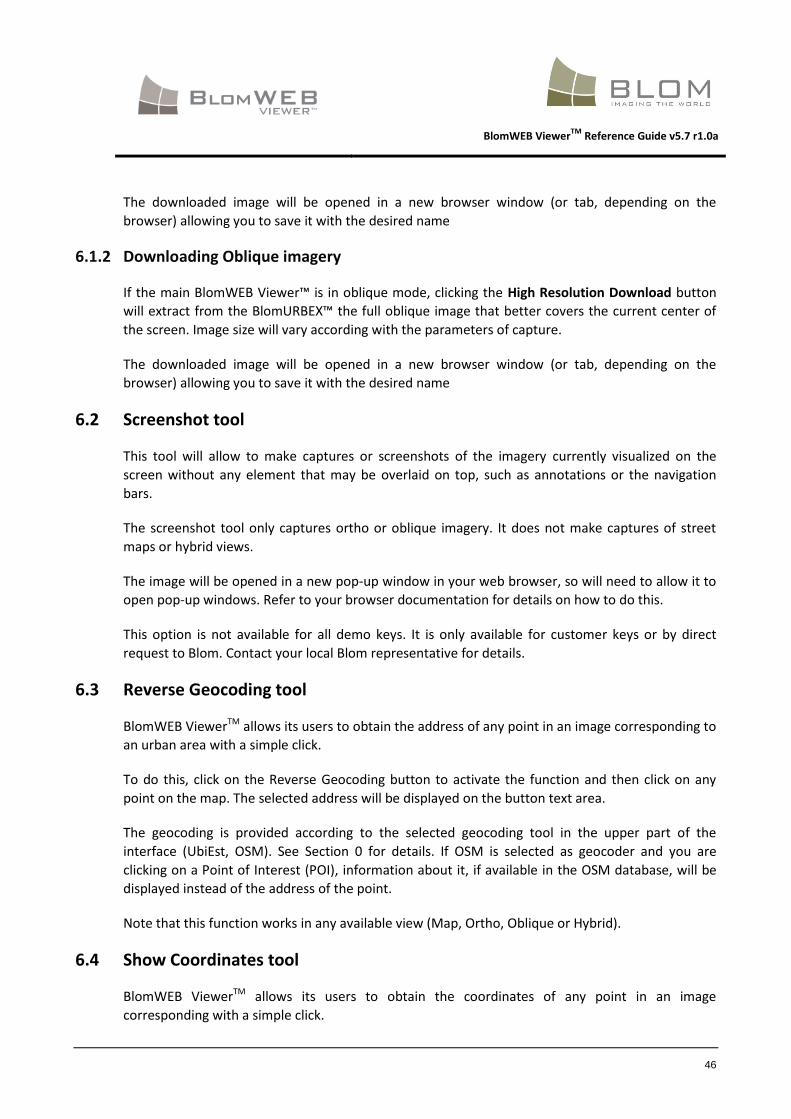
BlomWEB ViewerTM
Reference Guide v5.7 r1.0a
46
The downloaded image will be opened in a new browser window (or tab, depending on the
browser) allowing you to save it with the desired name
6.1.2 Downloading Oblique imagery
If the main BlomWEB Viewer™ is in oblique mode, clicking the High Resolution Download button
will extract from the BlomURBEX™ the full oblique image that better covers the current center of
the screen. Image size will vary according with the parameters of capture.
The downloaded image will be opened in a new browser window (or tab, depending on the
browser) allowing you to save it with the desired name
6.2 Screenshot tool
This tool will allow to make captures or screenshots of the imagery currently visualized on the
screen without any element that may be overlaid on top, such as annotations or the navigation
bars.
The screenshot tool only captures ortho or oblique imagery. It does not make captures of street
maps or hybrid views.
The image will be opened in a new pop-up window in your web browser, so will need to allow it to
open pop-up windows. Refer to your browser documentation for details on how to do this.
This option is not available for all demo keys. It is only available for customer keys or by direct
request to Blom. Contact your local Blom representative for details.
6.3 Reverse Geocoding tool
BlomWEB ViewerTM allows its users to obtain the address of any point in an image corresponding to
an urban area with a simple click.
To do this, click on the Reverse Geocoding button to activate the function and then click on any
point on the map. The selected address will be displayed on the button text area.
The geocoding is provided according to the selected geocoding tool in the upper part of the
interface (UbiEst, OSM). See Section 0 for details. If OSM is selected as geocoder and you are
clicking on a Point of Interest (POI), information about it, if available in the OSM database, will be
displayed instead of the address of the point.
Note that this function works in any available view (Map, Ortho, Oblique or Hybrid).
6.4 Show Coordinates tool
BlomWEB ViewerTM allows its users to obtain the coordinates of any point in an image
corresponding with a simple click.
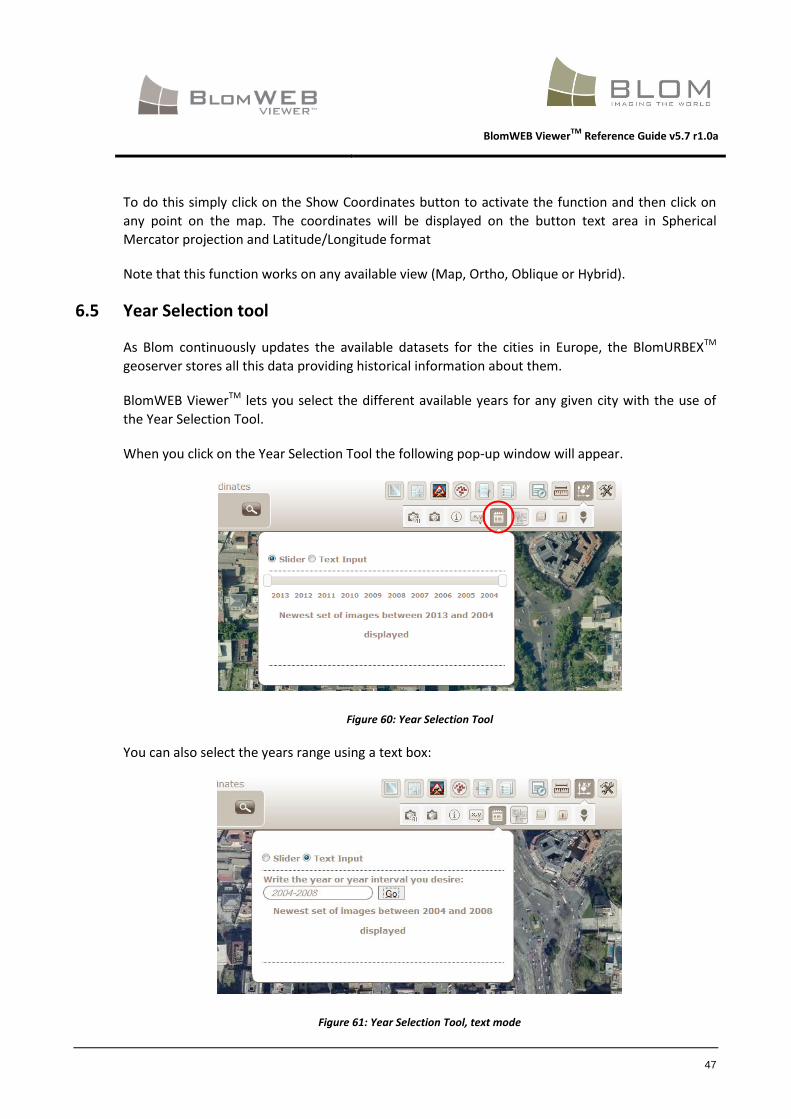
BlomWEB ViewerTM
Reference Guide v5.7 r1.0a
47
To do this simply click on the Show Coordinates button to activate the function and then click on
any point on the map. The coordinates will be displayed on the button text area in Spherical
Mercator projection and Latitude/Longitude format
Note that this function works on any available view (Map, Ortho, Oblique or Hybrid).
6.5 Year Selection tool
As Blom continuously updates the available datasets for the cities in Europe, the BlomURBEXTM
geoserver stores all this data providing historical information about them.
BlomWEB ViewerTM lets you select the different available years for any given city with the use of
the Year Selection Tool.
When you click on the Year Selection Tool the following pop-up window will appear.
Figure 60: Year Selection Tool
You can also select the years range using a text box:
Figure 61: Year Selection Tool, text mode

BlomWEB ViewerTM
Reference Guide v5.7 r1.0a
48
The system will show images in the current area for the selected range of years, starting on the
most recent one. If there are no images for the range the screen will appear black. The interval can
be defined by dragging the two sliders located on top of the year’s numbers.
6.5.1 Year selection and MultiView
Note that this tool can be easily combined with the MultiView feature on the viewer, so you can
easily display two different views of the same city from different years.
Figure 62: Multiview with different imagery years

BlomWEB ViewerTM
Reference Guide v5.7 r1.0a
49
6.6 Oblique Selection tool
In order to produce Oblique imagery of urban areas the aircraft capturing the images makes several
passes over the cities to ensure enough overlap. This means that a given point in a city is often
covered by more than 10 oblique images per year.
The Oblique Selection tool allows you to see how many images that cover the current centre of the
screen there are. If you click on the All Orientations option the list will display all available oblique
images regardless of orientation.
Figure 63: Oblique Views Selection
You can select any Oblique view from the list to display it immediately. Note that the naming of the
images includes the coordinates of the central point and the date of its capture in YYMMDD format
(Year-Month-Day).
Note that this tool is available only if you are seeing Natural Obliques (as Orthorectified Obliques
are Ortho images in all senses).
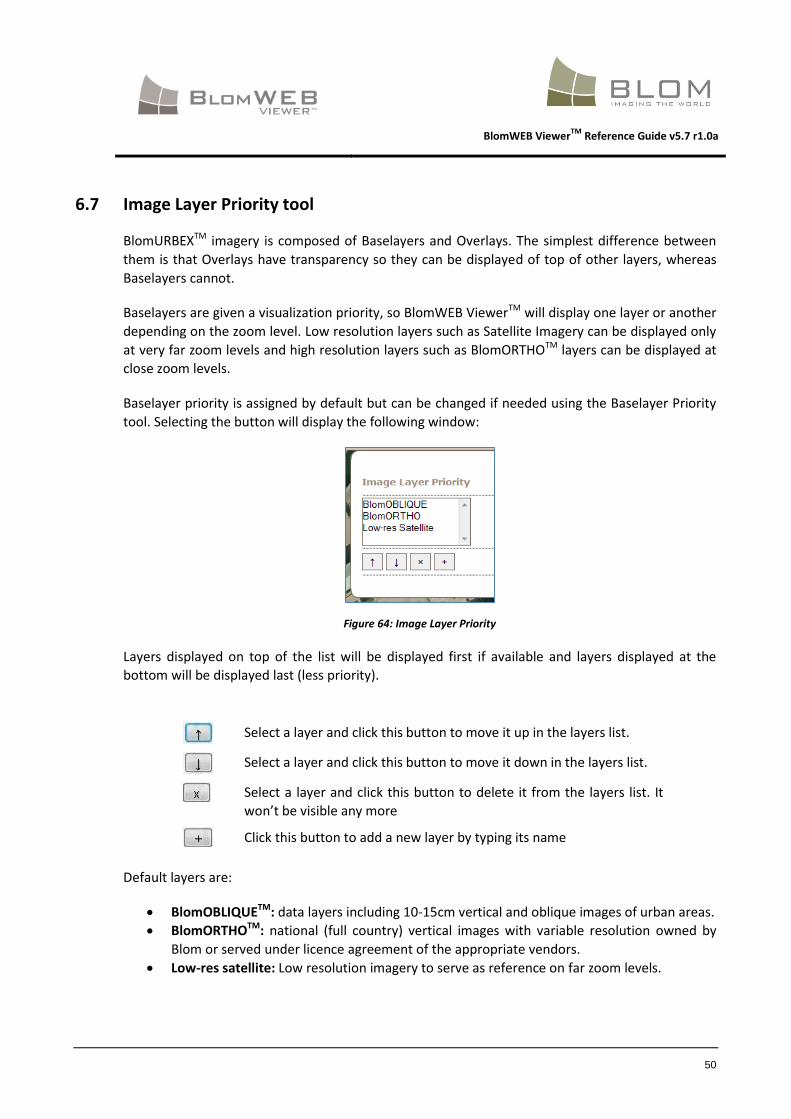
BlomWEB ViewerTM
Reference Guide v5.7 r1.0a
50
6.7 Image Layer Priority tool
BlomURBEXTM imagery is composed of Baselayers and Overlays. The simplest difference between
them is that Overlays have transparency so they can be displayed of top of other layers, whereas
Baselayers cannot.
Baselayers are given a visualization priority, so BlomWEB ViewerTM will display one layer or another
depending on the zoom level. Low resolution layers such as Satellite Imagery can be displayed only
at very far zoom levels and high resolution layers such as BlomORTHOTM layers can be displayed at
close zoom levels.
Baselayer priority is assigned by default but can be changed if needed using the Baselayer Priority
tool. Selecting the button will display the following window:
Figure 64: Image Layer Priority
Layers displayed on top of the list will be displayed first if available and layers displayed at the
bottom will be displayed last (less priority).
Select a layer and click this button to move it up in the layers list.
Select a layer and click this button to move it down in the layers list.
Select a layer and click this button to delete it from the layers list. It
won’t be visible any more
Click this button to add a new layer by typing its name
Default layers are:
BlomOBLIQUETM: data layers including 10-15cm vertical and oblique images of urban areas.
BlomORTHOTM: national (full country) vertical images with variable resolution owned by
Blom or served under licence agreement of the appropriate vendors.
Low-res satellite: Low resolution imagery to serve as reference on far zoom levels.
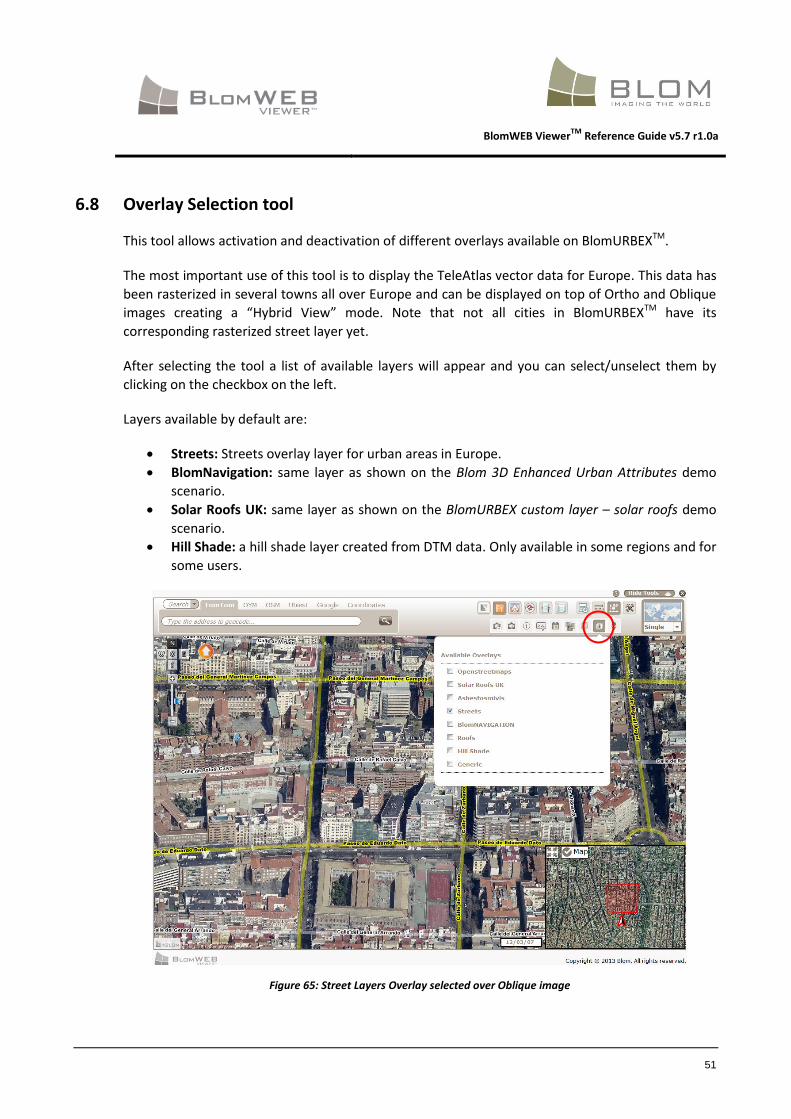
BlomWEB ViewerTM
Reference Guide v5.7 r1.0a
51
6.8 Overlay Selection tool
This tool allows activation and deactivation of different overlays available on BlomURBEXTM.
The most important use of this tool is to display the TeleAtlas vector data for Europe. This data has
been rasterized in several towns all over Europe and can be displayed on top of Ortho and Oblique
images creating a “Hybrid View” mode. Note that not all cities in BlomURBEXTM have its
corresponding rasterized street layer yet.
After selecting the tool a list of available layers will appear and you can select/unselect them by
clicking on the checkbox on the left.
Layers available by default are:
Streets: Streets overlay layer for urban areas in Europe.
BlomNavigation: same layer as shown on the Blom 3D Enhanced Urban Attributes demo
scenario.
Solar Roofs UK: same layer as shown on the BlomURBEX custom layer – solar roofs demo
scenario.
Hill Shade: a hill shade layer created from DTM data. Only available in some regions and for
some users.
Figure 65: Street Layers Overlay selected over Oblique image

BlomWEB ViewerTM
Reference Guide v5.7 r1.0a
52
6.9 Points of Interest (POIs)
The BlomURBEX™ JavaScript API allows the management and rendering of Points of Interest (POI)
information. This makes the geoserver able to store and retrieve information about the location,
type and contents of several categories of POIs that can be accessed by developers for creating
high value-added applications. Refer to the BlomURBEX™ JavaScript API documentation for
additional details on this.
BlomWEB Viewer™ makes use of the API capabilities to showcase this option using the contents of
several POI providers.
Since version 2.0, BlomWEB Viewer™ includes a sample of POI contents from Geomobile in Spain.
To access this data simply click on the Display POI Information icon to open the POI Window.
Figure 66: POIs button
Figure 67: POIs Window
Since version 2.1 of BlomWEB Viewer™, the different providers appear as collapsible tree-views.
This way it will be easier to showcase several providers on the window.

BlomWEB ViewerTM
Reference Guide v5.7 r1.0a
53
By default all existing POI categories are disabled. To show any of them on screen just click on its
checkbox on the right. The selected categories will be displayed on screen. Icons shown will depend
on the information provided by the POI provider. In some cases there can be proprietary and not
generic icons for displaying information.
Figure 68: POI database displayed
Clicking on any icon will open a pop-up window showing the available information about the
associated POI. Click on the ‘X’ icon on the upper right corner to close the pop-up.
Note that all POI information shown is part of the provider contents and is shown “as is”.
Information shown in BlomWEB Viewer™ POI sample is just a sample for demoing purposes.
Additional providers will be included in the future as new agreements are signed.
Figure 69: Displaying POI information

BlomWEB ViewerTM
Reference Guide v5.7 r1.0a
54
7 Additional Tools
A new set of tools has been included in BlomWEB Viewer™, grouped together under the generic
Additional Tools button.
Figure 70: Additional tools
Tool Description
View and Save Layers and Workspace
Upload Vector File
Manage Graphical Profiles
Execute and Upload Plugins
Upload JPG/JGW images
Workspaces and Custom layers are described on Chapter 8. Plugins are detailed on Chapter 12. This
section covers the capability for uploading shape files and the graphic profile management.
7.1 Vector Files uploading
BlomWEB Viewer™ allows you to upload vector files to be displayed on top of the existing imagery
from BlomURBEX™. Formats currently available are SHP, KML and KMZ.
To upload vector data there are several options:
Upload a ZIP file: the ZIP file must contain:
o Any number of .SHP files
o The corresponding companion files for the SHPs (.PRJ, .DBF, .SHX, etc.)
Upload a single SHP file (you will be asked to provide the file's ESPG:xxxx projection)
Upload a single KML or KMZ file
Note: uploaded shape files are stored temporarily on your BlomWEB User Area (BUA). This means
that they will not be available for future sessions and you will need to upload them again if needed.
If you need to keep an uploaded shape file for future use you need to convert it to a Custom Layer.
Refer to Chapter 8 for details.

BlomWEB ViewerTM
Reference Guide v5.7 r1.0a
55
If you provide a DBF file with the SHP file (using the upload ZIP option), BlomWEB Viewer™ will
show the associated attributed of the geometry when selected on screen with the mouse cursor.
Refer to chapter 8 for details on how to visualize custom layers in BlomWEB Viewer™.
Figure 71: Accesing attribute information from vector layer

BlomWEB ViewerTM
Reference Guide v5.7 r1.0a
56
7.2 Graphic Profiles Management
Since version 2.0, BlomWEB Viewer™ includes capabilities for customizing the look and feel of the
application in the form of predefined skins. It will also allow you to use a company logo to replace
the BlomWEB Viewer™ and help customize the tool for your own internal needs.
7.2.1 Skin selection
A different set of graphical skins have been preloaded. To change the application, skin simply select
one of the available skins and click the Apply button. The application appearance will then change.
Figure 72: Skin selection
Figure 73: The new skin applied
You can make any one of the existing skin profiles the default. To do this just select a skin and click
on the Save as default button. If you do not select a skin, the default one will be loaded.
Additional skins can be produced and included into BlomWEB Viewer™. Contact your local Blom
support representative for details on the BlomWEB Viewer™ skin definition.
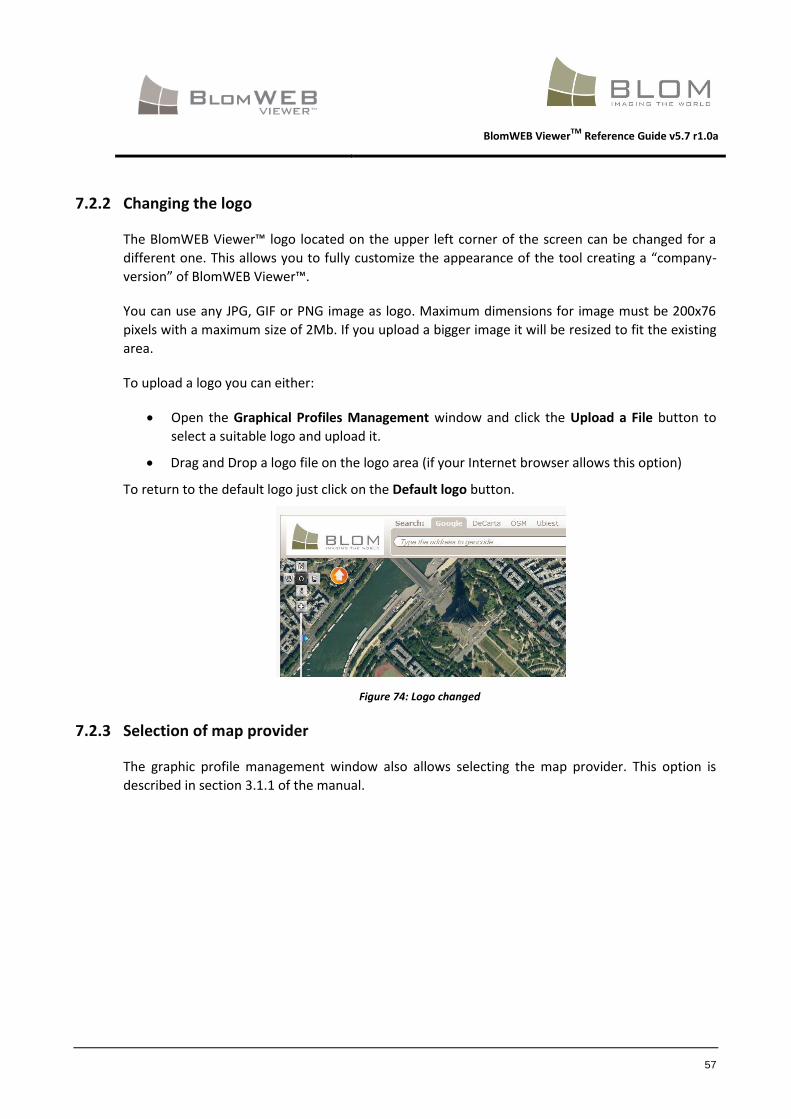
BlomWEB ViewerTM
Reference Guide v5.7 r1.0a
57
7.2.2 Changing the logo
The BlomWEB Viewer™ logo located on the upper left corner of the screen can be changed for a
different one. This allows you to fully customize the appearance of the tool creating a “company-
version” of BlomWEB Viewer™.
You can use any JPG, GIF or PNG image as logo. Maximum dimensions for image must be 200x76
pixels with a maximum size of 2Mb. If you upload a bigger image it will be resized to fit the existing
area.
To upload a logo you can either:
Open the Graphical Profiles Management window and click the Upload a File button to
select a suitable logo and upload it.
Drag and Drop a logo file on the logo area (if your Internet browser allows this option)
To return to the default logo just click on the Default logo button.
Figure 74: Logo changed
7.2.3 Selection of map provider
The graphic profile management window also allows selecting the map provider. This option is
described in section 3.1.1 of the manual.
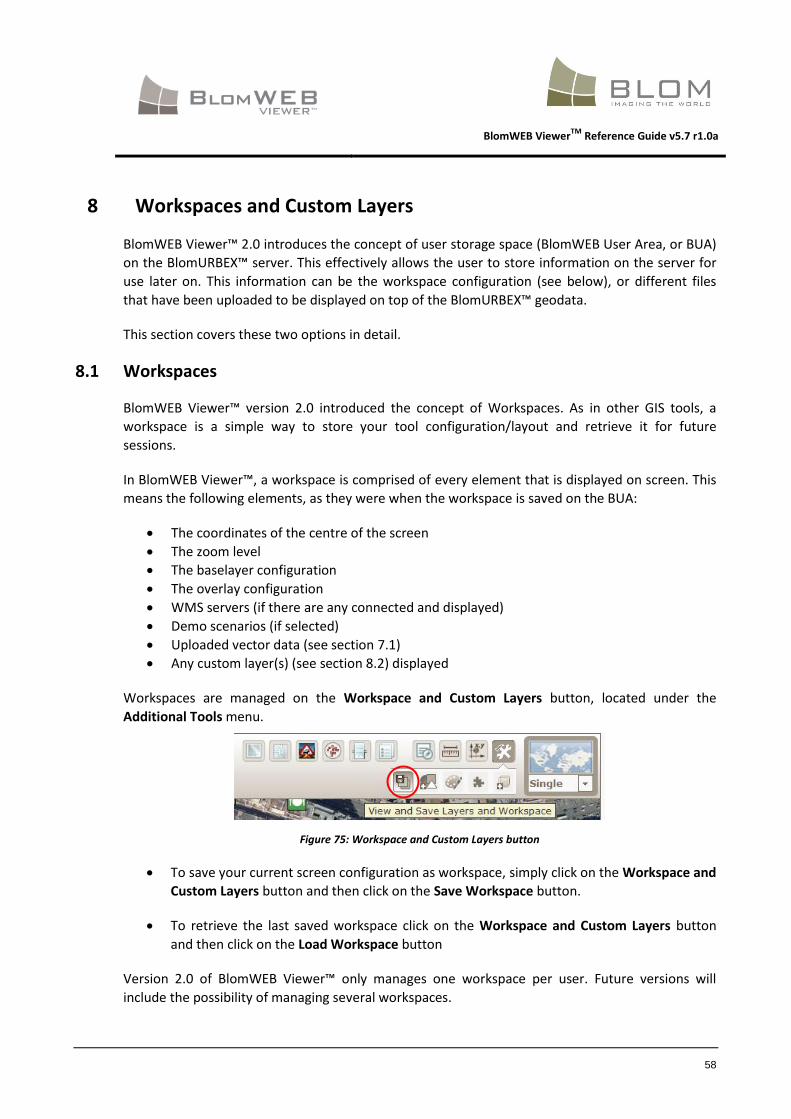
BlomWEB ViewerTM
Reference Guide v5.7 r1.0a
58
8 Workspaces and Custom Layers
BlomWEB Viewer™ 2.0 introduces the concept of user storage space (BlomWEB User Area, or BUA)
on the BlomURBEX™ server. This effectively allows the user to store information on the server for
use later on. This information can be the workspace configuration (see below), or different files
that have been uploaded to be displayed on top of the BlomURBEX™ geodata.
This section covers these two options in detail.
8.1 Workspaces
BlomWEB Viewer™ version 2.0 introduced the concept of Workspaces. As in other GIS tools, a
workspace is a simple way to store your tool configuration/layout and retrieve it for future
sessions.
In BlomWEB Viewer™, a workspace is comprised of every element that is displayed on screen. This
means the following elements, as they were when the workspace is saved on the BUA:
The coordinates of the centre of the screen
The zoom level
The baselayer configuration
The overlay configuration
WMS servers (if there are any connected and displayed)
Demo scenarios (if selected)
Uploaded vector data (see section 7.1)
Any custom layer(s) (see section 8.2) displayed
Workspaces are managed on the Workspace and Custom Layers button, located under the
Additional Tools menu.
Figure 75: Workspace and Custom Layers button
To save your current screen configuration as workspace, simply click on the Workspace and
Custom Layers button and then click on the Save Workspace button.
To retrieve the last saved workspace click on the Workspace and Custom Layers button
and then click on the Load Workspace button
Version 2.0 of BlomWEB Viewer™ only manages one workspace per user. Future versions will
include the possibility of managing several workspaces.

BlomWEB ViewerTM
Reference Guide v5.7 r1.0a
59
The Workspace and Custom Layers window is divided in to two main areas: the Workspace Layers
area and the Custom Layers area. Both concepts are described in the following sections.
Figure 76. Workspace and Custom Layers window
8.1.1 Workspace Layers
The Workspace Layers area displays a list of all layers that are currently visible on screen. These are
the layers that will be stored if you decide to save your workspace.
In the example above (Figure 76), there are two data layers on the user configuration: the Ortho
image from a given zone and a WMS server.
The layers displayed can be of two different types: Baselayers and Overlays (refer to section 0 for
details). Baselayers cannot be edited but there are some options that can be done with overlays.
Moving the mouse over the layer name will show three options:
Go To: This will center the screen view on the extent of the selected SHP/KML file. This way
it is possible to move quickly to the location of the uploaded file.
Export to SHP: this will save the selected layer to a shape file. A dialog box will appear to let
you select the name and location for the output file.
Save: this option will save a copy of this layer into your BlomWEB Viewer™ User Area
(BUA). This will convert the layer into a custom layer for later use.
Hide: this option will hide the layer from the view
8.2 Custom layers
BlomWEB Viewer™ allows users to upload or create custom data layers and store them in their user
area on the server.
Currently there is a limit of five custom layers per user on the server. The example on Figure 76,
above, shows three layers stored in this user BUA: a measurements layer, an annotation layer, and
test shape file.
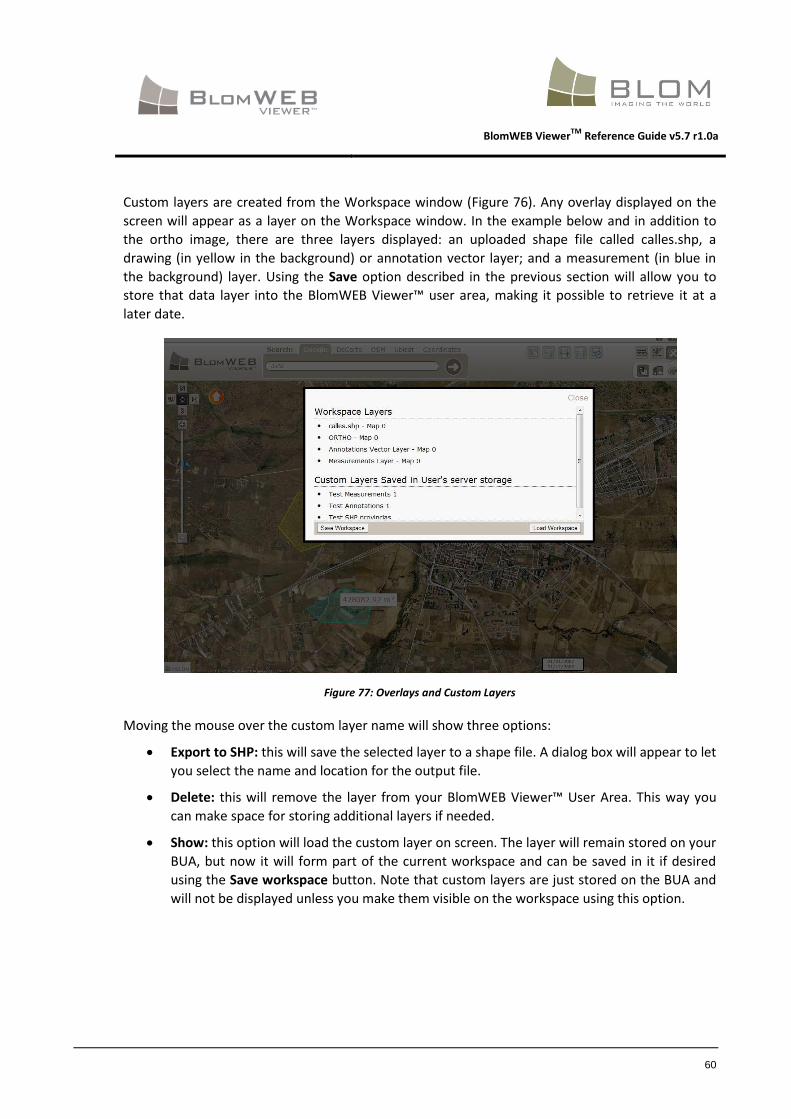
BlomWEB ViewerTM
Reference Guide v5.7 r1.0a
60
Custom layers are created from the Workspace window (Figure 76). Any overlay displayed on the
screen will appear as a layer on the Workspace window. In the example below and in addition to
the ortho image, there are three layers displayed: an uploaded shape file called calles.shp, a
drawing (in yellow in the background) or annotation vector layer; and a measurement (in blue in
the background) layer. Using the Save option described in the previous section will allow you to
store that data layer into the BlomWEB Viewer™ user area, making it possible to retrieve it at a
later date.
Figure 77: Overlays and Custom Layers
Moving the mouse over the custom layer name will show three options:
Export to SHP: this will save the selected layer to a shape file. A dialog box will appear to let
you select the name and location for the output file.
Delete: this will remove the layer from your BlomWEB Viewer™ User Area. This way you
can make space for storing additional layers if needed.
Show: this option will load the custom layer on screen. The layer will remain stored on your
BUA, but now it will form part of the current workspace and can be saved in it if desired
using the Save workspace button. Note that custom layers are just stored on the BUA and
will not be displayed unless you make them visible on the workspace using this option.

BlomWEB ViewerTM
Reference Guide v5.7 r1.0a
61
8.3 Symbology Edition for Vector Layers
Custom vector layers that are loaded into the workspace (see above) can have their symbology
edited from Version 3.0 of BlomWEB Viewer™.
Figure 78: Vector Layer Symbology Edition
As seen in Figure 78, above; you can select now the colour of the vector layer as well as the
opacity level, so that the vector layer can be display with transparency effect. On the example
above, a layer called TO_EDIF_4000.KML has been loaded on the workspace and its base colour is
green. Changing the colour and opacity level can lead to results like the one shown below.
Figure 79: Vector Symbology changed
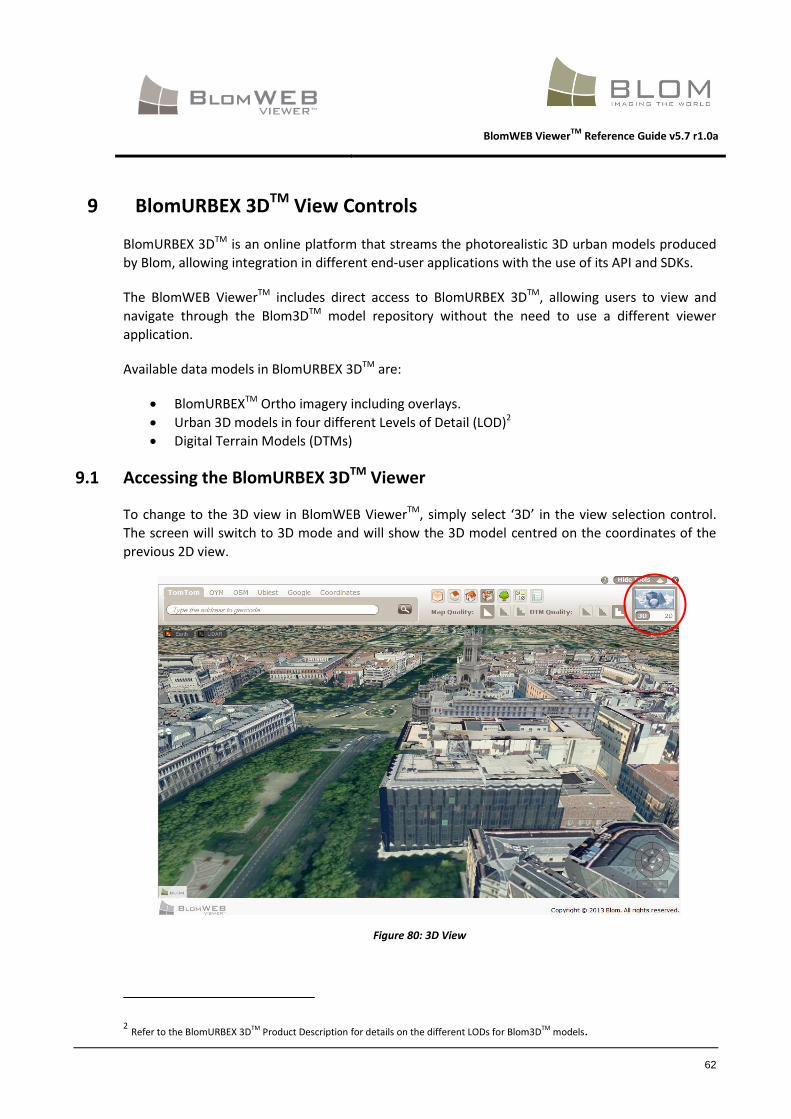
BlomWEB ViewerTM
Reference Guide v5.7 r1.0a
62
9 BlomURBEX 3DTM View Controls
BlomURBEX 3DTM is an online platform that streams the photorealistic 3D urban models produced
by Blom, allowing integration in different end-user applications with the use of its API and SDKs.
The BlomWEB ViewerTM includes direct access to BlomURBEX 3DTM, allowing users to view and
navigate through the Blom3DTM model repository without the need to use a different viewer
application.
Available data models in BlomURBEX 3DTM are:
BlomURBEXTM Ortho imagery including overlays.
Urban 3D models in four different Levels of Detail (LOD)2
Digital Terrain Models (DTMs)
9.1 Accessing the BlomURBEX 3DTM Viewer
To change to the 3D view in BlomWEB ViewerTM, simply select ‘3D’ in the view selection control.
The screen will switch to 3D mode and will show the 3D model centred on the coordinates of the
previous 2D view.
Figure 80: 3D View
2 Refer to the BlomURBEX 3DTM Product Description for details on the different LODs for Blom3DTM models.
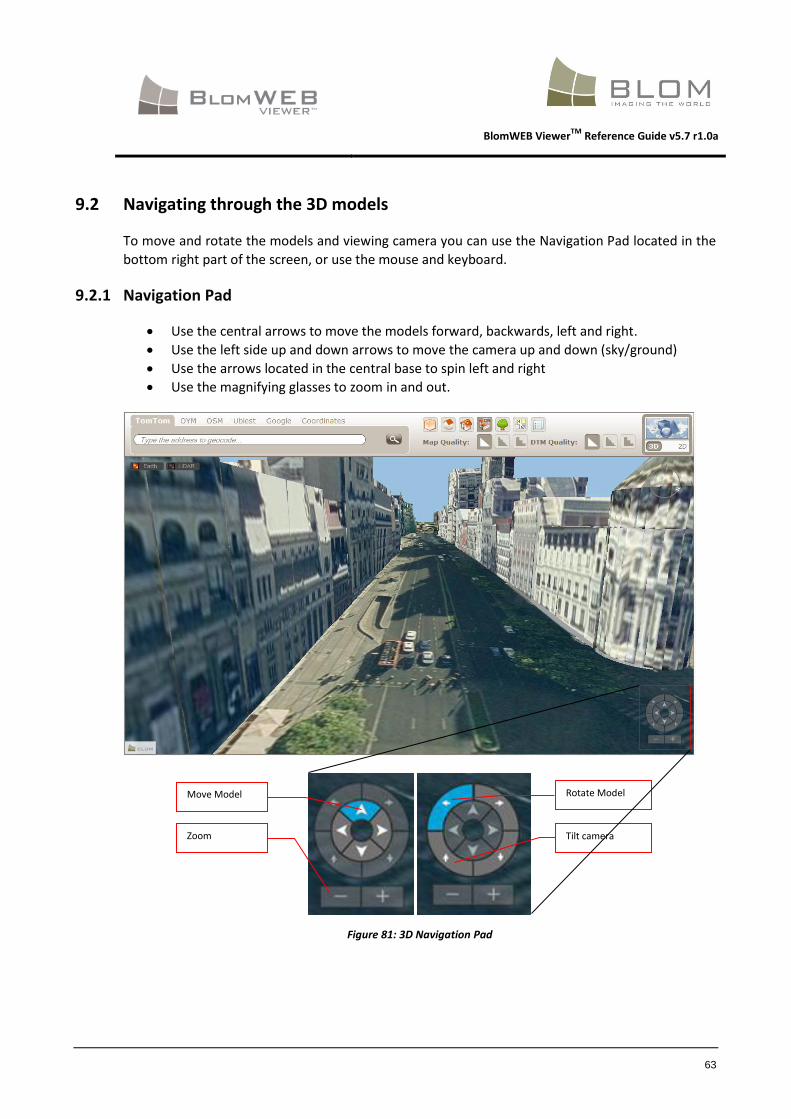
BlomWEB ViewerTM
Reference Guide v5.7 r1.0a
63
9.2 Navigating through the 3D models
To move and rotate the models and viewing camera you can use the Navigation Pad located in the
bottom right part of the screen, or use the mouse and keyboard.
9.2.1 Navigation Pad
Use the central arrows to move the models forward, backwards, left and right.
Use the left side up and down arrows to move the camera up and down (sky/ground)
Use the arrows located in the central base to spin left and right
Use the magnifying glasses to zoom in and out.
Figure 81: 3D Navigation Pad
Move Model Rotate Model
Tilt camera Zoom

BlomWEB ViewerTM
Reference Guide v5.7 r1.0a
64
9.2.2 Mouse controls
Use the central mouse wheel to zoom in and out.
Left-click and drag to move the models forward, backwards, left and right
Right-click and drag to spin left and right
Press Shift and right-click, and then drag to move the camera up and down
Make a double left-click to zoom in
Make a double right-click to zoom out
Make a double middle-click to point the camera to North.
9.2.3 Keyboard controls
Use the arrow keys to move the models forward, backwards, left and right.
Press shift and the up/down arrow keys to tilt the camera up and down
Press shift and the right/left arrow keys to rotate the camera clockwise
Press Ctrl and the right/left arrow keys to rotate the camera counter clockwise
Press Ctrl and the up/down arrow keys to zoom in and out.
9.3 Level of Detail (LOD) selection
Blom3DTM models are available on 4 different Levels of Detail:
LOD 1 (Block Model): These are 3D buildings represented as parallelogram blocks, with no
information on roofs or additional structures.
LOD 2 (RoofTop Model): This model adds roof structure and other constructions present
on the buildings.
LOD3 (Library Texture Model): This is a rooftop (LOD2) model to which automated library
textures have been added.
LOD4 (Photo-realistic Texture Model): This a rooftop model in which the building textures
are applied from the BLOM oblique images.
Refer to the Blom3DTM Product Description for a more detailed description of these LODs.
In BlomWEB ViewerTM it is possible to select dynamically the LOD to display by clicking on one of
the four LOD buttons available. Note that the currently selected LOD will be highlighted.
Figure 82: LOD Selection tool (LOD1, LOD2, LOD3, and LOD4)
9.4 Edit Mode
The BlomURBEX 3DTM Viewer included in BlomWEB ViewerTM includes an Edit Mode. In this mode
users can perform different operations on any building, such as retrieve information, move or
delete the building, as well as add new buildings from local 3D models located on their computer.

BlomWEB ViewerTM
Reference Guide v5.7 r1.0a
65
Edits done can be saved on the local machine and then be delivered later to Blom in order to
submit changes to the model to the BlomURBEX 3DTM Server.
To enter Edit Mode press the “E” key on your keyboard. A toolbox will appear. The different
available options are:
Tool Icon Action
Enable/disable edit layer
Move selected building using the arrow keys
Delete selected building
Revert to last saved version, ignoring current changes
Save into local disk
Clean all history
To use the Edit Toolbox you need to select a building. Double-click a building to select it.
Figure 83: 3D Model Selected in the Viewer
Selected buildings will be painted in green showing the wireframe mode. It is possible to select
different polygons in the façade to interact with them. The selected polygon will be displayed in
red.
Once the building is selected you can delete or move using the tools described above.

BlomWEB ViewerTM
Reference Guide v5.7 r1.0a
66
9.4.1 Changing textures in the building
You can select any image file in .JPG, .BMP or .TGA mode and drag and drop it on to the selected 3D
model. The image file will be pasted on the selected façade (in red).
Figure 84: Texture Replacement
9.4.2 Adding new buildings
You can drag and drop 3D models to the viewer screen to automatically add them to the model.
Valid formats are OBJ and VRML. The models will be represented according to their orientation and
georeference, and can be moved using the arrow keys but not rotated.
Changes will be stored locally and will be lost in later sessions unless they are saved with the Save
button.
Figure 85: External 3D model dropped on the London 3D city model
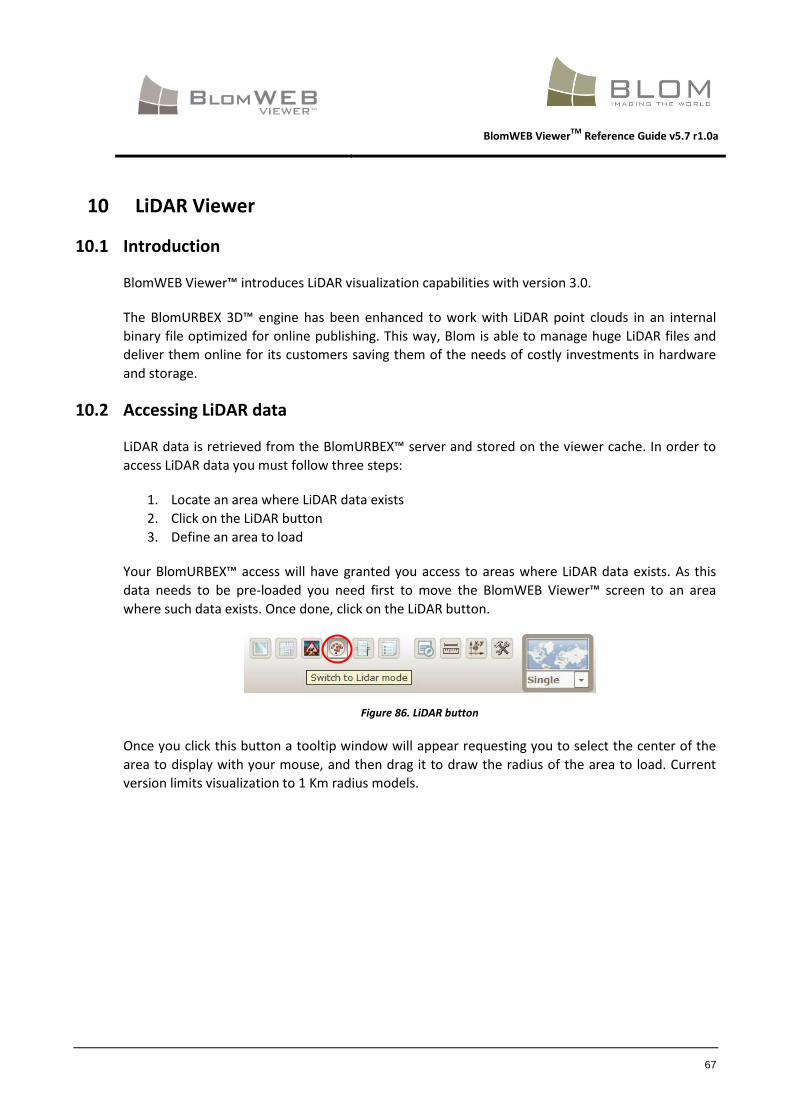
BlomWEB ViewerTM
Reference Guide v5.7 r1.0a
67
10 LiDAR Viewer
10.1 Introduction
BlomWEB Viewer™ introduces LiDAR visualization capabilities with version 3.0.
The BlomURBEX 3D™ engine has been enhanced to work with LiDAR point clouds in an internal
binary file optimized for online publishing. This way, Blom is able to manage huge LiDAR files and
deliver them online for its customers saving them of the needs of costly investments in hardware
and storage.
10.2 Accessing LiDAR data
LiDAR data is retrieved from the BlomURBEX™ server and stored on the viewer cache. In order to
access LiDAR data you must follow three steps:
1. Locate an area where LiDAR data exists
2. Click on the LiDAR button
3. Define an area to load
Your BlomURBEX™ access will have granted you access to areas where LiDAR data exists. As this
data needs to be pre-loaded you need first to move the BlomWEB Viewer™ screen to an area
where such data exists. Once done, click on the LiDAR button.
Figure 86. LiDAR button
Once you click this button a tooltip window will appear requesting you to select the center of the
area to display with your mouse, and then drag it to draw the radius of the area to load. Current
version limits visualization to 1 Km radius models.
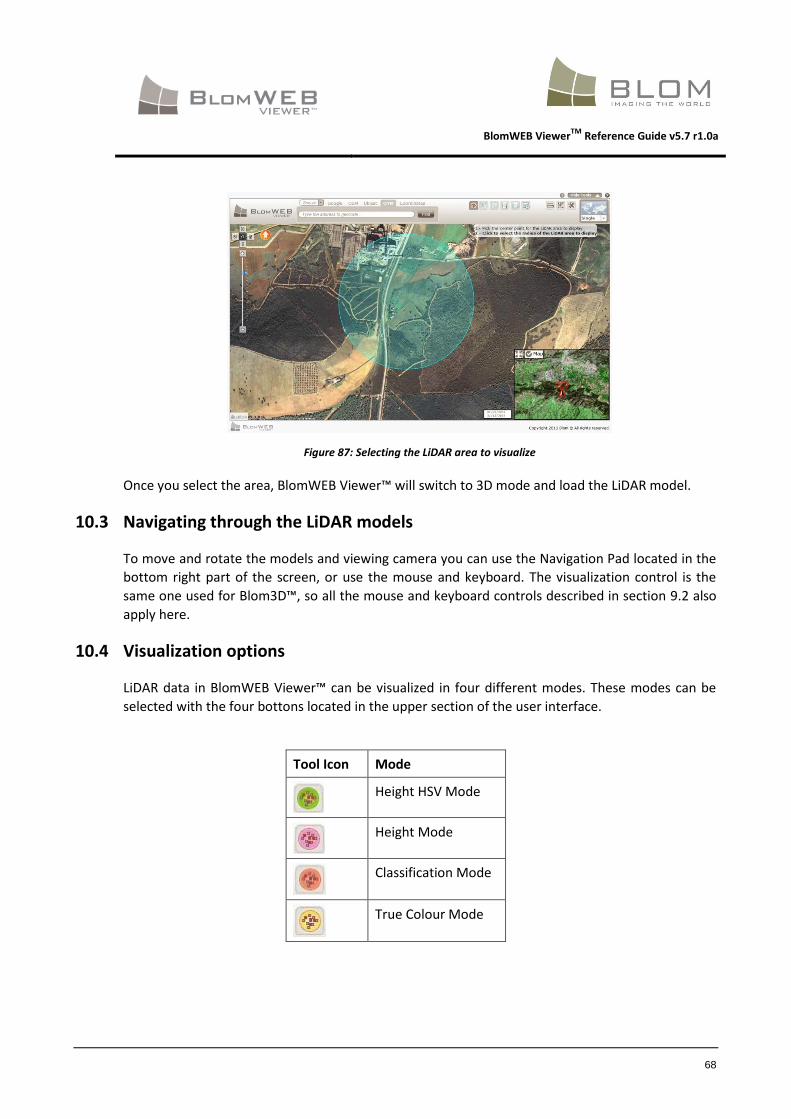
BlomWEB ViewerTM
Reference Guide v5.7 r1.0a
68
Figure 87: Selecting the LiDAR area to visualize
Once you select the area, BlomWEB Viewer™ will switch to 3D mode and load the LiDAR model.
10.3 Navigating through the LiDAR models
To move and rotate the models and viewing camera you can use the Navigation Pad located in the
bottom right part of the screen, or use the mouse and keyboard. The visualization control is the
same one used for Blom3D™, so all the mouse and keyboard controls described in section 9.2 also
apply here.
10.4 Visualization options
LiDAR data in BlomWEB Viewer™ can be visualized in four different modes. These modes can be
selected with the four bottons located in the upper section of the user interface.
Tool Icon Mode
Height HSV Mode
Height Mode
Classification Mode
True Colour Mode
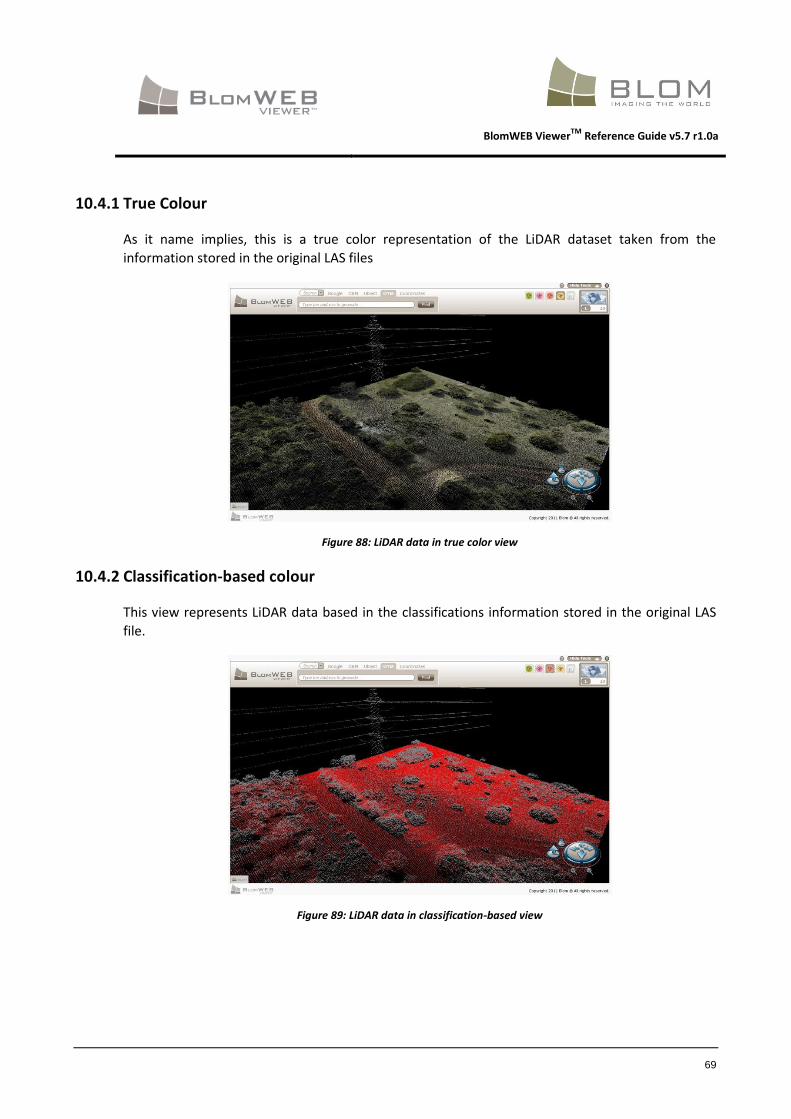
BlomWEB ViewerTM
Reference Guide v5.7 r1.0a
69
10.4.1 True Colour
As it name implies, this is a true color representation of the LiDAR dataset taken from the
information stored in the original LAS files
Figure 88: LiDAR data in true color view
10.4.2 Classification-based colour
This view represents LiDAR data based in the classifications information stored in the original LAS
file.
Figure 89: LiDAR data in classification-based view
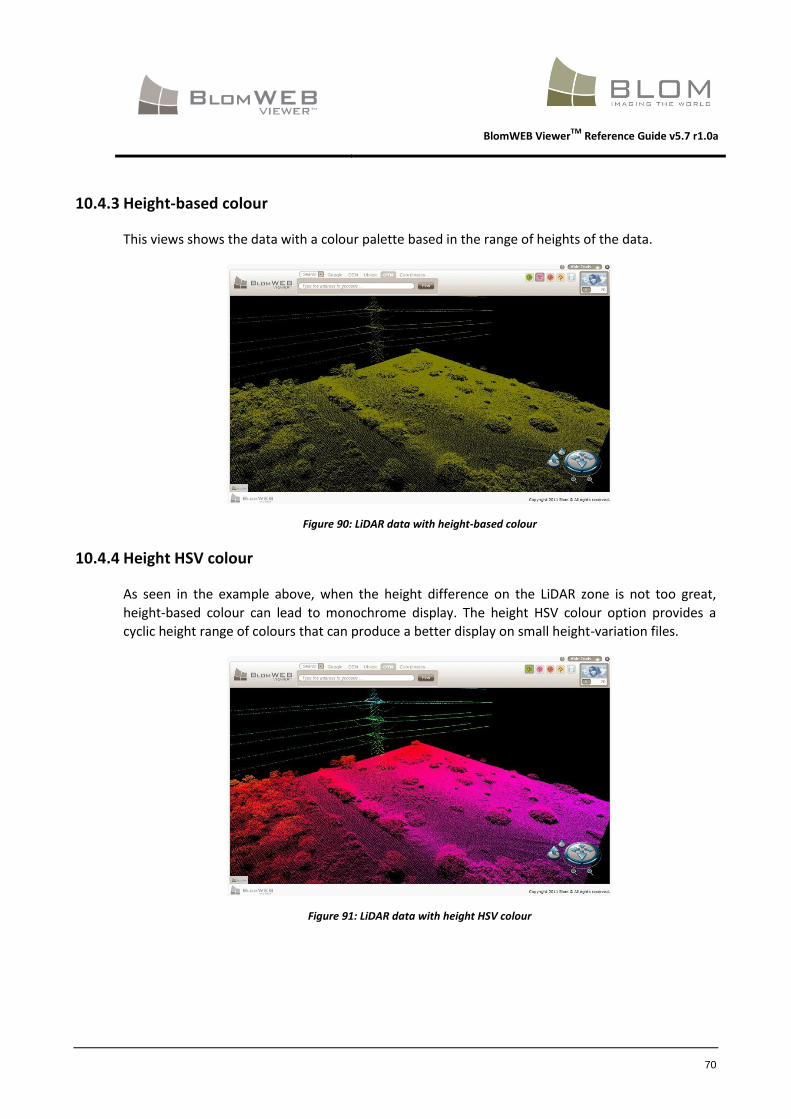
BlomWEB ViewerTM
Reference Guide v5.7 r1.0a
70
10.4.3 Height-based colour
This views shows the data with a colour palette based in the range of heights of the data.
Figure 90: LiDAR data with height-based colour
10.4.4 Height HSV colour
As seen in the example above, when the height difference on the LiDAR zone is not too great,
height-based colour can lead to monochrome display. The height HSV colour option provides a
cyclic height range of colours that can produce a better display on small height-variation files.
Figure 91: LiDAR data with height HSV colour
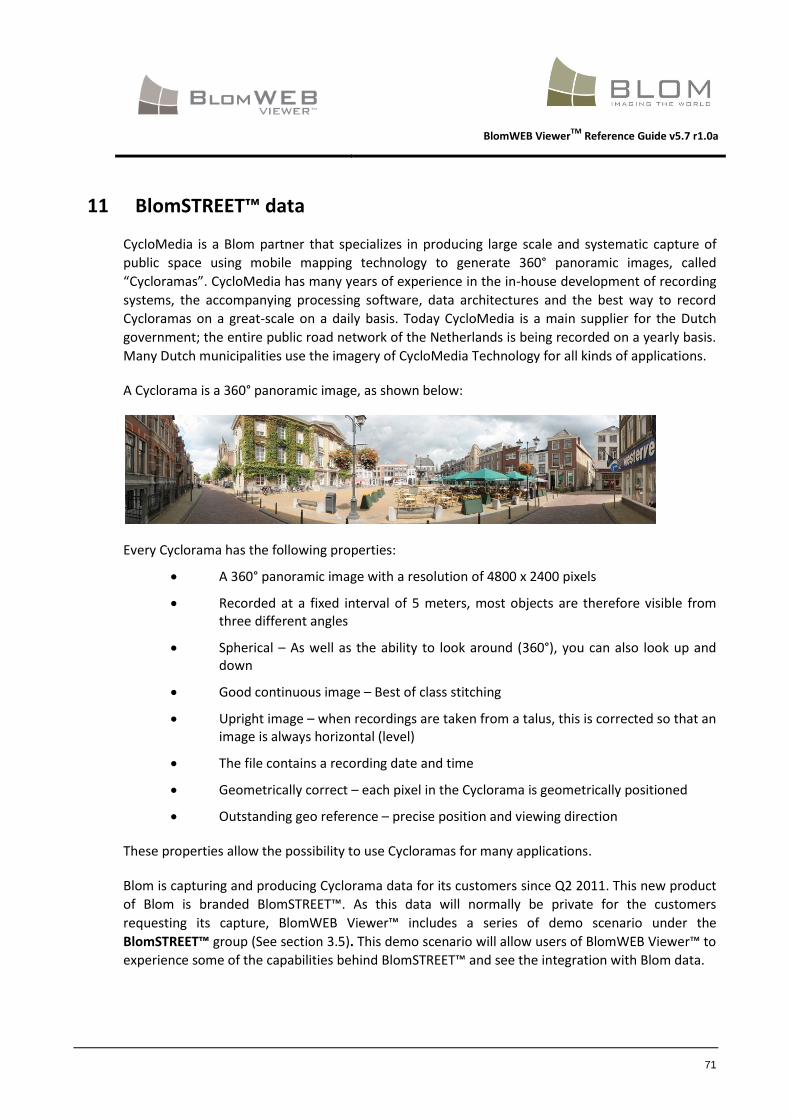
BlomWEB ViewerTM
Reference Guide v5.7 r1.0a
71
11 BlomSTREET™ data
CycloMedia is a Blom partner that specializes in producing large scale and systematic capture of
public space using mobile mapping technology to generate 360° panoramic images, called
“Cycloramas”. CycloMedia has many years of experience in the in-house development of recording
systems, the accompanying processing software, data architectures and the best way to record
Cycloramas on a great-scale on a daily basis. Today CycloMedia is a main supplier for the Dutch
government; the entire public road network of the Netherlands is being recorded on a yearly basis.
Many Dutch municipalities use the imagery of CycloMedia Technology for all kinds of applications.
A Cyclorama is a 360° panoramic image, as shown below:
Every Cyclorama has the following properties:
A 360° panoramic image with a resolution of 4800 x 2400 pixels
Recorded at a fixed interval of 5 meters, most objects are therefore visible from three different angles
Spherical – As well as the ability to look around (360°), you can also look up and down
Good continuous image – Best of class stitching
Upright image – when recordings are taken from a talus, this is corrected so that an image is always horizontal (level)
The file contains a recording date and time
Geometrically correct – each pixel in the Cyclorama is geometrically positioned
Outstanding geo reference – precise position and viewing direction
These properties allow the possibility to use Cycloramas for many applications.
Blom is capturing and producing Cyclorama data for its customers since Q2 2011. This new product
of Blom is branded BlomSTREET™. As this data will normally be private for the customers
requesting its capture, BlomWEB Viewer™ includes a series of demo scenario under the
BlomSTREET™ group (See section 3.5). This demo scenario will allow users of BlomWEB Viewer™ to
experience some of the capabilities behind BlomSTREET™ and see the integration with Blom data.
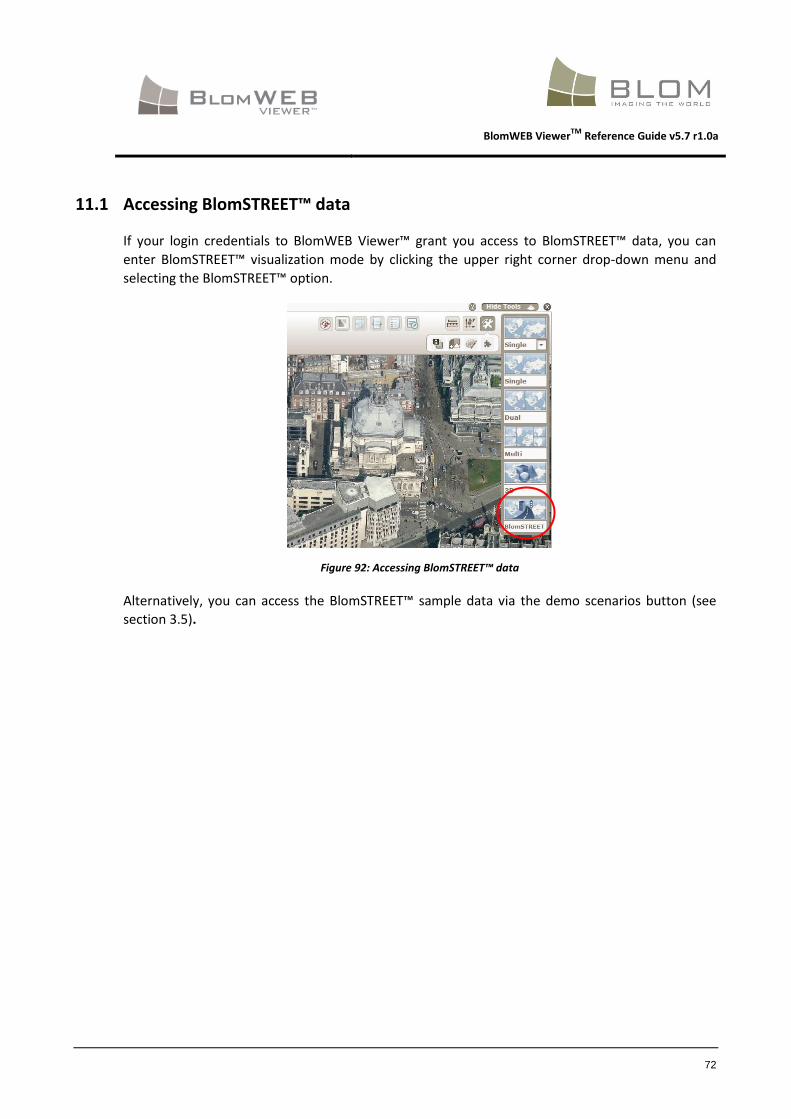
BlomWEB ViewerTM
Reference Guide v5.7 r1.0a
72
11.1 Accessing BlomSTREET™ data
If your login credentials to BlomWEB Viewer™ grant you access to BlomSTREET™ data, you can
enter BlomSTREET™ visualization mode by clicking the upper right corner drop-down menu and
selecting the BlomSTREET™ option.
Figure 92: Accessing BlomSTREET™ data
Alternatively, you can access the BlomSTREET™ sample data via the demo scenarios button (see
section 3.5).
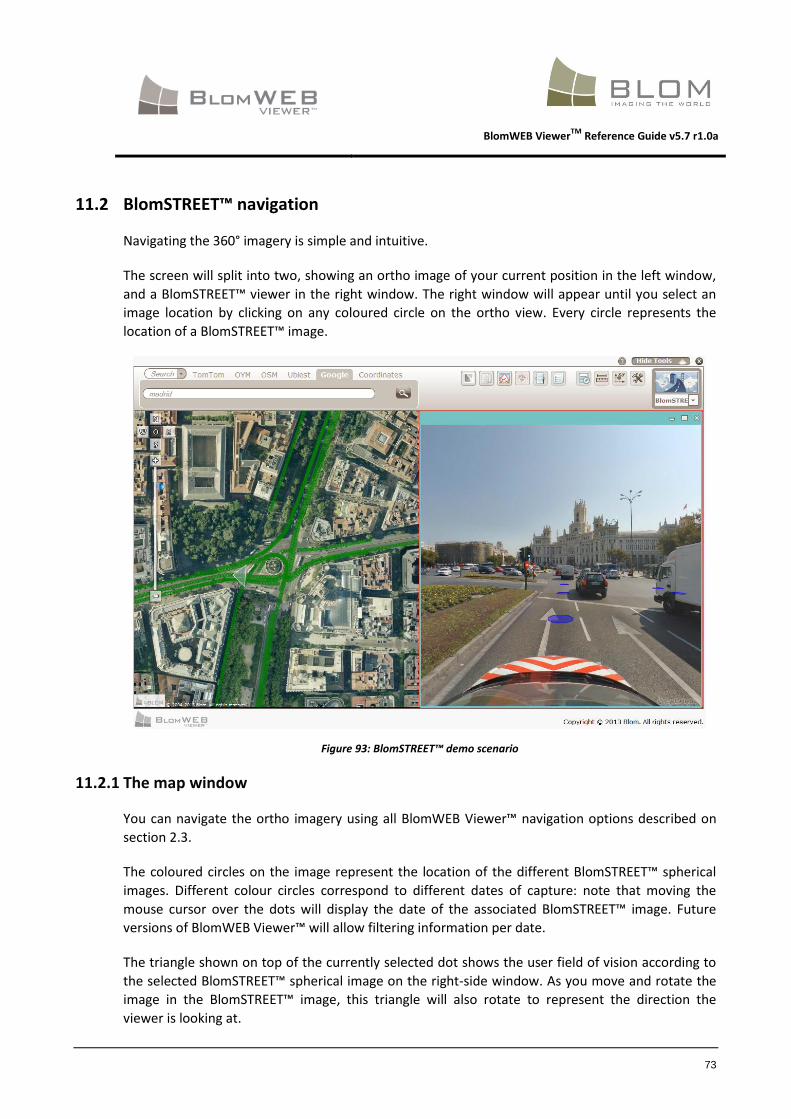
BlomWEB ViewerTM
Reference Guide v5.7 r1.0a
73
11.2 BlomSTREET™ navigation
Navigating the 360° imagery is simple and intuitive.
The screen will split into two, showing an ortho image of your current position in the left window,
and a BlomSTREET™ viewer in the right window. The right window will appear until you select an
image location by clicking on any coloured circle on the ortho view. Every circle represents the
location of a BlomSTREET™ image.
Figure 93: BlomSTREET™ demo scenario
11.2.1 The map window
You can navigate the ortho imagery using all BlomWEB Viewer™ navigation options described on
section 2.3.
The coloured circles on the image represent the location of the different BlomSTREET™ spherical
images. Different colour circles correspond to different dates of capture: note that moving the
mouse cursor over the dots will display the date of the associated BlomSTREET™ image. Future
versions of BlomWEB Viewer™ will allow filtering information per date.
The triangle shown on top of the currently selected dot shows the user field of vision according to
the selected BlomSTREET™ spherical image on the right-side window. As you move and rotate the
image in the BlomSTREET™ image, this triangle will also rotate to represent the direction the
viewer is looking at.

BlomWEB ViewerTM
Reference Guide v5.7 r1.0a
74
Click on any dot to access the associated BlomSTREET™ spherical image on the right-side window.
Figure 94: The triangle rotates according to the BlomSTREET™ view
Clicking on additional dots will open new BlomSTREET™ windows up to a limit of four windows. This
will prove necessary to perform measures on the images (section 11.3). Different windows will
have different frame colours - these correspond to the associated triangle(s) on the ortho window.
This makes it easy to track the view angle on different views.
Note that the BlomSTREET™ windows can be resized according to your needs.
Figure 95: BlomSTREET™ mode with three opened BlomSTREET™ windows

BlomWEB ViewerTM
Reference Guide v5.7 r1.0a
75
11.2.2 The BlomSTREET™ window
To move around the BlomSTREET™ image, click on it and drag your mouse to move the camera.
You can use the following keys for navigating the image:
Use the left/right arrow keys to rotate the image
Use the up/down arrow keys to advance to the next/previous BlomSTREET™ spherical
image.
Use the + and – keys to zoom in and out
Use the PageUp and PageDown keys to tilt up and down
Coloured circles also appear on the BlomSTREET™ window, allowing you to select different views
by simply clicking on them. Note that moving the mouse cursor over a circle will show a tooltip with
the date of capture of the associated BlomSTREET™ spherical image.
Figure 96: Date of the BlomSTREET™ image
11.3 Measurements on BlomSTREET™ data
One of the main features of BlomSTREET™ is the capability to perform measurements directly on
the spherical images. Once you are in the BlomSTREET™ view mode, the Measurement Tools
button will become selectable, allowing you access to the BlomSTREET™ measurement tools.
Figure 97: BlomSTREET™ Measurements Tools
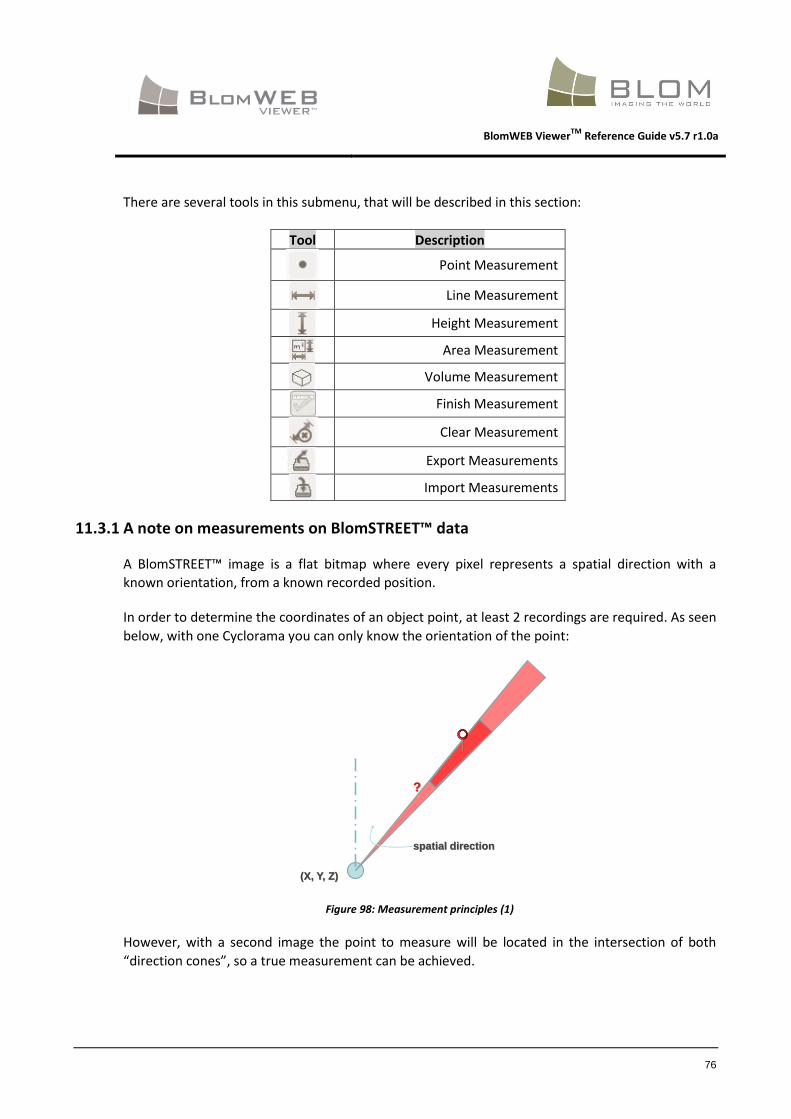
BlomWEB ViewerTM
Reference Guide v5.7 r1.0a
76
There are several tools in this submenu, that will be described in this section:
Tool Description
Point Measurement
Line Measurement
Height Measurement
Area Measurement
Volume Measurement
Finish Measurement
Clear Measurement
Export Measurements
Import Measurements
11.3.1 A note on measurements on BlomSTREET™ data
A BlomSTREET™ image is a flat bitmap where every pixel represents a spatial direction with a
known orientation, from a known recorded position.
In order to determine the coordinates of an object point, at least 2 recordings are required. As seen
below, with one Cyclorama you can only know the orientation of the point:
Figure 98: Measurement principles (1)
However, with a second image the point to measure will be located in the intersection of both
“direction cones”, so a true measurement can be achieved.
?
(X, Y, Z)
spatial direction

BlomWEB ViewerTM
Reference Guide v5.7 r1.0a
77
Figure 99: Measurement Principles (2)
As above, the greater the number of BlomSTREET™ images used, the better the accuracy of the
measurement results.
11.3.2 Measuring Points
As described above, you will need to open at least two BlomSTREET™ viewing windows in order to
perform a measurement. We will demonstrate the process with an easy example. As you can see
on the screenshot below, we are going to measure the coordinates of a spot in a building. Two
BlomSTREET™ windows have been opened and rotated so that the spot to measure can be seen in
both windows simultaneously.
Click on the Point Measurement button to begin the procedure, and then click on the location of
the desired point you want to measure. You will see a line appear on the other BlomSTREET™
window with the same colour of the frame as the first one. This is a visual guide to locate where the
point is located on the second image.
Figure 100: Point Measurement. Step 1
(X, Y, Z)1 (X, Y, Z)2

BlomWEB ViewerTM
Reference Guide v5.7 r1.0a
78
Locate the point on the second BlomSTREET™ Window and click on it. Note that a similar guideline
will appear on the first Window.
Figure 101: Point Measurement. Step 2
You can click on the selected points as many times as you need until you are happy with the
location. When you are ready, click on the Finish Measurement button and the results will be
displayed in a popup window. These are:
X, Y, Z coordinates of the point in Spherical Mercator and Lat/Lon
11.3.3 Measuring Lines
As described above in measuring points, you will need to open at least two BlomSTREET™ windows
in order to perform a measurement. We will demonstrate the process with an easy example. As
you can see on the screenshot below, we are going to measure the height of a window in a
building. Two BlomSTREET™ windows have been opened and rotated so that the line to measure
can be seen in both windows simultaneously.
Click on the Line Measurement button to start the procedure. Now click on the location of the
initial point of the line, and then again on the end point of that line. You will see that both spots will
appear numbered on the BlomSTREET™ windows, and a line will appear on the other BlomSTREET™
window with the same colour of the frame of the first one. This line is a visual guide to locate
where the first point of the line is located on the second image.
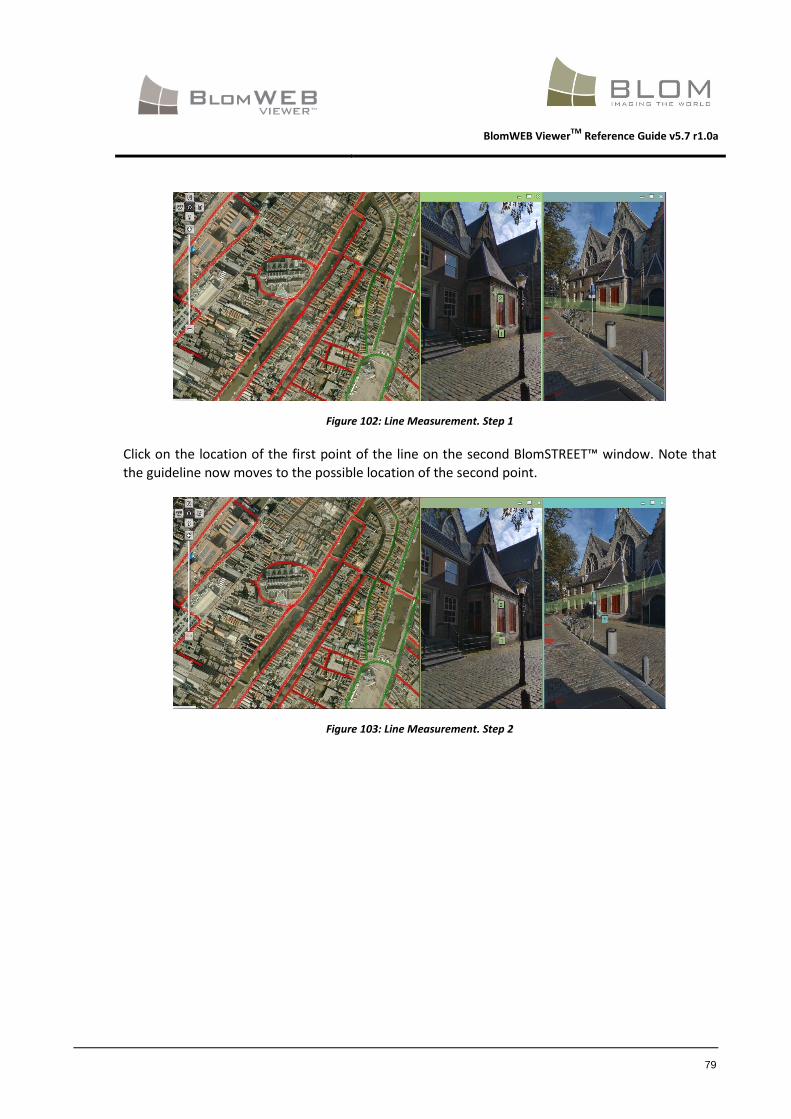
BlomWEB ViewerTM
Reference Guide v5.7 r1.0a
79
Figure 102: Line Measurement. Step 1
Click on the location of the first point of the line on the second BlomSTREET™ window. Note that
the guideline now moves to the possible location of the second point.
Figure 103: Line Measurement. Step 2
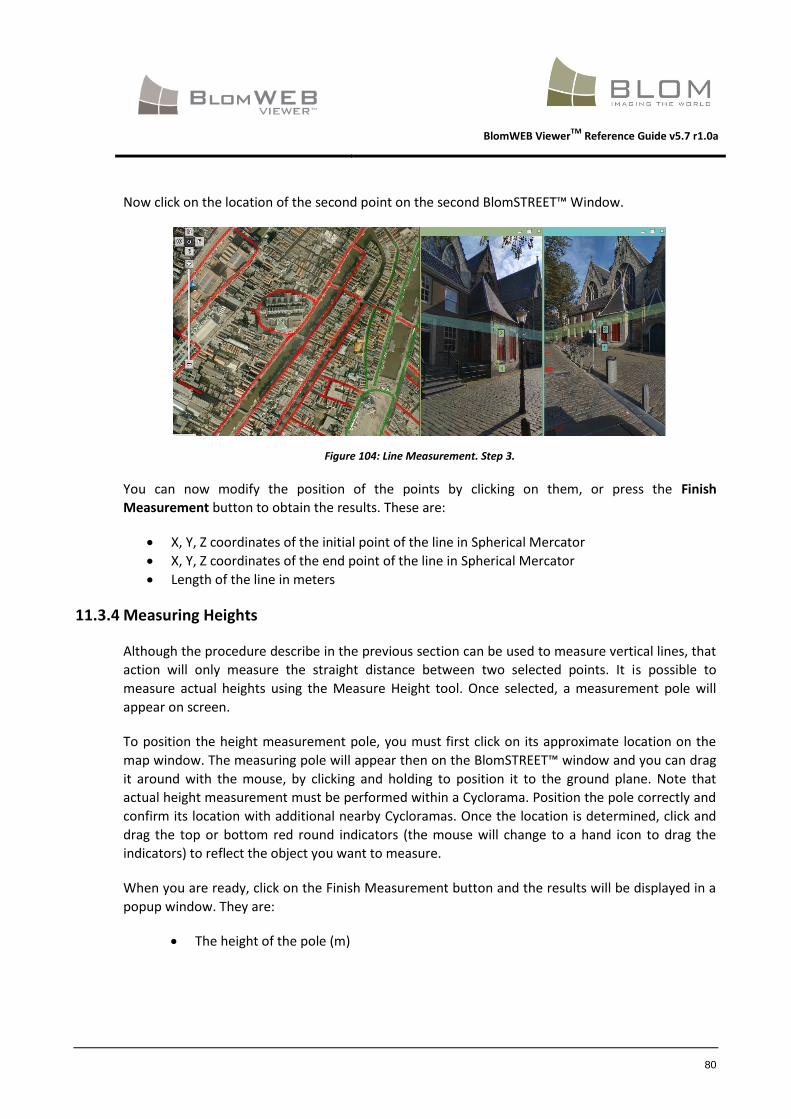
BlomWEB ViewerTM
Reference Guide v5.7 r1.0a
80
Now click on the location of the second point on the second BlomSTREET™ Window.
Figure 104: Line Measurement. Step 3.
You can now modify the position of the points by clicking on them, or press the Finish
Measurement button to obtain the results. These are:
X, Y, Z coordinates of the initial point of the line in Spherical Mercator
X, Y, Z coordinates of the end point of the line in Spherical Mercator
Length of the line in meters
11.3.4 Measuring Heights
Although the procedure describe in the previous section can be used to measure vertical lines, that
action will only measure the straight distance between two selected points. It is possible to
measure actual heights using the Measure Height tool. Once selected, a measurement pole will
appear on screen.
To position the height measurement pole, you must first click on its approximate location on the
map window. The measuring pole will appear then on the BlomSTREET™ window and you can drag
it around with the mouse, by clicking and holding to position it to the ground plane. Note that
actual height measurement must be performed within a Cyclorama. Position the pole correctly and
confirm its location with additional nearby Cycloramas. Once the location is determined, click and
drag the top or bottom red round indicators (the mouse will change to a hand icon to drag the
indicators) to reflect the object you want to measure.
When you are ready, click on the Finish Measurement button and the results will be displayed in a
popup window. They are:
The height of the pole (m)
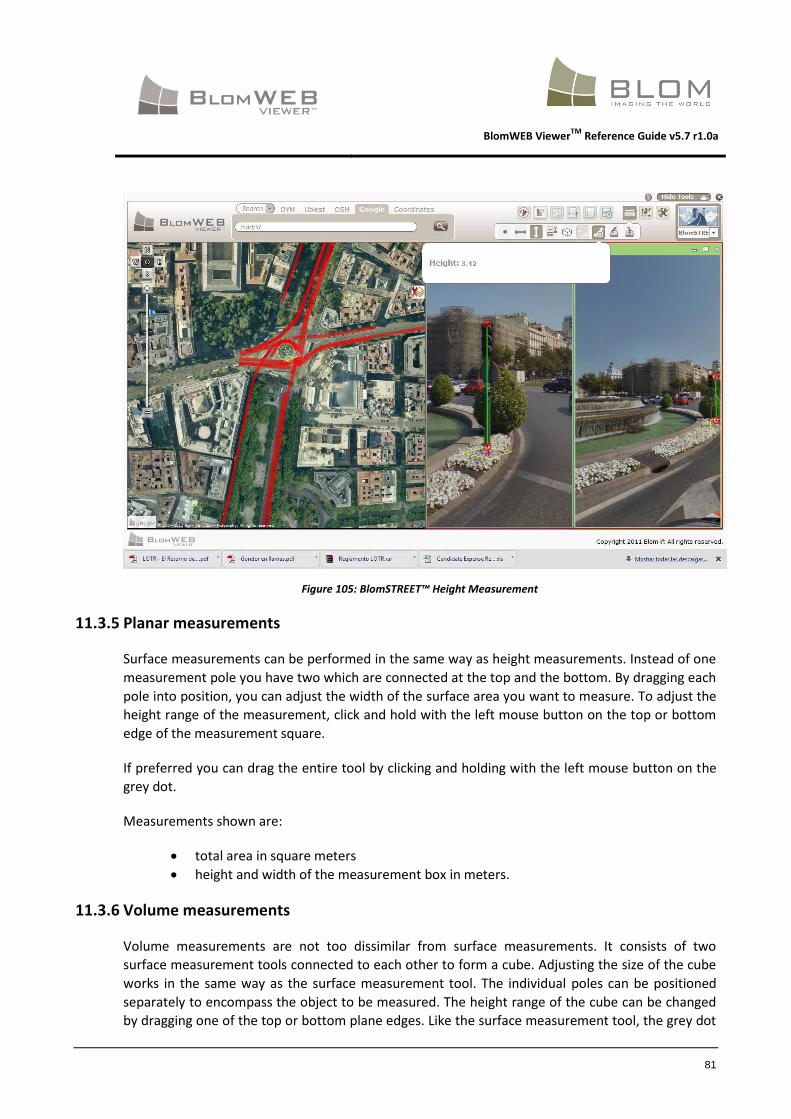
BlomWEB ViewerTM
Reference Guide v5.7 r1.0a
81
Figure 105: BlomSTREET™ Height Measurement
11.3.5 Planar measurements
Surface measurements can be performed in the same way as height measurements. Instead of one
measurement pole you have two which are connected at the top and the bottom. By dragging each
pole into position, you can adjust the width of the surface area you want to measure. To adjust the
height range of the measurement, click and hold with the left mouse button on the top or bottom
edge of the measurement square.
If preferred you can drag the entire tool by clicking and holding with the left mouse button on the
grey dot.
Measurements shown are:
total area in square meters
height and width of the measurement box in meters.
11.3.6 Volume measurements
Volume measurements are not too dissimilar from surface measurements. It consists of two
surface measurement tools connected to each other to form a cube. Adjusting the size of the cube
works in the same way as the surface measurement tool. The individual poles can be positioned
separately to encompass the object to be measured. The height range of the cube can be changed
by dragging one of the top or bottom plane edges. Like the surface measurement tool, the grey dot

BlomWEB ViewerTM
Reference Guide v5.7 r1.0a
82
at the bottom of the tool can be clicked on to allow dragging of the entire tool without changing its
shape.
Results provided are:
Volume in cubic meters
Area of the face looking to the camera, in square meters
Height of the volume.
11.3.7 Export measurements
It is possible to draw several measuring objects on screen, digitizing elements using the
BlomSTREET™ data as reference. The objects drawn on the BlomSTREET™ Window can be exported
to SHP or XML files.
Click on the Export Measurements button, select the desired format (SHP or XML) and press Ok. A
window will appear to let you select the name and location of the exported file.
11.3.8 Import measurements
It is possible to retrieve measuring objects from previously saved files and visualize them on the
BlomSTREET™ Window. Supported files are:
XML files
ZIP files containing any number of SHP files and their companion files (PRJ, DBF, SHX…)
Click on the Upload file button to select the desired measurements file to upload.
11.3.9 Deleting measurements
Use the Clear Measurements button to delete all measurement and start a new measurement if
required.
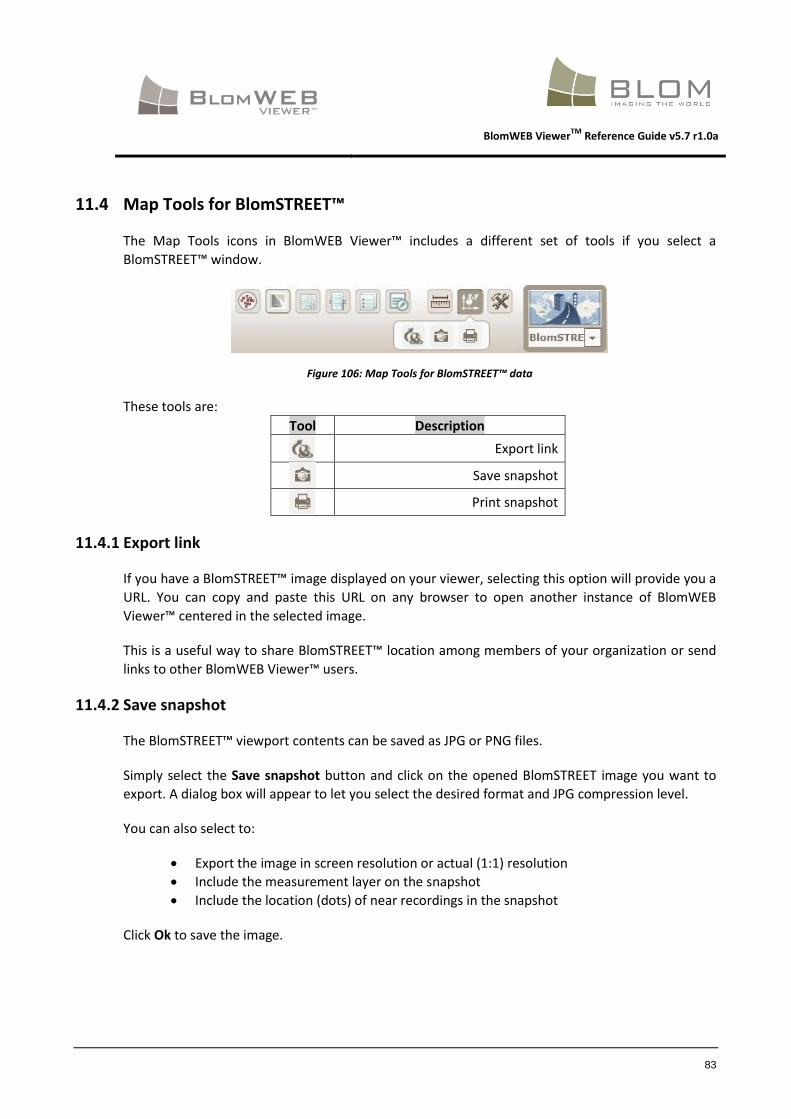
BlomWEB ViewerTM
Reference Guide v5.7 r1.0a
83
11.4 Map Tools for BlomSTREET™
The Map Tools icons in BlomWEB Viewer™ includes a different set of tools if you select a
BlomSTREET™ window.
Figure 106: Map Tools for BlomSTREET™ data
These tools are:
Tool Description
Export link
Save snapshot
Print snapshot
11.4.1 Export link
If you have a BlomSTREET™ image displayed on your viewer, selecting this option will provide you a
URL. You can copy and paste this URL on any browser to open another instance of BlomWEB
Viewer™ centered in the selected image.
This is a useful way to share BlomSTREET™ location among members of your organization or send
links to other BlomWEB Viewer™ users.
11.4.2 Save snapshot
The BlomSTREET™ viewport contents can be saved as JPG or PNG files.
Simply select the Save snapshot button and click on the opened BlomSTREET image you want to
export. A dialog box will appear to let you select the desired format and JPG compression level.
You can also select to:
Export the image in screen resolution or actual (1:1) resolution
Include the measurement layer on the snapshot
Include the location (dots) of near recordings in the snapshot
Click Ok to save the image.

BlomWEB ViewerTM
Reference Guide v5.7 r1.0a
84
Figure 107: Exporting BlomSTREET™ imagery
11.4.3 Printing BlomSTREET™ data
You can print the contents of the BlomSTREET™ window in any printer connected to your network.
Simply select the Print snapshot button and click on the opened BlomSTREET image you want to
print. You can select if you want to include the measurements layer and the recordings layer in the
image. Then, the system printer dialog box will appear to let you select the desired printing
options. Click Ok to print the image.
Figure 108: BlomSTREET™ print options

BlomWEB ViewerTM
Reference Guide v5.7 r1.0a
85
11.5 Reprojecting vector data on BlomSTREET™
BlomWEB Viewer™ can reproject vector datasets and show them over the spherical imagery. This is
an immediate action as long as there is vector data overlayed on the main window. Full detail on
vector loading on BlomWEB Viewer™ can be found on section 7.1. Note that you need to have the
Cyclorama window selected in order to upload the vector file correctly.
Current version of the BlomSTREET™ only supports vector data in SHP and KML format. If you have
datasets in other formats, they won’t visualize in the BlomSTREET™ window.
Figure 109: Vector data over BlomSTREET™ image
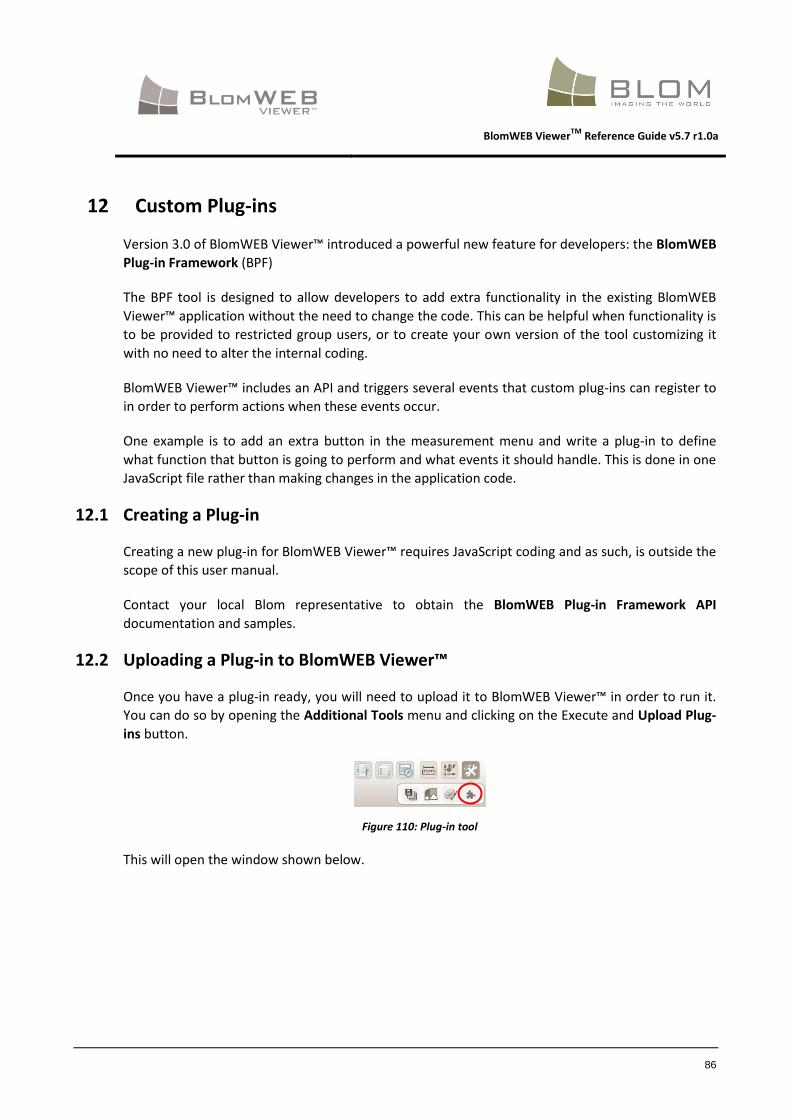
BlomWEB ViewerTM
Reference Guide v5.7 r1.0a
86
12 Custom Plug-ins
Version 3.0 of BlomWEB Viewer™ introduced a powerful new feature for developers: the BlomWEB
Plug-in Framework (BPF)
The BPF tool is designed to allow developers to add extra functionality in the existing BlomWEB
Viewer™ application without the need to change the code. This can be helpful when functionality is
to be provided to restricted group users, or to create your own version of the tool customizing it
with no need to alter the internal coding.
BlomWEB Viewer™ includes an API and triggers several events that custom plug-ins can register to
in order to perform actions when these events occur.
One example is to add an extra button in the measurement menu and write a plug-in to define
what function that button is going to perform and what events it should handle. This is done in one
JavaScript file rather than making changes in the application code.
12.1 Creating a Plug-in
Creating a new plug-in for BlomWEB Viewer™ requires JavaScript coding and as such, is outside the
scope of this user manual.
Contact your local Blom representative to obtain the BlomWEB Plug-in Framework API
documentation and samples.
12.2 Uploading a Plug-in to BlomWEB Viewer™
Once you have a plug-in ready, you will need to upload it to BlomWEB Viewer™ in order to run it.
You can do so by opening the Additional Tools menu and clicking on the Execute and Upload Plug-
ins button.
Figure 110: Plug-in tool
This will open the window shown below.
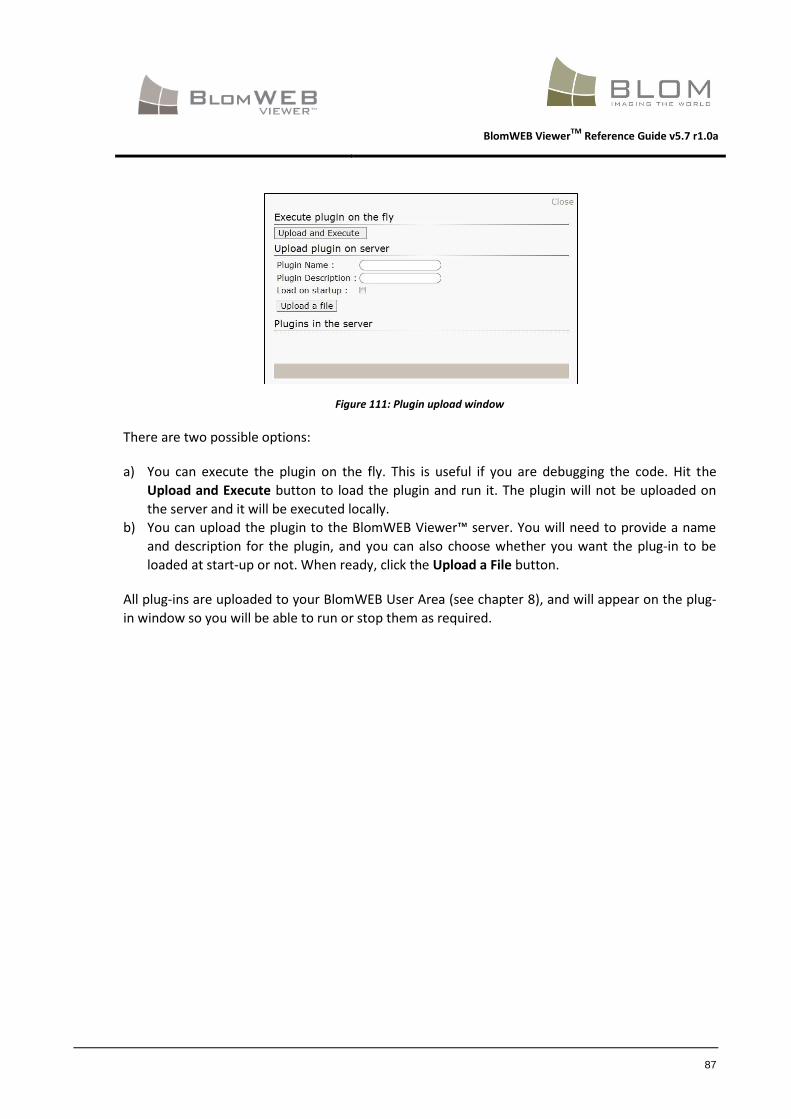
BlomWEB ViewerTM
Reference Guide v5.7 r1.0a
87
Figure 111: Plugin upload window
There are two possible options:
a) You can execute the plugin on the fly. This is useful if you are debugging the code. Hit the
Upload and Execute button to load the plugin and run it. The plugin will not be uploaded on
the server and it will be executed locally.
b) You can upload the plugin to the BlomWEB Viewer™ server. You will need to provide a name
and description for the plugin, and you can also choose whether you want the plug-in to be
loaded at start-up or not. When ready, click the Upload a File button.
All plug-ins are uploaded to your BlomWEB User Area (see chapter 8), and will appear on the plug-
in window so you will be able to run or stop them as required.
BlomWEB ViewerTM
Reference Guide v5.7 r1.0a
88
13 Running BlomWEB Viewer™ from the command line
The URL to open BlomWEB Viewer™ can include parameters. This is new from version 3.1 and
allows calling the application from a GIS tool or another kind of application and make it open
centered in any desired position.
13.1 Valid parameters
x = Spherical Mercator X coordinate of the desired center of the image
y = Spherical Mercator Y coordinate of the desired center of the image
lat = Latitude in decimal degrees of the desired center of the image
lon = Longitude in decimal degrees of the desired center of the image
view = desired view to open the application. Possible values are:
DUAL
PENTA
BLOMSTREET
3D
LIDAR
SINGLE (default value)
Orientation = orientation of the image. It only applies to SINGLE view. Possible values
are:
N
S
E
W
O
Zoom = zoom level (starting at 1)
13.2 Examples
In Spherical Mercator:
http://www.blomwebviewer.com?x=255521.188&y=6250728.549&zoom=17&view=PENTA
In Latitude, Longitude:
http://www.blomwebviewer.com?lat=48.51&lon=2.17&zoom=19&view=SINGLE