blasting vibrations and .their effects on structures · blasting vibrations and .their effects on...
TRANSCRIPT
Bulletin 656
BLASTING VIBRATIONS
AND .THEIR EFFECTS ON STRUCTURES
By Harry R. Nicholls, Charles F. Johnson, and Wilbur I. Duvall
US Department of Interior Office of Surface Mining Reclamation and Enforcement
Kenneth K. Eltschlager Mining/Explosives Engineer
3 Parkway Center Pittsburgh, PA 15220
Phone 412.937.2169 Fax 412.937.3012 [email protected]
UNITED STATES DEPARTMENT OF THE INTERIOR
BUREAU OF MINES
CONTENTS
Page
List of Symbola -·--· 'ri Abstract -·· I Chapter 1.-General introduction I
1.1-lntroduction _ I
1.2-lndustry meeting --------- 2 U-History --------···---·---- 2 U-Gencral approach to the problem ·--····-- !I 1.5-Rcferences ··-·······--··--·--·~---··---- 4
Chapter 2.-lnstrumentation ··-·····-··---- 5 2.1-Introduction ·---··-··--···-·-···-·-- 5 2.2-;-T1!e dynamic response of a
IClSIIllC transducer ···-·---····-···-··--····· 5 2.2.1-Di.splacement transducer --·-·-· 6 2.2.2-Velocity transducer ···-·--···--··· 6 2.2.5-Acccleration transducer ·······----··· 7
2.5-Descriptions of typical seismographl --·- 7 2.4--Seisrnograph stability -----·····--··-·- 8 2.5-Scisrnograph calibration ·······-····---··- 10 2.6-lnstrumentation used by the
Bureau of Minca -·-···-··--·-···-·---··· 10 2.7-References ·-··-··-··-·-··················-·--· 12
Chapter !1.-Safc vibration levels for residential
structures ···-········------·-··-·--·-··-·-·· l!I !I.I-Introduction -·-······-·-·-·-···-·-····-··--··· l!I !l.2-Statistical study of published data on
ground vibrations and damage -·-·-·-·--· l!I !l~.1-lnvestigatiom by the
) Bureau of Mines ············-·--········-······-· l!I !l.2.2-Investigations by Langcfon,
Kihlstrom, and Westerberg·········-···-··· H !l.2.5-lnvestigations by Edwards and
Northwood ············-·········-······-··-·-··-·- 14 !1.2.4-statiatical study of damage data ··-··· 18
!1.5-Data from other investigaton ······-··-······· 19 !1.4-Additional Bureau of Mines data ···-·-··-· 20 !1.5-Building vibrations from normal
activities ·······-······-··•···-······-··-···---- 21 !1.6-Reliability of particle motion
calculations ·····-·······-···-··············----······- 21 !1.7-Recommended safe ground vibration
levels ···········-·-··-······-·····-·-···-··-··-···--···· 22 !1.8-Published data on air vibrations and
damage ···-··-·--····-··········-······--·-----· 25 !1.9-Recommended safe air blast pressure
levels ····-·---··-······-··-··-··-··············-·---·· 27 !I.IO-Human respon11e and its effect on
safe vibration levcla ····-··-·-··-··-··-·-··-··· 27 !1.11-Refercnccs ·········--··-··-··············-·---- 29
Chapter 4.-Gcneration and propagation of ground
vibrations from blasting -·--······-·-···-·-··--··· !IO 4.1-Introduction ·······-··-··-··············-··-·--· 51 4.2-Millisecond-delayed blasts venua
instantaneous blasts ···············-···········-·····-·- !12 4.2.1-Expcrimental procedure ··-··-····--· 52
4.2.2-Propagation law ··--------4.2.5-Effcct of charge weight for
instantaneous blasts 4.2.4-Effcct of delay interval and
number of holca ··--··-·-----4.2.5-Comparilon of millillCCODd·
delayed blaata with instantanCOUI
blasts ~---·-·-··---------·· 4.5-Wa as a scaling factor·------··--···
4.U-Experimcntal procedure -·-·-·-·-4.!l.2-Data analysis --··-·--·--···-·-
4.4-Effect of method of initiation -·-·-·--4.4.1-Experimental procedure··--··-····-· 4.4.2-Data analysis ·······-·-···-·-··----...
4.5-Effect of geol<>g'_', including direction of propagation an~ overburden ···-·-----
4.5.1-Geology and direction ··-···---·-··-· 4.5.2-Effect of rock type on vibration
levels ······---·····--·--··-·----4.5.!l-Overburden ···-···-·-····---·--
4.6-Application of Fourier analysis techniques to vibration data ···-·-··-··---
4.6.1-Displaccment and acceleration
from particle velocities ···-··-··-····-·-·· 4.6.2-Comparison of instantaneous
and delay-type blasting through Fourier techniques ··-····-·-----
4.7-Rcfcrcnces ······--···--··-·---·-··-Chapter 5.-Generation and propagation of ak
vibrations from blasting -·----·-··-·---· 5.1-Introduction ···-······--···-·------·-5.2-Previously published data ----·---5.!l-Burcau of Mines data·--·-·--·-·--5.4-Refcrcnces ··-·····-·--·-··-·-··---·-·--
Chapter 6.-Estimating safe air and ground vibration levels for blasting ····--------·
6.1-lntroduction ···-··-·----······-·-·-----6.2-Estimating vibration limits with
instrumentation ·-········---······-··-·----6.!l-Estimating vibration limits without
inst rumen talion -·-·-···-··-······-··-·-·-··--6.4-U11e of scaled distance as a blasting
control ·······-·-··-······-··-··-··--·--·--6.5-Estimating air blast limits ···-······---·-·
Chapter 7.-Summary and concluaiom -····--···-·· 7.1-Summary -·--··----·-·---··--·-7.2-C:OOcluaiom ·---·-··
Acknowledgments ·······-·-···-·---·····---·-·-Explanation of Appendica ···-······-···-·······---·
Appendix A.-Plan views of test lites -----Appendix B.-Shot and loading data ···--·····-Appendix C.-Particlc velocity· and frequency
data ···················-··········-··········-······-··········-· Appendix D.-Geologic description ------···
ILLUSTRATIONS Fig.
2.1. Mau-spring-dashpot model of a 11eismic transd~cer ·····-··-·-···-·-···-·--·-·-~------2.2. Theoretical rcspoDIC curves for a typical displacement or velocity transducer ---·---2.!I. Theoretical rcspon11e curves for a typical acceleration transducer ···········-··-······-······-······-··-··············-····
., ·!" -.,.1 ·f.
Page
52
ff
40 ·ii ·ii 41 50 52 55
55 59
59
60
60 6!I
64 64 64 67 68
69 69
69
70
70 72 75 'IS 75 75 76 76 86
92 104
Fig.
2.4. Horizontal location of ccntrr of gravity of a lamina .. ·-·--··-··-·--·--2.5. Vertical location of center of gravity of a aeismograph .. -······-··-·---------··-------2.6. Frequency response curve of linear amplifier -·------·----·-· 2.7. Frequency response curve of velocity gage ···········-···-·············-··-·-········---------·-----· S.l. Displacement versus frequency for ob!lerved damage, Bureau of Minaa ···-··----···-···-··-···----··· SJ!. Displacement versus frequency for ohaerved damage, La.ngefors and others ·--··-··-····--·---··-··-S.!J. Displacement versus frequency for ob!lerved damage, Edwards and Northwood ···------··-···S.4. Displacement versus frequency, combined data with ecommended safe blasting criterion ···----·--·-S.5. Comparison of displacemenlll from integration and simple harmonic motion calculations -·---·-······S.6. Comparison of particle velocities as recorded and from displacements ···-··-·---·---·---·-··-· S.7. Particle velocity versus frequency with recommended safe blasting criterion ··---·-· S.8. Particle velocity versus frequency for no damage data ...•..••.... ·-······-······-··-·-·-·---· S.9. Subjective response of the human body to vibratory JI¥>tion (after Goldman) ·--··-·------··-·-···· S.10. Complaint hi.story, Salmon Nuclear Event, with superposed subjective respon1e ---·-----4.l. Vibration records for I-hole blast ·····-·--·-········-······-·-··-···--··--·····-··-·--··-------4J! Vibration records for 7-hole instantaneous blut ·······-·-··············-··--···-····---·------·--·-·-·· 4.!J. Vibration records for 7·hole, 9·milliaecond-delayed blast ···---·-··········--·-·--·----·---·--·· 4.4. Vibration records for 7-hole, '4-milliaecond-delaycd blast ····-·----·· -----··---··-·----··· 4.5. Particle velocity versus distance .for l· and !-hole blasts ···-·-·····;-·----·----·---·------4.6. Particle velocity versus distance for 7- and 15-hole blasts .................. ·-····-····-·----···-··--· ·-4.7. Particle velocity versus distance for a I-hole and 2·m ultiple-row blasta ....................................... ·--····-···-4.8. C.Omparison of effect of charge weight on level of vibration from imtantaneo111 and millisecond-delayed
blasts ···································-··················-··········-······-·····················-······-··-··-- -·----·--···· 4.9. Peak particle velocity versus distance, radial component ········-.. ···-··-·-···-·-··-·····-·-··-·····-·----·-·-· 4.10. Peak particle velocity versus distance. vertical component ·······-···· .. -··-······-··-·--·········--------·-·····-4.ll. Peak particle velocity versus distance, transverae component ...................... ·-··--·--·-···-·----·--·-4.12. Particle velocity intercepts venu~ charge weight per delay, radial component···-···--·-·-···---·-·-··-4.IS. Particle velocity intercepts versu5 charge weight per delay, vertical component ···-····--------··-· 4.14. Particle velocity intercepts versus charge weight per delay. transverse component ·---·········-·--·---···-·· 4.15. Peak particle velocity versus sca.led distance, radial component ............ - ... ----·····-·----·-··-· 4.16. Peak particle velocity versus scaled distance, vertical component ......................................... ·-···--···---· 4.17. Peak particle velocity versus scaled distance, transverse component ............... - ................. ·-··-··-···-···-·-·-4.18. Three methods of initiating blasts ···-········ ..................................................................... -·····-··---··-·-" 4.19. Effect of direct.ion, Jack Quarry, peak particle velocity versus scaled distance ·····-····-········-··--··-····--···· 4.20. Effect of direction, Culpeper Quarry, peak particle velocity versus scaled distance ........... - .......... - .......... .. 421. Effect of direction, Centreville Quarry, peak particle velocity versus scaled distance ·······-··-··-··---·····-··· 4.22. Combined data, limestone and dolomite quarries, peak particle velocity versus sea.led distance ···--···-···· 4.23. Combined data, diabase quarries, peak particle velocity versus scaled distance ······················-·····-----·-····· 4.24. Combined data, granite-type Quarries, peak particle velocity versus scaled distance ............... --·--··-···· .. 4.25. Sandstone quarry data, peak particle velocity versus scaled distance .... ,.·-·····-······-··········-·-·--·--···-· 4.26. EJfect of overburden, peak particle velocity versus scaled distance .................. _ ......................... ___ .......... . 4.27. C.Omparison of particle velocity and displacement in the time and frequency domains ................ - ............ . 4.28. Spectral amplitudes, radial and vertical components, from a 3-hole, 9-millisecond-delayed blast .................. .. 4.29. Spectral amplitudes, radial and vertical components, from a 7-hole, 9-millisecond-delayed blast ------· .. 4.30. Particle motion trajectories, SOO feet from an instantaneous blast ................................................. - ............ . 4.31. Radial-Vertical particle motion trajectories, 300 feet from 3-hole and 7·hole, 9-millisecond-delayed blasts •• 5.1. C.Ombined data plot, overpressure versus scaled distance .......................... ·-·-··-··················-··--·---·· 6.1. Comparison of particle velocity data from different shots within a quarry ................................... - ............ . 6.2. C.Ombined velocity data from all quarries in Bureau of Mines studies .......................... ·-·········---··-··-· 6.S. Nomogram for estimating safe charge and distance limits for scaled distances of 20 and 50 ft/lb~ --··-
A· 1. Weaver Quarry ..... -------····--··-·····-·-···-·--·--··-·-···-·-··-·· .... -·······-··-·-·-····-·--·--··· A· 2. Webster City Quarry ·········---··---····-·-·················--·· .. ··-·-···-··-···-·--··---····--·--··-··-·-A· S. P &: M Quarry ·····-··-····--···----··-···-·-·--···-··--····-··-··-.. ····-··-······-····---··-··--·----·-·-·-A· 4. Ferguson Quarry ···-·········--·-··-·--···-··-······ .. --............... ·--··-··-··········..:·····-·-·--·-··-- • A· 5. Shawnee Quarry ... -····-····-··---····-·········-···---·-·-··-··-··-······-······-······-······---···-·--·-···--··· A· 6. Hamilton Quarry ···-·---···--·-···--·-·-···-··-·-----··-····-··············-······-·····-···---··· .. ··-····-··-··-······· A· 7. Flat Rock Quarry ·········-··· .. -······· .. ··················-···-.......... - ............................. - .................. - •• • .. ----··---··· A· 8. Bellevue Quarry ·········-···--.. ·······-·---····----·--···-·-·-······--··-··-······-···· .. ···-·-· .. ···-··-···--··-.. ····-A· 9. Bloomville Quarry ...................... ·---····-·-··-····--··-····· .. ···-··-··· .. ·-· ........................... ·--··--···· A·IO. Washington, D.C. Site ··-····--·-····-····--·----··-·-··-··-······---·····-.. -·--·--·--··-·---··--···· A -11. Poughkeepsie Quarry ......... - ............. ·-···-··-···-··-··-.. -· .. ·······-······-·-···-·-··-··------·-·--·-A· 12. West Nyack Quarry ............................ ·----·-·-···-.. ·-··-····· ......... _ .............. ---·-·-·····-··--··-··--··· A·I 3. Littleville Dam Site ............................................................. _ .................. _ ......................................... ___ .......... . A-14. Centreville Quarry ...................... _ ............. - ... - ...................................................................... ·-·--···· .. ••··• A· J 5. Manassas Quarry ........... _ ............. ·-·····-··-·········-··-······--................. ·-·····-··-··----··-··---·-·-··-······ A-16. Strasburg Quarry ·············-·····--·-····-··-····~·····-·····--··-·-·-············--····-······-·-··--·-···· .. -·---·--··-····-A-17. Chantilly Quarry ................................................................. _ ......................... ·-·-·-···--·······-·----··-······· A·IB. Culpeper Quarry ........................................ --·--· .. ·---·-··-··· .. -···-··-······-···· .. ··············-···· .. -· .. ··-·-·-···
iY
Page 9 9 II 11 15 16 17 18 2S 2-i 25 26 27 28 S2 SS 3-i !15 S6 !17 SB
S9 4S 44 45 46 48 48 50 51 52 5S 55 56 56 57 57 58 58 59 60 61 62 6S 6S 66 70 71 72
77 77 77 78 78 78 78 79 79 ~ 79 79 80 80 80 80 81 82 82

Fig.
A-19. Doswell Quarry -··-·-·-----·----------------------A·20. Riverton Quarry ____________ ..;..... ___________________ ~
A-21. Jaclc. Quarry ···-··---·---------------------------·----A·22. Buchanan Quarry •..
A·2'. Hi·Cone Quarry ···-····-··-------··-------·---·-------A·24. Union Furnace Quarry·------------------------------· A·25. Rocle.ville Quarry ···-··
TABLES Table 2.1. Average magnification of displacement leitmograplu --------------------5.1. Vibrations &om noxmal activities ·------·--------------· 4.1. Factorial design and shooting order--··----4.2. Summary of quarry-blasting tesu -----43. Average n and standard dcviatio111. __________________ . ______ _
4.4. Particle velocity intercepu at 100 feet 4.5. Average particle velocity intcn:epu for single bole and
milliaeoond-delayed blaau ···---·;·--··-·---------+·----·--··----····-·---4.6. Quarry blast data ···-·-··-·--·..:-·····-·- ·----·------4.7. Average slopes. {J1 ·-····-····-···--·· -·--·-·--·-----
4.8. Summary of K, 1, afJ., and H 1 data--·- ·-------·-------··---···----4.9. Values of 11t -····-··········-······-·-·····-·······--·· -·------------4.10. Slopes and interc.epu &om combined data •• ···----·---------·-·-· .. -·--4.11. Summary-method of initiation tests ---·····-······--·---···-·-~---·----····--···-----5.1. _Charge and overpressure data for W. E. Graham and Son~ Manassa.a Quarry, Mana1111a11. Va. ···----5.2. Charge and overpressure data for Culpeper Crushed Stone Company Quarry, Culpeper. Va. ···----·· 53. Charge and overpressure data for Chantilly Crushed Stone Company Quarry, Chantilly, Va.···----·· 5.4. Charge and overpressure data for New York Trap Rocle. Corporation Quarry, West Nyaclc., N.Y. ···-·---·· 5.5. Charge and overpressure data for Superior Stone Company, Buchanan Quarry, Greensboro, N.C. ···-··· 5.6. Charge and overpressure data for Superior Stone Company, Hi-Cone Quarry, Greensboro, N.C. ··-·---·· 5.7. Charge and overpressure data for Southern Material! Corporation, Jaclc. Stone Quarry, Petersburg. Va .... 5.8. Charge and overpressure data for Rockville Crushed Stone, Inc. Quarry, Rocle.ville, Md ......
JJ. 1. Shot and loading data for Weaver Quarry, Alden, Iowa ··--···---·----·----···--··--···--B· 2. Shot and loading data for Moberly Quarry, Webster City, Iowa-----·-···-·--·---:·-··-----B· 3. Shot and loading data for P &: M Quarry, Bradgate, Iowa ..................... ·-·-···---·······-······--··-···--.. . B· 4. Shot and loading data for American Marietta Quarry, Ferguson. Iowa --···--··-···-·--···--·····--··B· 5. Shot and loading data for Marble Cliff Quarrlca, Shawnee, Ohio ·--··--···········-·--···-········-·---B· 6. Shot and loading data for Hamilton Quarry. Marion, Ohio ······----·-----·-··-··-·-·--·B· 7. Shot and loading data for Flat Rocle. Quarry, Flat Roclt, Ohio ----····-·--·-··--·----·---··· B· 8. Shot and loading data for France Stone Company Quarry, Bellevue, Ohio ···--.. -······-······-·····-··--· ... B· 9. Shot and loading data for France Stone Company Quarry, Bloomville, Ohio ···-·········-··········-·······--· B-10. Shot and loading data for Theodore Roosevelt Bridge Construction Site, Washington, D.C ....... ·-·-·..,--··· B·ll. Shot and loading data for New Yorlt Trap Rocle. Corporation, Clinton Point Quarry, Poughkeepsie, N.Y. B-12. Shot and loading data for New York Trap .Jloclc. Corporation Quarry, West Nyack, N.Y. ·--·-.. ·-····--8-13. Shot and loading data for Littleville Dam Construction Site, Huntington, M;w. ·---···-···-··· .... ·-·-·B-14. Shot and loading data for Fairfax Quarries, Inc. Quarry, Centreville, Va. ···········-··-··-----·---B-15. Shot and loading data for W. E. Graham&: Som, Manassas Quarry, Manassas, Va. ··--·-··-··--···----8-16. Shot and loading data for Chemstone Corporation Quarry, Strasburg, Va .............. ·---·-··--··-····--8·17. Shot and loading data for Chantilly Crushed Stoue Company Quarry, Chantilly. Va.--·-····-----8-18. Shot and loading data for Culpeper Crushed Stone Company Quarry, Culpeper. Va .... ---8-19. Shot and loading data for General Crushed Stone Company Quarry, Doswell, Va.-·--··----8-20. Shot and loading data for Riverton Lime &: Stone Company Quarry, Riverton, Va. ··-···-····---··B-21. Shot and loading data for Southern Materials Corporation, Jaclc. Stone Quarry, Petersburg. Va. -·--B-22. Shot and loading data for Superior Stone Company. Buchanan Quarry, Greensboro, N.C. ---·--B-23. Shot and loading data for Superior Stone Company, Hi-Cone Quarry, Greensboro, N.C. B-24. Shot and loading data for Warner Company Quarry, Union Furnace, Pa. ----·
C 1. Particle velocity and frequency data for Weaver Quarry, Alden, Iowa __ ... C· 2. Particle velocity and frequency data for Moberly Quarry, Webster City, Iowa------c. 3. Particle velocity and frequency data for P &: M Quarry," Bradgate, Iowa ······-··---·······--··-·--··-c. 4. Particle velocity and frequency data for America Marietta Quarry, Fergwon, Iowa ··--······-·---c. 5. Particle velocity and frequency data for Marble Cliff Quarries, Shawnee, Ohio ··-·-·-···-···-----C· 6. Particle velocity and frequency data for Hamilton Quarry, Marion, Ohio ···--··-··-··-·· .............. _.. __ C· 7. Particle velocity and frequency data for Flatroclt Quarry, Northern Ohio Stone Company. Flatrock, Ohio C· 8. Particle velocity and frequency data for France Stone Company, Bellevue, Ohio ···--···~·----··-··--
Page 82 IU IU IK IK 85 85
raro 21 31 S5 39 40
41 42 46 47 49 49 M 67 67 67 67 67 67 67 67
87 87 87 87 87 88 88 88 88 88 89 89 89 89 90 90 90 90 91 91 91 91 91 91
95 !H !H !H !H 95 95 95
.,
Table Page C- 9. Particle velocity and frequency data fo.r France Company Quarry, Bloomville, Ohio ······-···-·····-··-··-··- 96 C-10. Particle velocity and frequency data for Theodore Roosevelt Bridge Construction Site, W:uhington, D.C. 96 C·ll. Particle velocity and frequency data for N.Y. Trap Rock Corporation, Clinton Point Quarry, Pough-
keepsie, N.Y. ·······-······--···--····-·-··-·-·····-···-···-·-··-··-······-··-·····-·-···-··--···-······-·-·-·····-- 91 C-12. Particle velocity and frequency data for N.Y. Trap Rock Corporation Quarry, West Nyack, N.Y. -·-···-·- 91 C-15. Particle velocity and frequency data for Littleville Dam Construction Site, Huntington, Mass. ·······-··-- 98 C-14. Particle velocity and frequency data for Fairfax Quarries, Inc. Quarry, Centreville, Va. -·-··--·-·---··-·- 98 C-15. Particle velocity and frequency data for W. E. Graham and Sona, Mana.ssu Quarry, Manassu, Va. ···-··-· 99 C·l6. Particle velocity and frequency data for Chemstone Corporation Quarry, Strasburg, Va. ···-········-···-··-·- 100 C-17. Particle velocity and frequency data for Chantilly Crushed Stone Company Quarry, Chantilly, Va. ··-······- 101 C-18. Particle velocity and frequency data for Culpeper Crwhed Stone Company Quarry, Culpeper, Va. ·--- 101 C·l9. Particle velocity and frequency data for General Crushed Stone Company Quarry, Doswell. Va. ---·-- 101 C-20. Particle velocity and frequency data for R.iverton Lime and Stone Company Quarry, R.iverton, Va. ··-····· 102 C-21. Particle velocity and frequency data for Southern Materials Corporation, Jack Stone Quarry, Petersburg,
Va. ······-······--···-·····-······-·····-······---···--··----··-··-··-·-···-·----·---··----·----·-··-··-·-······- 102 C-22. Particle velocity l.Jld frequency data for Superior Stone Company, Buchanan Quarry, Greensboro, N.C..... 102 C-2!. Particle velocity and frequency data for Superior Stone Company, Hi-Cone Quarry, Greensboro, N.C. .... 102 C-24. Particle velocity and frequency data for Warner Company Quarry, Union Furnace, Pa.------·- 10!
A
a
D E. R.
' F" f g H
It k t.
t.
k.
m
" LIST OF SYMBOLS
- Amplitude of vibration for displacement, velocity, or acceleration.
- Trace deflection for acceleration. - Trace deflection for displacement. - Trace deflection for particle velocity. - Peak acceleration. - Peak horizontal acceleration. - Peak vertical acceleration. - Exponent of charge weight in general propa·
gation ·law. Distance. Energy Ratio. Driving force. Vertical fora:. Frequency.
- Acceleration of gravity. - Particle velocity intercept for tcaled propa·
gation equation. - Intercept of regression line. - Constant or intercept of regression line. - Proportionality constant or magnification for
acceleration seismograph. - Proportionality ronstant or magnification for
displacement seismograph. .. Proportionality constant or magnification for
velocity seismograph. Mass.
n - Exponent. P - Peak overpressure. R - Radial component of motion. r •·• Damping factor. re - Critical damping factor. a - Spring ronstant. T - Transverse component of motion.
- Time. u - Peak displacement. " - Peak velocity. V - Vertical romponent of motion. W - Charge weight. x - Instantaneous amplitude of indicated W.
placement. x., x.. x. - x coordinates. s. • x coordinate for center of gravity. y., y., Y• - y roordinatet. y. - y coordinate for center of gravity. a - Exponent of charge weight in scaled propa-
gation law. fl - Exponent in scaled propagation law. 1 - Angle. I' - Coefficient of friction. 111 - Standard deviation about the regresnon line. + - Phase angle. ., - Angular frequency.

BLASTING VIBRATIONS AND. THEIR EFFECTS ON STRUCTURES
Bury ll. Nich~U.,1 Charles F. Johmon,• and Wilbur L Dun.11•
ABSTRACT
This report presents the results of the Bureau of Mines IO.year program to study the problem of air blast and ground vibrations ~nerated by blasting. The program included an extensive field study of ground vibrations; a consideration of air blast effects: an evaluation of instrumentation to measure vibrations: establishment of damage criteria for residential structures: determination of blasting parameters which grossly affected vibrations; empirical safe blasting limits; and the problem of human response. While values of 2.0 in/sec particle velocity and 0.5 psi air blast overpressure are recommended as safe blasting limits not to be. exceeded to preclude damage to residential structures, lower limits are suggested to minimize complaints. Millisecond-delay blasting is shown to reduce vibration levels as compared to instantaneous blasting. and electric cap deJay blasts offer a slight reduction in vibration levels as compared to Primacord delay blasts. Vibration levels of different blasts may be compared at common scaled distances, where scaled distance is the distance divided by the square root of the maximum charge weight per delay. Geology, rock type, and direction affect vibration level within limits. Empirically, a safe blasting limit based on a-scaled distance of 50 ft/lb"' may be used without instrumentation. However, a knowledge of the particle velocity propagation characteristics of a blasting site determined from instrumented blasts at that site are recommended to insure that the safe blasting limit of 2.0 in/sec is not exceeded.
CHAPTER 1.-GENERAL INTRODUCTION
I.I-INTRODUCTION
Using explosives to break rock generates air-. and ground-borne vibrations which may have detrimental effects on nearby structures. A variety of complaints attributable to vibrations from blasting have always been received by the quarrying industry. producing stone or aggregate from surface excavations, the mining industry producing ore from open-pit mines, and the construction industry producing road cuts, pipe line, and foundation excavations. Blasting operations associated with underground mining and excavation work are relatively immune to these com-
plaints, but if large-scale nuclear devices are used for mining purposes, complaints from underground blasting operations will become a major problem. This problem is currently being investigated by the Atomic Energy Commission (AEC).
1 Supuvllo..,. seophyaldat. • GeaphYJidJt. ~ S..puv;_, mean:h physlal a:lentflt, AU aulbon are with the ........ er MiDiq Jlaearc:h Oeiua, Bureau ol Mina, Dellttt", <:olo.
Some complaints registered are legitimate claims of damage from vibrations generated by blasting. However, other complaints are not valid, and the reported damage has resulted from natural settling of building, poor construction, et cetera. In general. complaints have been sufficiently numerous to constitute a major problem for operators engaged in blasting and emphasize the need for technological data to evaluate vibration problems associated with blasting. Both the
1
2 BLASTING VIBRATIONS A.ND THEIR EFFECl'S ON STRUCTUltES
operators and the general public nee<! adequate safeguards based upon factual data to protect their specific interests. Industry needs a reliable basis on which to plan and conduct blasting operations . to minimize or abolish legitimate damage claims and eliminate the nuisance variety of complaint. The public would benefit by the absence of conditions which would create damage. The problem has been of major concern to Federal, State, and local governments, industries engaged in blasting, explosive manufacturers, insurance companies. and scientists.
During the post World War II period, the growth in population, urbanization, new highway programs, and the need for more construction materials increased the problem of complaints from blasting. In addition, the need for quarries and construction near urban centers and the simultaneous urban sprawl acted to bring operators engaged in blasting and the public into a closer physical contact. In many cases, housing and public buildings were actually built on property adjoining quarries. Naturally, the number of complaints increased drastically. During the same time period, rapid advancements and improvements were made in applicable instrumentation, primarily seismic gages, amplifiers, and recording equipment. There was also extensive research in closely related fields. The Defense Department and other groups studied damage to structures from explosive and other impulse-type loading. The Bureau of Mines and other investigators studied both empirically and theoretically, the generation and propagation of seismic waves in rock and other media.
In 1958 the Bureau of Mines decided to reinvestigate blasting vibration phenomena becau5e of the pressing need for additional blas\ing vibration information, the availability of improved seismic instrumentation, and the availability of applicable seismic information from investigators in other disciplines. To assure that the research effort was directed toward the solution of the most urgent problems, industry support was solicited and obtained to establish a cooperative research program.
1.2 INDUSTRY MEETING
In 1959 representatives of the cooperating groups, quarry operators, scientists from industry and educational institutions, and members of the Bureau of Mines technical staff engaged in blasting research attended a conference, held at the Bureau of Mines facility at College Park, Maryland. As a result, a comprehensive research
program on blasting vibrations and their effects on structures was developed and initiated by the Bureau. The major objectives of this program were
1. To establish reliable damage criteria, i.e., the relationship between the magnitude of the ground vibrations and the damage produced in a structure and
2. To establish a propagation law {or groundbome surface vibrations that could be used to predict the relationship between the magnitude of the ground vibration and the size of the explosive charge, the effect of shot-to-measurement point distance, and the other variables which have a qiajor effect on the magnitude or character of the ground vibrations. The other variables might include explosive type, method of initiation, geology, and directional effects.
Additional objectives .were to evaluate the vibration measuring equipment currently used and to develop specifications for new instrumentation, if warranted. The degrt>! of. significance of air blast in causing damage to structures was also to be established.
1.5 HISTORY
Many investigations had been conducted both. in the U.S. and other countries on the effects of air and ground vibrations· from blasting on residential and other type structures. One of the first suc:h. studies reported. in this country was made in 1927 by Rockwell (8).4 From blast-effect studies instrumented with displacement seismographs and falling-pin gauges, Rockwell concluded that· quarry blasting, as normally conducted, would not produce damage to resi· dential structures if they were more than 200 to SOO feet distant from the quarry. He also pointed out the need for "securing accurate quantitative measurements of the vibrations produced by blasting".
The Bureau of Mines conducted. an extensive investigation of the problem of seismic effects of. quarry blasting during the period 19SO to 1940. This study represented the first major effort to establish damage criteria for residential structures and to develop a generalized. propagation law for ground vibrations (11) • The recommended criteria of damage were based upon the resultant acceleration experienced by the structures. Consideration of all data indicated an acceleration of 1.0 g was the best index of damage. Accelerations ranging between 0.1 g and 1.0 g
• Italic numben in parmti- mer to refen:aca at the eacl of each diapter. •
GENDAL INTllODUCI'IOH 5
resulted in slight damage. Accelerations of less than 0.1 g resulted in no damage. A propagation law relating displacement amplitude, charge weight, and distance was developed empirically from data from many quarry blasts, but its use was recommended only within specified distances and charge weights.
In 194.3 the Bureau published the results of a study on the effect of air blast waves on structures (12). The results indicated that windows were always the first portion of a structure to be damaged. An overpressure of 0.7 psi orless would result in no window damage, while overpressures of 1.5 psi or more would definitely produce damage. The main conclusion of this study was that damage from air blast was not a major problem in normal quarry operations.
Damage criteria for structures subjected to :vibration were advanced by Crandell in 1949 (1) and were based upon measured vib~tion levels in the ground near the structure. A consideration of the energy transmitted through the ground resulted in his use of the quantity identified as Energy Ratio (E.R.) and defined as the ratio of the square of the acceleration in feet per second squared and the square of the frequency in cycles per second. His tests showed that when the Energy Ratio in the ground was less than .3.0, .3.0 to 6.0, and greater than 6.0, nearby structures were in damage zones considered safe, caution, and danger, respectively. Crandell pointed out that displacement and frequency could also be used to determine the Energy Ratio.
In J 950 Sutherland reported (9) the results of a study of vibrations produced in structures by passing vehicles. No harmful effects on the structures were associated with vibrations from the nearby movement of heavy vehicles. It was shown that people perceived vibrations at much lower levels than would cause any damage to structures and that vibrations causing extrem!! discomfort to a person would barely cause plastc!r damage in a structure. Two additional published papers (J, 4) discussed the relationship of seismic amplitude and explosive charge size. Both established a propagation law for a specific site with little application elsewhere. In 1956 Jenkins (5) discussing the data of Reiher and Meister (7) on human response to vibratory motion and the response to blasting vibrations, stated that the public should be made aware of the fact that the average person can feel vibrations from onehundredth to one-thousandth of the magnitude necessary to damage structures.
Several states and organizations adopted dam· age criteria during the period 1949 to 1960. For
example, New Jersey and Massachusetts specified an Energy Ratio of 1.0 as the allowable limit for blasting operations. Pennsylvania adopted a displacement amplitude of 0.0.3 inch as a safe blasting limit. Biasting operations conducted by or for the U.S. Corps of Engineers and the New York State Power Authority specify a damage criterion based on an Energy Ratio of 1.0.
In 1957 Teichmann and . Westwater (10) presented a brief but informative state-of-the-art summary on the subject of blasting vibrations, including ground movement, air blast, human susceptibility, legal aspects, and other topics. · In 1958, as the result of an extensive series of tests to study vibrations from blasting, Langefors. Kihlstrom, and Westerberg proposed damage criteria based on particle velocity in the ground near a structure (6). A particle velocity of 2.8 in/sec was cited as a damage threshold above which damage J.bight begin to occur. In 1960 Edwards and Northwood presented the results of their study in which six structures were subjected to damage from vibrations due to blasting (2) • From the evaluation of data obtained from an assortment of instrumentation, including ac· celeration, particle velocity, and displacement measurements, they concluded that particle velocity was the most reliable quantity on which to base damage criteria, and they proposed a safe limit of 2 in/sec particle velocity.
1.4 GENERAL APPROACH TO THE PROBLEM .
The available data as discussed in section Ul and the general state of the art of the blasting vibration technology represented the starting point for the Bureau study. The first objective of the program was the development of reliable damage criteria. Since the acquisition of sufficient and reliable vibration damage data would be a long and costly process and since a considerable effort had been expended on this subject by the Bureau and other investigators, it was believed that the most profitable approach would be to conduct a comprehensive study to evaluate the published experimental data pertaining to dam· age. This study would determine if published data relating vibr~tion amplitudes and frequen· des to damage could be pooled to establish one set of reliable damage criteria. If the data could not be pooled, results would indicate the direc· tion of further investigation to establish reliable damage criteria. Additional data involving dam· age from blasting vibrations would be obtained .if possible. The determination of which quantity
4 BLASTING VIBRATIONS AND THEDt EF)"ECI'S ON STRUcnJllEI
(displacement, particle velocity, or acceleration) was most closely associated with damage to structures would provide optimum selection of gages and instrumentation.
The use of three-component seismographs or gage stations enabling the recording of motion in three mutually perpendicular directions was considered a necessity, because seismic quantities, such as displacement, particle velocity, and acceleration are vector quantities. Examination of published vibration data from blasting revealed the serious limitation in the data that results when only one or two three~mponent stations were employed to record seismic data from any one shot. It was decided to use six to eight threecomponent gage stations as an array to record data from each quarry blast to overcome this limitation.
In the determination of a propagation law that would be useful· at any site and to avoid considering the nearly infinite variety of struc· tures, damage criteria were based on the vibra· lion levels observed in the ground near the structure rather than on exposed rod or in struc· tures. A comprehensive program to evaluate existing instrumentation was planned which included shaking table tests to study linearity, useful amplitude and frequency range, and a sensitivity calibration as a function of frequency and amplitude.
Most published data indicated that damage from air blast was insignificant in routine blast· ing operations. Evaluation of air blast effects was to be initiated after the major factors con· tributing to ground vibrations had been studied, rather than divide the recording capabilities to study the two phenomena simultan~usly.
This report reviews and summarizes the Bureau program to restudy the problem of vibrations from quarry blasting. Data from 171 blasts at 26 different sites are presented. Published data from many other investigators have been considered in the analysis. The results include an evaluation of instrumentation, recommended instrumentation specifications, and gage placement procedures. .
Recommendations for safe levels of vibration permissible in structures, safe levels of airblast overpressure, and human response and the resulting problems are discussed in Chapter S. The generation and prQpagation of air blast and ground vibrations and the variables which grossly affect them are discussed in Chapters 4 and 5 and a general propagation law derived. Chapter 6 ia devoted to the problem of estimating safe vibration levels.
1.5 REFERENCES"
I. Crandell, :r. J. Ground Vibration Due to Blasting and ~ Elfccu Upon Structures. J. Boston Soc. Civil
gineen, April· 1949, pp. 222-245. 2. Edwards, A. T., and T. D. Northwood. Ex~rimental
Studies of the Elfecta of Blastin9' on tructurea. The Engineer, v. 210, Sept. 50, l , pp. 598-546. ·
J. Habberjam, G. M., and J. Il. Whetton. On the Rela· tionshit Between Seismic Am~itude and Cb.afF of ~ Olive Fired in Routine lasting Operations. Geo ysics. v. 17, No. 1, January 1952, pp. ll&-128.
4. Ito, lchiro. On the Relationship Between Seismic Ground Am~tude and the Quantity of Ex~losives in Blastinf. · eprint &om Memoirs of the acul~ of En~ toto Univ., v. 15, No. 11, April 195 , pp. 57 8.
5. Jenkins. J· E. Human Rcspome to Industrial Blasting Vibrations. AIME Tram., Mining Engineering. May 1956, pp. 555-5!18.
6. Langeforr, U.. Kihlltr&ll, B., and H. West~. Ground Vibrations in Blastin~ater Power v. l , February 1958, pp. !135-338, !I 595 •. 421-424.
T. Reiher, H., and :r. J. Meister. Die Empfindlichkeit des Menschcn ~ Enchuetterunl:in (Sensitivity of Human Be ngs to Vibration/' orschunf. auf dem Gebert des lngcnieurwesens Berlin), v. , February 19!11, pp. !181-586.
8. RockweU, E. H. Vibrations Cau!ICd by Qua~ Blasting and Their Elfect on Structures. R Producu, vol. !IO, 1927, pp. 58-61.
9. Sutherland, H. B. A Stud~ of Vibrations Produced in Structure by Hea~ Ve ides. Proc. of the Thirtieth Annual Meeting o the Highway Research Board, Ottawa, December 1950, pp. 406-419.
10. Teichman, G. A., and R. Westwater. Blasting and Associated Vibrations. Engineering, April 12, 1957, PP· 460-465.
11. Thoenen, i R .. and S. L. Windes. Seismic Efl'ecta of Quarry lasting. BuMines Bull. 442, 1942, 85 pp.
12. Windes, S. L. Damage From Air Blast. BuMines llept. · of Inv. 5708, 1945, 50 pp.
•Titles cncloled In puenthem arc tnDIJatJo1111 from the lanpqe In wbicb !he lum wu orisUW11 pu1>liallcd. ·
" ~
CHAPTER 2.-INSTRUMENT A TI ON
2.1-INTRODUCTION
The Bureau of Mines program of research in . the field of vibrations from quarry blasting in· duded objectives to evaluate currently used vibration-measuring equipment and to develop instrumentation for use in the research program. The instrumentation then widely used to moni~ tor blast vibrations was of the portable seismograph type with three adjustable feet. These instruments were designed to measure displacement or acceleration and to record the comJ>09 nents of motion along with timing lines on a moving strip of light sensitive paper. The tripodlike feet pen.titted easy leveling of the machines. However, some instability of the machines was noted, and a theoretical study of the stability of three-point mounted portable seismographs was made by Duvall (I). Calibration studies of three portable displacement seismographs and a portable acceleration seismograph were made (4, 8').
The instrumentation developed by the Bureau of Mines for measuring blasting vibrations was housed in a mobile van-type laboratory and consisted of particle velocity gages, amplifiers, and a direct writing osci11ograph to record either particle velocity or displacement by integrating the particle velocity. Because airborne vibrations were recognized as a major factor in the complaints presented to agencies involved in blast· ing, gages to measure the airborne vib:rations were included in the instrumentation. Mounting of particle velocity gages was subjected to critical examination, and a standard technique for coupling the gages to soil was devised (6) •
The dynamic response of a seismic transducer is presented to provide the mathematical basis for a brief description of the three types of seis. mographs. The stability of three·point mounted seismographs and calibration studies of two types of portable seismographs are included to complete the objective of evaluating vibration measuring equipment. The instrumentation developed for use in the research program and the technique for coupling gages to the soil are briefly described.
2.2-THE DYNAMIC RESPONSE OF A SEISMIC TRANSDUCER
The typical portable seismograph consists of a seismic transducer, a timer, and a recording sys. tem. The recording 51stem may be a peak-reading volt meter, a photographiC paper recorder, or a direct-writing paper recorder. The timer is an accurate frequency generator which puts timing lines on the piper record. The seismic transducer is a device for converting ground motion to a varying voltage or to a similar motion of a spot of light which is recorded on a moving strip of light sensitive paper. Seismic transducers can be designed to respond linearly to either particle displacement, velocity, or acceleration.
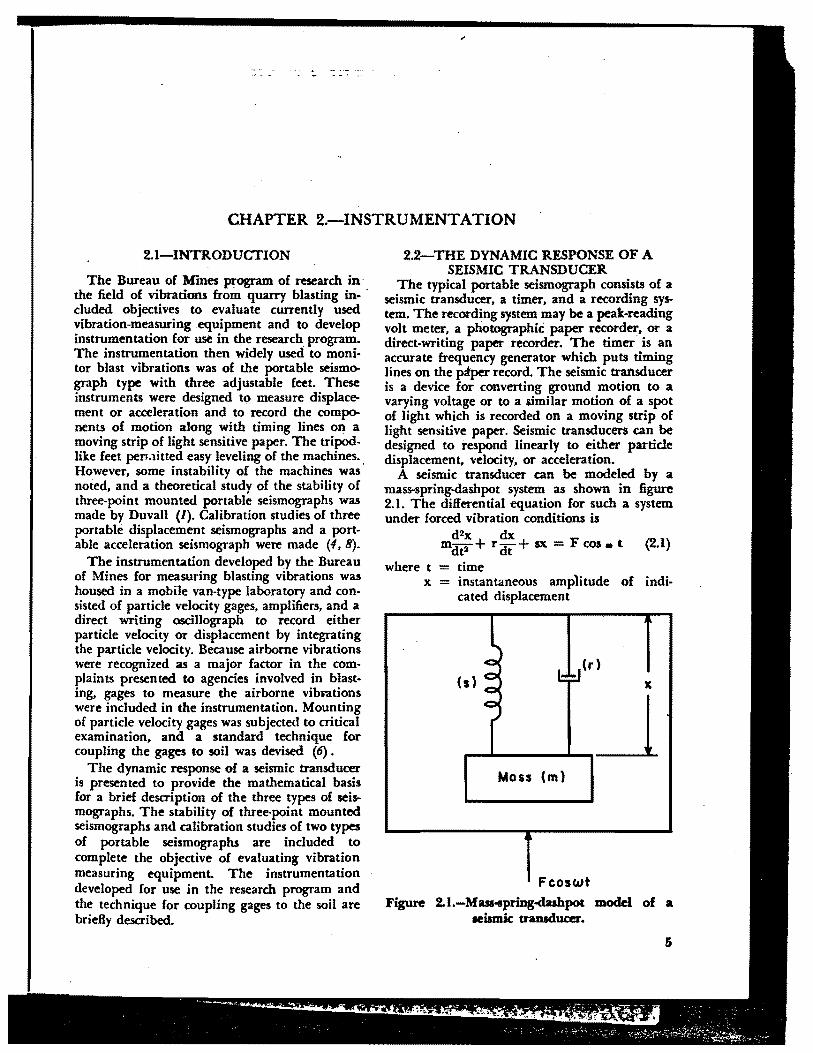
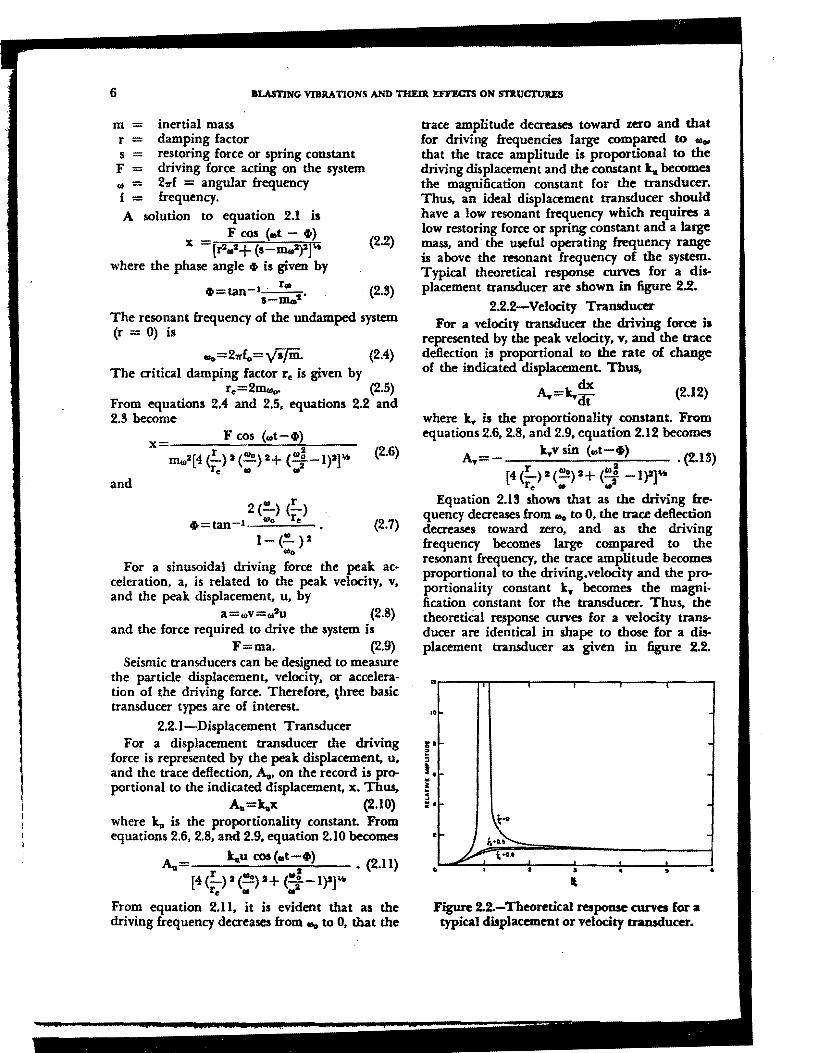
A seismic transducer can be modeled by a mass-spring-dashpot system as shown in figure 2.1. The differential equation for such a system under forced vibration conditions is
d2x dx mdt2 + r dt + sx = F cos • t (2.1)
where t = time x = instantaneous amplitude of indi·
cated displacement
(r)
(s) x
_____ _J Mass (m)
Fcoswt Figure 2.1.-MasHpring-duhpot model of a
seismic tramducer.
5
6 BLASTING VIBRATIONS AND THEIR. EFl'ECl'S ON sntUClVRES
m = inertial mass r = damping factor s = restoring force or spring constant F = driving force acting on the system • = 211'f = angular frequency f = frequency. A solution to equation 2.1 is
F cos (•t - ti) x =rr2(lt2+ (s-m.2)2]~ (2.2)
where the phase angle ti is given by
ti=tan-• · r,. . (2.S) s-m.2
The resonant frequency of the undamped system (r = 0) is
111o=211'f0 =ys/m. (2.4) The critical damping factor re is given by
re=2nw.,. (2.5) From equations 2.4 and 2.5, equations 2.2 and 2.S become
x= F cos (•t-ti)
mw2(4 ~) 2 <:0 )2+ c::-1)2]~ (2.6)
and
2 (!.) (!..) +=tan-1. '°° re (2.7)
1- (!. )2 Clllo
For a sinusoidal driving force the peak acceleration, a, is related to the peak velocity, v, and the peak displacement, u, by
a=wv=Cll2u (2.8) and the force required to drive the system is
F=ma. (2.9) Seismic transducers can be designed to measure
the particle displacement, velocity, or acceleration of the driving force. Therefore, three biuic transducer types are of interest.
2.2.1-Displacement Transducer For a displacement transducer the driving
force is represented by the peak displacement, u, and the trace deflection, A,., on the record is proportional to the indicated displacement, x. Thw,
A,.= tax (2.10) where ta is the proportionality constant. From equations 2.6, 2.8, and 2.9, equation 2.10 becomes
A,.= tau cos(mt-;•> • (2.ll)
[4 (!..) 2 (""') s+ (•o -1)2]~ re 111 • 2
From equation 2.11, it is evident that as the driving frequency decreases from tito to 0, that the
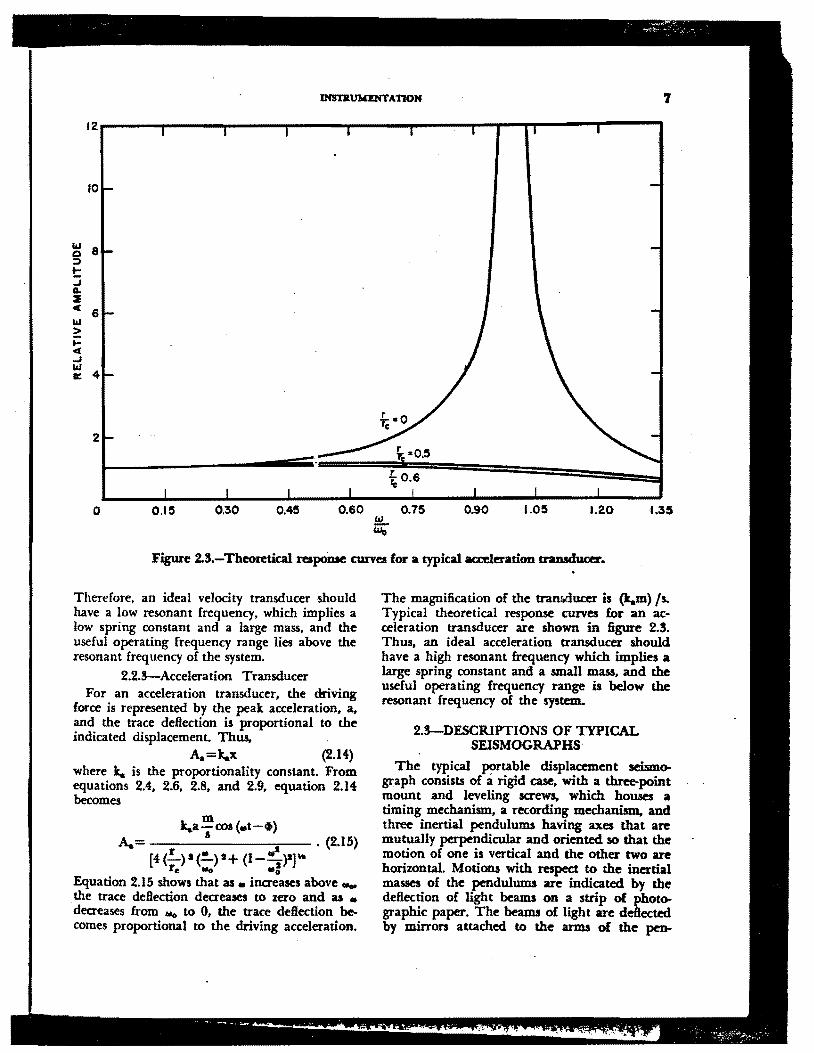
trace amplitude decreases toward zero and that for driving frequencies large compared to -... that the trace amplitude is proportional to the driving displacement and the constant k.. becomes the magnification constant for the transducer. Thus, an ideal displacement transducer should have a low resonant frequency which .requires a low restoring force or spring constant and a large mass, and· the· useful operating frequency range is above the resonant frequency of the system. Typical theoretical response curves for a displacement transducer are shown in figure 2.2.
2.2.2-Velocity Transducer For a velocity transducer the driving force is
represented by the peak velocity, v, and the trace deflection is proportional to the rate of change of the indicated displacement. Thus,
dx A.,.=k,.dt (2.12)
where k,. is the proportionality constant. From equations 2.6, 2.8, and 2.9, equation 2.12 becomes
A.,.=- k,.v sin (•t-+) . (2.lS)
[4(!..)t(!!!2)2+ ( 111 ~ -1)2]" re '* ,,;
Equation 2.15 shows that as the driving frequency decreases from 111o to 0, the trace deflection decreases toward zero, and as the driving frequency becomes large compared to the resonant frequency, the trace amplitude becomes proportional to the driving.velocity and the proportionality constant k.T becomes the magni· fication constant for the transducer. Thus, the theoretical response curves for a velocity transducer are identical in shape to those for a displacement transducer as given in figure 2.2.
••..---........ ..---------...----....-----. 10
0 •
Figure 2.2.-Theoretical response curves for a typical displacement or velocity ttansducer.
7
12----------------------------.------------..... --................. -----r------.
10
II.I 8 0 ::> !:: ..J a. :I • 6 II.I ~ ... c ..J I.I.I a: 4
2
to.&
0 0.15 0.30 0.45 0.60 0.75 0.90 1.05 1.20 1.35
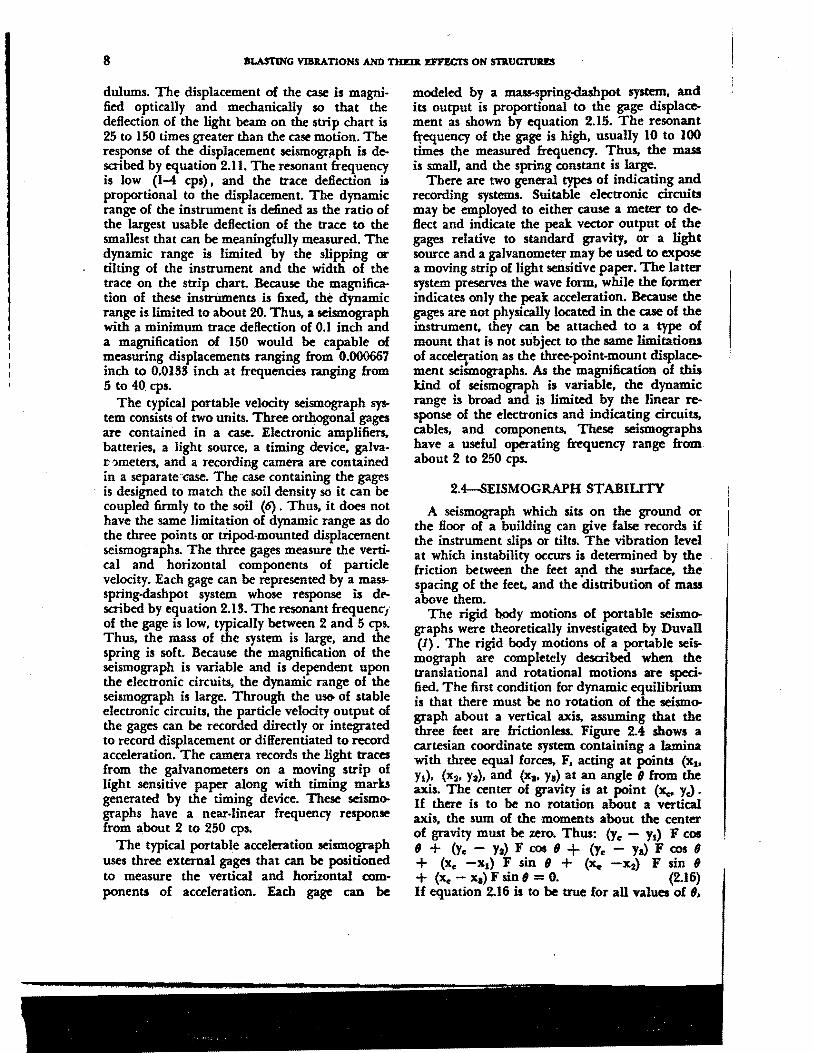
Figure 2.3.-Theoretical response curves for a typical acceleration transducer •
Therefore, an ideal velocity transducer should have a low resonant frequency, which implies a low spring constant and a· large mass, and the useful operating frequency range lies above the resonant frequency of the system.
2.2.!J-Acceleration Transducer For an acceleration transducer, the driving
force is represented by the peak acceleration, a, and the trace deflection is proportional to the indicated displacement. Thus,
A.=k.x (2.14) where Jc. is the proportionality constant. From equations 2.4, 2.6, 2.8, and 2.9, equation 2.14 becomes
m Jc.a-cos (.,t-•) A.= s . (2.15)
(4(!_)1(.!..)I+ (J-_.1)1)\11 re ... ·=
Equation 2.15 shows that as• increases above-.. the trace deflection decreases to zero and as • decreases from .,.. to 0, the trace deflection becomes proportional to the driving acceleration.
. The magnification of the transducer is (k.m) /s. Typical theoretical response curves for an acceleration transducer are shown in figure 2.5. Thus, an ideal acceleration transducer should have a high resonant frequency which implies a large spring constant and a small mas.s, and the useful operating frequency range is below the resonant frequency of the system.
2.!J-DESCRIPTIONS OF TYPICAL SEISMOGRAPHS
The typical ~table displacement seismograph consists of a rigid case. with a three-point mount and leveling screws, which houses a timing mechanism, a recording mechanism, and three inertial pendulums having axes that are mutually perpendicular and oriented. so that the motion of one is vertical and the other two are horizontal. Motions with respect to the inertial masses of the pendulums are indicated. by the deflection of light beams on a strip of photographic paper. The beams of light are deflected. by mirrors attached to the arms of the pen-
8 BLASTING vmunoNS AND 11llDl D'FECTS ON STllUCTUU:s
dulums. The displacement of the case is magnified optically and mechanically so that the deflection of the light beam on the strip chart is 25 to 150 times greater than the case motion. The response of the displacement seismogr~ph is described by equation 2.11. The resonant frequency is low (1-4 cps), and the trace deflection is proportional to the displacement. The dynamic range of the instrument is defined as the ratio of the largest usable deflection of the trace to the smallest that can be meaningfully measured. The dynamic range is limited by the slipping or tilting of the instrument and the width of the trace on the strip charL Because the magnifica· don of these instruments is fixed, the dynamic range is limited to about 20. Thus, a seismograph with a minimum trace deflection of 0.1 inch and a magnification of 150 would be capable of measuring displacements ranging from 0.000667 inch to 0.018S inch at frequencies ranging from 5 to 40 cps.
The typical portable velocity seismograph system consists of two units. Three orthogonal gages are contained in a case. Electronic amplifiers,, batteries, a light source, a timing device, galvar, '.>meters, and a recording camera are contained in a separate<:ase. The case containing the gages is designed to match the soil density so it can be coupled firmly to the soil (6) . Thus, it does not have the same limitation of dynamic range as do the three points or trlpod·mounted displacement seismographs. The three gages measure the vertical and horizontal components of particle velocity. Each gage can be represented by a massspring-dashpot system whose response is df'scribed by equation 2.18. The resonant frequenci of the gage is low, typicaJly between 2 and 5 cps. Thus, the mass of the system is large, and the spring is soft. Because the magnification of the seismograph is variable and is dependent upon the electronic circuits, the dynamic range of the seismograph is large. Through the US& of stable electronic circuits, the particle velocity output of the gages can be recorded directly or integrated to record displacement or differentiated to record acceleration. The camera records the light traces from the galvanometers on a moving strip of light sensitive paper along with timing marks generated by the timing device. These seismographs have a near-linear frequency response from about 2 to 250 cps.
The typical portable acceleration seismograph uses three external gages that can be positioned to measure the vertical and horizontal components of acceleration. Each gage can be
modeled by a mass-spring-dashpot system, and its output is proportional to the gage displacement as shown by equation 2.15. The resonant f:tequency of the gage is high, usually 10 to 100 times the measured frequency. Thus, tbe mass is small, and the spring constant is large.
There are two general types of indicating and recording systems. Suitable electronic circuits may be employed to either cause a meter to deflect and indicate the peak vector output of the gages relative to standard gravity, or a light source and a galvanometer may be used to expose a moving strip of light sensitive paper. The latter system preserves the wave form, while the former indicates only the peak acceleration. Because the gages are not physically located in the case of the instrwrient, they can be attached to a type of mount that is not subject to the same limitations of accelc:i;ation as the three-point-mount displacement seismographs. As the magnification of this kind of seismograph is variable, the dynamic range is broad and is limited by the linear response of the electronia and indicating circuits, cables, and components. These seismographs have a useful operating frequency range from about 2 to 250 cps.
2.4-SEISMOGRAPH STABILITY
A seismograph which sits on the ground or the floor of a building can give false records if the instrument slips or tilts. The vibration level at which instability occurs is determined by the friction between the feet apd the surface, the spacing of the feet, and the distribution of mass above them.
The rigid body motions of portable seismographs were theoretically investigated by Duvall (I) . The rigid body motions of a portable seis
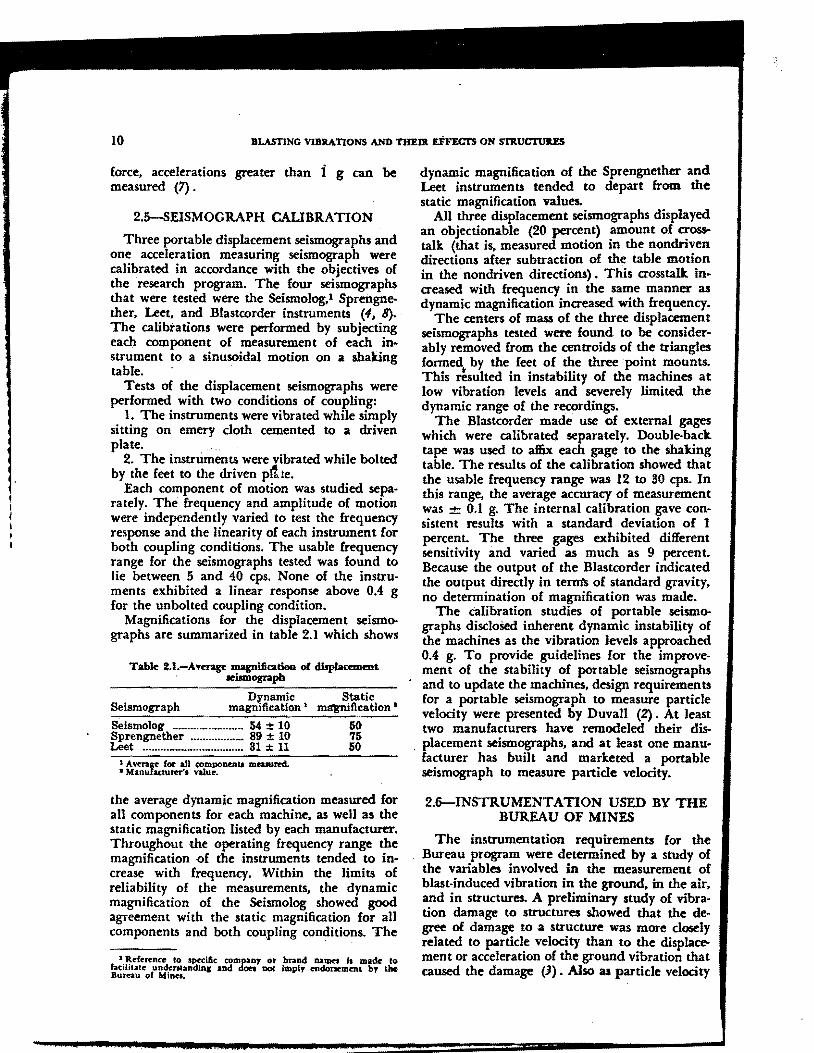
mograph are completely described when the translational and rotational motions are sped· fi.ed. The first condition for dynamic equilibrium is that there must be no rotation of the seismograph about a vertical axis, assuming that the three feet are frictionless. Figure 2.4 shows a cartesian coordinate system containing a lamina with three equal forces, F, acting at points (xi, Yi), (x2, Y2), and (xa, Y11) at an angle I from the axis. The center of gravity is at point (Xe. Ye). If there is to be no rotation about a vertical axis, the sum of the moments about the center of gravity must be zero. Thus: (Ye - Yi) F cos I + (Ye - Y2) F cos I + (Ye - Ya) F cos fJ + (Xe -xi) F sin (J + (X. -x2) F sin (J
+ (Xe - Xa) F sin (J = 0. (2.16) If equation 2.16 is to be true for all values of fJ.
----- ~

JNSTallll.ENTATION 9
y
F
--~~~--...... ~~~~----~~--~x Figure 2.4.-Horizontal location of center of
gravity of a laminL
the sum of the coefficients of cos (J and sin (J must be zero. Therefore.
and (2.17)
Y = Y1+Y2+Ya fl s .
Thus, the condition for no rotation about a vertical axis is that the center of gravity of the seismograph must be located at the centroid of the feet.
If tht center of gravity of the seismograph were located at the centroid and in the plane of the feet, the same type of solution would hold for rotation about a horizontal axis. However, all portable seismographs have a center of gravity that is located some distance above the plane of the feet. This configuration is shown in figure 2.5.
The feet of the seismograph are located at points A, B, and C. Point 0 is the centroid of the triangle ABC. Because tilting will normally occur by the raising of one of the feet, the rotation axis will lie along the lines between two of the feet. For convenience, line AB has been selected for a rotation axis. The center of gravity of the seism~ graph is located above the plane of the feet at point G. ·
A motion of the surface in a direction normal to the line AB will cause a force to be generated to accelerate the mass. This force will be distributed among the feet so that each foot will
Figure %.5.-Vertkal location of center of gravity of a Seismograph.
contribute one.third of the total horizontal accelerating force ma111 where m is the mass of the instrument anq a11 is the horizontal acceleration. The inertial force resisting the driving force is then equal to it and opposite in direction. A second force mg due to gravity acting on the mass is directed downward.
The condition of no rotation about the axis AB is that the moment of the force ma11 be less than the moment of the force mg. Thus.
DG ma11 cos esDG mg sin e or (2.18)
all g tan e. The sliding of a seismograph is resisted by the
friction between the feet and the surface. This frictional force is dependent upon the coefticient of friction, µ., and the mass of the machine, m. The condition of no slippage is that the inertial force mwt not exceed the frictional force. Thus,
ma11 < p. mg. (2.19) Because the coefticient of friction is usually less
than unity, slipping may occur at less than 1 g. When the seismograph is subjected to vibratory motion, the vertical force, F.,, may be thought of as oscillating about some steady value,
F.,=mg+mil... sin .t where a., is the vertical acceleration. Therefore, the minimum vertical force ii
F., min=m (g-a.,). (2.20) Thus, from equations 2.19 and 2.20, the maximum horizontal acceleration before slipping occurs ii
a11 max !S. p. (g-a ... ). (2.21) Equation 2.21 shows that horizontal accelerations of 1 g cannot be measured with a seismograph simply resting on a surface when it is subjected to vibratory motion. If the seismograph is spring loaded to the ground with an additional vertical
10 BLASTING VIBRATIONS AND TBE.Dl EFFECTS ON S'l'llUCTUllES
force, accelerations greater than i g can be measured (7) .
2.5-SEISMOGRAPH CALIBRATION
Three portable displacement seismographs and one acceleration measuring seismograph were calibrated in accordance with the objectives of the research program. The four seismographs that were tested were the Seismolog,t Spreilgnether. Leet. and Blastcorder instruments (4, 8). The calibrations were performed by subjecting each component of measurement of each in· strument to a sinusoidal motion on a shaking table.
Tests of the displacement seismographs were performed with two conditions of coupling:
I. The instruments were vibrated while simply sitting on emery cloth cemented to a driven plate. . ...
2. The instruments were vibrated while bolted by the feet to the driven pdte.
Each component of motion was studied separately. The frequency and amplitude of motion were independently varied to test the frequency response and the linearity of each instrument for both coupling conditions. The usable frequency range for the seismographs tested was found to lie between 5 and 40 cps. None of the instruments exhibited a linear response above 0.4 g for the unbolted coupling condition.
Magnifications for the displacement seismographs are summarized in table 2.1 which shows
Table 2.1.-Avmigc magnification of displacement . Rilmograph
Dynamic Static Seismograph magnification ' mqnification •
Seismolog ........................ 54 ± 10 50 Sprengnether ............... _. 89 ± 10 75 Leet ·········-····-················· 31 ± 11 50
• Avcraae for all c:ompoMnll meuured. • Manufactunn'• valu.,.
the average dynamic magnification measured for all components for each machine. as well as the static magnification listed by each manufacturer. Throughout the operating frequency range t!te magnification of the instruments tended to m· crease with frequency. Within the limits '?f reliability of the measurements. the dynamic magnification of the Seismolog showed good agreement with the static magnification for all components and both cou,pling conditions. The
' lldeRnc" to specific company or brand iames It made to facilitat" undentandlq and don not Imply "ndorwment by the Bur.,au of Mina.
dynamic magnification of the Sprengnether and Leet instruments tended to depart from the static magnification values.
All three displacement seismographs displayed an objectionable (20 percent) amount of cros.talk (that is. measured motion in the nondri~en directions after subtraction of the table motion in the nondriven directions) • This crosstalk increased with frequency in the same manner as dynamic magnification increased with frequency.
The centers of mass of the three displacement seismographs tested were found to be considerably removed from the centroids of the triangles fanned by the feet of the three point mounts. This Jsulted in instability of the machines at low vibration levels and severely limited the dynamic range of the recordings.
The Blastcorder made use of external gages which were calibrated separately. Double-back tape was used to affix each gage to the shaking table. The results of the calibration showed that the usable frequency range was 12 to 30 cps. In this range, the average accuracy of measurement was ± 0.1 g. The internal calibration gave consistent results with a standard deviation of 1 percent. The three gages exhibited different sensitivity and varied as much as 9 percent. Because the output of the Blastcorder indicated the output directly in ternts of standard gravity, no determination of magnification was made.
The calibration studies of portable seismographs disclosed inherent dynamic instability of the machines as the vibration levels approached 0.4 g. To provide guidelines for the improvement of the stability of portable seismographs and to update the machines. design requirements for a portable seismograph to measure particle velocity were presented by Duvall (2) . At least two manufacturers have remodeled their dis-
. placement seismographs. and at least one manu· facturer has built and marketed a portable seismograph to measure particle velocity.
2.6-INSTRUMENTATION USED BY THE BUREAU OF MINES
The instrumentation requirements for the Bureau program were determined by a study of the variables involved in the measurement of blast-induced vibration in the ground. in the air. and in structures. A preliminary study of vibration damage to structures showed that the degree of damage to a structure was more closely related to particle velocity than to the displacement or acceleration of the ground vibration that caused the damage (J) • Also as particle velocity

JNSTR.UMDITATION · 11
could be recorded directly or converted to either displacement or acceleration by a single integration or differentiation, particle velocit}'. was selected as the quantity to measure in the ground.
The measurement of air-blast waves by the Bureau of Mines was initially done with microphone-type devices (5, 11) • During World War II, these studies were taken over by the armed forces, and their results showed that dynamic pressure was the best quantity to measure in the air and to correlate with damage to struc:tures (9).
Using these guidelines, instrumentation was developed for use with a mobile laboratory housed in a 2Y2·ton van-body truck. To provide sufficient instrumentation for the study of progagation of seismic waves and their loss of amplitude with distance, a !$6-channel direct-writing osdllograph, 24 linear-integrating amplifiers, and 12 carrier-type amplifiers, along with velocity gages and accelerometers, were provided. The carrier-type amplifiers were replaced later with linear-integrating amplifiers. Power to operate the equipment was provided by a gasoline-driven AC power plant housed in a trailer.
Six pressure gages with mounting mechanisms, tripods, and preamplifiers were provided for the measurement of air waves resulting from the blasts. The pressure gages were calibrated at the Naval Ordnance Laboratory, White Oak, Md. An auxiliary 12-channel direct-writing oscillograph was used to augment the recording capa· bility and to allow portable operation when used in conjunction with a small auxiliary power plant. Two-conductor shielded cables on reels were provided with waterproof connectors to connect the gages to the amplifiers through an input panel located in the side of the van-body.
The 36-channel direct-writing oscillograf>h contained fluid damped galvanometers that directed light beams on a 12-inch wide light sensitive recording paper which was driven at the rate of 17Y2 inches per second. Ten-millisecond timing lines were produced on the paper by a light beam passing through a slotted rotating cylinder. Because the accuracy of these timing lines was dependent upon the frequency of the portable power plant, a secondary means of time control was maintained by recording the output of a 100-cps tuning fork controlled oscillator. This provided a timing accuracy of about I percenL The Huid damped galvanometers had a resonant frequency of S,500 cps and maintained a fiat
frequency response (within± 5 percent) from 0 to 2,100 cps.
The linear-integrating amplifiers were selected for ruggedness and simplicity of operation. Velocity output from the gages could be recorded directly or integrated to furnish displacement data. Acceleration could be recorded directly or integrated to provide velocity data. The frequency response of the amplifiers was flat (within ± 5 percent) from 5 to 5,000 cps as shown in figure 2.6. Step attenuators on each amplifier provided control of the output signal level. Calibration of the amplifiers for each recorded blast was performed by using a variable frequency oscillator and a microvolter to provide a known input signal which was then recorded by the system witht the controls set for the blast recording.
The velocity gages were adjustable to operate in either vertical or horizontal positions. The resonant frequency of the gages was 4.75 cps. and they were damped at 65 per cent aitical. The frequency response of the gages is shown in figure 2.7. The gages were periodically calibrnted on a shaking table to maintain them within 2 percent of the manufacturer's specifications. Defective gages were returned to the manufacturer for repair. .
The problem of coupling the gages to the soil for making measurements at or near the soil , surface was studied. Several <Ufferent coupling methods were compared (6). The following criteria were established for a satisfactory gage mount:
1. There should be no evidence of "ringing .. or resonance in the output of a velocity gage from the vibration produced by a sharp hammer blow to the surface of the soil at a distance of 10 feet.
2. The velocity record shoUJd resemble the velocity wavelet shapes that are predicted by Ricker's theory (JU).
S. Good reproducibility should be obtained from repeated hammer blow tests.
4. Good reproducibility should be obtained from repeated mounting of the gage. Four types of gage mounts were tested:
I. A single gage was attached to a steel plate welded to a steel pin which could be driven into the bottom or the sides of a square hole in the soil. One mount was required fCX' each component of the vibration.
2. Three gages were attached to the sides of a cube of metal welded to a steel pin driven into the soiL

12 BLASTING VIBRATIONS AND THEIR EFFECTS ON STR.UCTURES
1.0
.8 .. ~ ui .6 !:; 0 > I-:::> fl. I-:::> 0
10 100 1,000 10,000 100.000 FREQUENCY, cps
Figure 2.6.-Frequency respome curve of linear amplifier.
3. Three gages at right angles were attached to an angle bracket welded to a steel pin driven into the soil.
4. Three gages were attached to the inside of an aluminum box at right angles to one another. The box was buried in the soil. The box mount was designed to approximately match the soil density. .
A designed test randomized the variables that could not be controlled. The test results showed that the mounts carrying three gages on a cube or an angle bracket resonated or "rang" with each hammer blow. The single gage mounts and the box mounts produced identical wave forms that satisfied the four gage criteria for a satisfactory gage mount. However, because it is not possible to drive pins firmly into all types of soil, the box mount was selected for use in the research program.
The gage system used by the Bureau !ind other investigators consists of three mutually perpen· dicular gages representing two horizontal and one vertical component which are commonly referred to as radial, vertical, and transverse. Radial signifies a horizontal gage, oriented radial to the source if the source is projected vertically to the horizontal plane of the gage.
> e ,: 80 !.: :!: t: 60 ~ w en
401 10 100 1.000 10.000 FREQUENCY, cps
~
Figure 2.7.-Frequency response cune of Telocity gage.
2.7-REFERENCES
l, ~avall, Wilbur I. Design Criteria for Portable Sdsmop-aphs. BuMines Rept. of Inv. 5708, 1961, 6 pp.
2. --. Design Requirements for Imtrumentadon To Record Vibrations Produml by Blasting. BuMines Rept. of Inv. &187, 1964, 7 pp.
5. Duvall, Wilbur I .. and David E. Fogelson. Review of Criteria for Estimatinl Damage to Residenc:a From Bludng VibratlonL uMines R.cpt. of Inv. 5968, 1962, 19 pp. .
4. Fogelson, David E .. and Charles F. Johnson. Calibra· tion Studies of Three Portable Seismographs. BuMines Rept. of Inv. 6009, 1962, 21 pp.
5. Ireland, A. T. Design of Alr·Blast Meter and CaJi.. brating Equipment. BuMines Tech. Paper 655. 1942, 20 pp.
6. Johnson, Charles F. Coupling Small Vibration Gages to Soil, Earthquake Notes, v. !5, September 1962. pp. 40-47.
7. Langefon, U .. and B. l.ihlstriSm. R.ock Blasting. John Wiley and Sons, Inc., New York, 1963, pp. 262-2&1.
8. Meyer, Alfred V. C., and Wilbur I. Duvall. Calibra· uon Study of a Peak.Reading Acoelerograpb. BuMines llept. of Inv. 6026, 1962, 6 pp.
9. Perkins, Beauregard, Jr. Forecasting the Focus of Air Blasu Due to Meteorol~cal Conditions in the Lower Atmosphere. Ballisuc Rese:arch Laboratories Rept. No. 1118, October 1960, 72 pp.
10. Ricker, Norman. The Form and Nature of Seismic Waves and the Structure of Seismograms, Geophysics, vol. 5, No. 4, October 1940, pp. 348-!166.
11. Thoenen, J. R., and S. L Windes. Seismic Effects of Quarry Blasting, BuMines Bull. 442. 1942, 83 pp.
j
'

,
CHAPTER 3.-SAFE VIBRATION LEVELS FOR RESII)ENTIAL STRUCTURES
8.1-INTRODUCTION
One of the primary objectives of this research program was to establish reliable damage criteria for structures subjected to blasting vibrations. Of the literature reviewed, only five papers contained specific data on the amplitude and fre... quency of vibrations associated with damage evaluation of structures (J-4, 7, H-14). The data from these investigations have been compre-
. hensively studied to .provide a set of damage criteria and to establish a safe vibration level for residential structures. The analysis shows that particle velocity is more directly related to structural damage than· displacement or acceleration. The effect of air blast waves and their effects on structures does not generally create a damage problem in normal blasting operations. The magnitudes of safe and damaging overpressures for structures are discussed and methods of reducing overpressures are considered in tJiis chapter. This chapter also discusses the human response to blasting operations, its psychological aspects, and its relation to vibration levels.
8.2-STATISTICAL STUDY OF PUBLISHED DATA ON GROUND VIBRATIONS AND
DAMAGE A statistical study has been made of the data
presented by Thoenen and Windes (H) , Langefors, Kihlstrom and Westerberg (7), and Ed· wards and Northwood (4). These three papers provide sufficient amplitude and frequency data from blasting vibrations and an assessment of damage to structures for detailed analysis. In addition, the instrumentation in these three investigations was adequate to record the ampli· tudes and frequencies observed. Test conditions. while not ideal, were adequate, and the procedures used were good.
8.2.1-Investigations by the Bureau of Mines
From 1980 to 1942, the Bureau of Mines con· ducted an extensive research program to study the seismic effects of quarry blasting. The first 5 years were spent in developing instrumentation and techniques needed for field measurements. Field tests were conducted from 1985 to 1940.
Assembly and analysis of data was completed, and a summary bulletin published in 1942 (H).
Vibration amplitudes were measured with variable capacitance displacement seismometers. Horizontal and vertical seismometers were used so that motion in three orthogonal directions could be measured at each station. The outputs of up to 12 seismometers were recorded simultaneously on a 12-channel oscillograpb.
Vibration amplitudes were recorded from many quarry blasts, A major difficulty was encountered in locating buildings suitable in all respects for determining blast-induted damage. Structures available for damage tests generally fell into two categories: 1. those in such a state of disrepair as to be useless for testing, 2. those adjacent to other buildings which precluded testing. These same conditions prevailed in the Bureau's current test series.
On Bureau-operated property, one house was available for testing. Blasts were set off in a mine adit some 75 feet beneath the structure with instrumentation near and in the structure. Successively larger shots (from 10 to 195 pounds) were fired until damage (cracking o~ plaster) was observed. A review of previous recordings made in houses during quarry blasting which resulted in no damage indicated that displacements at damage were 5 to 20 times those experienced in normal blasting operations with explosive charges ranging from I to 17,-000 pounds.
Because these tests indicated that damage occurred at greater displacements than those occurring from ordinary quarry blasts, a renewed
"attempt was made to obtain structures to be blast-loaded to damage. Again, no suitable structures were located. Therefore, damage was induced by mechanical means. The mechanical vibrator was of the unbalanced rotor type driven by an electric motor. Both force and frequency were adjustable with upper limits of 1,000 pounds and 40 cps. respectively. A total of 1-i structures near quarries were tested to determine building response, damage indices, and comparative e.ffect of quarry blasting. Construction was frame, brick, or stone, and the height ranged from one to three stories. Recordings of vibrations were made from vibrating the building as a
15
14 BLASTING VIBRATIONS AND TIU:1R. EFFECfS ON STRUcrt.JRES
whole, vibrating individual wall or floor panels,. and from quarry shots. As the buildings or building members were taken to damage, examinations for damage were made as well as recordings of vibrations in and near the buildings. Apart from the data included in the present analysis, two very interesting features were pointed out by the results. First, for ordinary residential structures, the vibration level necessary to produce damage is much greater than that resulting from most quarry blasts. Second, vibrating structures at resonance, in the amplitude and frequency range of Thoenen and Windes' tests, is no more destructive than at any other frequency.
In six of the 14 buildings tested, 160 mechanical :vibrator tests were made about the damage point as defined by the failure of plaster. Amplitudes ranged from 1 to 500 mils and frequencies from 4 to 40 cps. To relate vibration amplitudes and frequencies to damage, three · classifications of damage were proposed based upon the degree of failure of plaster. These in-
. dices of damage were: I. Major damage (fall of plaster, serious
cracking) 2. Minor damage (fine plaster cracks, opening
of old cracks) 3. No damage.
In modern dry wall construction similar evidence would probably be observed in the spaclt.ling at joints and corners. It should be noted that any index of damage is gradational between degrees of s~verity of damage. There is no sharp distinctior. between classifications. It should also be noted that many other factors, including aging, settling, and shrinkage, result in similar failure. The amplitude, frequency, and damage data are shown in figure 3.1. The Bureau report of these data (H) recommended an index of damage based upon acceleration. If accelerations were less than 0.1 g, no damage was expected; from 0.1 to 1.0 g, minor damage; and greater than 1.0 g, major damage. Duvall and Fogelson showed statistically (2) that these data gave contradictory results, because major damage correlated with particle velocity, while minor damage correlated with acceleration.
S.2.2-Investigations by Langefors, Kihlstr5m, and Westerberg
A report (7) by Langefors, Kihlstr6m, and Westerberg, published in 1958, desaibed extensive studies of the relationship between damage and ground vibrations from nearby blasting. The data were obtained during a reconstruction proj-
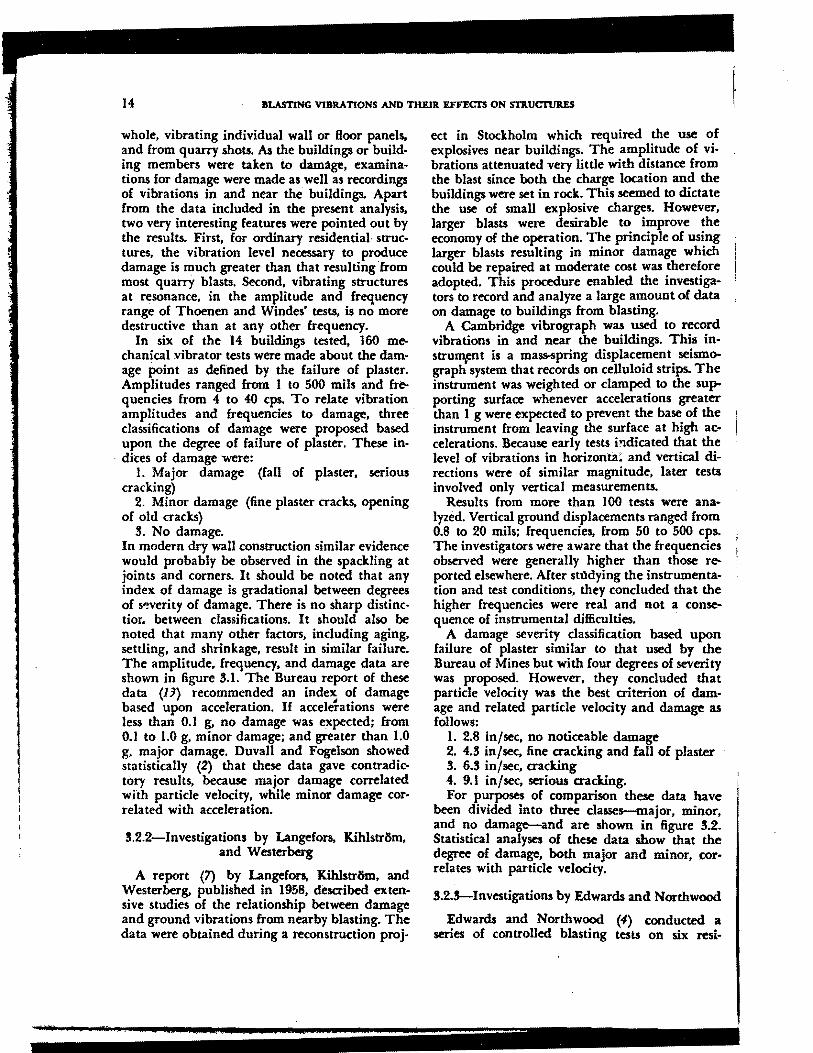
ect in Stockholm which required the use of explosives near buildings. The amplitude of vibrations attenuated very little with distance from the blast since both the charge location and the buildings were set in rock. This seemed to dictate the use of small explosive charges. However, larger blasts were desirable to improve the economy of the operation. The principle of using larger blasts resulting in minor damage which could be repaired at moderate cost was therefore adopted. This procedure enabled the investigators to record and analyze a large amount of data on damage to buildings from blasting.
A Cambridge vibrograph was used to record vibrations in and near the buildings. This inStrUIDFnt is a mass-spring displacement seismograph system that records on celluloid strips. The instrument was weighted or clamped to the supporting surface whenever accelerations greater than 1 g were expected to prevent the base of the instrument from leaving the surface at high accelerations. Because early tests indicated that the level of vibrations in horizonfa: and vertical directions were of similar magnitude, later tests involved only vertical measurements.
Results from more than I 00 tests were ana· lyzed. Vertical ground displacements ranged from 0.8 to 20 mils; frequencies, from 50 to 500 cps. The investigators were aware that the frequencies observed were generally higher than those re-ported elsewhere. After studying the instrumentation and test conditions, they concluded that the higher frequencies were real and not a consequence of instrumental difficulties.
A damage severity classification based upon failure of plaster similar to that used by the Bureau of Mines but with four degrees of severity was proposed. However, they concluded that particle velocity was the best criterion of damage and related particle velocity and damage as follows:
I. 2.8 in/sec, no noticeable damage 2. 4.3 in/sec, fine cracking and fall of plaster 3. 6.S in/sec, cracking 4. 9.1 in/sec, serious cracking. For purposes of comparison these data have
been divided into three classes-major, minor, and no damage-and are shown in figure S.2. Statistical analyses of these data show that the degree of damage, both major and minor, correlates with particle velocity.
S.2.S-Investigations by Edwards and Northwood
Edwards and Northwood {4) conducted a series of controlled blasting tests on six resi-

.1
en Q) .c (,J
.5 ,...: z LU :E LU (J
:5 Q.. en c
.01
.001
0
0
0
0
1
• 0
0 0
0
0
0
" 0
0
10
±Standard deviation A Major damage • Minor damage o No damage
15
y Major damage 'slope=-122
' ' ., ' '
\ Minor damage slope=-2.00
'< \ • \
100 FREQUENCY, c.p.s.
Figure 5.1.-Displacement umu frequency for observed damage, Bureau of Kina.
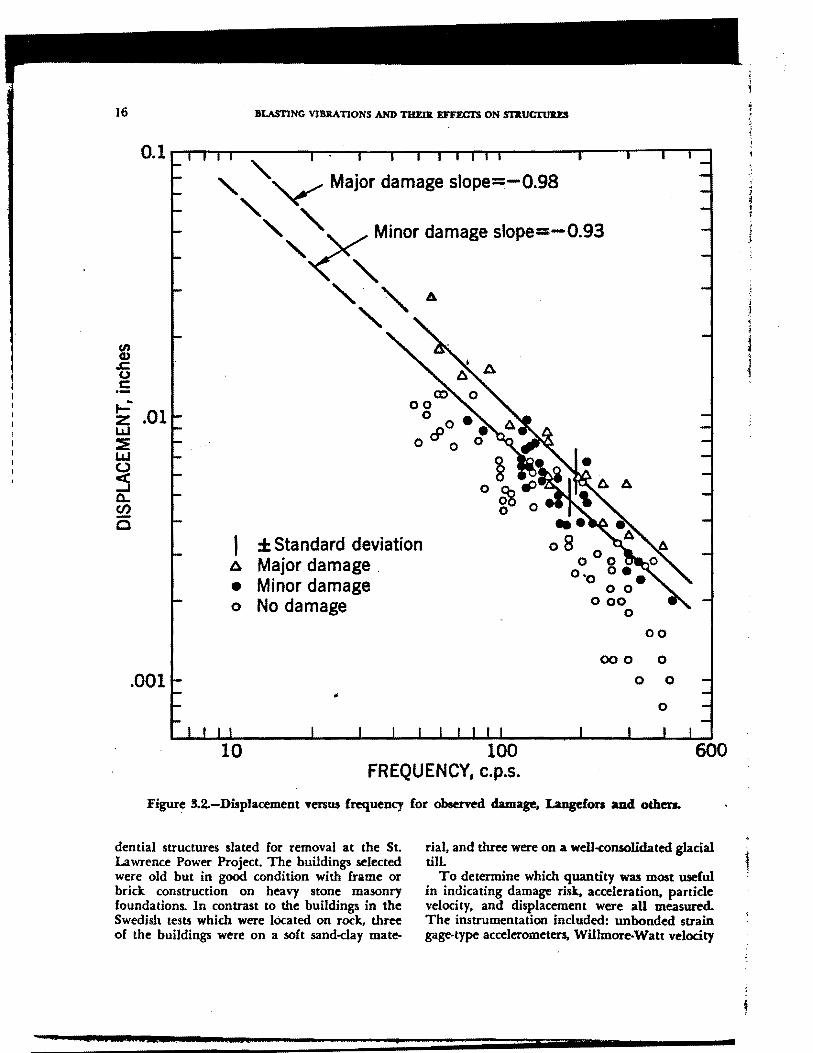
16 BLASTING VlBllATIONS AND THEm EFFECTS ON S11lUCTUJt.F.3
0.1.-.---........-~~--~--~-----..._..,...-.-........... ~~~..-~,..---r--r-..
' "v Major damage slope=-0.98
' ',X Minor damage slope=-0.93
"~'A 81
.s::. (.)
.5
...= z .01 L&J ::E L&J (.)
:5 0.. en 25
CD 00
0 • &o •
0 0 0
A
±Standard deviation A Major damage . • Minor damage 0 No damage
00
000 0
.001 0 0
"' 0
10 100 600 FREQUENCY, c.p.s.
Figure 5.2..-Displacement venus frequency for observed damage, Langefors and others.
dential structures slated for removal at the St. Lawrence Power Project. The buildings selected were old but in good condition with frame or brick construction on heavy stone masonry foundations. In contrast to the buildings in the Swedish tests which were located on rock, three of the buildings were on a soft sand-clay mate-
rial, and three were on a well-consolidated gladal till.
To determine which quantity was most useful in indicating damage risk. acceleration, particle velocity, and displacement were all measured. The instrumentation included: unbonded strain gage-type accelerometers, Willmore-Watt velodty
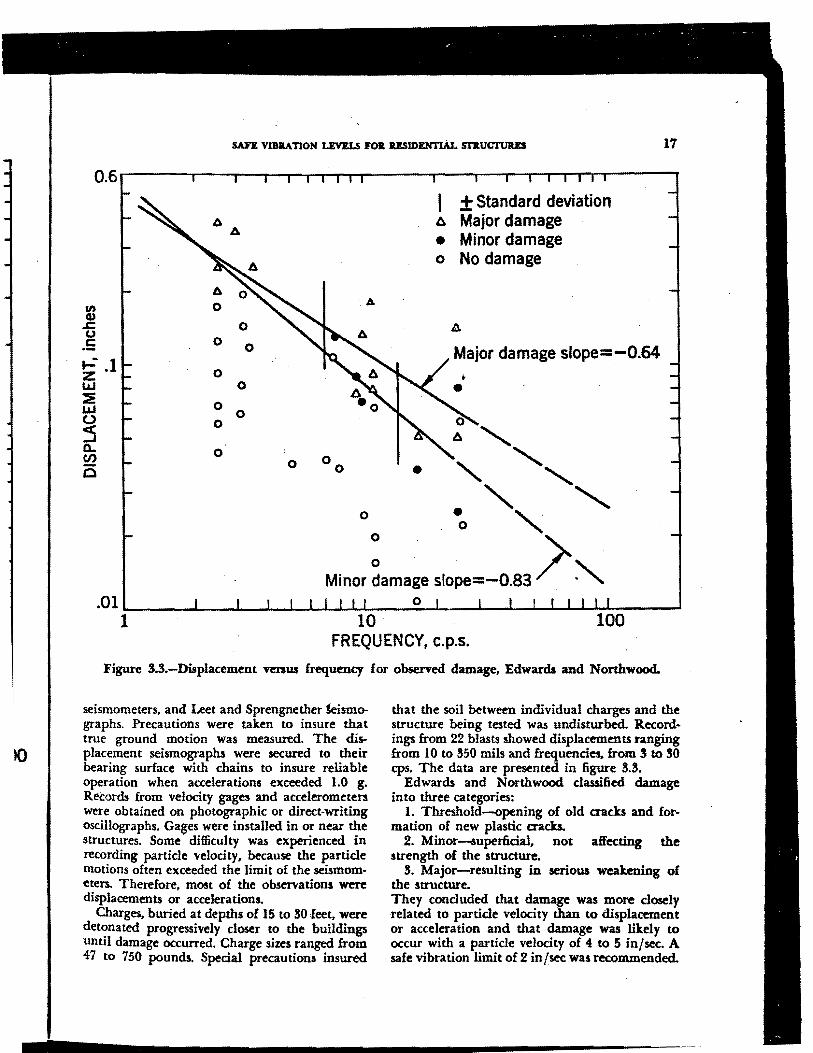
IQ
SAFE VIBRATION LEVELS FO.. RESIDENTIAL Sl'llUCTUllES 17
b. .,, 0 Q.) .c: 0 u
0 .5 0
,_: .1 z 0 UJ 0 ::iE 0 UJ 0 (.) 0 s 0.. 0 en Ci 0 •
0
+ Standard deviation -1::i. Major damage • Minor damage o No damage
b.
Major damage slope=-0.64
" " " " ', •o "
0 . > Minor ~amage slope=-0.83 ~
10 FREQUENCY, c.p.s.
100
Figure 3.3.-Displacement versus frequency for observed damage, Edwards and Northwood.
seismometers, and Leet and Sprengnether kismographs. Precautions were taken to insure that true ground motion was measured. The displacement seismographs were secured to their bearing surface with chains to insure reliable operation when accelerations exceeded 1.0 g. Records from velocity gages and accelerometers were obtained on photographic or direct-writing oscillographs. Gages were installed in or near the structures. Some difficulty was experienced in recording particle velocity, because the particle motions often exceeded the limit of the seismometers. Therefore, most of the observations were displacements or accelerations.
Charges, buried at depths of 15 to !SO Jeet, were detonated progressively closer to the buildings until damage occurred. Charge sizes ranged from 47 to 750 pounds. Special precautions insured
that the soil between individual charges and the structure being tested was undisturbed. Recordings from 22 blasts showed displacements ranging from 10 to 350 mils and frequencies. from 5 to 30 cps. The data are presented in figure 3.3.
Edwards and Northwood classified damage into three categories:
1. Threshold-opening of old aacb and formation of new plastic cracks.
2. Minor-superficial, not affecting the strength of the structure.
3. Major-resulting in serious weakening of the structure. They concluded that damage was more closely related to particle velocity than to displacement or acceleration and that damage was likely to occur with a particle velocity of 4 to 5 in/sec. A safe vibration limit of 2 in/sec was recommended.
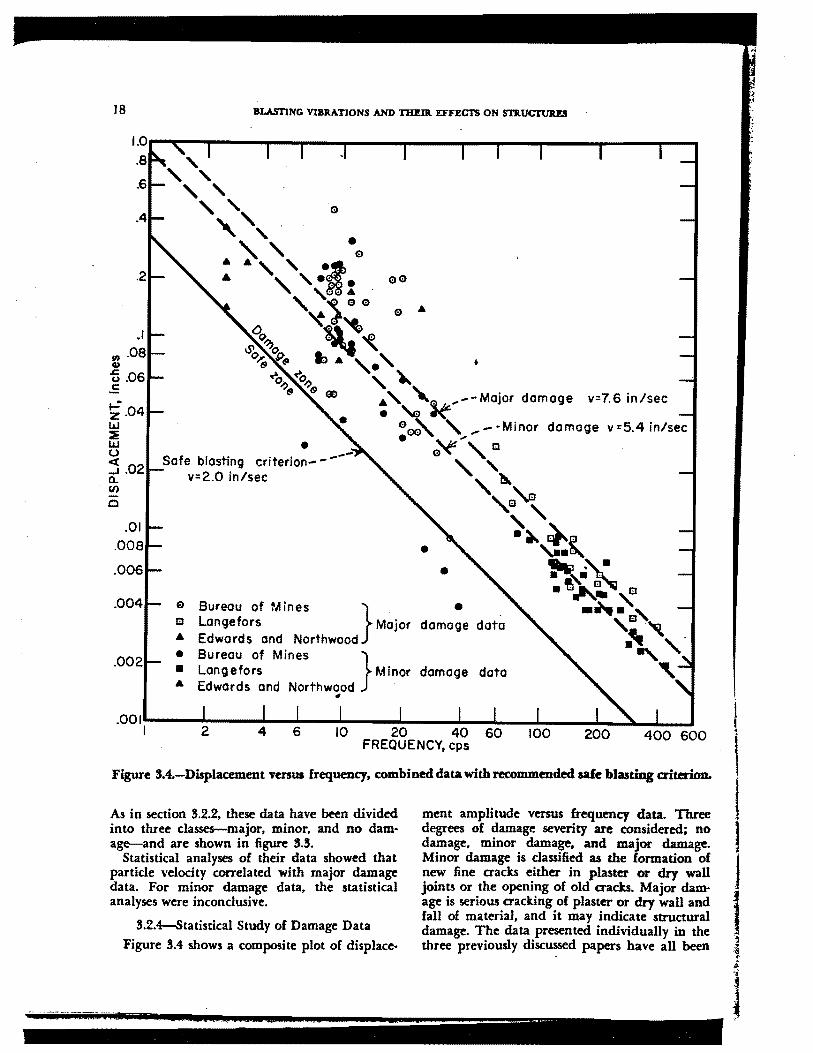
18 BLASTING VIBRATIONS AND Til1tDl EFFECI'S ON STJl.UCI'URD
.a
.6
.4
.2
.I en .08 G>
'fi .06 .E ...= z.04 w :E w 0 <[ ..J.02 Q.. (/)
Cl
.01 .008
. 006
. 004
.002
• Safe blasting criterion- - ---
v=2.0 in/sec
e Bureau of Min es } a Langefors Major • Edwards and Northwood • Bureau of Mines } • Langefors Minor • Edwards and Northwood
•
• • •
damage data
damage data
.001:----~=----~---=---~----~----~--~--..L...----""""-~.._.L-...J I 2 4 6 10 20 40 60 100 200
FREQUENCY, cps 400 600
Figure 8.4.-Displacement venua frequency, combined data with recommended safe blasting aiterion.
As in section S.2.2. these data have been divided into three dasses--major, minor, and no damage-and are shown in figure ~U.
Statistical analyses of their data showed that particle velocity correlated with major damage data. For minor damage data, the statistical analyses were inconclusive.
S.2.4-Statistical Study of Damage Data
Figure S.4 shows a composite plot of displace-
ment amplitude versus frequency data. Three degrees of damag~ severity are considered; no damage, minor damage, and major damage. Minor damage is classi6ed as the formation of new fine cracks either in plaster or dry wall joints or the opening of old aads. Major dam· age is serious cracking of plaster or dry wall and fall of material, and it may indicate structural damage. The data presented individually in the three previously discussed papers have all been
1
I J
1 ·~
i •· ;. 'i
j

SAFE VIBRATION LEVELS F01l JlE.Sm.ENTIAL SI'll.UCTURES 19
converted to displacement and plotted versus frequency. .
Statistical tests on the individual sets of data related to major damage indicate that a slope of - I on a displacement-frequency plot on log-log coordinates must be accepted. A slope of - I' corresponds to a constant particle velocity. Using standard statistical analysis techniques. these data can be pooled, and a single regression line used to represent all the major damage data. Moreover, it can be s.'iown that the slope of the regression line must be -1, rather than 0, or -2. This result indicates that the regression line, representing all major damage data considered, corresponds to a constant particle velocity rather than constant displacement or acceleration, respectively. The magnitude of this particle velocity is 7.6 in/sec and is shown as a dashed line in figure 3.4.
Statistical tests of the individual sets of minor damage data are inconclusive. Only the data of Langefors show that a slope of -1, indicating· a constant particle velocity, is acceptable while rejecting hypothetical slopes of 0 and - 2 representing constant displacement or acceleration. However, statistical tests show that the thr~ sets of data can be pooled and represented by a single regression line. Statistical tests of the pooled minor damage data indicate that a slope of -1, representing a constant particle velocity, cannot be rejected and that slopes of 0 and -2 can be rejected. Thus, the pooled minor damage data correspond to a constant particle velocity with a value of 5.4 in/sec as shown in figure 3.4.
Analysis of the pooled major and minor dam· age data show that both sets of data are statistically correlated with constant particle velocity. It is significant that these data were obtained by different investigators using different instrumentation, procedures, and sources and a wide va· riety of house structures on different types of foundation material. Therefore, a damage criterion based on particle velocity should be applicable to a wide variety of physical conditions.
Other investigators have proposed damage criteria and defined three or more zones of dam· age. Because the data did not have homogeneous variance when pooled, the outer limits of the damage zones could not be determined statisti· cally. Therefore, Duvall and Fogelson (2) recommended a safe zone and a damage zone. A particle velocity of 2 in/sec was proposed as a reasonable separation between the safe and damage zones.
8.3-DATA FROM OTHER INVESTIGATORS
In 1949 Crandell (J) reported results from a study of damage to structures. Insufficient data were published to permit inclusion of these results in the analysis of section 8.2.4. Vibrations from blasting, pile driving, and industrial machinery were recorded on accelerographs. Crandell introduced a quantity which he called Energy Ratio, or E. R., which is defined as:
a2 E.R. =p E. R. = 16'r'Pu2 (S.l) E. R. = 4,,2v•
where a = peak acceleration, ft/sec2, u = peak displacement, ft, v = peak velocity. ft/sec,
and f = frequency associated with peak am-plitude, cps. t
The first two terms he derived from a consideration of kinetic energy, and the relationship between a, u, and v if simple harmonic motions are assumed (see equation 2.8, where 11t is equal to 211'£) . Although not used by Crandell, the third equation of !U is presented to iUustrate that Energy Ratio is proportional to particle velocity squared. He concluded that a value of E. R. equal to 8.0 was the threshold limit of damage to structures, below S.O was a safe zone, between 3.0 and 6.0 was .a caution zone, and an E. R. of 6.0 or greater was defined as the danger zone. An E. R. of 3.0 is equivalent to a particle velocity of 3.3 in/sec, and 6.0 is equivalent to 4.7 in/sec. These zones are in good agreement with Bureau results.
In 1962 Dvorak (J) published results from studies of damage caused by the seismic effects of blasting. Explosive charges ranging from 2 to 40 pounds were detonated at distances of 16 to 100 feet from the buildings. The ground was a semihardened clay containing lenses of sand, usually water-bearing. The buildings were one to two stories of ordinary brick construction.
The shots were instrumented with mechanicaloptical displacement seismographs of three types: Cambridge, Somet, and Geiger. These were placed in or near the structures. The natural frequencies of these instruments were within the range of the observed frequencies. The Cambridge system with natural frequencies of 8.5 cps for the horizontal and 5.5 cps for the vertical direction presented the most serious problem. The observed frequencies of the seismic data were in the range of 1.5 to 15 cps. An additional

20 BLASTING VDllATIONS AND THEIR EFFECTS ON STllt1CTURES
source of trouble, not discussed by Dvorak, may have been the tendency of these instruments to leave their supporting surface at accelerations of 1.0 g or more. Edwards and Northwood (1) and Langefors and othen (7) recognized this problem and weighted or clamped their instruments.
Displacements of 6 to 260 mils were measured at frequencies ranging from 1.5 to 15 cps. The four degrees of severity of damage, considered and correlated with plaster or structural damage, were
1. No damage, 2. Threshold-minor plaster cracking, 5. Minor-loosening and falling of plaster,
minor cracking in masonry, and 4. Major-serious structural cracking and
weakening. Dvorak correlated damage with particle veloc
ity; threshold damage occurring at particle velocities between 0.4 to 1.2 in/sec, minor damage from 1.2 to 2.4 in/sec, and major damage above 2.4 in/sec. He stated that these limits are conservative compared to other investigators.
The observed frequency range is lower than would be expected from the charge sizes and distances involved. This may have been a result of the instrumentation problem previously pointed out. Consequently, because of the instrumentation problem and the low frequencies reported, the results have not been included by pooling with other data.
In 1967 Wall (14) reported on seismic-induced damage to masonry structures at Mercury, Nev. Two of the objectives of the study were to determine the validity of particle velocity as a damage criterion and the level of velocity at damage. The buildings were generaJJy of con· crete block construction and Jess than 5 years old. The buildings were inspected f6r cracking before and after nuclear detonations at the Nevada Test Site. Charge sizes are not listed but must be assumed to be greater than normally encountered in other blasting operations. The detonations were at distances ranging from 100,-000 to 290,000 feet from the buildings.
The instrumentation consisted o( three-com· ponent moving coil seismometers, responsive to particle velocity, and accessory recording equipment (not desaibed) . The seismometers were placed on the ground near the buildings. The particle velocity used was the vector sum of the . three components.
The buildings were experiencing cracks due to natural reasons (use, settling, shrinkage, temper· ature cycling, etc.). Therefore, the damage study
74 - jji' ' .
consisted of examining cracb, establishing natu· ral cracking rates. and correlating any increase in rates after a nuclear detonation with observed particle velocities. The peak particle velocities at selected sites within the complex of 45 buildings under study were within a factor of 2. No frequencies were reported. The particle velocities observed when the rate of cracking was above normal were in the range of 0.04 to 0.12 in/sec. Wall noted that the cracks at these low levels were no more severe than those occurring naturally and may represent an acceleration of normal cracking. He concluded that .. it appears that this cracking would have occurred naturally in a matter of time."
The size of explosion, distance, and assessment of damage (increase in rate of cracking) may place these results in a domain different from the usual blasting operations. The results may be valid but only applicable to very large blasts.
5.4-ADDITIONAL BUREAU OF MINES DATA
In October I 969, the Bureau participated in a test program, sponsored by the American Society of Civil Engineen (ASCE), to study the response of a residential structure to blast loading. Previously described instrumentation (see section 2.6) was used to record ground and house vibrations from a series of 10 explosive blasts detonated in glacial till. Shot-to-house distances ranged from 200 to 55 feet. Charge weights ranged from l to 85 pounds. Particle velocities in the ground varied from 0.091 to I 1.6 in/sec. Particle velocities in and on the house at ground or floor level agreed generally with those measured in the ground outside the house. Measurements at the roof level of the house show an amplification of up to a fact~ of 2.0 compared to ground response. Frequencies ranged from 5 to 40 cps and were higher in the vertical component than in the radial and transverse component.
The structure investigated was more substantial than most present-day residences due to a massive field-stone foundation and to I-inch planking on the studs under the dry wan in some rooms. Through the eighth blast in the series there had been no observable damage. Maximum particle velocities recorded at the house in the ground through test 8 were: radial, 5.56 in/sec; vertical, 6.86 in/sec; and transverse. 1.71 in/SttThe vibrations from test 9 opened new cracb in the walls and ceiling of an upstain room. Maxi· mum particle velocities in the ground at the edge
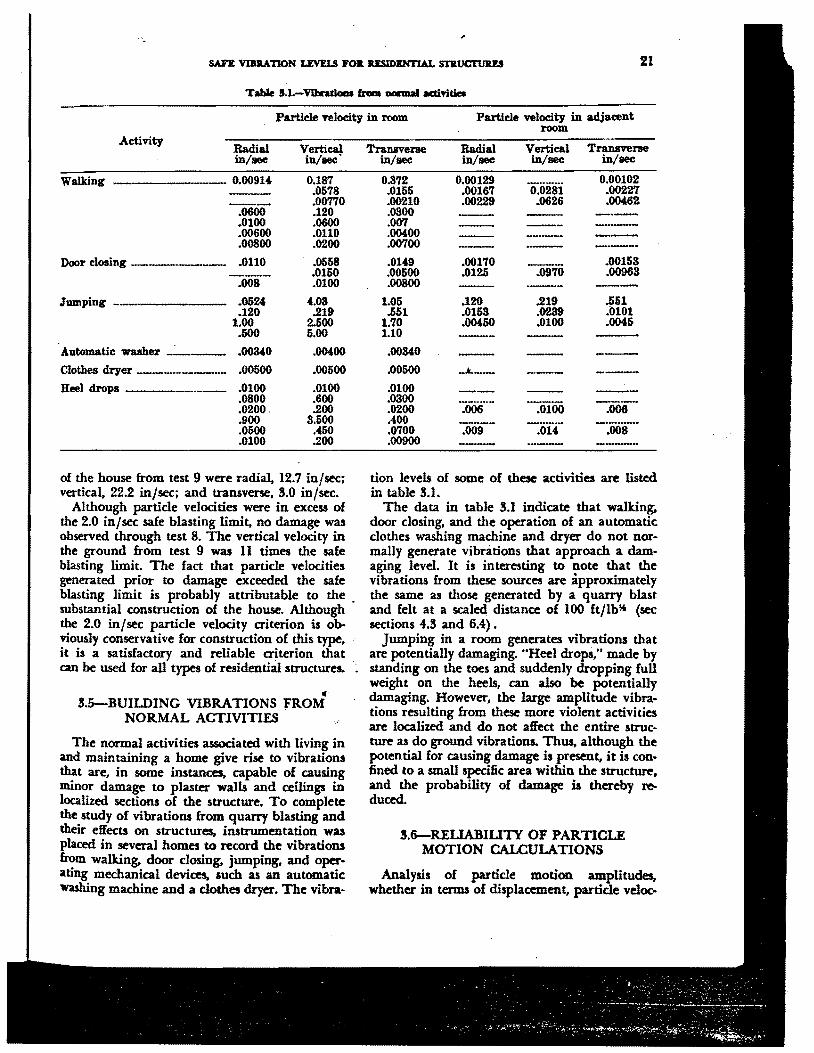
.
SAFE VIB1lATION LEVEU FOa RESIDENTIAL S111.UCTUllltS 21
Table 5.1.-Vlbndom fram -.al acti'ritia
Particle velocity in room Particle velocity in adjacent
Activity Radial Vertica! in/sec in/aee
Walking ---- 0.0091(. 0.187 .0578
--- .00770 .0600 .120 .0100 .0600 .00600 .0110 .00800 .0200
Door closing .0110 .0558 .0150
.008 .0100
Jumping - .052' 4.03 • 120 .219
1.00 2.500 .500 5.00
Aut.omatic wuher _. ___ .00340 .00400
Clothes dryer .00500 .00500
Heel dropa .0100 .0100 .0800 .600 .0200. .200 .900 3.500 .0500 .450 .0100 .200
of the house from test 9 were radial, 12.7 in/sec; vertical, 22.2 in/sec; and transverse, 5.0 in/sec.
Although particle velocities were in excess of the 2.0 in/sec safe blasting limit. no damage was observed through test 8. The vertical velocity in the ground from test 9 was 11 times the safe blasting limit. The fact that particle velocities generated prior to damage exceeded the safe blasting limit is probably attributable to the . substantial construction of the house. Although the 2.0 in/sec particle velocity criterion is obviously conservative for construction of this type, it is a satisfactory and reliable criterion that can be used for all types of residential structures. ·
,,. 5.5---BUILDING VIBRATIONS FROM
NORMAL ACTIVITIES
The normal activities associated with living in and maintaining a home give rise to vibrations that are, in some instances, capable of causing minor damage to plaster walls and ceilings in localized sections of the structure. To complete the study of vibrations from quarry blasting and their effects on structures, instrumentation was placed in several homes to record the vibrations from walking. door closing. jumping, and oper· ating mechanical devices, such as an automatic washing machine and a clothes dryer. The vibra·
room
Transverse Radial Vertical Transverse in/sec in/sec in/sec in/sec
0.372 0.00129 0.00102 .0155 .00167 0.0281 .00227 .00210 .00229 .0626 .00462 .0300 -·--.007 ---.00400 ---.00700 --· .01'9 .00170 .00153 .00500 .0125 .0970 .00963 .00800
1.05 .120 .219 .551 .551 .0158 .0289 . .0101
1.70 .00450 .0100 .0045 1.10
.00340
.00500 _..t._ __ --
.0100
.0300 -:006-.0200 .006 .0100
.400 -:oos-.0700 .009 .OH
.00900 ----tion levels of some of these activities are listed in table 5. I.
The data in table S.1 indicate that walking, door closing, and the operation of an automatic clothes washing machine and dryer do not normally generate vibrations that approach a damaging level. It is interesting to note that the vibrations from these sources are approximately the same as those generated by a quarry blast and felt at a scaled distance of 100 ft/lb~ (sec sections 4.3 and 6.4) .
Jumping in a room generates vibrations that are potentially damaging. "Heel drops," made by standing on the toes and suddenly dropping full weight on the heels, can also be potentially damaging. However, the large amplitude vibrations resulting from these more violent activities are localized and do not affect the entire structure as do ground vibrations. Thus, although the potential for causing damage is present, it is confined to a small specific area within the structure, and the probability of damage is thereby reduced.
3.6-REUABIUTY OF PARTICLE MOTION CALCULATIONS
Analysis of particle motion amplitudes, whether in terms of displacement, particle veloc-
22 BLAmNG VIBR.ATIONS AND THEIR EFFl:CI'S ON STkUC'IlJltES
ity, or acceleration, often leads inyestigators to calculate one or more of these quantities from the others. The mathematical relationships are
where
u = /vdt or v = du/dt (8.2) v = fadt or a= dv/dt (!U)
u = displacement, v = particle velocity, a = acceleration, and t =time.
The integration or differentiation can be done either electronically or mathematically. Neither of these techniques could be applied to the published data, because the original records were not available.
An alternative procedure permits calculation of the other quantities from a given recorded quantity using the relationships of equation 2.8:
u = v /21Tf or v = 2.,..fu (8.4) v = a/2.,..f or a = 2.,..fv (8.5)
where f is the frequency of the seismic trace, where the peak amplitude is observed. Equations 8.4 and 3.5 may be used if the motion is simple harmonic. This is not the case with seismic motion which is generally aperiodic. The authors of the published papers used these relationships either directly or indirectly. Duvall and Fogelson (2) used this treatment directly or indirectly when analyzing the data from the three published papers. The need to establish the reliabil· ity of using equations 8.4 and 8.5 on aperiodic data was pressing, particularly when the data were being used to establish damage criteria.
Particle velocity records obtained during the current test series were used to evaluate the use of equations 8.4 and 8.5. Data from kveral shots of different charge size and distribution were selected for analysis. The data used included radial, vertical, and transverse components and represented a cross section of the data available. The peak amplitude and its associated frequency were read for the selected velocity-time record.a. Equation 8.4 was used to calculate the displacement for these data. The same velocity-time records were digitized, input to a computer, and the velocity amplitude spectra calculated. These spectra were integrated in the frequency. domain to provide displacement amplitude spectra from which displacement-time records were syn· thesized. The peak displacement could then be determined for each recording. This is the same as applying equation 8.2 to the original data to determine dispJacement, except that the integra-
tion is done in the frequency domain. Figure 5.5 shows the plot of displacement integrated from velocity versus displacement computed from velocity and frequency, as the abscissa and ordinate, respectively. The line with slope of 1.0 indicates the locus of points which would result if the displacements calculated by the two methods were identical. The bulk of the points falling below the line indicates that displacements calculated by assuming simple harmonic motion are generally less than displacements from integrated velocities which are mathematically correcL
Because most calculations treating the published.. data were from displacement or acceleration to particle velocity, the next step was to take the synthesized displacement-time records, read the peak amplitude and associated frequency. These values were used to calculate particle velocities assuming simple harmonic motion. The calculated particle velocities were plotted versus recorded particle velocities for the same traces as shown in figure 8.6. Again, the line with a slope of 1.0 shows the relationship of cal· culated and recorded values if they have a 1:1 ratio. Since most of the points fall below the line, calculated values are generally less than recorded velocities.
It should be noted that the calculation of displacements as shown in· figure 5.5 is directly analogous to the calculation of particle velocity data frcm recorded acceleration data. The results, shown in figures 5.5 and 8.6, indicate that particle velocities calculated from either displacement or acceleration data assuming simple harmonic motion will generally be less than particle velocities recorded directly. It is obvious that a damage criterion of particle velocity calculated from displacement and acceleration has a built-in safety factor. If the data of figures 8.5 and 8.6 fell above the lines. a risk factor would have resulted.
5.7-RECOMMENDED SAFE GROUND VIBRATION LEVEU
On the basis of the statistical study of published data and the recommendations of the investigators, Edwards and Northwood, and Langefors and others, particle velocity is more closely associated with damage to structures than either displacement or acceleration. Figure 8.7 shows particle velocity venus frequency on a log· log plot. These have generally been converted to particle velocity from. displacement or accelera·
~ . j .:;
! ]
~
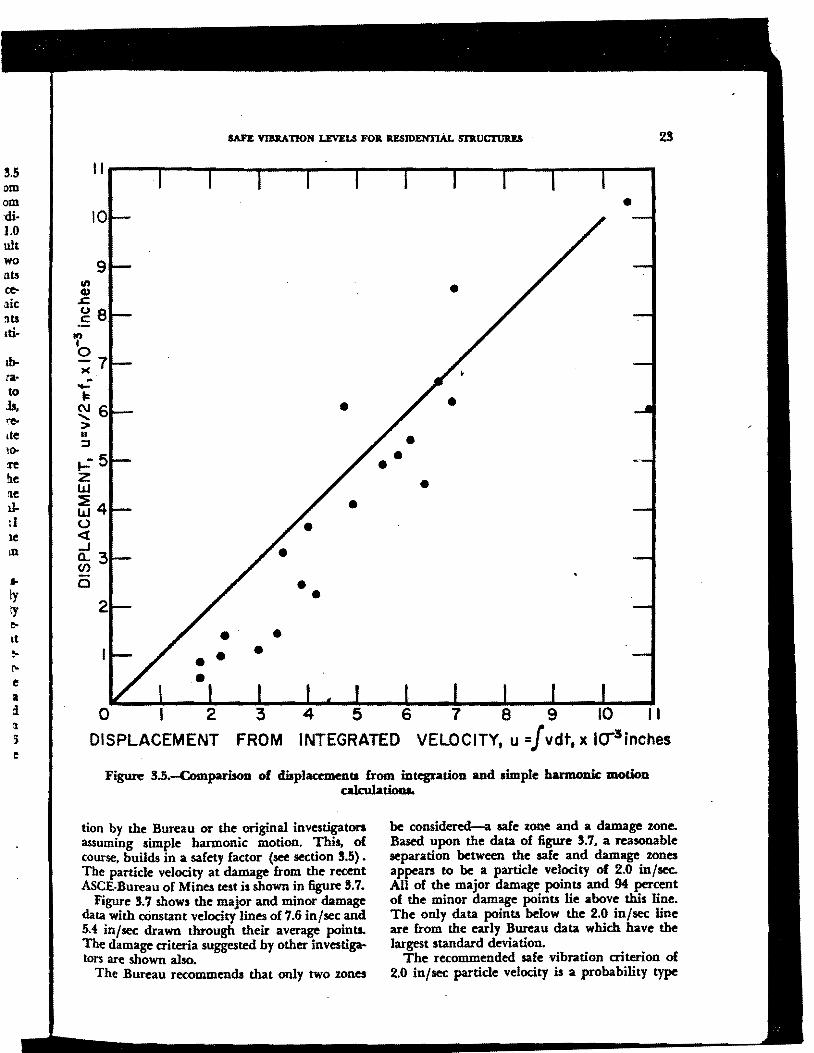
5.5 om om .-di· 1.0 ult WO
nts ceaic !its tti·
tbrato ls, ".'e-1te 10-
:re Ile Ile u. :1 1e Ill
• ly ty ~
tt
t'
e a r1 fl
ii I:
SAR VIBJlATION LEVELS FOR llESIDENTIAL STRUC'l'tllll'.S
II
• 10
9
"' CD • .c. gs
If)
'o -1 )( .. -t:: ~6 • • > II :J • .,: 5 z w • ~4 • (.)
<t ..J a.. 3 CJ)
a • • 2
• • • • • •
0 2 3 FROM
4 5 6 7 8 9 10 · 11
DISPLACEMENT INTEGRATED VELOCITY, u =f vdt, x I0-3 inches
Figure ll.5.-Comparison of d.isplaa:menu from integration and simple harmonic motion calculatiom.
tion by the Bureau or the original investigators assuming simple harmonic motion. This, of course, builds in a safety factor (see section 5.5) • The particle vdocity at damage from the recent ASCE-Bureau of Mines test is shown in figure 5.7.
Figure ll.7 shows the major and minor damage data with c:Onstant velocity Jines of 7.6 in/sec and 5.4 in/sec drawn through their average points. The damage criteria suggested by other investigators are shown also.
The Bureau recommends that only two zones
be considercd--a. safe zone and a damage zone. Based upon the data of figure 5.7, a reasonable separation between the safe and damage zones appears to be a particle velocity of 2.0 in/sec. All of the major damage points and 94 percent of the minor damage points lie above this line. The only data points below the 2.0 in/sec line are from the early Bureau data which have the largest standard deviation.
The recommended safe vibration criterion of 2.0 in/sec particle velocity is a probability type

24 BLASTING VIBlt.ATIONS AND THUR EFFECTS ON STl.UC'l'VllD
1.1...-~,..........,,_. ..... ~---------...---------....,.-....,.-....
• • •
u G in ~.8 . :::s t; .7 N II > >-" .6 • • • t:::: (,)
9 .5 • I.LI > .. I.LI .4 • ...J (,) • • ~ .3 <t a..
.2 • .I
0 0.1 0.2 0.3 0.4 0.5 0.6 0.7 0.8 0.9 1.0 I.I RECORDED PARTICLE VELOCITY, v,in/sec
1.2 1.3 1.4 1.5
Figure 5.6.-Comparison of particle velocities u recorded and from diaplacementa.
criterion. If the observed particle velocity exceeds 2.0 in/sec in any of the three orthogonal com· ponents, there is a reasonable pro"t,ability that damage will occur to residential structures. The safe vibration criterion is not a value below which damage will not occur and above which damage will occur. Many structures can experience vibration levels greatly in excess of 2.0 in/sec with no observable damage. For example, figure S.8 presents velocity data from tests in which damage was not observed. However, the probability of damage to a residential structure increases or decreases as the vibration level increases or decreases from 2.0 in/1«.
Having ascertained a safe vibration criterion, the next logical step is to qualify the conditions under which the best assessment of vibration levels can be made. Obviously, particle velocity should be measured directly with instrumentation which responds to particle velocity and with an adequate frequency response. If displacement
or acceleration are measured, particle velocity should be calculated only by integration or differentiation, either electronically or mathe-matically. Calculations which assume simple bar· monic motion yield particle velocities which are in general too small. The velocity gages should preferably be mounted on or in the ground rather than in the structure, became most of the data used in establishing the damage criterion were obtained in this manner. Mount· ing of gages in the ground alleviates the necessity of considering the responses of a large variety of structures. Particle velocity should be observed in three mutually perpendicular directions: a vertical component, a horizontal component radial to the source projected on a horizontal plane, and a horizontal component transverse to the source. The safe vibration criterion is based upon the measurement of individual components, and if the particle velocity of any com-ponent exceeds 2.0 in/sec, dam.age is likely to

5
' r
SAFE VIIHlATION LEVEU FOR U:SID.ENTL\L ST&UcnJU:S
100..---.....,----...... --...... -------------..... ------------..------------. 80
60
40
e -Major damage
l v=7.6 in/sec 20
e t rMinor damage IP• 1
' v=5.4 in/sec ·~ • 0
I .~e I I e & .,. ... a Ill e i:>"' e ... a ~-----~-~~--~--~~-~--L.I ·~~t.. • e a ;ti• 'ii- • m ___.. ___ ... -·---~ ..::ii!...a-a.--
A . " A e GI • .._, • • - ee ..__
• r • • • • • Damage zone
• • Safe zone
•
-----~ ------·r : I
•
Safe blasting criterion 1 l 1 i Crandell ER=3..0, v=3.3 in/sec-•: I 1 Longefors v=2.8 In/sec--•: 1
Edwards and I I
Northwood v=2.0 in/sec--J 1
UIO Cl> 8 ~ c ·- 6 >!° I-04 9 LIJ > LIJ 2 -I u t:= a:: 1l
I .8
.6 Bureau of Mines v=2.0 in/sec-- 1
.4 Cil Bureau of Mines } Ill Langefors Major damage data A Edwards and Northwood
. 2 • e ..... al Mines I • Langefors Minor damage data A Edwards and Northwood <:> ASCE-BuMlnes Test
.1~,-----2·.-----4----6----10.,__ __ ..... .__ ________________________ __. __ ..... __ _, If 20. 40 60 100 200 400 600 1000 FREQUENCY, cps
Figure S.7.-Particle Telodty Temu frequency with recommended safe blaating aiterion.
occur. Since seismic motion is a vector quantity, individual components must be considered.
3.8-PUBUSHED DATA ON AIR VIBRATIONS AND DAMAGE
Windes (U, 16) reported on the Bureau of Mines• 1940 study in the early l940's of the air blast problem associated with quarry and mine blasting. He concluded that window glass failure occurred before any other type of structure failure due to air blast. Explosive charges were detonated in air to induce sufficient air blast
overpressures to break window panes. Some panes were broken by an overpressure of 1.0 psi. and all panes failed and plaster walls experienced minor damage at overprcssurcs of 2.0 psi or more. Higher overpressurea caused more serious failures,. such as masonry cracks. Plaster cracks were generally found to be caused by flexing of wall panels by building vibrations induced by air blast. The condition of the glass in the windows contributed directly to the damage experience. Poorly mounted panes which have been prestressed by improperly inserted glazier's points or other causes, may fail when subjected to over·

26 BLASTING VIBRATIONS AND THEIR EFFECTS ON ST'.R.VCT'URES
100..-~~----~-..~--~~ ..... ~~--~~--~--~--..... ----...---~...,..~ ..... 80
60
40
20
u 10
~ 8 t:
~ t-
6
u 4 g w > .~ 2 0 j:: a:: -g._
1.0 .a .6
.4
.2
• es e
s e ~ e (i)a El a a G> e,,.1!1 - "' e El a El
r.I?>... e "' ..... "" Ela '8 a El ;;,:sese G>GDe i§I ~% e e e m Q a a 8 a "' e a a l!lEI a 'i!J . . a
Q Q Q e 0 ... 0 eEll:La rm a t:la tfb El
e <&. """' 0 U1 · aEl a a a
.if """ a · a A c:eG'> . El a
A r.\ (;) QG) G)(l) ""
-------------~-----------..---Safe blasting criterion--""""
a Bureau of Mines J a Langefors No damage data A Edwards and Northwood 0 ASCE-BuMines Test
2 4 6 10 20 40 60 100 200 400 600 FREQUENCY, cps
Figure S.8.-Particle 'Velocity 'ftl'IUI frequency for no damage data.
pressures as low as 0.1 psi. Charges of explosives detonated in boreholes at similar explosive-towindow distances as used in the open air blasts did not produce failure of window panes due to air blast overpressure. On the basis of these Bureau studies, Windes concluded that under normal blasting conditions the problem of dam· age from air blast was insignificant.
Research Laboratories (9,, 10) were similar to those of Windes. Glass panes forced in to frames so as to be under constant strain were found to crack when subjected to overpressures o( 0.1 psi. Properly mounted panes were subject to cracking at overpressures of 0.75 psi or greater. Air blast pressures of only O.OS to 0.05 psi could vibrate loose window sash which might be a source of complaints but would not represent damage. The results of an extensive study of the air
blast overpressure problem made by the Ballistic As a routine procedure, Edwards and North-

SAFE VIBRATION LEVELS FOJI. RE.SIDENTIAL STllUCIVRES 27
wood (4) measured air blast prCMure during their vibration studies. The measured overpressures ranged from 0.01 to 0.2 psi at locations out· side the six structures being blast loaded. These pressures were considerably below the levels expected to cause damage. None of the damage that occurred in any of the six structures was at· aibuted to air blast.
Air blast is not considered to be a significant factor in causing damage to residential structures in most blasting operations. However, air blast and the attendant transmission of noise may be a major factor in nuisance type complaints.
S.9-RECOMMENDED SAFE AIR BLAST PRESSURE LEVELl
The recommended safe air blast pressure level of 0.5 psi is based on a· consideration of the results reported. in section S.8. If some panes of glass will fail at overpressures of 0.75 psi and all would be expected to fail at 2.0 psi or more, 0.5 psi provides a reasonable margin of safety. Damage to plaster walls at overpressures greater than 1.0 psi would thereby be precluded. The recommended level would not alleviate the problem of prestressed glass panes failing at 0.1 psi or loose sash vibration. These two conditions would continue to result in complaints. However, most routine blasting operations designed to limit vibrations to Jess than 2.0 in/sec do not generate air blast overpressures that are significant factors in causing damage to residential structures. The air blast pressures from buried explosive charges and from charges properly stemmed in boreholes are an order of magnitude or more below the pressures required for damage. Sadwin and Duvall (12) pointed out that optimum use of explosives to break rock results in less energy available to generate air blast overpressures.
S.10-HUMAN RESPONSE AND ITS EFFECT ,, ON SAFE VIBRATION LEVELl
Legitimate damage claims result when per· sonal or property damage is caused by seismic or air blast waves from blasts. The advances ~n blasting technology during the past 25 years, mcluding blasting procedures, damage criteria, knowledge of seismic wave propagation, moni· toring instrumentation, and a more knowledgeable blasting profession have minimized claims rtsulting from real structural damage. More and more blasting operators instrument their own blasts or subscribe to a consulting service to insure vibration levels below those necessary
to cause damage. The occasion~ legitimate damage claim can .result from many unknown causes perhaps the best being that any damage criterion is a probability-type criterion.
Vibration levels that are completely safe for structures are annoying and even uncomfortable when viewed subjectively by people. Figure 5.9 has been adapted from Goldman (5) to show the subjective response of the human body to vibra· tory motion. These limits are based on the results for sinusoidal vibration. Similar results have not been determined for nonsinusoidal vibrations. Predominant frequencies generated by blasting are commonly in the range from 6 to 40 cps. If a building is being vibrated to a particle velocity of 1.0 in/sec, the building is considered safe, but the vibration level as viewed subjectively by people is intolerable. At a particle velocity of 0.2 in/sec, the probability of damage to a building is nil, ai\d yet the vibration level is viewed as quite unpleasant or aruioying by some people.
The superposition of the perceptible, unpleasant, and intolerable limits on the case history plot of particle velocity versus percentage of
u Cl> ... .... c
10.-~--~-..~..-....... ~~..-~ .................. ~ 8 6
4
I
2 in/sec J~!! .J!r:E:!!:!!!...IJ'.!!.!t
~ 0.8 >-
.6 t: (..)
.4 0 ..J UJ >
.2 UJ ..J (..)
t== .I a: .08 ci Q.. .06
.04
.02
.01 ..... ~--~ ...... ~----~~..._~----.-.~ I 2 4 I 10 20 40 10 100
FREQUENCY, cpt
Figure 5.9.-Subjective response of the human body to TI°bratory motion (after Goldman).

28 BLASTING VIBRATIONS AND THEIR. EFFECI'S ON STR.UCTURES
10 8 6
4
2 u G> Cl> ...... I c: 0.8
>- .6 ·I-O· .4 0 ...J LLJ > .2
LLJ ...J 0 .10 I- .08 a:: <t .06 a..
.04 \..''
.02
.01 0.01 0.02 0.04 0.06 0.1 0.2 0.4 0.6 I 2 4 6 10 20 40 60 100
NUMBER OF COMPLAINTS/NUMBER OF FAMILIES,.percent
Figure 3.10.-COmplaint hi"-tory. Salmon Nuclear Event. with superposed subjective response.
complaints for the Salmon nuclear event near Hattiesburg, Miss., is shown in figure 3.10 (11). More than 35 percent of the families located in the zone where the 2 in/sec was exceeded filed complaints. This is the intolerabhr subjective response zone and should have been anticipated. In the perceptible zone, less than 8 percent of the families complained. Thus, the Salmon data indicates that a vibration level of 0.4 in/sec should not be exceeded if complaints and claims are to be kept below 8 percent.
A similar relationship exists with the noise associated with air blast pressures. The air blast pressure from most blasts is considerably less than that which causes glass damage. However, the sound level at an overpressure of 0.01 psi is comparable to the maximum sound in a boiler shop or the sound level 4 feet from a large pneumatic riveter (ff). The sound level at 0.001 psi compares with the sound generated at a distance of 3 feet from a trumpet, auto horn, or
an automatic punch press. It is completely under· standable that the public reacts to blasting opera· tions. Kringel (6) describes a quarry operation where adequate precautions were taken to insure that seismic vibrations and air blast pressures generated were a small fraction of the levels required to cause physical damage. A full-time public relations staff devoted their efforts to ac· quainting the community with the company's efforts to minimize seismic vibrations, air blast, and noise. The complaints continued. It was concluded from an analysis of the complaints that the problem is one of subjective response. No amount of objective data will convince a person who "feels" strong vibrations that the vibration level as measured was barely perceptible-similarly with noises and air blasts. Personal contact and strong efforts in public relations help alleviate the problem but convince few. An understanding of the overall human response to such stimuli may be achieved some day but will
. ___ .....

SAFE VIBRATION LEVELS FOR. 11.ESIDE.NTIAL STR.UcrtJRES 29
not really solve the problem. The only possible solution is to keep vibration levels and air blast pressures well below the safe vibration criteria and concentrate on noise abatement.
3.11-REFERENCES
l. Crandell, F. J. Ground Vibration Due to Blasting and Its Effect Opon Structures. J. of the Boston Soc. of Civil En~eers, April 1949, pp. 222-245.
2. Duvall, Wtlbur I., and D. E. 'Fogelson. Review of Criteria for Estimating Damage to Residences From Blasting Vibrations. BuMines Rcpt. of Inv. 5968, 1962, 19 pp.
S. Dvorak, A. Seismic Effects of Blasting on Brick Houses. Prace geofyrikeniha Ustance Ctiskoslovenski Abdemie Ved. No. 169. Geofylikalni Sbomil:, 1962, pp. 189-202.
4. Edwards, A. T .. and Northwood, T. D. Experimental Studies of the Effects of Blasting on Structures. The Engineer, v. 210, Sept. SO, 1960, pp. 55&-546.
5. Goldman, D. E. A Review of Subjective Responses to Vibrating Motion of the Human Body in the Fttquency Range, 1 to 70 cycles per second. Naval Medical Res. Inst. Rept. No. 1, Project NM 004001, Mar. 16, 1948, 17 Pf·
6. Kringel, J. R.. Contro of Air Blast Effect Resulting From Blasting Operations. Mining Congr. J., April 1960, pp. 51-56. ·
7. Langefors, Ulf, Kihlstrom, B., and Westerberg, H.
Ground Vibrations in Blasting. Water Power, February 1958, pp. 335-338, 390-395, 421-424.
8. Peterson, A. P. G., and E. E. Gross, Jr. Handbook of Noise Measurement. General Radio Co. West Concord, Mass., 5th ed., 196!, p. 4.
9. Perkins, Beauregard, Jr., Paul H. Lorain, and Wil· liam H. Townsend .. Forecasting the Focus of Air Blasts Due to Meteoroloipcal Conditions in the Lower Atmosphere. Ballistic Research Laboratories Rept. No. lll8, October 1960, 77/1>·
10. Perkins, Beauregard, Jr., and Willis . Jackson. Hand· book for Prediction of Air Blast Focusing. Ballistic Research Laboratories Rept. No. 1240, February Hl64, 100 pp.
11. Power, D. V. A Survey of Complaints of Seismic·Rc-lated Damage to Surface Structures Following the Salmon Underground Nuclear Detonation. Bull. of the Seil. Soc. of America, v. 56, No. 6, December 1966, pp. HllJ.-1428.
12. Sadwin, L. D., and W. I. Duvall. A Comparison of. Explosives by Cratering and Other MethOds. Trans. of SME of AIME, v. 232, June 1965, pp. 111-115.
Ill. Thoenen, J. R .. and Windes, S. L. Seismic Effects of Quarry Blasting. BuMines Bull. 442, 1942, 8! pp.
14. Wall, J. F .. Jr. Sew;mic-Induced Architectural Damage to Masonry Structures at Mercury, Nevada. Bull. of the Seis. Soc. of America, v. 57, No. 5, October 1967, pp. 991-1007.
15. Windes, S. L. Damage From Air Blast. Progress R.c-port 1. BuMines Rept. of Inv. 5622, 1942. f8 pp.
16. --. Damage From Air Blast. Progress Report 2. BuMines Rept. of Inv. 3708, 1943, 50 pp.

t
I f I I I
·I .1
CHAPTER 4.--GENERATION AND PROPAGATION OF GROUND VIBRATIONS FROM BLASTING
4.1-INTRODUCTION
A major objective of the program was to determine a propagation law for ground-borne surface vibrations. Of primary interest were the relationships among the size of. the explosive charge, shot-to-gage distance, and the magnitude of the ground vibration. Other variables considered were explosive type, method of initiation, geology, and directional effects.
The effect of distance and charge weight on the vibration level is basic to all blasting vibration studies. Many types of propagation laws or equations have been proposed. The most widely accepted form is
A= kWbDn, (4.1) where A is the peak amplitude, W is the charge weight, D is the distance, and k, b, and n are constants associated with a given site or shooting procedure. Both theoretical and empirical methods have been used to estimate values of b and n. Typical values found in the literature for b range from 0.4 to 1.0 and for n from -1 to -2 (1, 4, 5, 9-12, 14-17). The quantity, A, may be the peak amplitude of particle displacement, velocity, or acceleration, and k and n will vary correspondingly. For purposes of the present study, particle velocity only was recorded and analyzed, because it correlated most directly with damage (see Chapter 3) .
A reasonable aim in any scientific research is to obtain reliable data with a minin1um expenditure of experimental effort. This requires that the variables to be studied be controlled in a
· known manner and that other contributing factors be held constant or randomized. The desired degree of control was not always attained in the study of quarry blasting vibrations. Quarry operators, justifiably, were often reluctant to vary factors, such as method of initiation, hole size, burden, spacing, etc., because such changes could result in additional operating costs. Therefore, it was necessary to visit a large number of quarries and with the dose cooperation of the quarry operators select the necessary conditions of explosive placement and initiation, terrain, ovet"· burden, etc. Most of the quarries selected were in relatively flat terrain, with more or less uniform
30
overburden extending back from a working face for 1,000 feet or more.
Among the gross factors studied were a comparison of vibration levels from milliseconddelayed blasts and instantaneous blasts, the proper charge weight to be used in scaling data from different blasts, and the scaling factor to be used (6, 7). In addition, the effect of the method of blast initiation on vibration amplitudes was investigated, as well as such variables as direction of propagation, overburden thickness. site, and rock type. Most quarries or blasting operations use a particular type or types of explosive that best suit their needs. Explosive type varied within and among quarries and could not be controlled. Therefore, the site effect includes the effect of using different explosives at different sites.
Fourier spectra analysis methods were used on a limited amount of the data where particular results were desired, such as those arrived at in section 3.6. The technique was not used extensively in a routine manner but only as a device to provide specific results.
The basic instrumentation used in these tests (described fully in Chapter 2) consisted of up to 36 particle velocity gages and amplifiers and two direct-writing oscillographs. The gages were generally mounted in or on the overburden, on steel pins driven in the sides of square holes in the i soil, or in boxes buried in square holes in the f soil. Occasionally the gage boxes were attached ~ directly to the rock surface with cemenL The , .. j normal gage array consisted of several stations. each at a successively greater shot-to-station distance and each with 5 gages oriented in three mutually perpendicular directions from the shoL At some quarries, extended arrays with only vertically oriented gages were used. At other quarries, the azimuth between arrays or parts of an array was changed either to study directional effects or because of difficulty in maintaining a si~gle azimuth due to terrain or physical obstructions.
Refraction tests were conducted in some of the ' quarries to determine overburden depths and seismic propagation velocities. Arrival times oo
.1 -i .
GENERATION AND PROPAGATION OF GROUND VIBRATIONS FRO¥ BLASTING SI
the recordings from quarry blasts wer~ also analyzed to determine velocities through the rock beneath the overburden.
A total ofl71 blasts were recorded at 26 sites. The charge size ranged from 70 to 180,550 paunds per blast and from 25 to 19,625 pounds per delay. The number of holes per shot ranged from I to 490. The rock types included limestone, dolomite, diorite, basalt. sericite schist. trap rock, granite, granite-gneiss, and sandstone.
4.2-MILLISECOND-DELA YED BLASTS VERSUS INSTANTANEOUS BLASTS
In the 1940's and 1950's, millisecond-delay blasting became an accepted technique for reducing vibrations from blasting and as a better method for breaking rock. The main variables associated with a millisecond-delayed blast in a given rock are the delay interval, the number of delay intervals, and the number of holes per delay interval. Although previous work by other investigators had shown that milliseconddelayed blasts produce . smaller vibration amplitudes than those produced by instantaneous blasts employing the same total charge W•'. ight, the effect of these variables on the vibrations produced by millisecond-delayed blasts was not thoroughly understood.
For the first phase of the field program, the following problems were selected for study: (1) to determine the propagation law for the amplitude of vibrations produced by both instantaneow and millisecond-delayed quarry blasts, (2) to determine if the level of vibration at various distances from the blast area is controlled by either the length of the delay interval or the number of delay periods in a millisecond-delayed quarry blast, and (S) to compare vibration levels from instantaneous quarry blasts with those from millisecond-delayed blasts.
4.2.1-Experimental Procedure
The factorial design and shooting order used to study vibration levels from instantaneous and millisecond-delayed blasts is given in table 4.1. For these 12 tests, only a single row of holes was
Table 4.1.-Factorial design and shooting order by test number
No. of holes 0
3 -···----··-···- 2 17 ----····-···-···-· 8 5 -··--·-·-···-····- 12
Delay interval, msec.
9 17
19 3 20 5 21 11
34
6 7
13
used. Detonating fuse between holes connected the charges together in series for the instantaneous blasts. Delay intervals were achieved by placing a 9, 17, or two 17 millisecond-delay connectors in aeries with the detonating fuse between adjacent holes of the round. Only one hole per delay was used. The study also included five single-hole and two multiple-row millisecond-delayed blasts. For the two multiple-row blasts, the maximum number of holes per delay was four for one round and six for the other.
An attempt was made to randomize the shooting order and position along the face for these blasts to remove bias due to these variables. The necessity to efficiently mine the face prevented complete randomization. In addition, the tests involving multiple-rows and 9 milliseconddelay intervals were "added to the program after the other tests had been completed.
Hole diameter, depth, spacing, burden, and loading procedure were held constant for these tests. Spacing and burden were 15 and IO feet, respectively. All holes were 6 inches in diameter and 36 feet in depth. Stemming was about 15 feet. A 200-pound charge of explosives in 5-inch diameter sticks was loaded into each hole.
A plan view of the test area at the Weaver Quarry near Alden, Iowa, is shown in Appendix A, figure A-1. The location of each quarry blast is identified by test number, and the area of rock breakage is indicated by broken lines. The instrument arrays were placed along the straight lines shown on the map and are identified by a number signifying the corresponding blast and area. In general, each instrument array was directly behind the blast area and approximately perpendicular to the face. The main exception was the array used for Shot 14. The gaps shown between the blast areas represent the rock
. quarried when vibration studies were not con•f ducted. The distance to the gage stations along
each array was measured from the center of the blast area.
Up to 24 particle velocity versus time records were obtained from each of the 19 quarry blasts. Typical recordings are shown in figures 4.1 through 4.4. The vertical lines represent 10-millisecond intervals. Each record trace is identified as to component of particle velocity and the distance from blast to gage. R, V, and T represent the radial, vertical and transverse components. The center trace of each record is the 100 cps reference timing signal from a standard oscillator.
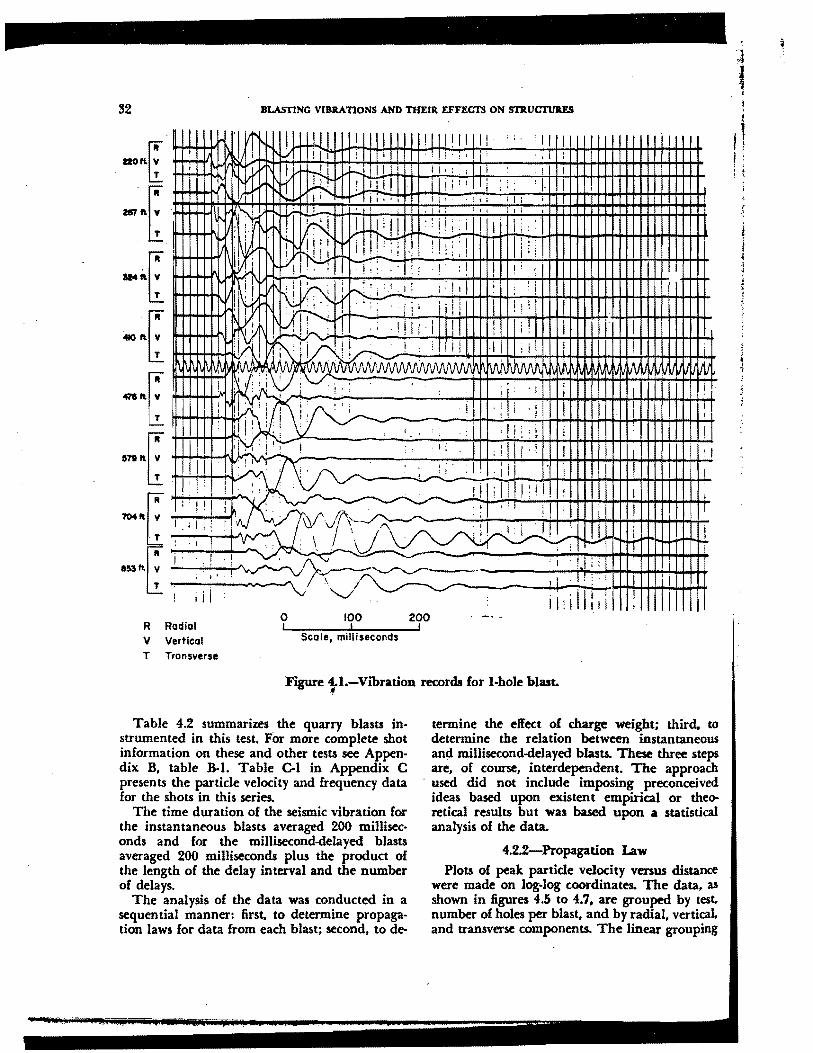
32 BLASTING VIBRATIONS AND THEIR EFFECfS ON STllUCTUJlF3
R Radial V Vertical T Transverse
0 100 200
Scale, milliseconds
: : : I i
! : :
I-:
i I j i
' I l I
I ii : : -i
l Ii i: i ~
I t ' I I ' ; I
i '
I ' ! ; , . ! I i I
-I : i
w~ ii I
11: i ~ I ' i
I
, 11 'I '' r
I I i :
I
I I
I '"'" --I I I I
I I I ! i t. fl 'V ~111. . ' i I I
I I I I l
j I I I , I
I I i
I I
I I I I I I I
T I
I
I 11
I 11 '
Figure 1-1.-Vibration records for l·hole blast.
Table 4.2 summarizes . the quarry blasts in· strumented in this test. For more complete shot information on these and other tests see Appendix B, table B-1. Table C-1 in Appendix C presents the particle velocity and frequency data for the shots in this series.
The time duration of the seismic vibration for the instantaneous blasts averaged 200 millisec· onds and for the millisecond-delayed blasts averaged 200 milliseconds plus the product of the length of the delay interval and the number of delays.
The analysis of the data was conducted in a sequential manner: first, to determine propagation Jaws for data from each blast; second, to de-
termine the effect of charge weight; third, to determine the relation between instantaneous and millisecond-delayed blasts. These three steps are, of course, interdependent. The approach
· used did not include imposing preconceived ideas based upon existent empirical or thee>retical results but was based upon a statistical analysis of the data.
4.2.2-Propagation Law
Plots of peak. particle velocity versus distance were made on log-log coordinates. The data. as shown in figures 4.5 to 4.7, are grouped by test. number of holes per blast, and by radial, vertical. and transverse components. The linear grouping
- ---·
' ~ i ;
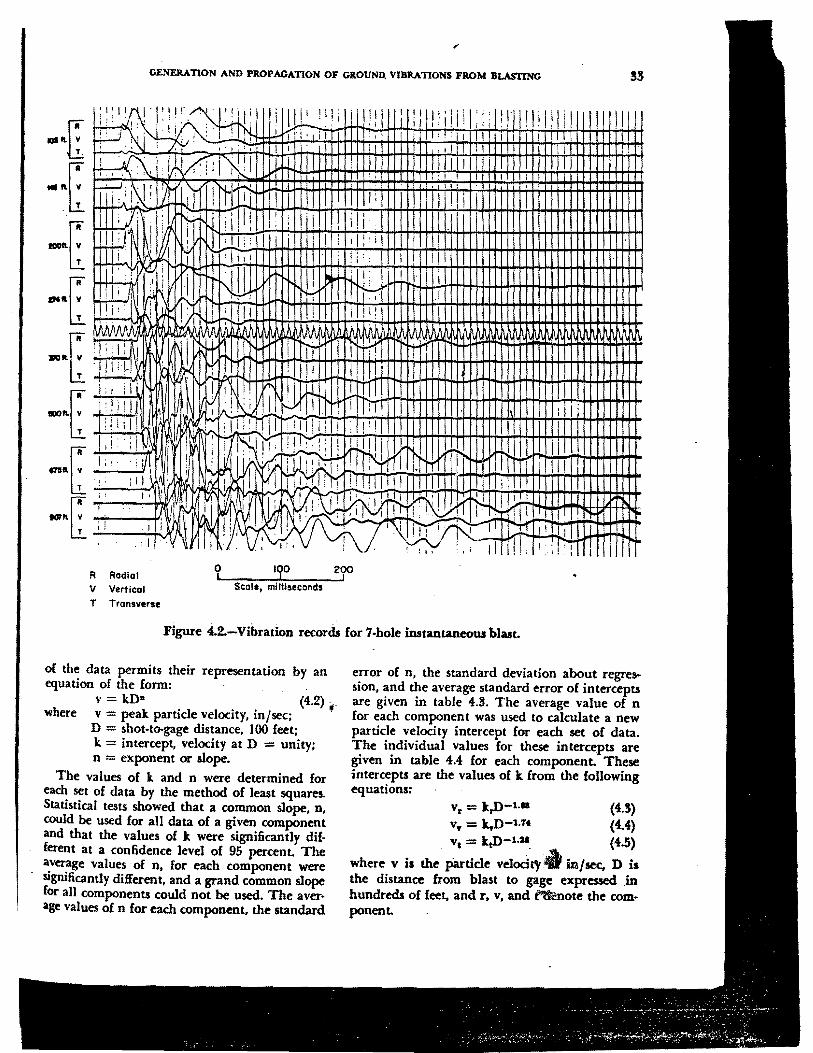
,
GENERATION AND PROPAGATION OF GltOUND. VJBltATIONS FROM BLASTING
R Rodial V Vertical
T Transverse
0 100 200
Scole, milliseconds
Figure 4.2.-Vibration records for 7-hole instantaneous blast.
of the data permits their representation by an equation of the fonn:
v = kD• (4.2) .. where v = peak particle velocity, in/sec; "
D = shot-to-gage distance, 100 feet; k = intercept, velocity at D = unity; n =exponent or slope.
The values of k and n were determined for each set of data by the method of least squares. Statistical tests showed that a common slope, n, could be used for all data of a given component and that the values of k were significantly dif· ferent at a confidence level of 95 percent. The average values of n, for each component were significantly different, and a grand common slope for all components could not be used. The aver· age values of n for each component, the standard
error of n, the standard deviation about regression, and the average standard error of intercepts are given in table 4.S. The average value of n for each component was used to calculate a new particle velocity intercept for each set of data. The individual values for these intercepts are given in table 4.4 for each component. These intercepts are the values of k from the following equations:
Vr = k.D-1·• (4.5) v,. = k,.D-1.H {4.4) v, = ~-1.•. (4.5)
where v is the particle velocity.4t in/sec:. D is the distance from blast to gage expressed .in hundreds of feet, and r, v, and ~note the com· ponent.
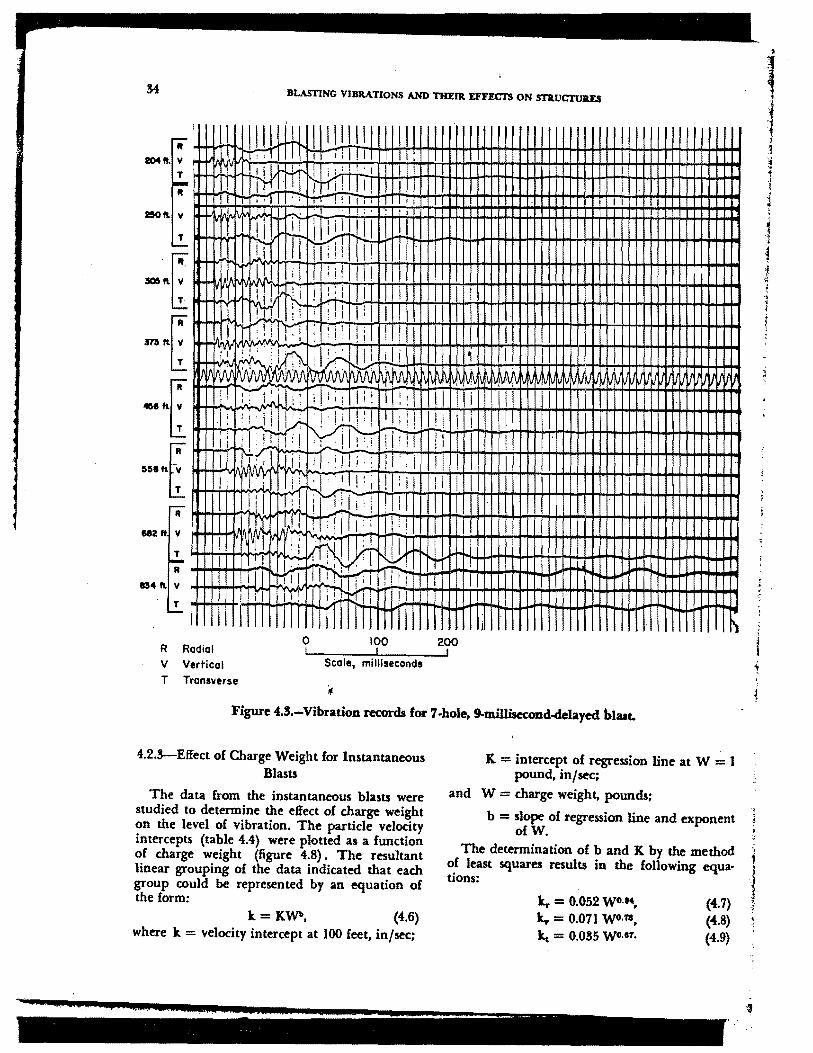
Bl.ASTING VIBRATIONS AND THEIJl EFFECfS ON STRUCTURES
R 11 I I. "' I! Iii! I I I
2!50ft. v J ,J.. .. '.a. -1 . t ! : . : 11
T
R
U2rt V
T
R
&ll4ft. y
T
R Radial 0 100 200
V Vertical Scale, milliseconds
T Transverse ~
Figure 4.5.-Vibration records for 7 ·hole, 9-millisecond-delayed blaat.
4.2.!-Effect of Charge Weight for Instantaneous Blasts
The data from the instantaneous blasts were studied to determine the effect of charge weight on the level of vibration. The particle velocity intercepts (table 4.4) were plotted as a function of charge weight (figure 4.8) . The resultant linear grouping of the data indicated that each group could be represented by an equation of the form:
k =KW", (4.6) where k = velocity intercept at 100 feet, in/se.c;
K = intercept of regression line at W = I pound, in/sec;
and W = charge weight, pounds;
b = slope of regression line and exponent ofW.
The determination of b and K by the method 1 of least squares results in the following equa· !
tions: l k.. = 0.052 wo.u, It..,.= 0.071 Wo·'lll, kc = 0.035 WO.IT,
(4.7) (4.8) (4.9)
l "" -~
.·'3
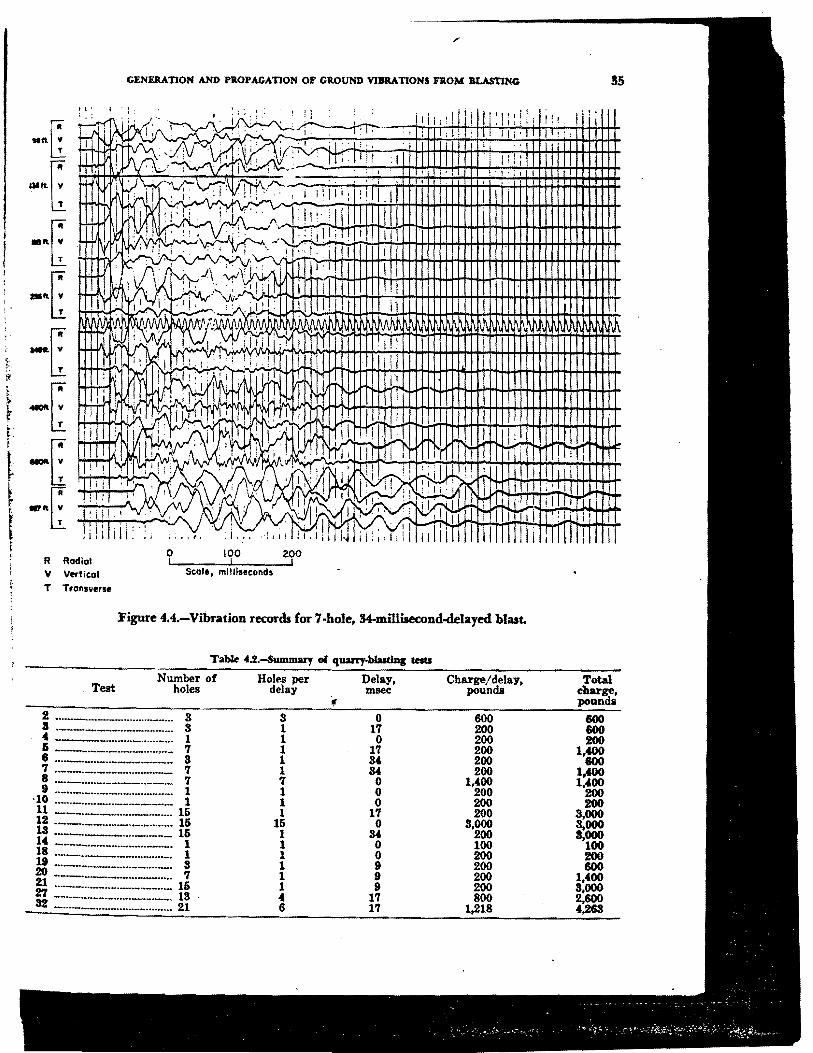
GENERATION AND PROPAGATION OF GROUND VIBRATIONS FROM BLASTING
R Rodlol v Vertical
T Tronsverse
0 100 200
Scale, milliseconds
Figure 4.4.-Vibration records tor 7-hole, 54-millisecond-delayed blast.
Number of Test holes
2 -··--····-················-····· s a ····-·-·-··-··-··--··-·-· s 4 ---····-·······-······-··· 1 I --·-·--·-··-·-······-- 7 6 ···--·-····----~--- 3 7 ··-·-·--··-·--·····- 7 8 ·-·--···--·····--··-····-· 7 9 ··-··-·-···-·-······-··-···-· 1
· 10 --····--···--·--·-···· 1 11 ----···---·-·--··-····· 16 ~ ·-·--···--··-····-····· 16 1 ·--·---····--·--- 16 14 ·---·---····-··-··--····· 1 18 --···---·--·········--· 1 ~ ----······--·····-·-·····- 3 21 --·-·---···--··- 7 2'1 ··---···-·····-·----··-· 16 32 -·-·-··-·-······-·-·-··· lS ........................................ 21
Holes per delay
s 1 1 1 1 1 7 1 1 1
16 1 1 1 1 1 1 4 6
Delay, tnseC
f 0
17 0
17 34 34
0 0 0
l'1 0
34 0 0 9 9 9
17 17
Charge/ delay, pounds
600 200 200 200 200 200
1,400 200 200 200
8,000 200 100 200 200 200 200 800
1,218
55
Total charge, pounds
600 600 200
1,400 600
1,400 1,400
200 200
3,000 3,000 1,000
100 200 600
1,400 8,000 2,600 4,268
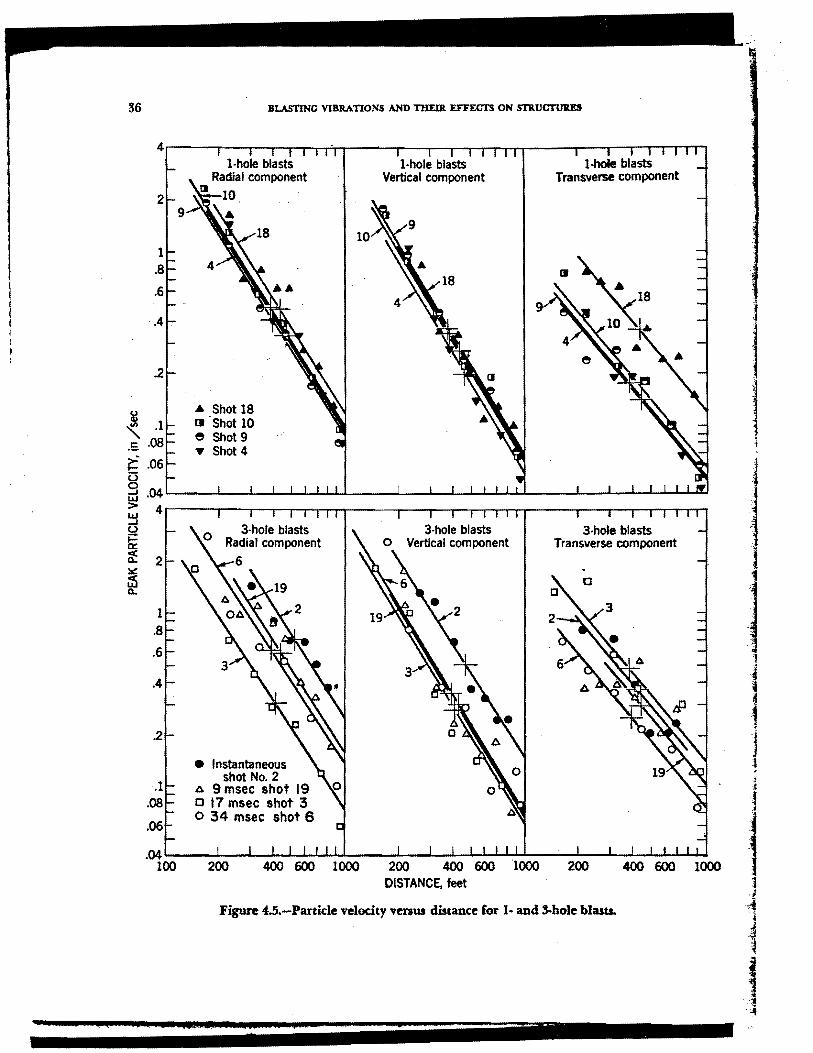
.,
86
2
1 .8
.6
.4 .
.2
1 .8
.6
.4
.2
.1 .08
.06
9
BLASTING VIBRATIONS AND THEIR EFFECTS ON STllUCTU'llES
· 1-hole blasts Radial component
[I 10
._ Shot 18 m ·shot 10 e Shot 9 • Shot 4
3-hole blasts Radial component
6
• Instantaneous shot No. 2
4 9 msec shot 19 o 17 msec shot 3 o 34 msec shot 6
1-hole blasts Vertical component
3·hole blasts Vertical component
1-hole blasts Transverse component
3·hole blasts Transverse component
.04...._~~.._~..__.__._...._._._ ........ ~~---~--.~"--...__.~ ...... --~~--~--__...__,_......_......_.
100 200 400 600 1000 200 400 600 1000 200 400 600 1000 DISTANCE, feet
Figure 4.!S.-Particle velocity venus distance for I· and 3-hole blasts.
. a z A A.!. IJ I t; Ji p p ---

~ .5
~ 0 g l.&J > l.&J ...I u j:.: a:: f :w::: :i a.
4
2
.4
.2
.06 6
4
•
7·hole blasts Radial component
Instantaneous shot No. 8
A 9 msec shot 20 c 17 msec shot 5 o 34 msec shot 7
15-hole blasts Radial com~nent
2
1 .8 A • .6
A
.2 • Instantaneous shot No. 12
1::.. 9msec shot 21 .1 c 17 msec shot 11
.08 o 34 msec shot 13
.06 100 200 400 600 1000
11 13
'
7·hole blasts Vertical component
15-hole blasts Vertical component
0
200 400 600 1000
DISTANCE. feet
7 ·hole blasts Transverse component
0
15-hole blasts Transverse co~ponent
21
200 400 600
Figure 4.6.-Particle velocity versus distance lor 7· and 15-bole bla..ts.
1000

.!18
0.2
.1 .08
.06
.04
.02
.4
2
BLASTING VIB'RATJONS A.ND THEIR EFFECTS ON ST.RUCIUIU!'.S
~ Shot 14, 1 hole, 100 lb.
a Shot 27, 4 holes per 17 msec delay
0 Shot 32, 6 hotes per 17 msec delay
• Multiple hole blasts Radial component
200 400 600 1,000
Multiple hole blasts Vertical component
200 400 600 1,000 DISTANCE. feet
l·hole blasts Vertical component
A
c
Multiple hole blasts Transverse component
200 400 600 1,000
Figure 4.7.-Particle velocity versus distance for a I-hole and 2-iriultiple-row blaa11.
-..... - ..
I
I
I
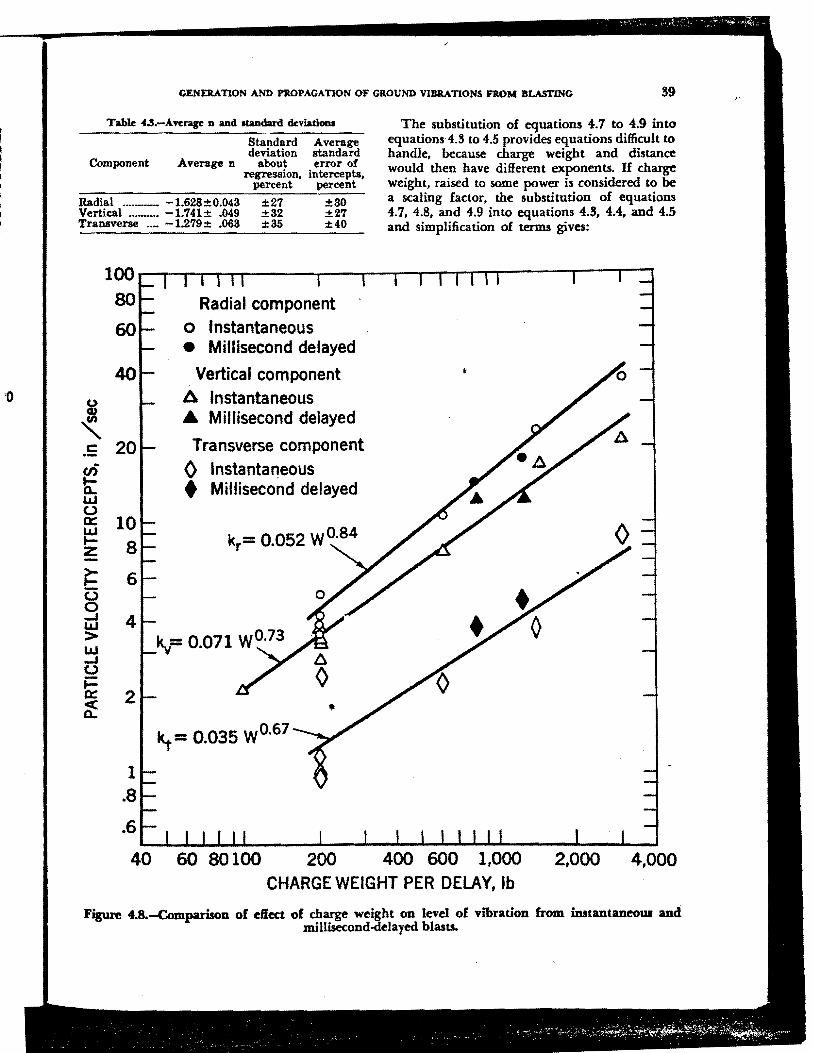
·o
GENERATION AND PROPAGATION OF GROUND VIBRATIONS FROM BLASTING 89
Table .f.!.-Average n and Nandard deviatl.ona
Standard Average deviation standard
Component Average n about error of
Radial ····-- -1.628±0.043 Vertical ... --·· -1.741± .049 Transverse ··- -1.279 ± .063
:regression, intercepts, percent percent
±27 ±30 ±32 ±27 ±35 ±40
The substitution of equations 4.7 to 4.9 into equations 4.!J to 4.5 provides equations difficult to handle, because charge weight and distance would then have different exponents. If charge weight, raised to some power is considered to be a scaling factor, the substitution of equations 4.7, 4.8, and 4.9 into equations 4.8, 4.4. and 4.5 and simplification of terms gives:
100--..--------~~--~--------...,..._,.-.,-r-r-~~-.-~..,---,
80 Radial component 60 o Instantaneous
40
~ .5 20 en t: L&J (J
0: 10 ~ z 8
~ (J 0 ...J L&J > LIJ ...J (J
~ ~
6
4
2
1 .8
.6
• Millisecond delayed
Vertical component A Instantaneous A Millisecond delayed
Transverse component 0 lnstanta11eous t Millisecond delayed
~ = 0.035 w0·67
40 60 80100 200 400 600 1,000 CHARGE WEIGHT PER DELAY, lb
2,000 4,000
Figure 4.8.-Comparisou of effect of charge weight on level of vibration &om imtantaneo1U and millisecond-delayed blasts.
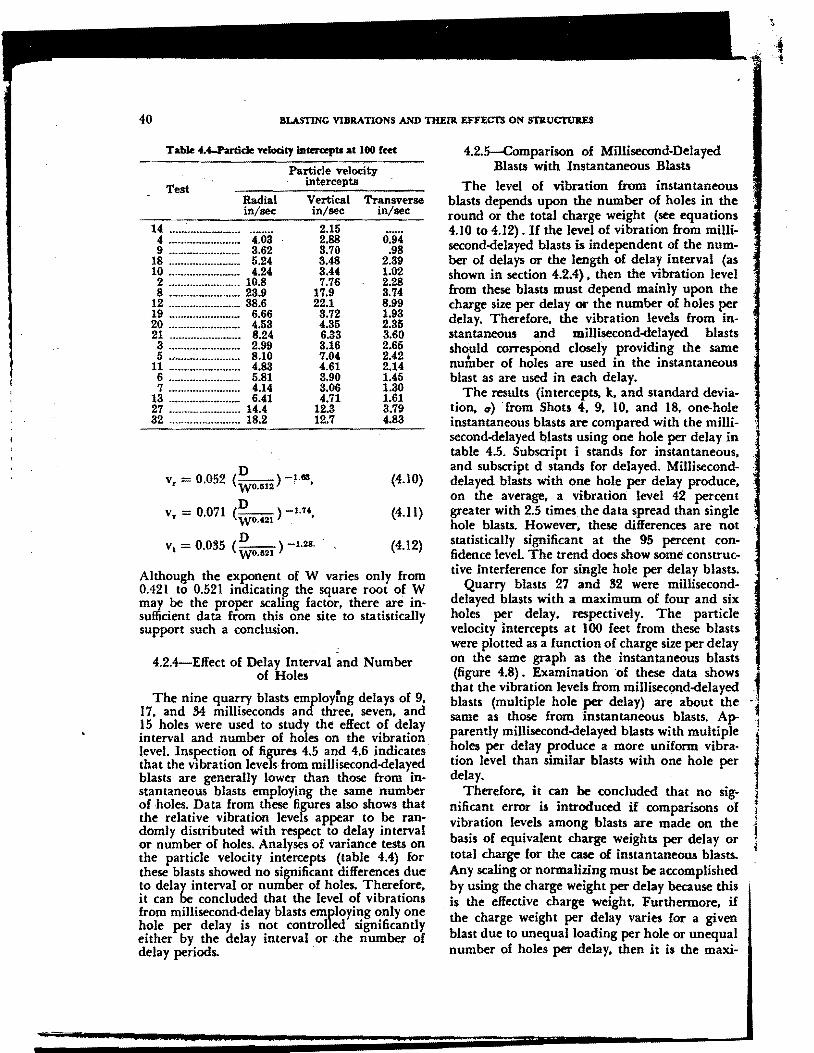
40 BLASTING VIBRATIONS AND THElll EFP'ECI'S ON STR.UCTlllt.ES
Table .f.4-Partide Ytlodty inurupu at 100 fm
Test
14 ···············-··-···
Radial in/sec
4 ........•............... 4.03 9 ···-·-················ 3.62
18 ........................ 5.24 10 ···············-··-··· 4.24 2 ........................ 10.8 8 ........................ 23.9
12 ........................ 38.6 19 ···-··············-··· 6.66 20 ........................ 4.53 21 ........................ 8.24 3 ........................ 2.99 5 ·'······················ 8.10 11 ........................ 4.88 6 ···················-··· 5.81 7 ........................ 4.14
13 ···············-······· 6.41 27 ........................ 14.4 32 ........................ 18.2
Particle velocity · intercepts
Vertical Transverse in/sec in/sec
2.15 2.88 0.94 3.70 .98 3.48 2.39 3.44 1.02 7.76 2.28
17.9 3.74 22.1 8.99 3.72 1.93 4.35 2.35 6.33 3.60 3.16 2.65 7.04 2.42 4.61 2.14 3.90 1.45 3.06 1.30 4.71 1.61
12.3 3.79 12.7 4.83
D vr = 0.052 <wo.1112 )-~·113, . (4.10)
v = 0 071 (~) -1.'lf 1' • wo.•21 . ,
D Vt = 0.035 (--) -1.28. wo.1121
(4.11)
(4.12)
Although the exponent of W varies only from 0.421 to 0.521 ini:licatin~ the square root of W may be the proper scalmg factor, there are in· sufficient data from this one site to statistically support such a conclusion.
4.2.4-Effect of Delay Interval and Number of Holes
The nine quarry blasts employrng delays of 9, l 7. and S4 milliseconds and three, seven, and 15 holes were used to study the effect of delay interval and number of holes on the vibration level. Ins~ction of figures 4.5 and 4.6 indicates· that the vibration levels from millisecond-delayed blasts are generally lower than those from in· stantaneous blasts employing the same number of holes. Data from these figures also shows that the relative vibration levels appear to be randomly distributed with respect to delay interval or .number of holes. Analyses of variance tests on the particle velocity intercepts (table 4.4) for these blasts showed no significant differences due to delay interval or number of holes. Therefore, it can be concluded that the level of vibrations from millisecond-delay blasts employing only one hole per delay is not controlled significantly either by the delay interval or the number of delay periods. ·
4.2.5-Comparison of Millisecond-Delayed Blasts with Instantaneous Blasts
The level of vibration from instantaneous blasts depends upon the number of holes in the round or the total charge weight (see equations 4.10 to 4.12). If the level of vibration from millisecond-delayed blasts is independent of the number of delays or the length of delay interval (as shown in section 4.2.4), then the vibration level from these blasts must depend mainly upon the charge size per delay or the number of holes per delay. Therefore, the vibration levels from in· stantaneous and millisecond-delayed blasts should correspond closely providing the same nufuber of holes are used in the instantaneous blast as are used in each delay.
The results (intercepts, k, and standard deviation, a) ·from Shots 4, 9, 10, and 18, one-hole instantaneous blasts are compared with the millisecond-delayed blasts using one hole per delay in table 4.5. Subscript i stands for instantaneous, and subscript d stands for delayed. Milliseconddelayed blasts with one hole per delay produce, on the average, a vibration level 42 percent greater with 2.5 times. the data spread than single hole blasts. However, these differences are not statistically significant at the 95 percent confidence level. The trend does show some constructive interference for single hole per delay blasts.
Quarry blasts 27 and 32 were milliseconddelayed blasts with a maximum of four and six holes per delay, respectively. The particle velocity intercepts at 100 feet from these blasts were plotted as a function of charge size per delay on the same graph as the instantaneous blasts (figure 4.8) • Examination of these data shows that the vibration levels from millisecond-delayed blasts (multiple hole per delay) are about the ~ same as those from instantaneous blasts. Apparently millisecond-delayed blasts with multiple
1
1 holes per delay produce a more uniform vibra· tion level than similar blasts with one hole per · delay.
Therefore, it can be concluded that no sig- ·~ nificant error is introduced if comparisons of J vibration levels among blasts are made on the J basis of equivalent charge weights per delay or l total charge for the case of instantaneous blasts. Any scaling or normalizing must be accomplished by using the charge weight per delay because this is the effective charge weight. Furthermore, if the charge weight per delay varies for a given blast due to unequal loading per hole or unequal number of holes per delay, then it is the maxi·
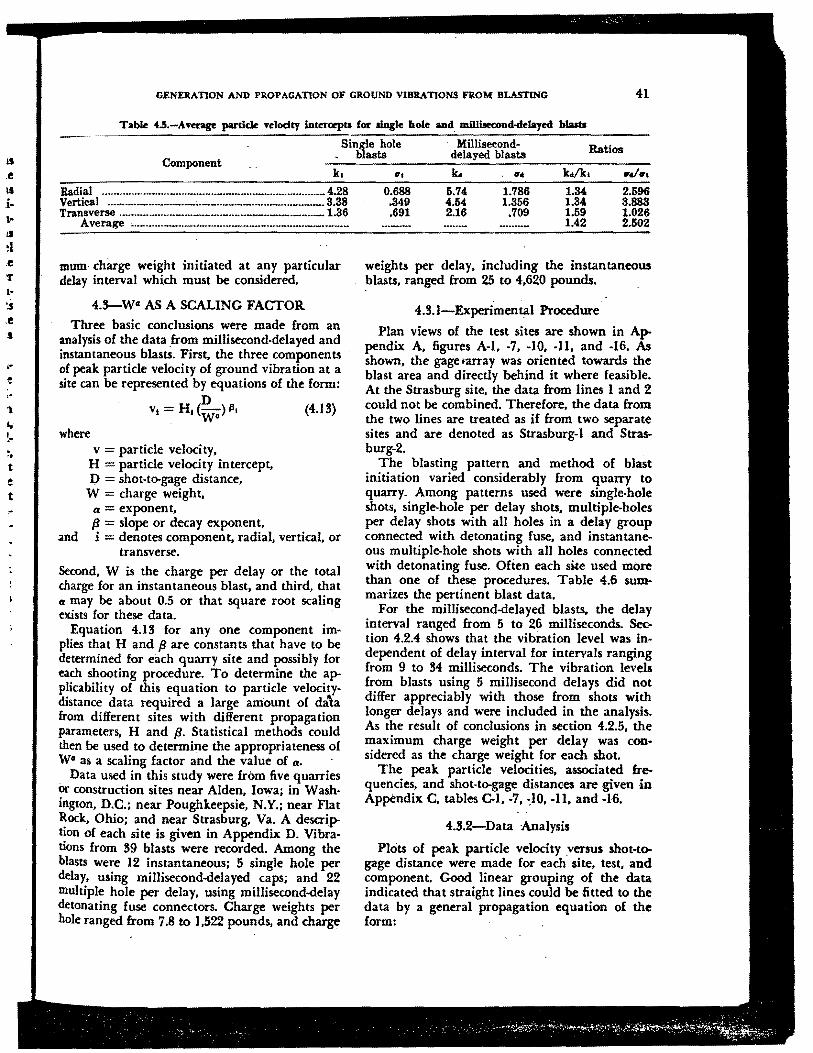
IS
.e IS
. .. t e t
GENERATION AND PROPAGATION OF GROUND VIBRATIONS FROM BLA.STING 41
Table 4..5.-Avcrage partick nlodty intercepts for single hole and_ milliiiecond-delayed blasts
Component
Single hole • blasts
Milliseconddelayed blasts Ratios
k.t . O'•
Radial ···-··-·····-·-··-···--····-·-··-··----·-···-·· 4.28 0.688 5.74 1.786 . 1.34 2.596 Vertical ···-··-·---···--··-;·--·······--·--·-··--····-· 3.38 .349 4.54 1.366 1.34 3.883 Transverse ···········-··-··-····--····-··-··-·-··--·-·-··- 1.36 .691 2.16 .709 1.59 1.026
Average '··········-······-······-······-····-····-·-·-·--·-·-·-
mum· charge weight initiated at any particular delay interval which must be considered.
4.~wa AS A SCALING FACTOR
Three basic conclusions were made from an analysis of the data _from millisecond-delayed and instantaneous blasts. First, the three components of peak particle velocity of ground vibration at a site can be represented by equations of the fonn:
D Vt= Hi(-) 111 (4.18) . wa
where v =particle velocity,
H =particle velocity intercept, D = shot-to-gage distance,
W = charge weight, a = exponent, p = slope or decay exponent,
.and i = denotes component, radial, vertical. or transverse.
Second, W is the charge per delay or the total charge for an instantaneous blast, and third, that a may be about 0.5 or that square root scaling exists for these data.
Equation 4.18 for any one component implies that H and pare constants that have to be determined for each quarry site and possibly for each shooting procedure. To determine the applicability of this equation to particle velocitydistance data required a large amount of da\a from different sites with different propagation parameters, H and p. Statistical methods could then be used to determine the appropriateness of W• as a scaling factor and the value of a. ·
Data used in this study were fr<>m five quarries or construction sites near Alden, Iowa: in Washington, D.C.: near Poughkeepsie, N.Y.; near Flat Rock, Ohio; and near Strasburg, Va. A descrip~on of each site is given in Appendix D. Vibrations from 89 blasts were recorded. Among the blasts were 12 instantaneous; 5 single hole per delay, using miJiisecond-delayed caps; and 22 multiple hole per delay, using millisecond-delay detonating fuse connectors. Charge weights per hole ranged from 7.8 to 1.522 pounds, and charge
1.42 2.502
weights per delay, including the instantaneous blasts, ranged from 25 to 4,620 pounds.
4.8.1-Experimental Procedure
Plan views of the test sites are shown in Appendix A, figures A-1, -7, -10, -11, and -16. As shown, the gage~array was oriented towards the blast area and directly behind it where feasible. At the Strasburg site, the data from lines I and 2 could not be combined. Therefore, the data from the two lines are treated as if from two separate sites and are denoted as Strasburg-I and Strasburg-2.
The blasting pattern and method of blut initiation varied considerably from quarry to quarry. Among patterns used were single-bole shots, single-hole per delay shots, multiple-holes per delay shots with all holes in a delay group connected with detonating fuse, and instantaneous multiple-hole shots with all holes connected with detonating fuse. Often each site used more than one of these procedures. Table 4.6 summarizes the pertinent blast data.
For the milJisecond-delayed blasts, the delay interval ranged from 5 to 26 milliseconds. Section 4.2.4 shows that the vibration level was independent of delay interval for intervals ranging from 9 to 84 miJliseconds. The vibration levels from blasts using 5 miJiisecond delays did not differ appreciably with those from shots with longer delays and were included in the analysis. As the result of conclusions in section 4.2.5, the maximum charge weight per delay was considered as the charge weight for each shot.
The peak particle velocities, associated frequencies, and shot-to-gage distances are .given in Appendix C, tables Cl, -7, -:10, -11, and -16.
4.S.2-Data Analysis
PIOts of peak particle velocity .versus shot-togage distance were made for each site, test, and component. Good linear grouping of the data indicated that straight lines could be fitted to the data by a general propagation equation of the form:
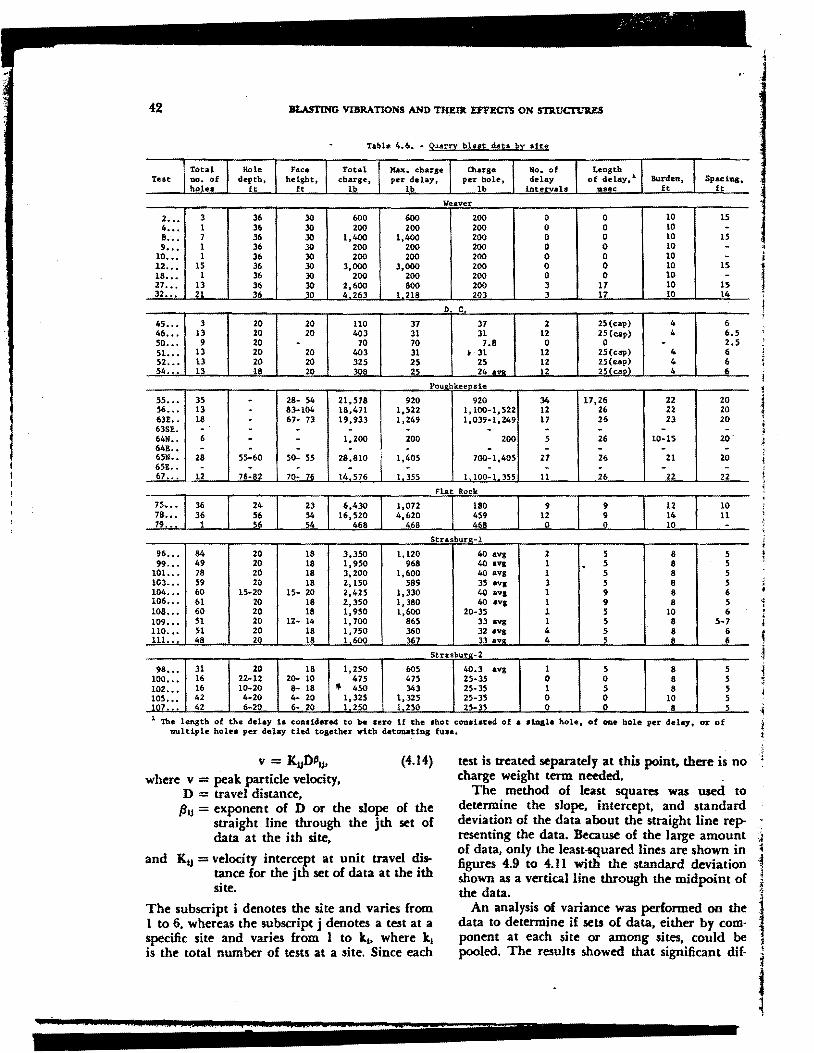
/ t
BLASTING VIBRATIONS AND THEIR EFFECTS ON S'IllUCTt.l1lES
Table 4,6, - QuaTry blast data l>y site
Teat Total no. of holes
Hole depth,
ft
Face hel.ght,
ft
Total charge,
lb
Max. charge per delay,
lb
Qiarge pu hole,
lb
No, Of delay
intervals
Length of delay, 1 Burden,
11sec ft Spacing,
ft
Weaver
2 ... 3 36 30 600 600 200 0 0 10 15 4 ••• l 36 30 200 200 200 0 0 10 -8 ••• 1 36 30 1,400 1,400 200 0 0 10 15 9 ... 1 36 30 200 200 200 0 0 10 -
10 ... 1 36 30 200 200 200 0 0 10 - i 12 ••• 15 36 30 3,000 3,000 200 0 0 10 15 18 ... 1 36 30 200 200 200 0 0 10 -21 ••• 13 36 30 2,600 800 200 3 17 10 15 32 ••• 21 36 30 4 263 1 218 203 3 17 IO 14 l .
D C
45 ••• 3 20 20 110 37 37 2 25(cap) 4 6 46 ••• 13 20 20 403 31 31 12 25(cap) 4 6.5 so ... 9 20 - 70 10 7.8 0 0 - 2.5 51 ••• 13 20 20 403 31 • 31 12 25(cap) 4 6 52 ••• 13 20 20 325 25 25 12 25(..ap) 4 6 54 ••• 13 18 20 308 25 24 a111> 12 25(ca1>l 4 6
Pou•hkeensie
55 ••• 35 56 ••• 13 63! •• 18 63SE. -64N •• 6 64! •• -65N •• 28 65! •• . 67 ••• 12
75... 36 78... 36 79.. 1
---. -.
55-60 -76-82
24 56
28- 54 83-104 67- 73 . .
. 50- 55 -70- 76
23 54 54
21,578 18,471 19,933 . 1,200 -
28,810 -14 576
6,430 16,520
468
I
920 1,522 1,249 -
200 . 1,405 -
l 355
1,072 4,620
468
920 l, 100-1,522 1, 039-1, 249
-zoo -
700-1,405 -
I 100-1 355
Flat Rock
180 459 468
34 12 17 -
5 -27 -
11
9 12 0
17,26 26 26 -26 -26 -26
9 9 0
22 22 23 -
10-15 --21
22
12 14 10
20 20 20 -
20· -20 -
22
10 11
Strasb11r1>-l
96 ... 84 20 18 3,350 1,120 40 avg 2 5 8 s 99 ••• 49 20 18 1,950 968 40 avg 1 . s 8 5
101. •• 78 20 18 3,200 1,600 40 avg l 5 8 s 103 ••• 59 2() 18 2,150 589 35 avg 3 5 8 5 104 ••• 60 15-20 15· 20 2,425 1,330 40 avg 1 9 8 6 106 ... 61 2() 18 2,350 1,380 40 avg 1 9 8 5 108 ••• 60 20 18 1,950 1,600 20-35 1 5 10 6 109 ... 51 20 12· 14 1,700 865 33 avg l 5 8 5-7 110 ••• 51 20 18 l, 750 360 32 avg 4 5 8 6 111.. 48 20 18 l 600 367 33 av<r 4 5 8 6
Strasburo:- 2
98 ••• 31 20 18 l,250 605 40.3 avg l 5 8 5 100 ••• 16 22·12 20- 10 475 475 25·35 0 0 8 5 102 ••• 16 10·20 8- 18 • 4.50 343 25·35 1 5 8 5 105 ... 42 4-20 4· 20 1,325 1,325 25-35 0 0 10 5 107 ... 42 6-20 6- 20 1 250 1.250 25-35 0 0 8 5 1 The length of the delay 11 conaidered to lHt uro if the ahot c0t11Uted of a .tngle hole, of one bole per delay• or of
multiple hole• per delay tied together vit:h detonating fuae.
v = K1,1Dll1,1, (4.14) where v = :Peak particle velocity,
D = travel distance, fJIJ = exponent of D or the slope of the
straight line through the jth set of data at the ith site,
and KIJ = velocity intercept at unit travel distance for the jth set of data at the ith site.
The subscript i denotes the site and varies from I to 6, whereas the subscript j denotes a test at a specific site and varies from l to ki. where k1
is the total number of tests at a site. Since each
W AUS&
~ test is treated separately at this point. there is no 1
charge weight term needed. The method of least squares was used to
determine the slope, intercept, and standard deviation of the data about the straight line representing the data. Because of the large amount ·~ of data, only the least-squared lines are shown in ~ figures 4.9 to 4.11 with the standard deviation 1 shown as a vertical line through the midpoint of ~ the data. i
An analysis of variance was performed on the l data to determine if sets of data, either by com· l ponent at each site or among sites, could be 1 pooled. The results showed that significant dif· i
j 1 -------

u • Ill
' c
>· !:: (,) 0 -I I.LI > w -I (,)
i= a:: ~ x <( I.LI Q.
8.0 6.0
4.0
2.0
1.0 .8 .6
.4
. 2
. I
4.0
2.0
1.0 .8 .6
. 4
.2
. I .08 .06
. 04
GENERATION AND PROPAGATION OF GROUND VIBRATIONS ROM BLASTING
• FLAT ROCK
A 0 0
v • • ... ...
Symbol Test a 75 A 78
(J 0 79
POUGHKEEPSIE Symbol Test
o.::. i:l 56 ... 63£ ... 63SE 0 64N
• 64£ I> 65N <l 65£ • 67
Symbol Test ... 45 c 46 A 50 0 51
• 52
• 54
Symbol Test STRASBURG-I o 96
Symbol Test (J 110 .t. 111
c 99 • IOI t:. 103 • 104 ... 106
108 109
STRASBURG-2
Symbol Test 0 98 c 100
• 102 t:. 105
• 107 . 02 _________ _.
I 2 4 s e 10 2 4 6 8 10 20 40 2 4 s e 10
DISTANCE, hundreds of fee1
Figure 4.9.-Peak particle velocity versus di.stance, radial component.
43
20
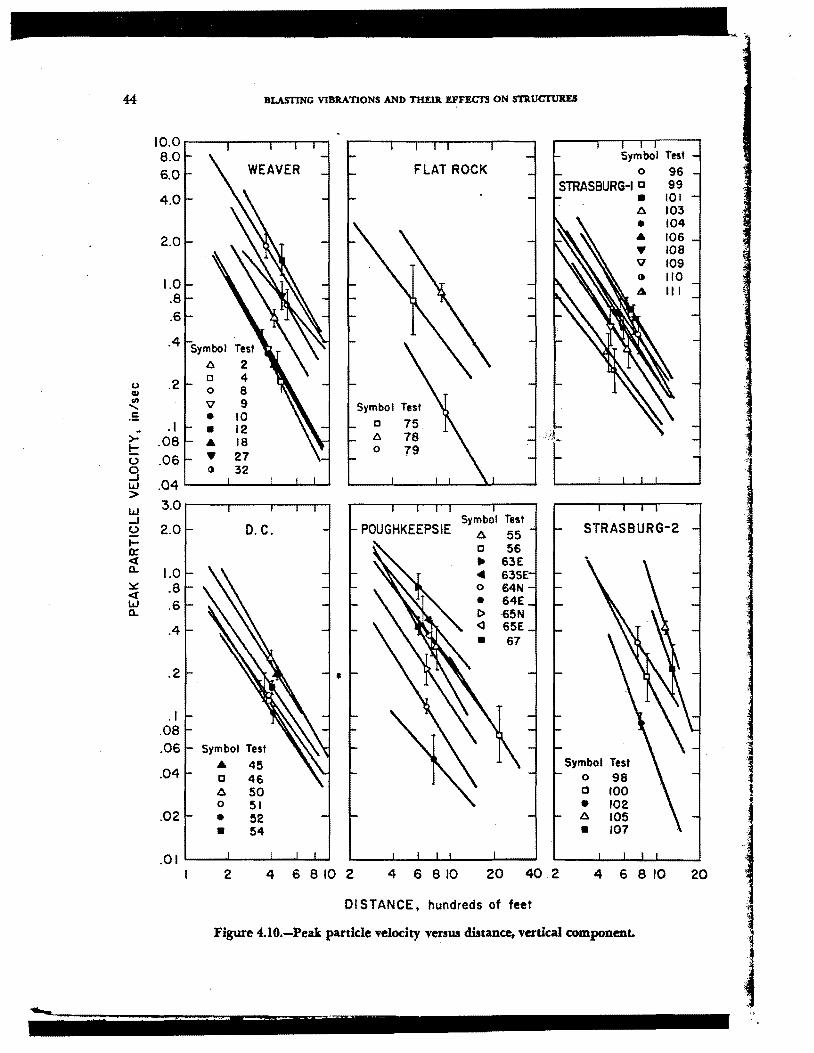
44
10.0 8.0 6.0
4.0
2.0
1.0 .8 .6
.4
(,) .2 Q) U) ..... . :
. I >- .08 !:: (,) . 06 g
.04 w > w 3.0 _. (,) 2.0 I-er. <( a.. 1.0 :::.:: .8 <( w .6 a..
.4
.2
. I .08 .06
. 04
. 02
. 01 I
BLASTING VIBRATIONS AND TilE1R EFFECTS ON STRUCTUllES
WEAVER FLAT ROCK
Symbol Test A 2 a 4 0 8
" 9 • 10
• 12
• 18 .. 27 <> 32
o.c.
Symbol Test
• 45 0 46 .0. 50 0 51 • 52 • 54
2 4
Symbol Test a 75 A 78 0 79
POUGHKEEPSIE
•
6 810 2 4 6 810
Symbol Test .0. 55 a 56 • 63E 4 63SE o 64N • 64E I> "65N <3 65E • 67
20 40 .2
DI STANCE. hundreds of feet
Symbol Tnt 0 96
STRASBURG-ID 99 • IOI .0. 103 • 104 • 106 .. 108 v 109
110 111
STRASBURG-2
Symbol Test 0 98 13 100 • 102 .0. 105 • 107
4 6 a 10
Figure 4.10.-Peak particle velocity venus distance, vertical component.
20
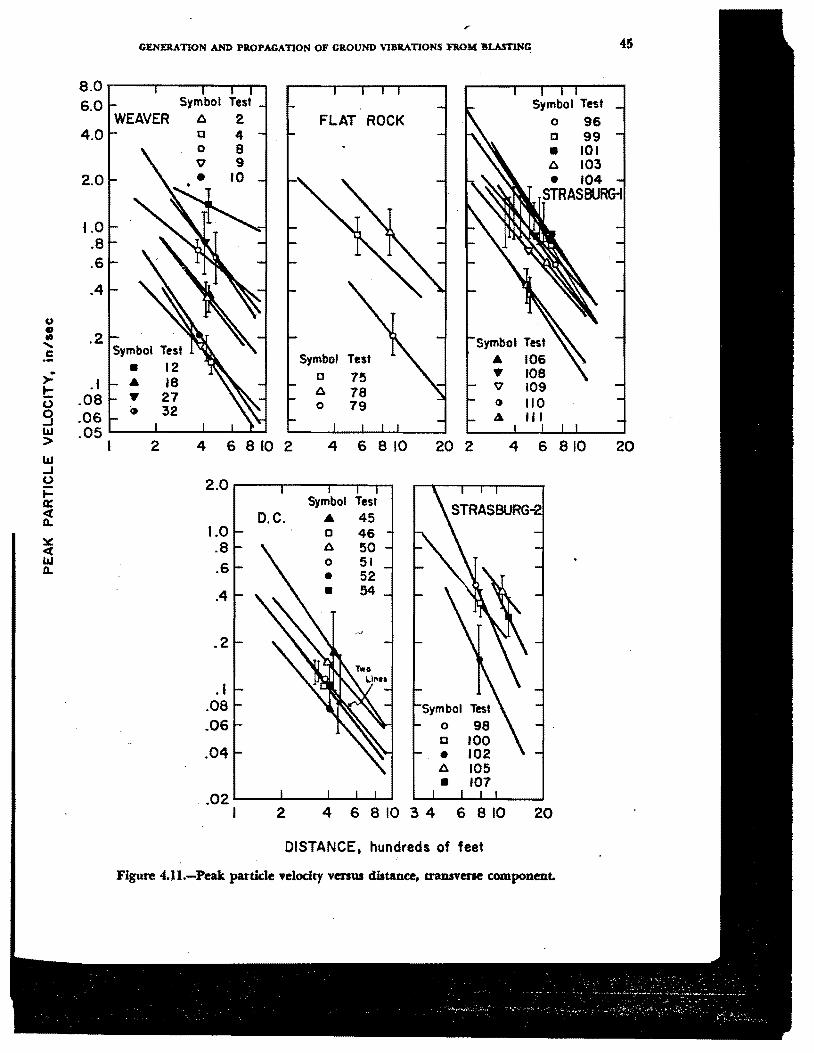
8.0 6.0
4.0
2.0
1.0 .a .6
.4
u C> • .2 ..... c ..
> . I t:: . 08 0 g .06 llJ .05 > I llJ ..J 0 I-0: ct 0..
::Iii:: ct llJ 0..
GENERATION AND PROPAGATION OF GROUND VIBRATIONS FROM BLASTING 45
Symbol Test Symbol Test WEAVER 6 2 FLAT ROCK 0 96
D 4 D 99 0 8 • 101 v 9 6 103
10 • 104 STRASBURG-I
Symbol Test
• 12 .& 18
• 27 GI 32
2
Symbol Test
4 6 810 2
2.0
1.0 .8 .6
. 4
.2
. I .08 .06
.04
D.C.
Symbol D
6 0
4
Symbol .& 0 6 0
• •
Test
75 78 79
6 a 10
Test 45 46 50 51 52 54
.02 ------------..........
20 2
Symbol Test
0 98 D 100 • 102 6 105 • 107
.&
• v <» &
I 2 4 6 8 10 3 4 6 8 10
DISTANCE, hundreds of feet
106 108 109 110 111
4 6
20
Figure 4.)1.-Peak. particle velocity versus distance, transverse componeuL
810 20

46 BLASTING VIBRATIONS AND THEIR EFF~ ON STRUCI'UllES
ferences existed and no pooling could be done. The results also showed that· there were no significant differences in the slopes for different tests at each site for each component. Thus an average slope, p1, was used for each component at each site. These average slopes are given in table 4.7.
Site Component .
Radial Vertical Transverse
Weaver ·······-·····-1.576 -1.766 -1.189 D.C ..................... -1.384 -1.548 -1.286 Poughkeepsie .... -1.431 Flat Rock ·······-· -1.255
-1.475 -1.497 -1.083
Strasburg-1 ...... -1.086 Strasburg-2 ...... -2.148
-1.548 -2.346
-1.389 -2.046
An analysis of variance test was performed on data from all sites grouped together by component to determine if significant differences in slope existed because of site effects. There was a significant difference in slope with site for radial and vertical components but not for the transverse component. Examination of the standard deviations on figures 4.9 to 4.11 indicates a greater spread in the data for the transverse component.
No attempt was made to combine these data beyond an average slope, p1• The intercepts, Ku, for each test were calculated using the average slope, p1, for each component at each site. Distances were determined in units of 100 feet to reduce the variance in the intercept and to reduce extrapolation. Therefore, the values of Ku represent the particle velocity at 100 feet and are summarized in table 4.8. This table and figures 4.9 to 4.11 show that .the level of vibration generally increases as cha"8e weight per jelay increases. Equation 4.14 can now be written as
v = KuDll, (4.15) where Dis now in units of 100 feet and p1 is the average slope of the j sets of data at the ith site.
Generalizing equation 4.15 gives v = Hi (D/Wu•) 111 (4.16)
where D =distance in units of 100 ft, W 1J = maximum charge weight per delay
for each test in units of I 00 pounds, and Hi= velocity intercept at D/W• = 1 for
all the tests at the ith site.
A comparison of equation 4.15 and 4.16 shows that the following relationship must exist:
Ku= H1Wu-•ll1. !,4.17)
--- -----~--·· ------~
• 8i ....
The relationship of equation 4.17 indicates that a log-log plot of the Ku intercept values versus Wu, charge weight per delay, should give a ·1· .. ·_
linear grouping of the data by site and com· ponent. Plots of these data, Ku versus WU• from table 4.8, are shown in figures 4.12A, 4.l~A. and
l 4.14A. Linear grouping of the data is obtained, I and furthermore, the data from each site group . independently indicating that the slope, af3i, and ;_ the intercept, H., are functions of site and com- ~ ponent. The values of af31 and H1 as determined ~ by the method of least squares are given in 1
table 4.8. i I
4 ~ l
l i
~ 100
A
;
! : 10
:5
Q
.4 ! 0.1 10 100
CHARGE ¥(EIGHT PER DELAY, 100 lb ~ -;
20
~ .. .... . 5
:::' ¥
1.0
10 100
CHARGE WEIGHT PER DELAY, 100 lb
8.0
~- l'
~ ;. II
~ -= 1.0 f; ¥ "~ ..
·'~
.3 1
0.1 10 100
CHARGE WEIGHT PER DELAY, 100 lb
Figure 4.12.-Particle velocity intercepts versus charge weight per delay, radial component.
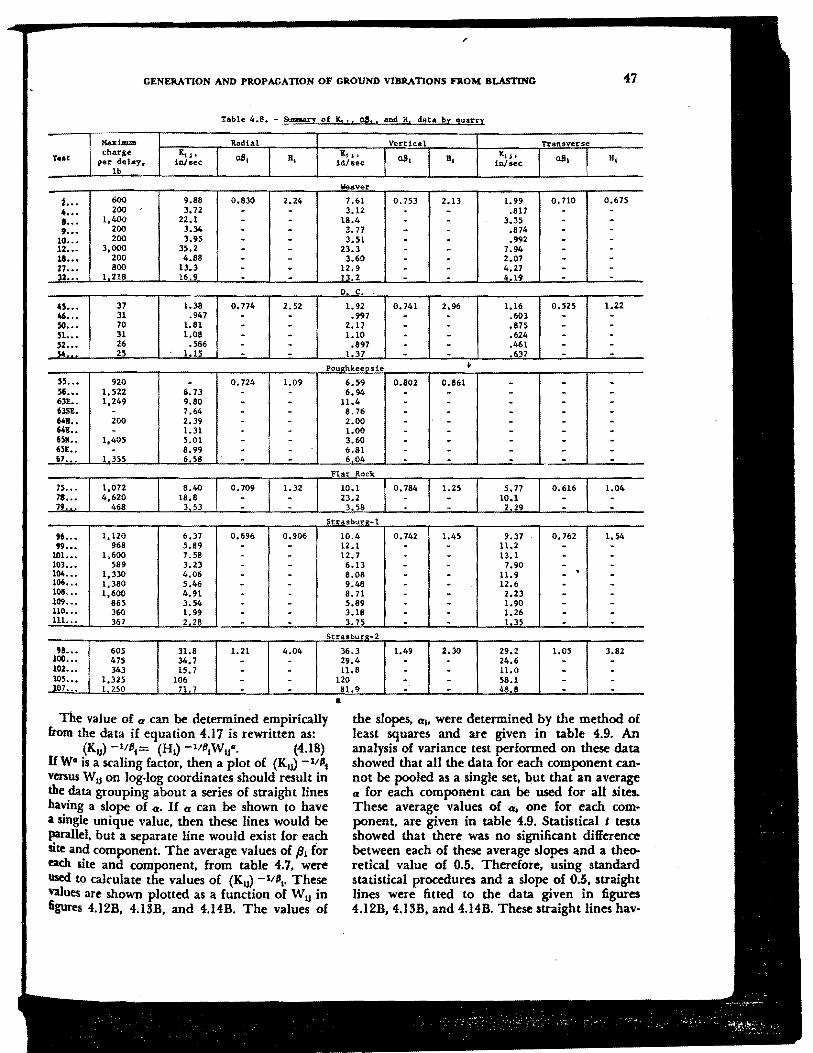
GENERATION AND PROPAGATION OF GROUND VIBRATIONS FR.OM BLASTING 47
Table 4.8. - Sunaav of !!., ! I aa. I and H, data by quarry
Maxima Radial Vertical Transverse
THt charge KtJ > I all1 I B, XsJ, I all, I H1 KaJ • I aS1 I H, per delay, in/sec id/sec in/sec
lb
Weaver
i ... 600 9.88 0.830 2.24 7 .61 0. 753 2.13 1.99 0,710 0.675 4 ••• 200 3. 72 - - 3.12 - - .817 - -e ••• 1,400 22.1 - - 18.4 - - 3.35 - -'··· 200 3.34 - - 3. 77 - - .874 - -
10 ... 200 3.95 - - 3.51 - - .992 - -12 ••• 3,000 35.2 - - 23.3 - - 7.94 - -18 ••• 200 4.88 - - 3.60 - - 2.07 - -21 ••• 800 13.3 - - 12,9 - - 4.27 - -32 ••• l 218 16 .9 - - 13.2 - - 4 19 - -
D C
45 ... 37 1.38 0.774 2.52 1.92 o. 741 2.96 1,16 0.525 1.22 46 ••• 31 .947 - - .997 - - .603 - -50 ••• 70 1.81 - - 2.17 - - .875 - -n ... 31 1,08 - - 1.10 - - .624 - -52 ••• 26 .586 - - .897 - - .461 - -"" 25 l 15 - - 1.37 - - 637 - -
Pou<>hkeeosie
55 •••
"··· 631! •• 63SI!. 64!1 •• 641! .. 6511 •• 651! •• 67 ••
75 ... 71 ... 79 ••
920 1,522 1,249
-200 -
1,405 -
l 355
1,072 4,620
468
-6. 73 9.80 7.64 2.39 1.31 5.01 8.99 6.58
8.40 18,8
3 53
o. 724 . -----. -
o. 709
1.09 . -------
1.32
6.59 6,94
11.4 8. 76 2.00 1.00 3.60 6.81 6,04
Flat Rock
10,l 23.2 3.58
0.802 0.861 - -- -- -- -- -- -- -- -o. 784 1,25
---------5. 77
10,l 2.29
---------0.616
------. --
1,04
Strasbun·l
96 ••• 1,120 6,37 0,696 0.906 10.4 0.742 1.45 9.37 0.762 1.54 99 ••• 968 5.89 - - 12.1 - - 11,2 - -
101. •• 1,600 7.58 - - 12.7 - - 13.1 - -103 ••• 589 3.23 - - 6.13 - - 7.90 - -104 ... 1,330 4.06 - - 8.08 - - 11.9 - . -106 ... 1,380 5.46 - - 9.48 - - 12.6 - -108 ••• 1,600 4.91 - - 8. 71 - - 2.23 - -109 ••• 865 3.54 - - 5.89 - - 1.90 - -uo ... 360 1.99 - - 3.18 - - 1.26 - -111 ••• 367 2.28 - - 3,75 - - l.35 - -
s 2 trasbura:·
98 ••• 605 31.8 1.21 4.04 100 ••• 475 34. 7 - -102 ••• 343 15.7 - -105 ••• 1,325 106 - -107 ••• l 250 71. 7 - -The value of a can be determined empirically
&om the data if equation 4.17 is rewritten as: (K1J) -11131= (H1) -11131w1Jo.· (4.18)
If Wo. is a scaling factor, then a plot of (Kt,) -1/llt
versus W IJ on log-log coordinates should result in the data grouping about a series of straight lines having a slope of a. If a can be shown to have a single unique value, then these lines would be ~llel, but a separate line would exist for each ate and component. The average values of p1 for each site and component, from table 4.7, were used to cakulate the values of (KIJ) -11111• These values are shown plotted as a function of W IJ in figures 4.12B, 4.Um, and 4.14B. The values of
36.3 1.49 2.30 29.2 1,05 3.82 29,4 - - 24.6 - -11.8 - - ll.O - -
120 - - 58.1 - -Rl,9 - - 48.8 - -..
the slopes, a 1, were determined by the method of least squares and are given in table 4.9. An analysis of variance test performed on these data showed that all the data for each component cannot be pooled as a single set, but that an average a for each component can be used for all sites. These average values of a. one for each component, are given in table 4.9. Statistical t tests showed that there was no significant difference between each of these average slopes and a theoretical value of 0.5. Therefore, using standard statistical procedures and a slope of 0.5, straight lines were fitted to the data given in figures 4.12B, 4.13B, and 4.14B. These straight lines hav-
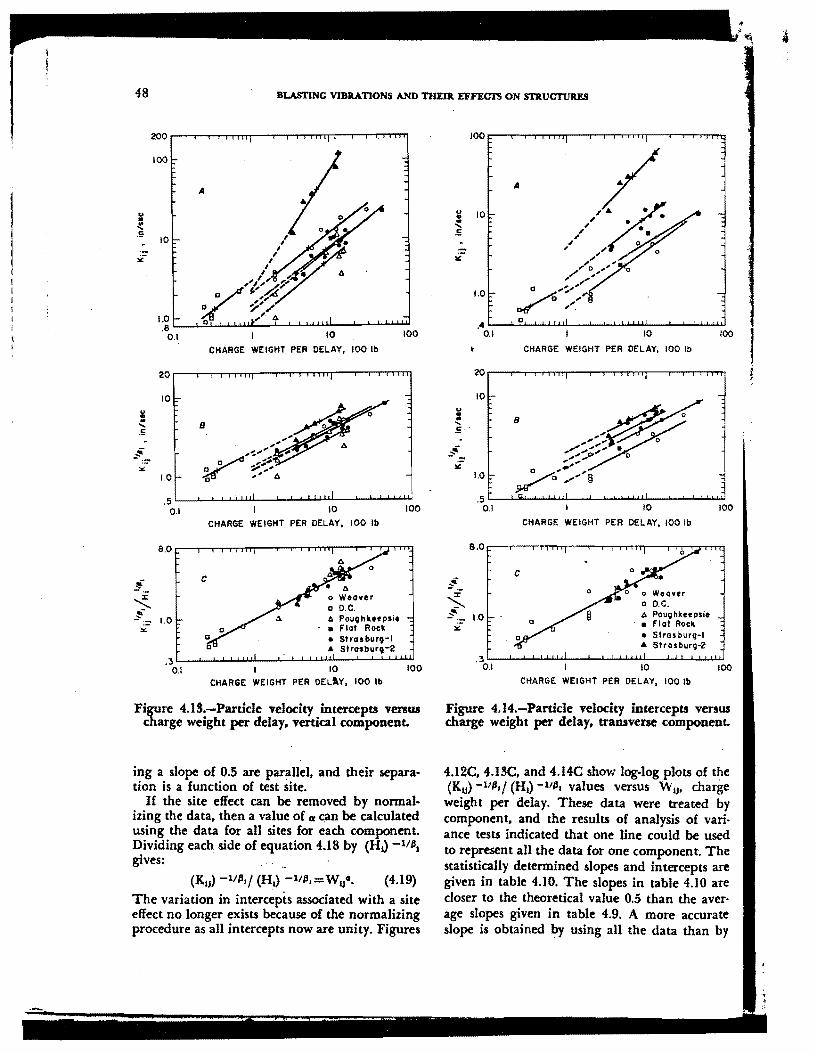
48 BLASTING VIBRATIONS AND THEIR. EFFECl'S ON STR.UCTUllES
200
100
A
u • .e: .5
.;e_-
1.0 .8
0.1 10 100
CHARGE WEIGHT PER DELAY, 100 lb
20
10
: ..... .5
~' "' 1.0
.5 0.1 10 100
CHARGE WEIGHT PER DELAY, 100 lb
8.0
c ~ • 6
~ o weaver o D.C.
§ 1.0 6 Pou9hkeepsie
"' • Flot Rock
.3 0.1 I 10 100
CHARGE WEIGHT PER OELJ.Y, 100 lb
Figure 4.13.-Pardcle velocity intercepts versus charge weight per delay, vertical component.
ing a slope of 0.5 are par11llel, and their separation is a function of test site.
If the site effect can be removed by normalizing the data, then a value of a c,an be calculated using the data for all sites for each component. Dividing each side of equation 4.18 by (HJ -111'1 gives:
(4.19)
The variation in intercepts associated with a site effect no longer exists because of the normalizing procedure as all intercepts now are unity. Figures
u
~ .5
.4 0.1 10 100
CHARGE WEIGHT PER DELAY, 100 lb
20
---~# u : 8 ..... .!:
~-/ ... "' ...
... ~.. 0
"' ...-:: .....
0 ....
~ ..... ...-9
I 10 100
CHARGE WEIGHT PER DELAY, 100 lb
e.o
c ::-' ~ ::::' 1.0 t> Pou11hkeepsie
· • Flot Rock "'
.3 0.1 10 100
CHARGE WEIGHT PER DELAY, 100 lb
Figure 4.14.-Particle velocity intercepts versus charge weight per delay, transverse component.
4.12C, 4.13C, and 4.14C show log-log plots of t~e (Ku) -11tt1/ (H1) -11111 values versus Wu. charge
weight per delay. These data were treated by component, and the results of analysis of vari· ance tests indicated that one line could be used to represent all the data for one component. The statistically determined slopes and intercepts are given in table 4.10. The slopes in table 4.JO are closer to the theoretical value 0.5 than the aver· age slopes given in table 4.9. A more accurate slope is obtained by using all the data than by
l
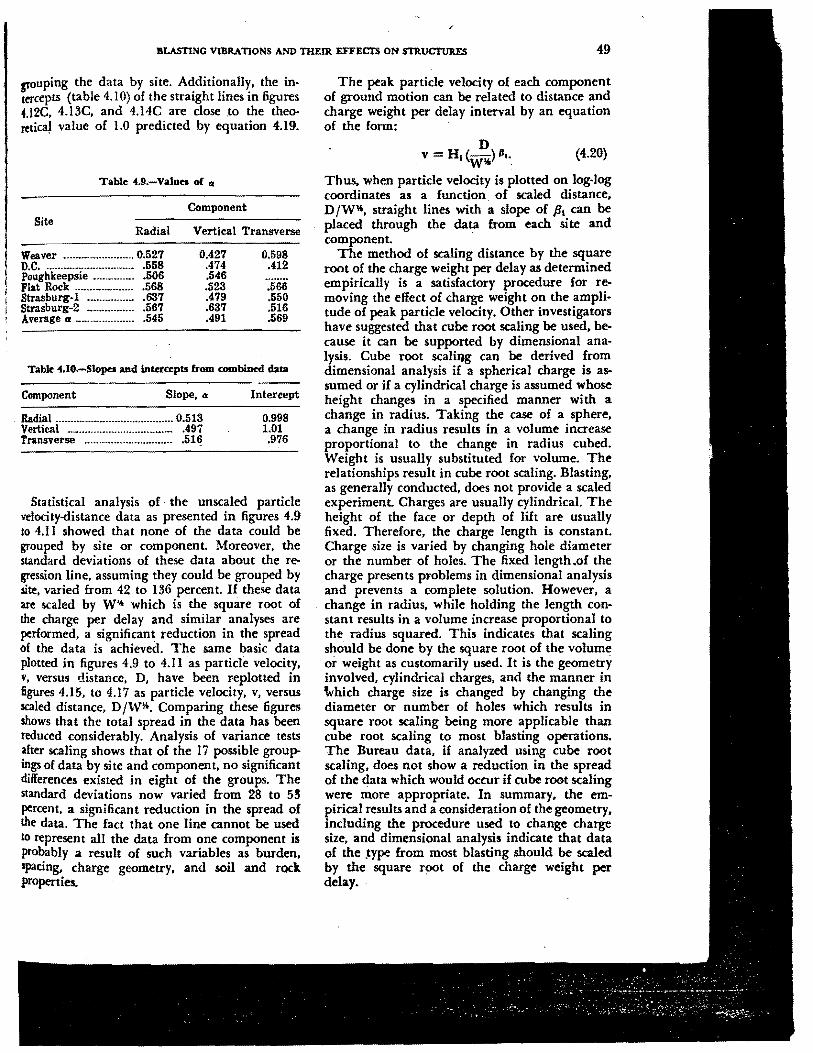
BLASTING VIBRATIONS AND THE.IR EFFECTS ON STRUCTUllES 49
grouping the data by site. Additionally, the intercepts (table 4.10) of the straight lines in figures U2C, 4.13C, and 4.14C are dose .to the theorctica~ value of 1.0 predicted by equation 4.19.
Table 4.9.-Valua of a
Component Site
Radial Vertical Transverse
Weaver ..... ~---·············· 0.527 D.C. ·······-······--······--····· .558 Poughkeepsie .............. .506 Flat Rock .................... .568 Strasburg-I ................ .637 Strasburg-2 ................ .567 Average 11 ..................... 545
0.427 .474 .546 .523 .479 .637 .491
0.598 .412
.566 .550 .516 .569
Table 4.10.-Slopcs and intercepts from combined data
Component Slope, a Intercept
Radial ........................................ 0.513 0.998 Vertical .................................... .497 1.01 Transverse .............................. .516 .976
Statistical analysis of· the unscaled particle velocity-distance data as presented in figures 4.9 to 4.I I showed that none of the data could be grouped by site or component. Moreover, the standard deviations of these data about the re· gression line, assuming they could be grouped by site, varied from 42 to 136 percent. 1£ these data are scaled by W"" which is the square root of the charge per delay and similar analyses are performed, a significant reduction in the spread of the data is achieved. The same basic data plotted in figures 4.9 to 4.11 as particle velocity, v, versus distance, D, have been replotted in figures 4.15, to 4.17 as particle velocity, v, versus scaled distance, D /W"". Comparing these figures shows that the total spread in the data has been reduced considerably. Analysis of variance tests after scaling shows that of the 17 possible grou}>' ings of data by site and component, no significant differences existed in eight of the groups. The standard deviations now varied from 28 to 5~ percent, a significant reduction in the spread of the data. The fact that one line cannot be used to represent all the data from one component is probably a result of such variables as burden, spacing, charge geometry, and soil and rock properties.
The peak particle velocity of each component of ground motion can be related to distance and charge weight per delay interval by an equation of the form: ·
D v = H1{-)111. Wli .
(4.20)
Thus, when particle velocity is plotted on log-log coordinates as a function. of scaled distance, D /Wli, straight lines with a slope of fl1 can be placed through the data from each site and component.
The method of scaling distance by the square root of the charge weight per delay as determined empirically is a satisfactory procedure for removing the effect of charge weight on the amplitude of peak particle velocity. Other investigators have suggested that cube root scaling be used, because it can be supported by dimensional analysis. Cube root scaliqg can be derived from dimensional analysis if a spherical charge is assumed or if a cylindrical charge is assumed whose height changes in a specified manner with a change in radius. Taking the case of a sphere, a change in radius results in a volume increase proportional to the change in .radius cubed. Weight is usually substituted for volume. The relationships result in cube root scaling. Blasting, as generally conducted, does not provide a scaled experiment. Charges are usually cylindrical. The height of the face or depth of lift are usually fixed. Therefore, the charge length is constant. Charge size is varied by changing hole diameter or the number of holes. The fixed length.of the charge presents problems in dimensional analysis and prevents a complete solution. However, a change in radius, while holding the Jength constant results in a volume increase proportional to the radius squared. This indicates that scaling should be done by the square root of the volume or weight as customarily used. It is the geometry involved, cylindrical charges, and the manner in tvhich charge size is changed by changing the diameter or number of holes which results in square root scaling being more applicable than cube root scaling to most blasting operations. The Bureau data, if analyzed using cube root scaling, does not show a reduction in the spread of the data which would occur if cube root scaling were more appropriate. In summary, the empirical results and a consideration of the geometry, including the procedure used to change charge size, and dimensional analysis indicate that data of the .type from most blasting should be scaled by the square root of the charge weight per delay ..
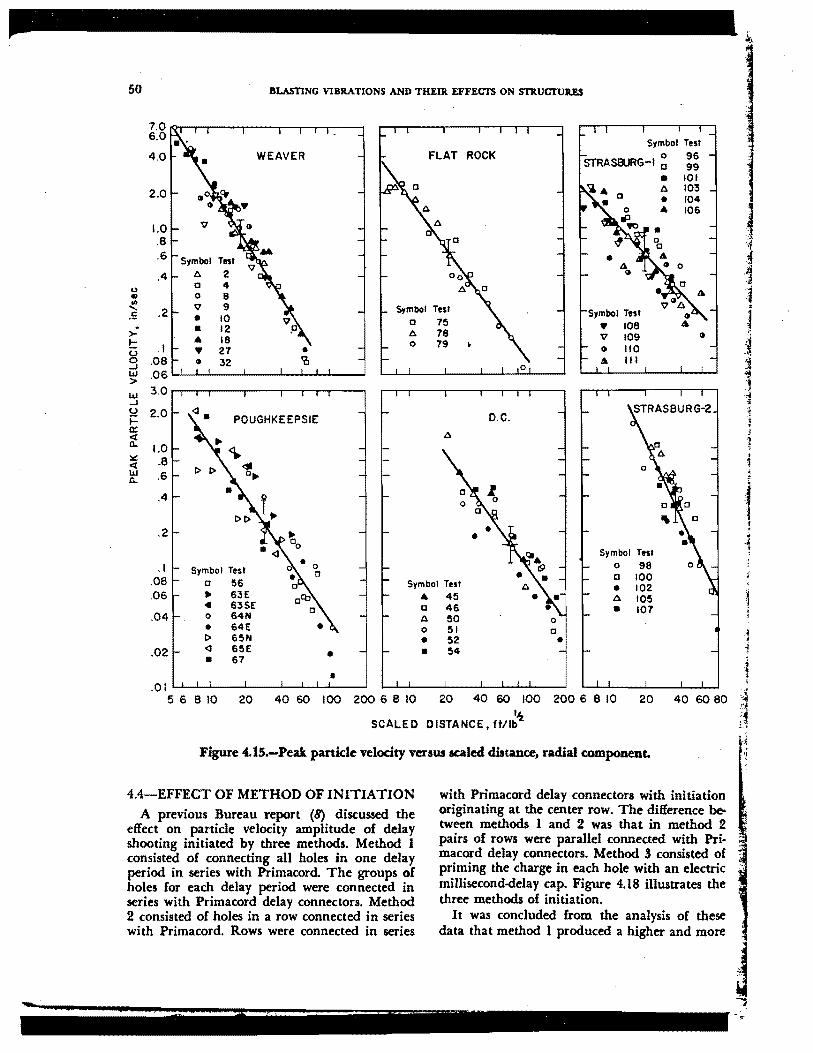
50
u ., II> ...... .5
>-!::: 0 g I.a.I > I.a.I ...J 0 i:: a:: <{ a. ~ <{ I.a.I a.
BLASTING VIBRATIONS AND THEIR. EFFECTS ON STJlUCJ:UR.ES
7.0 6.0
4.0
2.0
1.0 .8 .6
.4
.2
.I .08 .06 3.0
2.0
1.0 . 8 .6
.4
.2
.I .08 . 06
.04
.02
v
Symbol Test t:;. 2 0 4 0 8 v 9 • 10 • 12 • 18 ,, 27 I> 32
WEAVER
• 'ii
POUGHKEEPSIE
Symbol Test a 56
• 63E
• 63SE 0 64N
• 64E I> 65N <I 65E
• 67 • . 01 ._.__.._......_~___._~~.....__.__._..._~--'
FLAT ROCK
Symbol Tnt 0 75 t:;. 78 0 79
D.C.
•
Symbol Test
• 45 0 46 t:;. 50 0 0 51 0
• 52 • • 54
Symbol Test
STRASBURG-I 0 96 0 99 a IOI t:;. 103
0 • 104 • 106
•
S~mbol Test ,, 108 v 109 t) 110 A 111
Symbol Test 0 98 0 100
• 102 6 105 • 107
5 6 8 10 20 40 60 I 00 200 6 8 10 20 40 60 100 200 6 8 10 20
SCALED DISTANCE, ft/1~'2
Figure 4.15.-Pea.k particle velocity versus scaled distance, radial component.
4.4-EFFECT OF METHOD OF INITIATION with Primacord delay connectors with initiation originating at the center row. The difference between methods I and 2 was that in method 2 pairs of rows were parallel connected with Pri· macord delay connectors. Method S consisted of
• 1 ~
l f '
4
'I
A previous Bureau report (8) discussed the effect on particle velocity amplitude of delay shooting initia.ted by three methods. Method I consisted of connecting all holes in one delay period in series with Primacord. The groups of holes for each delay period were connected in series with Primacord delay connectors. Method 2 consisted of holes in a row connected in series with Primacord. Rows were connected in series
priming the charge in each hole with an electric , ..... millisecond-delay cap. Figure 4.18 illustrates the . three methods of initiation.
It was concluded from the analysis of these data that method 1 produced a higher and more
~ "'j
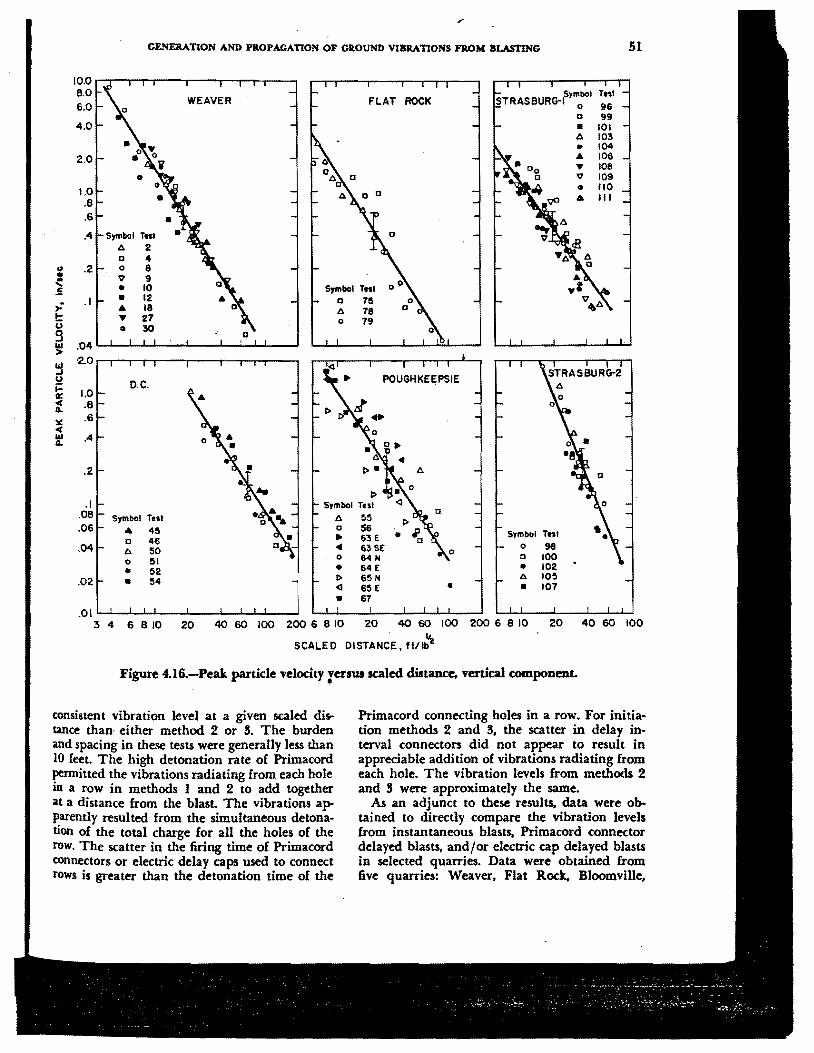
GENERATION AND PROPAGATION OF GROUND VIBRATIONS FROM BLASTING 51
10.0 8.0 6.0
WEAVER FLAT ROCK Symbol THI
STRASBURG-I 0 96 ti 99
4.0 • IOI l'J. 103 • 104
2.0 • 106 ,, 108 ., 109
1.0 .8
• 110 at. Ill
.6
.4 Symbol THI l'J. 2 ti 4
0 .2 : 0 8 v 9
' .5 • 10 SJftlbol Test
.,: . I
!:: u g I.I.I .04 >
• 12 ti 75 • 18 l'J. 78 ,, 27 0 79 • 30
~ ·2.0
~ ,... 1.0 a:
o.c. POUGHKEEPSIE
c .8 Q.
~ .6
c I.I.I .4 Q.
.2 l'J.
C> .I Symbol THI
.08 Symbol Test l'J. 55
.06
.04
.02
• 45 0 56 Symbol THI 46 .. 63 E • 0
l'J. 50 .. 63SE 0 98
0 51 0 64 N 0 100
• 52 • 64E • 102
• 54 C> 65N l'J. 105 <I 65E • • 107
• 67 . 01 .......... ~---........ ~~"--~_.__.__,_..._~_,
3 4 6 8 10 20 40 60 IOO 200 6 8 10 20 40 60 100 200 6 8 10 20 40 60 100
SCALED DISTANCE, ftllb"z
Figure 4.16.-Peak particle velocity versus scaled distance, vertical componenL '
consistent vibration level at a given scaled distance than· either method 2 or S. The burden and spacing in these tests were generally less than 10 feet. The high detonation rate of Primacord permitted the vibrations radiating from each hole in a row in methods I and 2 to add together at a distance from the blast. The vibrations apparently resulted from the simultaneous detonation of the total charge for all the holes of the row. The scatter in the firing time of Primacord connectors or electric delay caps used to connect rows is greater than the detonation time of the
Primacord connecting holes in a row. For initia· tion methods 2 and S, the scatter in delay interval connectors did not appear to result in appreciable addition of vibrations radiating from each hole. The vibration levels from methods 2 and S were approximately the same.
As an adjunct to these results, data were obtained to directly compare the vibration levels from instantaneous blasts, Primacord connector delayed blasts, and/or electric cap delayed blasts in selected quarries. Data were obtained from five quarries: Weaver, Flat Rock, Bloomville.
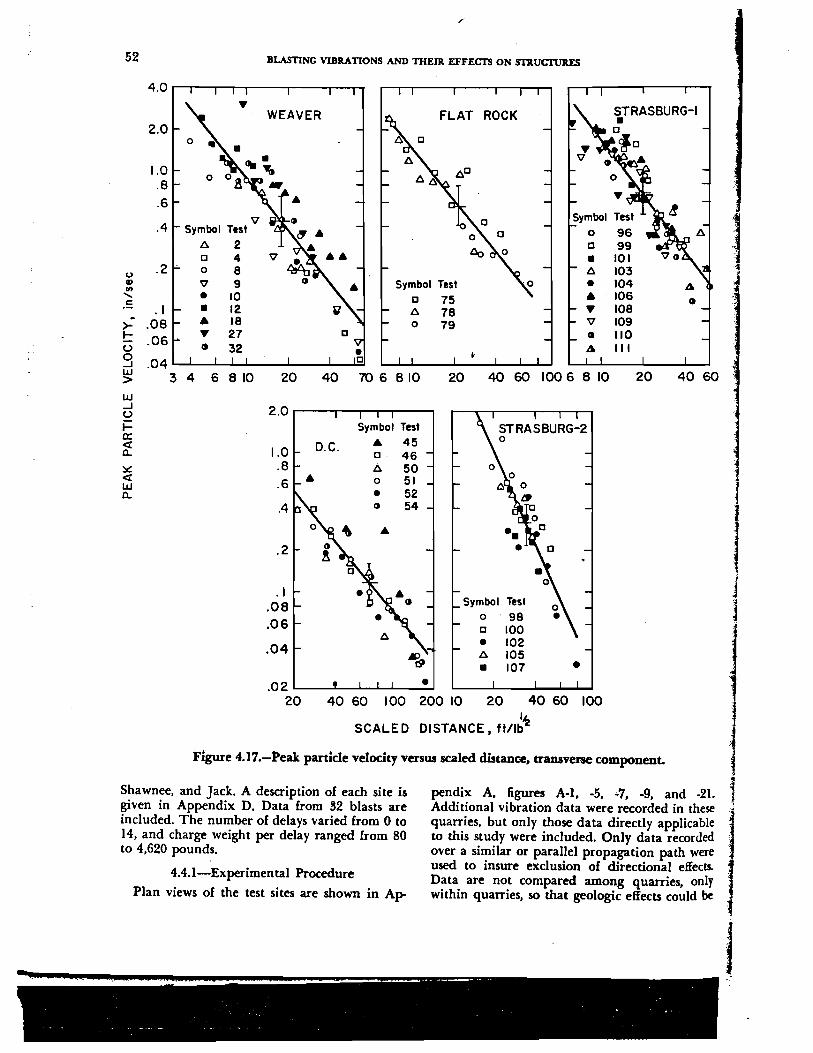
52
u CD .,,
...... c
->I-u g
2.0
1.0 .8 .6
.4
.2 .
. I .08 .06
.04
0
0
Symbol Test
6 2 a 4 0 8 'il 9 • 10 • 12
• 18
• 27 Cl 32
'il
BLASTING VIBllATIONS AND THEIR EFFEcrs ON S'IllUCTUJlES
WEAVER FLAT ROCK
Symbol
• a
Symbol Test
D 75 6 78 0 79
0
D
• 6
• • • 'il Cl
.&
STRASBURG-I • D
fa
Test
96 99
101 103 104 106 108
Cl
109 110 111
~ 3 4 6 8 10 20 40 70 6 810 20 40 60 100 6 8 10 20 40 60 .
w ...J u ~ 0:: ~ a.. :::.:: ~ w a..
2.0
1.0 . 8 .6
.4
. 2
. I .08 .06
.04
D.C.
•
Symbol Test
• 45 a . 46 6 50 0 51 • 52 0 54
•
Symbol Test 0 - 98 a 100 • 102 6 105 • 107 •
J
I l ! j
.0 2 ...._ _ __.,_.....__~--·- 1 20 40 60 I 00 200 10 20 40 60 100
1 SCALED DISTANCE, ft/I~~
F1gure 4.17.-Peak particle velocity vcnus scaled distance, transverse component.
Shawnee, and Jack. A description of each site is given in Appendix D. Data from 32 blasts are included. The number of delays varied from 0 to 14, and charge weight per delay ranged from 80 to 4,620 pounds.
4.4.1-Experimental Procedure
Plan views of the test sites are shown in Ap-
~ i ...
pendix A, figures A-1, -5, -7, -9, and -21. Additional vibration data were recorded in these quarries, but only those data directly applicable to this study were included. Only data recorded over a similar or parallel propagation path were used to insure exclusion of directional effects. Data are not compared among quarries. only within quarries, so that geologic effects could be l
j - --~"'- ·-----···
. .. - . .. . -- . ~
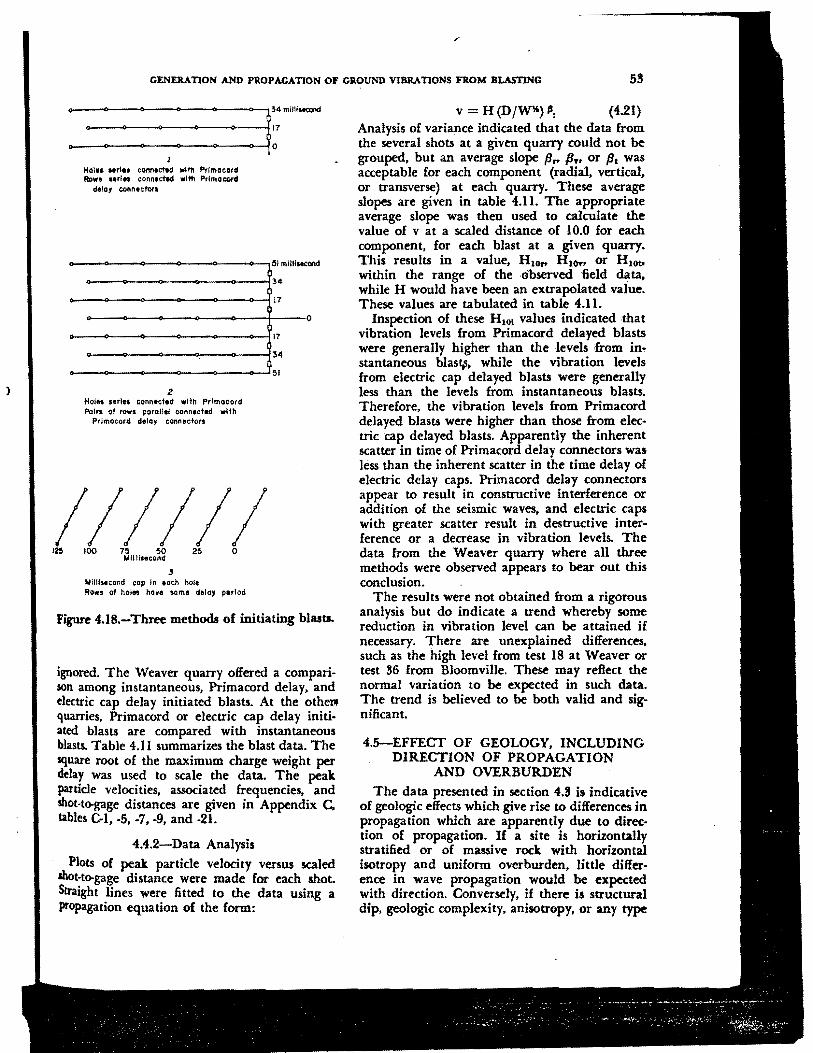
}
r
GENERATION AND PROPAGATION OF GROUND VIBRATIONS FROM BLASTING 53
Hoitt serl.. connectild wittl Prlmacord Rows serl 11 connected with Prim a cord
delay connecn:.r.
_______ .__ ___ _,,_ __ .,__,~I millisecond
2 Hol11 series connecled with Prlmacord Pairs of rows porallel connected with
Prlmocord delay connectors
////// 12!1 100 75 50 25 0
Mllllsecond
J Millisecond cap In each hole Rows of holes have some delay period
Figure 4.18.-Three methods of initiating bluts.
ignored. The Weaver quarry offered a comparison among instantaneous, Primacord delay, and electric cap delay initiated blasts. At the othel1' quarries, Primacord or electric cap delay initiated blasts are compared with instantaneous blasts. Table 4.11 summarizes the blast data. The tquare root of the maximum charge weight per delay was used to scale the data. The peak particle velocities, associated frequencies, and shot-to-gage distances are given in Appendix C, tables C-1, -5, -7, -9, and -21.
4.4.2-Data Analysis
Plots of peak particle velocity versus scaled shot-to-gage distance were made for each shot. Straight lines were fitted to the data using a propagation equation of the form:
v = H (D /W*') "= (4.21) Analysis of variance indicated that the data from the several shots at a given quarry could not be grouped, but an average slope p.,. fJT• or Pt was acceptable for each component (radial, vertical, or transverse) at each quarry. These average slopes are given in table 4.11. The appropriate average slope was then used to calculate the value of v at a scaled distance of 10.0 for each component, for each blast at a given quarry. This results in a value, H 1°" H 1o..-. or H 1ov within the range of the observed field data, while H would have been an extrapolated value. These values are tabulated in table 4.11.
Inspection of these H 101 values indicated that vibration levels from Primacord delayed blasts were generally higher than the levels ;from instantaneous bias~, while the vibration levels from electric cap delayed blasts were generally less than the levels from instantaneous blasts. Therefore, the vibration levels from Primacord delayed blasts were higher than those from electric cap delayed blasts. Apparently the inherent scatter in time of Primacord delay connectors was Jess than the inherent scatter in the time delay of electric delay caps. Primacord delay connectors appear to result in constructive interference or addition of the seismic waves, and electric caps with greater scatter result in destructive interference or a decrease in vibration levels. The data from the Weaver quarry where all three methods were observed appears to bear out this conclusion.
The resu1ts were not obtained from a rigorous analysis but do indicate a trend whereby some reduction in vibration level can be attained if necessary. There are unexplained differences, such as the high level from test 18 at Weaver or test S6 from BJoomville. These may reflect the normal variation to be expected in such data. The trend is believed to be both valid and significant.
4.5-EFFECT OF GEOLOGY, INCLUDING DIRECTION OF PROPAGATION
AND OVERBURDEN
The data presented in section 4.!J is indicative of geologic effects which give rise to differences in propagation which are apparently due to direction of propagation. If a site is horizontally stratified or of massive rock with horizontal isotropy and uniform overburden, little difference in wave propagation would be expected with direction. Conversely, if there is structural dip, geologic complexity, anisotropy, or any type
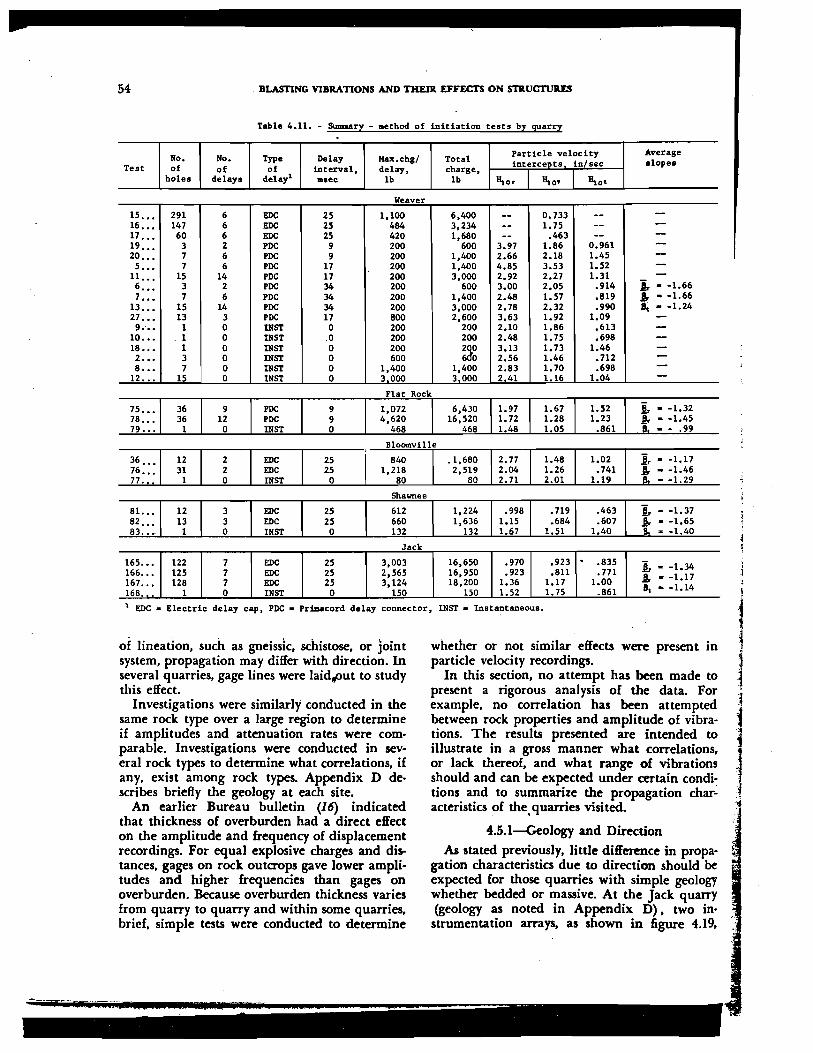
54 . BLASTING VIBRATIONS AND THEIR EFFECTS ON STRUCTUllES
Table 4.11. - Summary - method of initiation tests by quarry
Ho. !lo. Type Delay Max.chg/ Total Particle velocity Average
Test of of of interval, delay, charge, intercepts. in/sec •lopes
holes delays delay1 msec lb lb Bio• I Bio• I Bio• Weaver
15 ••• 291 6 EDC 25 1,100 6,400 -- o. 733 -- -16 ••• 147 6 EDC 25 484 3,234 -- 1.75 -- -17 ••• 60 6 EDC 25 420 1,680 -- .463 -- -19 ••• 3 2 PDC 9 200 600 3.97 1.86 0.961 -20 ••• 7 6 PDC 9 200 1,400 2.66 2.18 1.45 -5 ••• 7 6 PDC 17 200 1,400 4.85 3.53 1.52 -
11 ••• 15 14 PDC 17 200 3,000 2.92 2.27 1.31 -6 ••• 3 2 PDC 34 200 600 3.00 2.05 .914 j. - -1.66 7 ••• 7 6 PDC 34 200 1,400 2.48 1.57 .819 Ar - -1.66
13 ••• 15 14 PDC 34 200 3,000 2.78 2.32 .990 ~ - -1.24 27 ••• 13 3 PDC 17 800 2,600 3.63 1.92 1.09 -9.· •• 1 0 IHST 0 200 200 2.10 1.86 .613 -
10 ••• - 1 0 DIST 0 200 200 2.48 1.75 .698 -18 ••• 1 0 DIST 0 200 ~g 3.13 1.73 1.46 -2 ••• 3 0 IHST 0 600 2.56 1.46 .712 -8 ••• 7 0 DIST 0 1,400 1,400 2.83 1.70 .698 -
12 ••• 15 0 DIST 0 3 000 3.000 2.41 1.16 1.04 -Plat Rock
75 ••• 36 9 PDC 9 1,072 6,430 1.97 1.67 1.52 j, - -1.32 78 ••• 36 12 PDC 9 4,620 16,520 1. 72 1.28 1.23 J. - -1.45 79 ••• 1 0 INST 0 468 468 1.48 1.05 .861 -- .99
Bloomville
36 ••• 12 2 EDC 25 840 . 1,680 2. 77 1.48 1.02 L - -1.17 76 ••• 31 2 EDC 25 1,218 2,519 2.04 1.26 .741 J. - -1.46 77. 1 0 INST 0 80 80 2. 71 2.01 1.19 - -1. 29
Shawnee
81. •• 12 3 EDC 25 612 1,224 .998 • 719 .463 L - -1.37 82 ••• 13 3 EDC 25 660 1,636 1.15 .684 .607 .ft. - -1.65 83 •••. 1 0 I!IST 0 132 132 1.67 1.51 1.40 - -1.40
Jack
165 ••• 122 7 EDC 25 3,003 16,650 .970 .923 . .835 L - -1.34 166 ••• 125 7 EDC 25 2,565 16,950 .923 .811 .771 J. - -1.17 167 ••• 128 7 EDC 25 3,124 18,200 1.36 1.17 1.00 168 •. 1 0 INST 0 150 150 1.52 1.75 .861 s, - -1.14
1 EDC • Electric delay cap, PDC • Prilllacord delay connector, INST• Insta~taneous.
of lineation, such as gneissic, schistose, or joint system, propagation may differ with direction. In several quarries, gage lines were laid,put to study this effect.
Investigations were similarly conducted in the same rock type over a large region to determine if amplitudes and attenuation rates were comparable. Investigations were conducted in several rock types to determine what correlations, if any, exist among rock types. Appendix D de· scribes briefly the geology at each site.
An earlier Bureau bulletin (16) indicated that thickness of overburden had a direct effect on the amplitude and frequency of displacement recordings. For equal explosive charges and distances, gages on rock outcrops gave lower amplitudes and higher frequencies than gages on overburden. Because overburden thickness varies from quarry to quarry and within some quarries, brief, simple tests were conducted to determine
whether or not similar effects were present in particle velocity recordings.
In this section, no attempt has been made to present a rigorous analysis of the data. For example, no correlation has been attempted between rock properties and amplitude of vibra· tions. The results presented are intended to illustrate in a gross manner what correlations, or lack thereof, and what range of vibrations should and can be expected under certain condi: tions and to summarize the propagation characteristics of the.quarries visited.
4.5.1-Geology and Direction
As stated previously, little difference in propagation characteristics due to direction should be expected for those quarries with simple geology whether bedded or massive. At the Jack quarry (geology as noted in Appendix D) , two in
strumentation arrays, as shown in figure 4.19,

GENERATION AND PllOPAGATION OF GROUND VIBRATIONS FltOM BLASTING 55
~l.O ~o.a II.I > .6
~ ~ .4
f ~ 2 II.I a.
.I
Array I _.
Jock Quarry Radial
~2: Ci)
Ci)
Transverse
.OB4~~6---'Br-.ll0~--2""0---4""0 4 6 8 10 20 40 4!:-~6~8!--'10~-.....i20~-li>-· 4""0 SCALED DISTANCE, ft/lbltz
Figure 4.19.-EJlect of direction, Jack Quarry. peak particle velocity versus scaled distance.
were located 50° apart. In the inset, vertically up is north. Regression lines through the data for arrays I and 2 are shown. The heavy line indi· cates a pooled regression line representing all the data. The vertical lines represent the standard deviation of the data about the line. The varia· tion in amplitude and attenuation (slope) between arrays I and 2 is small and can be ignored. Similar results would be expected in the data from the limestone and dolomite quarries in Iowa and Ohio. At Bellevue and at Ferguson, no . appreciable difference in the data from gage arrays in two or more orientations was noted.
At Culpeper and at Webster City, there was a distinct difference in amplitude but not in at· tenuation with direction. The data from Cul- • peper are shown in figure 4.20. Although the geology is less complex at Webster City, data obtained in two directions there resemble those at Culpeper.
Data from the Strasburg and Centreville quar· ries displayed the most variation with direction. Strasburg data, treated separately in section 4.5, represent differences which are probably at· tributable to orientation with respect to strike and dip of dipping beds. In a diabase at Centreville, variation in the radial component (figure 4.21) was as great as at Strasburg. Less variation was noted in the vertical and transverse com·
ponents in the diabase. Directional effects in a diabase mass are probably due to anisotropy and/or jointing. In the diabase at the Manassas and West Nyack quarries, data from three direc· tions show little variation. Therefore, variation with direction is not necessarily expected in diabase quarries. However, a fourth lirre at West Nyack, intermediate in direction with the other three lines. was of considerably lower amplitude, possibly being separated from the blast by major faulting or joints.
Variation with direction due to geology may be large or small. Such variation is not predictable; West Nyack, with little, and Centreville, with large variations, are both diabases. Ferguson, in a ftat·lying limestone showed relatively large varia· tion. The primary conclusion that can be drawn is that generalizations cannot be made with reference to the effect of geology in the grossest sense on propagation variations with direction either within or among quarries.
4.5.2-Effect of Rock Type on Vibration Levels
Investigations were conducted in the following rock types: limestone, dolomite, diabase, granitetype, sandstone, and a quartz-sericite schist. Data from similar rock types have been combined. The limestones and dolomites have been grouped together. The granite-type rocks included

56 BLASTING VIBRATIONS AND THEIR. EFFECTS ON STKUCI'URE.S
.... "
.023L-'4i......1.6--IOi....-""'20--40"'-_.60 _ _.I00.__200_. 3 4 6 10 20 40 60 100 200 3 4 6 IO 20 40 60 100 200
SCALED DISTANCE, lt/lb'ft
Figure 4.20.-Effect of direction. Culpeper Quarry. peak particle v.:locity versus scaled distance.
6.
4.
z.o .; .. .. "' .5 1.0 )!' I- 0.8 u 0 .6 ..J IU > IU .4 ..J u ~ a: if .z lie:
"' IU 0..
Centreville Quarry · Radial
Array I •
• Vertlcol
6 IO ZO 40 60
SCALED DISTANCE, ftllb'fa
Figure 4.21.-Effect of direction, Centreville Quarry, peak particle velocity versus scaled distance.
granite-gneisses, a granite-diorite, and a gneissic diorite. The data from the quartz·sericite schist were grouped with the data from the granite-type rocks.
The data from tests in 12 limestone or dolomite quarries are shown combined in figure 4.22.
The data collectively show a scatter of almost a factor of 5. In figures 4.22 to 4.25 the dash lines represent the envelope of data points fro all quarries instrumented. Both lowest and high est amplitudes were observed in limestone an dolomites.
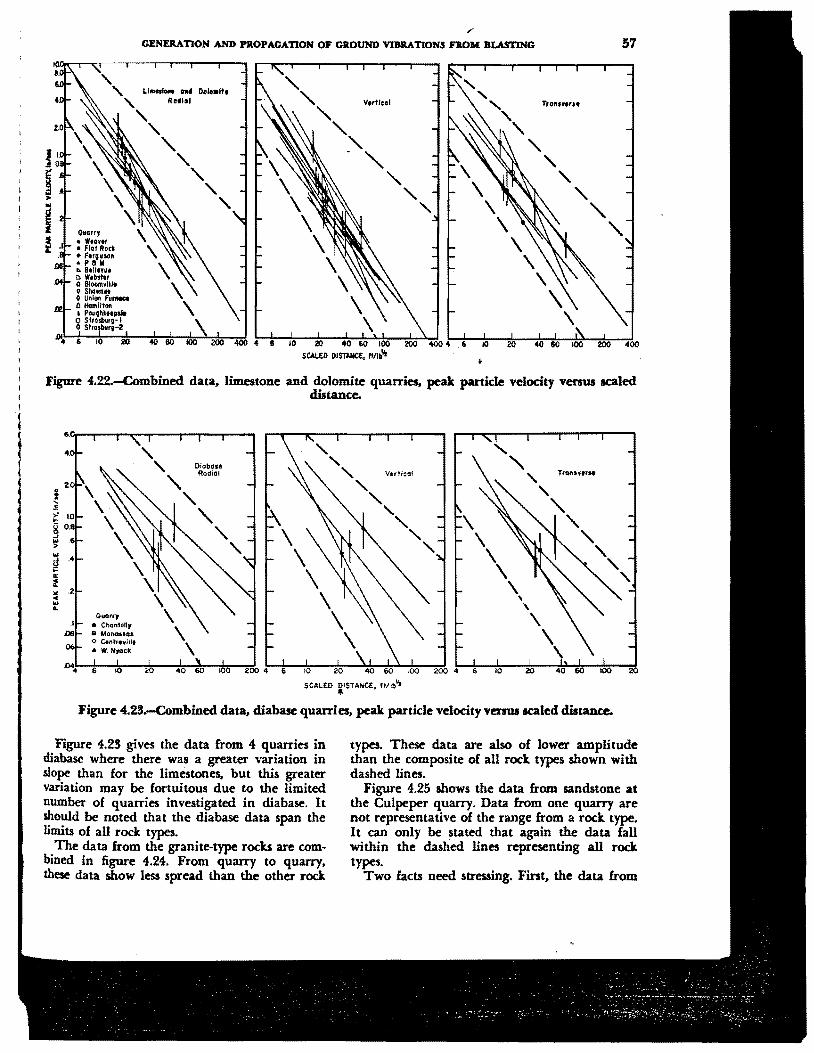
GENERATION AND PROPAGATION OF GROUND VIBllATIONS FROM BLASTING 57
Quarry • Wtovtr • Flot Rot* • Ftrv•so• • P 8 II 0. BtlltYut t> Wtbt!tr o 81oomvlll• o SllGonn 0 Uni'"' Fu,_
fR ~ ::':~~~ ..... ~ ~g:t;::~
LI•- IHHI Dclc•ltt Ro~lol ' ' '
\ \
\
' ' Tron•"''*
" ' ' \ " ' '\.
\ \.
\ \
\ IO 20 40 60 100 200 400
• Figure 4.22.-Combined data, limestone and dolomite quarries, peak particle velocity versus scaled
distance.
.. ~ .4
II:
i "' .2 c .. ..
.I .oe
\ \
\ \ \
\ \
\ Querry
• ChontiUy a Monouos G Centre•illt • W. Nyock
\
D44 6 IO 20
\ \
40 60 IOO 200 4 6 10 20 2004 6 10 20
SCALED i'STANCE, ltllb\fr
Figure 4.23.-Combined data, diabase quarries, peak particle velocity versus scaled distance.
Figure 4.2S gives the data from 4 quarries in diabase where there was a greater variation in slope than for the limestones, but this greater variation may be fortuitous due to the limited number of quarries investigated in diabase. It should be noted that the diabase data span the limits of all rock types.
The data from the granite-type rocks are combined in figure 4.24. From quarry to quarry, these data show less spread than the other rock
· types. These data are also of lower amplitude than the composite of all rock types shown with dashed lines.
Figure 4.25 shows the data from sandstone at the Culpeper quarry. Data from one quarry are not representative of the range from a rock type. It can only be stated that again the data fall within the dashed lines representing all rock types.
Two facts need stressing. Fint, the data from
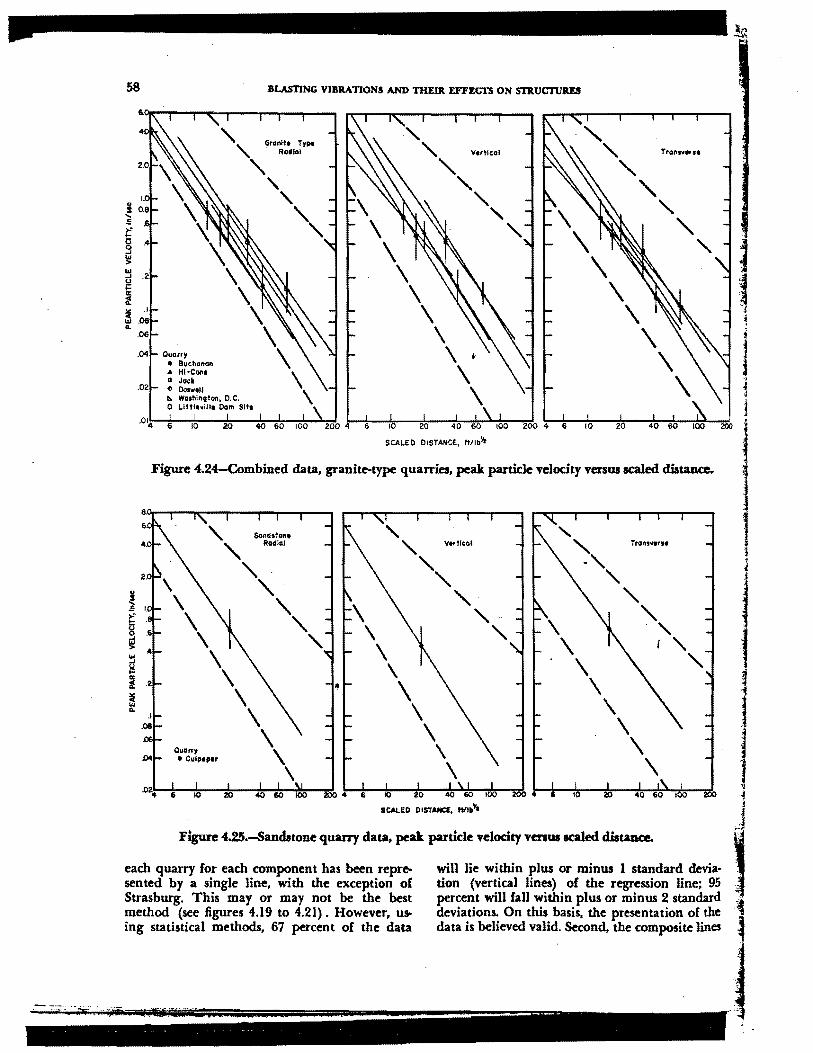
58 BLASTING VIBRATIONS AND THEill EFFECI'S ON STRUCTURES
... Q .2
Ii: f .. .I ~ .08 "-
.06
.04 Quarry • Buchanan " Hl•Cont a Jock
.02 ~ [)(!swell b. Washington, O. C. 0 Littlt•lllt Dom Site
10 40 60 100 200 4 6 10 20 40 60 100 200 4 6 10
SCALED OISTAllCE, It/lb\;
20 40 60 100 200
Figure 4.24-Combined data, granite-type quarries, peak particle velocity versus scaled distance..
.I
.oe
'\. Sandstone
' Radial
' ' ' ' '
Figure 4.25.-Sandstone quarry data, peak particle velocity Tenus scaled distance.
each quarry for each component has been represented by a single line, with the exception of Strasburg. This may or may not be the best method (see figures 4.19 to 4.21). However, using statistical methods, 67 percent of the data
will lie within plus or minus 1 standard devia· lion (vertical lines) of the regression line; 95 percent will fall within plus or minus 2 standard deviations. On this basis, the presentation of the data is believed valid. Second, the composite lines
·- ~-- --- -- -- ------ . . - ' ..

GENERATION AND PJlOPAGATION OF GllOUND VIBRATIONS FllOM BLASTING 59
for all rock types as shown by the dashed lines in figures 4.22 to 4.25 represent more than 99 percent of the data obtained. This does not mean that all data from all quarries would fall be· iween these lines, but most data wouldbe expected to lie within these limits.
4.5.J--Overburden
Several tests were conducted to determine the effect of overburden on particle velocity ampli· tude. The results in all cases showed no effect on amplitude. Figure . 4.26 is typical of the results. The filled-in symbols represent gage stations on bedrock or with less overburden. The open sym·
I bols represent gage stations on overburden. At
I
the Webster City quarry, stations 5 and 6 were placed at the bottom of a valley and had M feet
t Jess overburden. At the Bellevue quarry, stations 1 l, 2, and !I were on bedrock, and the balance t of the stations were on 10 feet of overburden. In : both cases, regression lines were fitted to the data 1 omitting the stations with less or no overburden. I · It is concluded for the tests shown that no 1 amplification of particle velocity amplitude ocf curs due to presence or absence of overburden.
I
t 2.0.---..,....---.,,_--'""'T"--..... ---I
1.0 0.8 I l .6
I ! f ~ i ~ 2
~ (,) .! ~ ~ 0 I ! . s l ~ .06
<(
r· ~ .04 f'
.02
• Webster Cityl Normal • Bellevue J overburden
• Webster Cltyl Thin or no • Bellevue J overburden
•01, .. o--2 ... 0 ___ 40,,__60..___, .... 00---200"----'400
SCALED DISTANCE, ft/lblt
I. Figure 4.26.-Effect of overburden, peak particle ' velocity venw ICaled distance.
~
"' ~
However, other effects are observed. The initial particle velocity pulse arrives proportion· ately earlier at stat~ons on little or no bedrock by an amount attributable to the missing over.burden. The frequency of vibration with less overburden is two or three times that recorded on thicker overburden. Displacements obtained by integration of particle velocity are one-half to one-third the level expected if the overburden thickness had been uniform. These results are in general agreement with the conclusions of Thoenen and Windes (16). Displacements are higher and frequencies are lower on thick. overburden. These changes are such that the resulting particle velocity is not appreciably affected.
4.6-APPUCATION OF FOURIER ANALYSIS TECHNIQUES TO
VIBRATION DATA
The development and utilization of high-speed electronic digital computers has brought about the widespread application of Fourier techniques to all types of seismicdata. The Fourier integral representation of a function, ( (t) , may be simply given by:
f (t) .,:t F (111) (4.22) where f (t) is the function in the time domain, and F (ro) is the transform off (t) and represents the function in the frequency domain. The process is reversible, so that if either f (t) or F (111) is known, the other function may be determined (2, J).
The authors feel that there is a hidden fallacy in the use of Fourier techniques; that is. if the end product of the process is to determine the frequency content of the signal, nothing is gained. Familiarity with seismic-type records and their transforms leads one to conclude that there is little if anything (perhaps phase information) contained in the transform that cannot be dh•cemed from the original records. However, if the purpose is to determine ground response spectra. to filter, to determine energies. to integrate or differentiate, or to study absorption or many other phenomena, then Fourier analysis provides a. strong and useful tool
The primary use of Fourier techniques was to determine displacements and accelerations from particle velocity records and to examine the relationship of instantineous and delayed-type blasts. While the details of the mathematics are available (2, J) and are not presented here, the general procedures are described.
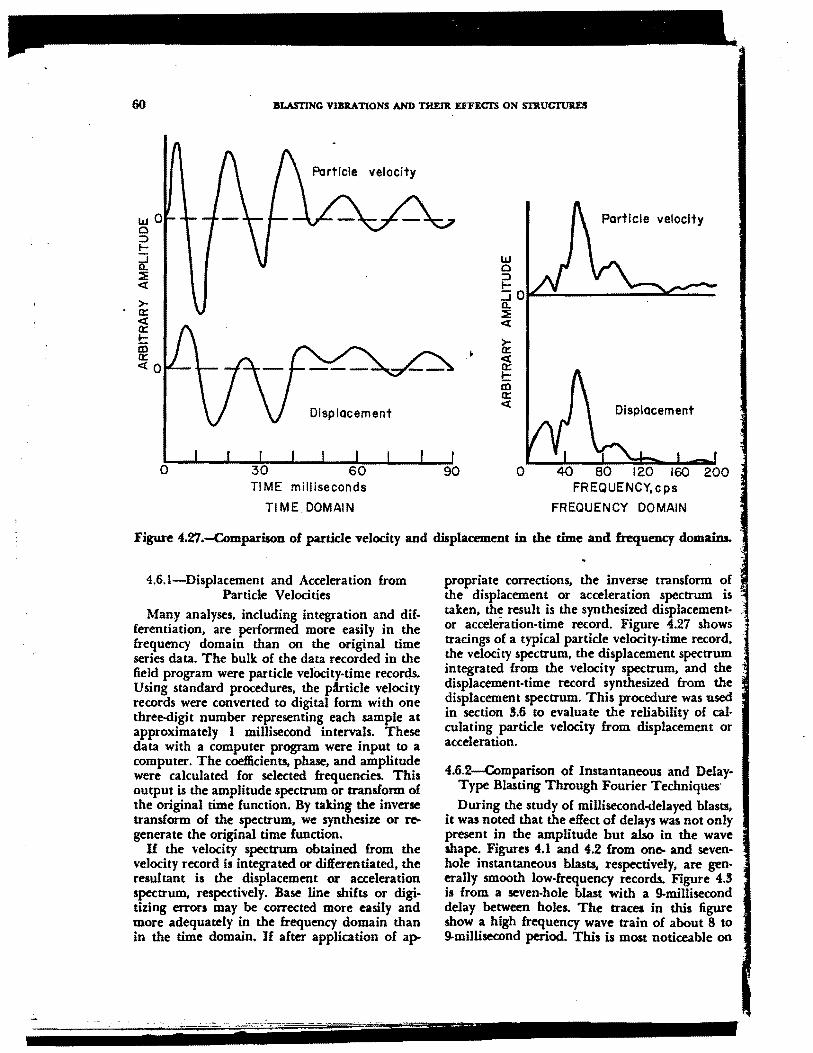
60 BLASTING VIBRATIONS AND THEilt EFFEC'tS ON STJlUCTUIES
UJ 0 0 ::::::> I-:J Q.. :::E <t
>-a:: <t a:: I-m a:: <t 0
0
velocity
Displacement
30 60 TIME milliseconds
TIME. DOMAIN
UJ 0 ::::::> I-:J 0 Q.. :::E <t
>-.. a:: <t a:: !::: l.D a:: <t
90 0
Particle velocity
Displacement
40 80 120 160 200 FREQUENCY, cps
FREQUENCY DOMAIN
Figure 4.27.-COmparison of particle velocity and displacement in the time and frequency domains.
4.6.1-Displacement and Acceleration from Particle Velocities
Many analyses, including integration and differentiation, are performed more easily in the frequency domain than on the original time series data. The bulk of the data recorded in the field program were particle velOcity·time records. Using standard procedures, the phticle velocity records were converted to digital form with one three-digit number representing each sample at approximately I millisecond intervals. These data with a computer program were input to a computer. The coefficients, phase, and amplitude were calculated for selected &equencies. This output is the amplitude spectrum or transform of the original time function. By taking the inverse transform of the spectrum, we synthesize or regenerate the original time function.
Jf the velocity spectrum obtained from the velocity record is integrated or differentiated, the resultant is the displacement or acceleration spectrum, respectively. Base line shifts or digitizing errors may be corrected more easily and more adequately in the frequency domain than in the time domain. If after application of ap-
propriate corrections, the inverse transform of the displacement or acceleration spectrum is taken, th~ result is the synthesized displacement- .. or acceleration-time record. Figure 4.27 shows tracings of a typical particle velocity-time record, the velocity spectrum, the displacement spectrum integrated from the velocity spectrum, and the displacement-time record synthesized from the displacement spectrum. This procedure was used in section 5.6 to evaluate the reliability of cal· culating particle velocity from displacement or acceleration.
4.6.2-Comparison of Instantaneous and DelayType Blasting Through Fourier Techniques·
During the study of millisecond-delayed blasts, it was noted that the effect of delays was not only present in the amplitude but also in the wave shape. Figures 4.1 and 4.2 from one- and sevenhole instantaneous blasts, respectively, are generally smooth low-frequency records. Figure 4.5 is from a seven-hole blast with a 9-millisecond delay between holes. The traces in this figure show a high frequency wave train of about 8 to 9-millisccond period. This is most noticeable on

GENERATION AND PllOPACATION OF GJtOUND VIBRATIONS FltOM BLASTING 61
(/) I.I.I 0 :::> 1-:J Q.
2 <[
0 LIJ N
~ 2 0:: 0 z
40 FREQUENCY, cps
80 0 40
Vertica I corn.,onent
80 FREQUENCY, cps
120 160
Figure 4.28.-Spectral amplitudes, radial and verticah:omponents, from a 5-hole, 9-m.illisecond-delayed blast.
the vertical components. Figure 4.4 shows a similar phenomenon from a 7-hole, 34-millisecond delayed blast. A longer duration as expected is apparent from the longer delayed blast.
The higher frequencies generated by the de~yed blast are a function of the interval delay ~me. If a number of identical amplitude-time ngnals, each delayed from the previous by a delay time, are summed, it can be shown mathematically that a periodicity comparable to the delay time results (JJ) . Figure 4.28 shows the
spectra for radial and vertical components at various distances from a 5-hole, 9-millisecond delay blast. The spectral amplitudes have been nor· malized to about 1.0 at the peak frequency. In these and ensuing plots, the spectra have been truncated at a point where all higher frequencies have amplitudes less than 5 percent of the peak amplitude. The spectra from an instantaneous shot are not shown, since the radial, vertical, and transverse spectra would all resemble the radial spectra of figure 4.28. Similarly. transverse spectra
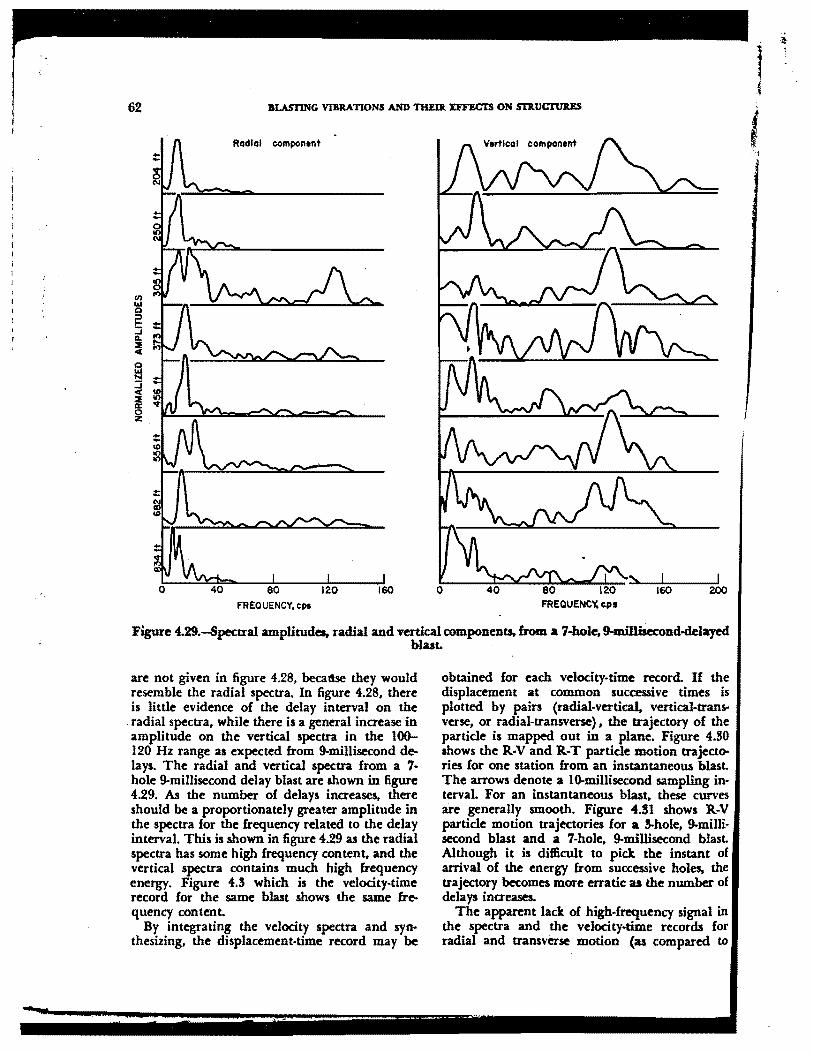
62 BLASTING VIBRATIONS AND THEill EFFECTS ON SlllUCTUllES
Radial eomponent
80
FREQUENCY, cps
120 160 0
Vertical component
160 200 FREQUENCY, CPI
Figure 4.29.-Spectral amplitudes. radial and vertical components. from a 7-hole. 9-m.illiSecond-delayed blast.
are not given in figure 4.28, becat'lse they would resemble the radial spectra. In figure 4.28, there is little evidence of the delay interval on the
. radial spectra, while there is a general increase in amplitude on the vertical spectra in the 100-120 Hz range as expected from 9-millisecond delays. The radial and vertical spectra from a 7· hole 9-millisecond delay blast are shown in figure 4.29. As the number of delays increases, there should be a proportionately greater amplitude in the spectra for the frequency related to the delay interval. This is shown in figure 4.29 as the radial spectra has some high frequency content, and the vertical spectra contains much high frequency energy. Figure 4.~ which is the velocity-time record for the same blast shows the same frequency content.
By integrating the velocity spectra and syn· thesizing, the displacement-time record may be
obtained for each velocity-time record. If the displacement at common successive times is plotted by pairs (radial-vertical. vertical-transverse, or radial-transverse), the trajectory of the particle is mapped out in a plane. Figure 4.80 shows the R·V and R-T particle motion trajectories for one station from an instantaneous blast. The arrows denote a 10-millisecond sampling in· terval. For an instantaneous blast, these curves are generally smooth. Figure 4.Sl shows R.-V particle motion trajectories for a ~hole, 9-milli· second blast and a 7-hole, 9-millisecond blast. Although it is difficult to pick the instant of arrival of the energy from successive holes, the trajectory becomes more erratic as the number of delays increases.
The apparent lack of high-frequency signal in the spectra and the velocity-time records for radial and transverse motion (as compared to
I j

c ,;; 9 ..: z w 2 w (.) <I: ...I a. (/)
i5 w (/) a:: ~-2 z .c[ a: t-
GENEJlATION AND PllOPAGATION OJ' GROUND VIBJlATIONS FR.OM BLASTING
/ I
,,. . ....... , '· -·-·-. Rodiol-Tronsv- trojectoty
""#::_ -·--. r .... , ........ __ , ., -........ I '-. ....... ...... '·, ............
\ ' ., " '· . ·, ··~ '·, ·, ........ \ ...... "'":""·-....... \ '· ...........:.~·-- ., ....... ....... .......... .
.......... ....... .... ......... - ,:;;. """ ................... __ ., ___ _.......,.--~--·-·-
\
Figure 4.30.-Partkle motion trajectories, 300 feet from an instantaneous blut.
~6 -5 -4 -3 -2 ·o 2 3
----·-·-·-·-·--·-·-·-·- Rodlal-VoriicGI tn>joctor,
_.,... -·- 3·Hole, 9--mllll- -- ·-·-·-~-- -""' ........... -, --.... .......... ... ,.,. .. ,_. .. · ·,, -· -.......... -·-·--------·-·-- ............. _ ....... _._ ·-....... ~ '\
- -·-· ~·----·-" -·--·----·-·-·- ....... , ............... ' .......
Figure 4.31.-Radial-VerticaJ particle motion trajectories, 300 feet from S.hole, and 7·hole, 9-millisecoud-delayed blaau. .
6!
64 BLASTING VIBRATIONS AND THEDl EFFECl'S ON STRUCTUIU!:S
vertical motion) may be a consequence of the free half.space in the vertical diI:ection. The earth is more free to vibrate in the vertical direction and may carry higher frequency vibrations. However, the presence of higher frequencies should cause greater attenuation with distance for the vertical component. This was true for almost every quarry blast recorded.
A similar and perhaps corresponding phenomenon was apparent in the velocity-time records (figures 4.1 to 4.4). The radial and transverse component traces tend to oscillate for a much longer time than the vertical traces. This may be the consequence of some type of trapped wave in the horizontal plane or the result of the generation of Love waves at the surface. These lower frequency oscillations often being sustained tend to mask higher frequency energies on the radial and transverse components in both the time and frequency domains.
4.7-REU:RENCES I. Adams. W. M., R.. G. Preston, P. L. Flanders, D. C.
Sach~. and W. R. Perrett. Summary Report of Strong Motion Measurements, Underground Detonations. J. Geophys. Res., v. 66, No. !I, March 1961, pp. 90!1-942.
2. Blackman, R.. B., and J. W. Tukey. The Measurement of Power Spectra. Dover Publications, New York, 1958, 190 pp. .
5. Bracewell, R.. The Fourier Transform and Its Applications. McGraw·Hill, Inc., New York, 1965, 581 pp.
4. Carder, D. S., and W. K. Cloud. Surface Motion From Large Underground ExelO!lions, J. Geophys. Res., v. 64, No. 10, October 1959, pp. 1471-1487.
5. Crandell, F. J. Transm'.ssion Coefficient for Ground Vibrations Due to Blasting. J. Boston Soc. Civil Eng., v. 47, No. 2. April 1960, pp. 152-168.
•
6 .. Devine,J· F., ll. H. Beel, A. V. C. Meyer, and W. I. Duva . Effect of Charge Weight on Vibration Levell From Quarry Blasting. BuMincs llepL of Inv. 6774, 1966, !17 pp.
7. Duvall, W. I .• C. F. Johnson, A. V. C. Meyer, and J. F. Devine. Vibrations From Instantaneous and Millisecond-Delayed Quarry Blasts. BuMines llept. of Inv. 6151, 1963, M pp.
8. Duvall, W. I .. J. F. Devine, C. F. Johnson, and A, V. C. Meyer. Vibrations From Blasting at Iowa Limestone Quarries. BuMincs Rept. of Inv. 6270, 1963. 28 pp.
9. Habberjam, G. M .. and J. T. Wbeuon. On Lue llela· tionship Between Seismic Amplitude and Cha~ of Expl0!i1ve Fired in Routine Blasting Operauons. GeOpbysics, v. 17, No. I. January 1952, pp. 116-128.
IO. Hudson, D. E., J. L. Alford, and W. D. Iwan. Ground · Accelerati<ins Caused by LaJ:F Quarry Blasts. Bull. of the Seis. Soc. of America, v. 51, No. 2. April J961, pp. 191-202.
11. Ito, lchiro. On the Relationship Between Seismic Ground Amplitude and the Quantity of Explodves in Blasting. lleprint from Memoirs of the Faculty of Eng., Kyoto Univ., v. 15, No. 11, April 1955, pp. 579-587.
12. Morris, G. The Reduction of Ground Vibrations From Blasting Operations. Engineering. Apr. 21, 1950; pp. 4!!0-453.
U. Pollack, H. N. Effect of Delay Time and Number of Delays on the Spectra of ll1pple-Fired Shots. Earth· quake Notes, v. M, No. I, March 1965, pp. l-12.
14. Ricker, N. The Form and Nature of Seismic Waves and the Structure of Sdsmograms. Geophysics, v. 5, No. 4, October l!HO, pp. MS-!166.
J!S. Teichmann, G. A., and R.. Westwater. Blasting and Associated Vibrations. Engineering, Apr. 12, 1957, PP· 460-465.
16. Thoenen, J. R., and S. L. Windes. Seismic EJfects of Quarry Blasting. BuMines Bull. 442. 1942, 83 pp.
17. Willis, D. E., and J. T. Wilson. Maximum Vmical Ground Displacement of Seismic Waves Generated by Explosive Blasts. Bull. of the Seis. Soc. of America, v. 50, No. !, July 1960. pp. 455-459 •
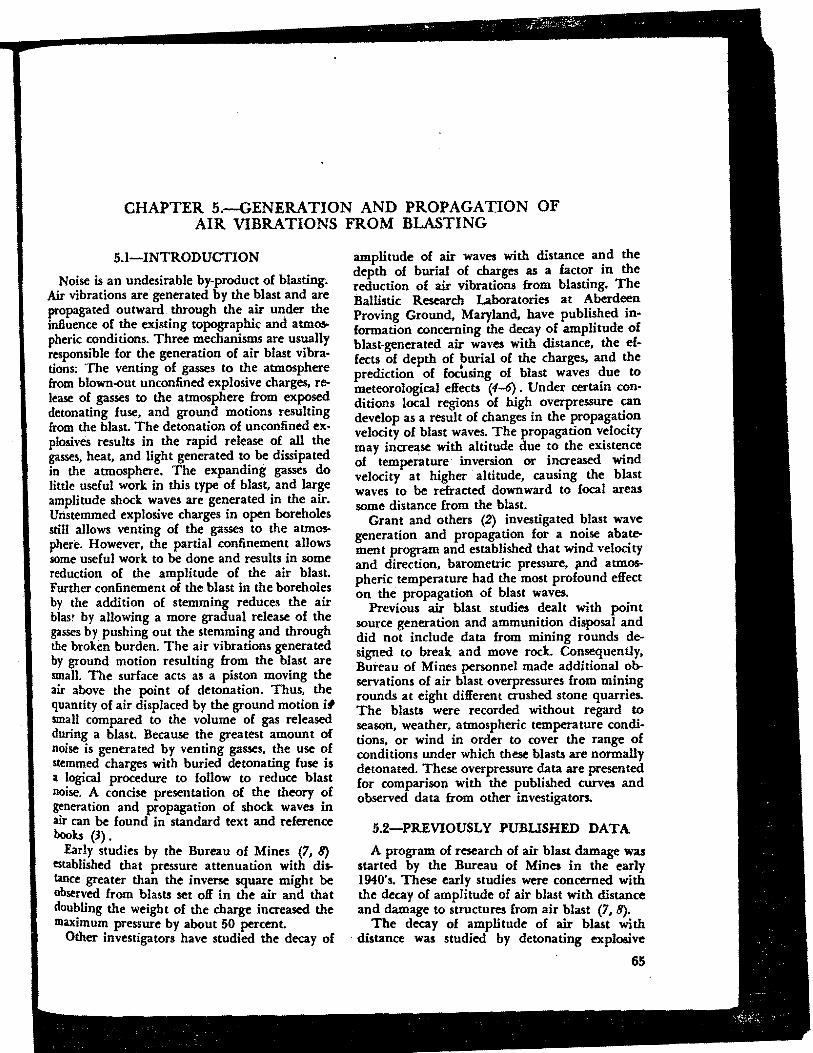
CHAPTER 5.-GENERATION AND PROPAGATION OF AIR VIBRATIONS FROM BLASTING
5.1-INTRODUCTION
Noise is an undesirable by-product of blasting. Air vibrations are generated by the blast and are propagated outward. through the air under the influence of the existing topographic and atmospheric conditions. Three m_echanis~s are us1;U'llY responsible for the generation of arr blast v1bra· tions: The venting of gasses to the atmosphere from blown-out unconfined explosive charges, release of gasses to the atmosphere from exposed detonating fuse, and ground motions resulting from the blast. The detonation of unconfined ex· plosives results in the rapid release of all the gasses, heat, and light generated t~ be dissipated in the atmosphere. The expanding gasses do little useful work in this type of blast, and large amplitude shock waves are generated in the air. Unstemmed explosive charges in open boreholes still allows venting of the gasses to the atmosphere. However, the partial confinemen~ allows some useful work to be done and results in some reduction of the amplitude of the air blast. Further confinement of the blast in the boreholes by the addition of stemming reduces the air bJasr by allowing a more gradual release of the gasses by pushing out the stemming and through the broken burden. The air vibrations generated by ground motion resulting from the blast are small. The surface acts as a piston moving the air above the point of detonation. Thus, the quantity of air displaced by the ground motion ii small compared to the volume of gas released during a blast. Because the greatest amount of noise is generated by venting gasses, the use of stemmed charges with buried detonating fuse is a logical procedure to follow to reduce blast noise. A concise presentation of the theory of generation and propagation of shock waves in air can be found in standard text and reference books (3).
Early studies by the Bureau of Mines (7, 8) established that pressure attenuation with distance greater than the inverse square might be observed from blasts set off in the air and that doubling the weight of the charge increased the maximum pressure by about 50 percent.
Other investigators have studied the decay of
amplitude of air waves with distance ~d the depth of burial of charges as a facto.r m the reduction of air vibrations from blasting. The .Ballistic Research Laboratories at Aberdeen Proving Ground, Maryland, have publi~hed in· formation concerning the decay of amplitude of blast-generated air waves with distance, the effects of depth of burial of the charges, and the prediction of fodtsing of blast waves c;tue to meteorological effects (4-6) . Under certam con· ditions local regions of high overpressure can develop as a result of changes in the propagation velocity of blast waves. The propagation v~locity may increase with altitude due ~o the extste?ce of temperature inversion or increased wind velocity at higher altitude, causing the blast waves to be refracted downward to focal areas some distance from the blast.
Grant and others (2) investigated blast wave generation and propagation for a noise abatement program and established that wind velocity and direction, barometric pressure, ;ind atmospheric temperature had the most profound effect on the propagation of bla.st waves. . .
Previous air blast studies dealt with point source generation and ammunition disposal and did not include data from mining rounds designed to break and move rock. Consequently. Bureau of Mines personnel made additional observations of air blast overpressures from mining rounds at eight different crushed stone quarries. The blasts were recorded without regard to season, weather, atmospheric temperature condi· tions, or wind in order to cover the range of conditions under which these blasts are normally detonated. These overpressure data are presented for comparison with the published curves and observed data from other investigators.
5.2-PREVIOUSLY PUBLISHED DATA
A program of research of air blast damage was started by the Bureau of Mines in the early l940's. These early studies were concerned with the decay of amplitude of air blast with distance and damage to structures from air blast (7, 8).
The decay of amplitude of air blast with · distance was studied by detonating explosive
65
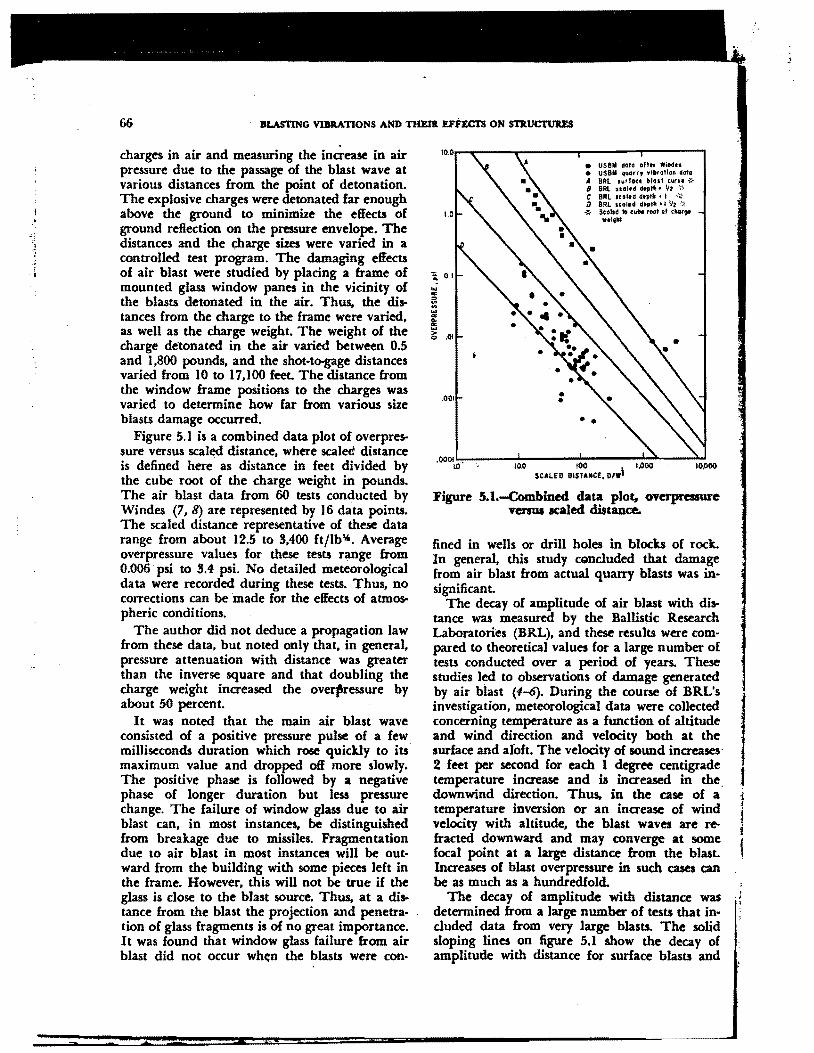
66 BLASTING VIBRATIONS AND THE.DI. EFFEcrs ON SlllUC1111.ES
charges in air and measuring the increase in air pressure due to the passage of the blast wave at various distances from the point of detonation. The explosive charges were detonated far enough above the ground to minimize the effects of ground reftection on the pressure envelope. The distances and the ~arge sizes were varied in a controlled test program. The damaging effects of air blast were studied by placing a frame of mounted glass window panes in the vicinity of the blasts detonated in the air. Thus. the distances from the charge to the frame were varied, as well as the charge weight. The weight of the charge detonated in the air varied between 0.5 and l,800 pounds, and the shot-to-gage distances varied from 10 to 17, I 00 feet. The distance from the window frame positions to the charges was varied to determine how far from various size blasts damage occurred.
Figure 5.l is a combined data plot of overpressure versus scaled distance, where scaled distance is defined here as distance in feet divided by the cube root of the charge weight in pounds. The air blast data from 60 tests conducted by Windes (7, 8) are represented by 16 data points. The scaled distance representative of these data range from about 12.5 to 8,400 ft/lb"'. Average overpressure values for these tests range from 0.006 psi to S.4 psi. No detailed meteorological data were recorded during these tests. Thus, no corrections can be made for the effects of atmospheric conditions.
The author did not deduce a propagation law from these data, but noted only that, in general, pressure attenuation with distance was greater than the inverse square and that doubJing the charge weight increased the over~ressure by about 50 percent.
It was noted that the main air blast wave consisted of a positive pressure pulse of a few milliseconds duration which rose quickly to its maximum value and dropped off more slowly. The positive phase is followed by a negative phase of longer duration but less pressure change. The failure of window glass due to air blast can, in most instances, be distinguished from breakage due to missiles. Fragmentation due to air blast in most instances will be out· ward from the building with some pieces left in the frame. However, this will not be true if the glass is close to the blast source. Thus. at a distance from the blast the projection and penetra· tion of glass fragments is of no great importance. It was found that window glass failure from air blast did not occur when the blasts were con-
:. 0.1
.... .. ~
"' ... .... .. ~ Z'> .01
• •
• USBM doto ofttf Windn • USBM 41.1:on, wib,otion dofo A BRL urron blast c11rv• {lo 8 BRL sc•l•d dolt,. l/z -::-c BRL 1e:ottd dtpt• 11 ' ·~· D 8RL "ol1d dtpl- •I 111 -:; -~ SCGltd to cubt root of tbar91
w1l91t1
• •
JQO 100 1 1.000 SCALED DISTAllCE. D/W1
10,000
Figure 5.1.-Combined data plot, overpressure versus acaled distance.
fined in wells or drill holes in blocks of rock. In general, this study cGncluded that damage from air blast from actual quarry blasts was insignificant.
The decay of amplitude of air blast with distance was measured by the Ballistic Research Laboratori~s (BRL), and these results were compared to theoretical values for a large number of tests conducted over a period of years. These studies led to observations of damage generated by air blast (4-6). During the course of BRL's investigation, meteorological data were collected concerning temperature as a function of altitude and wind direction and velocity both at the surface and afoft. The velocity of sound increases 2 feet per second for each I degree centigrade temperature increase and is increased in the. downwind direction. Thus, in the case of a temperature inversion or an increase of wind velocity with altitude, the blast waves are refracted downward and may converge at some focal point at a large distance from the blasL Increases of blast overpressure in such cases can be as much as a hundredfold.
The decay of amplitude with distance was · i determined from a large number of tests that included data from very large blasts. The solid sloping lines on figure 5.1 show the decay of amplitude with distance for surface blasts and
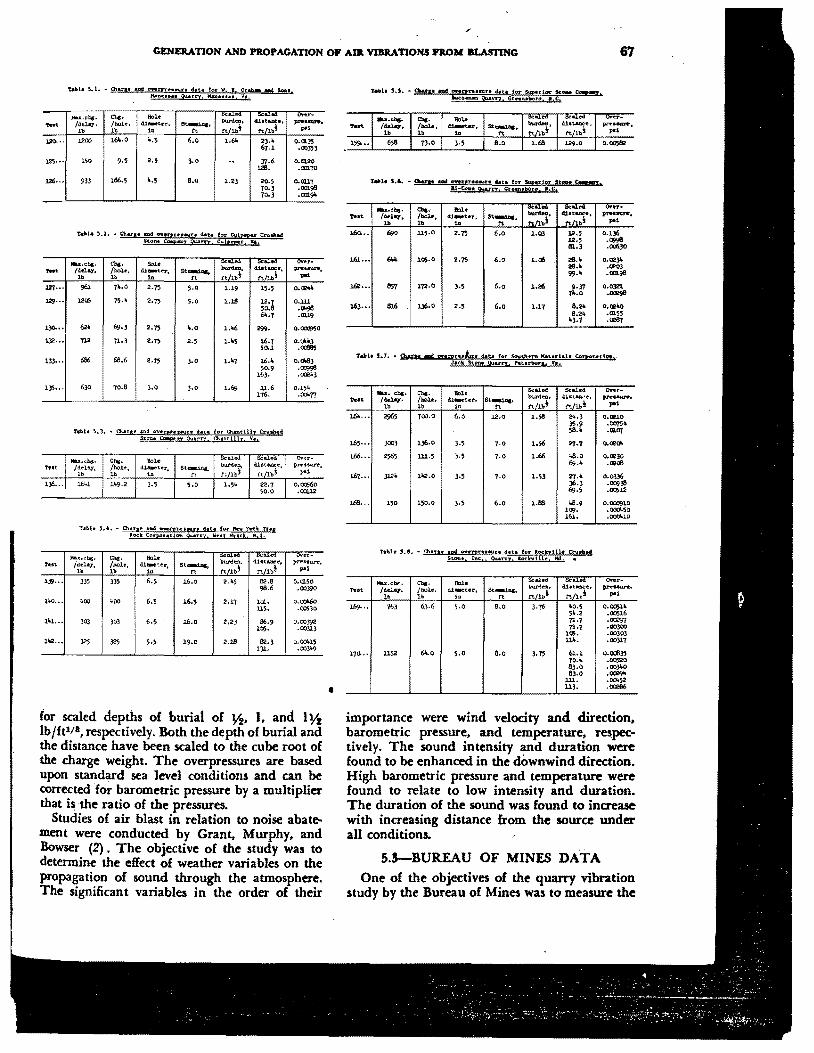
GENERA.TION AND PROPAGATION OF AlJl VIBRA'l10NS FROM BLASTING 67
..... J.20.··
12'J ...
125 •••
'"' lZ'I···
'29···
1.JO.u
132 •••
133··.
135···
"'" 1)6 ...
..... l.J!I ...
11.0 ...
141 ...
1"2 ...
Tabl• 5.1. - Oi.uu .... Vft!'!HUU• fft• tot' v. '· ere- ap4 ••• IYn.ttw• gu..rry, tt.a:d.&•Ha, V•.
*1.cbg. e.g. Bole l•eJJ:t. /bole. dime"tl'l"~ -· bu.rd.cm, diataaee,
lb lb io !'t rt/lb! nit•~ l.200 16'·0 i..5 6.o l.61o 23.i.
67.1
150 9.5 2.5 ).O -· Jt:6
933 J.86.5 "·' 8.0 l.2J 20.5 10.3 10.3
T•bl• $.2:. - Ch.u1• and 9VH!l:'t!HllO d..llt• for Cul"P&r Cnuh.ct Sto11• C..my Ouarrr C1.1hmr. V•.
Mlt.Jf..cnc. Chg. Sole ~--/dd&'/ 0 /bole, die.&'t~:r. St- ~ d.i•t&l:ICll!,
lb lb io n n11•! 961 1•.o .. .,, 5.0 i.19 15.5
l.2(1; 75.• .. .,, 5.0 l.18 12.7 50.e 61o.7 .... 69.3 . . .,, •.o l.<b 299.
112 71.3 .. .,, 2.5 1.45 l.6.7 50.l
686 68.6 .. .,, J.O l.lq l.6.4 50.9
163.
6)0 70.8 3.0 3.0 i.69 11.6 .. 176.
t'«bh ~.3 .... O.nae .and ~gre•f:Un dua for Ol.antllh Cru:ahed Stone C(9#..l'Y 9uuTy. 0-.ancllh v.,,
-·'""· Chg. Uol• 5<"1 .. ~~ .. /d.elay, /hoJ.•~ dillllt'tcr,
.. _ .... .,., d.bt~'" lb lb i.o " nil•! !'tJlbl
1641 1"9.2 3.5 5.0 1.5• 22.7 50.0
T.abh $.4, - 01ugl! Bid O'nl9l' .. SUU d..llt.a for JlrN YOT\ TTH, ioca Corp!HUoon 91.L!ny, Wut HJsclt. Itfl.
J"1e ~-- --~
~,. ..,,..._.., ... O.Ol.35
.00353
0.0!.20 .om.70
0.0117 .00198 o00l9"
QY>r-
"'""""· ... o."'" O.lll
.""91!
.0119
o.~
o:~
o.<MJ • 00998 .l.X21'J
0.15" .o:>m
Over-pl"e'SS~, ... o.0056o
.0011.2
over-MaJc;.""b@i· Cbg.
/dd&T • /!v>J.•, di_,".. er. St.~, - t:U.at.e.:w:~. pns•urt!'~
lb lb io rt rt/lb! nl1•~ ... 335 335 6.5 1.6.0 V•5 82.8 o.cnso
98.6 .oom 400 400 6.5 16.5 2.11 l<ll.. o."""6o
115. ,00530
303 303 6.5 1.6.o 2.23 86.9 0.00392 1(1.i. .00313
325 325 5.5 19.0 2.18 82.3 o.oo>15 1)1. .003"9
for scaled depths of burial of *· I. and I* lb/ftl/8, respectively. Both the depth of burial and the distance have been scaled to the cube root of the charge weight. The overpressures are based upon standard sea level conditions and can be corrected for barometric pressure by a multiplier that is the ratio of the pressures.
Studies of air blast in relation to noise abatement were conducted by Grant, Murphy, and Bowser (2) . The objective of the study was to determine the effect of weather variables on the propagation of sound through the atmosphere. The significant variables in the order of their
•
\'Ht.
160. ..
l..61. ...
w ...
1.63···
?Mh '·'· ~ 911&£,H ad onnrusun Uta for Svp!rtor kc.a eep-r. hcbtnml 9u&m Gr-1uboro, •.C,
73.0 3.5 8.o
TM.t.. '·'· - !!:!II! did murHM:aT• 11.ata for !!£!!!en I*!!! "'--"• It-Coot 9!!!!!1:1 er-IHboro •• c,
.-i.cbg. Cbe• Bole /d.Wq, /....,.., .._.. ... s.-... . "' lb 1o n
"-"' ll5·0 •-15 6.o l.Q] U!.5 12.5 91.]
641< lOJ.O 2.15 6.o 1.o6 28.4 28.4 9!1·"
ll57 172.0 M 6.o 1.26 9.n .,i..o
916 1'6·0 2.5 6.o l.17 8.2• 8.2•
43.7
O.a2]lo .<l!03 .00l98
0.0321 .00!98
O.li!loO .cn.55 .a:!ef
'f.Ul• :f.7, .. C!.ag• :!!Dll aunuak.re fft.t for ~thUft Kaurlda Corpor.UhM•· Jack Stom Ou!rrx. htnbvra. Va •
...... w. ...
165 ...
J.66 •••
l.67 ...
168 ...
flu, cbg. Cbg. Bolo Scaled Scaled bu.nl .... ..Usuu:;.:e, /d.Wq. /....,.., dital!te:l". "'-· !'t/lbt rt/lb! lb lb l.n n
2965 700.0 6.o 12.0 1.58 2".] 35.9 58.•
3003 136.0 3,5 7.0 Vi6 21.1
~5 lll.5 3-5 7.0 1.66 .a.o 69.i.
w• 1'2.0 3.5 7.0 1.53 21·" )6.3 69.5
150 150.0 3.5 6.o l.88 Wl.9 109. 161.
T•blc S.8~ - O.aue and qvcnrutun d.at.a for l0<:k1irllle CNA., St0Qt1 tac., Quarry lockYllie Md, •
8.o
170... U52 8.o Q.1 70.i. 83.0 8).0
lll. 113 •
..... ........... pU
O.CIUO .0075• .cn.07
O.a20lo
0.0230 .a2oll
0.0336 .00938 .005.1.2
0.00091.0 .000450 .oooi.10
0.0051 .. .00516 .~ .00300 .00303 .00)17
O.<X635 .00520 .003"0 .OC£91> .00.52 _.,._
importance were wind velocity and direction, barometric pressure, and temperature, respec· tively. The sound intensity and duration were found to be enhanced in the downwind direction. High barometric pressure and temperature were found to relate to low intensity and duration. The duration of the sound was found to increase with increasing distance from the source under all conditions.
5.S--BUREAU OF MINES DAT A One of the objectives of the quarry vibration
study by the Bureau of Mines was to measure the

68 BLASTING VIBRATIONS AND THEIR. EFFECTS ON STR.UCTUllES
amplitude of air-blast overpressures resulting from detonation of mining rounds in operating quarries. Accordingly, measurements were made of the air blast amplitudes from 26 mining blasts detonated in eight crushed stone quarries. The data were collected during the routine mining operations without regard to atmospheric conditions, time of day, rock type, or explosives used. The burden and spacing were controlled by the operators to achieve desired rock breakage, and the blasts were stemmed in accordance with the blasting procedure practiced at each quarry. Thus, the data obtained are representative of actual operating conditions.
. The use of cube root scaling implies spherical propagation from a point source. The configuration of a normal mining round does not conform to a point source model, and burial of the charges in long boreholes behind a shallow burden precludes either true spherical or hemispherical propagation in the air over distances of a few thousands of feet. However, it has been common practice to scale air blast data to the cube root of the charge weight. Therefore, the Bureau of Mines air blast data (shot-to-gage distances) have been scaled to the cube root of the maximum charge weight per delay. These data are presented in tables 5.1 through 5.8 and are shown in figure 5.1 by 66 data points on the overpressure versus scaled distance plot.
The confinement of an adequately stemmed charge in a borehole in a mining round is the distance from the borehole to the free face, which is the burden. Therefore, the burden scaled to the cube root of the charge weight per hole would be expected to correspond to the scaled depth of burial of the charge as determined by the Ballistic Research Laboratories (J, 6).
A careful study of the Bureau of Mines air blast data was made, and it was deter1n.ined that adequate stemming might be achieved by main-
~~.........._,. . ..........- -· .. -·--- . .._ ... -- -
taining a ratio of stem.ming height in feet to hole diameter in inches of 2.6 ft/in or greater. Under this condition, the burden, scaled to the cube root of the charge weight per hole, will compare favorably with the scaled depth of burial of the charge as used by the Ballistic Re-search Laboratories (J, 6). Also, the value of 2.6 J ft/in for the stemming height to hole diameter 1 ratio agrees with published data of Ash (1).
It is interesting to note that only one point from the quarry blast data on figure 5.1 lies above a scaled depth of I. The maximum overpressures measured did not exceed 0.16 psi, and most of the overpressures are at least an order of magnitude lower. Thus, it is reasonable to assume that a properly stemmed mining round designed u:f break and move rock efficiently will not generate air blast overpressures of a damaging level under average operating conditions.
5.4-REFERENCES
I. Ash, Richard I.. The Mechanics of Rock Breakage. Pit and Quany, v. 56, No. 5, September 1965, pp. 118-125;.
2. Grant, R. L., J. · N. Murphy, and M. L. Bowser. Effect of Weather on Sound Transmission From Explosive Shots. U. S. BuMines Rept. of Inv. 6921. 1967, 15 P.P·
ll. Kenney, Gilbert F. Explosive Shocks in Air. The McMillan Company, New York, 1962, 198 pp.
4. Kingery, C. N., and B. F. Pannill. Peak Overpressure Versus Scaled Distance for TNT Surface Bursts (Hemispherical Charges). Ballistic Research Laborato.-ies Rept. No. 1518, Af.ril 1964, 22 pp.
5. Perk.ins, Beauregard, Jr., Pau H. Lorrain, and Wil· liam H. Townsend. Forecasting the Focus of Air Blasts Due to Met~-orolo~cal Conditions in the Lower Atmosphere. Ballisuc Research Laboratories Rept. No, 1118, October 1960. 77 Pi:>·
6. Perkins, Beauregard, Jr., and Wilbs F. Jackson. Handbook for Prediction of Air Blast F"ocusing. Ballistic Research Laboratories Rcpt. No. 1240. February 1964, JOO pp.
7. Windes, S. L Damage From Air Blast. Progress Report 1. BuMines Rept. of Inv. 5622. February 1942. 18 pp.
8. __ . Damage From Air Blast. Progress Report 2. BuMines Rept. of Inv. 5708, June 1945, 50 pp.

CHAPTER 6.-ESTIMATING SAFE AIR AND GROUND VIBRATION LEVELS FOR BLASTING
6.1-INTRODUCTION
Blasting operators are often faced with the necessity of limiting vibration levels to minimize or eliminate the possibility of damage to nearby residential structures or to reduce complaints from neighbors. As discussed in Chapter 5, the Bureau recommends a safe blasting limit of 2.0 in/sec peak particle velocity that should not be exceeded if damage is· to be precluded. If com· plaints are a major problem, the operator may wish to further limit the particle velocity level to reduce the number of complaints which he feels are attributable to vibration level. Again, as discussed in Chapter 3, from the case history of the Salmon event, a particle velocity limit of 0.4 in/sec could, be established by the operator if complaints are to be kept below 8 percent of the potential number of complainants. In a densely populated area, or where the history of complaints has been a serious problem, an operator may find it desirable to still further limit the vibration level to minimize complaints. It should be dearly understood that the authors are not advocating a limit below the 2.0 in/sec criterion which will preclude damage but are suggesting that an operator may, by choice, find it desirable to impose a more restrictive limit to minimize complaints. ·
The two variables which appear to affect vibration level the most at a given distance are the charge weight per delay and, to a lesser extent, the method of initiation. The same total charge weight which would result in damage can often be shot in a series of delays with no damage.
~ Electric delay caps can often be used with a net '\ decrease in vibration level as opposed to the
levels from Primacord delay connectors or in-. stantaneous blasts. The operator has a design
problem to obtain the proper procedure for best breakage, proper throw from the working face, the best economy, and other considerations. Conversion to delay shooting, increasing the number of delays, or electric delay caps may not provide the best solution or even any solution to many blasting problems. However, where the vibration problem is urgent, changes in the two
variables cited will provide the greatest change in vibration level at a given distance.
There are two approaches to the problem of how to estimate charge size so that safe vibration level limits will not be exceeded at a given distance. The first and best is to use instrumenta· tion on blasts to determine within a quarry what the specific constants are in equation 4.21 for the actual blasting conditions. The second approach is to use general dam taken under varying conditions (such as the data in figures 4.22 through 4.25) to determine empirical rules of thumb which must inherently have larger safety facton than those where a specific quarry moniton its own blasts.
Although air blast is rarely a problem in normal blasting operations, a discussion of estimat· ing procedures for the control of overpressures is included in section 6.5. As pointed out in section 5.5, this repon continues the general practice of scaling air blast data to the cube root of the charge weight per delay.
6.2-ESTIMATING VIBRATION UMITS WITH INSTRUMENTATION
Ohviously, the best way to control vibration levels is to determine and know these levels. Many blasting operations record the particle velocity from each blast on a routine basis either with owned or leased equipment or through consultant services. Data from one station may be used to accumulate sufficient data to make plots
'similar to those shown in figures 4.15 through 4.17. This can be done in either of two ways: by recording at a fixed gage location from several shots at different scaled distances; or by locating the gage station at successively further scaled distances from successive shots at the working face. The second method is recommended, because it only requires a gage station at preselected scaled ·distances from several routine blasts.
As an illustration, one data point was selected from each of the tests at the Weaver quarry shown in figure 4.15. Eight data points were chosen at random but at various scaled distances. A ninth point. from Weaver test 9, was chosen to
69

:t'
70 BLASTING VJBJtATIONS AND THEIR. EFFECTS ON STJtUcnJJll'.S
provide the largest scatter possible within the data of figure 4.15. These nine· data points. shown in figure 6.1, represent a single data point from each of nine blasts and illustrate the use of a single gage station for several blasts at a quarry. The single point selected to have the largest deviation is shown with a different sym· bol. Three regression lines have been placed through the data. Line A represents all the data from the Weaver quarry in figure 4.15. Line B represents the 8 data points selected at random but at various scaled distances. Line C represents those 8 data points plus the data point from figure 4.15 with the most deviation. It is obvious that these 8 or 9 points are representative of the approximately 60 points used in figure 4.15. · From these data, shown in figure 6.1, an operator might select a scaled distance of 15.0 to insure that 2.0 in/sec peal particle velocity is not ex· ceeded at a particular distance or a scaled distance of 20.0 to be more conservative. While the illustration is only for the radial component data from Weaver, similar results could have been obtained for the vertical and transverse component data.
(,) Cl) I/)
......
.E r-I-(..) 0 -' IJJ > IJJ -' (..)
i== a:: <( a.. ~ <C IJJ a..
s.o------------
2.0
1.0 0.8
.6
.4
---une B
---Line A
•
20 40 60
SCALED DISTANCE, ft/lbYz
Figure 6.1.-Com~n of ,particle velocity data from diJferent shots within a quarry.
A single three-component gage station would be the minimum used in determining propagation data for a blasting operation. Data should be taken in more than one direction to insure that directional effects, such as those discussed in section 4.5 are determined if present. Establishment of a propagation law, such as shown in figure 6.1 removes all questions and permits design of blasts and maintenance of controls on blasting limits which will preclude exceeding safe blasting criteria.
6.5-ESTIMATING VIBRATION LIMITS WITHOUT INSTRUMENTATION
For" many quarries or blasting operations, it is not possible to obtain data as suggested in section 6.2. In such cases, it is advisable to use empirical data derived from investigations in various quarries. Figure 6.2 represents the combined particle velocity versus scaled distance data from Bureau tests in many quarries. The heavy line i 1 the upper limit envelope of all the data points col· lected. If it is assumed that these data represent a sufficiently random sample of all possible blasting sites, then these data can be used to esti· mate a safe scaled distance for any blasting site. At a scaled distance of 50 ft/lb" the probability is small of finding a site that produces a vibration level that exceeds the safe blasting limit of 2.0 in/sec. Therefore, it is concluded that a scaled distance of 50 ft/lb" can be used as a control limit with a reasonable margin of safety where instrumentaJion is not used or is not available. For cases where a scaled distance of 50 ft/lb~ appears to be too restrictive, a controlled experiment with instrumentation should be con· ducted to determine what scaled distances can be used to insure that vibration levels do not exceed 2.0 in/sec particle velocity.
6.4-USE OF SCALED DISTANCE AS A BLASTING CONTROL
The significance of scaled distance and its proper use has raised many questions and is often misunderstood. As discussed in section 4.S, the peal particle velocity of each component of ground motion can be expressed as a function of distance from the blast and the maximum charge weight per delay by the equation:
D v = H (W,.) II (6.1)
where v = particle velocity, H =intercept at D/W" = 1.0, D = distance,
i
l 1 ' i
'f I
: .

ESTIMATING SAFE Ant AND GROUND VIBRATION LEVELS FOR BLAmNG 71
VERTICAL TRANSVERSE
u • • ... .!: . ,. ... ~ w ::> Ill ..J u
I 0.1
10 100 4 10 100 4 10 100
SCALED DISTANCE, ft /lb 11r
Figure 6.2.-COmbined velocity data from all quarries in Bureau of .M!rt1es studieL
W = maximum charge weight per delay, D /W"' = scaled distance,
and p = regreSsion exponent or slope. The values of both H and p will vary with site and component.
After plotting values of peak. particle velocity versus scaled distance, D /W"' on log-log coordinate paper from instrumented shots (as shown in figure 6.1), the scaled distance at which 2.0 in/S«. particle velocity is not exceeded, can readily be picked from the graph. For illustra· tive purposes, a scaled distance of 20 ft/lb,,. has been chosen. Similarly, in the absence of data from instrumented blasts, the data of figure 6.1 can be used empirically. A scaled distance of 50 ft/lb"' has been chosen from these data and ia recommended for use where instrumentation has not been used. This will insure that vibration levels will not exceed 2.0 in/sec particle velocity. Two examples have thw been set up: one, where instrumented data has been available and a second, where no data was available. The two hypothesized scaled distances for the two aitua· tions are 20 and 50 ft/lbi.tt, respectively.
Normally, the distance from,, the blast to a potential damage point will be fixed. The charge per delay must then be . varied to provide the
proper scaled distance limit. Since D /W"' is the scaled distance, one may determine the proper charge weight per delay from the equation:
W = n2 / (S.D.) a. (6.2) The quantity, S.D., in equation 6.2 i' the selected scaled distance to preclude damage. For the ex· amples, S.D. has the value of 20 ft/lbi.tt and 50 ft/lbi.tt. Assuming the potential damage point is 500 feet from the blast and solving equation 6.2 for the charge weight per delay, 625 and 100 pounds of explosives could be detonated per delay without exceeding the safe vibration criterion if the control limit was a scaled distance of 20 ft/lb"' or 50 ft/lb"', respectively. If the distance to the potential damage point is 1,000 feet. the maximum charge per delay that could be detonated safely would be 2,500 or 400 pounds fOI' scaled distances of 20 or 50 ft/lb"', respectively.
Figure 6.5 is useful to quickly determine the maximum charge per delay for scaled distances of 20 or 50 It/lb"'. The line for a scaled distance of 50 ft/lb"' can be used where no data are available. The line for a scaled distance of 20 ft/lb1' is used only to illustrate what might be done if previow shots had been instrumented and data plotted as shown in figure 6.1. Two of the four previow numerical examples are shown oo
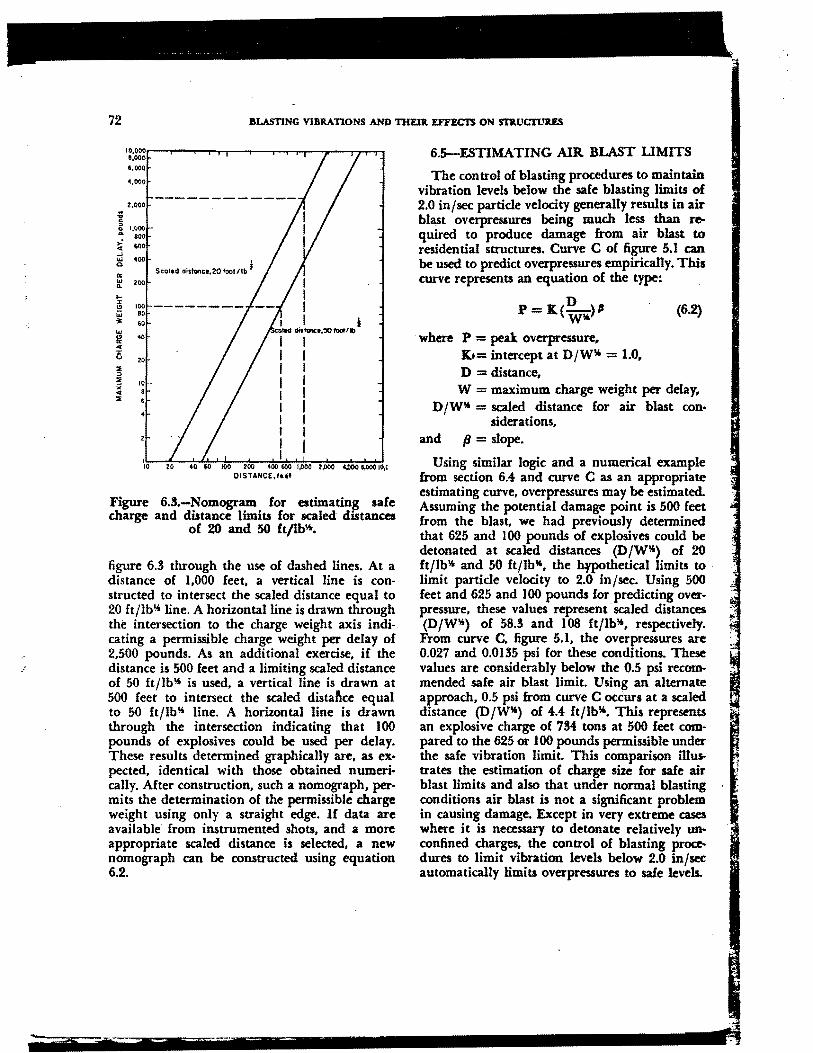
72 BLASTING VIBRATIONS AND THEIR EFFECTS ON STll.UCI'UJlES
10,000.---.---,.--.-,...,.....-.....---. .................. -.....-..................... e,ooo 6,000
4,000
l,000 .. ~ 0 1.000 A 800 ,:
600 <I ..J
"' 400 c a: "' too Q. ... ;;t
100 " w 80
"' 60
I
sc·at•d dtstonee,20footllb I
I I I
I I • ltd di1tonct,:!Olool/ll)
I I I I I I I I I I I I I I I I I I I
Figure 6.3.-Nomogram. for estimating safe charge and distance limits for scaled diStances
of 20 and 50 ft/lb~.
figure 6.3 through the use of dashed lines. At a distance of 1,000 feet, a vertical line is constructed to intersect the scaled distance equal to 20 ft/lb"' line. A horizontal line is drawn through the intersection to the charge weight axis indicating a permissible charge weight per delay of 2,500 pounds. As an additional exercise, i£ · the distance is 500 feet and a limiting scaled distance of 50 ft/lb"" is used, a vertical line is drawn at 500 feet to intersect the scaled distat\ce equal to 50 ft/lb"' line. A horizontal line is drawn through the intersection indicating that 100 pounds of explosives could be used per delay. These results determined graphically are, as ex· pected, identical with those obtained numerically. After construction, such a nomograph, permits the determination o( the permissible charge weight using only a straight edge. 1£ data are available from instrumented shots, and a more appropriate scaled distance is selected, a new nomograph can be constructed using equation 6.2.
6.5-ESTIMA TING AIR. BLAST LIMITS
The control of blasting procedures to maintain vibration levels below the safe blasting limits of 2.0 in/sec particle velocity generally results in air blast overpressures being much less than required to produce damage from air blast to residential structures. Curve C of figure 5.1 can be used to predict overpressures empirically. This curve represents an equation of the type:
D p = K.( W"')f'
where P = peak overpressure, K.•= intercept at D /W"' = 1.0. D = distance,
{6.2)
W =maximum charge weight per delay, D /W"" = scaled distance for air blast con·
siderations, and fl = slope.
Using similar logic and a numerical example from section 6.4 and curve C as an appropriate estimating curve, overpressures may be estimated. Assuming the potential damage point is 500 feet from the blast, we had previously determined that 625 and 100 pounds of explosives could be detonated at scaled distances (D /W"') of 20 ft/lb"' and 50 ft/lb", the hfpothetical limits to limit particle velocity to 2.0 in/sec. Using 500 feet and 625 and 100 pounds for predicting overpressure, these values represent ·scaled distances (D/W"') of ~8.3 and 108 ft/lb"", respectively. From curve C, figure 5.1, the overpressures are 0.027 and O.OU5 psi for these conditions. These values are considerably below the 0.5 psi recommended safe air blast limit. Using an alternate approach, 0.5 psi from curve C occurs at a scaled distance (D /W"") of 4.4 ft/lb"'. This represents an explosive charge of 7!J4 tons at 500 feet compared to the 625 or I 00 pounds permissible under the safe vibration limit. This comparison illustrates the estimation of charge size for safe air blast limits and also that under normal blasting conditions air blast is not a significant problem in causing damage. Except in very extreme cases where it is necessary to detonate relatively unconfined charges, the control of blasting procedures to limit vibration levels below 2.0 in/su automatically limits overpressures to safe levels.

CHAPTER 7.-SUMMARY AND CONCLUSIONS
7.1-SUMMARY
This study is based on the IO-year Bureau program to reexamine the problem of vibrations from blasting. Included in the program were an extensive field study of ground vibrations from blasting; an evaluation of instrumentation to measure vibrations; establishment of damage aiteria for residential structures; a consideration of human response; a determination of param· eters of blasting which grossly affected vibrations; and empirical safe blasting limits which could be used with or without instrumentation for the design of safe blasts.
In all sections of this report, the authors have drawn heavily on the published work of others. This is particularly true in Chapters S and 5. In addition to the many publications referenced, all known, available, and pertinent articles published through August 1969 were critically reviewed. Obviously, many articles have been left out of the discussion either because of duplication or because they did not present significant contributions to other discussed data.
The Bureau study included data from 171 blasts at 26 sites. The sites included many rock types, such as limestone and dolomite, granitetype, diabase, schist, and sandstone and covered simple and complex geology with and without overburden.
The tests covered the detonation of explosive charges ranging from 25 to 19,625 pounds per delay at scaled distances ranging from S.39 to 369 ft/lb~. Recorded amplitudes of particle velocity ranged from 0.000808 to 20.9 in/sec. , Frequencies of the seismic waves at peak ampli· tudes ranged from 7 to 200 cycles per second.
7.2-CONCLUSIONS
Damage to residential structures from ground· home vibrations from blasting correlates more ~osely with particle velocity than with accelerabon or displacement. The safe blasting limit of 2.0 in/sec peak particle velocity as measured ~om a_ny of three mutually perpendicular directions m the ground adjacent to a structure should not be exceeded if the probability of damage to the structure is to be small (probably less
than 5 percent). Complaints can be further reduced if a lower. vibration limit is imposed. As an example, a peak velocity level of 0.4 in/sec should be imposed if complaints and claims are to be kept below 8 percent of the potential number of complainants. In the absence of instrumentation, a scaled distance of 50 ft/lb" may be used as a safe blasting limit for vibra· tions.
Air blast does not contribute to the damage problem in most blasting operations. A safe blasting limit of 0.5 psi air blast overpressure is recommended. Except in extreme cases (lack of standard stemming procedures). the control of blasting procedures to limit ground vibration levels below 2.0 in/sec automatically limits overpressures to safe levels.
Human response levels to ground vibrations, air blast, a11d noise are considerably below those levels necessary to induce damage to residential structures. The human response level is a major factor contributing to complaints. The ground and air vibrations observed in this study at reasonable distances from routine blasts are significantly lower than the vibrations necessary to damage residential structures. However, many of the observed vibration levels were at values that would cause people discomfort and, therefore, result in their filing complaints.
Millisecond-delay blasting can be used to decrease the vibration level from blasting, because it is the maximum charge weight per delay in· terval rather than the total charge which determines the resultant amplitude. To relate the ground vibration effects of different blasts, peak amplitudes at common scaled distances should be compared. The distance is scaled by dividing it by the square root of the charge weight per delay interval. Blasts initiated with electric millisec· ond-delay caps generally produce a lower vibration level than blasts initiated with Primacord delay connectors.
Geology and/or direction can have a major effect on both amplitude level and decay of amplitude with distance. If a site is instrumented to provide blasting limits, these effects should be examined, particularly in directions where strut·
75

,· ,
74 BLASTING VIB1lATIONS AND THEDl EFFECTS ON STllUCl'lJltES
tures might be subjected to damage. In an overall sense, from quarry to quarry, effects of geology including rock type, could not be determined from the data. Amplitudes at comparable scaled distances were similar irresJ>c:Ctive of rock type.
•
The presence or absence of overburden does not give rise to differences in particle velocity ampli· tude but does alter the wave frequency giving rise to changes in displacement and acceleration amplitudes.
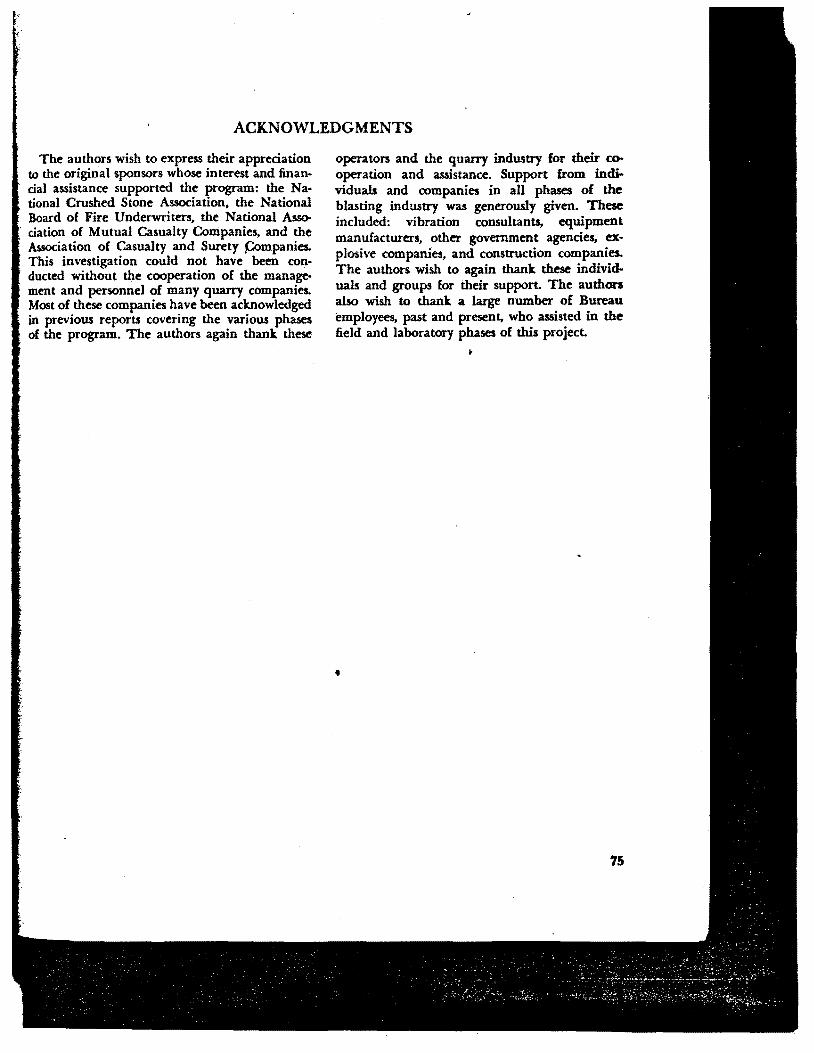
ACKNOWLEDGMENTS
The authors wish to express their appreciation to the original sponsors whose interest and financial assistance supported the program: the Na· tional Crushed Stone Association, the National Board of Fire Underwriters, the National Assa-
. ciation of Mutual Casualty Companies, and the Auociation of Casualty and Surety P,mpanies. This investigation could not have been conducted without the cooperation of the manage-
. ment and personnel of many quarry companies. Most of these companies have been acknowledged in previous reports covering the various phases of the program. The authors again thank these
operators and the quarry industry for their cooperation and assistance. Support from individuals and companies in all phases of the blasting indwstry was generously given. These included: vibration consultants, equipment manufacturers, other government agencies. explosive companies, and construction companies. The authors wish to again thank these individuals and groups for their support. The authors also wish to thank a large number of Bureau employees, past and present. who assisted in the field and laboratory phases of this project.
'
75

EXPLANATION OF APPENDICES
The appendices present the pertinent data concerning the field studies. Appendix A presents plan views of the various sites. Appendix B gives the shot and hading data for the ground vibration tests. Appendix C gives the particle velocity and frequency data. Appendix D gives a brief geologic site description. The order of sites is uniform throughout the appendices. For example, the Chantilly quarry is represented as figure A-17, tables B- and C-17, or site 17.
Two sites have been treated slightly different
because of the limited data obtained there. Only pressure measurements were obtained at the Rockville quarry. A plan view of the tests is given in figure A-25, and the pertinent blast and loading data are given in table 5.8. The Rockville quarry does not appear elsewhere in the appendices. Site 26, the location of the BureauASCE dan\age study tests, does not appear in the appendices. These two sites do not represent the same type tests as sites 1 through 24 and have therefore been excluded from the appendices.
Appendix A.-Plan Views of Test Sites
The gag! station arrays and blast areas, mapped by a stadia survey at each site, are shown in figures A-1 through -25. The location of each blast is identified by test number. The gage station locations are shown by a series of circles along a line and are indicated as station I, 2, 8, etc. At the Weaver quarry where gage arrays were numerous and close together, only a line
•
is shown to represent the gage stations along the line. Gage arrays are identified with blasts by the corresponding test number as necessary to indicate which blast was recorded along which gage line. Gaps between blast areas on the maps represent rock quarried during periods when vibration studies were not conducted.

LEG ENO o Gog• otatioftl
,.....,...., Quarry tl111 = 81011 oru
0 200 400 600
Scolt,fut
PLAN VIEWS OF TEST SrrES
Figure A-1.-Weaver Quarry.
'
1234 6 7 8 9
0 200 400 soo
Seoie,IHI
10 11
77
LE&EllD c::.-- e.,.1iiwt
LEGEM:> o Gate 1totlon•
.....,..., o-rr ,,., ic::::1 8 lo•t Dl'M
Figure A-2.-Webata: City Quarry. Figure A-3.-P &: M Quarry.
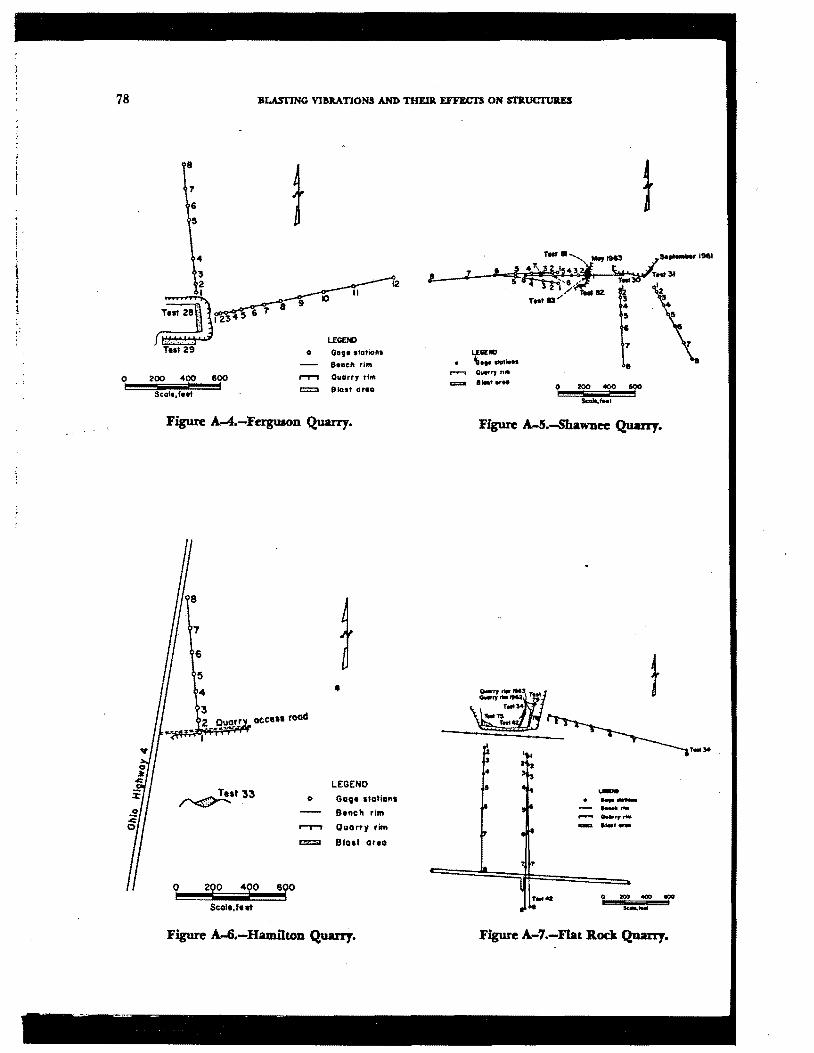
78
i : . ! : ! '
0
BLASTING VIB1t.A110NS AND THEIR E.FFEC'.l'S ON STl.UCI'URES
8
7
6
~
4
3 2
~· T11t 29
200 400 600
Scolo,fHI
0
L£GEJC> Gaga •tatlo•• Banch rim
r"T""'1 Quorry riM
= Blo•t area
Figure A-4.-Ferguson Quarry.
8
7
6
5
~•f33
0 I
2QO 4QO
Scale, feet
600 l
'
LEGEND
o Ga91 1tatian1
B1nch rim
r-r-t Quarry rim
cz::oi Bloat or10
Figure A-6.-Hamilton Quarry.
l
L[;f;llO
IGa .. lllOliaH
,....,..., °"°'"' n• a:::a .... , ... "
7
• 0 200 "°° l50D
kalil.fMt
Figure A-5.-Shawnee Quarry.
-. -_ ... ..,.,,,... - ..........
0 - .... ,.. --Figure A-7.-Flat llock Quarry.

PLAN VIEWS OF TEST SlT.IS
•
7
3
LEGEND GOIJtU0-8.-..cb rim
T""'r" Quony rim
c:::i> Blast orM
200 400
a.fut
Figure A-8.-Bellevue QuarrY·
•
-
..... . --0 ----
79
• c..-., ..... ---0 '° - .. --
Figure A-9.-Bloomville Quarry. Figure A-10.-Waahington. D.C. Site.

,_-
" .. ,,
80
6
BLASTING VlBllATIONS AND THEIR. EFFECT'S ON S"n.Ucrmt:a
\
8
hol58 and62
7
6
4 3
0 200 400
Scole,fNf
~ElllNll
0 Goo• - ,.. , ... 57,!ll,!lt, .... 12 n Gov• 11totioftl for lelta !~ CJftd M • 6- .. ., ... , far ""' 413 A ~ 11ot1CN11 tw •ts 64 ..t e o ~ototioftokll'tntftr
Ott.lllftCe~fPol:M c::::J Blosl !H'M
-9*nctt ri• ,..,......, 0uorr, , .. ---O.Orllw.., .....
_,.. lAdietlOtl~I
Figure A-11.-Poughkeepsie ~·
'
0
Figure A-12.-West Nyack Quarry.
UllENO ca M1ttoreo
toO 400 -.........

/ /
. --1TT"I~, ... r:=--
PLAN VIEWS OF TEST SITES
j
_,... __ _ . --F'igure A-U.-LittleVille Dam Site.
·- s
•
- ..., ---LUUtO -----
81
___ ... __ N: t&f 11 1at '" , .. tl7 , ...
HI S&4 JIG !&ot lft :s •tt • IH J IH 4 IH 4
l'igure A-14.-Centreville Quarry. Figure A-l!S.-Manassas Quarry.

82 BLASTING VIBRATIONS AND THEIR EFFECI'S ON STllUCTIJRES
' LEGEND D Gove 1to1ton1. tiM 1 .. °"9• 1totion1, liM 2
I • Go9I stations, Jint 3 Di•ta----· lftihotion pOint 3 Pri-d
lltftcllli"' Ovtrti..wden "9t I
4 l .,.,........... Quaffy rint t
=Blot!- I !
II
1 0 100 200 '°° I
Scait,IMt I
• J'igure A-16.-Sttasburg Quarry.
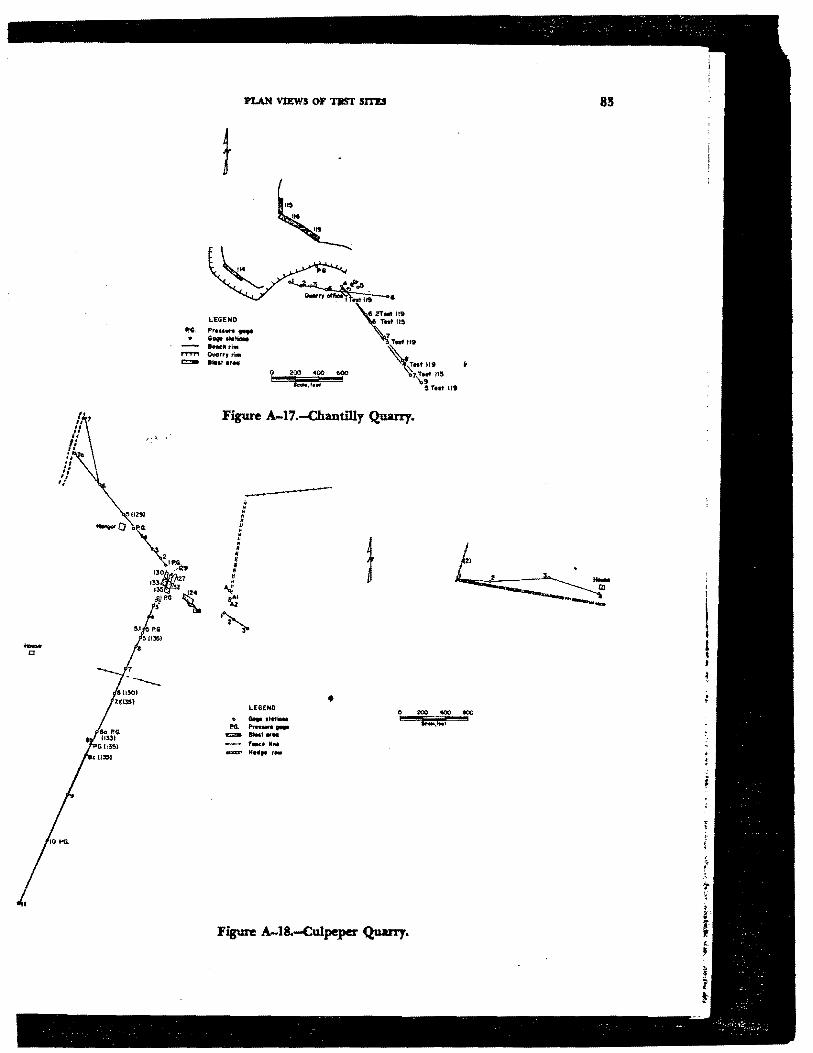
-c
PLAN VIEWS OF TJIST SITU
LEGEND P.8. ,, ..........
GottBnc:tt ti•
""'" °"°"' , .. a::. lklst °'"
~·~ 130~· ••
129 . 7
133.
·~P.G ~
200 4-00 w ..... 000 I
Figure A-17.-Chantilly Quarry.
------• : . • • g • • • • • • • a
-.;; \~
~
LEGEND
• Goto .... -ea....._._ -=- ..... .. , .... ..
HH .. r•
•
Figure A-18.-Culpeper Quarry.
85
84 BLASTING VIBRATIONS AND THEIR. EFFECTS ON STR.UCl'UR.ES
LEGEND Govt 1tatlon1
C!:ZJ Bkliat Otto
IA
~154
0 200 400 600
Scolt,fH1
Figure A-19.-Doswell Quarry •
LEGEND o Goo• 1totlon ~ 81nt or.a
0
•
200 400 1100
Figure A-20.-Riverton Quarry.
.... !;iJ tmll t•~ '" t$1
LEGEND Tait 164
t
Tut IMM4118 Tnt lff Tot 111 $ ..... ~ i•1t , ••
-.::::t B~ttor•a
DrttoAc• ~--~ P,G, Pt.•tw• 909"
)1~9
1
156
Figure A-21.-Jack Quarry.
• °"" 1totioft1 P.G. ..... _.. ... ,.
TrTT °""'" rh• - Bllltt 0<90
. Figure A-22.-Buchanan Quarry.
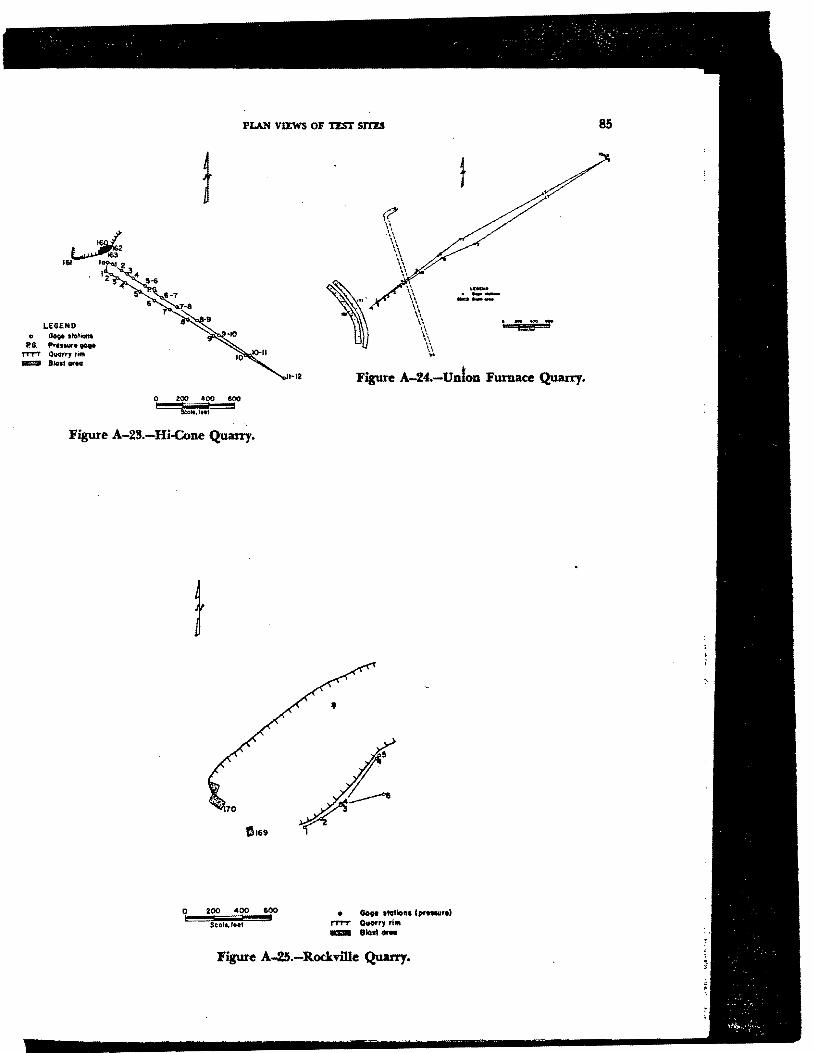
~ 161 I ·~ ..
. '2~-6 "'-6·7 6~7-8
7
LEGEND o (loge stoliono
P.6. "'·--· -TTTT Quorry rim
PLAN VIEWS OF TEST SJTES
' ... -. -----
. --LA
- BIHla...,
Figure A-24.-Un!on Furnace Quarry. 0 200 400 600
Scolt,IMI
Figure A-2lt-Hi-Cone Quarry.
0 200 •OO 600
Scol .. lnt
• Gote t1ctioftl ,,,_,.,
TTTT O..orry ri•
- a1a1-
Figure A-25.-R.ockville Quarry.
85

t 1 " t • J' ~!
:·i ~:.
' . ~--
~
~ .r ~
~ " ! ~ ,, i r {'
~
I ,.. ,;
l
Appendix. B.--Shot and Loading Data
A summary of the shot and loading data is given by site in Appendix B. Included are the number of holes, dimensions of holes and blast
•
86
pattern, and the loading information including charge per hole and delay, type of initiation and delay interval

SHOT AND LOADING DATA 87
Tabl• t-l ... !ynr 9!.arry. 4.ldea. love
~ P11<• Ch&rg• -
11o. of ~·-Teet Total !lo. Bole •ize, depth, height, Stemi.og, h<ll<I, del.q per del.q, Leogtb del.11,y, TJpe or
ot holes in rt rt rt rt rt l.b interval.• l.b .... .tn1tiat1on
2 ••• 3 6 36 30 15 10 15 200 0 6oo 0 Prilueont 3 ••• 3 6 36 30 15 10 15 200 2 200 17 Do. 4 ••• l 6 36 30 15 10 0 200 0 200 0 Do. 5 ••• 1 6 36 30 15 lo 15 200 6 200 17 no. 6 ••• 3 6 36 30 15 10 15 200 2 200 ~ llo. 1 ••• 1 6 36 30 15 lo 15 200 6 200 ~ !Jo. 8 ••• 1 6 36 30 15 10 15 200 0 l,loOo 0 Do. 9 ••• J. 6 36 30 15 10 0 200 0 200 0 !Jo.
lO ••• J. 6 36 30 15 10 0 200 0 200 0 -11 ••• 15 6 36 30 15 10 15 200 11> 200 17 Do. 12 ••• 15 6 36 30 15 10 15 200 0 3,000 0 !Jo. 13 ••• 15 6 36 30 15 10 15 200 l' 3,000 34 !Jo. 14 ••• 1 6 10 30 ll+-1.6 10 0 ioo 0 100 0 llo. u ... 291 3 10 9 2 6 12 22 ,..,.. abot 1,100 25 Cap 16 ••• 11+7 3 10 9 2 5 10 22 To. abet J,81. 25 Do. 17 ••• 6o 3 14 12 2 5 10 26 TH •bot io;!O 25 no. 18 ••• J. 6 36 30 1.6 l.O 0 200 0 200 0 Pr:tu.cwd. 19 ••• 3 6 36 30 l.6 10 15 200 2 200 9 Do. JO ••• 1 6 36 30 1.6 l.O 15 200 6 200 9 !Jo. u ... 15 6 36 30 1.6 10 15 200 l' 200 9 !Jo. 21 • •• 13 6 J6 30 1.6 10 15 200 3 800 17 DO.
"··· 21 6 36 30 1.6 lo 14 203 3 l.,2l.8 17 Do • .
Table 1-2. - KohilI Ou.anva kb•U:r Citz1 law•
Ho. Ch&rge per No. or MU.c Teat Totlil. Ho~ Hole a1ie 1 depth, emoing, Jmden, Sp&oillg, bol.o, dtlq per del.q, Longtb del.11,y, TJpe of
ot holes ill rt rt rt rt lb interval.J lb ..... 1.nitiation
22 ... 490 3 l2 2 9 25 3 1,100 17 Priaeoor.t 25 ••• 1.60 3 l2 2 9 25 • i.oo 17 Do. 26 ... 75 3 l.4 2 9 30 l8 120 17 llo.
fa.bl• 1 .. 3 ... P ' M Qu..a.m, !radute, Iowa
..... Face Crm.rge per No. ot Mn,x.charge Tut Total. No. Hole s1ie, depth, height, Stemi.og, -· Spo.eillg, bol.•, dela;y per dtl.oy, Length dtla,y. TJpe of
of holes ill rt rt rt !'t ft l.b 1.Jltervale lb .... 1.D.1tiat1on
23 ••• 28 3 28 24 4 B 6 •o l 560 50 •Cap 24 ••• 78 3 20 l8 4 B 9 25 2 625 50 llo.
T&ble t-4 ... AMrican Karirtu ay.m. Ferguson, Iowa
tto.i.e Face ~e;epe:r no. or ,_.charge Te•t Total No. Hole size:, depth. height, Steaait'.lg• -.,,, Spacing, bole. del.q per del.q, Lell<!t• dtla,y. Type or
of' bol.ea 1n rt ft rt rt rt lb interval• lb ..... initiation
28 ... 44 3 17 l8 3 7.5 15 50 3 700 25 Cap 29 ••• 55 3 12 ll 3.7.5 7.5 15 15 3 270 25 llo.
' 'l'AILE .... , ... Karbl« Cliff Ou.a.niu. Shft'nH Cillo
=· -· ~.,.,... per rleh or ~.cwi.rge
Test '.l'otal ""· Bole siiie. d•ptb, height, St-1.og. l!u"1eO. Spocl.JI&, bol.e, dcl.Jl;t per dei.,.1 Llmgth del.q, Type ot or holes 1n ft ft ft ft ft lb 1Atervll.• lb ... c 1n.1t1•t10ll
30 ••• ll 6 26 25 1().12 10 l2 ll2 ' lolo8 25 Cq Jl ... ll 6 26 25 1().12 40 l2 125 3 500 25 Do. 81 ... 12 5.875 25 25 l().ll 10 10 102 3 612 25 Do. 82 ••• J.3 5.875 30 JO 12 l.O 10 13:! 3 66o 25 llo. 83 ••• l 5.875 31 30 ll 10 0 13:! 0 lJ2 0 IJo,

88 BLASTING VIBRATIONS AND THErR EFFECTS ON STRUCl"UllES
oru.e ,,.,. ... ~"'°e per ~- 01 Max.cbarge
Lengt.!.: del.a;J" • I Teat Total !lo. Bole •1z.e. depth heJ.&ht St-1ng, Burden, Spooi.og, hole, delay per dela7, Type or of boles 111 rt ft rt ft ft lb 1.a.tervala lb initiation
33 ••• - 126 2.5 20 20 5-6 5 7 35 7 910 25 I Cop
t•H• a- 7. .. Flat lock Ou.arry. Flat lock. Clalo
aoie nee .... ~per BO. or Max..CUAi~e
Te•t Total !lo. Bol.e •ize, depth, he1gbt, St-1ng, BurUen, Spooi.og, bole, del.lcy per delay, Length de lq, Type or or boles 111 rt ft rt rt ft lb 1lltern.l.o lb
_ .. initiation
34 ••• l2 6 56-58 53-55 -- ll 14 450 8 888 17 Priaacord. 42 ••• 37 6 52 51 9 l2 l.6 :l92 7 2,7i.1> 17 Qo.
75 ••• 36 6.25 24 23 6 l2 10 1.82 9 l,C712 9 Oo. 78 ••• 36 6.25 56 511 7 l .. ll •59 l2 4,620 9 Do. 79 ••• L 6.25 56 511 4 10 0 1+68 0 1+68 0 Cop
TaH• a-1. - Prance Stone eo.!l!J Quarry BelleWe, Ohio
ao.e Face ... .._rge per no. ot Ma.x.cnarge Test Total !lo. Bol.e •1ze, depth, heJ.&ht, St-1ng, BurUeu, Spooi.og, hole, del.lcy per deliQ', Length de~, Type or
ot bolea 1D rt rt rt ft rt lb intervals lb •&eC 1n1tiat.ion
35 ••• l2 4 15 14 -- 10 ll 42 5 8" 25 Cop 37 ••• 7 5,625 l8 l8 -- l2 10 73.5 6 73.5 25 Qo.
)8, •• 7 5.625 l8 l8 -- l2 10 73,5 6 73.5 25 Do. 39 •••
~ 5.625 l8 l8 -- l2 10 78.5 6 78.5 25 Qo.
40 ••• 5.625 l8 l8 -- l2 10 78.5 6 78.5 25 Oo. 41 ... L'· 5.625 l8 l8 -- l2 10 51 5 lC2 25 Oo.
ta.bh ~ IJ. - Prance Scone Company Ou.am. Bloc.ville Claio
Ho~• Face ""l.ID..llSe per no. or Max..C1.1&.1l!lr
Teat Total llo. Bol.e size, depth, height St-1ng, Burd.en, Spooi.og, bole, delq per delay. LeDjlt.h del.lcy. Type or or boles 111 rt rt rt rt rt lb intervals lb aaec initiation
]6 ••• l2 6 32 32 -- 9 14 140 2 8"0 25 Cap 43 ••• 41 4.75 l8 l8 -- 10 ll 77 2 l,540 25 Oo. 76 ••• 3l ... 75 l8 17 6.5 10 ll Bl.2 2 l,218 25 Qo. 77 ••• l 4.75 l8 iA 6.5 ll 0 Bo 0 80 0 Do. 80 ••• ii) 4.75 l8 6.5-7.0 10 ll 79.8 3 2,714 25 Do.
Table a-10. - Theodore loosewlt Bridge Construction Site. Washi.ngtoa. D.C.
BoJ.e nee '"'11All!ie per flo, or Mu..cnarge Teat Total !lo. Bol.e aize, depth, height, St-1ng, Burden, Spooi.og. hole, del.lcy per delay. Length delO¥ • Type or
or bolezi 111 rt rt rt rt ft lb interval& lb ••ec in1t1a!.1on
44 ••• 13 2.625 20 l.6 -- .. 4 4 10 6 3l 25 Cop 45 ... 3 2.625 20 l.6 -- 4 6 37 2 37 25 Oo. 46 ... 13 2.625 20 l6 -- 4 6.5 3l l2 3l 25 Oo. 47 ••• 9 2.625 20 Ro race lone 0 2.5 7.75 0 70 25 Oo. 48 ••• 9 2.625 20 'la fac• - 0 2.5 8 0 72 25 Oo. 49 ••• 9 2.625 20 'la fan - 0 2.5 8 0 72 25 Oo. !() ••• 9 2.625 20 .. fac. ..... 0 2.5 7.8 0 70 0 Prtaacord 51. •• 13 2.625 20 20 -- 4 6 3l l2 3l 25 Cop 52 ••• 13 2.625 20 20 -- 4 6 26 l2 26 25 Oo. 53 ••• 13 2.625 20 20 -- 4 6 2l 8 lo2 25 Oo. S4 ••• L3 2.625 l8 l8 -- 4 6 25 l2 25 25 Oo.
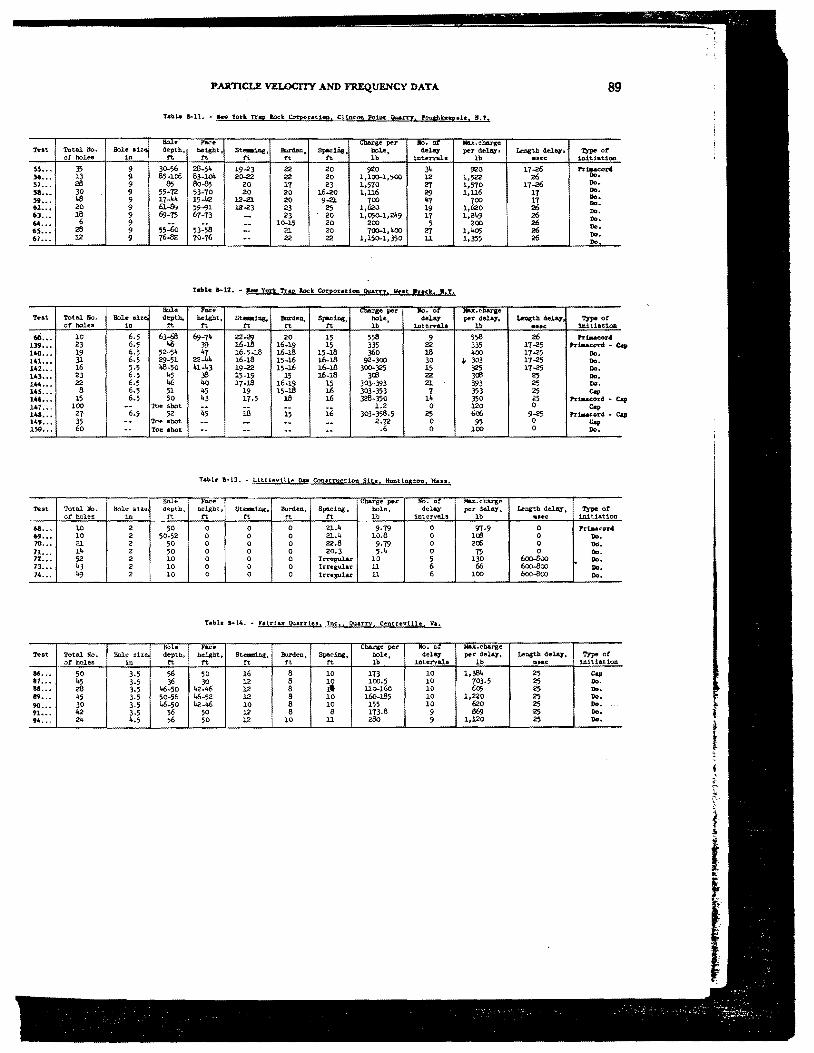
PARTICLE VELOCITY AND FREQUENcY DATA 89
-· he• ..,.LMM 5 e per ""· or )lllu~c~
l'o•t Total. !lo. iklle dt~ depth, be16ht. Stemtil>g, -. si-1.lla. bol•. del.lr;y per~. ~ del.11¥· Type or or boles in ft rt t't rt 1't lb tnterval.s lb •H!C in.iti&tiOll
55 ••• 35 9 30-56 28-54 19-23 22 20 920 34 920 17-'!6 Pr!Joac<ml 56 ••• 13 9 85-106 63-10'! 20-22 22 20 1zl00-l.,500 12 1.522 26 Do.
57 ••• 2B 9 85 8o-tl5 20 17 23 1,570 27 1,570 17-'!6 Do.
58 ••• 30 9 55-72 53-70 20 20 J.6-20 l,l.J.6 29 1,116 17 ""· » ... 48 9 17-44 15-42 12-21 20 9-21 700 '7 700 17 Do. Do.
62 ••• 20 9 61-89 59-91 12-<!3 23 25 1,620 19 1,620 26 Do. 63 ••• ie 9 6<.i-75 67-73 -- 23 20 1,050-1,2"9 17 1,2"9 26 ""· 64 ••• 6 9 ·-
53:58 -- 10-15 20 200 5 200 26 Do. 65 ••• 26 9 55-60 -- 21 20 700-1,rioo 27 l,l+o; 26 Do. 67 ••• 12 9 76.&2 70-76 .. 22 22 1,150-1, 350 11 1,355 26 Do.
""i• ,,.,. ~}lier ""· or na.io.c~e
Tt!&t Total. liO. Bole dz~ depth, he16ht, St-lllg, l!urd.eu, SJ'"Ci.ac, bole1 del.q per ddq, Lol:lgth delq Type or
ot boles in rt rt 1't rt rt l.b 1.ntert'&l.a lb ••ec: 1.!1.itiation
60 .•• 10 6.5 63.$ 69-7~ 22..;!9 20 15 556 9 558 26 Pr!Joacor4 139 ••• 23 6.5 ~ 39 16-16 16-19 15 335 22 335 17-<5 Prt..coM -140 ••• 19 6.5 52-51' i.7 16.5.16 16-16 15-16 360 l8 400 17-<5 Do. 1U ••• 31 6.5 29-51 22..i.i. 16-18 15-16 16-16 92·300 30 j. 303 17-<5 Do. 142 ••• 16 5-5 48-50 41-43 19-'22 15-16 16-16 300-325 15 325 17-25 Do. 143 ••• 23 6.5 45 38 15-19 15 J.6-16 3cil 22 3cil 25 Do, 144 ••• 22 6.5 "6 40 17-16 16-19 15 303-393 21 393 25 Do. 145 ... 6 6.5 51 45 19 15-16 16 303.353 1 353 25 Cq 146 ••• 15 6.5 50 43 17-5 ie l6 328-350 14 350 25 Priaacord ... 147 ••. 100 -- Toe $bot -- -- l.2 0 120 0 Cop 148 ... 27 6.5 52 45 l6 15 i6 303.356.5 25 606 9-25 Prt..cord .. 149 ••• 35 -- Toe shot ·- -- -- -- 2.72 0 95 0 Cap 150 ••• 60 ·- Toe th.at .. -- .. .. .6 0 100 0 Do.
Table 1 .. 13. - Littleville o .. Conatructioa Stse. H.untinston, Mau.
H<>J.e , . ..,. -.,~e per lfQ. or Mll.X.CUllU"ge
Test Total. lio. liole s1ze d.epth, hei6ht, Stem.1.ng* llul'den, Spaciog, bol.e, delq per de.l.Al't Leagth d"1.q. Type or or holes in rt rt rt ft ft lb intervals lb •••c i.nitiaticm
68 ••• 10 2 50 0 0 0 21.4 9.79 0 'TT-9 0 Prt-..coM 69 ••• 10 2 50.52 0 0 0 21.4 10.8 0 lei! 0 ""· 70 ••• 21 2 50 0 0 0 22.8 9.79 0 206 0 °"· 11 ••. 14 2 50 0 0 0 20.3 5.4 0 75 0 Do. 72 ••• 52 2 10 0 0 0 Inegul.Ar 10 5 130 600...Svo . Do • 73 ••• 43 2 10 0 0 0 Irngular 11 6 66 600-800 Do, 74 ••• 49 2 10 0 0 0 Irregular ll 6 100 600-800 Do.
Ho.Le ''"'" •~s• per llo. or Me.x.Cuo.,itSe Test Total tto. Bole •ixe, dl!"pth, h!!igbt. St-1ng, !Urdeo. Spaci.a(c, bole, delq per delay, Lencth delq, Type or
ot holes 1n rt rt rt ft rt lb interval• lb •••c Wtiatton
et; ... 50 3,5 56 50 16 8 10 113 10 1,381< 25 Cap 87 ••• 45 3.5 36 30 12 6 10 100.5 10 703.5 25 Do. 811 ••• 26 3.5 46-50 42-46 12 8 it ll0-16o 10 605 25 ""· 119 ••• 45 3-5 50-56 46-52 12 8 10 16o-l85 10 1,220 25 Do. 90 ••• 30 3.5 46.50 42-46 10 8 10 155 10 620 25 Do. 91 ••• 42 3.5 56 50 12 8 8 113.8 9 8€>9 ~ Do. 94 ..• 24 4,5 56 50 12 10 11 28o 9 l,l.20 25 Do.
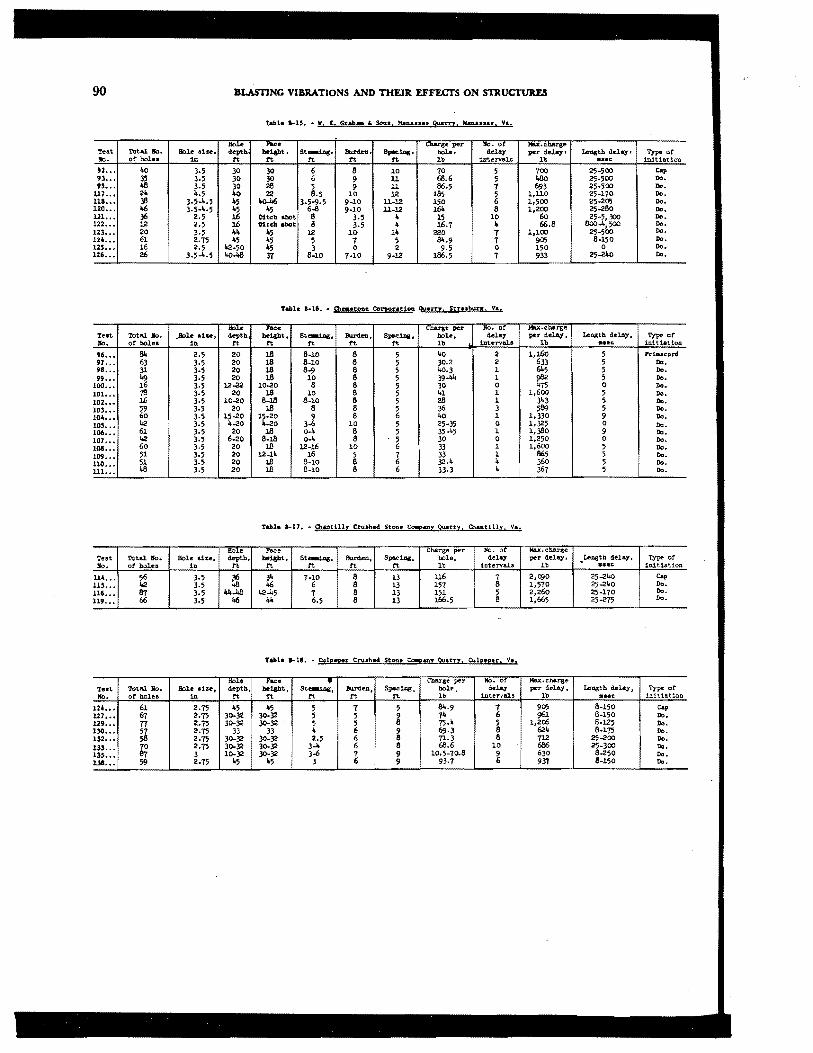
90 BLASTING VIBRATIONS AND THEIR EFFECTS ON STJlUCIUR.ES
'tahl• a-n ... w. E. er.ui- a Solla. Manaua1 9uarrt. Kanatn:•. va.
!lo.Le ,....,. ...---.. 6 e per ltO· ox 1'11.X.e..-,.ae
r..•t Total. !lo. Bole a1u. depth heilllrt. St-1J>g. llm'den 8-1.ng· hol.e• delq pe:r delay• Length dtle.r• J .~or !lo. or boles 1l1 rt tt ... n f't lb iutet'V'al.G lb ••ec tietion
92 ••• 4o 3.5 30 30 6 8 10 70 5 700 25-500 cap 93 ••• 3S 3,5 30 30 6 9 ll (,8.6 5 i.ao 25-500 Do. u ... 48 3,5 30 28 5 9 ll 86.5 1 693 25.500 Do.
u1 ... 2.\. 4.5 4o 22 8.5 10 l2 l.85 5 l,llO 25-170 Do. us ... 38 3.5..i..5 i.5 .\.o-1'6 3,5-<J.5 9-10 ll-l.2 150 6 1,500 25...205 Do. 120 ... .\.6 3.5..i..5 •5 .\.5 6.a 9-10 l.l.-l.2 161> 8 l,200 25...28o Do. 121 ... 36 2.5 16 Dit<:b -t 8 3.5 .. 15 10 6o 25·5, 300 Do. 122 ... l2 2.5 16
111tcll -· ll 3.5 4 1.6. 7 .. 66.8 lloo.J., 500 Do.
123 ••• 20 3.5 " .\.5 l2 10 lli 220 7 l,100 25-500 llo. 124 ... 61 2.75 45 i.5 5 1 5 8'.9 7 905 8-150 Do. 125 ... 16 2.5 "2-50 45 3 0 2 9.5 0 150 0 llo. 126 ... 26 3.5..i..5 li-0-48 37 8-10 7-10 9-l.2 186.5 7 933 25...24o llo,
Table .... 16. • Ch-..tont Conoratioo. Qu.!m. su.·aaburg. Va.
-· ..... ... -e.~ per :no. ot Max.charge Test Total. Jlo, Jlol~ uu, depth he~t, St.-1.Gg, l!urdm, 5-illl!. bol.•, dela7 per dtle.y, Length del.Ay, T:rPe or !lo. or bole-a in l't rt ft l't f't lb lllterval.a lb asec initiation
96 ••• 84 2.5 20 l8 8-10 8 5 4o 2 l,l6o 5 Priut::ord 97 ... 63 3.5 20 l8 6-10 a 5 30.2 2 633 5 llo. 98 ••• 3l 3.5 20 l8 6-9 6 5 i.o.3 l ~5 5 Do. 99 ... "9 3-5 20 l8 10 6 5 39~ l 91!2 5 llo.
100 ... 16 M 12...22 10...20 8 6 5 30 0 •75 0 Do. 101 ... 78 M 20 l8 10 8 5 •1 l l,600 5 Do. 102 ... 1.6 3.5 10...20 8-18 6-10 8 5 28 l 343 5 Do. 103 ••• 59 3.5 20 l8 8 6 5 36 3 589 5 Do. 104 ... 60 3.5 15...20 15...20 9 6 6 40 l 1,330 9 Do. 105 ... "2 3;5 4...20 4...20 3-6 10 5 25.35 0 1,325 0 llo. 106 ••• 61 3.5 20 18 o..i. 8 5 35-45 l 1,380 9 n... 107 ... "2 3.5 6-20 8-1.8 o..i. 6 5 30 0 1,250 0 n... 108 ••• 60 3,5 20 1.8 12-1.6 10 6 33 l 1,600 5 Do. 109 ... 51 3.5 20 l.2-1• 16 5 7 33 l 865 5 Do. 110 ... 51 3,5 20 1.8 8-10 6 6 32 ... .. 360 5 Do. 111 ••. 48 3.5 20 1.8 8-10 8 6 33,3 4
I 367 5 Do.
Boie Face ;.;narge per Ho. or HU.charge Test Tot&l !lo. Bol.e dze. d"P1:b. he~t, St.-1.Gg, auun, Spe.cills. bole, del-., per dtl&)'• Leogtb dtle.y, I Type or !lo. ot boles in l't ft ft l't ft lb ioterva.ls lb " •••c 1nit1at1on
114 ••• 56 3.5 36 31< 7.10 8 13 U6 7 2,Cl;IO 25-24-0 ! Cap
115 ••• "2 3.5 48 "6 6 6 l3 157 6 l,570 25-2•0
I
Do. 116 ••• 67 3.5 "..i.a "2.J.5 7 8 13 151 5 2,26o 25-170 Do.
119 ... 66 3.5 "6 " 6.5 8 13 166.5 8 1,665 25.275 Do.
fabh 1-11 ... C:U..bep•r C'Nahed. StPn• ea.per ()atu. O..lp•ecr. V•,
lloJ.e -· • Cbarg• per Ko. or Max.che.rge Te•t Tota.l. Ho. Bol.e 11ze, deptb, he~t, St~, :eo.n>en, Spacj.Qg, bobJ dele.y ~r dday~ Length delay' Type or llO. or bolee in ft l't l't l't ft lb 1.llterval.s lb ••ec initiation
124 ••• 61 2.75 45 .\.5 5 7 5 11'<.9 7 905 8-150 Cap 127 ... 67 2.75 30..32 30-32 5 5 9 74 6 961 8-150 Do. 129 ... T7 2.75 30..32 30-32 5 5 e 75.i. 5 l,2o6 8-125 Do. 130 ... 57 2.75 33 33 • 6 9 69.3 6 62• 8-115 Do. 132 ... 58 2.75 30..32 30-32 2.5 6 8 71.3 8 712 25-200 Do. 133 ••• 70 2.75 30..32 30..32 3-4 6 e fi8.6 10 686 25-300 n... 135 ••• 67 3 10..32 30-32 3-6 t 9 l0.5-70.8 9 630 6...250 Do, 138 ••• 59 2.75 •5 45 3 9 93.7 6 937 6-150 Do.

PARTICU: VELOCITY AND FREQUENCY DATA 91
table a-19. ... c.neral Q!:uh.-d StODot Cwm Qu!rn. Oram 11. Va.
-· ..... -e· per ,..;h ox ~.charge
Te•t Tot.al Jlo. BOle 11ze. deptll, be:13ht. ~. -- !lpooc1.og. boLe. del.q per del.ll.f• Length d'llq. T.1J>e or or holes in tt rt rt rt rt 1b interval• lb NOC 1.Git1&t1on
152 ••• l8 6 53 50 10 13 16 •:!9-~ 6 2,<Bl 25-205 Cap
lH .•. 20 6 45 42 11 13 16 354-500. 6 1,616 25-205 Do. 1'4 ••• 14 6 54 5J. ll-l8 13 16 5~· 5 1,837 25·110 Do.
Ta.bl• .. 20 .... limtoa LtM • !tons Co!pa!Y _Qu.!.m. l.ivertgn. Va,
~- ..... .,._"'e per .,;Jo o:i: .._..,,,c-r.t: Teot Tot.al lfo. Sole eia, depth. hoi&ht, St.-JJ>g, -. SJ>ociDg, boLe, del.11.1 per del.a7, Le<>gtll del.ll.f, T1pe ot
of bo~a in rt tt tt tt rt 1b internl.a lb NOC 1n.1t1atioa
117 •.• ll8 3,5 l8 !lottc. -·
8 9 9 .25.6 4 (,6£, 25 Cap
-· ...... .. ~.e per no. or "l'tllLilo•Cua...i;tlie Test '?Otlll. !lo. lklle $1&e, dept ht be:13ht, St-1lli. ~. S-1.Dg. boLe, de]JQ' per delay. Length de~. 1',rpe or
ot boles in tt tt tt tt tt lb 1.lltervale lb •1ec illitiatioo
164 ••. 26 6 80 80 l2 14 16 700 9 2,965 25 Cap 165 ••• 122 3.5 45 42 1 8 8 136 1 3,003 25 Do. 166 ••• 152 3.5 i.i, 40 7 8 8 lll.5 7 2,565 25 Do. 167 ••. J.28 3.5 45 42 1 8 6 1"2 1 3,124 25 Do. 16& ••• l 3.5 45 50 6 lO 0 150 0 150 0 Do.
Table B-22 .. - Sueerior Sto-ne Ceany, kchlll!n Qu!m. Critenaboro, H.C.
Bole race ~r.~ per ,.,. 0, ,._....~"":"'"'"'e Test '?Otlll. !lo. Hole siz.~. depth, be:13ht, St-, Burdeo, S-1ng, boLe, delay per delay. Lee,gtb d.tlay, 'l:7pe ot
or holes ill ft tt tt tt tt lb 1.nteri'ala lb •••c 1.niti.ation
us ... 49 3.5 30 27 6-10 7 7 6o-68 8 520 17 Cap 156 ... 44 3.5 30 27 8 7 7 80 9 565 17 Ila. 137 ••• 34 3.5 30 33 10 7 7 85 6 510 17 Do. 15' ••• 11 3.5 30 27 8-10 7 1 86 5 173 17 . Ila. 1,9 ... 54 3.5 33 30 8-10 1 1 73 7 658 17 Do.
<w•• '""• ... ,.__..~e per "'°' oi Max. cwu-ge Test 'l'otll.1. Ho. llale size, depth. beigbt, St-, :8ul"d.en 1 S-ing, bole, de]JQ' per delay. Length d•il,y • 'r,rpe ot
or boles in ft tt tt ft rt lb interval.a lb a1ec initiation
160 ••• 42 2.75 55 59 6 5 5 115 1 (,<,lo 25 Cap 161 ••• i.5 2."15 55 59 6 5 i' 105 7 644 25 Do. 162 ••• 33 3.5 55 59 6 1 172 7 857 25 Do. 163 ... 43 2.5 58-63 60 6 6 6 136 7 816 25 Do.
~·· .-ace vi;wu-ge per ""· or ~·CD&Tge
Te•t Total lfo. Bole si:e. depth. be:13ht. 9t-1Dg. Burden, Spac1ng, bole, delq P'f!T delay• Leogtll delo;r. 'l:7pe or or b.olelJ in tt ft tt tt tt lb Ulterv&la lb NOC 1..D.itiatioa
Ul. •• 39 7.375 200-215 185-200 12 30 2~ 3,910 26 7,820 17 C&j> 171 ... 46 7,375 200-215 185-200 l2 30 23 3,925 22 19,~ 17 Do.
Appendix C.-Particle Velocity and Frequency Data
A summary of the peak particle velocity and associated frequency data is given by component and site in Appendix C. The peak particle velocity given is the maximum value recorded, regardless of where it occurred during the recording. The frequency given is the frequency associated with the peak particle velocity. When the peak particle velocity is associated with two frequencies, one superimposed on the other, both frequencies are listed in the tables. with the predominant frequency appearing first. The scaled
•
92
distance is given for each gage station for each tesL This is the distance from blast-to-gage divided by the square root of the maximum charge weight per. delay or the total charge weight for instantaneous blasts. The shot-togage distances. from which the scaled distance was calculated, were determined by measuring the distance from each gage to the center of the blast holes having the maximum charge weight per delay.
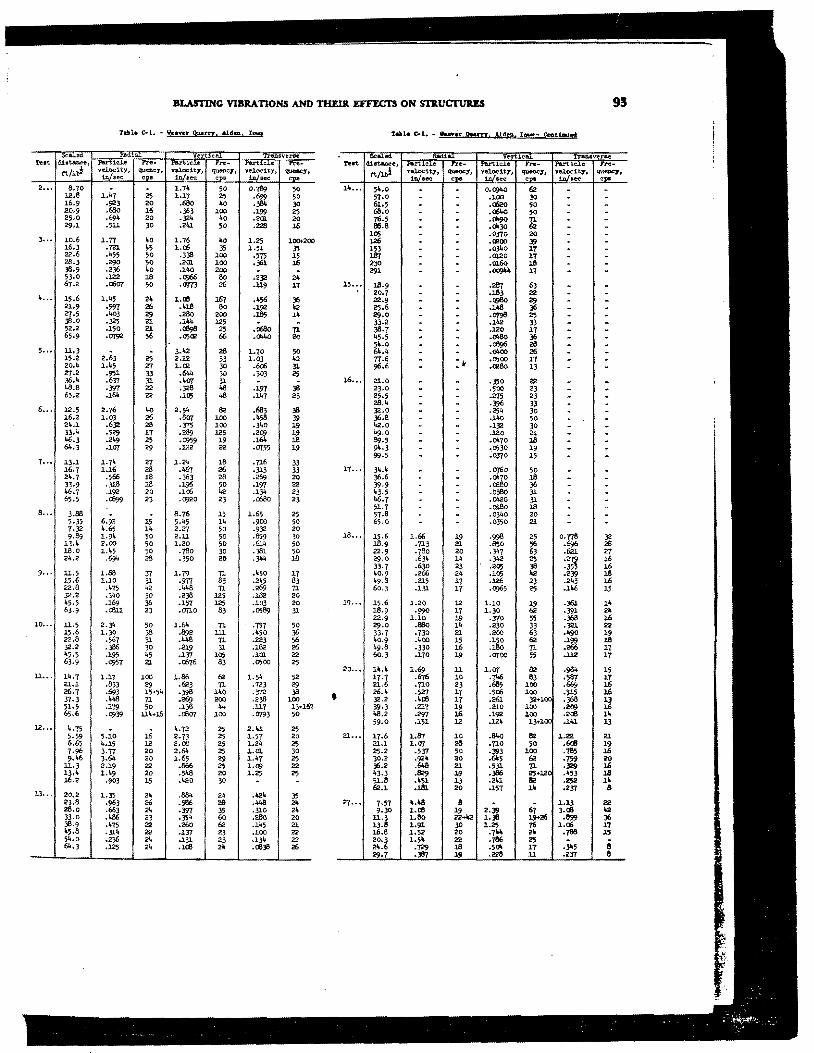
BLASTING VIBRATIONS A.ND THEDt EFFECl'S ON SD.UC'rult.ES 9S
oc~= Verticf!l..1 ..... 'l' .. t d.i•t.anee, Particle ..,..,. .-. ... iCJ.e rre- '-"~ Yr<•
tt/1.t v:;:~y, quenc7, v::i:!!71 qu=c7, vel.odty, queoc7, ens ~ u./aee """
--~ """"" Test diet.9.Dce, ~ .. icJ.o ,~. ~7· 1·-··-· z~·
tttal ~~7, ~7. vel.oc:it.y, "'"'""7• - """ WHC ""' 2 ••• e.10 - . 1.74 50 0.789 50 12.8 i.i.7 25 i.17 25 .69<J 50 16.9 .923 20 .680 4o .38Ji 30 20.9 .68o l6 .363 100 .199 25 25.0 .694 20 .32• 4o .2QJ. 20 29.1 .511 30 .2"1 50 .228 l6
14 ••• 5'-.o . - 0.0940 62 - -57.0 - . .100 30 . -61.5 - - .o620 50 - -68.o - . .06!.-0 50 - -76.5 . - .all90 7l - -es.a . - .oi.30 62 - .
3 ••• l0.6 l.77 4o 1.76 4o l.25 100.200 16.3 .121 45 1.o6 35 1.51 35 22.6 .455 50 .338 100 S15 15 2.'1.3 .290 50 .2QJ. 100 .:)61 l.6 38.9 .236 4o .111-0 200 . -53.0 .122 l8 .(1)66 8o .232 2• 67.2 .o6ar 50 ·CJT73 26 .119 17
105 . - .0370 20 - -126 . . .oooo 39 - . 1~3 - . .0340 lT . -187 - - .QJ.20 lT - -230 - - .Ol.6o l8 - -291 - . .OOJ" 17 - -
is ••• l.8.9 . - .287 63 - . .... 15.6 1.45 24 J..til l.67 .456 3li 21.9 .597 26 .41.8 8o .192 42 27-5 .403 29 .28o 200 .l.85 14 38.o .325 21 .144 125 -52.2 .150 2.1 .<;$8 25 .o680 7l 65.9 .ar92 56 .0500 66 ·°"° 20
20.7 - . .l83 22 - -22.9 - . .(98o 29 - -25.6 - . .1"8 J6 - . 29.0 - .0!98 25 - -33.2 - - .142 33 - -)8.7 - - .120 J.7 - -45.5 . - .Ol<So J6 . -
5 ••• ll.3 - 3.42 28 1-70 50 15.2 2.63 25 2.12 33 1.03 42 20.4 i.i.5 27 1.00 30 .6o6 31. 27.2 .951 33 .644 30 .303 25 36.4 .6rr 31 .4CJT 31 . -48.8 .397 22 .328 48 .197 38 65.2 • .t.61< 22 .10] 48 .J.47 23
5'-.o - - .c1l96 28 - -61..4 - - .oi.oo 26 - -77.6 - =~
.0500 17 . -96.6 . .008-0 13 - -
16 ••• 21.0 - - .350 22 . -23.0 . - .500 23 - . 25.5 - - .275 23 . -
6 ••. 12.5 2.76 4o 2.54 82 .683 38 16.2 1.03 26 .ear 100 ,458 39 24.1 .632 2a .J/5 100 .3"0 19
28.4 - - .396 33 - -32.0 . . .254 30 - -36.8 - - .14o 50 . -42.o - - .132 30 - . 33.i. .529 17 .289 125 .2()J 19 "9.0 - - .120 21 . . "6.3 .249 25 .0J59 19 .161. l.8 89.5 - - .0470 l8 - -64.J .1ar 29 ·= 22 .CJT55 19 91<.3 - . ,0530 l9 . .
7 ••• 13.1 1.7 .. 27 l.2 .. 18 .716 33 99-5 - . .0370 15 - -
16.7 l.16 28 .467 26 .313 33 2i..7 .566 18 .363 28 .269 20 33.9 .3J1! 18 .196 50 .197 22
17 ... 34 ... - - .(1/60 50 . -36.6 - - .0470 lB - -39-9 . - .cello 36 - -46.7 .192 20 .1o6 42 .13" 23 43.5 - - .0380 31 - .
65.5 .~ 23 • 0')20 23 .o68o 23 46.7 . - ,o42o 31 . . 8 ••• 3.88 . 8.76 15 1.65 25
5.35 6.92 15 5.45 14 .900 50 7.32 4.65 ii. 2.27 50 .932 20 9.89 l.94 50 2.ll 50 .859 JO
lJ.4 2.00 50 1.20 50 .6J.4 50 18.o l.45 50 .780 30 .)8l 50
51.7 - - .Qlllo lB - . 57.8 - - .0340 20 - . 65.0 - - .0350 2.1 - .
J.8 ... 15.6 l.66 19 .998 25 0.778 32 18.9 .713 2.1 .850 56 .696 26 22.9 .780 20 ,347 63 .621 27
2•.2 .6;)4 28 .350 20 .J"" J.8
9 ... ll.5 l.88 rr 1.79 7l .•50 17 15.6 l.10 31 .977 83 .245 83 22.8 .475 42 .448 71 .269 7l
29.0 .634 14 .3"2 25 :~ 16 33.7 .630 23 .20] 38 16 40.9 .266 24 .105 4.2 .239 lB 49.8 .215 17 .126 23 .243 l6 60.3 .131 17 .C(l65 25 .146 15
32.2 .3"o 30 .238 125 .J.82 20 45.5 .169 36 .157 125 .103 20 63.9 .dlll 23 .ap.o 83 .0'589 31
i9 ... 15.6 1.20 l.2 i.10 19 .)6l l' 18.9 .990 17 l.30 62 .391 2•
10 ••. ll.5 2.34 50 l.64 7l .757 50 15.6 l.30 38 .892 ill .450 36 22.B .567 3l .448 7l .223 56 J2.2 .]86 JO .219 3l .182 26 •5.5 .195 •5 .137 105 .lQJ. 22 63.9 .0J57 21 .o676 83 .0500 25
22.9 l.10 19 .370 55 .368 l6 29.0 .!l6o 14 .230 33 .321 22 33·7 .730 21 .200 63 ."90 19 40.9 .400 15 .150 62 .199 l.8 "9.8 .330 l6 .180 71 .266 17 6o.J .170 19 .aroo 55 .ll.2 17
11 ••. ii..7 1.17 100 1.86 62 1.54 52 20 ... l'·' l.69 11 l,CJT 82 ,954 15
17.7 .676 10 .746 83 .m lT 21.l .833 29 .623 7l .723 29 26.7 ,693 15•5• .398 140 .m 38 37.3 .448 7l .2{,r) 200 .238 100
21.6 .710 23 .685 100 .669 l6 26.4 .527 17 .5o6 100 .515 l6 32.2 .i.i:e 17 .261 32•100 .368 l3 • 51.5 .179 50 .138 44 .117 J.3+167
65.6 .OJ39 ll•+l6 .<il<:!f 100 .0793 50 39.3 .217 19 .210 100 .209 l6 48.2 .297 l6 .192 100 .2dl J.'
l.2 ••• 4.75 - i6 4.72 25 2.41 25 5.59 5.10 2.73 25 i.57 20 6.65 4.15 12 2.00 25 l.24 25
59.0 .151 12 .124 13+100 .lloJ. l3
21 ... 17.6 l.IH 10 .64o 82 J..22 2.1 21.1 l.CJT 28 .710 50 .6<S 19
7.96 3.77 20 2,64 25 J.,QJ. 30 9."6 3.64 20 1.65 29 l.47 25
11.3 2.i9 22 .866 25 l.OJ 22 l3.4 l."9 20 .;48 20 1.25 25 16.2 .903 15 .420 30 - -
25.2 .537 50 .393 lOO .785 l.6 J0.2 .924 20 .645 62 .759 20 36.2 .61.8 2.1 ,531 7l .329 l.6 43.3 .129 l.9 .JB6 ~·120 ·'53 l8 51.8 .451 13 .241 .252 i•
13 ... 20.2 l.35 2• • BB< 24 .42 .. 35 62.1 .181 20 .157 l' .2rr e
23.8 .963 26 .586 28 .448 2, 28.o .663 24 .397 35 .310 2, 33.0 ."86 23 .354 60 .28o 20 38.9 .475 22 .26o 62 .1•5 21 ,5.8 -3l4 22 .137 23 .100 22 54.o .236 24 .131 23 .13" 22 61o.3 .125 24 .lte 2, .te)!l 26
27 ••• 1S1 '·"8 8 - l..lJ 22 9.30 J..til 19 2.39 67 3.til 4.2
11.3 l.8o 22~ l.J6 19+26 .1159 36 J.3.8 l.!I]. 30 l.25 76 l.o6 17 16.8 J..52 20 .7 .. 24 .786 15 20.3 l.;4 22 .786 25 e 24.6 .729 lB .50!> 17 -~5 29.7 .367 19 .228 ll .2rr 8
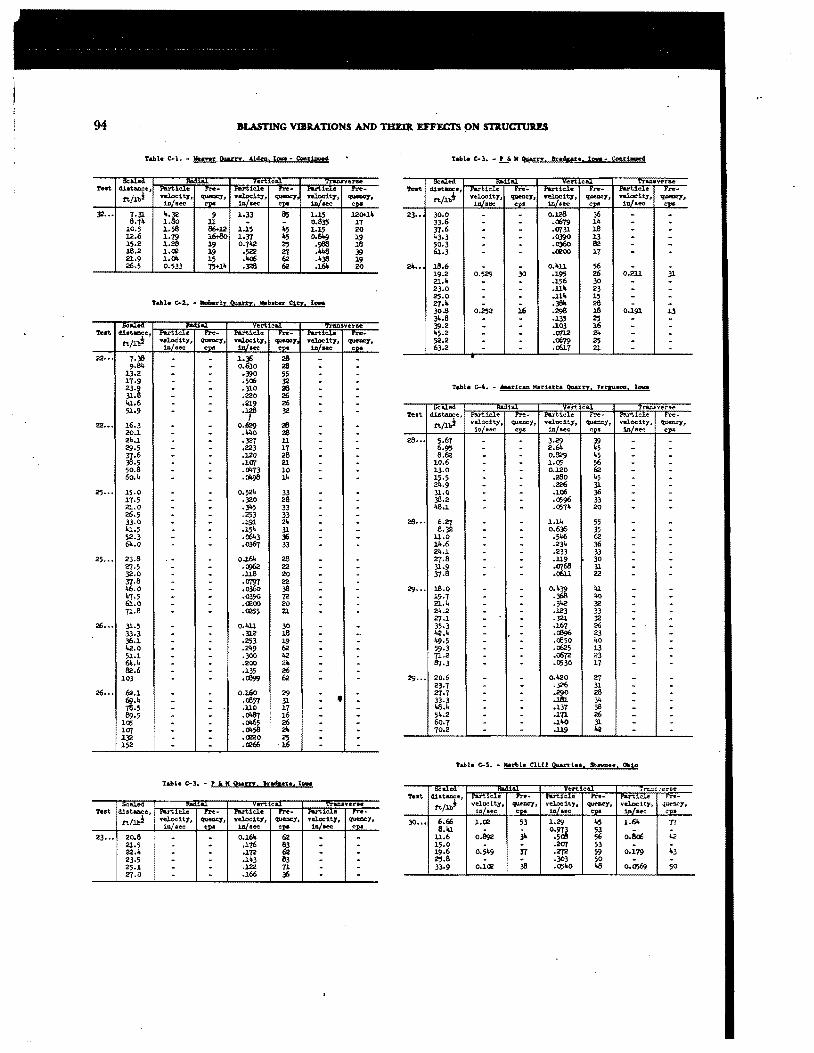
94 BLt\STING VIBRATIONS AND THEDt. EFFECTS ON STRUC'IUR.ES
"'"'"= Vert CIU '1'1'11.1WVer&e Twot hot dist&Dce:,
·---~· ,,..._
---~· ln· .!'&rt.~ .......
fi/l.~t velocity, queiiq, nlocit;r, quency, ftl..oci.t7, ~· W•ee e"" in/ .. c e•• waec
32 ... 7.31 J,.,32 l.J.5 8.74 l.80 u 0.83S
l.0.5 1.58 86+l.2 1.15 .\.5 l.J.5 l.2.6 1.79 u;.ao 1.31 .. , 0.11119 15.2 1.28 19 0.7'2 25 .988 18.2 l..il! 19 .522 27 .lo.\.8 21.9 l.OI. 15 .11()6 62 • .\.38 26.5 0.533 15+14 .)26 62 .J.64
23-· 30.0 . . o.l.28 36 . . 33.6 . . .o679 14 . . 31.6 . - .0731 18 - . 43.3 . . .0390 lJ . -50.3 - . .o)6o 82 . -61.3 . . .a.100 17 . .
2.\... 18.6 . - 0.4ll 56 . . J.9.2 0.529 30 .J.95 26 0.2.ll 31 2J.,J, . . .156 30 - . 23.0 . - .ui. 23 . -25.0 - . .ll.\. 15 - . 27.i. .
i'6 .384 28 - . 30..S 0.252 .296 18 0.J.91 l3
---~ ,.,.,. C&I. ver-ae
34.8 - . .135 25 . -39.2 . . .J.03 16 . .
Twot d.bt.uce, ............ ·~- ............... ZTI'6 ·-··-· .... fi/l.J •:%;:1, Q:uenc7, ~.!!'"• ~ ~,.!!7• -· """
.,,,. CM
.\.5.2 - . .QTl.2 24 - -52.2 . . .o679 25 . -63.2 - . .o6l7 2l .
22 ... 7.38 . . 1.36 28 - . . 9.Sll - . 0.630 28 . -J.3.2 . . .390 55 . .
17·9 . - • 5o6 32 - . 23.9 . . .310 28 - . 31.8 - - .220 26 - . "1..6 . - .219 26 - -51.9 - . ·ir 32 - -
22 ••• l.6.3 - - 0.629 28 - . 20.l . - .oi.o 28 . . 24.l. . . .327 u . . 29.5 - . .223 17 . . 31.6 . . .l.20 28 - . 38.5 . . .101 21 . .
28 ••• 5.67 3.29 39 6.95 2.6"- .. , 8.62 0.829 •5
10.6 l.()'j 56 50.8 - ,()1'73 10 . . 13.0 o.l.20 62 60.4 . - .o1.98 l.4 . . J.5.5 .280 45
2•.9 .226 3l. 25 ... 15.0 . - 0.524 33 - . 31.0 .J.o6 36
17·5 - . .320 28 . . 38.2 .0596 33 21.0 . . .345 33 . . "8.1 .0574 20 26.5 . . .253 33 . . 33.0 . . .191 2.\. . - 28 ... 6.27 l..J.4 55 41.5 - . .154 31 . . a.32 o.636 35 52.3 - . .()603 36 . - u..o .5"6 62 64-.o . - .0367 33 . . 14.6 .234 36
24.l. .233 33 25 ••• 23.6 . . . O.J.64 28 . . 27.8 .u9 30
27,5 - . .(:962 22 . . 32.0 - . .ue 20 . . ~:~ .0768 31
.o6ll 22 31.6 . . .0191 22 . . 46.o - . .o36o 38 . -47.5 - . .0390 72 . . 29 ... 18.o o.439 "1
19.7 .368 "O 61.o . . .ll!oo 20 . . 2J..4 .342 32 7.1.,8 - . .0055 2l - . 24.2 .l.23 33
26 ••• 31.5 - - o.w 30 . . 27.i .32J. 32 35.3 .167 26
33.3 . . .312 18 . 36.1 - . .253 l.9 . . "2.0 . . .249 62 - .
42.4 .<&]6 23 "9·5 .dl50 40 59.3 .o625 13
51.1 - . .300 "2 . . 7.1..2 .o672 23 64.4 - . .200 24 . . 67.3 .0530 17 82.6 - . .135 26 . .
103 . . ·dl99 62 . . 26 ••• 62.l . . o.l.6o 29 . .
69.4 . . .dl57 31 . • . 78.5 . . .uo 17 . . 89-5 . . .0487 16 . .
l.05 . . .Qli65 26 . .
29 ••• 20.6 o."20 27 23.7 .326 31 27.7 .290 28 33.3 .llll. 3" "8.4 .J.37 38 54.2 .l.71 26 6o.7 .ii.o 31
10'( . . .0458 2i. . . 70.2 ·U9 42 132 . . .(220 25 . . l.52 . . .Cl!66 16 . .
Tab1• e..s .... Karbl• Cliff Q!!!'.!1•• 1 ShMm••a CJ.to
Tabla C-3. •• I!" Ouarrr lr!M,ar.1 low
30 ... 6.66 l.il! 53 1.29 •5 1.61> TT a.u 0.913 u 23 ••• 20.8 o.J.64 62 u.6 0.892 34 .5<8 o.&16 42 2J.,5 .1~ 83 15.0 .2(ff 53 22.4 .172 62 19.6 0.51+9 '!'( .212 '9 0.179 .\.,; 23-5 .J.•3 83 25,8 ,303 50 25.l. ,J.22 7l. 33.9 O.l.<2 38 ,0540 "8 o.~ 50 21.0 .l.66 36

~--'htt d.Htance
f:t./lJ
30 ••.• l0.5 1.2.6 l•.9 17.2 20.5 24.2 26.8
lJ, ••• 7.51 9."4
12.5 16.3 20.9 27.3 )4.0
,3l ... 19.7 21.5 23.7 25.9 29.1 32.6 37.0 "2.o
ei ••• 9."6 ll.l 13.9 17.4 22.5 29.1 37.6 1+9.6
62 ••• 6.89 6.80
ll.4 14.9 19.6 26.2 34,5 45.5
83 ... l.Jl.9 23.1 29.0 36.6 47.4 61.4 eo.2
105
Tut
33 ••• l.4.1 16.4 19.1 22.2 25.9 30.l 35.2
Test
34 ... 7,55 9.70
12.• 20.7 26.6 )4.o lilo,4
PAll.TICLE VELOCITY AND FREQUENCY DATA
.. ,.,_ ..... . ...... ra;oo.iCJ..e ,.,.,,_
~ ic.1.e ,,.._ "''"'"'"""'
,,.._ Test ttlocity, que.oe7, ":f.!!"' -""1• ~:7, -1. W•ee .... ~ . ... - - l.10 48 - . 42 ••• - - l-32 48 - . - - 0.527 50 - -- . .473 30 - . . - .375 2• . -. . .232 33 . . . - .31 .. •5 - .
2.05 "° 1.62 67 1.22 loa
'2 l.o6 56 0.783 .552 50 .TJ6 38
75 ...
26 .236 63 -.262 .177 loa .191! 30 - . .130 ~ - . .175 20 .0)29 .127 19
. . .238 36 . -- . .2dl 50 - . . . .120 1" . . - . .182 50 . . 78 ••• . . .135 "° . -- - .llll 31 - -- - .lOl 2" . -- - .l.26 22 - -
l..29 42 .733 48 ,366 71 l.0,1 "° .758 4-0 .680 45
.488 27 .360 38 .301 19
.324 26 .226 30 .176 29 79 ...
.334 2l .265 30 .147 29
.263 20 .116 50 .130 32
.212 2l .o62o "° .0,112 22
.o68<) 15 .0545 24 .0597 lJl
l..60 46 .990 50 .678 48 l..41 30 l.03 53 .867 30
.743 33 .954 50 .668 33
.835 20 ,374 31 .560 2l
.re-, 20 .24" 26 .21+9 21
.265 14 .110 22 .J.l.6 19 .2(11+ 45 .o68l 53 .a133 91 .112 16 .Ol+66 38 .<J6<19 50
.478 10 .3ll 13 .448 27 'hst
.560 32 ."61 33 .292 33
.379 32 .253 'Z1 • 265 "° .210 26 .223 50 .2(,t; 23
.257 24 .126 2l .2o6 19 35 ...
.170 J.9 .<17"6 36 .lOl 15
.116 J.4 .01+71 lJl .dl8<> 13
.o617 16 .0303 16 .{)1;48 12
37 ...
T•bl• C.6. - p..iltoo Qyarry. M.ari<m. Cillo
37 ••• 0.631 23 0.359 30 o.~5 14
.340 56 ,550 21 .J.89 71
.l.64 16 .257 23 .211 16 .245 l• • .w. 16 .217 25 .110 17 .l.61 ll
38 •••
38 ... 3.25 56 l.53 3" 3.47 42
2.19 19 4,26 42 2.dl 17 .736 30 .637 2l
.760 36 .651 23 .827 ll .6?} 45
.26o ll
TU1• c.:r. - rt..t.t !osk ().&am. !IOrthent Cillo StOM Co!p!!r, Plat lock. l.bio - Continued
OCa.J.OQ Vert "'" <list-• """'"""' ,,..,. .ran11;!.le ,,..,_ l'ol'tiel.•
tt/1.J ~s!!;r, -· ... :;r_;::r. """"""'' ~,!T1 """ .... "·&!' - 5.7• 2l 5.10 6.0o 5.63 15 5.1 .. 22 2.20 6.30 5.56 15 3.67 20 l..6'
10.9 - l..91< 10 l..loa 1" ... 2.57 l6 .9<17 53 l.Cll. J.8.6 l..66 lJl .930 26 l..l!l. 2".6 1.20 l6 .563 2• l.l.3 32.3 .~ 26 .672 9 .710
7.0,1 2.17 25 1.79 37 2.J.9 6.95 2.3" 27 l-lo!I "° l.41
;ll ... 2.19 42 l.l .. 46 1.68 14.7 0.909 loa l.Jl 45 0.967 l.9.2 .764 3" 0.896 59 .56<> 2•.7 • 79" loo .950 77 l.C2 32.7 ·""1 50 .lool "° .lt.111 "2.6 .309 14 .o667 ll .346
6-77 2.o6 22 2.65 22 2.32 7.96 2.19 26 1.86 ~ l.67 9.42 2.ai. 24 l.31 32 l..J.8
11.5 1.72 23 ~ 0.912 30 o.e6l. 14.2 1.•7 9 .766 17 .634 17.5 1.0,1 3" .674 10 .768 22.1 0.590 43 .373 •3 .936 27.9 .3111 23 .278 20 .263
22.9 O.lool ll o.6ll 26 o.m 26.7 .364 30 .278 25 .334 31.2 ,341
~ .134 4-0 .251 37.9 .2&f .147 ~
.246 "6.l. .235 23 .lOl .261 56.7 .152 20 .o6o6 32 .l.62 '!l·O .120 16 ,05"6 l!l. .J.56 89.2 ·o669 24 ,(ll+22 17 .oi.71<
~-~ ••rt c= diatanee, n:ruc;.• h .. n.rdclt: ,.,,_ Pa.rt.!cl.e
t:t./lbt V:!j.!;11 queoc7, ·~,;:11 quooc7, v:r.!~7, ... ·~·
19.6 1.l.Jl 20 o.66o 63 o.668 27.3 .636 33 .765 48 -37.1 .385 26 .21• 56 .215 50.7 .590 25 .J.85 loa -69.S .190 32 .dl2o 50 -
145 - - O.L'J92 42 -162 - - .<1!65 33 -J.81 - - .0248 33 -2o6 - - .Ollilo •5 -23" - - ·= 25 -'Z'jO . - .00105 45 -314 - - .oo634 36 -368 - - .oo672 33 -90.1 - . 0.0977 31 -9"·1 - - ,<1703 39 -
lei! - - .Ola 29 -lll - - .0317 31 -l22 - - .0387 31 -lOo . - .0313 33 -161 - - .C26l 23 -168 - . .Q1B6 45 -141.o - - 0.030,1 •3 -159 - - .Cll!)4 56 -178 - - .0132 77 -203 - - .Cll.Ol 53 -233 - . .octll.8 •5 -2{,tJ . . .00658 37 -314 . - .()0526 loa -369 - - .ooua 59 -64,o . - 0.0799 37 -88.6 - . .Oll62 42 -96.6 - - .oi.i.5 71 -lo6.o - - .0370 33 -
117 - . .0368 56 -13" - - .(223 46 -155 - - .a2C6 "2 -163 - - .0315 38 -
95
verse .....,_ ~7·
J.I• 12 26 36 53 25 13 26
31> 33 45 29 33 63 24 14
23 26 ll •5 50 20 63 l!l.
18 2l. 2l 2l 24 25 J.8 24
verse . ,,_ quenc7, .~ . 71 . 53 -----------. -----------. -. -------.
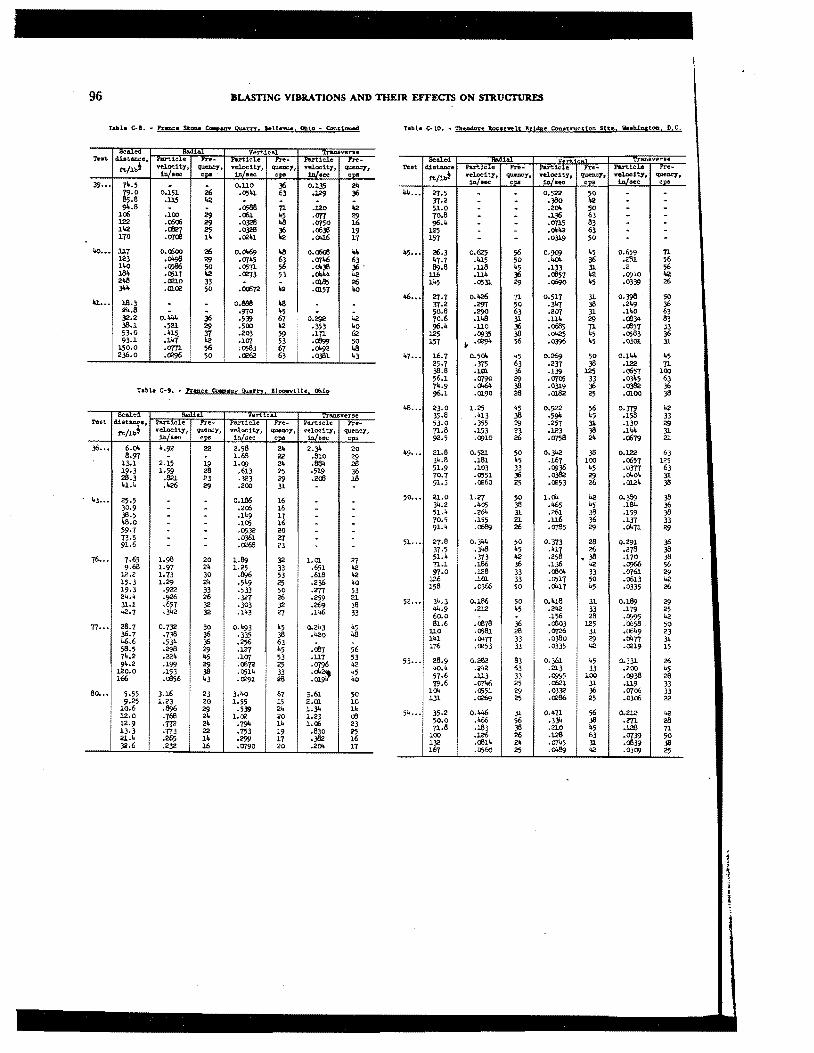
96 :BLASTING VIBRATIONS AND THEIR EFFECl'S ON STRUCTURES
Tabla C-1 ... hanc:e Stone ec.&ny Qu!!TT· lel lnou.e, Obto • Coctiaued
~~= ••
39 ... 71>.5 o.uo 36 o.i35 24 79.0 0.15J. 26 .05•1 63 .129 36 85.S .lJ.5 42 94.a .0588 71 .l.20 "2
106 .100 29 .061 •5 .an 29 122 .06<:6 29 .0328 l+8 .cr;o 16 142 .Ci!J2:7 25 .()328 36 .0638 19 170 .oral l• .0241 "2 .awi l.7
Teat distance Part1c~~,1 ~: r&.r .. tc-J.e ,.,... ft/~ nl.oeit7 ,,., TelOCity, quen.c;:7, veloc1t)', quent'J',
1n/see l.n/•eo CPB in/He ""' "··· 27.5 - . 0.522 50 - -
'J7.2 - - .380 42 . -51.0 - - .2oi. 50 - -10.8 - - .136 63 - -96.i. . - .0715 83 . .
l25 - - .oi.42 63 . -157 - - .0319 50 - -
40 ••• 117 o.(Xloo 26 0.0069 l+8 o.<1i08 ..... 123 .01!98 29 .0745 63 .0746 63 l"O .O')ll6 50 • 0571 56 .oi.39 36 . iai. .0517 "2 .0273 53 ·°""" 42 2"8 .02lo 33
~ .0185 26
Jl"' .Ql02 50 .(X.b72 .0157 Ito
45 ••• 26.3 0.625 56 o.m 45 0.659 71 47. 7 .415 50 ·"°" 36 .. 2?.l 56 89.8 .ua 45 .133 31 .<. 56
llh .ui. 36 .al57 lia .09<-0 42 145 .0531 29 .0690 45 .0339 26
u ... J.8.3 o.aaa "8 24.8 .970 45 32.2 o."44 36 .539 67 o.~ 42 38.1 .521. 29 .500 lo2 .353 i.o 53.0 .415 ~ .203 59 .171 62 93.1 ,l.41 .107 53 .Cflr;9 50
150.0 .mi 56 •0583 67 ·°"92 l+8 236.0 .0296 50 .0262 63 .oJSl 43
"°··· 27.7 o.426 71 0.517 31 0.398 50 '37·2 .297 50 .347 38 .249 36 50.e .290 63 .207 3l .l.40 63 70.6 .148 31 .ll4 29 .alJ4 63 96.4 .uo 36 .ota5 11 .(657 33
125 .0935 38 .""25 45 .0583 36 157 • .0294 56 .0396 45 .030l 3l
47 ••• 16.7 o.5oi. 45 0.269 50 0.144 45 25.7 ·'375 63 .237 38 .122 71 38.8 .1Ql 36 .lJ9 l25 .0657 lOO 56.1 .0790 29 .0705 33 .0345 63
Table C-9 ... hc:tee ~an;x 9!:!!r£.X 1 Bloosvttlta Ohto 7i..9 .oi.64 38 .0319 36 .0382 36 96.1 .01.90 28 .Ol.82 25 .01.00 38
48 ••• 23.0 l.25 45 0.922 56 0.379 42 Dea.led ~a ertica.i ·.rri!m.Sverse 35.8 .413 .J8 .594 45 .158 33
T .. t dista.oce, . nu·~LCJ.e ...... Particle ,.,. .. , .... .. 1e.Le rr•-tt/l~; veloc1t71 quency1 v:!is!~y, queac;y. velocity, quetley1
CD,! cna ,,,, ... cps
53.0 .355 29 .257 31 .130 29 11.8 .153 23 .123 .J8 .144 31 9'2·5 .~lO 26 .0758 24 .o679 2J.
36 ... 6.oi. 4.92 22 2.58 24 2.34 20 8.97 - - l."8 22 .810 29
lJ.l 2.15 19 l.~ 24 .864 28 19.J l.59 28 .613 25 .519 36 28.3 .821. 23 .323 29 .2(6 l8 41.4 .426 29 .200 31 - -
49 ... 2.l..8 0.521 50 0.342 .J8 0.122 63 34.8 .lSl 45 .l67 lOO .0657 125 51.9 .103 33 .0936 45 .om 63 70.7 .0551 36 .0382 29 .Ql;.04 31 91.3 .0260 25 .0253 26 .0124 .J8
43 ••• 25.5 - - o.186 16 . -30.9 - - .206 16 - -JB.5 - - .149 17 . . l+B.o - . .105 16 . . 59.7 . . .0532 20 . -
50 ••• 21.0 l.27 50 l.oi. 42 O • .J89 38 34.2 .405 .J8 ."65 45 .184 36 51.4 .264 31 .261 38 .159 38 70.5 .155 21 .u6 36 .137 33 91.4 .C689 26 .1]185 29 .oi.71 29
73.5 . - .0361 27 . . 91.6 . - .02"8 23 . -
76 ••• 7.65 l.98 20 l-89 32 l.Ol. 27 9.ta l.97 24 l.25 33 .651 42
12.2 l.73 30 .896 53 .6l8 42 15.3 l.29 24 .549 25 .236 40 19.3 .922 33 .533 50 .m 53 24.4 .926 26 .327 26 .259 2J. 31.1 .657 32 .303 32 .269 38 42.7 .342 32 .143 27 .l."6 33
51 ••• 27.8 0.344 50 0-'373 28 0.291 36 37.5 .31+8 45 :~;~ 26 .278 .J8 51.4 .373 42 • .J8 -l70 38 11.1 .186 36 .136 42 .a;JOO 56 97.0 .128 33 .c6o4 33 .0761 29
126 .101. 33 .0517 50 .o6l3 42 158 .oJ66 50 .oi.17 45 .0335 26
52 .•• 34.3 0.186 50 0.4l8 31 0.189 29 44.9 .212 45 .242 33 .179 25 60.0 - .156 28 .ow.; 42
17 ... 28.7 0.732 30 o.493 45 0.243 45 36.7 .738 36 .335 .J8 .420 l+8 46.6 .534 36 .256 63 56.5 .298 29 .127 45 .<it[ 56
81.6 .<itfS 36 .c6o3 125 .()';58 50 llO .0581 28 .0726 3l .()';49 23 141 .0477 33 .0380 29 .0477 31 176 .0253 33 .0335 42 .0219 15
74.2 .224 45 .107 53 .u7 53 94.2 .199 29 .0672 25 .0796 42
120.0 .153 38 .0514 33 .oi.2~ 45 166 .(656 43 -""91 28 .01.94 i.o
80 ... 5.55 3.16 23 3,40 67 3.61 50 9.25 l.23 20 l.55 15 2,Ql 10
l0.6 .896 29 .539 24 l.34 14 12.0 .768 24 1.02 ao l.23 c6 l.2.9 .m 24 .794 14 l.06 23 13.3 .773 22 .753 19 .830 25 21.4 .265 1'+ .299 17 • .)82 16 32.6 .232 16 .11190 20 .2oi. 17
53 ••• 28.9 0.262 8J o . .l6J. 45 0.331 26 4-0.4 .a42 63 .213 33 .zoo 45 57.6 .u3 33 .C9')5 l.00 .0938 28 79.6 .07"6 25 ."621 31 .u9 33
104 .0551 29 .OJ32 36 .0100 33 131 .0269 25 .0286 25 .0306 22
54 ••• 35.2 o.446 31 o.471 56 0.212 42 50.0 .466 56 .334 .J8 .m 28 11.8 .l8J .J8 .210 45 .l..28 71
100 .l.26 26 .12a 63 .l'.1j'J9 50 132 .<:614 2• .0745 3l .d!39 38 167 .0560 25 .Ql.89 42 .Ol09 25
l i

PARTICLE VELOCITY AND FREQUENCY DATA 97
T&bl• C-11 .. - lkv York Trff loc.lr. £omuti09. CHntop ?otnt gum. !o'1ghke.epdt. M.Y.
~-= .. ·~ ,.,... ,,,, .. d1ttance, ,.,.,, ... ,.., .. - ,_ ..... c.t.e ,,.., . ...-.. ;1eJ.• ,~.
rt/l•t velO<!ity, l\U:eDCJ'1 velocit,17 _,., velocit:tJ -7. in/sec CUI woee ·- in/NC ...
55 ••• 15.• - . 0.717 2• . •. 16.7 - - .418 45 " -22.l - . .263 •3 . -26.5 - - .2•5 33 - -37-5 - - .1611 "2 . . 56.4 . - .203 3" . -
56 ••• 27.• - 0.3"7 27 . 1o9,3 0.17• 16 .(1175 ill 0.148 13 52.0 .0716 lo8 .(156o 56 .101 Ii:? :;l>.6 .0537 53 .oi.57 56 .1ai. "2 58.2 .Cf[ffi 23 .ar"6 36 .ci191 33 62.2 .()582 37 .0631 67 ,<J699 48 67.3 .0571 32 -o499 )6 .0153 J6 73.1 ,c;,39 "° .oi.611 33 .<1;67 29 81.3 .0')¢9 3" .Cll61 3" .ce6:1 28
57 ••• 27.1 . . 0.270 •5 - -41.6 - - .• 139 43 0.130 27 i.i..9 0.25• 48 .1•3 56 .J.2() 50 48.o .152 \2 ,J.25 67 .2Cf1 loll 51.5 ,"1.l 16 • 189 •3 .270 19 55.0 .176 28 .123 51 .193 30 68.1 .152 32 .128 3" - .
58 ... 28.7 o.618 •5 0.631 14 o.480 19 32.6 .562 21 .269 •5 .523 •5 37.0 1.l2 16 .i.10 "° .676 20 '2.2 .5i.7 20 .""8 •3 .7"6 16 47.1 .Ji:u •3 ,6J.O 13 - -53.6 - - - . .225 36 6<).5 . - . - .328 \2
59 ... 22.7 - - o.ffio 50 -35.0 0.452 29 .296 •5 0.358 50 39,7 .270 50 .228 50 .439 50 .... 2 .338 32 .215 53 .200 53 49.3 .219 53 .913 16 ,348 17 56.5 • 3"1 l .. .230 48 .302 "O 63.5 .265 53 ,327 16 .215 53 72.8 .J1J2 "2 .226 45 .175 "9 82.o .123 36 .176 "2 - -
62 ... 38.0 - - 0.120 36 . . 38.0 . - .127 43 26 52.• 0.120 56 .U8 "2 o.116 55.5 .102 38 .0028 56 .116 32 65.7 .102 32 .O'Jll 56 .l26 48 73,3 .l28 29 .139 "2 • 176 37 78.0 .153 28 .12• 33 .125 38
63 ... 8.49 l.2 .. l8 l.3" "2 . . 12.0 l.16 23 l."6 30 - -17.0 .aao 21 .835 3" - -24.l .588 23 .620 22 - -3".0 .2.81 34 .3"1o "2 . . "8.1 .190 50 - - - .
63 ••• 16.1 0.5"9 29 0.581 56 - . 21.8 • 732 29 .618 23 . . 30.8 .228 23 .2ar 31 - . 38,3 .166 25 .2•5 33 . .
60 ... 21.2 0.627 50 o.438 i.o - -28.3 .:m 18 .303 3" - -"6.o .101 50 .137 63 . . 55.2 .156 50 .dll.e 36 - -77.1 .106 \2 .0520 20 - .
106 .0322 56 .0357 15 - -64 ... 27-6 0.172 30 0.121 29 - -
35 ... - - .0517 . - -"8.8 .005 .. 21 ,0505 37 - -6o.l .11• 16 .ar31 26 - . 83 ... .0332 - .0351 - - .
la2 .019" 9 ,Ql.83 19 . . 65 ... 8.oo 0.657 "° o. 705 33 - .
l0.7 .658 17 .63" "° - -17.J .258 29 .202 30 . . 20.8 .258 l6 .121 26 - . 29.1 .220 25 .12• 2• - . "°·0 .177 36 .o676 53 . .
&; ••• a.oo 2.<ii 50 l.80 36 . . 16.o ,9(,6 50 .76o 36 . . 20.4 .718 26 .358 "2 . . 29.1 .2ar 22 .125 "1 - -)6,3 .133 28 .105 30 - .
Tabl• C.-u. - hit Torts frap Kock Corporatl9!J. CUat:on PoiAt Oua.rn· rougbkeepab 1f1X, .. get t..!'.!ed
.,.,....
(q ••• 8.0l l./o9 30 l.63 37 l.46 25 9.60 l.86 9 l.33 J6 l.16 20
12.0 .977 ll .676 33 .560 l3 14.7 -~56 9 .518 43 .517 ll 18.3 .387 "2 .Jll 37 .)68 71 22.7 .3ll 29 .211 J6 .269 "8 28.o .1"6 )6 .158 36 .J.~l 56 3"-8 .J.28 1,5 .12• 50
~--..... ""' .,.,... 4.1.•t.U:tice, ParticJ.< ,.,.,. ,..._ ie.1.e ,.....,_ ,,..,.,,.ic:J.e .,..._
rt/lbf velocity, """D<l'• Telocity, ..-7, Telocit7, -:r. ··'·"" """ w .. ec ... w-. """
6o ••• 13.3 4,87 45 • 3.86 1 3.16 33 16.9 3·"1 "2 - -22.Q l.65 28 .8<;6 1,5 1.26 29 36.8 l.ar 50 - . - -"9.l - - .495 71 - .
139 ••• l0.6 l.47 63 J.59 36 l.73 50 13.2 2.69 33 3.•5 33 l-99 25 14.5 2.27 33 3.39 36 2.59 29 18.1 1.611 "2 .686 36 .837 20 18.6 4."2 33 2.76 50 l."6 50 26.4 .186 45 1.05 50 l.61> 45 31,9 .972 50 .737 "2 .624 50 i.o.5 .631 50 .455 63 .558 50 52.8 .619 50 ."29 50 .363 63 77.5 .551 i.5 .372 71 .339 56
l"O ... 13.l 2.57 31 2.31 31 i.ar 28 16.o 2.05 29 1.96 31 .864 28 22.0 i.ar 23 l.52 42 .7"2 38 25 ... 1.78 31 l.63 45 l.05 36 28.6 . - . Ji..6 l.27 45 .7f!I) 25 .los>o 56 4!1,3 .632 71 .357 71 ."13 63 60.3 .351 83 .239 •5 .214 71 82.9 ,556 56 .i.71 63 .lo.00 63
l .. l ... 15.6 l.18 33 2.1• 56 l.'ir'/ .
29 19.4 2.ar 33 3,0') 42 2.29 28 23.0 .965 50 .914 50 .527 50 30.2 l.e>;l 56 l.17 38 .797 42 31.9 l • .J8 50 .936 63 .765 63 37.7 1.03 45 .(Qr 2l. .380 50 "6.8 ."67 56 .301 26 ·"19 63 59.6 .339 "2 .31• 1,5 .212 63 85.5 .411 56 .273 71 .:J<TT 63
1"2 ••• 13-9 2.71 "2 1.67 •5 2.56 71 19.0 1.5 .. 36 l.ll 45 l.ar 31 23.6 1.20 31 1.61 50 .fftl;, 29 n.• 2.19 31 i.i.o 63 .&,;2 2B 31.0 .Mi. 33 .375 25 ."°5 50 31 ... - - - . 37.7 l.43 7l .m •5 .837 63 44.3 - . - - -44.9 l.cn 50 .6117 50 .lo'ir( 50 "9.9 - . -• 53.8 .519 56 .253 J6 .260 •5 66.l .383 50 .l6o 71 .27• ~ 91.1 .677 63 .i.19 56 .•53 71
1•3 ... 13.l l.57 42 2.19 63 l.60 J6 15.7 2.67 50 1.70 56 l.87 45 lS.7 2.ar 50 l.62 50 "·"1 66 22.4 l.ll "2 .909 71 .721 "2 26.7 ,190 50 .680 50 .1ar 66 32.1 l.J6 45 l.61 56 .962 ~ 31.J .882 •5 .806 83 .519 63 "6.0 1.28 J6 l.o4 83 .863 J6 54.6 l.03 56 ·9"9 56 ·7l" 50 69.1 1.06 "2 ·90l 26 .766 50

98 BLASTING VIBllATIONS AND THEill EFFECfS ON STll.UCTUJlES
Ta.bl• C-12. lw Yori: TTap Iock C:OrporatiOQ 9wtnJa WHt Nyack. Jll. Y .... Continued Table c .. u .... LlttleTUle 0.-, Cotu:tnctlOG Site: lluntb!l:tOD, .......
~-= c&1 ...... .. ....... Vert co.L ver1e :r ... diatance ra.n.ic.J.e -- ra.n-.icJ.e -- ....ruc.o.e P'H·
rt/lbf vel.oe1ty, que:nc7, ~!!7' l{Ua:w:7, ~!!>"• ~· w ... ·~·
.... ,,.,.It d.1stance,, ~icle Fre· .l:"lt.I' 1e1e ~- """'""""
,,.... rt/u> ~!!7' q)l<llC)", "!!'f.~7, -· ~~~y, quooq, ·- - .....
11+4 ... 20.4 0.891 56 0.924 42 OS19 42 25.3 2.17 56 l.lB 50 ~:~ 50 27.9 2.Clf 56 l.45 56 56 27.3 l.89 42 2.2'.l 50 1.20 56 31,2 .650 42 .526 71 .363 42 ;i..8 ·"14 45 .746 42 .761 56 39,5 .914 50 .950 56 .622 -5 1+4.0 .593 50 .467 63 .352 83 51.6 :~ 50 .983 56 .576 50 59,3 38 l.Oj' 56 .994 42 72.0 .905 56 .558 100 .493 ~
145 ••• 22.0 0.51.8 38 o.455 33 0.620 56 26.8 .517 50 .So; 63 .538 56 Jo.a .455 42 .557 42 .JO) 50 35.2 l.52 36 .797 56 .81ll 38 36.9 .579 38 .31!6 100 .376 42 40,5 .303 38 .537 36 .437 ~ 47.6 .~· 83 ."90 125 .463 63 55.7 .403 31 .351 63 .358 56 67.1 .503 63 .426 63 .415 45
68 ... lll.8 l.CI< 63 0.997 56 o.571 40 28.5 .6Clf 36 ,513 "8 :;1:2 3'! 36.8 .380 59 .575 30 26 51.4 .472 28 ,475 22 . 74.l .100 l3 .176 67 • teal 15
lo6 - . - - .0547 28
69 ... 13.5 i.61 39 l.37 Jlo. 1.26 32 20.3 .$oo ~ .790 63 .4;1> 38 29.3 .4211 .409 lo5 .456 33 31.2 .310 63 .42- 33 ."4li 26 51.0 ,329 30 .261 "8 .391 20 72.7 .o822 l2 .139 67 .er 14
103 - - .o62l. 59 .Oil33 17
70 ••• 13.7 0.915 53 0.849 10 0.673 10 20.4 .695 lil2 .560 45 ,543 32 26.2 .360 37 .7loo 30 .577 26 36.2 ."81. l!6 .570 lil2 .590 17 51.9 ,1J2 l2 .219 63 .W(O J.6 73.9 ~ .lOll 20 .dl35 10 .0590 22
146 ... 16.8 1·31 56 1.58 63 l.00 "'5 19.5 .868 56 .659 56 ,455 83 23.6 .933 45 2.00 50 1.38 42 27.6 l.31 56 l.l.8 33 1.33 63 33.7 l.01 36 1.29 56 1.26 33 40.5 .986 56 .642 50 .8119 45
71 ••• 22.7 0.589 50 0.589 71 o.1+49 42 33.4 .463 45 .)41 lo3 .455 ;i. 4J.l .493 59 .469 30 .432 26 59,7 .353 33 .369 loo .493 19 85.7 .ci149 l3 .124 67 ,0566 15
122 . - .o6ll Jlo. .0464 22 48.4 .729 56 .50il 63 .419 50 57.9 .760 63 .8119 63 .!27 45 76.3 .)84 63 .317 100 .177 63 82.8 . . .d\52 100 • o64JI 83
147 ... 1+4.0 O.l6o 6) 0.163 56 o.243 63 61.7 .o631 50 .01176 36 .o631 56
72 ••• lll.1 0.501 53 o.368 59 o.412 48 26.6 .446 43 .268 50 .369 43 34.1 .2dl 53 .285 loo .283 30 47.3 .232 37 .228 48 .184 19 67.8 .Oil61 ll .C1172 63 .CJ294 33 96.7 .0314 40 .Oill4 48 .Cl/27 37
65.9 .0995 56 .o686 63 .Cli/82 42 71.1 .137 J8 .10] 50 .eeo 45 si..1 .(j.78 42 .Oll98 45 .o6c8 42 92.9 .6dl 50 .Olloo 100 .Oll61 45
115 .0]82 45 .06dl 100 .()657 50 129 .0560 100 .0480 56 .ares 56 150 .0372 56 .01155 71 .0527 50
73 ... 24.5 o.eao 53 o.840 53 0.539 45 35.9 .659 38 .448 45 .554 31 46.2 .310 56 .547 31 .522 50 63.9 .483 28 .452 38 .582 23 91.6 .0]82 13 .132 13 ,()645 14
130 .d\48 2l .Clf46 59 .054.2 50 316 .00346 56 ·OOJ35 58 . .
148 ••• lB.o 1.41 36 l.35 36 l.l2 29 24.2 .731 J8 .615 J8 .765 45 27.3 .938 42 .645 63 .558 45 29.6 1.l.8 J8 .90] 83 .590 42 35.4 .)81 42 .263 42 -3'!5 42
74 ••• 20.1 0.314 67 . - 0.253 67 29.4 .JO] 67 0.147 7l .167 45 37.5 .155 38 .227 36 .170 33 51.9 .lCIT 32 .131 43 .116 32 74.4 .0)28 13 .wn 48 4a lo6 .Cl226 19 .0320 • 59 .cu.62
39.4 .6.J.o 45 .449 63 .229 45 49.2 .6dl 42 ,528 71 .535 42 55.5 .785 38 .686 50 .910 38 64.7 .596 42 .477 42 .478 38
145 .d\30 67 ·"122 45 .d\48 56 145 .dldl 100 .o6oi! 56 .o68" 42
149 ... 19.7 o.459 50 0.159 7l 0.196 56 36.0 .143 45 .lCli! 45 .dl97 56 40.6 .162 45 .dldl 56 .dl33 36 45.0 .2Clf 38 .179 50 .l.IB 42 6o.4 ,0788 45 .o685 56 .0350 38 70.2 .01196 45 .0170 33 .()645 50 95.0 .()649 36 .a;ll9 50 .0055 42 ill .o685 42 .C119l 56 ·"'111 42 134 .oi.72 50 .Cl282 50 . . 32:2 .0121 . .00]19 . .0128' -32:2 .0121 . .0dl98 . - -
150 ... 48.8 o.0991< 63 O.dlJO SJ o.0]86 56 68.5 .oi.oo 50 .0328 42 .OllO] 56 73.0 .0320 45 .Cl248 63 .C1269 42 85.3 . .Ql6o 63 .0130 63 9"·9 .0190 115 .0151 83 .oieo 33
103 .230 50 .Cli!Ql 100 .oieo "'5 127 .Cl21+4 63 .C1295 56 .oi.32 63 142 .am. 50 .C1227 63 .0339 38 165 .~ 63 .0198 83 .cu;i. 36 348 .OOll2o . .oou9 . ,OQ1i23 . 348 .00256 . .0Cl262 . .00314 .
""""= -V•rt eaT 'IG"8.nsverse !reot distimce, nr icle Fri!· t'llrt1Cle !'re· Particle ,.,._
rt/lb~ v~h!!y, queocr, v~!is~)', qu<:ae7, v~;h~)', quenc7, I ••• ....
·~· so ... 21.5 0.528 33 o.2ci. 36 o.422 30 23.5 - - .
i;a .)60 36 25.9 . . .i.a .705 40 29.0 .273 45 .l.86 36 .232 ~ 31.7 .165 37 .152 50 .24.2 34.9 .157 36 .ll2 59 .220 59 37,6 .20il loo .ll2 "" .172 43
87 ••• 7.54 1.14 10 2.53 43 l.38 29 9.35 1.41 "8 2.45 Jlo. 1-79 36
11.7 2.J2 30 l.64 32 2.99 33 14.7 .310 50 .634 ).\ ,496 53 17,9 .5l.8 33 .432 83 .).\6 37 22.2 . . .265 n .2i.i. 59 27,9 .235 '1 .174 33 )4,9 .162 43 .139 31 .172 30 43.4 .114 32 .1o6 29 .121 20 54.7 .105 29 . - .Ci196 29 67.9 .C1172 ll .oi.50 23 .(1196 13

PARTICLE VELOCITY AND FREQUENCY DA.TA 99
Tabla C·L4 ... Fd.rfu 'N!ntu. tnc. Ou.am· C.Otnvil lt. Va ... Contim.i.t
T•t. C-lS ... V, I, (;rah.- .net So.11, KmaaNa Oysu. MR&nu. Ya. • Cocn::i:.olMCI
,,.,..,._ vert e• S'f'el"M
hot dis~e, .-<icl.e ,.,... l'lt.rt.iCle :rre • re.rncle ....... ttfl.l) ":!f.!:r, -· ~,,!!1• queoc;r, ~!!7, queoq, ...,. - ·-ea ••• 8.lJ i.•7 .... li8 l.l?7 li8
9-96 1.58 3l+ 2.11 56 l.3J. 50 l.2.6 l-33 "2 l.6l 59 ·1" 50 15.8 l.14 43 ·94'> 11 .937 53 19-7 .!ll.8 71 .543 59 ,352 l.2 31,3 .292 59 • .?88 50 .273 50 36.8 ,413 "2 .152 50 .152 37 "2.9 .Jl+7 •5 .224 59 .235 lo) "9.1 .153 50 .0730 50 .<J196 50 62.6 .r:1;97 10 .0373 3ll .Qlo8l lo2 80.l .C'.12"9 91 .0241 50 .(21.9 67
1!9 ... 6.87 2.4l 50 4.36 53 2.56 27 e.16 l.33 3l 2."6 56 l.6l 27
10.0 1.67 li8 1.71 63 1.70 36 12.3 .875 1+3 .909 67 l.21o 37 15.2 .788 3l 23.5 .982 13 .)QI 32 .712 32 27.8 .47• 38 • 237 43 .w • 43 32,4 .558 45 .224 59 .2U 56
93 ••• 9.SJ. 1.15 rr 1.22 83 0.922 50 l•.3 1.58 56 1.li8 67 1.10 •3 22.2 - . .76J, 24 -33.1 .431 19 .J5" 22 ·3°Jl 36 50.7 .1"9 34 .110 36 .134 22 77.6 .l6J 22 .dl78 31 .131 20
93 ... l.2.0 1.61 67 1.12 71 l-95 lo6 17.8 l." 36 l.Cil •3 .76J, 56 26.1 26 :~ •J .8o7 •5 37.0 .967 "° .668 83 50.2 .320 lo8 .)8o 211 .566 03 '15.6 - - .166 7l .2ill 50
95 ••• lo.• 1.69 59 1-"l 71 0.943 71 15.• .946 67 .Et15 l~ .961: 56 20.6 . .550 -27.0 .505 83 .6'17 139 .658 ].(),!
•1.• .219 96 .l6e 113 . 63.5 .257 66 • oll7• lli8 .2116 59
47.0 ,155 50 59.6 .o48o 83 .o459 63 .o455 125
90 ••• 7.15 2.82 36 3.21 53 l.93 53 9.o4 l.61 3ll l.$9 53 l.e6 50
11.7 l.61!. 71 2.ll 59 ,871 36 14.9 l.63 43 l.e6 59 .68l 63 18.9 l.o6 45 .1l87 63 .Bdl 48 30.5 .585 .... .322 40 .365 42 35-9 .460 .... ,322 50 .2:28 53 "2.2 .4"0 45 .170 43 .293 43 49.o .186 l• .123 16 .l.26 13 61.8 .112 l.2 ,0758 17 -<i.127 17 79.1 ,0295 17 ,0336
95 ... 7.11 2.20 71 2.(1,! 59 1.83 •5 11.8 1.66 lo) l.61!. 67 .821 45 18.6 l.dl 37 t .729 53 .759 lo8 27.8 l.16 29 .570 53 .821 lo2 38.8 .5o4 lo8 .w. 56 .456 30 6o.4 .24" 53 .1"6 67 .1"9 50
117 ••• 13-3 l.33 "° 1.70 32 0.792 11 16.6 . . .858 l;O .863 50 2i..o 1.05 20 .691 l;O -29,l+ ,564 :lO .422 .... .248 n 38.l+ ·"87 20 .327 27 .2•5 53 50.6 .577 23 .299 29 .333 26
91··· 6.78 4.65 26 4.83 26 8.65 2.o4 24 2.96 29 3.22 26
l0.3 l.26 29 1.61 59 53 13.6 .936 33 l-73 83 l.70 30 16.5 .;r3 48 l.dl 56 l.48 27 20.• l.14 31 .
u7 ••• 12.1 2.31 29 2.18 21 1.17 38 18.l . . .788 33 .770 l+5 21.9 l.54 22 .77• 15 ·"1" 22 26.o . . .455 17 .2'1) 2• 3!+.o .992 17 .26'1 26 .172 41 45.1 ,21J. 36 .267 22 .16'1 ....
30.6 .1')1J 25 .261 T7 .751 29 37.0 .240 40 .167 53 .386 33 44.8 .Q<J32 13 ,(jlJ3 20 .154 17 55.0 .137 50 .l48 48 .o6l 53 67.0 .o673 43 .oroo 59 .()647 56
94 ••• 5-7l ... 38 J6 3.8o 27
118 ••• l0.7 l.99 21 1.93 29 1.12 50 13-9 . . l.20 33 .747 29 20.3 l.Q<J 30 .625 53 . . 25.0 .600 33 .730 J6 .373 37 32.7 • 5"2 53 .451 3l .393 .... 43.l ,373 21 .Jl+7 27 .1i87 25
7.32 3.1+1 56 2.48 50 2.23 31 8.78 l.87 53 l.89 36
11.6 l.81 63 2.52 56 .912 56 14.l l.48 36 l.14 59 l.16 50 17.6 .867 32 l-10 56 .657 3l 27.0 .912 24 .511 67 .517 30 j2.5 ,387 33 .178 83 .289 32
118 ••• 10.5 2.74 32 2.lo6 34 l."6 33 15.6 . . 1.05 26 .501. 59 18.9 . . .648 . .682 34 22.• . . .599 .)lB 21 29,3 .726 . .463 2• -3"8 39.0 • )lB . .273 .170 .34
Table C-lS. - W, .f;, Grah• &ad Sons. M.cttauu 9u!!Ff. Ku.tug. v.,
l.20 ... 9.87 2.92 19 LSI. 50 l.'21 21 l3-5 l.5l+ 29 .St!; 48 .-ne 36 20.6 .926 J8 .5,)8 83 - . 25.8 .673 23 ,5i.5 56 . . 3!+-5 .564 2'l • 365 71 .405 33 "6.2 .387 26 .178 24 .243 25
~~~ Vert CAl tve4•e Teat diata.nee ,: ~icle ,..,... rcu .... eJ.e ,.,... hrticlt' ,.,...
tt/lb! vdoc1t7, quen.e7, v:rs~y, qu~oc;y,, ~/:!!"'' qu~nc71 iu/eee en• ·- ...
l.20 ••• l0.9 l.75 2l l.78 25 1.14 33 15.7 l."9 25 1.10 34 .729 :lO i9.3 l.o6 23 . -23.2 .697 17 .lo85 27 .•58 23 30.9 -7ll l8 ,i.a; :lO .401 20 U.7 .251 27 .167 75 .217 50 •
92 ••• 7.18 2.tl; 7l 2.37 36 l.22 T7 ll.O l.22 63 l.6o 59 0.936 43 17.5 . .556 23 . 26.6 .(,&,; lO ,5dl 29 .640 10 41.2 .261 12 .256 13 . 63.5 .l88 ll .123 50 .15-> 10
121 •• 69.7 . . - . o.reor 56 94.1 0.0360 lo6 . . . .
ll8 .a!:<f( l;O O.(l!i.3 31 .0334 50 128 .!1195 32 .11195 36 . 263 - - .0526 lll .o437 53 321 . . .mo& 83 . .
92 ••• l.2.2 l.03 45 l.o& 53 0.702 59 16.9 l.22 31 .676 59 .li26 34 23.8 . . .268 50 .347 lo3 32.9 .669 l9 .621 H .421 36 43.8 .338 28 .273 33 .za• 38 65.2 . . .1•3 71 .197 67
l.22 .. 68.3 o.o622 32 0.0346 ~ o.Q!6o 50
8o.5 .c:i.39 ,3 .03o6 .11154 li8 90.5 .0316 •5 .Ol.l+l n .au.7 li8
113 .Ol.('8 l" .()($7 "° .oom li8 l.22 .aJ.41 36 .mo& n . 143 .aJ."2 J8 .0($8 38 .QC656 38 172 .!1139 34 ·°*' 57 .ooi.1• •3 2cS .00599 211 .oo)lB "9 .OOl'j3 68 250 .OOl';O n .00529 lll .OaJ.52 59 3°' . . .CXXY,122 BJ .ooceoe 34

100 BLASTING VIBRATIONS AND THEIR EFFECfS ON STJlUCTURES
Tabb C..15 ... W, I, GrAlhm and Son1, Mma•NI Qu!m• , Ke!•H•. V.t.. • Coa.tiaued
~-= ·~ .. ,.... ---- .. e" .... e-... v ......
1'Ht. cll•t&Dce, s: ..... .. ,..c.i.e Fre- ·---~· ....... fll.rt1c.I.• --tt.tu> velocity, queocy, ve.loc1t7J qu"""7, ~7· _,.,
w...., ... ,,,_,_ """ ... 1'fft 4Ut&Dce, ~·-~
,,,.. hrt>CJ.• ,,,._ ~ ....... --tt/r) nlocit7, --· ttl.oe1t7, -· Yeloc1ty, --· WHC opa izJ/oec - W•ec ....
123 ••• 10,0 2.63 33 2.58 3!I 2.u 36 l3·3 2.18 33 1.20 29 ,1le9 29 16.3 1.94 29 1.ar 30 .Sli8 23 22.• .7dl 33 .963 26 .)66 26 24.9 .725 22 .430 23 .432 22 30.2 .758 15 .322 20 .536 14 ~-5 . . .. - .243 27
.7 .5"4 2l .239 2l .219 ~ 'Sf.2 .2U 22 .us 62 • 0791 70.8 .ar37 31 .dl47 33 .o656 26
im. ••• 9.70 1.64 31 l.BI. 2li i.90 24 u.3 l.O'/ 20 1.14 26 1.57 22 13.6 1.17 19 1.02 29 2.25 26 16.8 . .114 29 =~
16 20.7 .946 15 ."61 26 20 25.8 .938 14 .~ 17 .431+ 15 32,5 .358 16 .J.911 42 .347 26
102 ••• 25.8 o.6'!'2 31 o.2111. li2 o.28o 31 30.3 .246 33 .185 26 .2U 36
125 ... 16.1 0.833 25 1.58 50 1.12 50 25,3 .568 3!I 1.33 4o ,526 31 2B.7 .705 48 .9(11.
~ .Jll "2 37.8 .60!< 32 .537 .5o6 30 1+5.1 • ..ar 26 .503 56 .366 li2 55.8 .244· - .300 - .159 -68.7 .,31.B - .228 - .170 -83.6 .325 . .245 - ,J.97 -laJ. .156 30 .150 27 .J.39 31
l2B .1"9 30 ·097l. 29 .J.34 31
35.2 .430 25 .136 31 .469 29 i.o.9 .196 26 .m 20 .261 2~ "8.4 .173 23 .05'19 23 .153 2• 56,7 .uo 12 .oi.84 17 .o681 26 79.4 .03o6 36 .C1l!l5 42 .a199 3l
103 ... U.l 2.a! 7 2.61. 19 1-27 10 14.7 .ei.o 17 1.<9 JB 1.25 2S 17.2 ·TI3 45 .580 26 1.0'/ 22 20.7 ~ lo:! .5oa 63 l.aJ. 24 25·9 .765 26 .243 17 .471> 21
126 ... 6.71 2.11 26 2.30 50 2.ar 50 io.i. l.17 48 1.64 "8 l.44 36 u.7 .609 37 .995 63 .758 31 15.• .784 29 .731 36 l.l!6 36 18.3 .711 50 .824 50 l.04 43 22.6 .6o6 - .37• . ."8:1. -
I 27.s • 583 .
:~ . .6o6 -33.8 .518 . . .1+53 -i.o.9 .235 26 .196 29 .347 32
51.5 .160 40 .105 32 .227 33
32,3 .346 18 .318 19 .493 23 4o.5 .223 14 .209 17 .232 15 51.9 .195 25 .0929 72 .353 23
104 ... 8.50 . - 1.24 20 -10.3 0.558 14 1.ci. 23 1.89 24 12.7 .786 19 .863 42 1.38 25 16.3 2.ar. 22 .456 22 l..10 29 20.6 .634 l6 .43'\ 22 .860 23 26.0 .296 u .2&,; 20 .276 16 33,7 .384 23 .129 42 .535 23
1Q5 ... 8.37 - - 2.47 - 1-37 -U.5 . - 2.&.; 1.10 -22.7 0.995 17 1.15 26 .536 29 27.5 .1S73 25 .000:18 63 .497 28 30.2 .581 20 .li24 36 .421 19 34.1 .598 19 .2113 lB .461+ 20 38.4 .310 14 .217 17 .2'-0 18
>CUO<l eri COJ. verae 'l'<•t d.iata.ncc, F'art1cle ...... """"'" ... e"-e , ... Pa:rt1cJ.e .........
tt/lb! y~~y, quf:JlCy, v:!j.!;7' quency, Ydoc1tJ't quenc:7, ••• .,,. 111/aee •••
96 ••• 9.40 l.46 17 . - -12.l .962 26 - o.886 24 13.9 l.39 2l 1.54 25 1.62 25 16.4 1.03 21 .683 25 - -20.2 . - .lo23 19 .900 22 2i..0 .772 l3 .334 23 .318 20 30.6 .383 l6 .311+ 17 .3ar. 16 38.6 .471 24 .159 83 .285 38
97 ... 7,55 l.84 l3 2.oi. 20 1.16 24 9.l.8 2.<17 20 l.67 2l 1.20 23
100 ... 7.70 2.dl 15 l.4o 15 - -9.42 1.98 25 1.42 25 2.00 21 11.e .922 29 l.<>J 38 l..61 17 15.2 2.60 25 .6oo 33 1.58 28 19-5 .566 26 .529 20 l.l.8 25 24.8 .i.35 13 .:iai. ·~ ,348 19 32.3 .323 20 .161 .363 19
1<11··· u.9 1.05 - 0.1112 - o.E>al -1.5.2 1.21 - .746 - - -e6.8 .483 26 .610 29 .552 26 29.1 .253 19 .278 26 .248 36 31.7 -5"9 26 .216 63 .403 31 31+.5 .323 22 .257 26 .31+1 23 36.2 .435 20 .173 22 .280 22
12.0 .'!'20 29 l.23 19 .481 25 15.4 2e .999 17 ·"95 26 22.5 .543 .632 16 ·"95 25 25.li ,936 25 ,535 26 ."6 20
38.5 .347 20 .)66 20 .235 16 43.0 .161 7 .130 20 .140 17 48.9 .171 56 .0511 18 - -
33.4 .i.i.5 26 .246 72 .352 31
98 ... 17.0 1.61 33 l.76 56 l.67 36 20.2 .679 26 .76f) 31 .'191> 31 23.0 • 629 33 .917 72 1.26 • 29 28.0 .550 56 .346 li2 .692 22 33.5 .517 17 .233 45 .592 22 39.7 .38J, 14 .1"2 17 ,338 17 48.o .1o6 25 .929 ~ .u9 56 56.1 .105 26 .991 20 .oiae 50
ldl ... 6.25 1.42 22 1.43 17 2.17 28 1.aa 1.52 20 2.<Jl 26 l..44 21
10.0 1.13 21 .959 li2 l."1 31 13.3 3.34 23 .727 26 .657 2S 15.l l.CI? 20 .977 22 1.70 21 17.3 ,711 19 • ....a 24 .628 25 22.2 .:m 15 .263 15 .338 14 29.0 .270 l.8 .124 JB .392 19
l<>J, •• 7.28 2.19 26 1,55 31 1.26 20
99 ••• 9.76 - - 1.35 16 12.6 1.85 29 1.67 26 1.92 2l 14.6 l.20 25 1.33 26 l.li2 23 17.3 .Ml 24 .628 50 l..53 23 21.3 .824 31 .845 25 26.3 .692 l6 .4o6 20 ,472 19
9,45 1.0'/ 2S 1.12 25 1.85 22 12.3 .736 50 .766 2l 1.29 23 16.6 2.19 24 .373 33 .597 25 l.8.9 .Sli3 26 .eoo 20 .958 24 21.9 .:m 20 ·"' 23 .628 25 l!ll.7 .223 17 .261> 19 .240 16 38.1 .273 25 .lQ!i ~ .286 21>
32.5 .328 19 ,342 17 .)26 16 41.2 .331+ 26 .215 36 .313 25
100 ••• 15.8 1.31 36 0.529 "2 0.53!1 56 25.3 1.o6 26 .693 36 .6u 25 29.2 ,328 20 .267 25 .380 3l 33.4 •. 57.3 24 .173 26 .328 33 :is.1 .442 20 ;230 17 .lo-0,1 25 44.6 .333 20 .121 25 .293 25 5J..8 .258 1' .1,e 19 .200 17 11.1 .o64o 25 .01181o 17 . -
uo ... u.2 1.10 24 l.o6 42 1.14 29 14.7 .420 48 .4'!'2 38 l.!J9 -26.2 .68Q 27 - - 26 29.9 .484 27 .2113 l3 .345 3'\.6 .245 u .1"4 26 .235 33 44.9 .181 u .o847 17 .112 48 59.6 .12• 43 .120 33 .142 23
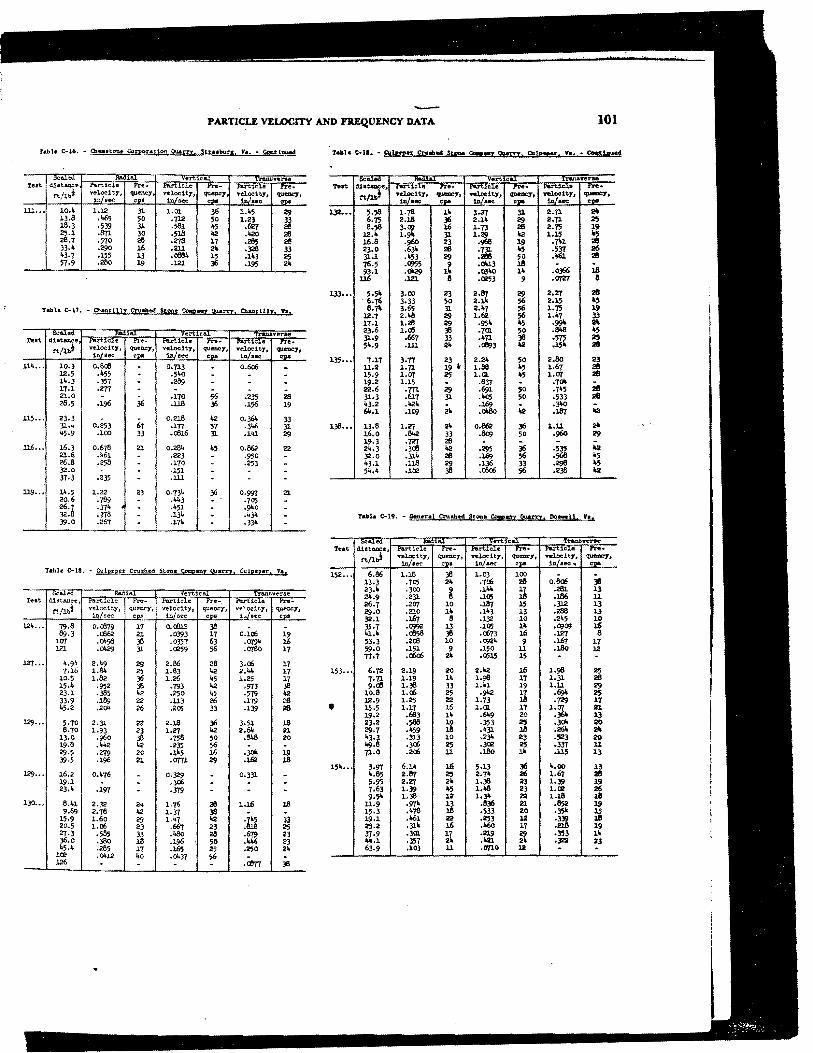
PAR.Tieu: VELOClTY AND FREQUENCY DATA
bb-le C-16. - Chautm Cogoratiog Quam. SttubQr1. Va ... CpsUDWJd
m ... 10.li l.12 3l l.Ql 36 l.li5 29 13.8 .1165 50 .1).2 50 1.23 33 l.8.3 .539 31 .581 •5 ./i27 26 25.1 .871 30 .518 42 .'2o 26 28.7 .570 26 .278 17 .265 26 33.• .290 16 .211 2" .326 33 1+3.7 .155 13 .ow. 15 .1"3 25 57.9 .28o 19 .121 3li .195 2•
T.Uta c-11 .... au..nuuy Crueh6d Stoee ec.em t>u.m, Chantllb. va.
=-- ver< CaJ. ...... Teat d1sta.l:ic•i ~ .. .i.c.Le ,,..,. ra:n.:1.c:.1.e .... .. - .... c.1.e ,..... .
rt/u.l ftl.ocit7, quenc71 velocit7 1 quenc7, ~!!>'• 'IUOGel', in/• .. ... W•ec .... .,,.
114 ••• 10.3 o.Sdl - 0.713 . o.6ai -12.5 .455 . .54-0 - - -14.3 .357 - .289 - - -17.l .zn - - - -21.0 - .170 56 .235 26 28.5 .196 36 .ll.8 36 .156 19
115 ••• 23.3 . - 0.218 42 0.361> 33 31.4 0.253 67 ·lT! 57 .346 31 i.5.9 .100 33 .dll6 3l .1"1 29
ll6 ••• l.6.3 0.678 21 o.284 1+5 o.862 22 21.6 .461 - .223 . .950 -26.8 .258 - .170 - .253 -32.0 - - .151 - - -37.3 .235 - .m - - -
119 ••• 14.5 l.22 23 0.734 36 o.m 2l 20.6 .169 - .... 3 - .705 -26.7 .374 - .i.51 . .940 -32.B .378 . .134 . .4)4 -39.0 • 267 - .174 - .334 -
Table C-18. - Cuboer Cru.:h~ Stone Comeany Quarry, Culp!tu. Va,
124... 79.8 89.3
1(1'{ 12l
127. •• 4.90 7.16
l0.5 15.4 23.1 33.9 45.2
129... 5.70 6.70
13.0 19.8 29.5 39.5
129... 16.2 19.l 23.4
lJO... 8.41 9.69
15.9 20.5 27.3 36,0 45.4
la! 126
o.<1119 .c66<? .0498 .0429
2.49 l.S4 1.82
.952
.385
.189
.204
2.]J. l.93
.960
.442
.279
.196
o.476
.197
2.32 2.78 l.60 l.Cb
.585
.380
.285
.0412
22 23
~ 20 2l
o.d\12 38 .0393 17 .0357 63 .a159 56
2.86 28 l.83 42 l.26 •5
.793 42
.250 1+5
.113 26
.205 33
2.18 36 i.27 42
.758 50
.235 56
.11+5 16
.om 29
0.329 -,3(b -.379 -
i. 76 28 i.37 38 l.47 42
.667 23
.i.ao 28
.196 ' 50
.165 25 ,0437 56
O.leb ,(1'{91< .0780
3.(b 2 .... l.25
.973
.579
.179
.139
J.51 2.64
.646
:~ .679 ."6 .250
,r:Jm
19 18
33 25 23 23 2•
OCOJ.ed ,.... diataoce, ,. .......... e.J.e
tt/n.; ~.!.'1· 132 ••• 5-58 i.78
6.75 2.18 8.58 3.0J
12.• i.91< 16.8 .96<> 23.0 .6)1i 31.1 .i.53 76.5 .0955 93.1 .Q429
116 .121
133 ••• 5.511 3.00 . 6.76 3.33
6.7'> 3.65 12-7 2."8 17.l l.26 23.6 l.Cll 31.9 .667 ;i..9 .ill
J..35 ... 7.17 3-T! ll.2 i.71 15.9 1.()'f 19.2 l.15 22.6 .m 31·3 .617 43.2 .42• 64.l .1<19
138 ••• 13.6 i.27 i6.o .842 19.3 .721 2•.3 .3ee }2.0 .314 1+3.1 .ll.8 54.4 .1<2
SCo.lod Teat d1eto.oce, :a..ii,,.i.CJ..e
n.;1.J velocity,
"'''"" 152 ... 6.ll6 l.l.8 13.3 .705 23.• .300 24.9 .231. 26.7 .2()'f 29.0 .210 32.1 .167 35.7 .0992 •1.• .~ 53.3 .2ee 59.0 .151 T1·1 .a>a;
153··· 6.72 2.19 7.71 i.19 9.ee J.,36
l0.6 L<;t; 12.9 l.25
' i5.5 i.17 19·2 .683 23.2 .;88 29.7 .i.59 •3.3 .313 1o9.8 ,3(b 11.0 .2Cb
i5i. ••• 3.97 6.1• i..55 2.llT 5.95 2.27 7.63 l.]9 9.511 l.38
11.9 .971+ 15-3 .•78 19.l ."6i 25.2 .]J.li 37.9 .3ai. .i..1 .357 63,9 .103
101
..... C&J. .. .... rre· ·---- ,.,... .......... cl• n-e--· ~.!7' -· ~!!7t -· """ .,... .... i• 3.27 3l 2.71 2lo 3li 2.1• 29 2.71 25 l6 1.73 26 2.75 19 3l 1.29 42 l.15 "' 23 .968 19 .m 211 26 .131 •s -531' 2iS 29 .2111! 50 .w;J. 211 9 .003 18
1" .()3.\0 i• .(1366 18 8 ,0253 ' .<mrr 8
23 2-llT 29 2.27 29 50 2.1• 56 2.15 ., 31 :M7 56 1.75 19 29 l.62 56 l.li7 33 29 .95• "5 .994 2lo 36 .7C11. 50 .ai.e •5 33 .i.71 38 -'1'5 25 2• .($3 112 .is• 211
23 2.2i. 50 2.6o 23 l9 ~ l.ll8 •s 1.67 26 25 l.OI. "' 1.0'( 211 - .637 . ·1°" 2e 29 .1i9l so .745 3l .liQ5 50 ,533 211
.169 ~
.340 -2• .Qlo&) ,187 loll
2• o.862 ]6 l..ll 21> 33 .80) 50 .96<> 29 26 - - ~ 42 .295 36 .535 211 .169 56 .568 J,5 29 .136 33 .298 •5 38 .ctla5 56 .238 loll
.... cu ..... rre- ~.ic.1.e
,,.,,_ ·---•.i.e ,._. queuc7, ~.!7·
qu_,., Yt!tl.ocit7, -· .... ... iJJ.l•ec,. -38 i.03 100 2• .7(b l!8 o.~ 38 g .1 .... 17 .261 l3
.105 18 .l.86 ll 10 .187 15 .312 13 ii. .1•3 13 .268 13 6 .132 10 .245 10
l3 .105 1" .C1)0') l6 36 .am 16 .127 6 io .C>,124 9 .167 17 9 .150 ll .J.8o l2 2• .0515 15 . -
20 2.42 16 l.$6 25 14 l.$6 17 l.31 26 33 l.U 19 l.ll 29 25 ·9"2 ii .694 25 22 l.73 .729 l.7 16 1.ai. 17 l.()'f 21. ii. .609 20 .)61i. 13 19 .353 25 .3oi. 20 l8 .1+31 l.8 .261< 2lo 10 ,2.Jl< 23 .523 20 25 ,Ja! 25 ,337 ll ll .l.Bo 1• -115 13
l6 5.13 ]6 i..oo 13 25 2.7• as l.67 211 2• l.36 23 l.]9 19 1>5 l."8 23 l.Cll as 12 l.)li 22 1.1.8 111 13 .6]6 21 .852 l9 l.8 .533 20 .3511 15 22 .253 12 .339 l.8 16 .i.6(1 17 .2ll! 19 17 .219 29 .353 ii. 2• .421 2• .322 23 ll .0710 lJ! - -

102 BLASTING VIBRATIONS AND THEIR EFFECTS ON STR.UCTUU:S
Table c-u .. ~ berior Stone Co!p!.i.V. luc~ ctuarry1 Cruasboro, •.c ..
--~ vert .... verse T .. t distance, .._ ..... ,, .... eJ.e ,.,.._ r .... -i.ic.le ,.,.._
,r;a.r\..1.C.Le ,,,._
t't/l,,! v-elocity, qu.,,e7, velocity, qu"""7, Yd.oeit;1, qu_,., in/sec c.,. 10.laec c•• tnl&ec c-
Ten I~~~, Ye.rt1C:'"' sver~
ntrtlell!" l'iilt- ....,.,...,.., ,.,.._ ranicle ,.,.._ tt/lb't ~!!71 qt,tmc7, ":!f.!!:1· quenc7, ~!~1~ queoc:r,
~ ·- en&
137 •• 7.56 3.54 25 3.35 2~ ,3.79 29 13.7 2.52 31 l.29 33 l.o6 )6 19.5 3."6 22 2.53 31 l.(IJ 29 23.6 - - 1.17 26 . -
Table C#ll. - Southern Kat•riah Corpontf.MI. J.cll StOM Qu.arq. Petu•sbu.rc. V•.
155··· 18.o 0.595 23 l..15 25 o.481> 25 20.6 .5(1J 33 .46') 28 .399 33 22.0 .351 29 .3'16 16 .Z'(O 29 25.4 .261 55 .182 ll .361 l8 30.3 -170 23 .:i.12 l.8 .200 17 36.1 .191> l8 .1•5 22 .135 28 •3.0 .188 19 .120 25 .245 28 5i.3 .l.32 2• .CJ)26 3l .Ql93 2• 59.0 ,001'7 ai. .Q)oo 55 .0621 51 67.3 .oi.75 10 -<81.3 Bl. .oi.30 Ill 78.9 .0496 63 .071:12 63 .05l.9 )6 88.9 .1:1298 26 .0372 :i.• .0360 13
SCAJ."1 •rt cu verse Tut dietanee, r-.n..tele ,,,_ Mt.I"t.:1.C:le ,,... Pa.nic.1.e ,.,.._
t't/lbi, ~~!I- quew:y, v~;!11 queuer, vel.ocit7, -· cu• cua w .. c c ..
J.6l. •• 6.41 l.31 . 17 1.61. 21 1.)6 19 8.58 1.26 20 1.37 17 l.loQ 17 9.48 l.13 l9 l.14 29 - .
l0.8 .662 2a .663 is l.07 i6 12.2 .58'1 .•76 .822 15.4 .48o 15 .400 21 .713 15 17.8 .3o6 l2 .413 20 .566 20 21.3 .372 13 .353 20 .558 15
J.56 ••• 15.l. 0.11• 25 o.7fi6 33 0..321 29 16.S .820 "2 .9(1J 28 .710 29 19·9 ."21. 25 .•10 15 -451 38 22.7 .933 li< .462 9 .278 9 25.6 .160 3l .2~ 22 .120 26 2a.1 .198 "2 -236 31 -zzr 3l 40.2 .-231 28 .244 26 .200 2l "6.3 .136 l8 .137 2• .121 29 54.2 .(IJ20 8 ,Q153 8 .0539 19 61.8 .163 ll .J.~ 23 .Q967 13 1•.o .0510 38 .OJ36 Tl .0034 45 86.2 .0565 25 .0568 1.4 .oi.91> 29
25.1 .w; - .213 . .270 -28.8 .141 - .273 i6 .252 -34.1 .141 14 .263 .288 17
165 •• 4.01 l.82 24 l.82 33 l.18 25 5.c;. 2.69 23 2.41 36 l.88 21 5.93 2.31 22 2.75 31 l-U 3l 7.30 1.67 . 2.00 . l 24 .
157 ••• 16.4 0.758 l8 1.78 30 0.783 .l8 19.0 .607 26 .619 J.4 .4o6 30 20.6 .600 19 .526 111 .448 22 23.8 .487 91 .263 l2 .442 58 28.8 .242 21 .247 l.7 .2(1J 16 3".8 .198 22 .205 26 .0962 26 41.3 .175 2l .203 23 .1•3 -
9.03 l.10 33 1.40 20 961. 33 u.e . 758 24 .545 36 1.20 24 14.2 .986 28 .779 56 .761 33 17.5 .4-09 19 .•OJ 33 - -20.9 .423 - .4o6 . .203 -
47.9 - .125 l.9 -56.2 .133 '64 -· .u5 61. -CIJ07 8 611..3 .a;m 9l .0993 5& .0516 n 78.8 .oi.51 •1 .OJ36 16 .0422 25 89.0 .0351 20 .Qli90 JS .0321 17
26.8 .192 . .179 . .125 33,7 .177 9 .145 13 .OJOJ JS 158 •.• 31.2 0.103 33 o.1!22 3l 0.385 )6
J".2 .345 50 .327 2J! .303 38 166 •• i..66 2.67 21 l.49 26 l.)8 25
5.65 2.77 25 l.72 13 l.52 2i. 6.83 1.28 13 l.ll 17 . -8.39 l.26 - l.04 - l.14 -
l0.3 l.03 25 .909 33 l.00 23 13.0 .661 20 .673 17 .556 29 15.• .496 25 .652 22 .473 28 19.0 ·3"5 20 .i.oo 1" .351 24 23.l .305 - .426 - .319 . 29.1 .201 - • 324 - .182 -36.4 .120 13 .125 13 .155 l~
167 .• 4.29 3.58 22 2.71 23 2.63 20 5.W. 2.13 16 l.30 15 l.89 21 6.26 2.36 20 1.91 17 1.9'> l8 7.66 2.36 20 1.37 23 l.45 16 9.48 l.44 19 .787 22 .243 29
ll.9 l.07 19 .7(1J 13 l.Ql l6 14.3 l.47 20 l.43 19 l.00 23 17.2 .487 ·- .195 - .462 -21.3 .603 - .563 . .551 -26.3 .362 - .64o - .255 26 33,4 .275 13 • 327 19 .155 •
39,5 .172 36 .151 15 .152 28 44.8 ·"°" 8 .l21l 10 .133 26 5•.2 .c648 26 .lQJ 3l .oooo 56 611..6 .o6Jl 25 .r£o3 33 _0472 Tl 76.0 .o6)8 29 .124 26 .105 33 86.9 .o621 2• .oi.37 24 .0518 25
101 .0549 8 .0323 • lo .0379 25 ll5 .0523 8 .oi.i.6 ll< .0421 1 137 .o218 50 .0361 63 .0231 56 157 .1:1235, 17 .C1223 13 .c255 ~5
159 ... 17.0 0.393 23 0.713 23 a.403 26 19.2 .658 33 .321 23 .461 31 20.7 .372 25 .326 20 .175 28 2}.5 .273 ll .JBo 61. .245 8 27.7 .242 17 .241 13 .167 20 32.8 .U6 23 -1~7 111 .lll. 23 38.6 .220 19 .l.6:! 25 .132 21 43.6 - - .m 17 - -50.6 .1o; 30 .o673 22 .ll8 JS 57.5 .l.24 8 .175 111 .0760 1 68.4 .o621 "2 .0735 56 .0450 15
i 7!\.6 - . .0583 14 .0481 38
168 •. 12.• 0.649 26 0.926 - o.417 56 17.1 .7•3 36 l.10 50 ·"87 50 21.2 .661 38 l.35 42 .261< 56 27.1 - - .613 - -35.1 .300 42 .320 50 .1113 56
~A:~ .229 45 .OJ42 50 .261> 12 .259 33 .312 83 .218 83
72.9 .103 JS .186 12 .cfe9 83 90.1 .laL - .137 - .u5 -ll4 .0435 - .0551 - .0300
145 .Cl254 12 .0560 12 .<290 83
Tut
l6o •• 1.30 63 2.10 63 2.42 56 l.33 •5 l.22 )6 l..03 •s
.81t7 l.61 .893
.758 29 .517 56 .62• 20
.599 33 .558 24 .858 50 .•lJ 29 -531 34
.i.70 .250 .232
.148 -!& .151
.Q786 l.00 .0962 125 .oooo 56
.la) 19 .ofi61 19 .100 26

PAJlTICLE VELOCITY AND FllEQUENCY DATA 103
Tabla: C-13~ .. Saperior Ston• C-m, Bi~Cou.• fJU&m. GnOJ1boro. X:C ... Coatinu.ed
~ ...... ·~ c~ .~ .,..,... Tttt <Ii'""""'• -~--~·
,.,,._ ~·--~·
,.,.._ r-.r-.,.c.l.e rre-
tt/1J Yeloc1t7 J """""7· nlo<:1t1, qll<OCJ', ftlocit7, q\i"""T, w ... - iz>/aec ~ w..., """ l& ... 9.73 l.63 3l 1.16 "5 2.ai! "2 ll.7 .957 36 l.67 33 2.03 29 13.8 .1!8J. 50 l-"9 50 l."7 33 16.6 .967 - .-853 - .933 . 21.6 .7(Ji! 36 .561> 33 .:m 33 211.e .539 26 ,:Jill 36 .553 3l 32.0 .289 21 .196 23 - -38.1> .268 - .2ar - .191 -47.5 .119 .139 - .177 58.9 .1ca 36 .0535 50 .1ca ;.5 12.5 .llS 26 .oi.39 29 .<11'27 36
J.62 ••• 6.83 l-~ 45 2.tll i.5 l.64 "2 8.51 l. 50 2.a6 l>5 l.46 45
l0.4 l.64 2.($ l.Jl 14.0 l.47 36 .aoo 36 .579 45 19.5 .933 36 -TI6 3l .696 38 24.0 .7(Ji! 36 .393 29 - -30 ... .545 - .346 .326 -37.3 .147 17 .rr6 26 .lOO 33 "6.9 - .0943 125 .cm.9 50 5'J.7 .126 - .($33 - .124 - ~
163 ••• 6.83 l.73 38 3.22 56 3.80 63 8.47 1.3). 45 1.4o 33 1-50 50
10.5 .9!17 - 1.28 1.28 -14.3 ~
.622 36 -19.8 .947 .462 22 .870 50 24.5 .693 36 .652 28 .652 45 31.0 .555 . .249 - .3l') . 38.1 .J1!5 .193 - .162 -47.9 .<iJ97 83 .c647 125 :~~ 100 59.1 .l.64 33 .C1176 56 38
151 ••• 3.39 4.85 ll 8.73 19 6.94 l.2 4.57 15.0 l3 13.8 3l 3.61 22 6.22 6.79 lO 7.46 26 5.48 14 8.63 5.76 17 5.49 56 2.62 38
11.9 3.68 33 2.19 71 2.68 38 16.l l.72 16 .954 42 .842 45 20.2 l.67 14 l.OI+ 50 ·7'71 38 69.0 .3o4 .195 .l.81
171 ••• 3.39 6-77 10 10.2 30 6.67 4.l+O 13.2 ll 20.9 16 7.47 20 6.o4 9.26 20 8.85 19 5.6o 28 8.24 5.68 25 4.40 38 4.71 ~ ll.l 6.67 22 i..17 3l. 2.2•
li..9 5.15 36 2.98 29 3.05 36 20.3 2.(1/ 24 l.56 38 l."8 42 66.6 ·l.27 ·'1199 .160
~
• t ;
<
"' '.} ' .. .. ~
~ t ';
~ '

Appendix D.-Geology Description
A brief description of the geologic condition, (ace height, and overburden thickness at each site follows: .
Site 1.-Weaver Quarry, Alden, Iowa. The quarry is in the Gilmore City Limestone. As exposed at the face, the rock is light tan,
. argillaceous, and loosely jointed. The floor of the quarry consists· of a massive, oolitic limestone. There is no structural dip. The face height was 80 feet with 6 feet of overburden.
Site 2.-Webster City Quarry, Webster City, Iowa. The quarry is in a light brown, loosely jointed, dolomitic limestone of ·the Spergen Formation. There is no structural dip. The face height was 10 feet with 56 feet of overburden.
. Site 8.-P 8e M Quarry, Bradgate, Iowa. The quarry is in the same geological setting as site 1. The face height was 24 feet with 2 to 12 feet of overburden.
Site 4.-Ferguson Quarry, Ferguson, Iowa. The quarry is in the. same geologic setting as site I. The face height ranged from 15 to 20 feet with 15 to 20 feet of overburden.
Site 5.-Shawnee Quarry, Shawnee, Ohio. The quarry is in the Columbus Limestone, in the general area of the Columbus Formation-type section. The Columbus Formation is typically a hard, flat-lying, thickly bedded, gray limestone, often slightly fractured and weathered in the upper levels, and hard and unfractured in the lower levels. The face height was 25 feet frith 15 feet of overburden.
Site 6.-Hamilton Quarry, Marion, Ohio. The quarry was in both the Columbus and Delaware Formations (see site 5) • The Delaware varies from an argillaceous, cherty, blue limestone to a very pure limestone and is flat-lying. The face height was 20 feet with IO feet of overburden.
Site 7.-Flat Rock Quarry, Flat Rock, Ohio. The quarry in the Columbus Limestone (see site 5) had a face height of 50 to 55 feet with 9 feet of overburden.
Site 8.-Bellevue Quarry, Bellevue, Ohio. The quarry in the Columbus Limestone (see site 5) had a face height of 18 feet with 2 to 12 feet of overburden.
Site 9.-Bloomville Quarry, BloomvilJe, Ohio. Operating in both the Columbus and Delaware
104
Fonnations, (see sites 5 and 6), the quarry had a face height ranging from 18 to S2 feet with 17 feet of overburden.
Site 10.-Washington, D.C.-The rock at the east approach of the Theodore Roosevelt Bridge over the Potomac River was a dark, greenishgray, gneissoid diorite. The bedrock dips eastward away from the site~ The overburden thickens froih 5 feet at the working area to 50 feet at the end of the gage array.
Site 1 I.-Poughkeepsie Quarry, Poughkeepsie, N.Y. The quarry was in the Stockbridge Group, a tilted, jointed dolomite. The face height varied from 28 to 104 feet with overburden thickness ranging from '? to 50 feet •
Site 12.-West Nyack Quarry, ·West Nyack, N.Y. The quarry is in the Palisade Diabase of Upper Triassic age. The face height varied from 20 to 45 feet with little or no overburden as the result of stripping.
Site U.-Littleville Dam Site, Huntington, Mass. This test was the sinking of a 16¥2 by 21 foot shaft to a depth of 50 feet. The rock was a quartz·sericite schist with a pronounced foliation that dipped 60° to the west. The surface was irregular and ranged from exposed bedrock to 5 feet of glacial till.
Site 14.-Centreville Quarry, Centreville, Va. The quarry is on diabase of Triassic age and had a face height of SO to 50 feet with 10 feet of overburden.
Site 15.-Manassas Quarry, Manassas, Va. In the Triassic diabase, the quarry had a face height of 22 to 45 feet with 6 feet of overburden.
Site 16.-Strasburg Quarry, Strasburg, Va. The quarry is in the New Market Limestone overlying the Beekmantown Formation which is quarried elsewhere but not utilized in this quarry. The New Market consists of thick-bedded, bluish· gray, fine- to medium-grained, crystalline dolomite, and compactly textured, blue- or dovecolored, coarsely fossiliferous limestone. The beds strike N. 75° E. and dip S0° to the southeasL The face height varied from 4 to 20 feet with 6 feet of overburden.
Site 17.-Chantilly Quarry, Chantilly, Va. This quarry in the Triassic diabase, had a face height of 84 to 45 feet with 4 feet of overburden.

CEOLOGY DESCRIPTION 105
Site 18.-Culpeper Quarry. Culpeper. Va. Tb.is quarry is in the Manassas Sandstone of Triassic age. The rock is a medium-bedded. 6.ne-grained. red and gray sandstone composed mainly of quartz and feldspar and dips 6° to So to the northwest. There are three distinct sets of vertical joints that strike N 45° E. N 15° E. and east. The face height varies from 50 to 45 feet with I to 5 feet of overburden.
Site 19.-Doswell Quarry, Doswell, Va. This quarry is in the Baltimore granite-gneiss which is a fine- to medium-grained. light- to dark-gray gneiss. In places, the gneiss is coarse-grained with large phenocrysts. The gneissic structure strikes N 45° E and dips 45'0 to the southeast. The rock is highly jointed with the most prominent joint set striking N 55° W and dipping 70° NE. The height of the working face is 50 feet with 20 to SO feet of overburden.
Site 20.-Riverton Quarry, Riverton, Va. This quarry is in the Beekmantown Formation and consists of medium- to thick-bedded, 6.ne-grained, gray dolomites, interbedded with thick-bedded, fine-grained, gray limestones with calcite-filled fractures. The beds dip from 25° to 45'0 in an easterly direction. The only shot recorded was a toe shot with little or no overburden.
Site 21.-Jack Quarry, Petersburg. Va. Tb.is quarry is in the Baltimore granite-gneiss and is
•
similar to the rock at site 19. Details on the structure and jointing were not available. The face height varied from 40 to 80 feet with 50 feet of overburden.
Site 22,-Bucbanan Quarry, Greensboro, N.C. This quarry is in a granite diorite complex showing moderate to strong gneissic structure. Grain size varies from fine to coarse. The rock is moderately jointed and deeply weathered. The height of the working face varied from 27 to 50 feet with 50 feet of overburden.
Site 25.-Hi-Cone Quarry, Greensboro, N.C. This quarry is in a granite-gneiss similar to the rock at site 22. The height of the working face is 50 feet with 50 feet of overburden.
Site 24.-Union Furnace Quarry, Union Furnace, Pa. ,This quarry is operating in the Beekmantown Formation and the overlying strata, in the Rodman, Lowville, and Carlin. The Beekmantown contains thick-bedded dolomites with chert and thin-bedded. blue limestones. The overlying beds are dark, fine-grained, nearly pure limestones. The limestones have been folded and faulted with individual beds overturned. Joints are numerous and closely spaced. Only one large shot is fired annually with a face height of 185 to 200 feet. Overburden thickness ranges from 2 to IO feet.
tf u ... •OV ... IUllUtT PalNTIN• OP"U. te'IO -