blast fragmentation analysis using image processing · svedefo formula, kuz-ram model, etc,...
TRANSCRIPT

IJMGE, VOL.50, NO.2, (2016) 211–218
International Journal of Mining and Geo-Engineering
* Corresponding author. Tel.: +98-2332395509, Fax: +98-2332395509. E-mail address: [email protected] (F. Sereshki).
DOI: 10.22059/ijmge.2016.59831 Journal Homepage: ijmge.ut.ac.ir
Blast fragmentation analysis using image processing
F. Sereshki a*, S. M. Hoseini a, M. Ataei a
a Faculty of mining, petroleum and geophysics engineering, University of Shahrood, Shahrood, Iran
A R T I C L E H I S T O R Y
Received 24 Mar 2016, Received in revised form 13 Jul 2016, Accepted 13 Jul 2016
A B S T R A C T
In this research, first of all, the common problems in fragmentation analysis are reviewed with regard to the reliability and rapidity of the evaluation. Then, the available methods used for evaluation of blast results are described. The usual errors especially in recognizing rock fragments in computer-aided methods, and also, the importance of accurate determination of fragment sizes in image analysis methods are illustrated. After reviewing previous research work in this area, an algorithm is proposed for automated determination of rock particles’ boundary in Matlab software. This method can automatically determine the particles boundary in very short time. The results of proposed method are compared with those of Split Desktop and GoldSize software packages in two automated and manual states. Comparing the curves extracted from different methods reveals that the proposed approach is accurately applicable in measuring the size distribution of laboratory samples, while the manual determination of boundaries in conventional software packages is very laborious and time-consuming; and moreover the results of automated netting of fragments are very different from real values due to the error in separation of the objects.
Keywords: Auto delineation; Fragmentation measurement; GoldSize; Matlab software; SplitDesktop
1. Introduction
The primary objective of rock blasting is to attain a successful fragmentation. The classification and size distribution of muckpile are the critical components of managing any blasting operation. The fragmentation affects all downstream operations including loading, hauling and crushing; and can be used to minimize these costs [1-8]. In order to effectively control and optimize the process it is essential that a rapid and reliable technique for assessing the degree of fragmentation to be adopted. This is also important from the design point of view where various different types of explosives and blast designs can be quickly and efficiently analyzed [1]. Reliable evaluation of fragmentation is a critical mining issue and quick and accurate measurements of size distribution are essential to manage fragmented rock. It can be used to optimize all blasting parameters to reduce costs [9].
Although many techniques have been used for evaluation of the
fragmentation, but their effectiveness in actual operations has seldom been documented [1]. There are several methods of size distribution measurement which fall under two broad categories; direct and indirect methods [5]. Sieving (or screening) is a direct and accurate method of evaluation of size distribution of particles and fragmentation; However,
for production blasting, this method is costly, time-consuming and inconvenient [4]. Hence, indirect methods, which are observational, empirical or digital methods have been developed. Observational methods include the visual observation of muckpile immediately following the blasting. It is widely used by blasting engineers to arrive at an approximation. In some empirical models such as Larsson’s equation, SveDeFo formula, KUZ-RAM model, etc, blasting parameters are considered to determine the size distribution of blasted rock [5, 10, 7, 11].
In this regard, another technique is using image processing programs which have been developed and have made rapid and accurate blast fragmentation distribution assessment possible [5, 12]. Some of these systems include IPACS, TUCIPS, FRAGSCAN, CIAS, GoldSize, WipFrag, SPLIT, PowerSieve and Fragalyst[4, 12]. Split Desktop, WipFrag, FragScan and GoldSize are the most popular software packages based on 2D image processing for performing size distribution analysis of the blasted rock blocks [12].
In addition to the aforementioned software packages which are employed in mining industry, the use of image processing and machine vision techniques is also on the rise. These techniques are utilized for detection of rock or clod particles, mostly in mineral processing plants (for detecting particles on the moving belt conveyor) or metallurgical processes, or even in remote sensing. However, these digital methods have inherent limitations, which adversely affect accuracy, precision, and reproducibility of measurement results. This stems from the fact

212 F. Sereshki et al./ IJMGE 50-2 (2016) 211–218
that there are myriads of variables, which influence the outcome of the measurements [14, 15]. Errors start with the imaging process and even more errors are introduced in the digital processing stage, where blocks may be miss-identified [14].
The image analysis techniques rely on first obtaining a digitized outline of each individual particle from a photograph by manual digitizing or automatic netting by CPU, then measuring the size and shape parameters of the particles by computer [16]. Manual digitizing is very time-consuming but it allows human interpretation of indistinct particle edges (that would otherwise cause disintegration), so measurement errors are reduced [1]. The time-consuming nature of manual digitizing will prevent from fast evaluation as an advantage for the computer software.
On the other hand, to ensure the validity of results in automatic netting of particles’ boundary, there should be an appropriate contrast between the particles. Therefore, image analysis methods work best under controlled conditions like over moving conveyor belts, where camera angles and distances can be held constant and lighting can be controlled [2, 3]. However, in practice, it is not possible to prepare the above conditions in big mines.
Because most imaging processing algorithms input data according to the shadows between fragments, using these methods to delineate individual blocks, as well as highly textured or multicolor fragments is inclined to confuse the block delineation algorithms, resulting in falsely identified fragment edges, and missed real fragment edges. In terms of color characteristics, the lighter the color of the rock, the easier it is for the edge delineation algorithms to correctly identify the edges. Even though this is true, it is still possible to image materials of all colors from white quartzite to black coal. Equally problematic areas are assemblages where individual fragments exhibit mottling, or color density variations. These also typically result in poor fragment delineation. Surface texture on the fragments also tends to confuse the edge delineation algorithms, in the same way that color differences do. In addition, fragments with void spaces are often difficult to deal with. The situation is worse in the case of washed and wet fragments, as this highlights color differences [3, 17]. Therefore, analyzed particle size can be over-divided or combined, which means larger particles can be divided into smaller particles and smaller particles can be grouped into larger particles. This is a common problem in all image processing programs [4, 5, 12, 13, 18, and 19].
On one hand the manual digitizing will increase the approximation accuracy and at the same time the required time; and on the other hand, although the automated determination of particles’ boundary is done in a matter of seconds, the approximation results usually don't have high accuracy, and in most cases the results are not reliable. So in software automatic determination of boundaries, there is often a need for a manual-edition stage which is time-consuming as well. By investigating the aforesaid problem, Sudhakar et al. declared that in automatic netting, the estimated average dimensions of the fragments are either bigger or smaller than their real values [4].
Regarding the abovementioned problems in detecting rock particle dimensions using the existing software, in this research, an appropriate algorithm is developed by using the image processing methods and presented for detection of rock particles; then the obtained results are compared with those of SplitDesktop and GoldSize. At first, by introducing image separating techniques in image analyzing methods, the previous studies in this filed are reviewed, and then, the techniques employed in the current research and its results are illustrated. Afterwards, the way of working with SplitDesktop and GoldSize software is briefly explained, and their output results are demonstrated.
2. Literature review
The image analysis systems make use of segmentation techniques for automated detection of particles’ boundary. This technique divides the image into homogeneous areas. Edge detection and Morphology-based methods are two examples of this technique [19]. Rock particle image
segmentation is typically the first and most difficult step. All subsequent interpretation tasks, including particle size, shape and texture analysis, rely heavily on the quality of the segmentation results [20]. The level of success in segmentation algorithms will determine the accuracy of the estimated size distribution [15]. Since rock particle images vary from one to another, it is difficult or even impossible to design and develop one segmentation algorithm for all kinds of rock particle images. The presented segmentation algorithms were developed for just several types of rock particle images with certain characteristics with respect to segmentation [20].
In 2006 Al-Thyabat and Miles used images of separated rock particles to evaluate the efficiency of measuring two different dimensions of the particles with the aim of attaining particle size distribution. Also, in order to separate touching particles in images, they utilized the Watershed algorithm [21].
In 2011 Thurley employed a morphological edge detection strategy to draw the boundary of limestone particles on a conveyor belt. In this work, 3-D data were used [17]. In 2012, Zelin et al. applied a series of pre-analyzing steps on the images using software to solve the overlapping problem for coal particles on conveyor belt; in the first step, they enhanced the primary image using Otsu method, afterwards the grayscale image was created. Also, exponential high pass filter and Fourier transform have been used in order to improve the images; and the edges of the image were detected by morphological edge detection [15]. In the same year Jemwa and Aldrich [19] investigated the problem of predicting the size class of coal particles on a conveyor belt with respect to the amount of fine size fraction, and for the purpose of particle identification, they proposed a machine vision approach based on textural characterization of images from coal material.
In 2014, Chimi et al. used a method based on a well-known segmentation algorithm which is called watershed segmentation method in order to detect clods in the soil; that is also applicable for remote sensing [22]. In the same year Al-Thyabt et al. focused on the difficulties raised in analyzing the images of coal particles on a moving conveyor belt, such as, camera location, overlapping of particles, image blurring, conveyor belt speed, dust generation and the treatment. After image analysis and using Gaussian filter for the image enhancement, they determined the coal particles’ boundary manually [23].
In 2013 and 2014 some other efforts were made in application of image processing for estimating the particle size distribution. In these research works, the particles’ boundaries were segmented manually, or the image processing aspects were not taken into consideration [24, 25].
Although segmentation methods have been successfully utilized in many object recognition systems, their use in particle size distribution estimation of aggregate material is still a challenge due to the abovementioned problems; and thus no general solution is available on the market [17, 19, and 23].
3. Sample Preparation and Photography
In order to evaluate the capability of determining the fragmentation size distribution with the approach developed using Matlab software, and to compare the results with SplitDesktop and GoldSize results, the laboratory samples of crushed rock were prepared by screening. The preparation was based on Rosin-Rammler distribution function (relation (1)) that is a function indicating the passing percentage of material mass. At first, specified values were taken for n and d50, and the weight percentage of each fraction was calculated according to Eq. (1) to acquire a 10kg sample. In Figure 1 one can see the image of first sample in two distributed and pile states with d50 equal to 38mm and n equal to 2. Table 1 shows the particle size and weight percentage of fractions for sample 3.
𝑅(𝑥) = 1 − 𝑒−(𝑥
𝑥𝑐)
𝑛
(1)
In (1), R(x) is the ratio of the mass passed through a screen having a dimension of x; while xc is the scale parameter (size at which the fraction passing is 63.9%), and n is the uniformity parameter [26].

F. Sereshki et al./ IJMGE 50-2 (2016) 211–218 213
Figure 1. Laboratory sample of crushed rock (n=1.4, d50=19), (a): Pile
(b): Distributed.
Table 1: Size and weight of each fraction for the sample 3 (n=1.4, and d50=19). Weight of each fraction (in grams) out of 10kg
Weight ratio of each fraction
Fraction (mm)
Screen size (mm)
7.9 0.000789 0 - 0.15 0.15 12.9 0.001291 0.15 - 0.3 0.3 34.0 0.003400 0.3 - 0.6 0.6 89.2 0.008917 0.6 - 1.2 1.2
222.9 0.022293 1.2 - 2.36 2.36 580.4 0.058044 2.36 - 4.75 4.75 1365.5 0.136555 4.75 - 9.51 9.51 946.0 0.094601 9.51 - 12.7 12.7 1741.1 0.174110 12.7 - 19 19 1468.0 0.146803 19 - 25.4 25.4 1926.6 0.192659 25.4 - 38 38 973.5 0.097350 38 - 51 51 397.6 0.039755 51 - 63.5 63.5 234.3 0.023432 > 63.5 125
4. Proposed Method for Automated Detection of Rock Particles
The procedure of the proposed approach is illustrated in Figure 2. As shown, initially the input images are transmitted to the grayscale space. The grayscale image is a monochrome image which indicates the brightness degree of the image.
According to different lighting conditions and camera location in imaging of each sample, every image will require its own specific image processing, so that different results were obtained for images by applying filters with definite dimensions and thresholds. Thus, to reduce this effect, the form shown in Figure 3 was considered for the data input in order to be able to evaluate the effect of filter dimension and threshold on various images with the purpose of acquiring optimal dimension and threshold values.
After generating the grayscale image, the median filter with the user-defined dimensions is applied to the image. This filter is a low-pass filter that due to its nature requires more processing time compared to other filters. Its working principal is in the way that it sorts the whole neighborhoods in an ascending order, then, selects the middle element of the sorted values and substitutes in the central pixel. Subsequently, in order to smooth the image, the Gaussian filter having 3×3 dimensions is utilized.
Afterwards, various segmentations were applied, and the Sobel filter is used. The Sobel masks outperform in noise removal. The segmentation divides the image into its constituent parts or objects. The degree of division depends on the problem at hand, in other words the segmentation is terminated when the desirable objects or regions are identified. Most of the segmentation algorithms are based on one of the two main properties of intensity, i.e. discontinuity and similarity. In the first category, the methodology is to divide the image based on sharp changes of intensity like edges. The basis of main method in the second category is based upon the division of image into regions which are similar according to a set of predefined criteria.
Line and edge detection is a kind of segmentation which is based on detecting sharp local changes in the intensity. The points, lines, and edges are the main components of image which their separation is
important to us. The edge pixels are those in which the image brightness intensity varies, and the edges are a set of connected edge pixels related to each other. The line can be considered as a part of edge in which the background intensity on either sides of line is significantly higher or lower than the line pixels’ intensity.
The edge detection is performed on basis of intensity changes. The model under evaluation in this research is edge detection based on the differences between two levels of intensity. Discovery of intensity changes for the edge detection purpose can be implemented using the first and second derivatives. Equations (2) and (3) give the first and second derivatives of the image.
)()1()( xfxfxfx
f
(2)
)()1(2)2()()1(2
2
xfxfxfxfxf
x
f
(3) In order to calculate the edge power and direction in (x, y) position
of the image f, the gradient operator ( f ) in its vector form is used as
Eq. (4). The amplitude and direction of f are also calculated using Eq.
(5) and (6).
x
f
y
f
g
gx
yfgradf )(
(4)
Figure 2. Procedure of the proposed method for detecting size of rock particles.
22
)(),(yx
ggfmagyxM
(5)
y
x
g
gyx 1tan),(
(6) Achieving the gradient of image requires calculation of partial
derivatives of xf
and yf
in the position of each pixel in the image. Since the relevant quantities are digital ones, digital approximation of partial derivatives on the output of a neighborhood around a point is
(a) (b)

214 F. Sereshki et al./ IJMGE 50-2 (2016) 211–218
required. Relations (7) and (8) represent the discrete form of xg and yg
that can be implemented using image filtering through one-dimensional masks.
),(),1(),(
yxfyxfx
yxfg
x
(7)
),()1,(),(
yxfyxfy
yxfg
y
(8) The edge detection technique of Canny is more efficient than the
Sobel method. In other words, the Canny algorithm has lower error rate. But the improvements of the Canny technique comes at the price of more complex implementation compared to Sobel method and longer execution time.
After detecting lines, another median filter with dimensions of 5×5 is applied, and the morphological operators are used. In image processing, the morphology is used as a tool to extract the image components. This
method acts based on the shape of objects existing within the image. The morphology consists of some basic primary operators, such as Dilation, Erosion, Opening, and Closing; and the other morphological operators are defined using the primary ones. In this work, for enhancement the quality of the images, the “Opening” operator is employed after the application of filters. For the binary and grayscale images, these operators are defined in two forms. In the current paper, the abovementioned operators are used for the grayscale images.
By identifying the connected regions, and labeling of each identified pixel, the rock particles are detected, and the area of each particle is determined according to the number of pixels within the scale balls, and then, the result is stored in an “Excel” file.
The images resulted from the proposed image processing approach have been illustrated in two pile and distributed states in Figures 4 and 5.
Figure 3. Form of determining the threshold and dimensions of median filter.
Figure 4. Output images of the proposed approach for distributed laboratory sample, (a): grayscale image after detection of lines (b): threshold image (c): applying the
second median filter (d): employing morphological operators.
Figure 5. Output images of the proposed approach for pile laboratory sample, (a): grayscale image after detection of lines (b): threshold image (c): application of the
second median filter (d): employing morphological operators.

F. Sereshki et al./ IJMGE 50-2 (2016) 211–218 215
5. SplitDesktop
SplitDesktop, which is based on 2-D images processing, is one of the most popular software packages for blast fragmentation analysis. This software uses images captured with two objects (balls) that are used as scaling tools. After the scaling process, the software delineates images automatically with an image filter as depicted in Figure 6. As it can be seen, the boundaries have not been drawn correctly, and the results (particle size distribution curve) are completely different from reality. Hence, regarding the possibility of manual edition of software automatic delineation, the particles boundary was drawn manually from the beginning that took a long time (Figure 7). After determining the particles in the previous stage, the software draws the particle size distribution curve as the output.
Figure 6. Automated delineation of particle boundaries in SplitDesktop software,
(a): Pile (b): Distributed.
Figure 7. Manual delineation of particle boundaries in SplitDesktop software,
(a): Pile (b): Distributed.
6. GoldSize
In this software, the particle sizing of fragmented rock is also evaluated based on 2-D digital images. In this system, the particle
boundaries are drawn by the user from the beginning. Figure 8 shows the working environment of this software in which the boundaries have been segmented.
7. Comparison of Results
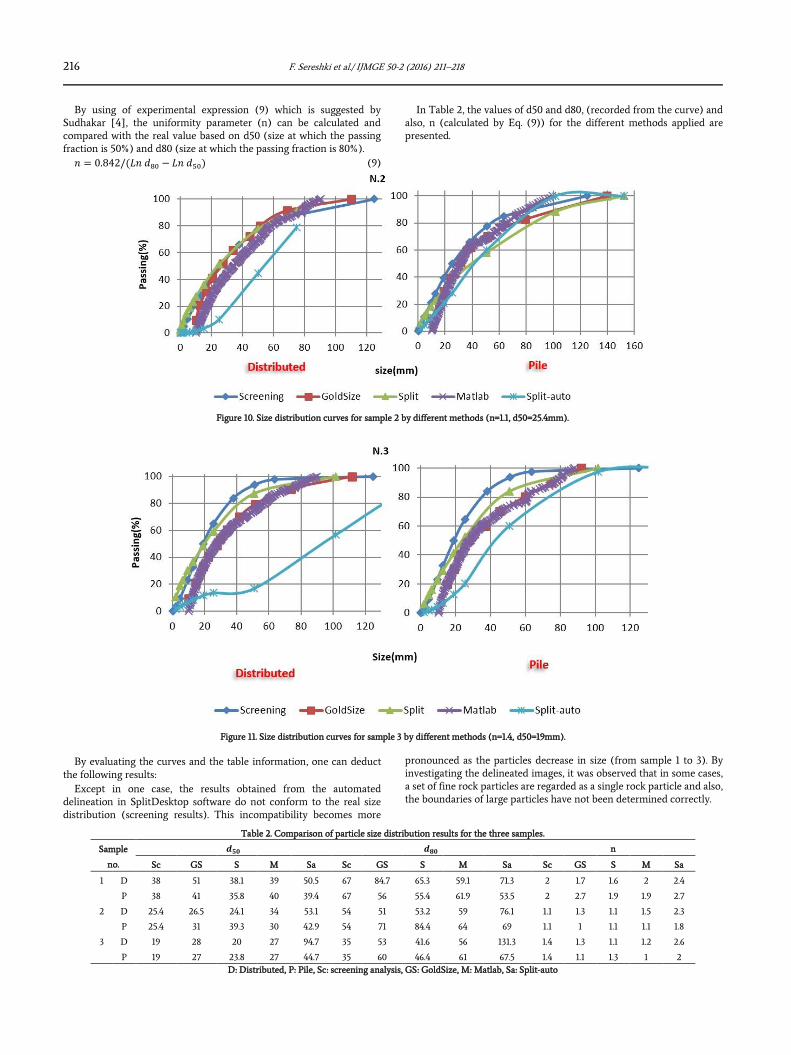
The figures 9, 10, 11 illustrate the particle size distribution curve for the samples 1, 2, and 3, in two distributed and pile states. In each curve, the particle size distribution is resulted from the screening analysis, GoldSize and Split software, and the proposed approach in Matlab software. The obtained curve from Split is the result of manual delineation in SplitDesktop, and the Split-auto refers to delineation by the software automatically.
Figure 8. Working environment of GoldSize software, right: delineation state,
left: scaling state.
Figure 9. Size distribution curves for sample 1 by different methods (n=2, d50=38mm).
(a) (b)
(a) (b)
216 F. Sereshki et al./ IJMGE 50-2 (2016) 211–218
By using of experimental expression (9) which is suggested by Sudhakar [4], the uniformity parameter (n) can be calculated and compared with the real value based on d50 (size at which the passing fraction is 50%) and d80 (size at which the passing fraction is 80%).
𝑛 = 0.842/(𝐿𝑛 𝑑80 − 𝐿𝑛 𝑑50) (9)
In Table 2, the values of d50 and d80, (recorded from the curve) and also, n (calculated by Eq. (9)) for the different methods applied are presented.
Figure 10. Size distribution curves for sample 2 by different methods (n=1.1, d50=25.4mm).
Figure 11. Size distribution curves for sample 3 by different methods (n=1.4, d50=19mm).
By evaluating the curves and the table information, one can deduct the following results:
Except in one case, the results obtained from the automated delineation in SplitDesktop software do not conform to the real size distribution (screening results). This incompatibility becomes more
pronounced as the particles decrease in size (from sample 1 to 3). By investigating the delineated images, it was observed that in some cases, a set of fine rock particles are regarded as a single rock particle and also, the boundaries of large particles have not been determined correctly.
Table 2. Comparison of particle size distribution results for the three samples.
n 𝒅𝟖𝟎 𝒅𝟓𝟎 Sample
no. Sa M S GS Sc Sa M S GS Sc Sa M S GS Sc
2.4 2 1.6 1.7 2 71.3 59.1 65.3 84.7 67 50.5 39 38.1 51 38 D 1
2.7 1.9 1.9 2.7 2 53.5 61.9 55.4 56 67 39.4 40 35.8 41 38 P
2.3 1.5 1.1 1.3 1.1 76.1 59 53.2 51 54 53.1 34 24.1 26.5 25.4 D 2
1.8 1.1 1.1 1 1.1 69 64 84.4 71 54 42.9 30 39.3 31 25.4 P
2.6 1.2 1.1 1.3 1.4 131.3 56 41.6 53 35 94.7 27 20 28 19 D 3
2 1 1.3 1.1 1.4 67.5 61 46.4 60 35 44.7 27 23.8 27 19 P D: Distributed, P: Pile, Sc: screening analysis, GS: GoldSize, M: Matlab, Sa: Split-auto
F. Sereshki et al./ IJMGE 50-2 (2016) 211–218 217
Although in the “Split-auto” case the boundary of rocks is detected by the software, for separating the background image and drawing the boundaries of surrounding rocks, a manual edition stage is required.
The results of manual determination of boundaries in SplitDesktop and GoldSize software packages are better in distributed state than in the pile one, which is due to observation of all the rock fragments and determination of the boundaries of each one.
In the finer sample (sample 3), despite the manual delineation, both SplitDesktop and GoldSize have estimated larger values for the particle size distribution. In these software packages, it is not possible to determine all the fine particles due to the limitation on the image contrast. In GoldSize software, the fine particles are not determined correctly, and in SplitDesktop, only the boundaries of the fine particles are detected and measured.
It is worth mentioning that in the manual delineation step,
SplitDesktop is easier to work with than Goldsize, and also the correction of user-induced errors is better possible within the former one.
The results of the proposed method are acceptable regarding the automated determination of the particles boundaries; and also, with regard to the results of manual determination in both of the two software packages, rock particles are not detected correctly when the particles are fine.
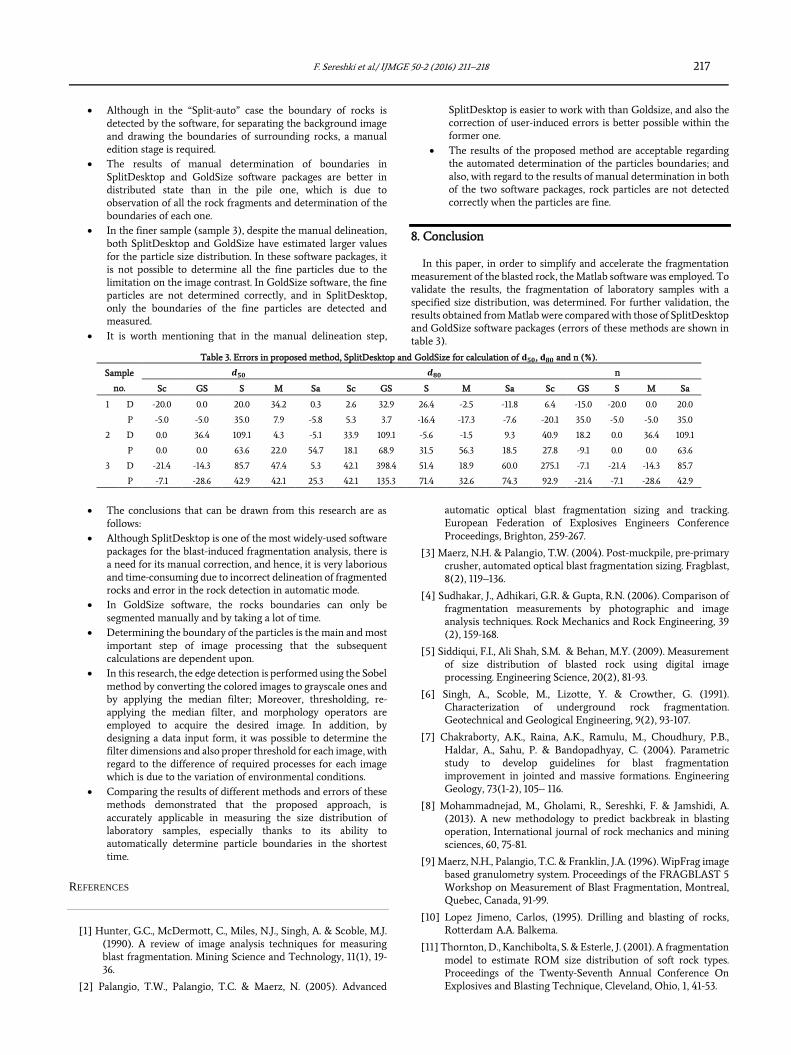
8. Conclusion
In this paper, in order to simplify and accelerate the fragmentation measurement of the blasted rock, the Matlab software was employed. To validate the results, the fragmentation of laboratory samples with a specified size distribution, was determined. For further validation, the results obtained from Matlab were compared with those of SplitDesktop and GoldSize software packages (errors of these methods are shown in table 3).
Table 3. Errors in proposed method, SplitDesktop and GoldSize for calculation of 𝐝𝟓𝟎, 𝐝𝟖𝟎 and n (%).
n 𝒅𝟖𝟎 𝒅𝟓𝟎 Sample
no. Sa M S GS Sc Sa M S GS Sc Sa M S GS Sc
20.0 0.0 -20.0 -15.0 6.4 -11.8 -2.5 26.4 32.9 2.6 0.3 34.2 20.0 0.0 -20.0 D 1
35.0 -5.0 -5.0 35.0 -20.1 -7.6 -17.3 -16.4 3.7 5.3 -5.8 7.9 35.0 -5.0 -5.0 P
109.1 36.4 0.0 18.2 40.9 9.3 -1.5 -5.6 109.1 33.9 -5.1 4.3 109.1 36.4 0.0 D 2
63.6 0.0 0.0 -9.1 27.8 18.5 56.3 31.5 68.9 18.1 54.7 22.0 63.6 0.0 0.0 P
85.7 -14.3 -21.4 -7.1 275.1 60.0 18.9 51.4 398.4 42.1 5.3 47.4 85.7 -14.3 -21.4 D 3
42.9 -28.6 -7.1 -21.4 92.9 74.3 32.6 71.4 135.3 42.1 25.3 42.1 42.9 -28.6 -7.1 P
The conclusions that can be drawn from this research are as follows:
Although SplitDesktop is one of the most widely-used software packages for the blast-induced fragmentation analysis, there is a need for its manual correction, and hence, it is very laborious and time-consuming due to incorrect delineation of fragmented rocks and error in the rock detection in automatic mode.
In GoldSize software, the rocks boundaries can only be segmented manually and by taking a lot of time.
Determining the boundary of the particles is the main and most important step of image processing that the subsequent calculations are dependent upon.
In this research, the edge detection is performed using the Sobel method by converting the colored images to grayscale ones and by applying the median filter; Moreover, thresholding, re-applying the median filter, and morphology operators are employed to acquire the desired image. In addition, by designing a data input form, it was possible to determine the filter dimensions and also proper threshold for each image, with regard to the difference of required processes for each image which is due to the variation of environmental conditions.
Comparing the results of different methods and errors of these methods demonstrated that the proposed approach, is accurately applicable in measuring the size distribution of laboratory samples, especially thanks to its ability to automatically determine particle boundaries in the shortest time.
REFERENCES
[1] Hunter, G.C., McDermott, C., Miles, N.J., Singh, A. & Scoble, M.J. (1990). A review of image analysis techniques for measuring blast fragmentation. Mining Science and Technology, 11(1), 19-36.
[2] Palangio, T.W., Palangio, T.C. & Maerz, N. (2005). Advanced
automatic optical blast fragmentation sizing and tracking. European Federation of Explosives Engineers Conference Proceedings, Brighton, 259-267.
[3] Maerz, N.H. & Palangio, T.W. (2004). Post-muckpile, pre-primary crusher, automated optical blast fragmentation sizing. Fragblast, 8(2), 119–136.
[4] Sudhakar, J., Adhikari, G.R. & Gupta, R.N. (2006). Comparison of fragmentation measurements by photographic and image analysis techniques. Rock Mechanics and Rock Engineering, 39 (2), 159-168.
[5] Siddiqui, F.I., Ali Shah, S.M. & Behan, M.Y. (2009). Measurement of size distribution of blasted rock using digital image processing. Engineering Science, 20(2), 81-93.
[6] Singh, A., Scoble, M., Lizotte, Y. & Crowther, G. (1991). Characterization of underground rock fragmentation. Geotechnical and Geological Engineering, 9(2), 93-107.
[7] Chakraborty, A.K., Raina, A.K., Ramulu, M., Choudhury, P.B., Haldar, A., Sahu, P. & Bandopadhyay, C. (2004). Parametric study to develop guidelines for blast fragmentation improvement in jointed and massive formations. Engineering Geology, 73(1-2), 105– 116.
[8] Mohammadnejad, M., Gholami, R., Sereshki, F. & Jamshidi, A. (2013). A new methodology to predict backbreak in blasting operation, International journal of rock mechanics and mining sciences, 60, 75-81.
[9] Maerz, N.H., Palangio, T.C. & Franklin, J.A. (1996). WipFrag image based granulometry system. Proceedings of the FRAGBLAST 5 Workshop on Measurement of Blast Fragmentation, Montreal, Quebec, Canada, 91-99.
[10] Lopez Jimeno, Carlos, (1995). Drilling and blasting of rocks, Rotterdam A.A. Balkema.
[11] Thornton, D., Kanchibolta, S. & Esterle, J. (2001). A fragmentation model to estimate ROM size distribution of soft rock types. Proceedings of the Twenty-Seventh Annual Conference On Explosives and Blasting Technique, Cleveland, Ohio, 1, 41-53.

218 F. Sereshki et al./ IJMGE 50-2 (2016) 211–218
[12] Kim, K. (2006). Blasting design using fracture toughness and image analysis of the bench face and muckpile. M.S, thesis, Virginia polytechnic institute and state university, Blacksburg.
[13] Han, J-H. & Song, J-J. (2014). Statistical estimation of blast fragmentation by applying stereophotogrammetry to block piles. International Journal of Rock Mechanics & Mining Sciences, 68, 150–158.
[14] Maerz, N.H. & Zhou, W. (1998). Optical digital fragmentation measuring systems – inherent sources of error, The International Journal for Blasting and Fragmentation, 2(4), 415- 431.
[15] Zelin, Z., Jianguo, Y., Lihua, D. & Yuemin, Z. (2012). Estimation of coal particle size distribution by image segmentation. International Journal of Mining Science and Technology, 22, 739–744.
[16] Wang, W. (2006). Size and shape measure of particles by image analysis. 11th International Workshop, IWCIA Proceedings, Berlin, Germany, 4040, 253 – 262.
[17] Thurley, M.J. (2011). Automated online measurement of limestone particle size distributions using 3D range data. Journal of Process Control, 21(2), 254–262.
[18] Maerz, N.H. & Zhou, W. (1999). Calibration of optical digital fragmentation measuring systems. FRAGBLAST 6, Sixth International Symposium For Rock Fragmentation By Blasting, Johannesburg, South Africa, 125-130.
[19] Jemwa, G.T. & Aldrich, C. (2012). Estimating size fraction categories of coal particles on conveyor belts using image texture modeling methods. Expert Systems with Applications, 39(9), 7947–7960.
[20] Weixing, W. (2008). Rock Particle Image Segmentation and Systems, Pattern Recognition Techniques, Technology and Applications, Peng-Yeng Yin (Ed.), ISBN: 978-953-7619-24-4, InTech, Available from:
http://www.intechopen.com/books/pattern_ recognition_techniques_technology_and_applications/rock_particle _image_segmentation _ and _ systems.
[21] Al-Thyabat, S. & Miles, N.J. (2006). An improved estimation of size distribution from particle profile measurements. Powder Technology, 166(3), 152–160.
[22] Chimi, C.O., Hegarat, M.S.L., Vannier, E., Taconet, O. & Dusseaux, R. (2014). Automatic clod detection and boundary estimation from Digital Elevation Model images using different approaches. Catena, 118, 73–83.
[23] Al-Thyabat, S., Miles, N.J. & Koh, T.S. (2007). Estimation of the size distribution of particles moving on a conveyor belt. Minerals Engineering, 20(1), 72–83.
[24] Hamzeloo, E., Massinaei, M. & Mehrshad, N., (2014). Estimation of particle size distribution on an industrial conveyor belt using image analysis and neural networks. Powder Technology, 261, 185–190.
[25] Zhang, Z., Yang, J., Su, X. & Ding, L. (2013). Analysis of large particle sizes using a machine vision system, Physicochemical Problems of Mineral Processing, 49(2), 397−405.
[26] Sanchidrian, J.A., Ouchterlony, F., Moser, P., Segarra, P. & Lopez, L.M. (2012). Performance of some distributions to describe rock fragmentation data. International Journal of Rock Mechanics & Mining Sciences, 53, 18–31.