blackstone alternative multi-strategy fund (bxmix) … · blackstone alternative multi-strategy...
TRANSCRIPT
Blackstone Alternative Multi-Strategy Fund (BXMIX) As of July 31, 2015
Investment approach
Blackstone Alternative Multi-Strategy Fund’s (“Fund”) investment objective is to seek capital appreciation. The Fund seeks this objective by allocating its assets among a variety of nontraditional or “alternative” investment strategies. Blackstone will allocate the Fund’s assets among investment subadvisers with experience managing alternative investment strategies and among investment funds. It may also manage a portion of the Fund’s assets directly.
Fund highlights
Fund assets6 $2,083 million
Inception date June 16, 2014
Investment advisor
Blackstone Alternative Investment Advisors, LLC
Eligible investors US taxable & tax-exempt
Liquidity Daily
CUSIP 09257V201
Fund terms (Share Class I)
Minimum investment $1,000,000
Omnibus/Bank investment minimum
$0*
Management fee 1.95%
Gross expense ratio 3.44%
Net expense ratio7 2.40%
* The investment minimum is waived for clients of a fi nancial intermediary, broker-dealer, fi nancial institution, or registered investment advisor that invest in the Fund through an omnibus account.
Portfolio managers
Name Experience
Stephen Sullens 25 years
Alberto Santulin 19 years
Rich Scarinci 12 years
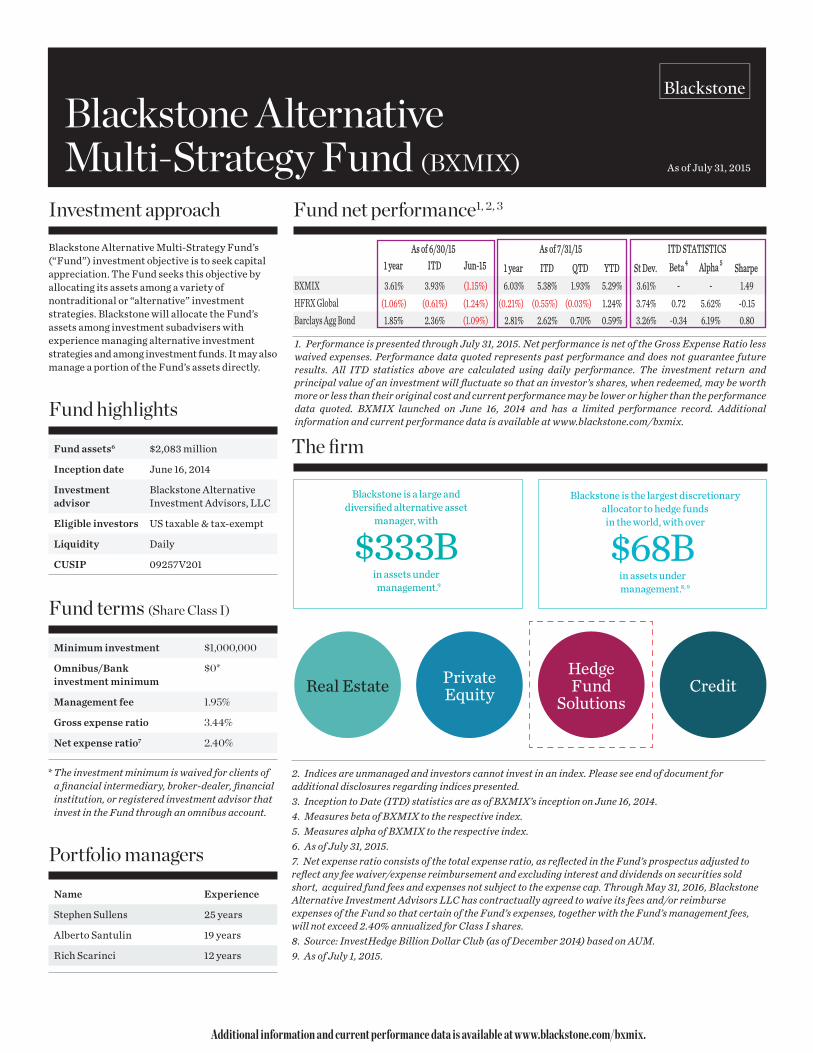
Fund net performance1, 2, 3
11 year ITD Jun-15 1 year ITD QTD YTD St Dev. Beta 4 Alpha 5 SharpeBXMIX 3.61% 3.93% (1.15%) 6.03% 5.38% 1.93% 5.29% 3.61% - - 1.49HFRX Global (1.06%) (0.61%) (1.24%) (0.21%) (0.55%) (0.03%) 1.24% 3.74% 0.72 5.62% -0.15Barclays Agg Bond 1.85% 2.36% (1.09%) 2.81% 2.62% 0.70% 0.59% 3.26% -0.34 6.19% 0.80
As of 6/30/15 ITD STATISTICSAs of 7/31/15
1. Performance is presented through July 31, 2015. Net performance is net of the Gross Expense Ratio less waived expenses. Performance data quoted represents past performance and does not guarantee future results. All ITD statistics above are calculated using daily performance. The investment return and principal value of an investment will fl uctuate so that an investor’s shares, when redeemed, may be worth more or less than their original cost and current performance may be lower or higher than the performance data quoted. BXMIX launched on June 16, 2014 and has a limited performance record. Additional information and current performance data is available at www.blackstone.com/bxmix.
The fi rm
$333B
Blackstone is a large and diversifi ed alternative asset
manager, with
in assets under management.9
$68B
Blackstone is the largest discretionary allocator to hedge funds in the world, with over
in assets under management.8, 9
2. Indices are unmanaged and investors cannot invest in an index. Please see end of document for additional disclosures regarding indices presented.3. Inception to Date (ITD) statistics are as of BXMIX’s inception on June 16, 2014.4. Measures beta of BXMIX to the respective index.5. Measures alpha of BXMIX to the respective index. 6. As of July 31, 2015.7. Net expense ratio consists of the total expense ratio, as refl ected in the Fund’s prospectus adjusted to refl ect any fee waiver/expense reimbursement and excluding interest and dividends on securities sold short, acquired fund fees and expenses not subject to the expense cap. Through May 31, 2016, Blackstone Alternative Investment Advisors LLC has contractually agreed to waive its fees and/or reimburse expenses of the Fund so that certain of the Fund’s expenses, together with the Fund’s management fees, will not exceed 2.40% annualized for Class I shares.8. Source: InvestHedge Billion Dollar Club (as of December 2014) based on AUM.9. As of July 1, 2015.
Real Estate PrivateEquity
HedgeFund
SolutionsCredit
Additional information and current performance data is available at www.blackstone.com/bxmix.
All investors should consider the investment objectives, risks, charges and expenses of BXMIX, Class I carefully before investing. The prospectus and, if available, the summary prospectus contain this and other information about BXMIX and are available on BXMIX’s website at www.blackstone.com/bxmix. All investors are urged to carefully read the prospectus and, if available, the summary prospectus in its entirety before investing.Beta: A measure of the volatility, or systemic risk, of a security or a portfolio in comparison to the market as a whole. Volatility/Standard Deviation: A measure of the dispersion of a set of data from its mean. The more spread apart the data, the higher the deviation. Standard deviation is calculated as the square root of variance. Sharpe Ratio: A ratio to measure risk-adjusted performance. The Sharpe ratio is calculated by subtracting the risk-free rate – such as that of the 10-year U.S. Treasury bond – from the rate of return for a portfolio and dividing the result by the standard deviation of the portfolio returns. The greater a portfolio’s Sharpe ratio, the better its risk-adjusted performance has been. Alpha: A risk-adjusted performance measure that represents the average return on a portfolio over and above that predicted by the capital asset pricing model (CAPM), given the portfolio’s beta and the average market return.Glossary of IndicesMarket indices obtained through Bloomberg. Indices are unmanaged and investors cannot invest in an index. The volatility of the indices presented may be materially diff erent from that of the performance of BXMIX. In addition, the indices employ diff erent investment guidelines and criteria than BXMIX; as a result, the holdings in BXMIX may diff er signifi cantly from the securities that comprise the indices. The performance of the indices has not been selected to represent an appropriate benchmark to compare to the performance of BXMIX, but rather is disclosed to allow for comparison of BXMIX’s performance to that of well-known and widely recognized indices. In the case of equity indices, performance of the indices refl ects the reinvestment of dividends. Barclays Aggregate Bond Index: covers the USD-denominated, investment-grade, fi xed-rate, taxable bond market of SEC-registered securities. The index includes government securities, mortgage-backed securities, asset-backed securities and corporate securities all with a maturity of greater than one year. HFRX Global Hedge Fund Index: designedd to be representative of the overall composition of the hedge fund universe. It is comprised of all eligible hedge fund strategies; including but not limited to convertible arbitrage, distressed securities, equity hedge, equity market neutral, even driven, macro, merger arbitrage, and relative value arbitrage. The strategies are asset weighted based on the distribution of assets in the hedge fund industry. Important RisksAn investment in BXMIX, Class I should be considered a speculative investment that entails substantial risks; you may lose part or all of your investment or your investment may not perform as well as other investments. BXMIX’s investments involve special risks including, but not limited to, loss of all or a
signifi cant portion of the investment due to leveraging, short-selling, or other speculative practices, lack of liquidity and volatility of returns. The following is a summary description of certain additional principal risks of investing in BXMIX: Allocation Risk – Blackstone’s judgment about the attractiveness, value or market trends aff ecting a particular asset class, investment style, subadviser or security may be incorrect and this may have a negative impact upon performance. Derivatives Risk – the use of derivatives involves the risk that their value may not move as expected relative to the value of the relevant underlying assets, rates, or indices. Derivatives can be subject to counterparty credit risk and may entail investment exposure greater than their notional amount. Distressed Securities Risk: investments in securities of business enterprises involved in workouts, liquidations, reorganizations, bankruptcies and similar situations involve a high degree of risk of loss since there is typically substantial uncertainty concerning the outcome of such situations. Event-Driven Trading Risk – involves the risk that the specifi c event identifi ed may not occur as anticipated and that this may have a negative impact upon the market price of the securities involved. Foreign Investments/ Emerging Markets Risk: involves special risks caused by foreign political, social and economic factors, including exposure to currency fl uctuations, less liquidity, less developed and less effi cient trading markets, political instability and less developed legal and auditing standards. High Portfolio Turnover Risk: active trading of securities can increase transaction costs (thus lowering performance) and taxable distributions. Model and Technology Risk – involves the risk that model-based strategies, data gathering systems, order execution and trade allocation systems and risk management systems may not be successful on an ongoing basis or could contains errors, omissions, imperfections or malfunctions. Multi-Manager Risk: managers may make investment decisions which confl ict with each other and as a result, the Fund could incur transaction costs without accomplishing any net investment result. Prepared by Blackstone Advisory Partners L.P., a member of FINR A and an affi liate of Blackstone Alternative Investment Advisors LLC, the investment adviser of the Fund.
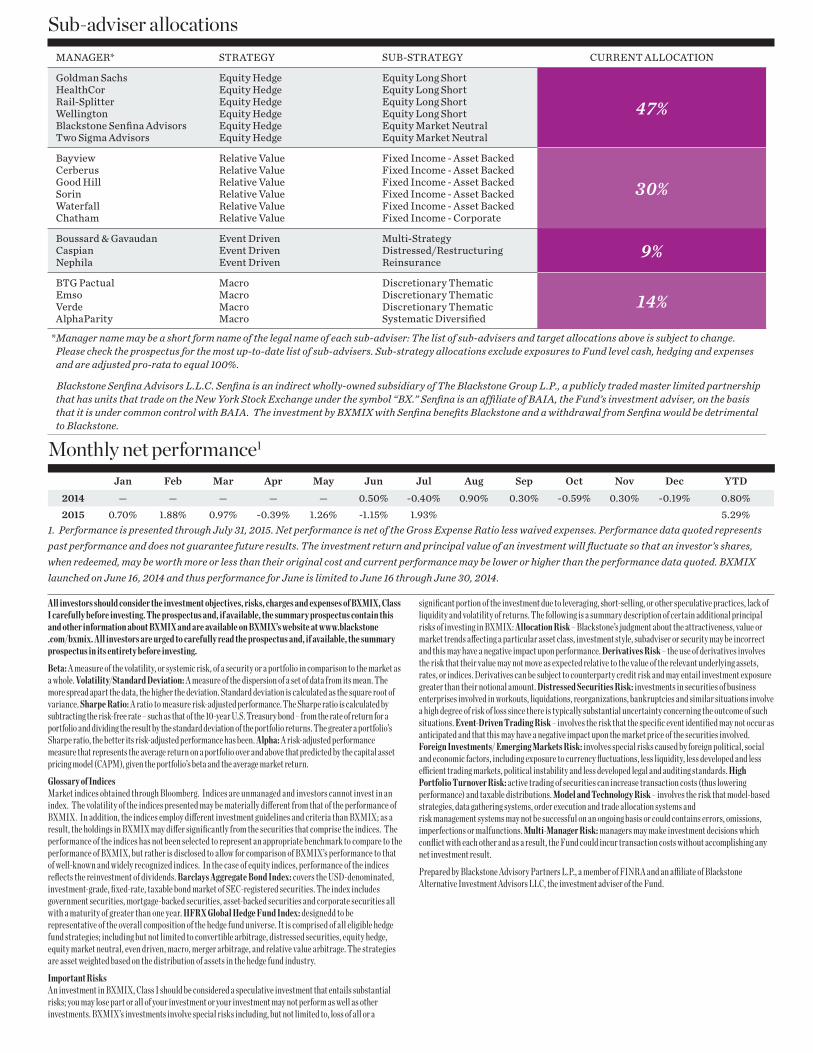
Sub-adviser allocationsMANAGER* STRATEGY SUB-STRATEGY CURRENT ALLOCATION
Goldman SachsHealthCorRail-SplitterWellingtonBlackstone Senfi na AdvisorsTwo Sigma Advisors
Equity HedgeEquity HedgeEquity HedgeEquity HedgeEquity HedgeEquity Hedge
Equity Long ShortEquity Long ShortEquity Long ShortEquity Long ShortEquity Market NeutralEquity Market Neutral
47%
BayviewCerberusGood HillSorin WaterfallChatham
Relative ValueRelative ValueRelative ValueRelative ValueRelative ValueRelative Value
Fixed Income - Asset BackedFixed Income - Asset BackedFixed Income - Asset BackedFixed Income - Asset BackedFixed Income - Asset BackedFixed Income - Corporate
30%
Boussard & GavaudanCaspianNephila
Event DrivenEvent DrivenEvent Driven
Multi-StrategyDistressed/RestructuringReinsurance
9%
BTG PactualEmsoVerdeAlphaParity
MacroMacroMacroMacro
Discretionary ThematicDiscretionary ThematicDiscretionary ThematicSystematic Diversifi ed
14%
* Manager name may be a short form name of the legal name of each sub-adviser: The list of sub-advisers and target allocations above is subject to change. Please check the prospectus for the most up-to-date list of sub-advisers. Sub-strategy allocations exclude exposures to Fund level cash, hedging and expenses and are adjusted pro-rata to equal 100%.
Blackstone Senfi na Advisors L.L.C. Senfi na is an indirect wholly-owned subsidiary of The Blackstone Group L.P., a publicly traded master limited partnership that has units that trade on the New York Stock Exchange under the symbol “BX.” Senfi na is an affi liate of BAIA, the Fund’s investment adviser, on the basis that it is under common control with BAIA. The investment by BXMIX with Senfi na benefi ts Blackstone and a withdrawal from Senfi na would be detrimental to Blackstone.
Monthly net performance1
Jan Feb Mar Apr May Jun Jul Aug Sep Oct Nov Dec YTD
2014 — — — — — 0.50% -0.40% 0.90% 0.30% -0.59% 0.30% -0.19% 0.80%
2015 0.70% 1.88% 0.97% -0.39% 1.26% -1.15% 1.93% 5.29%1. Performance is presented through July 31, 2015. Net performance is net of the Gross Expense Ratio less waived expenses. Performance data quoted represents past performance and does not guarantee future results. The investment return and principal value of an investment will fl uctuate so that an investor’s shares, when redeemed, may be worth more or less than their original cost and current performance may be lower or higher than the performance data quoted. BXMIX launched on June 16, 2014 and thus performance for June is limited to June 16 through June 30, 2014.
Blackstone Alternative Multi-Strategy Fund (BXMIX)
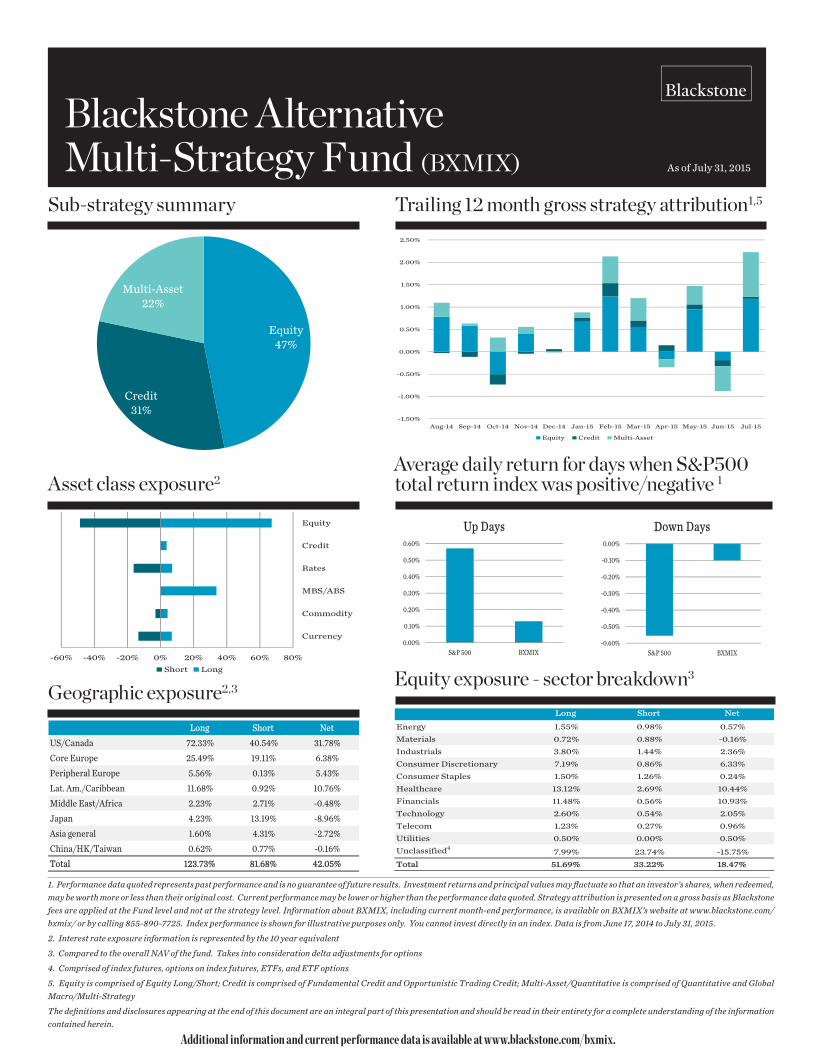
Sub-strategy summary
Asset class exposure2
Geographic exposure2,3
Trailing 12 month gross strategy attribution1,5
As of July 31, 2015
Average daily return for days when S&P500 total return index was positive/negative 1
Equity47%
Credit31%
Multi-Asset22%
-60% -40% -20% 0% 20% 40% 60% 80%
Currency
Commodity
MBS/ABS
Rates
Credit
Equity
Short Long
LLong Short Net
US/Canada 72.33% 40.54% 31.78%
Core Europe 25.49% 19.11% 6.38%
Peripheral Europe 5.56% 0.13% 5.43%
Lat. Am./Caribbean 11.68% 0.92% 10.76%
Middle East/Africa 2.23% 2.71% -0.48%
Japan 4.23% 13.19% -8.96%
Asia general 1.60% 4.31% -2.72%
China/HK/Taiwan 0.62% 0.77% -0.16%
Total 123.73% 81.68% 42.05%
-1.50%
-1.00%
-0.50%
0.00%
0.50%
1.00%
1.50%
2.00%
2.50%
Aug-14 Sep-14 Oct-14 Nov-14 Dec-14 Jan-15 Feb-15 Mar-15 Apr-15 May-15 Jun-15 Jul-15
Equity Credit Multi-Asset
Equity exposure - sector breakdown3
LLong Short Net
Energy 1.55% 0.98% 0.57%
Materials 0.72% 0.88% -0.16%
Industrials 3.80% 1.44% 2.36%
Consumer Discretionary 7.19% 0.86% 6.33%
Consumer Staples 1.50% 1.26% 0.24%
Healthcare 13.12% 2.69% 10.44%
Financials 11.48% 0.56% 10.93%
Technology 2.60% 0.54% 2.05%
Telecom 1.23% 0.27% 0.96%
Utilities 0.50% 0.00% 0.50%
Unclassified47.99% 23.74% -15.75%
Total 51.69% 33.22% 18.47%
1. Performance data quoted represents past performance and is no guarantee of future results. Investment returns and principal values may fl uctuate so that an investor’s shares, when redeemed, may be worth more or less than their original cost. Current performance may be lower or higher than the performance data quoted. Strategy attribution is presented on a gross basis as Blackstone fees are applied at the Fund level and not at the strategy level. Information about BXMIX, including current month-end performance, is available on BXMIX’s website at www.blackstone.com/bxmix/ or by calling 855-890-7725. Index performance is shown for illustrative purposes only. You cannot invest directly in an index. Data is from June 17, 2014 to July 31, 2015.
2. Interest rate exposure information is represented by the 10 year equivalent
3. Compared to the overall NAV of the fund. Takes into consideration delta adjustments for options
4. Comprised of index futures, options on index futures, ETFs, and ETF options
5. Equity is comprised of Equity Long/Short; Credit is comprised of Fundamental Credit and Opportunistic Trading Credit; Multi-Asset/Quantitative is comprised of Quantitative and Global Macro/Multi-Strategy
The defi nitions and disclosures appearing at the end of this document are an integral part of this presentation and should be read in their entirety for a complete understanding of the information contained herein.
Additional information and current performance data is available at www.blackstone.com/bxmix.
0.00%
0.10%
0.20%
0.30%
0.40%
0.50%
0.60%
S&P 500 BXMIX
UUp Days
-0.60%
-0.50%
-0.40%
-0.30%
-0.20%
-0.10%
0.00%
S&P 500 BXMIX
DDown Days
Performance commentaryThe investment objective of Blackstone Alternative Multi-Strategy Fund (the “Fund”) is to seek capital appreciation. The Fund aims to achieve its objective by allocating assets among a variety of investment sub-advisers with experience managing non-traditional or “alternative” investment strategies. In July, the Fund’s Class I share class
returned +1.93% net of fees and expenses versus +2.10% and +1.83% for the S&P 500 and MSCI World, respectively, and versus +0.70% for the Barclays U.S. Aggregate Bond Index.
Economic data revealed U.S. GDP growth in the fi rst half of 2015 came in well short of economists’ expectations at this point in the country’s economic expansion. Meanwhile, infl ation continues to be below the Fed’s 2% target, while key measures of compensation growth are running very low at a 2% pace. Although the unemployment rate has dropped by nearly half since its 32-year peak of 10% six years ago, the current recovery is a relatively weak one compared to those following the recessions of 2001 and the early 1990s. Still, the odds of a near-term rate hike by the US Federal Reserve are rising as it appears to be less backward looking data-dependent and more confi dent to tighten policy on the basis of its forecast that GDP growth and infl ation will eventually pick up. Many investors no longer consider it to be a question of “if” or “when” a rate hike will occur, but rather “at what pace” will rates rise. Global equity and fi xed income markets rebounded during the month as Greece dodged a bullet, turmoil in China moved to the back burner (at least temporarily) and corporate earnings trends showed signs of strengthening. It was a brutal month for commodities, however, as evidenced by the Bloomberg Commodity Index tumbling to a 13-year low. A deal limiting Iran’s nuclear program in exchange for lifting sanctions led investors to anticipate a new fl ood of oil supply from the Middle East. That, combined with existing oversupply and slowing demand from China, prompted a selloff in crude oil. Base metals also experienced selling pressure on the back of uncertainty about the Chinese government’s near-term investment in infrastructure projects.
We believe that a lack of synchronicity created by expansion in the U.S. and Europe along with a slowing emerging markets backdrop will continue to drive markets, potentially creating a tougher beta environment in aggregate, but with myriad opportunities within specifi c geographical and sector themes. Given these dynamics, we continue to shift away from directional exposures to more diversifying ones, both through recalibrating towards lower net exposures in Equity Market Neutral sub-strategies and increasing allocations towards certain opportunistic trades.
Equity:July was a strong month for our Equity Hedge strategies, which delivered solid performance from both an absolute return and alpha perspective. Fundamental stock picking drove performance, with gains extracted from both long and short positions. As a general observation, the alpha environment for Equity Long/Short sub-strategies has been as attractive lately as it has been in a number of years. And although we are actively reducing our directional exposure or beta, we are constructive on the opportunity to generate alpha and are positioning accordingly. From a sector perspective, positions in consumer discretionary, consumer staples, information technology and fi nancials contributed to performance while positions in industrials, utilities, commodities and biotech detracted from performance. Some short energy positions performed well on the heels of the drop in oil prices.
Credit:The performance of the Credit strategies was mixed in July, ending the month relatively fl at. We saw positive performance across most Fixed Income – Asset Backed sub-strategies with gains in both residential and commercial mortgage backed securities. Some structured credit positions were hurt, however, as technical supply factors resulted in mark-to-market losses. Certain short-biased commercial real estate investments benefi ted from write-downs, while some residential mortgage-backed and asset-backed securities attracted robust bids. However, we saw performance detraction across our corporate high yield exposures in conjunction with declines in the broader high yield market.
Multi-Asset:July was an eventful month for our Multi-Asset strategies, all of which managed to end the month in positive territory and, thus, contributed meaningfully to July performance. Certain quantitatively-based Multi-Asset models performed well, especially into the end of the month as markets breathed a sigh of relief following the resumption of Greece’s bailout program and assurance that the country would stay in the Eurozone, at least in the short term. Multi-Asset strategies that had exposure to European equities also benefi ted from the Greek bailout and resulting market rally. In addition, a number of equity and credit-based special situations trades performed well on the month and contributed to performance. However, these gains were off set by some losses in credits across various emerging markets, particularly those that experienced losses due to weakness in energy.
Performance data quoted represents past performance and does not guarantee future results. The investment return and principal value of an investment will fl uctuate so that an investor’s shares, when redeemed, may be worth more or less than their original cost and current performance may be lower or higher than the performance data quoted. Information about BXMIX, including current month-end performance, is available on BXMIX’s website at www.blackstone.com/bamsf/ or by calling 855-890-7725.
For a summary of Fund performance of other share classes, please refer to the Fund’s website: http://www.blackstone.com/bxmix
Performance commentary
Industry Commentary:There have been a number of recent media articles that have been centered on the perceived liquidity of mutual funds that off er alternative investment mandates. Several of these articles made broad generalizations that many liquid alternative funds have material exposure to junk bonds, bank loans and esoteric investments, and that it may be diffi cult to raise cash should large redemptions occur in a period of market distress. Critics have said that, in a period of stress, a lack of liquidity for certain credit instruments could lead to material mark-to-market losses as was seen in 2008 and 2009, for example.
While there can be no assurances as to how the fund will perform in periods of market distress, our investment process incorporates analysis of and stress tests against both historical scenarios such as the fi nancial crisis of 2008 as well as forward-looking scenarios. We contemplate portfolio construction and strategy allocations with these scenarios in mind and endeavor to avoid any mismatch between the terms of a fund and the liquidity of all underlying portfolio holdings. For the Fund, we monitor liquidity levels on a daily basis and conduct regular stress tests and scenario analyses to assess whether the portfolio is well-positioned to handle a liquidity crisis. Additionally, the Fund’s multi-strategy approach and multi-manager construction provide a diverse range of strategies and sub-advisers.
Performance data quoted represents past performance and does not guarantee future results. The investment return and principal value of an investment will fl uctuate so that an investor’s shares, when redeemed, may be worth more or less than their original cost and current performance may be lower or higher than the performance data quoted. Information about BXMIX, including current month-end performance, is available on BXMIX’s website at www.blackstone.com/bamsf/ or by calling 855-890-7725.
For a summary of Fund performance of other share classes, please refer to the Fund’s website: http://www.blackstone.com/bxmix
Disclosure information
All investors should consider the investment objectives, risks, charges and expenses of BXMIX carefully before investing. The prospectus and, if available, the summary prospectus contain this and other information about BXMIX and are available on BXMIX’s website at www.blackstone.com/bxmix. All investors are urged to carefully read the prospectus and, if available, the summary prospectus in its entirety before investing. Additional information regarding BXMIX is available upon request.Important Disclosures Regarding ExposureExposure data presented herein does not consider the impact of delta on option positions (unless noted otherwise). Instead, exposures represent the market value of each underlying instrument. Positions of unknown type (if any) are excluded from exposure data. There is no attempt in this report to diff erentiate between or adjust for shorter versus longer duration rates trades. Instead, they are shown only by market value of exposure. Given that exposure data is based on fund holdings, it excludes unsettled trades. Position level data is obtained from State Street Bank and Trust Company, the administrator for BXMIX. Blackstone does not guarantee the accuracy of such data.Glossary of Terms:Gross Exposure: Refl ects the aggregate of long and short investment positions in relation to the net asset value. For example, if BXMIX has 60% long exposure and 50% short exposure to a particular asset class, then BXMIX has 110% gross exposure to that asset class. The gross exposure is one indication of the level of leverage in a portfolio. Net Exposure: This is the diff erence between long and short investment positions in relation to the net asset value. For example, if BXMIX has 60% long exposure and 50% short exposure to a particular asset class, then BXMIX is 10% net exposure to that asset class. Long: A long position occurs when an individual owns securities. Short: Short selling a security not actually owned at the time of sale. Short positions can also generate returns when the price of a security declines. VaR: A statistical technique used to measure and quantify the level of fi nancial risk within a fi rm or investment portfolio over a specifi c time frame. Value at risk is used by risk managers in order to measure and control the level of risk which the fi rm undertakes. The risk manager’s job is to ensure that risks are not taken beyond the level at which the fi rm can absorb the losses of a probable worst outcome. DV01: A bond valuation calculation showing the dollar value of a one basis point change in interest rates or yield. Alpha: A risk-adjusted performance measure that represents the average return on a portfolio over and above that predicted by the capital asset pricing model (CAPM), given the portfolio’s beta and the average market return.Glossary of IndicesMarket indices obtained through Bloomberg. Indices are unmanaged and investors cannot invest in an index. The volatility of the indices presented may be materially diff erent from that of the performance of BXMIX. In addition, the indices employ diff erent investment guidelines and criteria than BXMIX; as a result, the holdings in BXMIX may diff er signifi cantly from the securities that comprise the indices. The performance of the indices has not been selected to represent an appropriate benchmark to compare to the performance of BXMIX, but rather is disclosed to allow for comparison of BXMIX’s performance to that of well-known and widely recognized indices. In the case of equity indices, performance of the indices refl ects the reinvestment of dividends.S&P 500 Total Return Index: market capitalization-weighted index that includes 500 stocks representing all major industries. Returns are denominated in U.S. dollars and include dividends. The index is a proxy of the performance of the broad U.S. economy through changes in aggregate market value. MSCI World Index: A market capitalization weighted index designed to provide a broad measure of equity-market performance throughout the world. The MSCI World is maintained by Morgan Stanley Capital International, and is comprised of stocks from all the developed markets in the world. Barclays Aggregate Bond Index: covers the USD-denominated, investment-grade, fi xed-rate, taxable bond market of SEC-registered securities. The index includes government securities, mortgage-backed securities, asset-backed securities and corporate securities all with a maturity of greater than one year.
Important RisksAn investment in BXMIX should be considered a speculative investment that entails substantial risks; you may lose part or all of your investment or your investment may not perform as well as other investments. BXMIX’s investments involve special risks including, but not limited to, loss of all or a signifi cant portion of the investment due to leveraging, short-selling, or other speculative practices, lack of liquidity and volatility of returns. The
following is a summary description of certain additional principal risks of investing in BXMIX:Allocation Risk – Blackstone’s judgment about the attractiveness, value or market trends aff ecting a particular asset class, investment style, subadviser or security may be incorrect and this may have a negative impact upon performance. Derivatives Risk – the use of derivatives involves the risk that their value may not move as expected relative to the value of the relevant underlying assets, rates, or indices. Derivatives can be subject to counterparty credit risk and may entail investment exposure greater than their notional amount. Distressed Securities Risk – investments in securities of business enterprises involved in workouts, liquidations, reorganizations, bankruptcies and similar situations involve a high degree of risk of loss since there is typically substantial uncertainty concerning the outcome of such situations. Event-Driven Trading Risk – involves the risk that the specifi c event identifi ed may not occur as anticipated and that this may have a negative impact upon the market price of the securities involved. Foreign Investments/ Emerging Markets Risk – involves special risks caused by foreign political, social and economic factors, including exposure to currency fl uctuations, less liquidity, less developed and less effi cient trading markets, political instability and less developed legal and auditing standards. High Portfolio Turnover Risk – active trading of securities can increase transaction costs (thus lowering performance) and taxable distributions. Model and Technology Risk – involves the risk that model-based strategies, data gathering systems, order execution and trade allocation systems and risk management systems may not be successful on an ongoing basis or could contains errors, omissions, imperfections or malfunctions. Multi-Manager Risk – managers may make investment decisions which confl ict with each other and as a result, the Fund could incur transaction costs without accomplishing any net investment result.Prepared by Blackstone Advisory Partners L.P., a member of FINRA and an affi liate of Blackstone Alternative Investment Advisors LLC, the investment adviser of BXMIX.