black’s nook in-pond restoration project
TRANSCRIPT

Black’s Nook In-Pond Restoration Project
Fresh Pond Advisory Board22 October 2020

AGENDA
1. Project Team
2. Black’s Nook Pond –Restoration Goals
3. Data Collection and Key Findings
4. Next Steps

OUR TEAMWATER QUALITY EXPERT – Ken Wagner, Ph.D., Limnologist, Certified Pond Manager
WILDLIFE SCIENTISTS – Ben Griffith and others, NORMANDEAU ASSOCIATES
WETLAND & RESTORATION ECOLOGISTS, GREEN INFRASTRUCTURE, LANDSCAPE ARCHITECTS, CERTIFIED ARBORIST – HATCH

STAKEHOLDER AND FPAB ENGAGEMENTFP Advisory Board:
‒ Presentations at Inventory, Analysis, and Assessment/ Alternatives phases
‒ Site visit(s)
‒ Goal-setting critical
‒ City Working Group: Recreation, Public Works/Conservation Commission, CWD
Stakeholders:
‒ Cambridge Plant and Garden Club
‒ Maynard Ecology Center (MEC)
‒ Fayerweather School teacher and student volunteers
‒ Friends of Fresh Pond
‒ Audubon birding group

BLACK’S NOOK
PROJECT AREA

‒ Inventory and Analysis
‒ Concept Designs
‒ Contract Documents
‒ Permitting
‒ Construction Oversight
‒ Vegetation Management Plan
‒ Phased Implementation
Original
Shoreline
PREVIOUS PROJECTS – PHASES 1 & 2

Black’s Nook as Unique Place:
‒ Passive recreation – birding, no dogs
‒ Permanent fence
‒ Diverse habitats
‒ Outdoor classroom
‒ Historical relevance
‒ FP Golf Course abutter
SIGNIFICANCE AT FRESH POND

ASSESSMENT APPROACHPreliminary Goal Setting:
1. Fresh Pond Reservation Master Plan Vision
• Preserve water quality, natural green spaces, wildlife habitat and refuge from hectic urban life
2. Black’s Nook Pond – Water Quality Goals
• Slow cultural eutrophication;
• Keep Black’s Nook an open water body;
• Address Category 5 impaired water body status on the State’s 303(d) list; and
• Meet Class B Water Quality standards.

Initial Characterization:
1. Understanding the source of nutrients very important to limiting their continued effect on pond eutrophication.
2. Value of aquatic plants & benthic community to existing fish and vertebrate community.
3. Understanding oxygen cycle critical.
4. Define Black’s Nook within existing watershed and habitats – bigger picture.
ASSESSMENT APPROACH

Slow Cultural Eutrophication:
1. Determine the source(s) and magnitude of nutrient loading.
2. Engage FPGC as long-term partner and steward.
3. Improve water quality within Black’s Nook Pond.
ASSESSMENT APPROACH

Riparian Buffer:
‒ FP Golf Course runoff.
‒ Mowing of pond buffer plantings.
‒ Changing maintenance crews.
‒ Geese.
Shrub Scrub Wetland Buffer Planting
2019
2019 2010
2012
ASSESSMENT APPROACH

Retains Open Water Body:
1. What new data are critical for assessment?
2. Dredging analysis for different scenarios
3. Alternatives for maintaining open water (e.g. benthic barriers)
4. Habitat goals, in-pond and birds
ASSESSMENT APPROACH

DATA COLLECTION AND ASSESSMENT
Components (Physical, Chemical and Biological):
1. Pond Bathymetry and Sediments
2. Watershed and Groundwater Inputs
3. Water Quality and Aquatic Vegetation
4. Phytoplankton and Zooplankton
5. Benthic Community
6. Fish
7. Herptiles (Reptiles and Amphibians)
8. Birds and Bats

OVERVIEW OF APPROACH
Field Survey and Metrics:
1. Review all existing information – reports, studies and observances.
2. Use standard industry protocols for collecting, monitoring, surveying and recording data.
3. Influence In-Pond Restoration Alternatives based on established goals and metrics.
Engelmann's Umbrella Sedge

POND BATHYMETRY AND SEDIMENT CHARACTERIZATIONField Survey and Metrics:
1. Bathymetric Survey –
‒ Small boat, electronic instrumentation, hand probes, underwater camera, GPS unit
2. Sediment Characterization -
‒ Sediment probes to evaluate depth and nature of sediment
‒ Core samples (3) for sediment quality and for dredging feasibility assessment (0-1’, 1’-2’, and 2’-3’ depths)

POND BATHYMETRY
Whitman & Howard 1986 Year 2020

SEDIMENT CHARACTERIZATION
Field Survey and Metrics:
1. Bathymetric Survey.
2. Sediment Characterization.
Soft Sediment Section A-A’

SEDIMENT CHARACTERIZATION
Field Survey and Metrics:
1. Sediment probes used to evaluate depth and nature of sediment.
2. Core samples (3) for sediment quality and for dredging feasibility assessment (0-12”; 12”-24”; and 24”-36” depths).
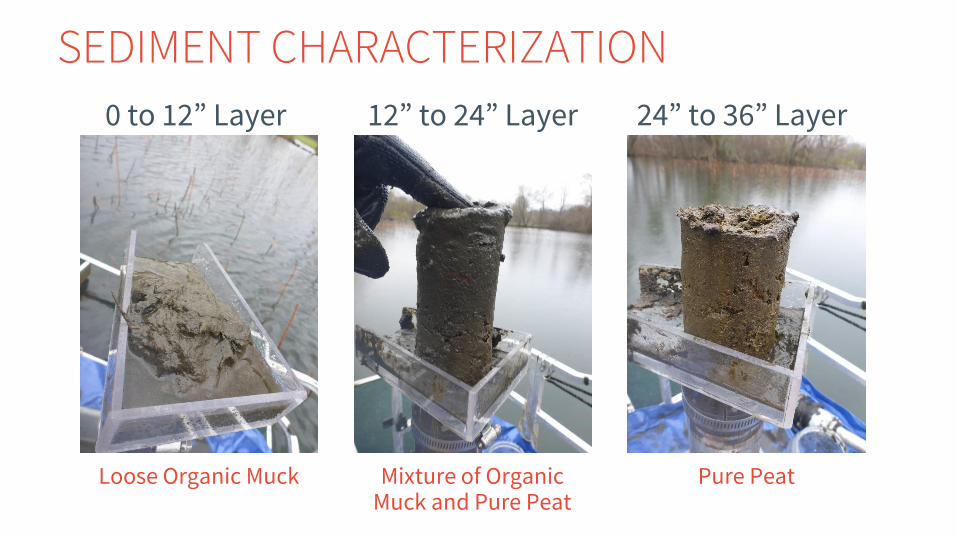
SEDIMENT CHARACTERIZATION
0 to 12” Layer 12” to 24” Layer 24” to 36” Layer
Loose Organic Muck Pure PeatMixture of Organic Muck and Pure Peat

SEDIMENT CHARACTERIZATIONKey Findings:
1. Marked change in physical features with sediment depth.
2. Nearly all contaminants below standard or below detection limits.
3. Lead (Pb) in upper foot of 2 Stations exceeds most stringent standards.
4. Available phosphorus (P) is substantial, even in upper 2’ of sediment (high organic content).

WATERSHED & GROUNDWATER INPUTS
Field Survey and Metrics:
1. Confirm watershed boundaries.
2. Estimate runoff inputs and nutrient loading from watershed.
3. Locate existing groundwater wells and monitor levels relative to Black’s Nook.
4. Estimate groundwater inflow and potential nutrient loading from contribution area.

WATERSHED & GROUNDWATER INPUTSKey Findings:
1. Pond fluctuates 1’ above and below normal water level (0).
2. Groundwater level less than normal pond elevation.
3. Existing peat layer restricts lateral groundwater flow.
4. Pond hydrology mainly impacted by precipitation (limited surface runoff; little groundwater input; and rare Stream A inflow).
-7
-6
-5
-4
-3
-2
-1
0
1
2
0 100 200 300 400 500 600 700 800
Dep
th r
elat
ive
to n
orm
al w
ater
leve
l (ft
)
Distance across Black's Nook, S to N (ft)
Water level
Range of groundwater level
Range of lake level

WATER QUALITYField Survey and Metrics:
1. Temperature, dissolved oxygen, pH, conductivity, turbidity, & chlorophyll-a.
2. Total and dissolved phosphorus, Nitrate-N, Ammonium-N, TKN.
3. Surface and bottom samplings with field instruments and boat.
4. Stormwater sampling - Streams A and B (FPGC).
5. Samplings conducted October 2019, March and July 2020.

WATER QUALITYKey Findings:
1. WQ data fairly consistent with 20-year historical CWD data.
2. Low dissolved oxygen (bottom) and high pH (surface) caused by excessive plant growth.
3. Large temperature gradient caused by high plant density restricting mixing and sunlight penetration.
4. Most water quality features are within normal ranges for ponds in acceptable condition.

WATER QUALITY (contd.)Key Findings:
5. Secchi transparency not measured due to density of aquatic plants.
6. High Ammonium levels cause potential for toxicity during summer months (elevated temperatures and pH).
7. Nitrate concentrations are low; Total Kjeldahl N levels are moderate.
8. Total Phosphorus levels elevated; very high at bottom; indicates internal loading from pond sediments.

AQUATIC VEGETATION Field Survey and Metrics:
1. Floating, Emergent, and Submerged Aquatic Vegetation surveyed.
2. Rowboat, rake, right angle prism, GPS, and transects utilized.
3. Observations during two growing seasons in 2019 and 2020.
4. 2/3 pond area is floating and emergent vegetation.
5. 1/3 pond area is native coontail (dense submergent growth).

AQUATIC VEGETATION Key Findings:
1. Aquatic plants not diverse but excessively abundant, filling entire water column.
2. Plant density is higher than desirable.
3. Dominant species include: water smartweed, coontail, and Indian lotus.
4. Indian lotus spread quickly in 2020; estimate 80-90% coverage in < 10 years.
5. Submergent species are gradually being eliminated due to floating leaves.
6. Indian lotus and water chestnut are only non-native species.

AQUATIC VEGETATION - SUBMERGED
Dominant:
1. Coontail (Ceratophyllumdemersum) – native; dense growth over 0.75 acres; up to 6’ water depth.
Rare:
1. Brazilian Waterweed (Egeria densa) – non-native.

AQUATIC VEGETATION - FLOATING
Dominant:
1. Indian Lotus (Nelumbo nucifera) – non-native; dense growth over 1.25 acres; up to 5’ depth.
Rare:
1. Duckweed (Lemna minor) –native; scattered growth.
2. Water Chestnut (Trapa natans) –non-native; invasive; scattered growth; active removal.
3. Blue Green Algae – native.

AQUATIC VEGETATION - EMERGENT
Dominant:
1. Water Smartweed (Persicaria amphibia) – native; surface growth over 0.75 acres; 0-5’ water depths.
Subdominant (near platform and shoreline):
1. Pickerelweed (Pontederia cordata)
2. White Water Lily (Nymphaea odorata) –native; scattered surface growth
3. Yellow Water Lily (Nuphar advena) –non-native; scattered surface growth

PHYTOPLANKTON & ZOOPLANKTON
Field Survey and Metrics:
1. Qualitative and Quantitative Sampling.
2. Collected Algae and characterize Algae community in relation to desired uses.
3. Collected surface Phytoplankton and provide a count by taxon (at time of water quality sampling).
4. Collected Zooplankton (for entire water column) and provide a count by taxon.
5. Sampled October 2019, March and July 2020.

PHYTOPLANKTON Key Findings:
1. Algal biomass is not excessive, despite high Chlorophyll A readings.
2. Green and gold algae most abundant groups.
3. Cyanobacteria present in 2019/2020 but not dominant due to rooted plants.
4. Nutrient levels will support algal blooms if rooted plants are managed.
0
1000
2000
3000
4000
5000
6000
10/3
/201
9
3/12
/202
0
7/9/
2020
Algal Biomass
PYRRHOPHYTA
EUGLENOPHYTA
CYANOPHYTA
CRYPTOPHYTA
CHRYSOPHYTA
CHLOROPHYTA
BACILLARIOPHYTA
Bio
mas
s(u
g/L)
Date
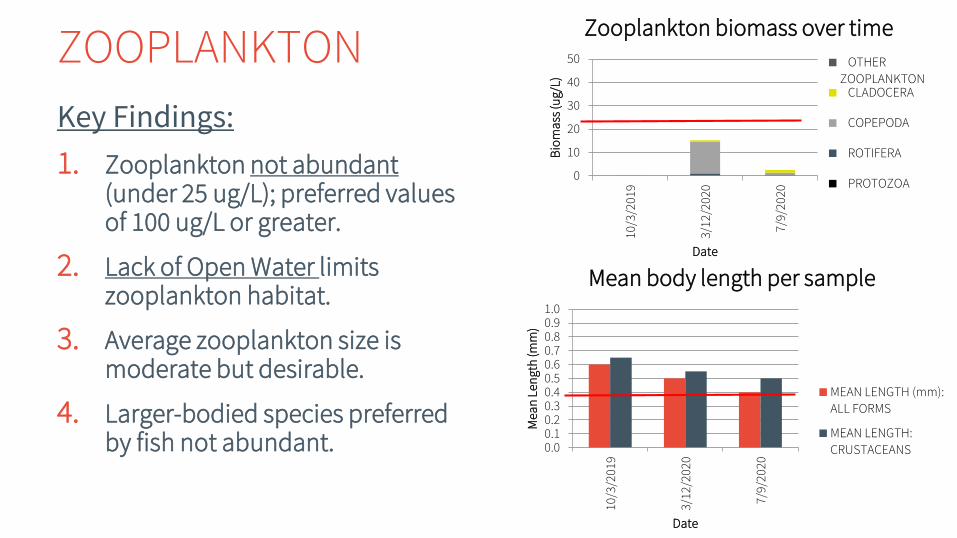
ZOOPLANKTON
Key Findings:
1. Zooplankton not abundant(under 25 ug/L); preferred values of 100 ug/L or greater.
2. Lack of Open Water limits zooplankton habitat.
3. Average zooplankton size is moderate but desirable.
4. Larger-bodied species preferred by fish not abundant.
0
10
20
30
40
50
10/3
/201
9
3/12
/202
0
7/9/
2020
Bio
ma
ss (u
g/L)
Date
Zooplankton biomass over time
OTHER
ZOOPLANKTON CLADOCERA
COPEPODA
ROTIFERA
PROTOZOA
0.00.10.20.30.40.50.60.70.80.91.0
10/3
/201
9
3/12
/202
0
7/9/
2020
Mea
n L
engt
h (m
m)
Date
Mean body length per sample
MEAN LENGTH (mm):
ALL FORMS
MEAN LENGTH:
CRUSTACEANS

BENTHIC COMMUNITY
Field Survey and Metrics:
1. Benthos (Aquatic Macroinvertebrate) Collecting.
2. Also identify water depth, temperature, Secchi disk reading (clarity).
3. Rowboat, grab sampler (mini hand dredge), kick net, GPS unit.
4. Lab sampling, photographs, collection.
5. Species list, richness, population density, diversity, relative abundance, & community composition.

BENTHIC COMMUNITYKey Findings:
1. Kick Net Sampling:
‒ 51 Species
‒ Diversity Index 2.39 (Moderate)
2. Ponar Sampling:
‒ 30 Species
‒ Diversity Index 2.57 (High)
3. Most species tolerant of low water quality.
Most Abundant Species - Kick Net Sampling
Taxon Common Name ToleranceChironomus sp. midge 10Dero sp. naiad worm 10Dero nivea naiad worm 10Dicrotendipes sp. midge 8Paranytarsus sp. midge 6
Most Abundant Species – Ponar Sampling
Taxon Common Name ToleranceDero nivea naiad worm HighCaenis sp. mayfly HighCorynoneura sp midge ModerateEnallagma sp. damselfly High

FISH SURVEYField Survey and Metrics:
1. Shallow pond observance/net capture.
2. Electro-capture (deeper) – temporarily immobilizes for study in live well before releasing.
3. Richness, diversity, and relative abundance.
4. Community composition.
5. Incidence of disease or parasitism.
6. Size class (reproduction indicator).
7. Water quality relevance.

FISH SURVEYKey Findings:
1. Four species detected.
2. Tolerant of Degraded Habitat.
3. Primarily young fish – low survivorship/high reproduction.
Species Native Distribution (in relation to Northeast)
Occurrence in Northeast (common to rare)
Water Class (General Habitat preference)
Water temperature preference
Trophic Class Tolerance to degraded habitat
Spottail Shiner Native/Introduced1 common Rivers to Lakes warmwater Water Column Intermediate
Golden Shiner Native common Streams to Lakes warmwater Generalist Feeder Tolerant
Goldfish introduced common Rivers to Lakes warmwater Generalist Feeder Tolerant
Pumpkinseed Native common Streams to Lakes warmwater Generalist Feeder Intermediate

HERPTILE SURVEY Field Survey and Metrics:
1. Breeding and Basking Study for Reptiles & Amphibians .
2. Breeding frogs and toads – recorded calls and surveys.
3. Turtles, snakes, salamanders, and newts - disturbing cover observations and surveys.
4. Includes North Pond, Little Fresh Pond, and north shore of Fresh Pond.
5. Late April - June 2020.

HERPTILE SURVEYKey Findings:
1. 3 Species Detected.
2. Only Bullfrog presently abundant.
3. Peepers may be the result of reintroduction effort.
Species Scientific Name Black’s Nook (N) Black’s Nook (S) Fresh Pond Little Fresh Pond
Bullfrog Lithobates catesbeianus Abundant Abundant 0 Abundant
Green Frog Lithobates clamitans Uncommon Uncommon 0 0
Spring Peeper Pseudacris crucifer Common 0 0 0

BREEDING BIRD SURVEYField Survey and Metrics:
1. Standardized census methods and Breeding Bird Atlas.
2. Post migration period - May 25th
3. Recorded calls, observed behavior, & survey (seen and heard).
4. List of breeding birds, diversity, habitat dependence.
5. Late May – June 30, 2020.

BREEDING BIRD SURVEYKey Findings:
1. 34 Species Detected.
2. 9 Species Confirmed Nesting, 7 Probable.
3. Aquatic insects and riparian vegetation important contributors of pond to bird community.
Diet:
Aquatic Insects
Diet:
Aquatic Vertebrate
s
Diet:
Aquatic Vegetation
Breeding Habitat
American Redstart Black-crowned
Night-Heron
Canada Goose Common Grackle
Cedar Waxwing Green Heron
Mallard Eastern Kingbird
Chimney Swift Great Blue Heron
Great Crested Flycatcher
Common Grackle Orchard Oriole
Eastern Kingbird Baltimore Oriole
Gray Catbird Red-winged Blackbird
Great Crested Flycatcher
Warbling Vireo
Red-winged Blackbird
Yellow Warbler
Tree Swallow
Pond Use by Bird Species at Black’s Nook

ACOUSTIC BAT SURVEYField Survey and Metrics:
1. Confirms presence of bats and identifies species present.
2. Automated high-frequency recording devices (USFWS and N.A. Bat Monitoring Program specifications).
3. Eight (8) consecutive nights.
4. Recorded calls, observed species, & weather data.
5. Mid May – June 30, 2020.

ACOUSTIC BAT SURVEYKey Findings:
1. 6 Species Detected (9 Total in MA).
2. Two Listed Species – both rare at the site.
3. Potentially significant bat foraging habitat.
Species Scientific Name Total Calls State Status Federal Status
Big Brown Bat Eptesicus fuscus 566 - -
Eastern Red Bat Lasiurus borealis 4 - -
Hoary Bat Lasiurus cinereus 483 - -
Silver-haired Bat Lasionycterus noctivagans 650 - -
Little Brown Bat Myotis lucifugus 3 Endangered -
Northern Long-eared Bat Myotis septentrionalis 10 Endangered Threatened
N. Long-eared Bat
Little Brown Bat

POND REHABILITATION STRATEGIES1. Increase oxygen levels, especially in
summer.
2. Stop spread of aquatic vegetation.
3. Maximize benefits through efficient removal of sediment.
4. Create emergent wetland vegetation habitat and maintain/enhance the riparian buffer.
5. Improve fish and herptile communities.
6. Promote Sustainable Management practices (low maintenance).
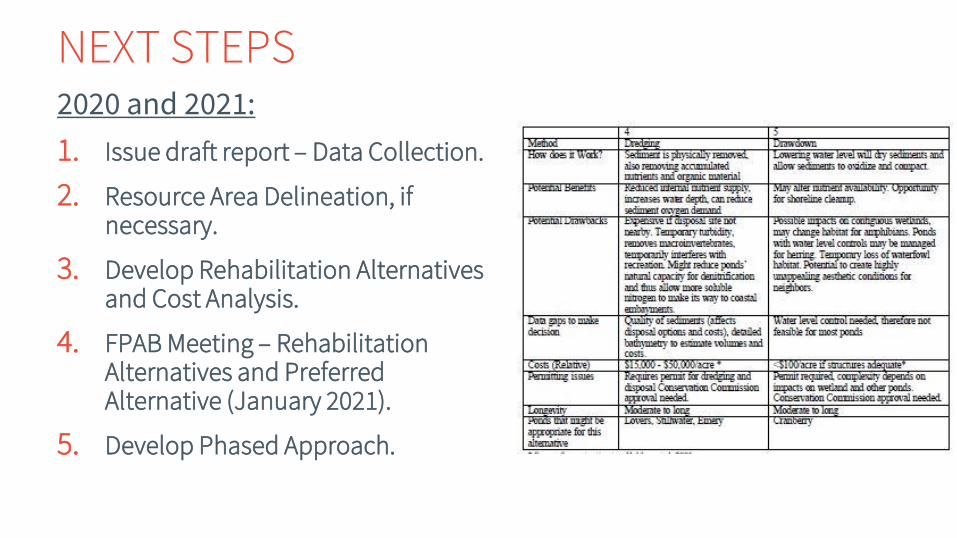
NEXT STEPS2020 and 2021:
1. Issue draft report – Data Collection.
2. Resource Area Delineation, if necessary.
3. Develop Rehabilitation Alternatives and Cost Analysis.
4. FPAB Meeting – Rehabilitation Alternatives and Preferred Alternative (January 2021).
5. Develop Phased Approach.
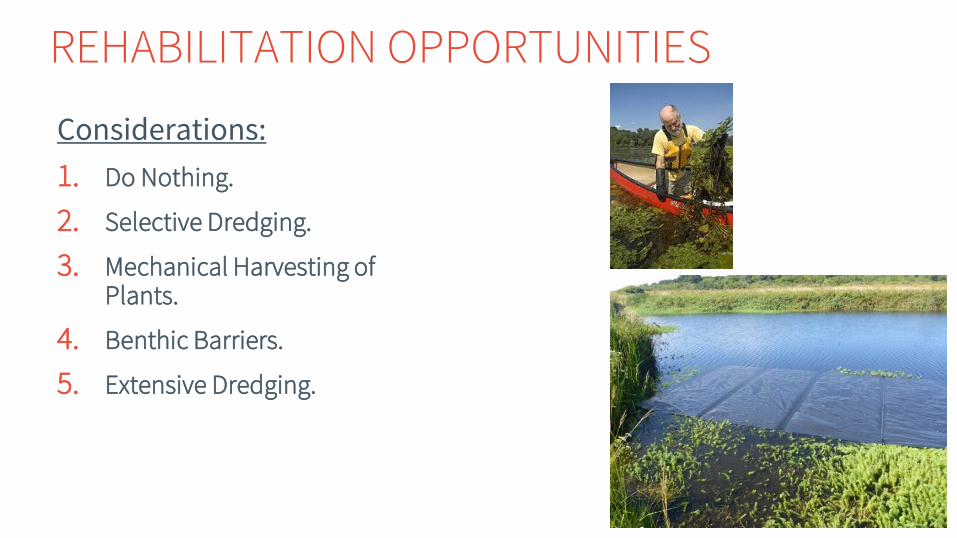
REHABILITATION OPPORTUNITIES
Considerations:
1. Do Nothing.
2. Selective Dredging.
3. Mechanical Harvesting of Plants.
4. Benthic Barriers.
5. Extensive Dredging.

QUESTIONS & INPUT

ASSESSMENT APPROACHModeling Approach (Standard):
‒ Define existing water quality and habitat conditions
‒ Identify pollutant(s) responsible for degraded water quality and/or habitat conditions
‒ Define targets that will support desired use
‒ Quantify acceptable loads
‒ Identify contributing point and nonpoint sources of pollution
‒ Quantify transport and attenuation
‒ Develop a strategy for source reductions targets