black carbon:global budget and impacts on climate
Post on 22-Dec-2015
214 views
TRANSCRIPT
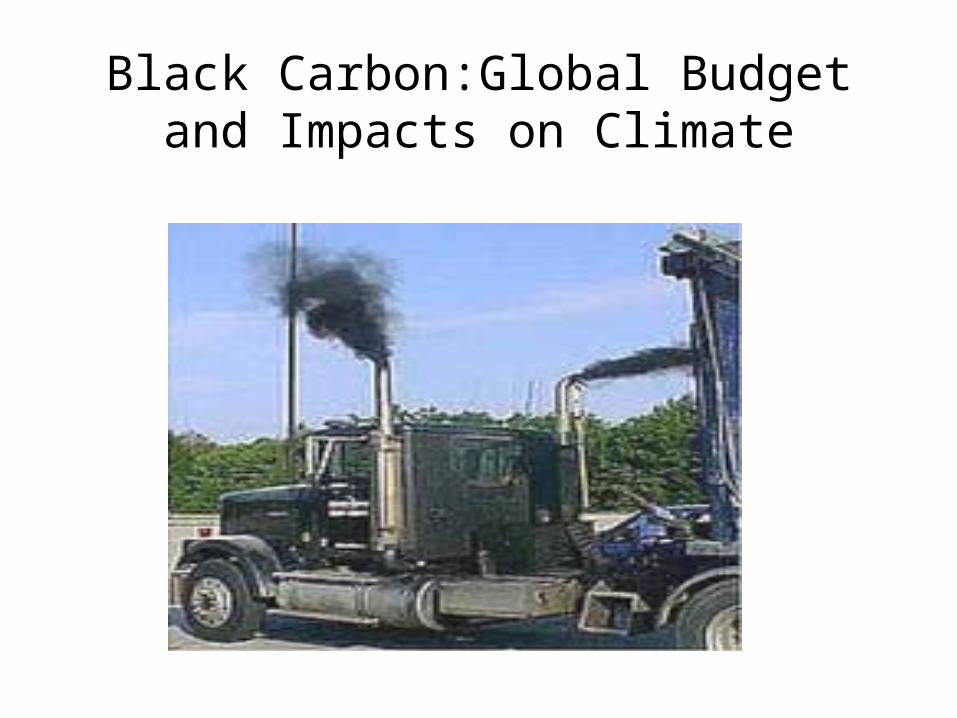
Black Carbon:Global Budget and Impacts on Climate
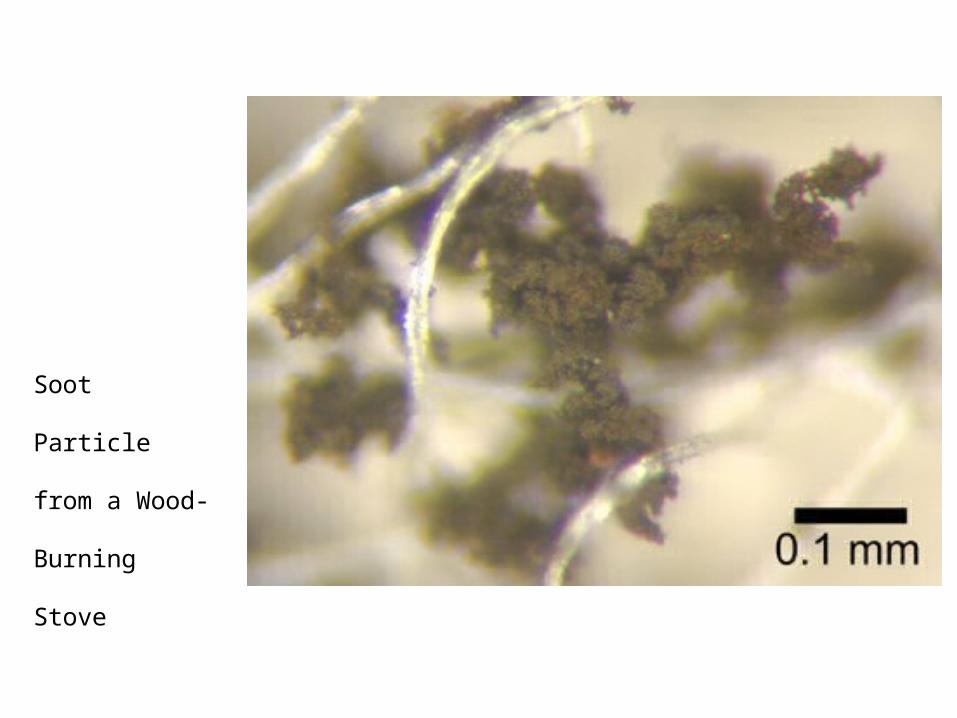
Soot Particle from
a Wood-Burning
Stove
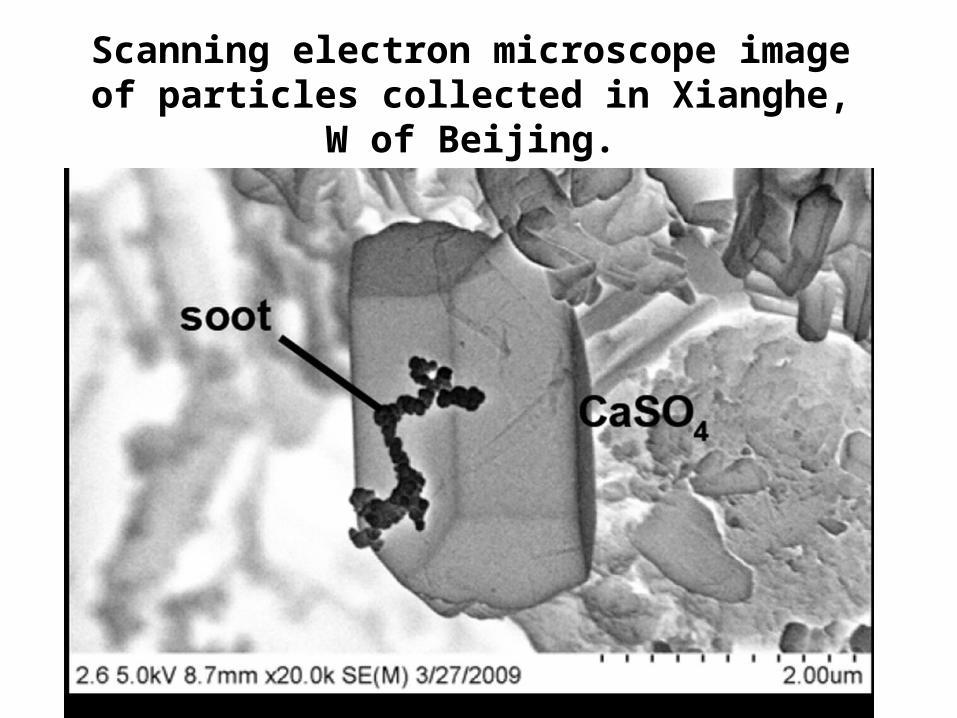
Scanning electron microscope image of particles collected in Xianghe, W of Beijing.

Structure of Soot
Outline
• Soot: What is it?
• Climate Impact
• Physics
• Prior budgets
• INDOEX
• Budget evaluation
• Conclusions
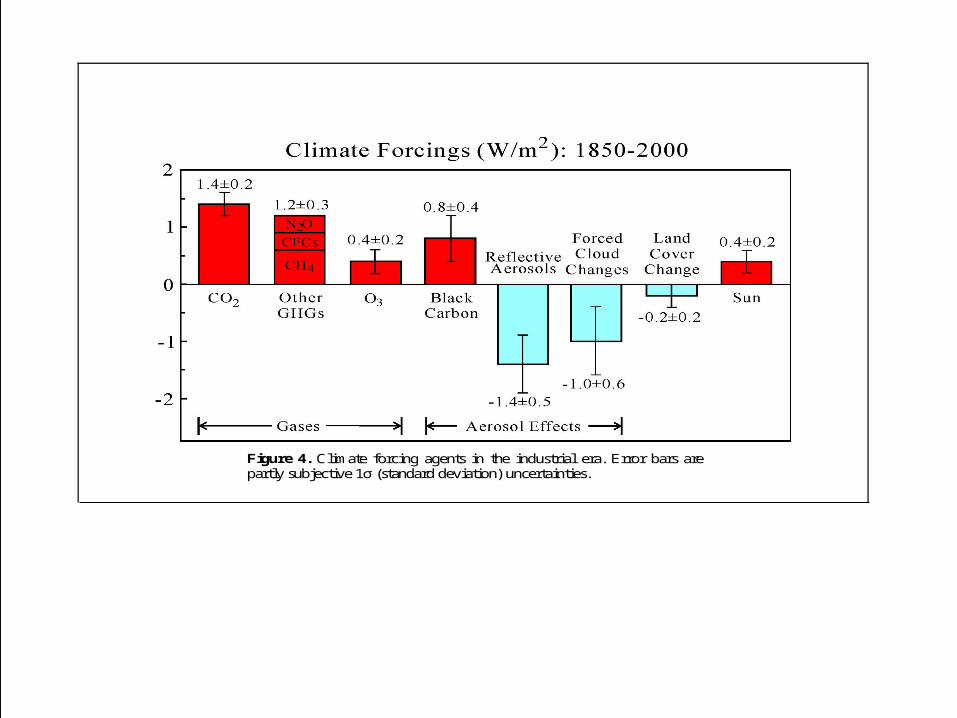
Figure 4. Climate forcing agents in the industrial era. Error bars are partly subjective 1σ (standard deviation) uncertainties.
Increases of well-mixed greenhouse gases (excludes O3) are known accurately from in situ observations and bubbles of air trapped in ice sheets. For example, the increase of CO2 from 285 parts per million (ppm) in 1850 to 368 ppm in 2000 is accurate to about 5 ppm. The conversion of this gas change to a climate forcing (1.4 W/m2), from calculation of the infrared opacity, adds about 10% to the uncertainty.
The CH4 increase since 1850, including its effect on stratospheric H2O and tropospheric O3, causes a climate forcing half as large as that by CO2. Principal anthropogenic sources of CH4 are landfills, coal mining, leaky natural gas lines, increasing ruminant population, rice cultivation, and anaerobic waste management lagoons. In the last decade the growth rate of CH4 has slowed, suggesting that the growth of sources is slowing.
Tropospheric O3 is increasing partly because CH4 is increasing, but the primary cause is other human-made emissions, especially carbon monoxide, nitrogen oxides, and volatile organic compounds. Air quality regulations in the U.S. and Europe reduced O3 precursor emissions in recent years, but not quite enough to balance increased emissions in the developing world.
Black carbon (“soot”), a product of incomplete combustion, can be seen in the exhaust of diesel-fueled trucks and buses. It is also produced by biofuels and outdoor biomass burning. Black carbon aerosols per se are not well measured, but their climate forcing is estimated from wide-spread multi-spectral measurements of total aerosol absorption. The estimated forcing includes the effect of soot in reducing the reflectance of snow and ice.
The reflective human-made aerosols are mainly sulfates, nitrates, organic carbon, and soil dust. Sources include fossil fuel burning and agricultural activities. Sources of the abundant sulfates are known reasonably well, but the 1σ uncertainty in the net forcing by reflective aerosols is at least 35%.
The indirect effects of aerosols on cloud properties are difficult to compute accurately, but recent satellite measurements of the correlation of aerosol and cloud properties are consistent with the estimated net forcing of –1 W/m2. The uncertainty is at least 50%.
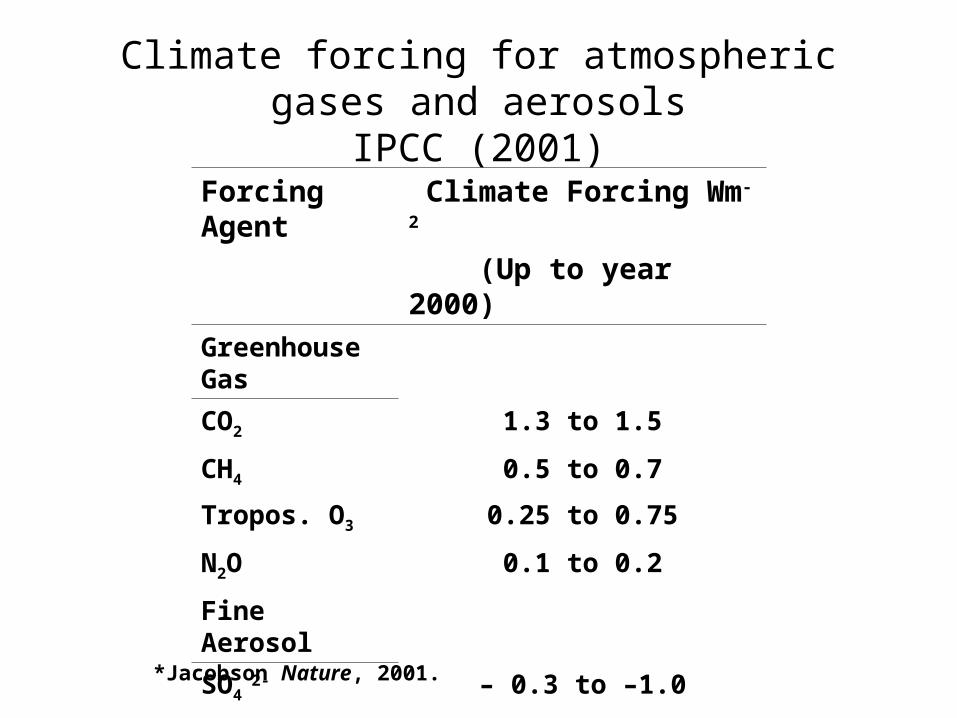
Climate forcing for atmospheric gases and aerosolsIPCC (2001)
Forcing Agent Climate Forcing Wm-2
(Up to year 2000)
Greenhouse Gas
CO2 1.3 to 1.5
CH4 0.5 to 0.7
Tropos. O3 0.25 to 0.75
N2O 0.1 to 0.2
Fine Aerosol
SO4 2- – 0.3 to –1.0
Black Carbon 0.1 to 0.8*
*Jacobson Nature, 2001.
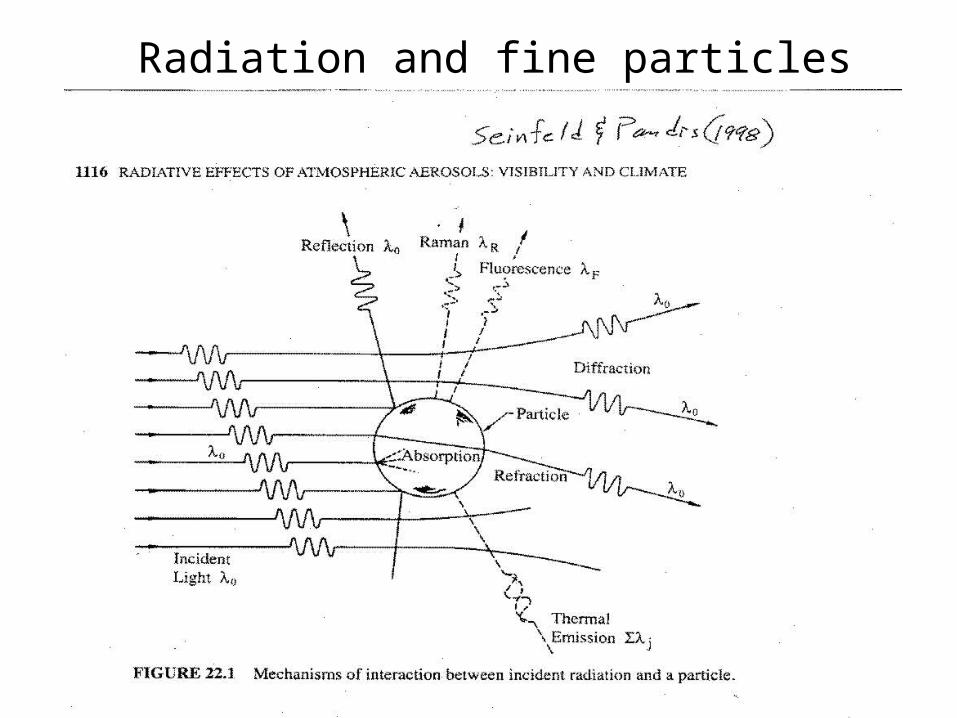
Radiation and fine particles
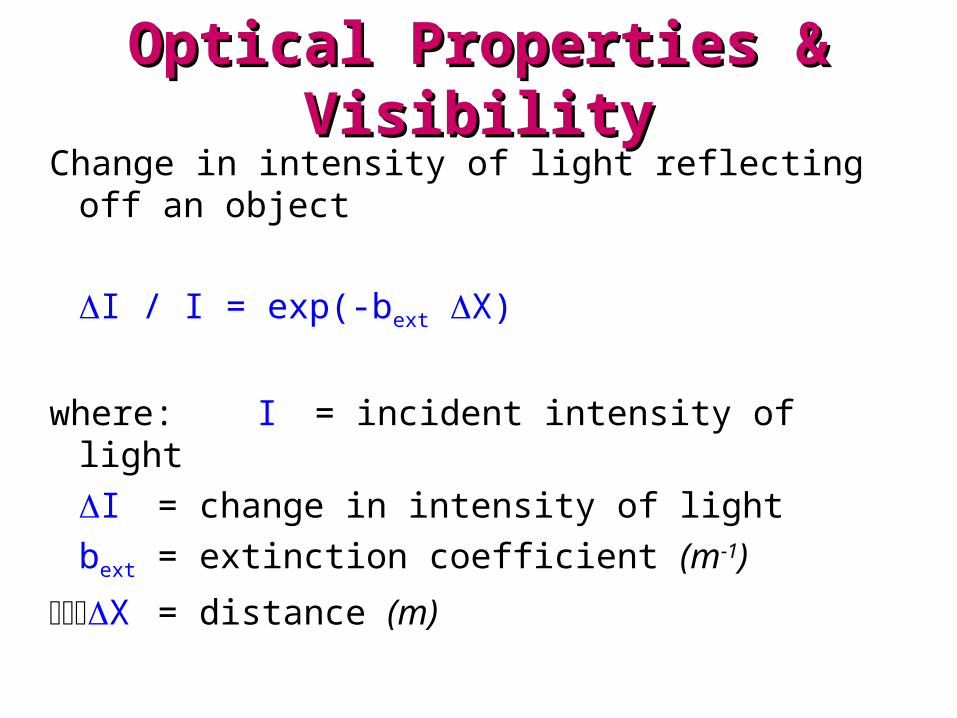
Optical Properties & VisibilityOptical Properties & Visibility
Change in intensity of light reflecting off an object
I / I = exp(‑bext X)
where: I = incident intensity of light
I = change in intensity of light
bext = extinction coefficient (m‑1)
X = distance (m)
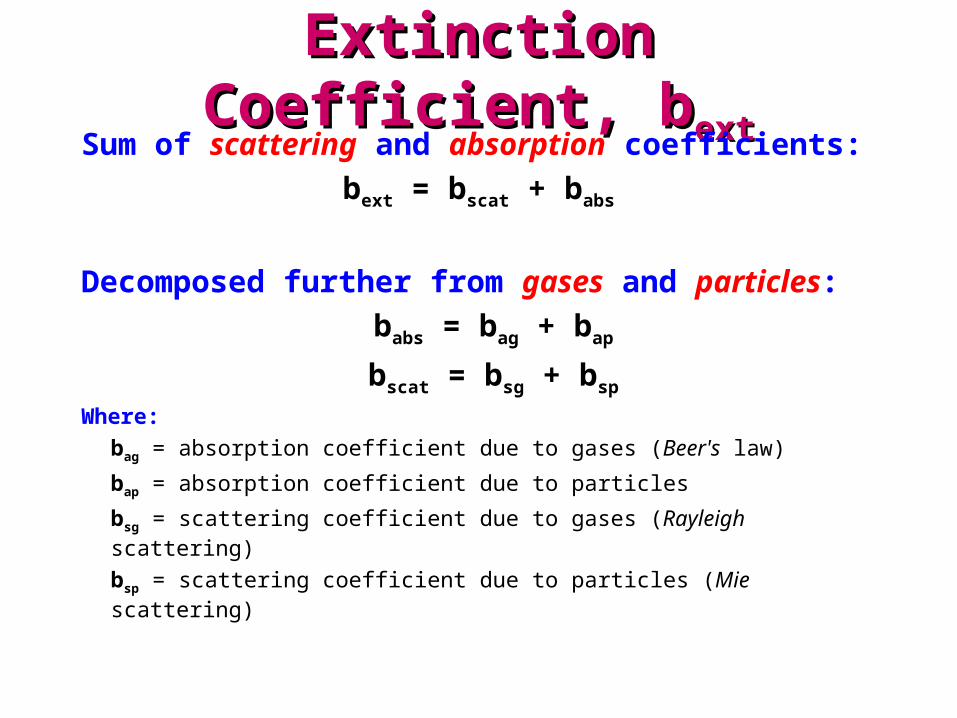
Extinction Coefficient, bExtinction Coefficient, bextext
Sum of scattering and absorption coefficients:
bext = bscat + babs
Decomposed further from gases and particles:
babs = bag + bap
bscat = bsg + bsp
Where:
bag = absorption coefficient due to gases (Beer's law)
bap = absorption coefficient due to particles
bsg = scattering coefficient due to gases (Rayleigh scattering)
bsp = scattering coefficient due to particles (Mie scattering)
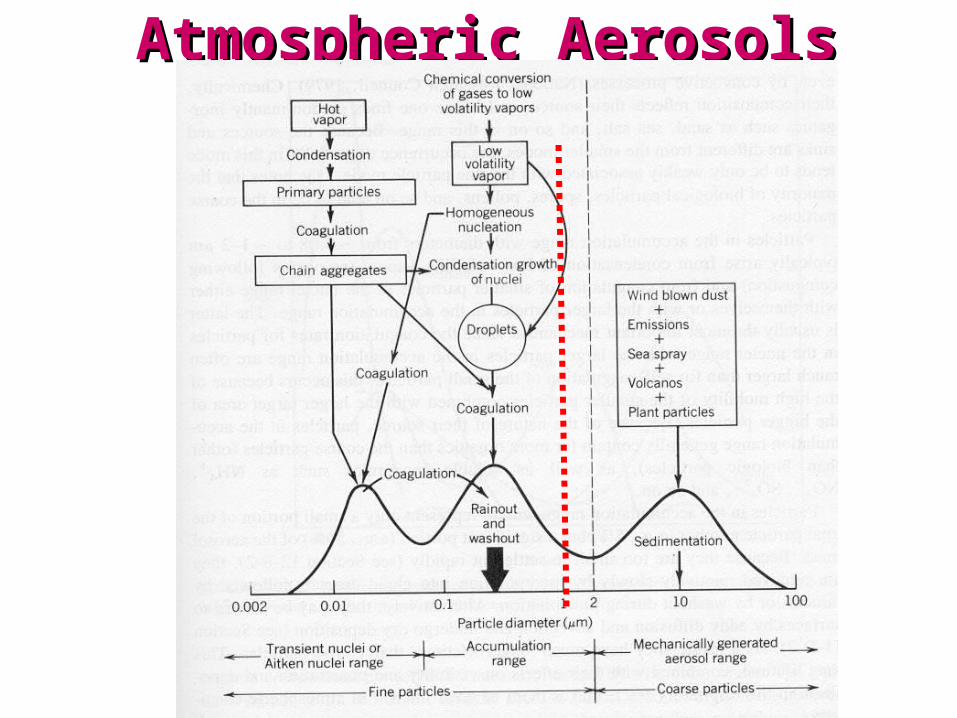
Atmospheric AerosolsAtmospheric Aerosols
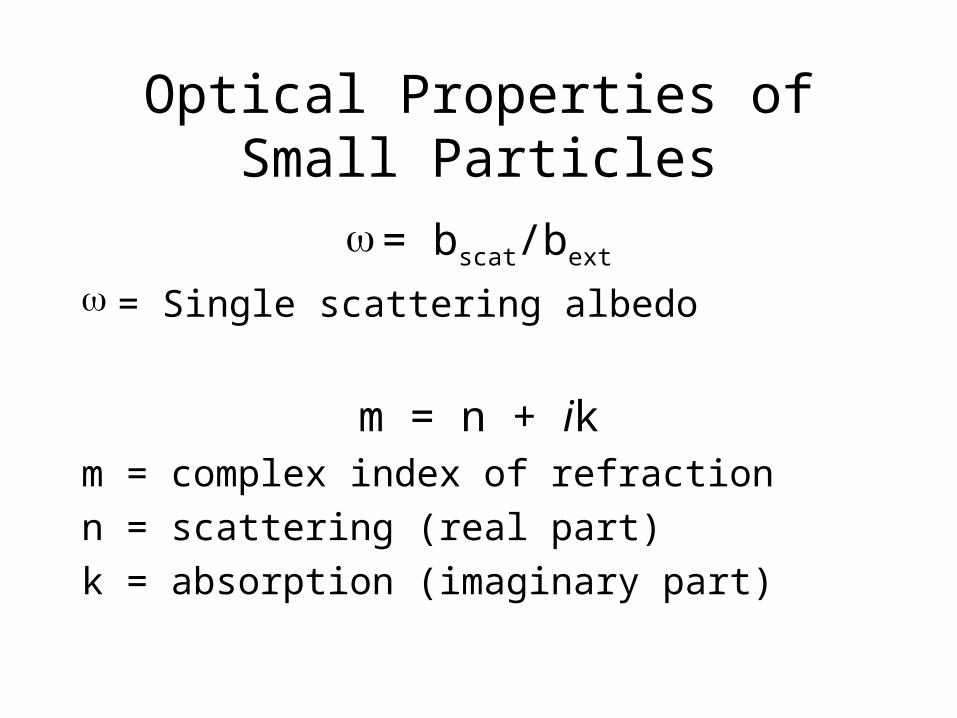
Optical Properties of Small Particles
= bscat/bext
= Single scattering albedo
m = n + ikm = complex index of refraction
n = scattering (real part)
k = absorption (imaginary part)
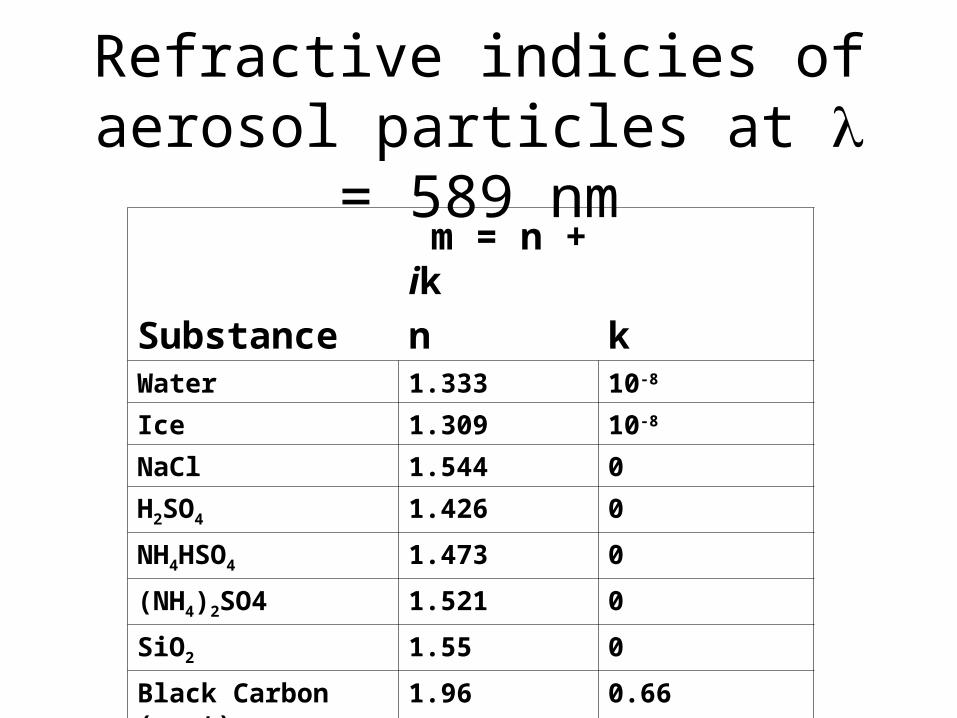
Refractive indicies of aerosol particles at = 589 nm
m = n + ik
Substance n kWater 1.333 10-8
Ice 1.309 10-8
NaCl 1.544 0
H2SO4 1.426 0
NH4HSO4 1.473 0
(NH4)2SO4 1.521 0
SiO2 1.55 0
Black Carbon (soot) 1.96 0.66
Mineral dust ~1.53 ~0.006
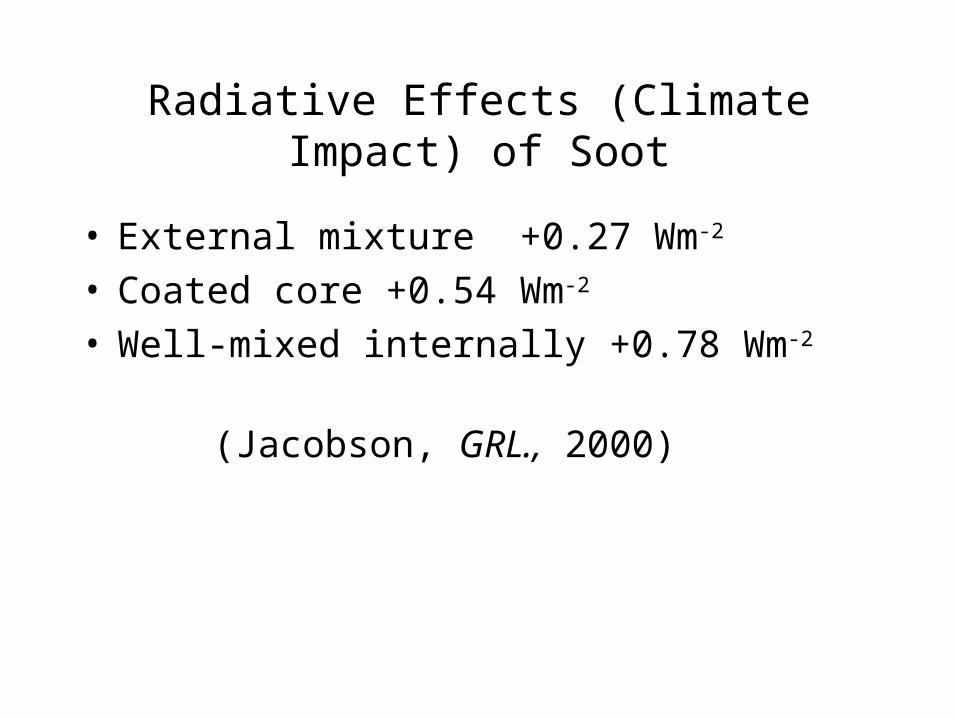
Radiative Effects (Climate Impact) of Soot
• External mixture +0.27 Wm-2
• Coated core +0.54 Wm-2
• Well-mixed internally +0.78 Wm-2
(Jacobson, GRL., 2000)
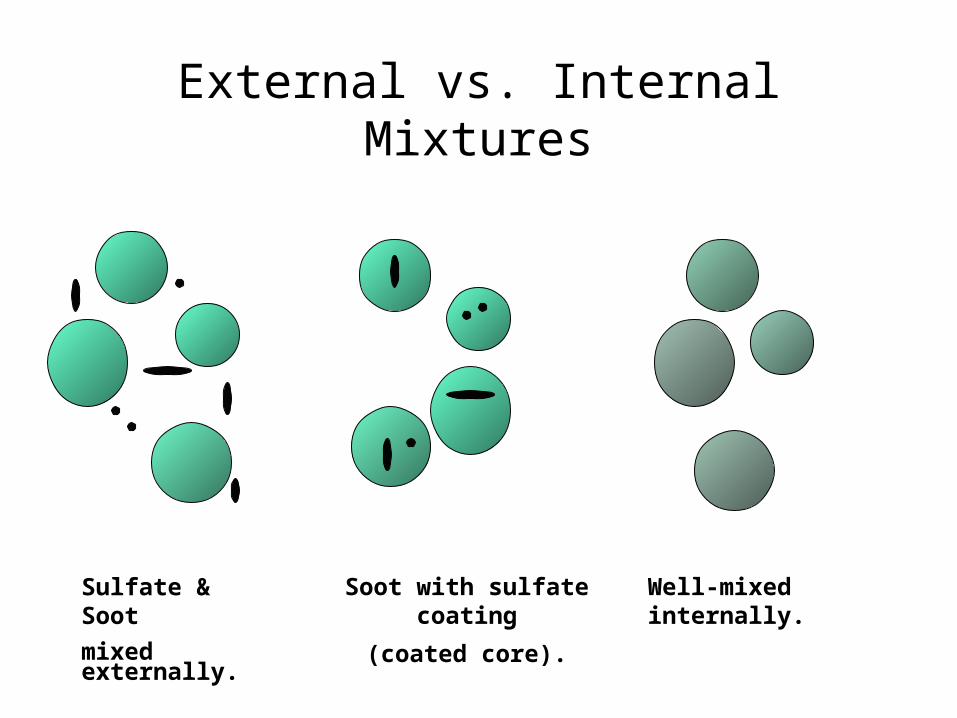
External vs. Internal Mixtures
Sulfate & Soot
mixed externally.
Soot with sulfate coating
(coated core).
Well-mixed internally.
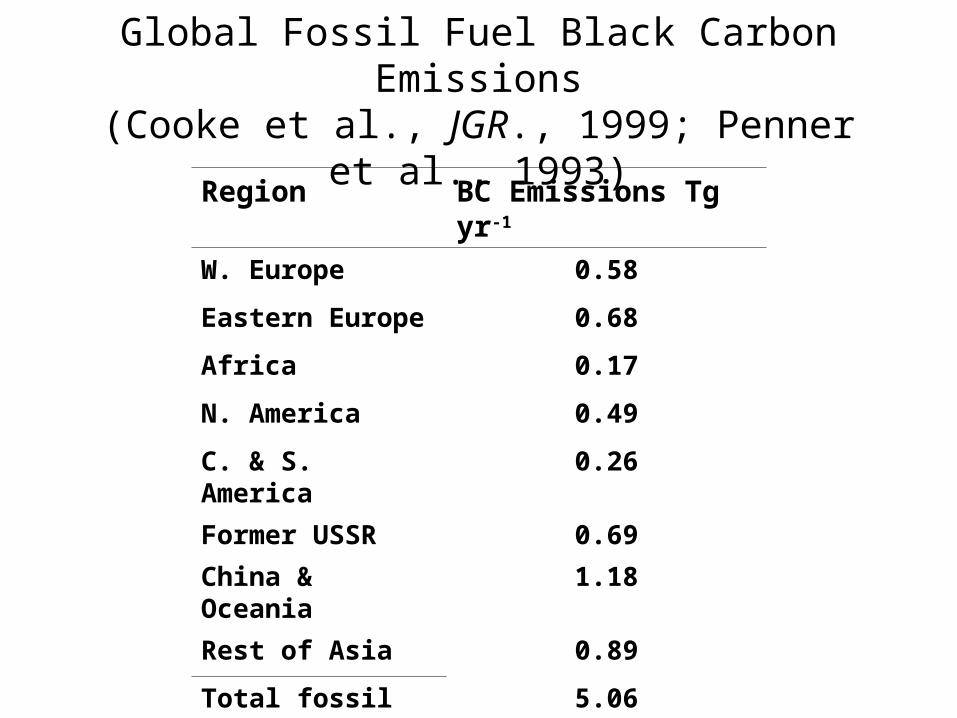
Global Fossil Fuel Black Carbon Emissions(Cooke et al., JGR., 1999; Penner et al., 1993)
Region BC Emissions Tg yr-1
W. Europe 0.58
Eastern Europe 0.68
Africa 0.17
N. America 0.49
C. & S. America 0.26
Former USSR 0.69
China & Oceania 1.18
Rest of Asia 0.89
Total fossil fuel 5.06
Biomass Burning 5.97
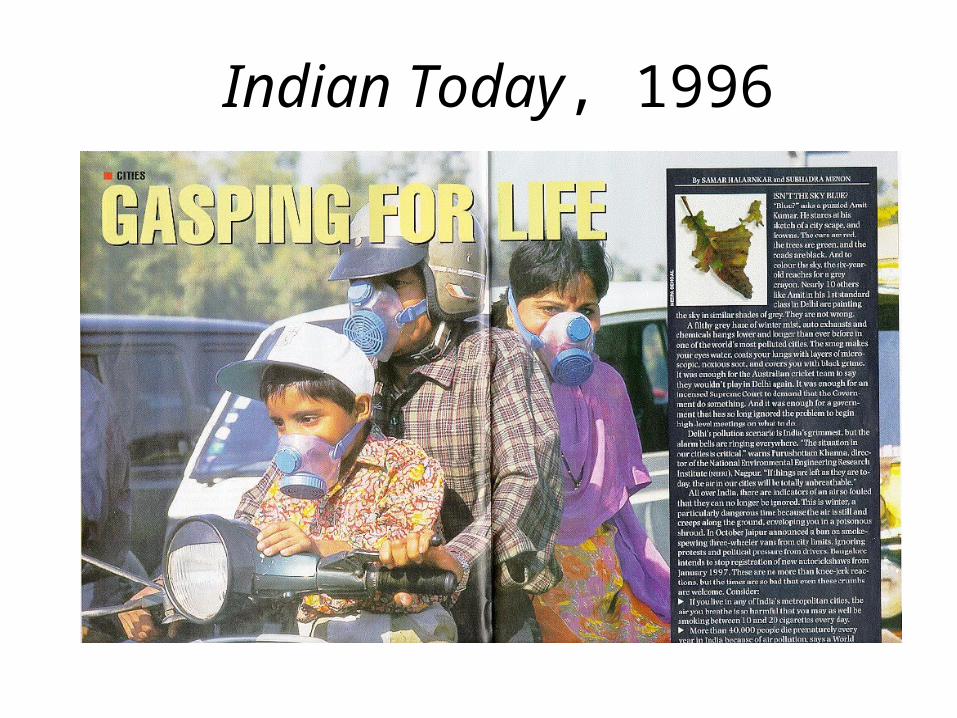
Indian Today, 1996
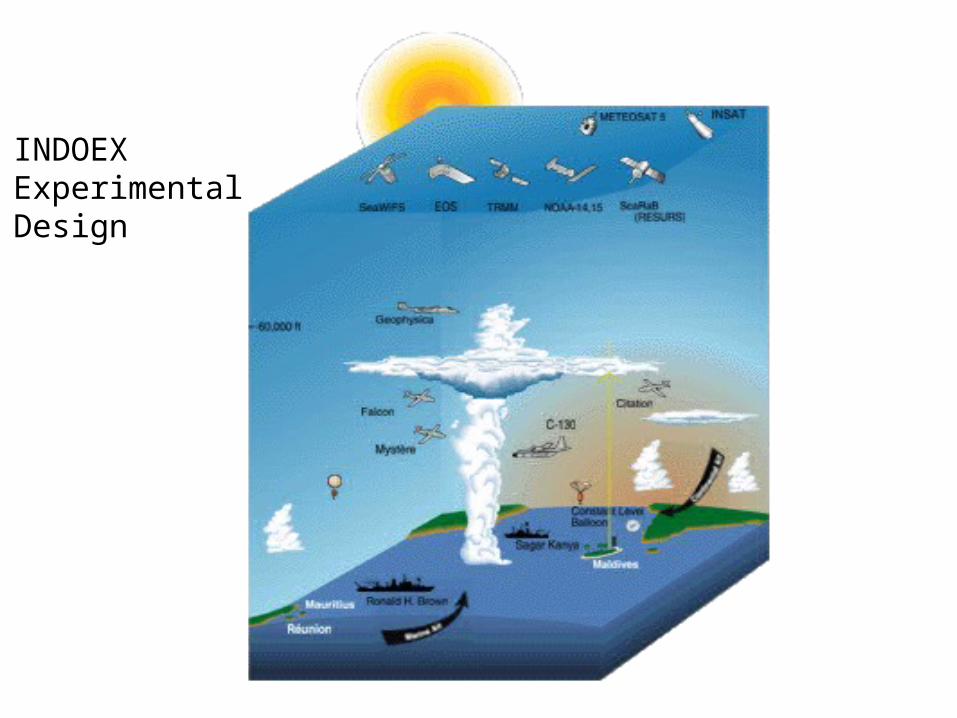
INDOEX, 1999INDOEXExperimental Design

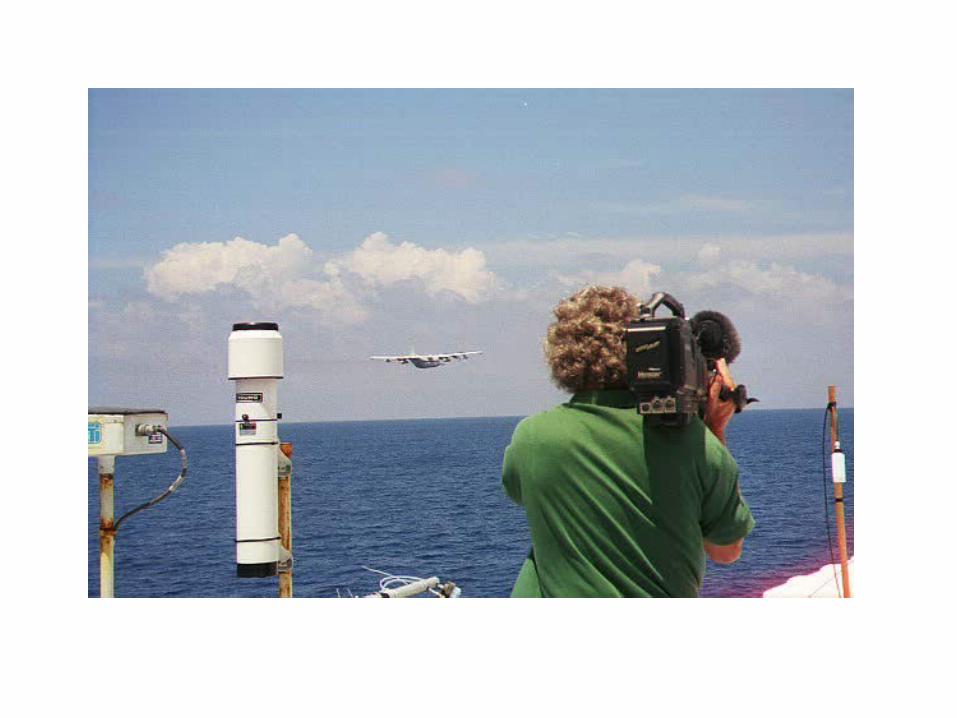
NOAA R/V Ronald Brown
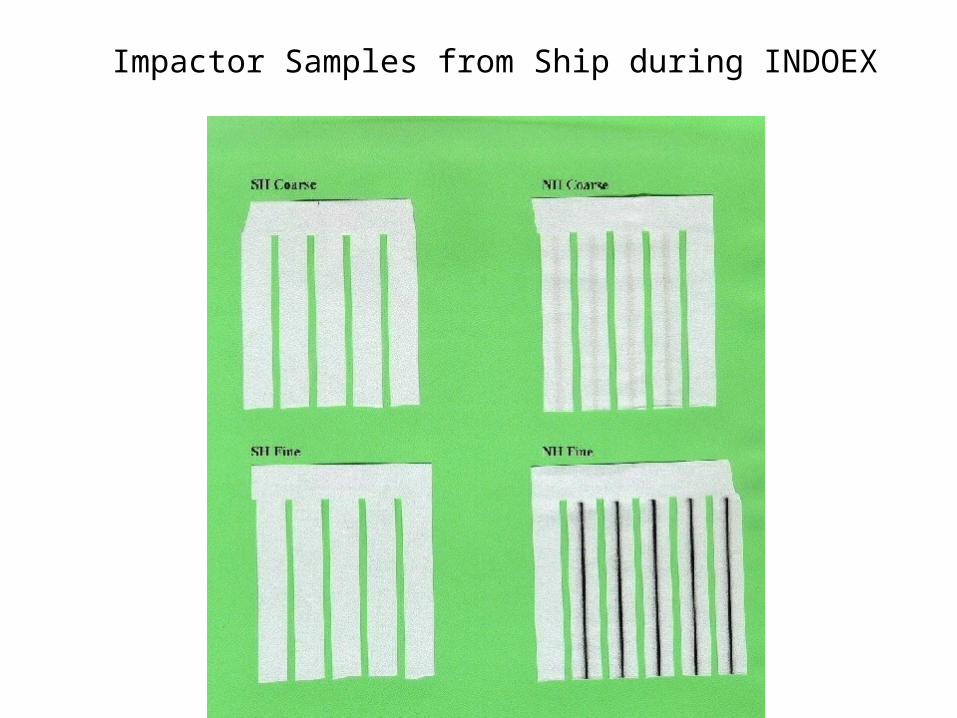
Impactor Samples from Ship during INDOEX

Origin of Soot?
•Low single scattering albedo, 0.81, indicates 70% from fossil fuel combustion (Mayol-Bracero et al, 2001).
•Ratio of BC/OC near unity means origin should be fossil fuelcombustion (Novakov et al., 2001).
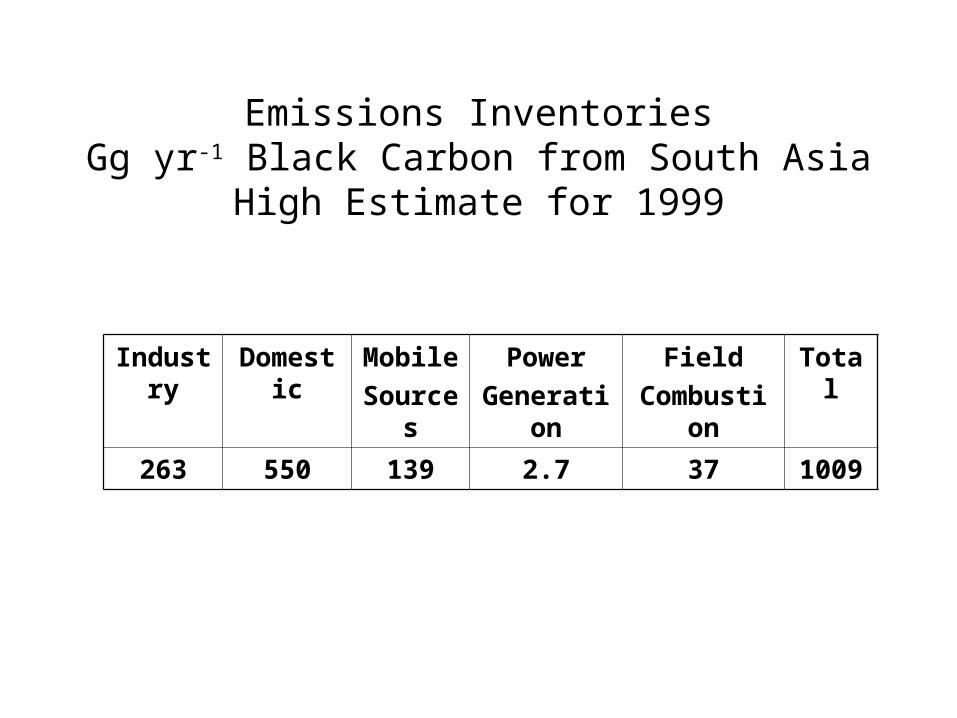
Emissions InventoriesGg yr-1 Black Carbon from South Asia
High Estimate for 1999
Industry Domestic Mobile
Sources
Power
Generation
Field
Combustion
Total
263 550 139 2.7 37 1009
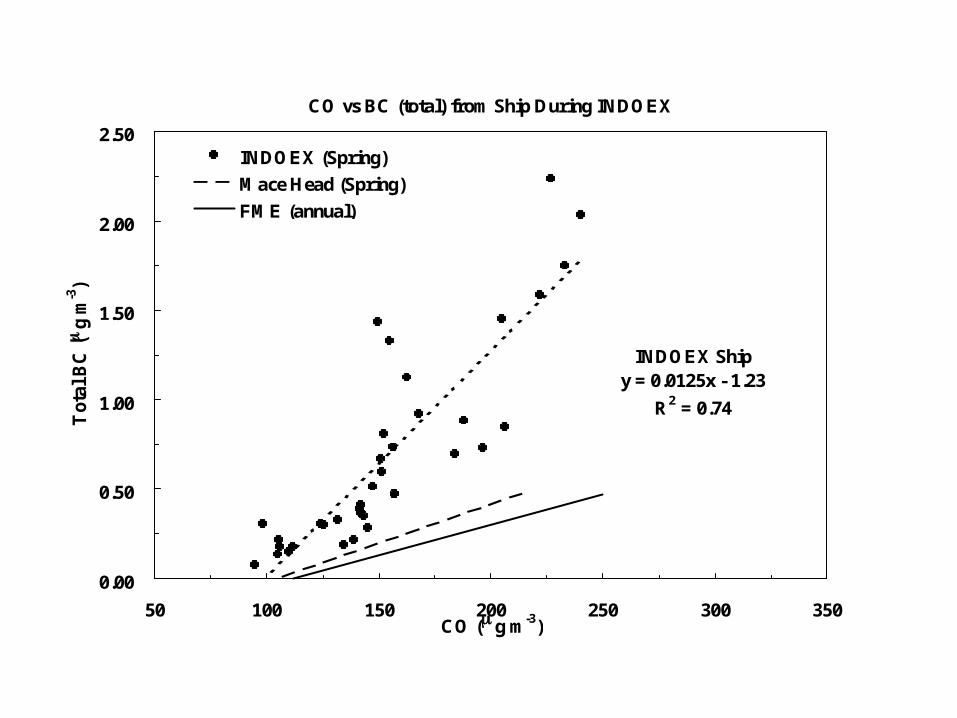
CO vs BC (total) from Ship During INDOEX
INDOEX Shipy = 0.0125x - 1.23
R2 = 0.74
0.00
0.50
1.00
1.50
2.00
2.50
50 100 150 200 250 300 350CO ( g m-3)
Tot
al B
C (
g m
-3)
INDOEX (Spring)
Mace Head (Spring)
FME (annual)
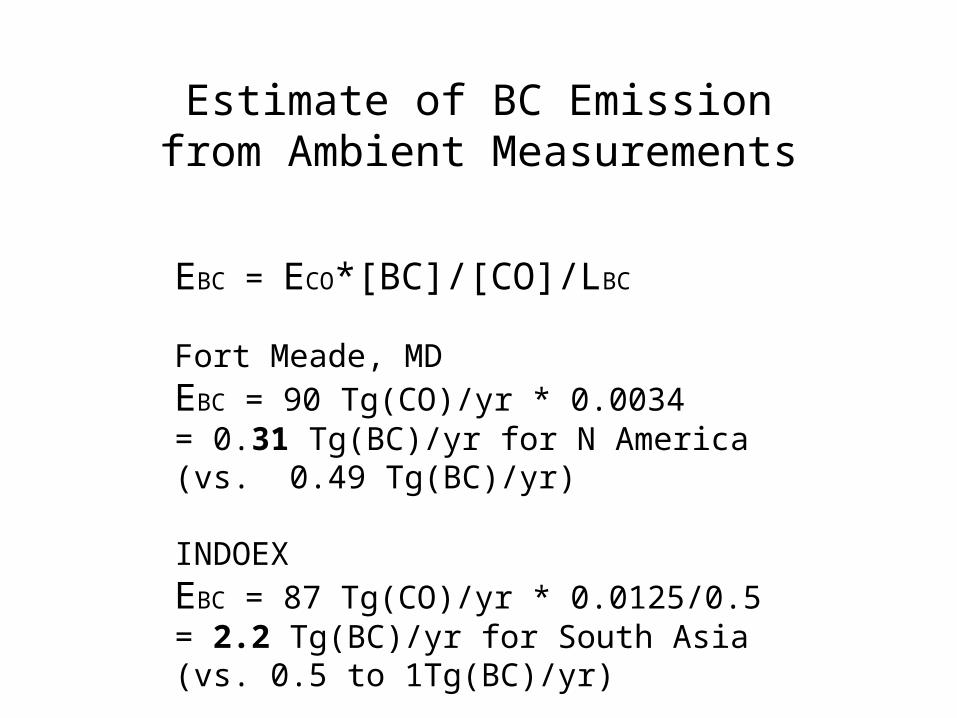
Estimate of BC Emissionfrom Ambient Measurements
EBC = ECO*[BC]/[CO]/LBC
Fort Meade, MDEBC = 90 Tg(CO)/yr * 0.0034= 0.31 Tg(BC)/yr for N America(vs. 0.49 Tg(BC)/yr)
INDOEXEBC = 87 Tg(CO)/yr * 0.0125/0.5 = 2.2 Tg(BC)/yr for South Asia(vs. 0.5 to 1Tg(BC)/yr)
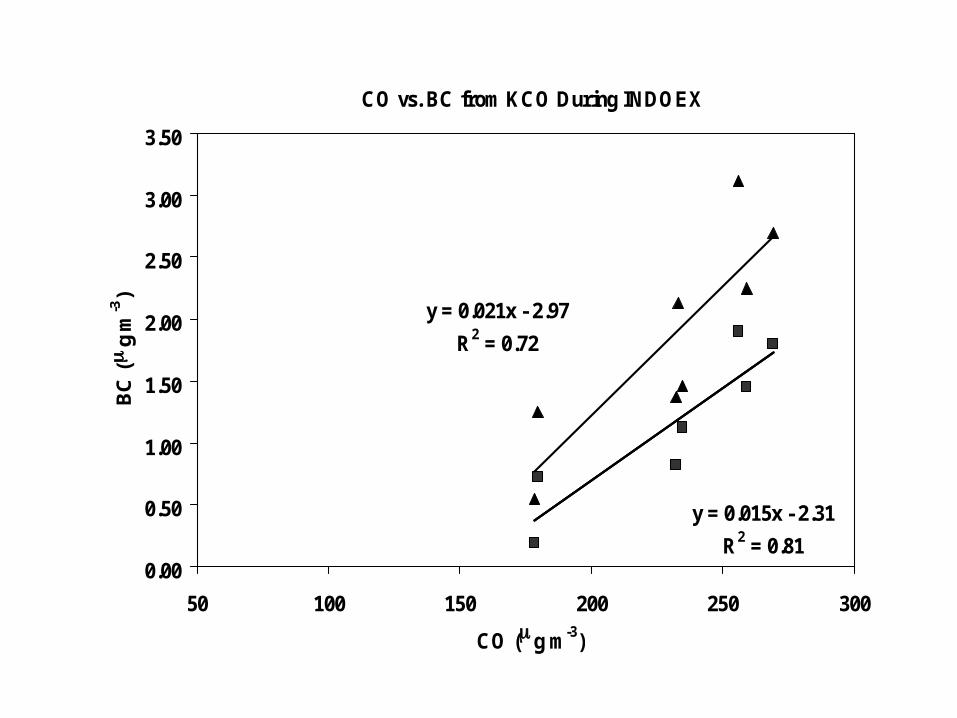
CO vs. BC from KCO During INDOEX
y = 0.021x - 2.97
R2 = 0.72
y = 0.015x - 2.31
R2 = 0.810.00
0.50
1.00
1.50
2.00
2.50
3.00
3.50
50 100 150 200 250 300
CO ( g m-3)
BC
(
g m
-3)
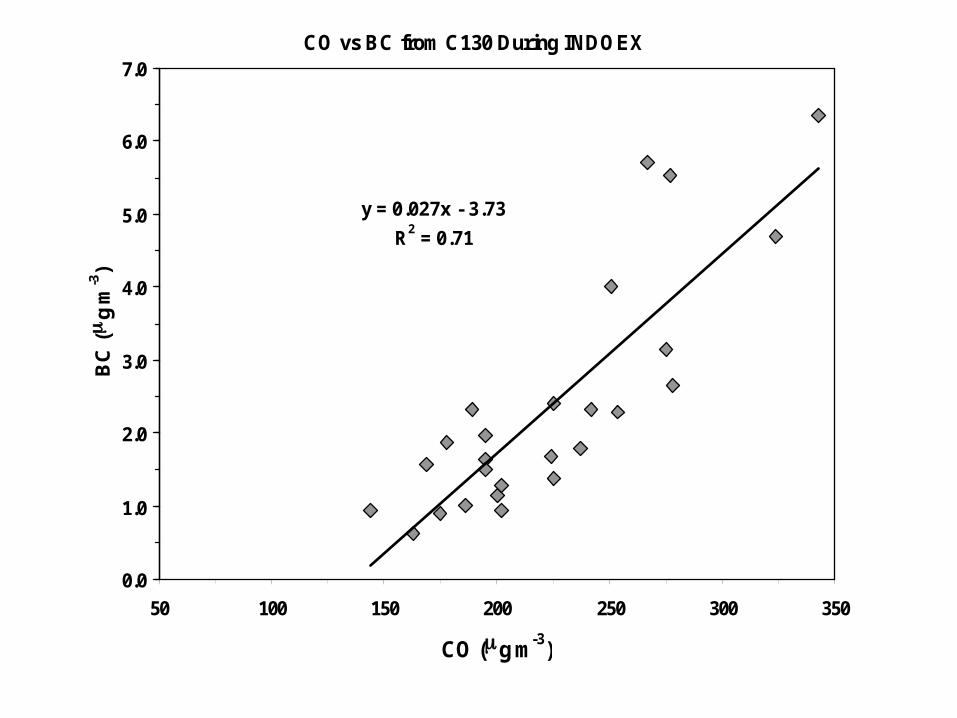
CO vs BC from C130 During INDOEX
y = 0.027x - 3.73
R2 = 0.71
0.0
1.0
2.0
3.0
4.0
5.0
6.0
7.0
50 100 150 200 250 300 350
CO (g m-3)
BC
(
g m
-3)
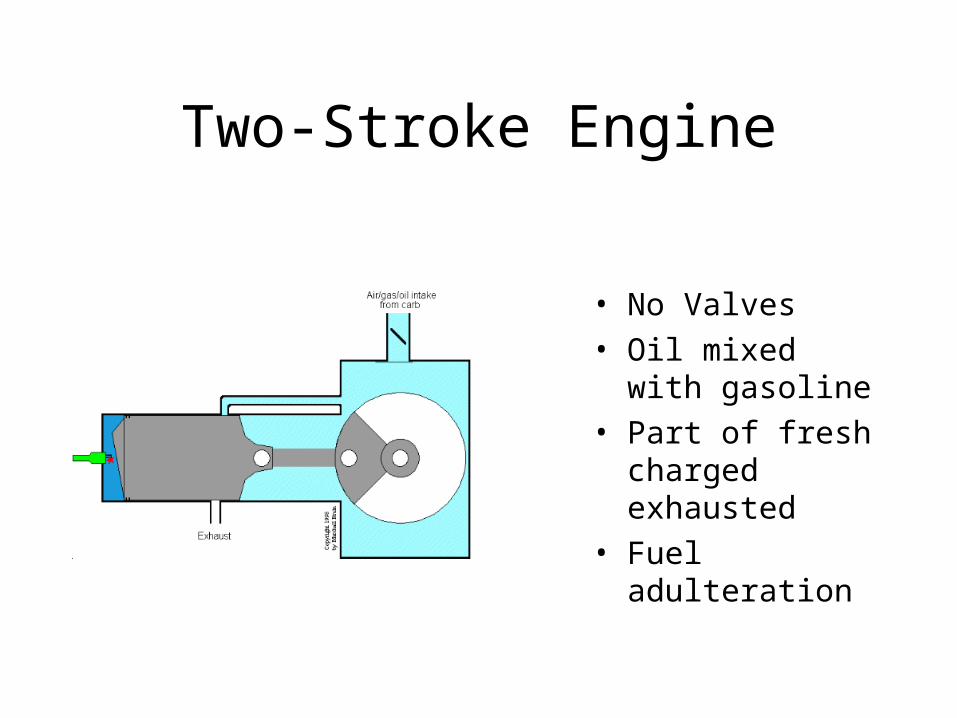
Two-Stroke Engine
• No Valves
• Oil mixed with gasoline
• Part of fresh charged exhausted
• Fuel adulteration
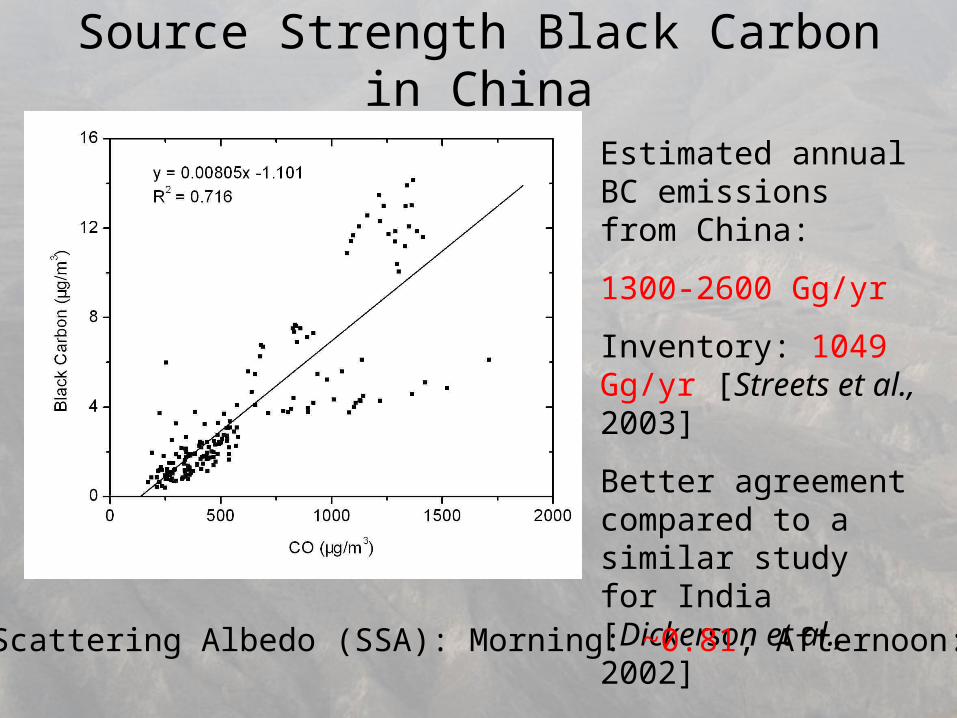
Source Strength Black Carbon in China
Estimated annual BC emissions from China:
1300-2600 Gg/yr
Inventory: 1049 Gg/yr [Streets et al., 2003]
Better agreement compared to a similar study for India [Dickerson et al., 2002]
Single Scattering Albedo (SSA): Morning: ~0.81, Afternoon: ~0.85
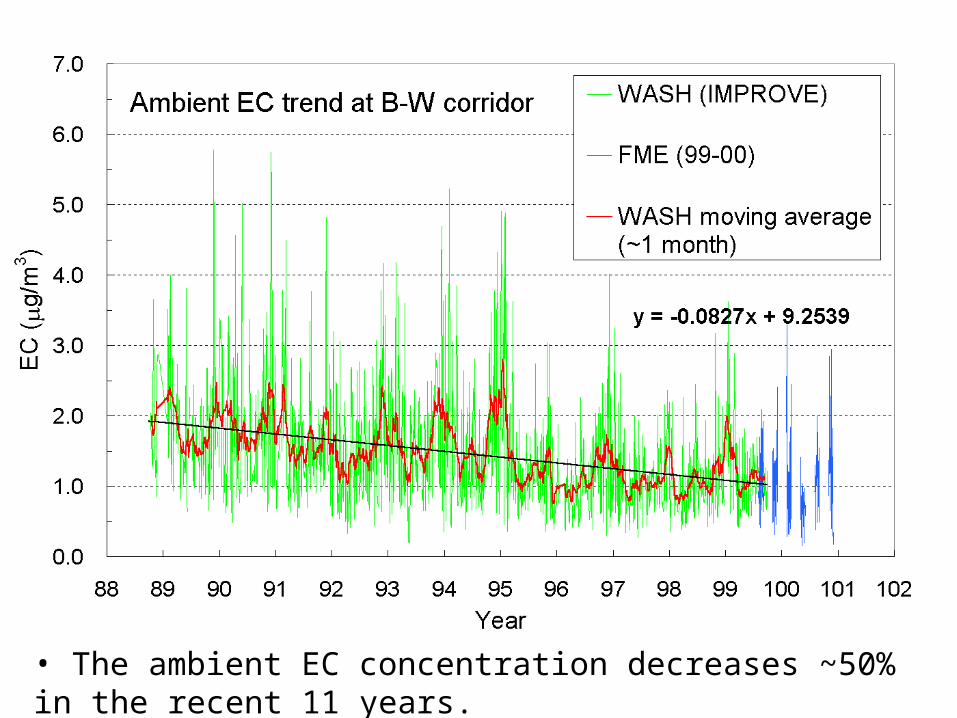
• The ambient EC concentration decreases ~50% in the recent 11 years.
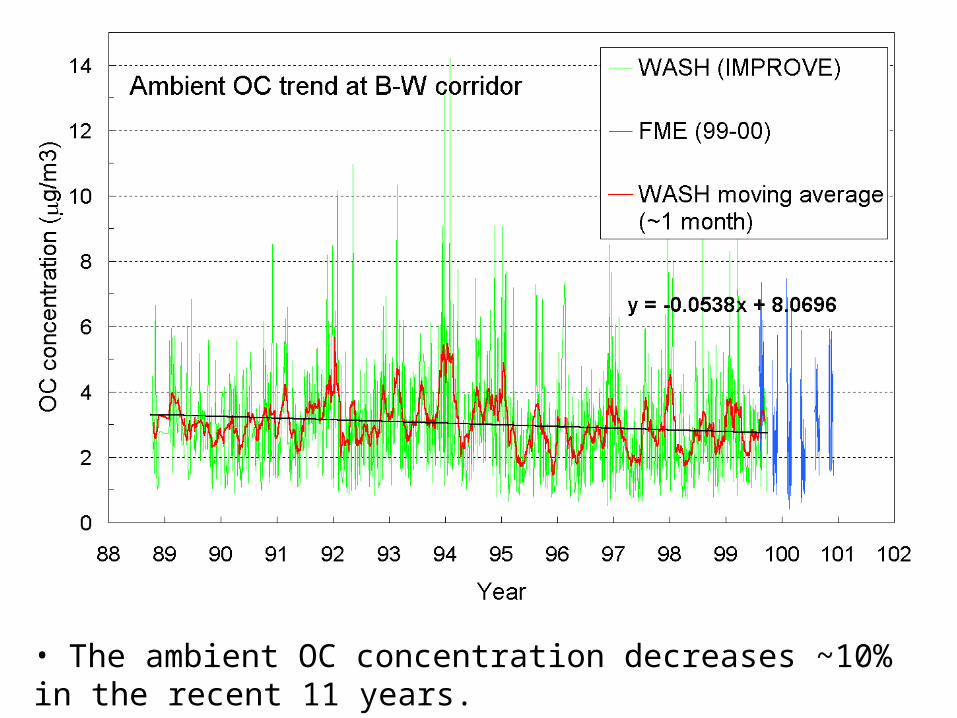
• The ambient OC concentration decreases ~10% in the recent 11 years.
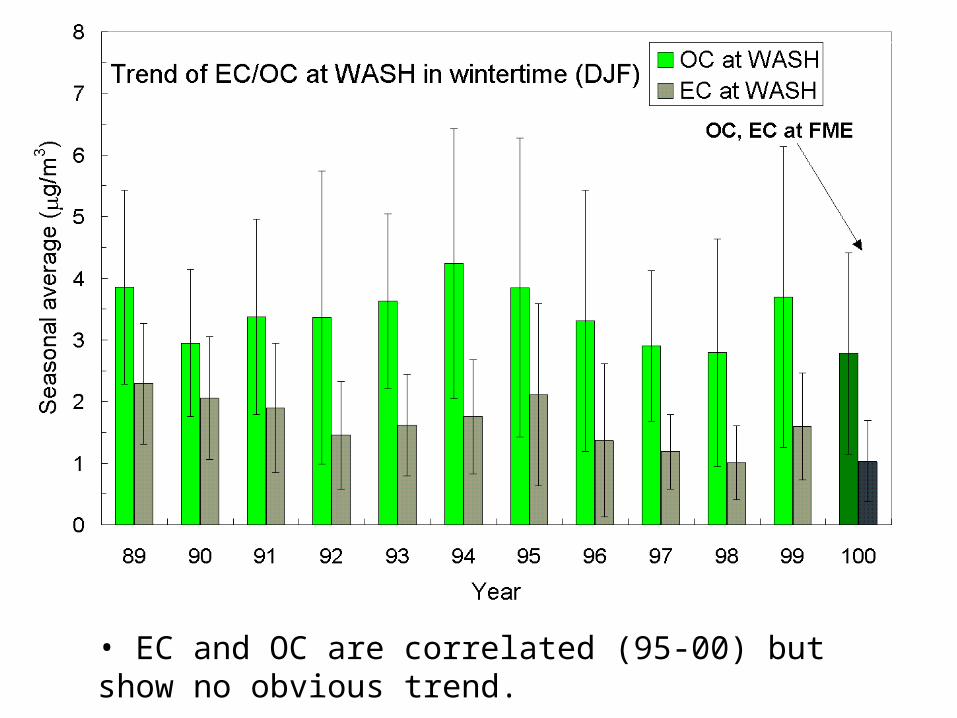
• EC and OC are correlated (95-00) but show no obvious trend.
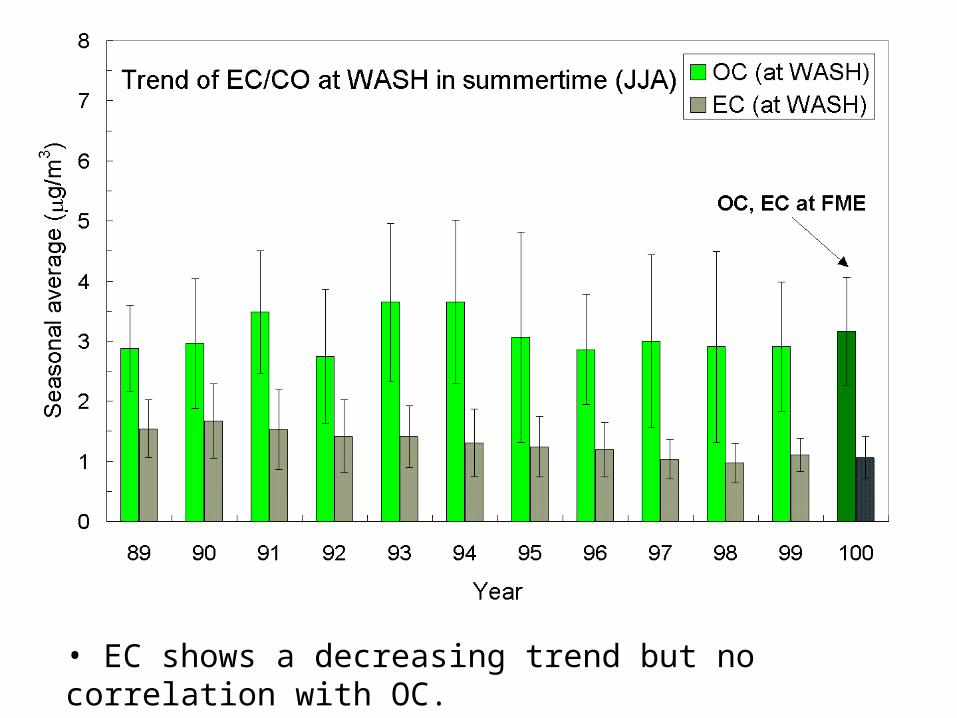
• EC shows a decreasing trend but no correlation with OC.
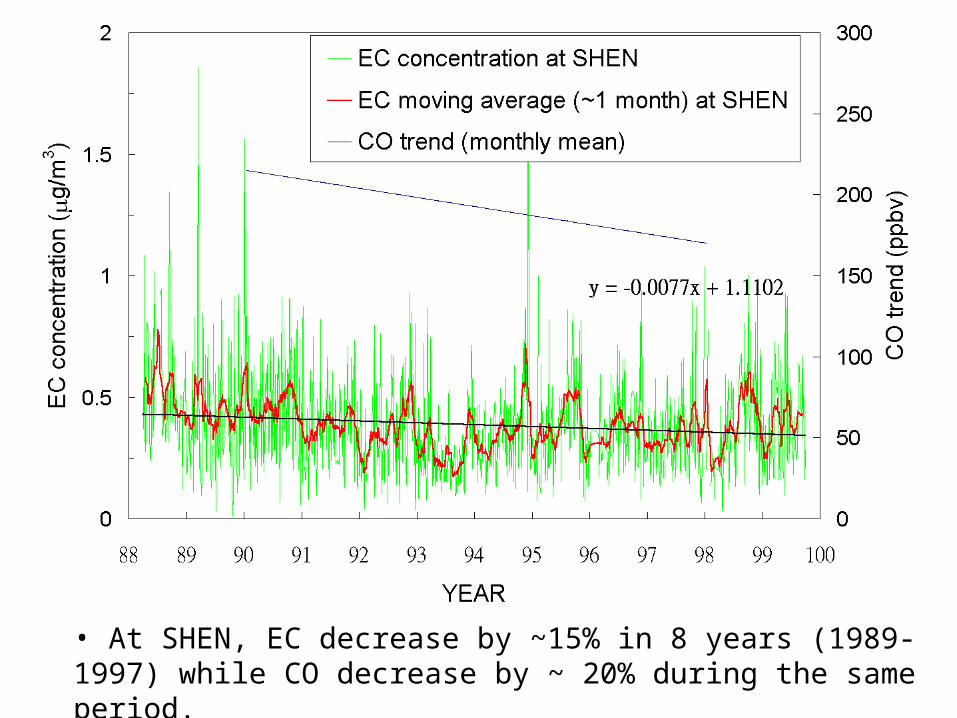
• At SHEN, EC decrease by ~15% in 8 years (1989-1997) while CO decrease by ~ 20% during the same period.
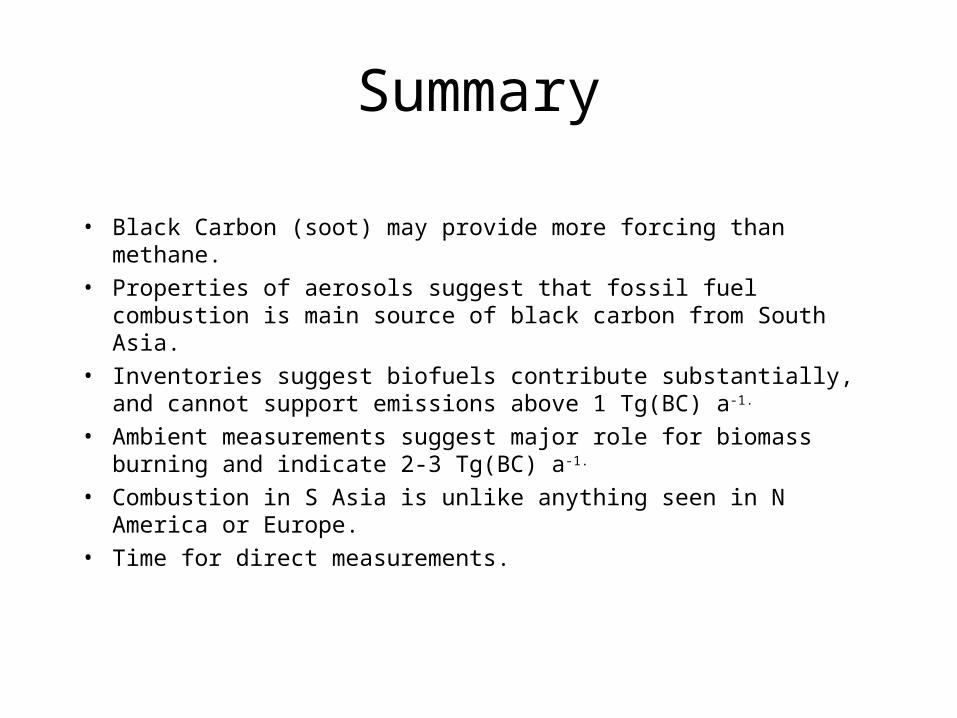
Summary
• Black Carbon (soot) may provide more forcing than methane.
• Properties of aerosols suggest that fossil fuel combustion is main source of black carbon from South Asia.
• Inventories suggest biofuels contribute substantially, and cannot support emissions above 1 Tg(BC) a-1.
• Ambient measurements suggest major role for biomass burning and indicate 2-3 Tg(BC) a-1.
• Combustion in S Asia is unlike anything seen in N America or Europe.
• Time for direct measurements.
Black Carbon References