björn hacker unequal europe
TRANSCRIPT

Björn Hacker
Unequal EuropeTackling Regional Disparities in the EU
With the financial support of the European Parliament.
The present report does not represent the European Parliament’s views.
Europe needs social democracy! Why do we need Europe? Can we demonstrate to European citizens the opportu-nities offered by social politics and a strong social democracy in Europe? This is the aim of the new Friedrich-Ebert-Stiftung project “Politics for Europe”. It shows that European integration can be done in a democratic, economic and socially balanced way and with a reliable foreign policy.
The following issues will be particularly important:
– Democratic Europe – Social and ecological transformation – Economic and social policy in Europe – Foreign and security policy in Europe
We focus on these issues in our events and publications. We provide impetus and offer advice to decision-makers from politics and trade unions. Our aim is to drive the debate on the future of Europe forward and to develop specific proposals to shape central policy areas. With this publication series we want to engage you in the debate on the “Politics for Europe”!
About this publicationIn the European Union, a social and spatial polarization has emerged between economically developed centres and peripheral regions, each reinforcing the up-ward or downward movement of the other. These divergences have been fuelled by external factors such as structural change, globalisation, and severe economic crises. A shift is needed from the current paradigm of competition and growth to an integrated European economic and social policy aimed at building protection and resilience in the face of global challenges such as pandemics or climate change.
About the AuthorDr Björn Hacker is Professor of Economic Policy at the University of Applied Sciences (HTW), Berlin.
Responsible for this publication within the FESDr Philipp Fink, Director FES Nordic Countries.
AcknowledgementsThe author would like to thank all of the authors involved in the eight country- specific disparity reports, as well as the FES and FEPS teams for their helpful com-ments on earlier drafts of this study.
Additional information and supplementary materials are published athttps://www.fes.de/en/politics-for-europe/unequal-europe
FRIEDRICH-EBERT-STIFTUNG – POLITICS FOR EUROPE

1
2
2.1
2.22.2.12.2.22.2.32.2.4
2.32.3.12.3.2
2.4
3
3.13.1.13.1.23.1.33.1.43.1.53.1.63.1.73.1.8
3.23.2.13.2.2
3.2.3
FOREWORD
EXECUTIVE SUMMARY
INTRODUCTION
INEQUALITY AS A EUROPEAN PHENOMENON
Increasing global inequality
Economic and social inequality in the European UnionIntensification of constitutional asymmetryShaping policy coordinationManagement of the financial, economic and euro crisesDevelopment of economic and social inequality
Territorial inequality in the European UnionCohesion policy reformsDevelopment of territorial inequality
Interim conclusion: weak social standards and interrupted processes of catching-up
REGIONAL DISPARITIES IN COMPARISON
Results of the country studiesRegional disparities in GermanyRegional disparities in EstoniaRegional disparities in SpainRegional disparities in FinlandRegional disparities in FranceRegional disparities in ItalyRegional disparities in RomaniaRegional disparities in Sweden
Pattern of interregional disparitiesStructural change and influencing factorsContrast between economically developed centres and peripheral regionsIdentification of development cycles
>>
3
4
5
6
6
7 7 78 9
111112
15
17
171718192122232526
2828
2930
Björn Hacker
Unequal EuropeTackling Regional Disparities in the EU

Interim Conclusion: Double social and spatial dualism
POLICY RECOMMENDATIONS
National measures to overcome disparities
A new role for the EU as a protective buffer against global challengesFocus on cohesion instead of internal competition between regionsThe development of an integrated European economic and social policyManaging new challenges together
CONCLUSION
BibliographyList of figures
3.3
4
4.1
4.2
4.2.1
4.2.2
4.2.3
5
32
33
34
35
35
3637
39
4042
2FRIEDRICH-EBERT-STIFTUNG – POLITICS FOR EUROPE

FOREWORD
The European Union was once called a “convergence ma-chine” but the EU can take less and less credit for territorially balanced economic development. Eastern economies that have produced higher than average long-term GDP growth rates have developed great internal imbalances despite re-ceiving vast resources from EU structural and investment funds. Similarly, the once converging EU South experienced striking divergence at the time of the euro area crisis which has been haunting them ever since, especially in the course of the pandemic. EU member states collectively responded to the pandemic recession with an unprecedented fiscal package. However, unless territorial cohesion becomes a priority within the emerging recovery and resilience plans, underdeveloped regions will continue their stagnation or de-cline and diverge even more.
We are witnessing a worrisome vicious cycle, deepening im-balances both across and within EU member states. On the one hand, some lagging regions have fewer and fewer indus-tries and economic activities, which results in high-skilled peo-ple moving away. This in turn results in the worsening of the conditions for relaunching economic dynamism and in the medium-term infrastructure and public service investment de-crease, with a further loss of human and non-human capital. Highly urbanised areas have been further advantaged in areas with concentrated economic activity that attracts more and more people, resulting in higher living and housing costs, but also in higher pollution and higher risk of social exclusion. On the other hand, the economic and social problems of rural areas and those suffering from industrial and economic de-cline are often forgotten, less visible and less frequently dis-cussed. Cumulative economic disadvantages and social mar-ginalisation only become frontpage news when we witness the repercussions in various forms of populist backlash.
The Europe-wide research presented in this volume examines 11 socioeconomic and wellbeing indicators in 8 EU member states, clustering regions in terms of socioeconomic inequal-ities. (Germany, France, Italy, Spain, Sweden, Finland, Estonia, Romania). This shows that the advantages of income growth and job opportunities have been distributed in an increas-ingly unequal way, not only within the layers of society, but geographically as well. Some of the intra-national imbalances are better known and even proverbial. The North-South di-vide within Italy has long history, while the East-West gap within the federal Germany is more recent. Romanian eco-nomic geography remaining heavily structured by the reverse
L-shaped Carpathian Mountains is not surprising. But the di-vide between peripheral areas and urbanised growth centres is a trend affecting all countries. Metropolitan areas with di-versified economic structures have benefited more from the internal competition at the national and European level than rural regions with little innovative potential and serious im-pediments to structural change. Resulting social and spatial inequalities fuel dissatisfaction with the political and eco-nomic systems in many European countries.
Why is it a European problem? First, it affects more or less all EU countries. Second, it challenges the unity and conver-gence that is at the core of the European project. And, per-haps even more importantly, it is linked to the EU governance framework that treats the mission of “territorial cohesion” with financing but without a real strategy to fight regional inequalities. The responsibility to define development strate-gies is delegated to national and regional authorities that is shown to be insufficient. Territorial cohesion needs to be re-considered and retooled. For example, cohesion policy can-not be effective if it is disconnected from the distribution of tax revenues and tax expenditures. Equalisation mechanisms should be adapted or redesigned. Very importantly, the local level must be empowered by having more direct access to EU budget resources.
Björn Hacker’s policy recommendations presented in this re-port are unanimous: move away from the interregional com-petition principle that never lets those trailing behind catch up and create an investment state that takes an active role in innovation as well as regional development. Living conditions in Europe’s peripheral regions cannot improve and social ine-qualities cannot be reduced without a renewed strategy to fight the regional divide. The European Union has a decisive role to play here. The EU shall reaffirm its mission towards well-being, decent and improving living standards for all Euro peans and can attain this with a policy mix comprising an ambitious social agenda but also the coordination of eco-nomic policy, a rethinking of cohesion policy and a post-Cov-id-19 recovery strategy leading to a new growth model capi-talising on the green and digital transitions.
LASZLO ANDOR, Secretary GeneralFoundation for European Progressive Studies
PHILIPP FINK, Director of the FES Office for the Nordic Countries
3FOREWORD

EXECUTIVE SUMMARY
The European Union is not only fraught by social and econom-ic inequality between the member states, but member states themselves show stark socioeconomic spatial disparities. Spa-tial socioeconomic polarization has emerged between Eu-rope’s economically developed population centres and their outlying regions right across the continent. These spatial dif-ferences are not only fuelled by external factors such as struc-tural change, globalisation, or severe economic crises; they are also a result of prevailing economic and regional policies.
This study uses a multidimensional approach in order to ana-lyse how and where this kind of economic, social, and terri-torial inequality occurs in the EU. Here, reference is made to studies focused on Germany, Estonia, Spain, Finland, France, Italy, Romania, and Sweden. This paper summarises the find-ings of the individual country studies, compares these find-ings, and considers them against the background of the European multi-level system, which has revealed the follow-ing insights:
– Upon examination of the district or municipal data in all the countries studied, what becomes clear is a pattern of social and economic differences that cu-mulate into spatial disparities. Stark differences in economic structure, local labour markets and social development become apparent between central growth regions and peripheral regions. This polariza-tion between population centres and peripheral are-as occurs both socially and spatially.
– While the growth poles in and around metropolises are integrated into global value chains, outlying re-gions either struggle with structural change and de-industrialisation or are largely rural and strongly char-acterised by agriculture. These economically isolated areas are also socially characterised by, among other things, higher unemployment, the risk of poverty, or an ageing society.
– Although external factors such as structural change and economic crises that have contributed to and deepened spatial inequality, differences within the regions have been exacerbated by a virtually mono-lithic and largely neglected economic policy since the 1990s. Over the course of time, regions with favour-able starting conditions have continued to prosper and left regions with disadvantageous starting con-ditions behind.
– In order to counter the uneven and crisis-ridden course of the European economic and development model, it is necessary to shift the existing competition and growth paradigm to an integrated European econom-ic and social policy specifically aimed at attaining more equitable living conditions. This is an essential protec-tive buffer in the face of global challenges such as pan-demics and climate change, as well as the emerging industrial transformations to mitigate these crises.
4FRIEDRICH-EBERT-STIFTUNG – POLITICS FOR EUROPE

1
INTRODUCTION
How and where is there economic, social and territorial inequality in the European Union and what can be done about it? This is the subject of investigation in this study as part of a comprehensive pan-European project undertaken by the Friedrich-Ebert-Stiftung (FES) and the Foundation for European Progressive Studies (FEPS). In the first stage of this project, individual studies were conducted on regional ine-quality in eight EU member states.1 The next step has been to summarize and compare, contextualising the results in the surrounding economic and political framework of the multi- level system of the EU. We have deliberately chosen an ap-proach that not only takes the classic economic indicators of gross domestic product (GDP) and GDP per capita into ac-count, but also employment and the labour market, educa-tional and development opportunities, prosperity and health, government action and political participation, as well as im-migration and emigration.
The effects of EU policies on the region can by no means be addressed by merely considering EU cohesion policy. In its latest cohesion report, the European Commission (2017: 175ff.) reports investments of 480 billion euros in the peri-od between 2014 and 2020, about three quarters of which are financed through European funding avenues, while the remaining financing is contributed by the member states. For the previous funding period, from 2007 to 2013, the report estimates a positive impact on EU GDP of 3 per cent. However, it is essential that regional inequality be contex-tualised, whereby EU cohesion policy is crucial since certain developments on the ground can only be explained in terms of changing circumstances, structural change, new chal-lenges, crises and volatile policy preferences: “A wide set of structural features of the target regions shape the influence of the policy on regional economic performance. However, the interaction of Cohesion Policy with other EU (and non-EU) policies, as well as with political economy dynamics, is also a crucial factor conditioning impacts.” (Crescenzi/Giuia 2017: 29).
This means that a multidimensional task must be undertaken that aims to close a gap between studies that have either focused exclusively on regional, national or European levels, or have taken a restrictively narrow focus on cohesion policy. There is, of course, the fundamental challenge of being able
1 https://www.fes.de/en/politics-for-europe/unequal-europe
to prepare the available data in sufficient detail, as well as the question of its comparability. Data is often difficult to com-pare since different indicators must be used for the same subject categories depending on the national situation. To give an example: Infrastructural development can easily be measured in Finland, for example, on the basis of the availa-bility of fast Internet in households; in Romania, the connec-tion of households to public water supply is a better indica-tor. In contrast to the EU’s practice in its cohesion reports, only very limited regional indicators are used here to take account of differences between member states.
Rather than undertaking an attempt at a comprehensive in-vestigation of all 27 member states, eight countries were selected to form suitable groups for various considerations, in order to obtain as comprehensive a picture as possible of the socioeconomic situation within the EU. In terms of the temporal dimension of the European integration pro-cess, three founding members of the European Coal and Steel Community (ECSC) from 1951 are represented (Germa-ny, France, Italy), Spain stands for the southern enlargement in 1986, Sweden and Finland cover the 1995 enlargement, Estonia (2004) and Romania (2007) for the enlargement to Central Eastern Europe. Except for Sweden and Romania, these countries are all members of the Eurozone, the inner-most circle of integration. Two countries are social democrat-ic welfare states (Sweden and Finland), two are conservative welfare states (Germany and France), and two adhere to the Southern European welfare model (Italy, Spain) (Esping-An-dersen 1990; Ferrera 1996). The remaining two can be un-derstood as post-socialist welfare states, but Romania be-longs more to the group of the Southern European model and in many respects Estonia has developed into a liberal welfare state (Baum-Ceisig et al. 2008). In terms of per capita income, two groups stand out: Germany, Sweden, Finland and France, which are above the European average, and Italy, Spain, Estonia and Romania that are below.
The study is divided into three major sections. First, econom-ic, social and territorial disparities in the EU are approached comparatively, with consideration to aggregate, country and regional perspectives (chapter 2). Subsequently, the level of observation is deepened by presenting the key findings of the eight country studies on regional disparities and examin-ing them for similarities and patterns (chapter 3). The find-ings are then used to formulate recommendations for poli-cies aimed at overcoming regional disparities (chapter 4).
5INTRODUCTION

2
INEQUALITY AS A EUROPEAN PHENOMENON
The startling increase in global inequality is now clearly evi-dent and widely discussed. For some time now, the conse-quences of the gradual shift that many states and interna-tional economic organisations made 40 years ago have become quite evident. This shift was politically championed by Margaret Thatcher and Ronald Reagan and adhered to a course of political restraint from market activities while in-creasing the individualisation of socioeconomic risks. This in crease in global inequality is internationally axiomatic (2.1) and has been illuminated by a great many scholars. Following the global financial and economic crisis in 2008, this kind of inequality became particularly obvious across the European Union (2.2) in both economic and social, as well as markedly territorial (2.3) terms.
2.1 INCREASING GLOBAL INEQUALITY
Thatcherism and Reagonomics paved the way for the re-placement of what many Western economies perceived as the “golden age” of the 1960s and 1970s through their reli-ance on supply-side economic policies, tax competition, and the flexibilisation and redevelopment of markets once regu-lated by the public sector. Post war economics and Fordist mass production with extensive investment in infrastructure, expanded welfare states, and widely developed economic democracy were followed by a replacement of the real eco- nomy by the finance capitalist “game order” (Schulmeister 2018: 75). Instead of Keynesian global governance and eco-nomic policy actors seeking consensus in stakeholder capital-ism, shareholder capitalism that focuses on short-term profits through high capital returns on internationalising stock ex-changes has become increasingly dominant.
Based on the concepts of Friedrich August von Hayek and Milton Friedman, new market liberalism spread from coun-try to country at different speeds by being incorporated into the programs of very different political actors. In Europe, this proved to be particularly influential when many social democratic parties adapted the theoretical constructs of the optimal allocative effects of free or unleashed market forces in the course of the so-called “third way” (Bailey 2009). Competitiveness had long since ceased to be a term for en-trepreneurial competition; it was adopted for the profes-sional and private lives of each and every individual. With the end of Cold War and its economic rivalry, the dream of a borderless world market became all the more real with its
digital counterpart, the World Wide Web. This not only showed what was possible, but also promoted the impera-tive of market-oriented individuals and their societies. The flip side of flexibilisation, privatisation and deregulation, was the end of social advancement across the board. Wage stagnation and atypical forms of employment such as tem-porary, part-time, marginal and solo self-employment be-came the hallmarks of the modern labour market. The de-collectivisation of workers’ interests and the expansion of precarious working conditions (Standing 2011), along with the need for private provision to cover major life risks in the social sphere, all go hand in hand with social individualis-ation and continually reinforce it.
Almost 20 years ago, Joseph Stiglitz (2002) pointed out that the belief that free and borderless markets would automati-cally increase prosperity for all was, in fact, erroneous. This contradicted the globalisation euphoria prevailing at the time, and refuted the myth of the trickle-down effect that the Washington Consensus had tried to make credible. Colin Crouch (2004) was similarly quick to warn against the new, primarily market-focused world of work, for which there were supposedly no alternatives. The resulting insecurities for many employees due to loss of income, the risk of pover-ty, and the inability to keep up in a globally competitive en-vironment would feed resentment of the political system and its establishment and provide right-wing populists with easy game. But it was not until the analytical aftermath of the global financial and economic crisis of 2008/09 that critical analyses of the new global capitalism began to make inroads in economics and sociology.
Meanwhile, the descriptions and analyses of new inequali-ties between states and within societies fills entire library shelves: Thomas Piketty (2013, 2019) has comprehensively traced the development of increasing income and wealth inequality, and criticised the dispensing of policy design in-struments that have emerged over the few decades to re-duce and prevent socioeconomic inequalities. Agnus Deaton (2013) draws attention to the unequal distribution of wealth between countries. Branko Milanović (2016: 225) looks into growing inequality within rich states. His analysis of a “pre-dicament created by the forces of automation and globali-sation (the ‘middle class squeeze’)“ of broad sections of soci-ety between an upper class rising to the top and a middle class increasingly struggling with concerns of relegation is examined in detail by Andreas Reckwitz (2017) and Oliver
6FRIEDRICH-EBERT-STIFTUNG – POLITICS FOR EUROPE

Nachtwey (2016). Dani Rodrik (2011), Joseph Stiglitz (2012), and Colin Crouch (2011), later Kate Raworth (2017) and Mariana Mazzucato (2018) challenge prevailing economic theories on market liberal globalisation, the belief in the effi-ciency of the market and its allocative powers, the assumed rationality of market processes and their actors, and the re-liance on the market’s self-healing powers. Anthony B. At-kinson (2015), Sebastian Dullien et al. (2011), and Paul Collier (2018) offer concrete suggestions on how to better regulate transnationally unleashed capitalism and save societies from growing inequality and social and political decay.
2.2 ECONOMIC AND SOCIAL INEQUALITY IN THE EUROPEAN UNION
The European Union was not spared the kind of increasing inequality described above. After the Second World War, be-yond the narrative of fostering peace in the region, European integration was primarily fostered for economic purposes. This saw the formation of the customs union, the common market, and later the formation of the Economic and Mone-tary Union (EMU) that served to create a single European market. Many European policies that served other goals were also related to the creation of the common market. These include the phases of enlargement to include new member states, the implementation of the free movement of persons through the abolition of internal borders, and initiatives to strengthen economic, professional, and social development. New market liberalism, as outlined in chapter 2.1, also found its way into European states. As the single market project entered the home stretch and the Maastricht Treaty paved the way for the creation of the euro zone, the following 30 years saw the competition paradigm became more potent. Major contributing factors were the (2.2.1) deepening of constitutional asymmetry, the (2.2.2) shaping of policy coor-dination and (2.2.3) the management of the financial, eco-nomic and euro crises. Finally, in this study we look at the (2.2.4) development of economic and social inequality in the eight countries considered in chapter 3.
2.2.1 INTENSIFICATION OF CONSTITUTIONAL ASYMMETRY
In the conception of the Economic and Monetary Union (EMU), the Delors Plan followed an ordoliberal and monetar-ist-inspired understanding of the functioning of a monetary union. Unlike the Keynesian-inspired Werner Plan of the 1970s, fiscal policy instruments were no longer used at the community level to cope with asymmetric shocks. This saw the exclusion of policy instruments such as the synchronisa-tion of budgetary procedures, fiscal harmonisation, an eco-nomic policy decision-making body, and wage policy coordi-nation with social partners. Although the different phases of European enlargement made the Community more socio-economically diverse, there was now a belief in the equalis-ing power of single market integration. Since the business cycles of member states were not concurrent, the eradication of vulnerability to asymmetric shocks was tackled by simply making capital and labour more flexible, and by opening
markets and using structural reforms to strengthen competi-tiveness. The dispute over the design of the EMU between supporters of a fiscal union and advocates of a stability union (here, see Brunnermeier et al. 2016 and Hacker/Koch 2017) was won by those who considered the most important goals to be keeping markets free of political regulations and the prevention of inflation. With this thinking, strict rules were needed to prevent interventionist fiscal policies and moral hazard. This evolved into the sanctions-based budget criteria of the Stability and Growth Pact and the no-bailout clause in the resulting treaties. This approach rendered a joint deci-sion-making body for global economic governance unthink-able; after all, fiscal policy was to be kept at a distance as much as possible, and monetary policy was to be primarily committed to price stability rather than promoting growth and employment. The fact that the Stability Pact still bears the suffix of a growth pact in its name represents a last gasp of the concept of a monetary union according to the Keynes-ian reading, which was, however, largely empty: “The Maas-tricht Treaty never supposed that the European Monetary Union should include such an insurance scheme. Europe was not intended as an instrument for fiscal solidarity. From a German perspective, such schemes are plagued with moral hazard” (Brunnermeier et al. 2016).
In the years that followed there was no traction for a conver-gence model characterised by internal solidarity to reduce social and economic disparity that set out to bring living con-ditions closer together and saw “protection against reducing social standards” as a measure for increasing common Euro-pean competitiveness (European Commission 1994: 5). This is largely because the positive integration mode of market shaping has progressed only in small steps, in contrast to the negative integration mode of market creation, which has ad-vanced considerably with the single market and EMU. This “constitutional asymmetry” (Scharpf 2002) could be built up further because the European court generously interpreted the existing freedoms of workers, goods and services trans-actions, and capital mobility within the single market (Grimm 2016). This was also exacerbated because, with the EMU, the European Commission and Euro pean Council largely ignored the lack of a fiscal policy counterpart to monetary policy and focused instead on compliance with budgetary rules and pro-competitive structural reforms. Instead of agreeing on new regulatory instruments and procedures to shape positive integration, member states took refuge in clinging to national sovereignty (Becker 2015: 10) conditioned by the existence of historically evolved worlds of welfare capitalism (funda-mentally, Esping-Andersen 1990 and Hall/Soskice 2001) that were difficult to reconcile.
2.2.2 SHAPING POLICY COORDINATION
In the mid-1990s, the idea emerged that member states should coordinate their economic, employment and social poli cies with each other, within a greater framework that would protect their sovereignty in the face of the faits ac-complis of market and monetary integration. Soft govern-ance was then supposed to help bridge the gap between market-creating and market-shaping integration.
7INEqUALITY AS A EUROPEAN PHENOMENON
Early fields of application of the new soft governance include the coordination of employment policies, that began in 1994, the Stability and Growth Pact concluded in 1996, and the Macroeconomic Dialogue from 1999 onwards. It was not until the turn of the century that the new form of gov-ernance was comprehensively institutionalised within the framework of the Open Method of Coordination (OMC) as part of the EU’s Lisbon Strategy adopted in 2000. But the “makeshift bridge” (Hacker 2020) of policy coordination be-tween the normative demand for common policies and the competences remaining in the capitals of the member states proved to be a shaky affair. Voluntary policy learning across national borders has proven strong and disciplining in those areas best served by treaty integration: in budgetary rule-making via the Stability and Growth Pact. Without quantita-tive targets with a contractual status (such as the govern-ment deficit and debt target), and the absence of sanctions (such as the opening of an excessive deficit procedure, at the end of which there may be financial penalties), the kind of “naming and shaming” envisaged in the process of cross- border system comparison only worked sporadically.
Early on, critics already warned that it was illusory to expect that a balance between market enhancing and market shap-ing integration could be achieved in this way. On the contra-ry, they said that this kind of policy coordination would be-come a Trojan horse for market-liberal ideas of competition that would penetrate the innermost areas of national eco-nomic and social policy (see Scharpf 2002; Offe 2003). Sure enough, it soon became apparent that policies released for coordination quickly became dependent on those areas that enjoyed greater integration. The protagonists of the compe-tition paradigm were helped by the existing European set-tings of well-developed market integration, the competitive mindset between welfare states inherent in EMU (cf. chap-ter 2.2.1), and the instrument of prioritising certain policy objectives via the new governance structures. With the help of the coordination cycles, reform concepts for flexibilisation, deregulation and privatisation were able to diffuse across the member states. Suddenly, the focus was no longer on jointly identified economic and social goals as the corner-stones of a European social model, but on adapting national welfare states to a market-liberal global environment that was deemed to be in their favour. It was advantageous for the implementation of the objectives of fiscal sustainability and structural reforms that the finance ministers of the member states made themselves the authoritative decision- makers in the coordination cycles at an early stage via the increasingly powerful ECOFIN Council of Economic and Fi-nance Ministers (De la Porte 2013: 412). The budgetary lens was not only utilised for national budget policies but also applied when negotiating the need for reform of pension systems and labour markets. As a result, the reform recom-mendations that were fed back to the member states em-phasised individual flexibility and mobility for jobs, private pension savings, lifelong learning and low taxes, coupled with curtailed investment in public infrastructure and re-duced social benefits. This was a result of the prioritisation of balanced state budgets and the emphasis on civic duties in the welfare state. This roughly represented the cornerstones of what Anthony Giddens (2006: 12f.) and the followers of
the so-called Third Way called the “renewed European social model.”
2.2.3 MANAGEMENT OF THE FINANCIAL, ECONOMIC AND EURO CRISES
The culmination of the orientation towards structural re-forms and budgetary restrictions came after the global finan-cial and economic crisis of 2009, when Keynesian crisis man-agement, which was undoubtedly sensible in economic terms, was rashly declared to be over. European Community instruments, such as France’s proposal to form a banking un-ion, were rejected as a way of immunising the EMU against future financial crises. These instruments were considered alien to the stability union model that was adopted in Maas-tricht by those who sought to defend it. In the years that followed, Germany distinguished itself as an advocate of strict budget criteria and structural reforms. After Germany was able to put the major economic crisis behind it quickly thanks to comprehensive economic stimulus packages, bank rescue programs and a well-functioning social partnership, little sympathy was shown for those countries that still had high deficits and growing debt levels in 2010.
While many economists were aware of the systemic nature of the incipient euro crisis and many governments and rep-resentatives of the European institutions understood it, the narrative of the alleged debt crisis could not be exposed as being just one element among many other issues, and only being a small part of the truth. In view of the divergent eco-nomic developments measurable in unit labour costs and current account balances and the “one size fits none” policy of the European Central Bank, one could have seized the opportunity to integrate the elements into the EMU rulebook that were missed in Maastricht, in order to develop the EMU further according to the model of a fiscal union (see 2.2.1). But after Greece became the only long-term problem case for tackling budgetary sustainability, it was made into an example of austerity, and the euro rescue management im-posed this half-baked concept on all crisis states (see Hacker/Koch 2017). In retrospect, even though Germany was one of the first countries to break the Stability Pact in 2002, it suddenly became the model student of the monetary union. The pro-competitive character of Agenda 2010, launched in 2003, involved the expansion of the low-wage sector and reduced social benefit entitlements, an export orienta-tion with the help of wage policy stagnation, and the debt brake incorporated into the Constitutional Law in 2009. The Troika imposed these measures on all crisis states by means of macroeconomic adjustment programs as part of rescue umbrellas in return for urgently needed credit lines.
There has been no lack of alternative plans. From early on the Commission in particular developed reform roadmaps that went far beyond singularly focusing on stability. However, with the exception of the banking union, none of the con-cepts of deeper fiscal integration such as Eurobonds, Euro-pean unemployment insurance, fiscal capacity, or European economic governance have been realised (see, for instance: European Commission 2012). It was not until 2015 that the
8FRIEDRICH-EBERT-STIFTUNG – POLITICS FOR EUROPE

Figure 1GDP per capita in PPS, selected countries 2019, EU-27 2020 = 100
Source: https://ec.europa.eu/eurostat /databrowser/view/tec00114/default /bar?lang=en.
Commission was able to begin focussing significant atten-tion on mitigating austerity policies and the social conse-quences of the crisis years and on making the application of the Stability Pact more flexible. This became the European Pillar of Social Rights in 2017, a declaration of intent that be-gins with a preamble referring to the social dislocations fol-lowing the euro crisis (see Hacker 2019). The need to recall the social objectives of the Union became necessary in view of the results of the austerity policy when the procyclicality of crisis management deepened the economic crisis by cap-ping demand in the affected countries. Instead of econom-ic recovery, economic output fell because of a lack of invest-ment, minimum wage cuts and pension reductions. The loosening of employment protection, the piercing of the collective bargaining landscape and the extensive privatisa-tion of state-owned companies led to stagnation in wage development and mass unemployment.
2.2.4 DEVELOPMENT OF ECONOMIC AND SOCIAL INEqUALITY
By looking per capita income in the eight countries in focus here according to purchasing power standards (PPS) and relate it to the European average (EU-27 2020 = 100), a split becomes apparent in the year before the start of the Coro-na crisis (see figure 1) between four countries with above- average wealth (Germany, Sweden, Finland and France) and four countries with below-average wealth, i.e., relatively poor countries (Romania, Estonia, Spain and Italy).
This was not always the case. Before the start of the crisis decade, Italy and Spain belonged to the group of countries wealthier than the EU average. Figure 2 shows how both countries have been thrown back relative to the EU average to 96 per cent (IT) and 91 per cent (ES) of GDP per capita – a direct result of the long-acting euro crisis and its manage-ment (see chapter 2.2.3). In contrast, France has been able to maintain its position in the group of wealthy member states (106 per cent of GDP per capita in 2019). Romania (70 per cent) and Estonia (84 per cent), as catching-up economies,
are clearly approaching the EU average in the period under review. For Sweden (119 per cent) and Finland (111 per cent), income per capita falls relative to the 2008 EU average, but for Sweden only after 2015. As a result of this effect, Germa-ny (120 per cent) has succeeded in occupying the top position as the wealthiest country considered here since 2016.
Analysing inequality within member states also reveals large differences in income distribution. Figure 3 shows the s80/s20 ratio by dividing the individual populations into quintiles and indicating the ratio of the total income of 20 per cent of the population with the highest income (top quintile) to the total income of 20 per cent of the population with the lowest income (bottom quintile) for 2019. For the countries consid-ered here, what stands out is a three-way split around the EU average. On average, the disposable income of the top quin-tile of all EU-27 states is just under five times higher than the disposable income of the lowest quintile – Germany (4.89) and Estonia (5.08) are close, while Sweden (4.33), France (4.27) and, above all, Finland (3.69) have much lower ine-qualities within their societies. In contrast, income inequality
Germany
Sweden
Finland
France
EU-27
Italy
Spain
Estonia
Romania
0 5 10 15 20 25 30 35 40 45 50 55 60 65 70 75 80 85 90 95 100 105 110 115 120
69
84
91
96
100
106
111
119
120
Figure 2GDP per capita in PPS, selected countries and years, EU-27 2020 = 100
Source: https://ec.europa.eu/eurostat /databrowser/view/tec00114/default /bar?lang=en.
2008 2013 2019
Sweden 129 129 119
Finland 123 115 111
Germany 118 125 120
France 108 110 106
Italy 108 100 96
Spain 102 90 91
Estonia 70 77 84
Romania 52 55 70
9INEqUALITY AS A EUROPEAN PHENOMENON

is more pronounced in Spain (5.94), Italy (6.01) and Romania, where on average the top quintile earns around seven times (7.08) as much as the bottom quintile.
Over time (see figure 4), there have been relatively small changes since 2009 in the countries showing below-aver-age inequality in 2019. In contrast, income inequality rose sharply in the two Eastern European countries between 2009 and 2014/15, only to largely decline again in the following years. Income inequality also increased in Italy and Spain be-tween 2009–2019, although only Spain managed a gradual reduction from 2016 onwards to close to the 2009 levels.2
How successful has the EU been in combating the risk of poverty and social exclusion in the last decade? The relevant indicator includes all people who fall below the poverty line
2 See also the different calculation formula of the quintile ratios in Dauderstädt 2021. Here, a long stagnation phase in the reduction of inequalities between 2011 and 2017 (can be identified, starting with the euro zone crisis.).
Figure 4Income ratio s80/s20, selected countries and years
Source: https://ec.europa.eu/eurostat /databrowser/view/tespm151/default /bar?lang=en.
2009 2015 2019
Finland 3.71 3.56 3.69
France 4.42 4.29 4.27
Sweden 3.96 4.06 4.33
Germany 4.48 4.80 4.89
Estonia 5.01 6.21 5.08
Spain 5.87 6.87 5.94
Italy 5.31 5.84 6.01
Romania 6.53 8.32 7.08
of 60 per cent of the respective national median income after social transfers, or suffer from severe material deprivation, or who live in households with very low work intensity. In the 2010 Europe 2020 Strategy, the EU set a target of lifting a total of 20 million people out of the risk of poverty or social exclusion. Between 2008 and 2019, it has achieved a reduc-tion of just under half of this target. This is related to a sharp increase (see figure 5) in rates of vulnerability during the eco-nomic crises, from 23.3 per cent in 2009 to 24.8 per cent in 2012, and to the rate falling very slowly thereafter. In EMU, on the other hand, after the increase from 2009 to 2011 there is a long period of stagnation at a high level because of the euro crisis. Here, between 2008 and 2019, only just under two million people cumulatively succeed in escaping from the risk of poverty and social exclusion. Since 2016, a significant reduction can be observed, corresponding to the income growth rates discussed above. In 2016, the EU was able to reach the pre-crisis level again; in the euro zone, this was not the case until 2018.
In the comparative perspective of the risk of poverty or social exclusion, now measured by the success of poverty reduction since 2008, a familiar distribution emerges for 2019: The Southern and Eastern European countries are above the EU average, while the Scandinavian countries as well as Germany and France are below (see figure 6). While the changes over time in the group of countries performing below average are small-scale, i.e. with relatively low vulnerability rates (with at least Germany managing a reduction of 2.2 percentage points between 2012 and 2019), the developments in the other four countries are more remarkable: Romania is catch-ing up in leaps and bounds – since becoming a member of the EU in 2007, its vulnerability rate has fallen by almost 16 points from the original 47 per cent in 2007 to 31.2 per cent; around three million people have been lifted out of risk.
In Spain and Italy, on the other hand, the risk of poverty and exclusion has risen sharply since 2009/10 and has only been reduced again fairly recently. Italy returned to its pre-crisis level for the first time in 2019, while Spain has not yet man-
Figure 3Income ratio s80/s20, selected countries 2019
Source: https://ec.europa.eu/eurostat /databrowser/view/tespm151/default /bar?lang=en.
Romania
Italy
Spain
Estonia
EU-27
Germany
Sweden
France
Finland
0
0.25 1.25 2.25 3.25 4.25 5.25 6.25 7.251.75 2.75 3.75 4.75 5.75 6.750.75
1 20.5 1.5 2.5 3.5 4.5 5.5 6.53 4 5 6 7
3.69
4.27
4.33
4.89
4.99
5.08
5.94
6.01
7.08
10FRIEDRICH-EBERT-STIFTUNG – POLITICS FOR EUROPE

Figure 5Risk of poverty or social exclusion in per cent EU & Eurozone
Source: https://ec.europa.eu/eurostat /databrowser/view/t2020_50/default /line?lang=en.
21
21.5
22
22.5
23
23.5
24
24.5
25
25.5
20.52008 2009 2010 2011 2012 2013 2014 2015 2016 2017 2018 2019
21.7 21.6
22.0
22.923.3 23.1
23.523.1 23.1
22.1
21.6
20.8
21.4
21.8
22.4
23.523.8
24.424.624.8
24.3
23.8
23.323.7
Euro area – 19 countries (from 2015) European Union
aged to do so; cumulatively, almost one million additional people in Spain have been affected by increased poverty risk since 2008. In relative terms, barely more than five percent-age points separate these two southern European countries from Romania. Estonia – which has always been in a better position than Italy and Spain in the period under review – ex-perienced an increase in the risk rate until 2014, which it was only able to reduce in part; since then, it has remained on the side of the EU countries affected by an above-average pov-erty risk.
2.3 TERRITORIAL INEQUALITY IN THE EUROPEAN UNION
Early on, the European Social Fund (ESF), created with the European Economic Community (EEC), and the European In-vestment Bank (EIB) have been dedicated to eliminating re-gional disparities. In its preamble, the EEC Treaty mentions
the objective of the six founding states “to strengthen the unity of their economies and to ensure their harmonious de-velopment by reducing the differences existing between the various regions and by mitigating the backwardness of the less favoured”. The EU’s regional and structural policies and other territorially effective programs that are collectively re-ferred to here as cohesion policy have changed significant-ly over time. Following important landmarks of (2.3.1) cohe-sion policy reforms, it is necessary to examine the de facto (2.3.2) development of territorial inequality in the eight coun-tries considered in Chapter 3.
2.3.1 COHESION POLICY REFORMS
The desire to achieve socioeconomic cohesion grew parallel to market integration and Community enlargements. After disparities widened with the inclusion of Ireland, Great Brit-ain and Denmark, the European Regional Development Fund (ERDF) marked the start of a supranational regional policy of its own in 1975. It was not until after the southern enlarge-ment to include Greece, Spain and Portugal and the linkage with the internal market project at the end of the 1980s that cohesion policy (often also referred to as structural and/or regional policy) gained shape. This was particularly formed by the transition from measure-oriented support policies to the structure of multi-year support programs practiced to this day, as well as the significant increase in the financial resources made available (Becker 2020a: 874).
Among the six founding states of the ECSC, economic and social indicators were still largely homogeneous, with the exception of the Italian Mezzogiorno (cf. Fina/Heider/Prota 2021: 5f.). It was only with the accession of the relatively poorer countries Ireland, Greece, Spain and Portugal in the 1970s and 1980s that the need for the EU’s own cohesion policy grew considerably. According to Peter Becker (2020a: 876f.), the establishment of supranational structural and re-gional policies gained significant impetus as a balance was sought for conflicting national interests.
Figure 6Risk of poverty or social exclusion as per cent of population, selected countries and years
Source: https://ec.europa.eu/eurostat /databrowser/view/t2020_50/default /table?lang=en.
2009 2012 2016 2019
Finland 16.9 17.2 16.6 15.6
Germany 20.0 19.6 19.7 17.4
France 18.5 19.1 18.2 17.9
Sweden 17.8 17.7 18.3 18.8
European Union 23.3 24.8 23.5 21.4
Estonia 23.4 23.4 24.4 24.3
Spain 24.7 27.2 27.9 25.3
Italy 24.9 29.9 30.0 25.6
Romania 43.0 43.2 38.8 31.2
11INEqUALITY AS A EUROPEAN PHENOMENON

Since the negotiations on the completion of the Single Mar-ket in the Single European Act (SEA) at the end of the 1980s at the latest, the issue within the EEC has been, on the one hand, about support payments for poor new members who feared being cut off from the deepening of integration. On the other hand, it was about compensations for rich new members who expected a share of their net payments back into the EU budget through the instruments of cohesion pol-icy. In the next rounds of enlargement, the required funds and funding targets grew in accordance with this scheme, as did the funding for specific regions. In addition to the classical categorisation of less developed regions (up to 75 per cent of the Community GDP average), transition regions (between 75 and 90 per cent of GDP) and more developed regions (over 90 per cent of GDP) in ESF and ERDF, outermost regions were included after the enlargement to Sweden and Finland in 1995. Already in the course of the negotiations of the Maastricht Treaty, a new source of regional funding was introduced in the form of the Cohesion Fund. After the eastward enlargement of the EU, between 2007 to 2013, the Multiannual Financial Framework (MFF) allocated more funds than ever before to policies to promote cohesion in the Community, at 35.7 per cent of the total European budget (Hartwig 2020: 551).
The benefits of cohesion policy for the acceding states Ire-land, Spain and Portugal became measurable in their lagging and catching-up economic development towards the Euro-pean average until the euro crisis and are considered success stories. However, the debate on promoting regional develop-ment made a striking turn after the largest round of enlarge-ment with 13 new member states in 2004, 2007 and 2013. Even if their convergence efforts for GDP per capita can be described as a positive development overall (Dauderstädt 2014: 13ff.), the socioeconomic differences between old and new member states pose a considerable challenge to the creation of the Union’s economic, social and territorial cohe-sion (Art.3 (3) TEU), which has been an objective since the Maastricht Treaty. The year 2013 saw a significant reorienta-tion of cohesion policy that had been precipitated by new financial distribution conflicts between countries and groups of countries in the face of growing inequality in the Union. This was especially so after following the accession of the two large states Bulgaria and Romania, which lagged far be-hind in many economic and social indicators.
This reform was described as the “most significant and sub-stantial set of regulatory changes” since the innovations in the wake of the European Economic Area (EEA) by John Bachtler et al. (2017: 1). The reform enforced a streamlining of regional policies with objectives of European economic governance. The above-mentioned target provisions of the treaties continue to apply, but their demand for more cohe-sion is complemented by objectives of growth, competitive-ness, effectiveness, and budgeting. The priorities of the ten-year growth strategy Europe 2020 have applied since the funding period starting in 2014. After 2020, the provisions of the integrative policy coordination cycle European Semes-ter will apply to all branches of cohesion policy. Newly intro-duced conditionalities tie the disbursement of funds to the fulfilment of partially non-disciplinary performance achieve-
ments of the member states in economic policy. The control of the use of funds was increased and the required applica-tion and reporting system was restructured. Becker (2020a: 875) states, “the European Structural Funds now entered the service of closer economic policy coordination and were to be harnessed to achieve common economic and employ-ment policy goals and increase the competitiveness of Euro-pean economies” (own translation).
The broader use of cohesion policy was set in motion through the basic eligibility of all EU regions, linkage with overarching goals of the EU, as well as the approach for a more efficient and effective use of financial resources. At the same time, convergence between poor and rich regions was downgrad-ed to a secondary objective below the focus on other politi-cal Union priorities. In this context, conditionalisation is a powerful political lever: Member states are obliged to take the challenges described in the national reform program and the country-specific recommendations (CSRs) of the Euro-pean Semester into account. This linkage is to be reviewed several times in the funding period starting in 2021. The Commission can require adjustments in all funding programs if the economic governance procedures are not followed and can order a suspension of payments if the member state fails to act or if “the Commission finds that the proposal fails to address its reprogramming request, or the proposed changes are not correctly reflected in the Partnership Agreement and programmes, or they are not ambitious enough” (European Commission 2014: 10).
Measured against the need for a dedicated European finan-cial capacity that is capable of political steering down to the regional level of the member states, the integration of cohe-sion policy into the development of a “European economic process policy” (Becker 2020b: 22) appears to be a sensible approach. For the funding period 2021 to 2027, the Commis-sion defines five overarching objectives for investments, in-cluding digitalisation, climate change and the energy tran-sition off fossil fuels, network expansion, social policy, and proximity to citizens, with priorities (65 to 85 per cent of re-sources) in the area of “smarter” and “greener, CO2-free Eu-rope.” The allocation of resources in the future will also sup-plement the familiar criterion of GDP per capita according to three levels of development with other indicators, such as youth unemployment, education levels, climate change, as well as migration and integration. This may lead to more tar-geted allocations, but at the same time increases complexity and opens the field for special payments beyond the singular goal of convergence.
2.3.2 DEVELOPMENT OF TERRITORIAL INEqUALITY
Statistical distinctions are made at various levels in the EU according to the Nomenclature des unités territoriales sta-tistiques (NUTS). While NUTS 0 represents the nation states and NUTS 1 summarises larger regions within the member states, NUTS 2 makes it possible to depict even smaller geo-graphical units, often identical to local administrative bodies. For the eight countries considered in chapter 3, a socioeco-
12FRIEDRICH-EBERT-STIFTUNG – POLITICS FOR EUROPE

Figure 7Regional gross domestic product (PPS per inhabitant) by NUTS 2 regions, selected countries
Geopolitical entity (reporting) / Time: 2019 / Time frequency: Annual / Unit of measure: Purchasing power standard (PPS, EU-27 from 2020), per inhabitant in percentage of the EU-27 (from 2020) average.Source: https://ec.europa.eu/eurostat /databrowser/view/tgs00005/default /map?lang=en.
Leaflet | Administrative boundaries: ©EuroGeographics ©UN-FAO ©Turkstat, Cartography: Eurostat - GISCO, 2019
Legend
≥ 44 to 65≥ 65 to 75≥ 75 to 90≥ 90 to 110≥ 110 to 125≥ 125Data not available
nomic indicator and an indicator related to life chances will now be analysed in detail at the NUTS 2 level.
Figure 7 shows regional per capita income in purchasing power standards (PPS) 2019 and clearly highlights the ine-qualities within the eight selected countries. According to this chart, the richest regions in Europe (over 90 per cent of EU GDP per capita) include all of Sweden and Finland; all of southern and western Germany except for the administrative district of Lüneburg, as well as the metropolitan regions of Berlin, Leipzig and Dresden in the east; northern and central Italy except for Umbria; northeastern Spain, Madrid and the Balearic Islands; southwestern and southeastern France, Île de France, Pays de la Loire and Alsace3; in Romania, the capi-tal region of Bucharest. They are all above the European av-erage, in some cases far above it, such as Hamburg (195 per cent), Upper Bavaria (173 per cent), Île de France (177 per cent), Stockholm (166 per cent) or Bucharest (160 per cent).
3 The French overseas territories Guadeloupe, French Guiana, la Réunion and Mayotte will not be considered in the following.
The areas with below-average per capita income, albeit with widely varying differences, are all of Estonia; large parts of eastern Germany; all areas in central France and many in northern France as well as Corsica; north-western and south-ern Spain, the Canary Islands and the North African enclaves of Ceuta and Melilla; all of southern Italy, Sardinia and Sicily; in Romania, all other regions outside the capital. Particularly far from the European average are the Italian regions of Sicily (58 per cent), Calabria (56 per cent), Campania (61 per cent) and Puglia (62 per cent), and in Romania, the three southern and the two northern regions (between 44 per cent and 64 per cent).
It is striking that the regions of the national capitals perform better than many regions in the country in seven of the eight cases4 considered here, as well as the very pronounced wealth gaps in Germany (east-west), Italy and Spain (north-south) and France (centre-periphery).
4 Estonia is considered as a single entity on NUTS 2 level.
13INEqUALITY AS A EUROPEAN PHENOMENON

Looking at the data on per capita income over time until 2019 and filtering for sharp changes (+ / − 10 percentage points), we see a significant decline compared with the pre-crisis level of 2008 (see figure 8) in all but three regions of Spain and Italy, but also in all but one region of Sweden and in more than half of the Finnish regions. The situation improved significantly in the years following the end of the euro crisis in 2015 for the two Scandinavian countries as well as for Italy and Spain, since the downward trend could be halted in most regions. The remaining regions with decreas-ing GDP p.c. between 2015 and 2019 are all regions that maintained high income levels even after the most recent de-cline: Bremen (144 per cent), Hamburg (195 per cent), Rhein-hessen-Pfalz (110 per cent), the Åland Islands (116 per cent), Stockholm (166 per cent) and western Sweden (115 per cent). However, there have been no striking improvements in the income situation in the majority of the regions considered here over these four years: Except for the administrative dis-trict of Braunschweig (2019: 146 per cent), this remains the case for six out of eight regions in economically catching-up Romania.
Instead, stability prevails. A prime example are the 22 French regions, all of which show neither conspicuous upward nor downward mobility in the period analysed. In both the short and longer term, Germany stands out: here, too, very few regions show drastic changes in per capita income.
Looking at the overall picture back to 2008, apart from all Eastern European regions, the only regions that succeeded in significantly improving their respective income positions were in Germany the Upper Palatinate (2019: 126 per cent), Upper Franconia (114 per cent), Berlin (123 per cent) and Braun-schweig (146 per cent). The reasons for this cannot be identi-fied across the board. This is similarly true for the few regions not losing (but also not gaining) in the period under review, namely Galicia (2019: 82 per cent), Castilla y León (86 per cent) and Extremadura (67 per cent) in Spain, South Tyrol (155 per cent), Puglia (62 per cent) and Basilicata (75 per cent) in Italy, Southern Finland (99 per cent), Northern and Eastern
Finland (93 per cent) and Övre Norrland (115 per cent) in Swe-den, for which no clear pattern of development emerges.
In the NUTS 2 breakdown, we can look at the average life expectancy of both sexes together in the region (see figure 9). In the eight countries considered here, life expectancy in 2019 varies between 74.4 years in south-eastern Romania and 85.8 in the capital region of Madrid. However, the maxi-mum difference of more than eleven years quickly melts away when Western and Eastern Europe are considered sepa rately. Among the eight countries, Romania alone still has regions with life expectancies of less than 76 years. The centre, the southwest and the Bucharest region are already above 76, Estonia at 79. Between the Western European re-gions, the maximum gap is just under 6 years, starting with Saxony-Anhalt in Germany with a life expectancy of 80. The highest life expectancies above 84 years can be found in the Mediterranean countries, especially in northern Spain and Madrid, the Balearic Islands and the Canary Islands, northern and central Italy, as well as in the Rhônes-Alpes region, Cor-sica and Île de France.
In Spain and Italy, life expectancy tends to decrease towards the southern regions of both countries; in France, Germany and Sweden, the trend is in the opposite direction. While most of the regions considered here have the expectation of over 82 years, this does not apply to two regions in Finland (north-eastern and southern Finland) and four regions in France immediately north of the Île de France and most re-gions in Germany. Here, only seven regions in the German states of Bavaria, Baden-Württemberg and Hesse show a life expectancy of more than 82 years.
The differences in average life expectancy correspond in part to the previously considered income ratios (for example, in Spain, Italy, Romania), but this remains insufficient as an ex-planatory factor and shows numerous deviations. In order to explain life expectancy, a large number of factors have to be taken into account; a view based purely on individual average income does not go far enough. If we look at the develop-
Figure 8Number of NUTS 2 regions with strongly changing GDP per capita, selected countries
Source: Eurostat data as in figure 7 / own calculations. No data for France 2008 available.
Countries: number of NUTS 2-regions
2019 improvement of 10 or more percentage points compared with 2008/2015
2019 improvement or deterioration by max. 9 percentage points compared
with 2008/2015
2019 deterioration by 10 or more percentage points compared with 2008/2015
Germany (DE): 38 4 / 1 30 / 34 4 / 3
Estonia (EE): 1 1 / 0 0 / 1 0 / 0
Spain (ES): 19 0 / 0 3 / 19 16 / 0
France (FR): 22 – / 0 – / 22 – / 0
Italy (IT): 21 0 / 0 3 / 21 18 / 0
Romania (RO): 8 8 / 6 0 / 2 0 / 0
Finland (FI): 5 0 / 0 2 / 4 3 / 1
Sweden (SE): 8 0 / 0 1 / 6 7 / 2
14FRIEDRICH-EBERT-STIFTUNG – POLITICS FOR EUROPE

Figure 9Life expectancy by NUTS 2 regions, selected countries
Geopolitical entity (reporting) / Time: 2019 / Time frequency: Annual / Unit of measure: Year / Age class: Less than 1 year / Sex: Total.Source: https://ec.europa.eu/eurostat /databrowser/view/tgs00101/default /table?lang=en.
Leaflet | Administrative boundaries: ©EuroGeographics ©UN-FAO ©Turkstat, Cartography: Eurostat - GISCO, 2019
Legend
≥ 74.4 to 76≥ 76 to 80≥ 80 to 82≥ 82 to 83≥ 83 to 84≥ 84Data not available
ment of life expectancy over the relatively short period of eleven years between 2008 and 2019, it becomes clear that it has increased in all regions of Finland and Estonia, in six of eight regions of Romania, in 16 of 19 regions of Spain and in ten of 21 regions of Italy, with values of two years or more. Only three French and Swedish regions each are in the group of life expectancy increases of more than two years; not a single German region makes it among them.5 While the highest increases in Estonia (plus 4.6 years) and Romania (southwest plus 3.5; northwest plus 2.7) can presumably be explained to a large extent by the transformation of the health and social systems, those in the capital region of Ma-drid (plus 2.9), on the Balearic Islands (plus 2.8) and in the North African enclave of Melilla (plus 2.6) are probably strongly due to immigration.
5 The highest increase can be found in the region Upper Franconia (plus 1.7 years). No comparable data to 2008 was available for the regions Chemnitz and Leipzig.
2.4 INTERIM CONCLUSION: WEAK SOCIAL STANDARDS AND INTERRUPTED PROCESSES OF CATCHING-UP
“Nobody falls in love with a single market” was the phrase used by former Commission President Jacques Delors (term of office: 1985–1995) to describe an explicitly political design and social framing of economic integration projects. This gave rise to the Social Protocol of the Maastricht Treaty, which formulated new employment and social policy Com-munity tasks. But European-guaranteed labour and social standards remain insignificant when pitted against the im-portance of the internal market freedoms and the stability rules of EMU. Since the 1990s, the Union has suffered great-ly from its asymmetry between market-creating and mar-ket-shaping integration.
In this context, policy coordination as a bracket between the demand for common policies and the desire of nation-states to protect their own sovereignty has not been helpful in establishing a European social model. The construction of numerous coordination cycles with initially good intentions
15INEqUALITY AS A EUROPEAN PHENOMENON
proved to be too weak to reconcile the predominance of neg-ative integration with approaches of positive integration. On the contrary, under its President José Manuel Durão Barro-so (term of office: 2004–2014), the Commission transformed the Lisbon Strategy into an instrument to stimulate pro-com-petitive structural reforms, low tax and contribution systems, financial market liberalisation, labour market flexibilisation and social security reform according to the criterion of finan-cial sustainability. The market- and competition-oriented un-derstanding of all policy areas converging in the coordination cycles concurrent with the heyday of the globalisation eupho-ria. The focus on economic growth and “jobs, jobs, jobs” (Kok 2003) also explains why the Commission did not see or did not want to see the formation of the serious macroeco-nomic imbalances between the euro states in the 2000s: Af-ter all, the later crisis states Ireland and Spain delivered high growth rates and Germany implemented pro-competitive structural reforms. For a long time, the ever-widening gap in unit labour costs and inflation rates between these and other countries was not perceived as a central problem of the EMU. Its architecture as a stability union without balancing fiscal instruments already holds an internalised concept of an inten-sified competitive system among member states. The euro crisis saw the culmination of the systemic deficits of the mon-etary union, but the competition paradigm is already so well entrenched that crisis management wrongly implements a structural policy approach to a cyclical economic slump with austerity policies. This artificial prolongation of the crisis leads economically to the deepening of social disparities and a “wasted decade” for the EU (Herzog-Stein et al. 2020: 18).
But until this was critically scrutinised across the board and cautiously corrected in Brussels under the aegis of Commis-sion President Jean-Claude Juncker (term of office: 2014–2019), cohesion policy was already aligned with the goals of growth and competitiveness. Policy coordination, which has long since been put on track, will henceforth serve as a benchmark here: regional funding can only be disbursed only if the objectives of national economic governance are met. This not only downgrades the original objectives of cohesion policy, it also creates potential for conflict between central government and regional authorities. For the MFF 2021 to 2027, the conditionality of the inflow of funds will be further sharpened, but at the same time cohesion policy will be placed on a broader footing by linking it to five overarching policy objectives and going beyond per capita income to in-clude social, educational, climate and environmental protec-tion and immigration-related indicators.
The sobering fact is, that even among the six founding mem-bers of the ECSC, the differences could not be levelled out in 70 years despite ongoing convergence processes. Rather, the euro crisis made clear how uncertain and reversible conver-gence developments are in the EU. In its assessment of the pandemic’s socioeconomic impact on the European regions, the European Commission (2021a: 100ff.) concludes that the increasing disparities observed over the last 15 years are expected to widen. This raises the question of whether the Community is well positioned with its instruments and pro-cesses to prevent divergence and adequately promote con-vergence?
16FRIEDRICH-EBERT-STIFTUNG – POLITICS FOR EUROPE

3
REGIONAL DISPARITIES IN COMPARISON
Due to the diverse socioeconomic contexts within the EU, analysis of regional developments is constantly confronted with the problem of clearly identifying causal relationships and their generalised applicability. Regionally specific phe-nomena such as an inhospitable geography, extreme cli-mates, and natural disasters, the existence of special mineral resources, historical disadvantages and national boundaries or population density are just some of the many factors that can explain certain developments in a given region. More-over, they often provide inadequate information about their relevance when it comes to the impact of financial crises, transformation processes resulting from industrialisation or deindustrialisation, the expansion or decline of the social welfare state, emigration and immigration, and many other politically processed and/or motivated events. As the last chapter of this study has shown, the possible interactions of various factors and their effect on regional development must be analysed in the context of local conditions to avoid drawing premature conclusions or comparisons. The NUTS 2 level statistical classification has proven to be only partly use-ful for this purpose, especially when the efficacy of cohesion policies and related European policies are the key interest: “[T]he NUTS 2 level, at which eligibility and financial allo-cations are largely determined, may not be the appropriate level at which to capture policy effects using spatial econo-metric techniques” (Fratesi/Wishdale 2017: 819). The situa-tion is compounded by the seemingly arbitrary demarcation of European regions on the NUTS 2 level: Sometimes it cor-relates to individual administrative areas and local authorities, though sometimes they have been grouped together in ways that do not play an independent role in the real political- administrative operation and in relation to the economic, so-cial and other local challenges.
In a study for the European Parliament Committee on Region-al Development (REGI), Marta Pilati and Alison Hunter (2020: 30) call for greater sensitivity to the diversity of regional devel-opments that often tend to pass under the radar of EU politi-cal decision makers. Greater sensitivity to regional and locally specific phenomena not only requires an in-depth statistical analysis; it also requires the inclusion of socioeconomic devel-opment indicators that go far beyond simply examining in-come development. It is only by taking into consideration the respective national and regional situations, developments, in-stitutions and actors in different areas of economic and social relevance that an adequate approach to the existing hetero-geneity in Europe will be possible (Crescenzi/Giua 2017: 22).
Accordingly, it is advisable to apply a multidimensional cluster analysis, which – inasmuch as data availability allows – oper-ates on the lowest regional statistical level. In an optimal scenario, these would be the local administrative units of mu-nicipalities (Local Administrative Units, LAU) or – on a slightly higher level – the NUTS 3 areas of smaller regions and larger cities. This is where the FES/FEPS Project on regional dispar-ities applies, though it is limited by the availability of data. The selected indicators are comprised of five dimensions for measuring equality/inequality in all eight study countries and their regions: (1) economy, employment and job market, (2) educational and development opportunities, (3) prosperity and health, (4) state intervention and participation, (5) inter-nal migration. However, the individual indicators for these five dimensions differed from country to country, which is due to the availability of data and also national and regional specifics that rule out some criteria for certain correlations, or which make them seem meaningless. Below we will first provide an overview (3.1) of the results of the eight country studies, by means of which the scale of the differences will become clear. We will then draw up models (3.2) of regional disparities by identifying similar problem areas.
3.1 RESULTS OF THE COUNTRY STUDIES
3.1.1 REGIONAL DISPARITIES IN GERMANY
In the cluster analysis (cf. Fina et al. 20196) with indicators from the aforementioned five dimensions of inequality, five clear types can be identified on a regional level. These can be summarised in three categories:
A. Dynamic large and medium-sized cities with exclu-sion risk (dark green) / strong urban environs (light green): 36.4 million people live in these areas, which is 44 per cent of the population. Geographically (see fig-ure 10) these islands of wealth predominate in southern Germany, however they can be found in and around many cities all over the country. These areas have the highest national levels of wealth, life expectancy (82 years), gross monthly salary (3,534 euros) and voter par-
6 The detailed description of the indicators used, the data sources and statistical calculation methodology can be consulted directly in the country study.
17REGIONAL DISPARITIES IN COMPARISON

ticipation (80.2 per cent). These regions are attractive due to their sustainable job markets and above average infra-structure. However, this success brings with it a tangible risk of rising living costs and correspondingly, increasing social disadvantage, especially in large cities (child pover-ty: 18 per cent, old-age poverty: 4.3 per cent).
B. Germany’s solid centre (ochre): Of note on the dis-parity map are the large areas in the west of the country and the areas surrounding Berlin. These areas are home to 32.8 million people, or just under 40 per cent of the total population. The indicators measured in the five dimensions are generally in line with average values in Germany, however the proportion of highly qualified employees is lower (10.2 per cent vs 13.5 per cent Ger-man average).
C. Suburban regions undergoing constant structural change (dark violet) / rural regions facing constant structural crisis (light violet): These disadvantaged re-gions, home to 13.6 million people live (around 16 per cent of the population), are experiencing rural flight as many people move to the more dynamic mid-sized and larger cities (migration balance over 200 people per 100,000 residents). Large areas of eastern Germany are still suffering from the loss of entire industrial sectors and jobs as a consequence of reunification. The infra-structure in these regions is relatively poor (broadband internet: 59 per cent; proximity to a family doctor: 6.8 min.) and gross monthly incomes are low (2,464 euros). In the former West German mining and heavy industry
areas by the rivers Rhine and Ruhr, as well as in Saarland, Bremen and Bremerhaven, structural change is clearly evident in the high debt burden of municipal budgets (6,373 euros) and high rates of child poverty (27.2 per cent).
Although Germany is in international comparison (cf. chap-ter 2.2.4) the most prosperous of the eight countries in the study and has hardly been affected by the financial crises of recent years, it nonetheless exhibits significant domestic disparities. Despite what the analysis on NUTS 2 level (cf. chapter 2.3.2) suggests, there is not only evidence of an East-West and North-South divide. In addition to the wealthy regions of southern Germany and the East German federal states still struggling with post-unification transformation, important differences are evident: In the north and the east there are numerous cities and metropolitan regions that are structurally dynamic in a positive sense (category A, dark green). Despite the wealthy southern federal states, some areas in western Germany are still dealing with major struc-tural challenges, e.g. the loss of its heavy industrial base. In disadvantaged regions, the risk of progressive depopulation due to a lack of employment prospects is a virulent problem. Even in the “solid centre” the shortage of qualified workers is a growing problem. Moreover, one of the downsides of success in the affluent cities and metropolitan regions is a growing risk of social exclusion due to increasing living costs caused by an ongoing population influx.
3.1.2 REGIONAL DISPARITIES IN ESTONIA
In this small Baltic country, four spatial types of socioeco-nomic disparity (cf. Fina/Heider/Masso 20217) are evident. These can be summarised in two distinct categories:
A. Flourishing regions and islands of wealth (dark green) / The better-off Estonia (light green): 680,000 people or around 51 per cent of the Estonian population lives in areas in which the socioeconomic situation is above the national average. They are concentrated geo-graphically (cf. figure 11) on several island locations in the Baltic Sea, areas adjacent to large and medium sized cities, and close to the Alutaguse national park region in the extreme north-east of the country. Among the met-ropolitan regions, the only one that is doing very well is the capital city Tallinn and its environs. Along with a few of the islands and the national park, it has the highest gross monthly income (1,604 euros), the highest voter participation in local elections (61.3 per cent), a low unemployment level (4.2 per cent) and a low number of early school leavers (3.8 per cent). However, this ac-counts for only around 100,000 people. This can also be explained by the fact that the capital city, and also the country’s second largest city Tartu, cannot be counted among the most affluent clusters. Due to their broad social spectrum they belong to the second most affluent
7 The detailed description of the indicators used, the data sources and statistical calculation methodology can be consulted directly in the country study.
Figure 10Disparity map of Germany
Source: Fina et al. 2019, 6.
Berlin
Köln
Hamburg
München
Leipzig
Bremen
Dresden
EssenDortmund
Stuttgart
Hannover
Düsseldorf
Nürnberg
Frankfurta.M.
Erfurt
Münster
Hamm
Bielefeld
Kiel
Flensburg
Lübeck
Schwerin
Ulm
Bonn
DuisburgBottrop
Trier
Salzgitter
JenaChemnitzAachen
PotsdamFrankfurt
(Oder)
Rostock
Wolfsburg
Krefeld
Karlsruhe
Wiesbaden
Magdeburg
Paderborn
Hagen
Mainz
Siegen
Kassel
Augsburg
Mannheim
Ingolstadt
Braunschweig
Saarbrücken
Koblenz
Fürth
Göttingen
Darmstadt
Osnabrück
Heilbronn
Halle (Saale)
Wuppertal
Heidel-berg
Pforzheim
Würzburg
Erlangen
Hildesheim
Reutlingen
Freiburg
Konstanz
Regensburg
Passau
Oldenburg
Bremerhaven
Ludwigs-hafen
18FRIEDRICH-EBERT-STIFTUNG – POLITICS FOR EUROPE

cluster with slightly poorer socioeconomic indicator val-ues than the “islands of wealth”. Both clusters are attrac-tive to outsiders and demonstrate positive balances of internal migration.
B. Shrinking regions with socioeconomic problems (ochre) / Hot spots of long-standing structural dis-advantage (violet): Large parts of rural Estonia and also the largest island Saaremaa are below the national average in many socioeconomic indicators. For the over half a million people who live in these regions (ca. 49 per cent of the population), employment prospects are worse than they are in close proximity to large towns and cities. Many Estonians leave these regions which re-sults in a lower number of highly qualified workers (25.1 per cent) and an ageing population (dependency ratio: 60.3 per cent). These regions are at risk due to transfor-mation processes, for instance when mining or other industries are shut down and digitalisation pushes out traditional trades. Examples of this process can be seen in four municipalities in the north-east of Estonia: In the third-largest city of Narva, the textile manufacturer Kreenholmi that once employed thousands of workers went bankrupt in 2010. Here we can observe two types of transformation processes at work: The structural transformation of economic sectors as well as the after-math of Estonian independence from the USSR in 1991. The roughly 100,000 citizens in these municipalities, which score poorly in almost all socioeconomic indica-tors, make up a high proportion of the once privileged Russian minority in the country who now experience problems finding work (unemployment level: 9.7 per cent) and earn relatively low gross monthly salaries (1,029 euros).
Overall, the regional detailed analysis of Estonia – which the NUTS 2 level cannot provide since the entire country is viewed as a whole – shows stark regional inequalities. De-spite Estonia’s impressive socioeconomic progress and its re-covery after suffering considerably in the financial crisis (cf.
chapter 2.2.4), geographic concentrations of business activity have apparently been consolidated. In terms of its popula-tion, Estonia is roughly divided in half between those regions that are prosperous and those that have been left behind. Tallinn and a few other mid-sized cities and their environs function as economic hubs and attract people from other parts of the country – which then fall back even further – by offering opportunities of increased prosperity.
3.1.3 REGIONAL DISPARITIES IN SPAIN
Four spatial clusters have been identified in Spain (cf. Colino et al. 20208) that are defined on an administrative level in the 17 autonomous communities as well as the two autono-mous cities of Ceuta and Melilla.9
A. Affluent Spain (dark blue): This includes the region around Madrid, the Basque Country, Navarre and Cata-lonia (cf. figure 12). Around 17 million people live in these regions, which is roughly 36 per cent of the popu-lation. Per capita incomes are highest here and are far above the national average (between 120 and 135 per cent). The proportion of highly qualified employees is high, and unemployment comparatively low. These four wealthy regions are particularly attractive due to the job opportunities afforded by their strong economies – the Basque Country and Navarre (except La Rioja) have the highest national employment rates in industrial sectors – and appeal to many Spaniards from other regions of the country. As a consequence, there is a positive migra-tion balance. This applies to Catalonia in particular. As the country’s largest cities, Madrid and Barcelona are especially attractive for jobseekers. The downside of the
8 The detailed description of the indicators used, the data sources and statistical calculation methodology can be consulted directly in the country study.
9 This corresponds to the NUTS 2 classification; a more detailed analysis was not carried out for Spain.
Figure 11Disparity map of Estonia
Source: Fina/Heider/Masso 2021, 8.
!
!
!
!
!
!
!
!!
!!
!
!
!
!Tartu
TallinnTallinn
Võru
JõhviKeila
Valga
Pärnu
NarvaMaardu
Rakvere
Sillamäe
Haapsalu
ViljandiKuressaare
Kohtla-Järve
19REGIONAL DISPARITIES IN COMPARISON

increasing concentration of people in these megacities is a reduction of life quality due to increasing poverty and exclusion (around 20 per cent in both regions compared to 6–7 per cent less in Navarre and the Basque Country) as a consequence of the rising cost of living.
B. The affluent north of Spain and Cantabria (me-dium blue): Six regions in the northern half of the coun-try form this category, in which 8.3 million people live (almost 18 per cent of the population). The standard of living in these wealthy regions is high, which is reflected in the high quality of public services. Expenditure on public education and healthcare is higher than the na-tional average, unemployment is lower than in the coun-try as a whole, and the risk of poverty and social exclu-sion is only slightly higher, and in some regions actually lower than in the most affluent category (between 14.4 per cent in La Rioja and 22.6 per cent in Galicia). In all six regions, industry accounts for a significant proportion of the gross value added, namely between 20 and 30 per cent. However, with the exception of Asturias and Can-tabria, the proportion of highly qualified employees is very low (below 40 per cent). Although these regions are affluent, they are afflicted with socioeconomic problems and are therefore only attractive to a limited extent: Whereas in 2017 Cantabria, Aragon and La Rioja experi-enced little inward migration, there was a high rate of emigration from Castile and León and Asturias, as well as a low negative migration balance in Galicia.
C. Mediterranean Spain (sea blue): The Balearic Islands and the regions of Valencia and Murcia form their own cluster with a total of 7.6 million inhabitants (ca. 16 per cent of the population). They differ from the autono-mous communities in the north in that they have a slightly lower income per capita and higher rates of
unemployment – though the Balearics are slightly above the national average in both indicators and the other two regions are well below (2017 under 90 per cent of the GDP per capita and around 17 per cent unemploy-ment). The proportion of university graduates in the ac-tive workforce is relatively low compared with most oth-er regions. These results can be explained by the special importance of the tourism industry for economic devel-opment: There are few positions available for highly qualified employees in tourism-related services and the job opportunities are seasonally dependent. Whereas Valencia and Murcia have an industrial core with about 20 per cent value added, in the Balearics this sector ac-counts for just 7.2 per cent and jobs in the service sector make up almost 86 per cent, which is the highest in Spain; almost 80 per cent of employed people work in this sector. The high quality of life and the (seasonally dependent) good employment opportunities result in a positive net migration rate.
D. Poor Spain (light blue): This includes the southern re-gions of Castilla-La Mancha, Andalusia and Extremadu-ra, as well as the Canary Islands and the north African enclaves of Ceuta and Melilla. Almost 14 million Span-iards live in these regions (around 30 per cent of the population), which lag far behind in terms of per capita income. As of 2017, the unemployment rates were very high, with up to a quarter of the working-age popula-tion without jobs, high rates of early school leavers, and few highly qualified workers. In Extremadura and Anda-lusia, the percentage of people working in agriculture and fisheries is the highest in the country (8.9 per cent and 6.8 per cent respectively) whereas the industrial sector accounts for under 15 per cent of all jobs. The risk of poverty and social exclusion is higher in these regions than anywhere else in the country (between 29 and 44
Source: Colino et al. 2020: 60.
Figure 12Disparity map of Spain
20FRIEDRICH-EBERT-STIFTUNG – POLITICS FOR EUROPE
per cent in 2017). Broadband internet coverage for nor-mal households is below the national average (76.09 per cent), with the worst coverage in Extremadura (48.44 per cent) Voter participation is relatively low in all these regions and emigration rates are very high in all areas except the Canary Islands.
Overall, it can be observed that there are very different paths of development in the autonomous regions of Spain. Since the 1980s there has been a reduction in inequality resulting from sporadic urbanisation and industrialisation by means of political decentralisation in the course of greater democ-ratisation as well as the support of the European cohesion policy. More recently, however, there has a been a growth of high inequality due to the financial crises of recent years (cf. chapter 2.2.4). Although the whole of Spain has fallen far below the average socioeconomic rating in the EU due to these crises, the differences between its national regions have become even more stark. However, the cluster analysis does not present a clear division between the rich north and the poor south, but rather diverse lines of conflict between the growing metropolitan regions of Madrid, Catalonia and Bilbao on the one hand and the sparsely populated regions suffering intensified outward migration including Extrema-dura, Castile and León or Castile-La Mancha on the other hand. In addition, the economic structure differs considera-bly between those regions with a strong industrial core in the north and Castile-La Mancha, a few regions in the south, in Aragon and Galicia still characterised by primary sector in-dustries, as well as a two-tier service sector which is domi-nated by finance in and around Madrid and Barcelona, and by tourism in many Mediterranean regions and the Spanish islands. As in many other countries, the different regions of Spain must confront the issues of increasing urbanisation, deindustrialisation and an anachronistic agricultural sector without falling victim to low economic growth, a decline in education and quality of life, and increased rates of outward migration.
3.1.4 REGIONAL DISPARITIES IN FINLAND
In Finland, four geographical types of socioeconomic cir-cumstances have been defined (cf. Fina/Heider/Matila et al. 202110). These can be summarised in three categories:
A. Prospering capital region and urban catchments (dark green) / urbanised areas with risks of social exclusion (light green): This encompasses the majority of the Finnish population – almost 4 million people or 72 per cent of the total. These affluent regions are all geo-graphically located (cf. figure 13) in and around large and mid-sized cities. Their respective locations – be it on the coast or in the country’s interior – seem to be irrele-vant in terms of their prosperity. The cities form the basis for highly dynamic economies and positive employment trends, which benefits the surrounding regions due to
10 The detailed description of the indicators used, the data sources and statistical calculation methodology can be consulted directly in the country study.
spill-over effects and the influx of commuters to outly-ing areas. The region around the capital city, as well as the suburban areas around Vaasa, Turku, Tampere, Kuo-pio and Joensuu have above-average indicators: The em-ployment rate is 76.8 per cent, the median gross annual income is 41,367 euros and the poverty risk for children is low at 8.2 per cent. Both of these clusters are attractive for companies looking for new locations especially since the proportion of highly qualified workers is around 20 per cent. The infrastructure in these successful regions is well developed (over 70 per cent of all households have broadband internet). The downside to these generally positive developments is that living costs are rising, espe-cially in large cities, due to economic growth. These rising costs can lead to an increased risk of social exclusion. An early indicator of problems on the housing market is, for example, an increase in mortgage costs.
B. Average Finland (ochre): These areas form a semi-cir-cle spanning the south of the country, over its western border up to the sparsely populated north. The roughly one million people (around 17 per cent of the popula-tion) who live in these areas are at, or slightly above, the national average in all the examined indicators. The me-dian gross annual income is 33,477 euros per year and the employment rate is quite high at 73.8 per cent.
C. Lagging areas (violet): Only around 600,000 people (ca. 11 per cent of the population) live in the border re-gions of eastern Finland and the many rural, often inhos-
Figure 13Disparity map of Finland
Source: Fina/Heider/Matila et al. 2021, 13.
Espoo
Tampere
KuusamoKemi
Raahe
Iisalmi
Kokkola
Kajaani
Oulu
Pori
Kotka
Kuopio
Mikkeli
Kouvola
Joensuu
Jyväskylä
Rovaniemi
Lappeenranta
Vantaa
Helsinki
Vaasa
Lahti
Turku Espoo
Tampere
Kemi
Raahe
Iisalmi
Kokkola
Kajaani
Oulu
Pori
Kotka
Kuopio
Mikkeli
Kouvola
Joensuu
Jyväskylä
Rovaniemi
Lappeenranta
Vantaa
Helsinki
Vaasa
Lahti
Turku
Kuusamo
21REGIONAL DISPARITIES IN COMPARISON

pitable regions of the country. Alongside agriculture and tourism, conventional industries such as mining can be found in these regions. As these areas become less rele-vant for the economy, employment opportunities de-crease, and the employment rate is currently below the average at 67.1 per cent. The high dependency ratio (84.8 per cent) and the above average percentage of people working in the medical sector are indicators of an ageing population. The proportion of highly qualified workers is low at just over 10 per cent, since many young people leave these areas to seek better opportunities in other parts of the country. What remains is an ageing popula-tion that is poorly prepared for a transformation to service industries and the digital economy (broadband internet: 43.3 per cent) in areas which, in some places, have infra-structure that is oversized in relation to the population.
Taken as a whole, Finland today seems to be a prosperous country. Despite a comparatively late period of industrialisa-tion and a difficult period economically in the 1990s, it now has a well-developed welfare state that provides a good safe-ty net in the course of new transformation processes. Conse-quently, the degree of inequality is quite low across the whole country, and the majority of Finns enjoy a good to very good quality of life. Even those areas with average qual-ity of life demonstrate very positive socioeconomic indica-tors. Nonetheless, Finland faces the now-familiar problems of urbanisation and rural flight observed here in other coun-tries: Many small rural communities and municipalities have obviously failed to attain the same high living standards as in the prosperous larger cities and their environs. Despite what the per capita income on the NUTS 2 level (cf. chapter 2.3.2) might suggest, large (albeit sparsely populated) re-gions in the rural and eastern part of the country could be left behind in the course of the abandonment of traditional industries and a decline in the importance of agriculture. The large cities and their surrounding regions face a different problem: Continued population growth is causing living costs to rise so quickly that low-income households (often migrants from rural areas with lower education levels) are increasingly at risk of poverty and social exclusion.
3.1.5 REGIONAL DISPARITIES IN FRANCE
In reference to France, Hervé Le Bras and Achille Warnant (2020)11 identified two central spatial types. However, the authors point out the multidimensionality of inequality and thus do not superimpose all the indicators in their study, but rather consider them complimentarily. In the following, the study is referred to in two categories, but an overall conclu-sion of the observations is made:
A. Metropolitan France: The successful regions in France include the extreme west (especially Brittany and Pays de la Loire), the Massif Central, the area south of the Ga-ronne towards the Spanish border, the Lyon metropoli-
11 The description of the indicators used, the data sources and statisti-cal calculation methodology is detailed in the country study.
tan area, Champagne south of Reims and the northern part of Alsace. Economic and social problems are quite mild in these areas (cf. figure 14a) which is mainly down to the success of its metropolitan areas. In the larger cities and their environs there is a concentration of high-ly qualified graduates, especially in Toulouse, Montpel-lier, Paris, Grenoble, Nantes, Rennes, Lyon, Bordeaux, Lille, and Strasbourg (tertiary education graduate ratio: 50 per cent). These cities and their outlying areas pos-sess a very dynamic commercial sector. They are fol-lowed by a number of mid-sized university towns: Poi-tiers, Orléans, Rouen, Aix-en-Provence, Dijon, Nancy, Besançon and Clermont-Ferrand, in which the ratio of university graduates is under 50 per cent. In many of the cities the employment situation is better than in other parts of the country, expenditure on research and devel-opment is high, the proportion of products made for export is high and the infrastructure – gauged on the
+1.2%
54.0%
+0.4%
44.0%
0.0%
36.0%
−0.4%
30.0%
−1.2%
20.0%
Figure 14 a/bDisparity map of France showing selected problem areas
Source: La Bras/Warnant 2020: 6, 8.
14b: Proportion of university-educated people among over-20-year-olds (2016)
14a: Synthesis of the four main difficult situations (young peo-ple without secondary school certificates, unemployment, poverty, single-parent families)
22FRIEDRICH-EBERT-STIFTUNG – POLITICS FOR EUROPE

people. Access to public services is very difficult in these areas.
Overall, the contrast between metropolitan and rural areas seems to be especially stark in France. This fact, and the multidimensionality of the areas of conflict and divergen-cies prevents us from identifying any clear geographical dis-parities. The presence of numerous fault lines has prompted Le Bras and Warnant (2020: 2) to speak of a “fragmented France”. It is clear that, despite the generally vibrant econo-my and comprehensive welfare state in France, there are major socioeconomic disparities. The contrast between Paris and the rest of the country – referred to the by the French themselves as “the provinces” – is not a new phenomenon but is rather a result of the historical trend towards centrali-sation. However, since the 1990s, the differences between the large cities and the rural regions have increased as a result of deindustrialisation, urbanisation, and globalisation and have been exacerbated by the financial crises of the last decade. During this time, right-wing extremism has gained a strong foothold in these disadvantaged regions: Originally only a strong force in the south, the Rassemblement Natio-nal managed to gain power in numerous electoral districts in the north and the east (Leron 2021: 4). In his book “Re-turning to Reims”, Didier Eribon (2009) describes the feel-ings of abandonment felt by many people in the French provinces and their concerns that they are not represented by the conservatives or the formerly strong socialist parties.
3.1.6 REGIONAL DISPARITIES IN ITALY
Italy can be divided into four spatial types of socioeconomic inequality (cf. Fina/Heider/Prota 202112). These can be sum-marised in three categories:
A. Regions of highest living standards with risk of social exclusion (dark green) / Dynamic city regions and affluent commuter belts of the North (light green): With almost 32 million people, about 53 per cent of the Italian population live here. About a third of them live in the economic powerhouses of the metro-politan regions in and around Milan, Genoa, Trento, Trieste, Bologna and Rome. This also includes the dense-ly populated areas of Tuscany and the Aoste Valley that benefit from borders with France and Switzerland. Apart from Tuscany and the Rome metropolitan area, all metro-politan regions are located in the north of Italy (cf. figure 15). This also applies to the areas around the prosperous cities, where the remaining two-thirds live. The dynamic economic power of the cities ensures low unemploy-ment rates (6–7 per cent) there as well as in their catch-ment areas and good infrastructural facilities, e.g. through a high supply of early childcare (between 18 and 27 per cent of children between 1 and 3 years are provided) or developed broadband internet (59 to 71 per cent of all households). The catchment areas perform
12 The detailed description of the indicators used, the data sources and statistical calculation methodology can be consulted directly in the country study.
provision of broadband internet to households – is well developed. The issue of urbanisation familiar in other countries seems to be particularly prominent in France. Referring to studies by Laurent Davezies, Nicolas Leron (2021: 3) raises the point that the 15 largest cities, each with more than half a million inhabitants (in total almost 27 million people, or ca. 40 per cent of the population), are responsible for over half of France’s economic out-put. These regions have seen a notable growth in em-ployment and the “per capita GDP is on average 50 per cent higher than the rest of the country.” Fig. 14b illus-trates that not all parts of the country profit from the growth engines of the big cities: The major beneficiary is the south-east, whereas in the rest of the country the ratio of tertiary education university graduates (marked in red here) remains sporadic. In particular in the central and northern parts of France, very few cities (such as Strasbourg, Metz, Reims and Lille) are able to stimulate and support growth. Correspondingly, the net migration rate in the northern départements is generally negative, whereas in many regions in the south and west it is posi-tive. That being said, one cannot draw direct conclusions from this in relation to the economic situation and em-ployment market. However, the economic success and attractiveness of these urban agglomerations also fuel social problems: The income gap in these areas is espe-cially large. Within the Paris metropolitan area, the most densely populated city in the EU, incomes in the western districts of the city and their adjacent suburbs are very high; east of the city centre incomes are very low, and they rise again towards the suburbs. In large inner-city areas, inequality of income distribution is reflected in the risk of poverty, which is likewise unequally distributed and exacerbated by financial crises. This phenomenon affects all the larger urban agglomerations in France on a smaller scale (Leron 2021. 3f.).
B. Empty France: In smaller towns and rural areas there is a lack of economic dynamism and jobs, however in contrast to some urban regions that have seen dramatic growth, income disparities are not as extreme. Less than 20 per cent of the inhabitants in these regions have a university degree (Leron 2021: 3) and the lack of em-ployment opportunities leads to a continuous exodus of people of working age. This particularly affects the sparsely populated areas of the so-called “empty diago-nal” that stretches from the Ardennes in the north to the southern département of Aveyron and divides France into an eastern and a western part: “The diagonal lies between two large continuous urban conglomerations […]: on the one hand the north and Paris, the west and south-west, and on the other hand the zone along the eastern border and the Mediterranean coast” (Le Bras/Warnant 2020: 10). In the former industrial heartland of the north-east, social problems have increased consider-ably as the economy has declined. Except for the larg-er cities, the south-east and south-west of the country suffer from low productivity and increased social prob-lems, making tourism a particularly important industry. In the very sparsely populated areas of the “empty diag-onal”, finding work is a major challenge for many young
23REGIONAL DISPARITIES IN COMPARISON

better in some indicators than the metropolises them-selves. The higher immigration rates to the city regions are particularly striking, as well as – and as a direct con-sequence of the competition sparked by the influx – the significantly higher average house prices on the proper-ty market here. In the entire northern cluster of Italy, the risk of social exclusion is growing due to rising living costs, in the cities more than in the surrounding areas. Accordingly, social expenditure per capita is almost twice as high here.
B. The solid centre and “bridge” between North and South (ochre): The geographical centre of Italy that stretches as far north as Emilia-Romagna and as far south as the Basilicata region, is home to 9.8 million people, almost 16 per cent of the Italian population. The socioeconomic indicators here are on a national average level and are only slightly worse than in the urban hinter-land regions of the north. On the other hand, due to only moderate but positive net immigration, there are fewer problems of social disparities here: house prices are comparatively low and so is social spending.
C. Disadvantaged regions with significant structural challenges (violet): 18.7 million people (31 per cent of the population) live in regions that are far below the Ital-ian socioeconomic average. In the north, this only in-
cludes Liguria, otherwise the affected regions are all in the south of the country, including the islands of Sar-dinia and Sicily. In this cluster, unemployment is higher than in the other types of areas (10.3 per cent), 22.1 per cent of young people are neither in employment nor in education (NEET), the proportion of highly qualified workers is relatively low at 25.8 per cent and the social and digital infrastructure is poorly developed. Measured against this, the income is not much lower than in the “solid centre” cluster (11.0 euros per hour vs. 11.3 euros per hour). However, dissatisfaction and disconnected-ness are expressed in voting behaviour, which at 74.1 per cent is about three percentage points lower than in the other clusters. The problems of a lack of economic dynamism, a shrinking employment base and reduced training opportunities are related to years of outward migration. At the same time, these problems are the reasons for the ongoing emigration from the affected regions. Southern Italy’s Mezzogiorno, shows the issues with deindustrialisation, demographic imbalances, lack of public investment and a globally uncompetitive ser-vice sector as if under a magnifying glass (cf. the detailed study – with an additional disparity map for southern Italy only – in Fina/Heider/Prota 2021: 16ff.): educational and employment opportunities are far greater in the northern part of southern Italy, around the cities of L’Aquila and Campobasso, as well as around Bari and
Figure 15Disparity map of Italy
Source: Fina/Heider/Prota 2021: 11.
!
!
!
!
!
!!
!
!
!
!!
!
!
!
!
Bari
Padova
Verona
Firenze
Messina
Catania
Bologna
TriesteVenezia
Taranto
Genova
Torino
Napoli
Palermo
Roma
MilanoMilano
24FRIEDRICH-EBERT-STIFTUNG – POLITICS FOR EUROPE

Potenza, and on Sardinia in the region of Cagliari – far better than in many regions even further south. In the metropolitan regions of the cities mentioned, modern industries provide greater independence from low-paid jobs in agriculture and tourism, which are predominant in Calabria, Sicily and the regions of Naples and Caserta. Between these two southern Italian extremes lie large parts of Sardinia, north-eastern Sicily and the mainland provinces of Salerno and Lecce. Here, about a third of the population is employed in the low-wage agricultural and tourist sectors, but outward-migration is much low-er than in the most isolated regions.
Overall, Italy suffers from a strong socioeconomic divide be-tween its northern and southern regions. This goes back to the period after political unification in 1861 when the two halves of the country saw different economic developments. The imbalance of the strong industrialisation in the north could be partially balanced out in the 1950s and 1960s with public programmes and industrial settlements in the south. With the oil crisis of the 1970s, this process of convergence came to a halt. Since the 1990s at the latest, the Mezzogior-no has not been able to transform the stagnant development into a new economic dynamic, despite numerous national and European support programmes. On the contrary, the global economic crisis, the euro crisis and the austerity man-agement emphatically recommended by Europe and exces-sively implemented nationally have further deepened the al-ready existing differences between the regions of the North and the South. The North-South divide in the country is al-ready evident at NUTS 2 level (cf. Chapter 2.3.2). However, it is only the analysis at NUTS 3 level that makes it possible to identify regional centres of albeit very different degrees of economic dynamism both in and around the rich metropo-lises of the north and in the south of Italy.
3.1.7 REGIONAL DISPARITIES IN ROMANIA
The consideration of socioeconomic indicators at NUTS 3 level shows the existence of four spatial types for Romania (cf. Fina/Heider/Rat 202113), which can be summarised in three categories:
A. Bucharest (dark green) / Dynamic urbanised regions (light green): The advantaged regions following the sys-tem transformation after 1989/90 and the country’s in-tegration into the EU are metropolitan regions with eco-nomic and academic centres (cf. figure 16). About 5.5 million people live here (1.8 million of them in Bucharest alone) – about 27 per cent of the Romanian population. The country’s highest per capita income is concentrated in and around the largest cities of Bucharest, Timișoara, Cluj, Sibiu, Brașov and Iași. Industries that require highly qualified employees have settled here. In most indica-tors, these regions perform better than the Romanian average: the share of wage earners in the active popula-
13 The detailed description of the indicators used, the data sources and statistical calculation methodology can be consulted directly in the country study.
tion is high (48.4 per cent and 75.9 per cent in Bucha-rest, respectively), the infrastructure is relatively well de-veloped (share of the population with access to public water supply: 76.2 per cent and 96.8 per cent in Bucha-rest, respectively). Nevertheless, there are some serious differences with regard to the capital region: Although Bucharest earned, for example, 227 per cent of the na-tional average income (in 2018) and functions as the country’s economic motor, the capital’s special status is better reflected in other indicators. For example, the share of employees in knowledge-intensive industries here is more than twice as high as in other metropolitan regions at 12.7 per cent, the health infrastructure is par-ticularly good (99.2 GPs per 100,000 inhabitants) and life expectancy at 78.3 years is more than a year higher than in other urban regions and 3.5 years higher than in Romania’s poorest regions. The attractiveness of the metropolitan regions leads to increased immigration within the country. At the same time, the proportion of emigration to other countries is high here (7.3 and in Bucharest 10 per 1,000 inhabitants). Immigration from poor regions with employment opportunities for immi-grants especially in the low-wage sector and the rising cost of living due to economic dynamics lead to an in-creased risk of social exclusion. The capital also has pe-ripheral districts where a high proportion of marginal-ised Roma live. Dissatisfaction is expressed, for example, in low turnouts in regional elections (44.4 per cent and 35 per cent in Bucharest).
B. Romania’s rural middle (ochre): The rural regions away from the metropolises are home to almost 10.2 million Romanians, more than half of the population. Com-pared to the urban centres, there is a lack of economic dynamism, higher education and employment opportu-nities. Only 32.6 per cent are wage earners, and the share of highly qualified workers is a low 3.6 per cent. The poor prospects on the labour market, which is still dominated by traditional agriculture, lead to migration towards the metropolitan regions. This is also reflected in the demographic development of the remaining popu-lation: the dependency ratio of 48.3 per cent is high compared to the rest of the country. Geographically, ru-ral Romania can be found in all parts of the country, 25 out of 42 counties are rural, including areas that have industrial potential, such as the Arges region in the auto-motive industry. While rural regions perform far worse than metropolitan regions in terms of infrastructure, the proportion of early school leavers is low here (2.5 per cent) and voter turnout (51.4 per cent) is higher than elsewhere in the country.
C. Rural and old industrial regions with significant socioeconomic challenges (violet): Romania’s outly-ing regions are found mostly in border regions, especial-ly on the eastern border with the Republic of Moldova and Ukraine. About 3.8 million people live here, almost 19 per cent of the total population. In these areas, old industries from the socialist era disappeared after the fall of communism. In addition, areas that were traditionally characterised by small-scale agriculture now have fewer
25REGIONAL DISPARITIES IN COMPARISON
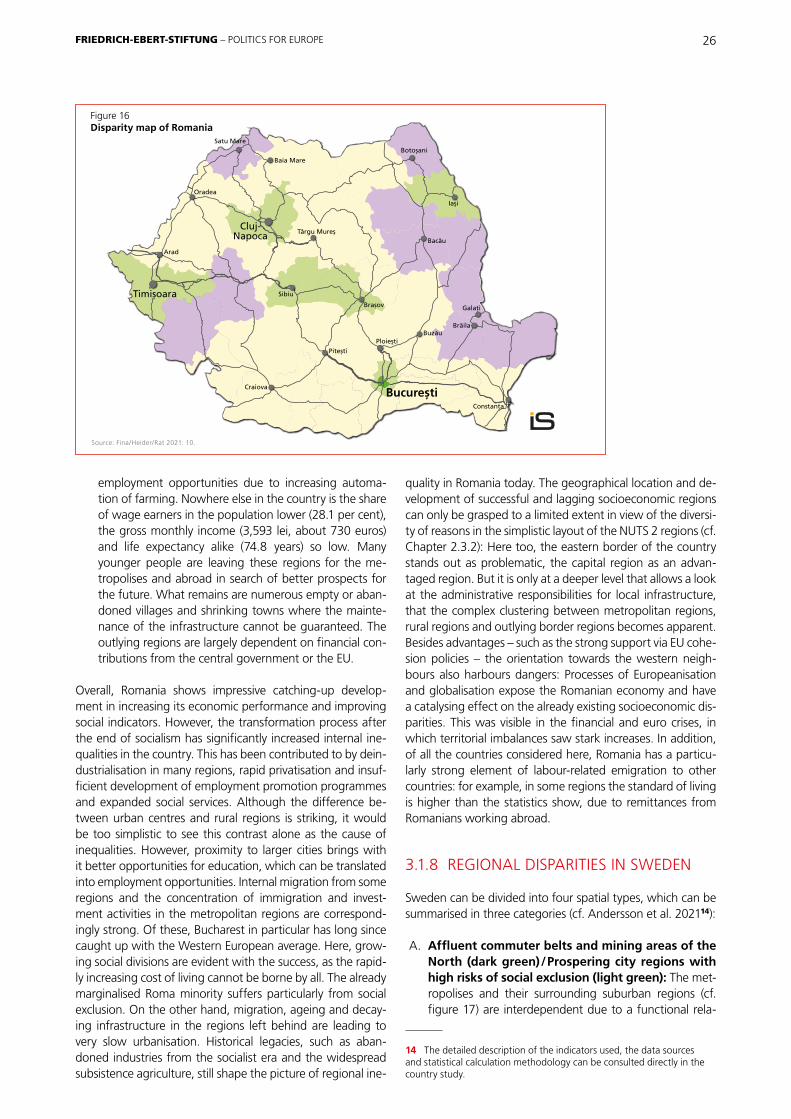
employment opportunities due to increasing automa-tion of farming. Nowhere else in the country is the share of wage earners in the population lower (28.1 per cent), the gross monthly income (3,593 lei, about 730 euros) and life expectancy alike (74.8 years) so low. Many younger people are leaving these regions for the me-tropolises and abroad in search of better prospects for the future. What remains are numerous empty or aban-doned villages and shrinking towns where the mainte-nance of the infrastructure cannot be guaranteed. The outlying regions are largely dependent on financial con-tributions from the central government or the EU.
Overall, Romania shows impressive catching-up develop-ment in increasing its economic performance and improving social indicators. However, the transformation process after the end of socialism has significantly increased internal ine-qualities in the country. This has been contributed to by dein-dustrialisation in many regions, rapid privatisation and insuf-ficient development of employment promotion programmes and expanded social services. Although the difference be-tween urban centres and rural regions is striking, it would be too simplistic to see this contrast alone as the cause of inequalities. However, proximity to larger cities brings with it better opportunities for education, which can be translated into employment opportunities. Internal migration from some regions and the concentration of immigration and invest-ment activities in the metropolitan regions are correspond-ingly strong. Of these, Bucharest in particular has long since caught up with the Western European average. Here, grow-ing social divisions are evident with the success, as the rapid-ly increasing cost of living cannot be borne by all. The already marginalised Roma minority suffers particularly from social exclusion. On the other hand, migration, ageing and decay-ing infrastructure in the regions left behind are leading to very slow urbanisation. Historical legacies, such as aban-doned industries from the socialist era and the widespread subsistence agriculture, still shape the picture of regional ine-
quality in Romania today. The geographical location and de-velopment of successful and lagging socioeconomic regions can only be grasped to a limited extent in view of the diversi-ty of reasons in the simplistic layout of the NUTS 2 regions (cf. Chapter 2.3.2): Here too, the eastern border of the country stands out as problematic, the capital region as an advan-taged region. But it is only at a deeper level that allows a look at the administrative responsibilities for local infrastructure, that the complex clustering between metropolitan regions, rural regions and outlying border regions becomes apparent. Besides advantages – such as the strong support via EU cohe-sion policies – the orientation towards the western neigh-bours also harbours dangers: Processes of Europeanisation and globalisation expose the Romanian economy and have a catalysing effect on the already existing socioeconomic dis-parities. This was visible in the financial and euro crises, in which territorial imbalances saw stark increases. In addition, of all the countries considered here, Romania has a particu-larly strong element of labour-related emigration to other countries: for example, in some regions the standard of living is higher than the statistics show, due to remittances from Romanians working abroad.
3.1.8 REGIONAL DISPARITIES IN SWEDEN
Sweden can be divided into four spatial types, which can be summarised in three categories (cf. Andersson et al. 202114):
A. Affluent commuter belts and mining areas of the North (dark green) / Prospering city regions with high risks of social exclusion (light green): The met-ropolises and their surrounding suburban regions (cf. figure 17) are interdependent due to a functional rela-
14 The detailed description of the indicators used, the data sources and statistical calculation methodology can be consulted directly in the country study.
!
!
!
!
!
!
!
!
!
!
!
!!
!
!
!
!
!
!
Iași
Arad
Bacău
Sibiu
Buzău
Oradea
Brașov Galați
Brăila
Craiova
Pitești
Botoșani
Ploiești
Constanța
Satu Mare
Baia Mare
Târgu Mureș
TimișoaraTimișoara
Cluj-Napoca
București
Source: Fina/Heider/Rat 2021: 10.
Figure 16Disparity map of Romania
26FRIEDRICH-EBERT-STIFTUNG – POLITICS FOR EUROPE

tionship between a dynamic economic centre and quick-ly and easily accessible residential areas in the catch-ment area. 6.9 million Swedes live here (about 67 per cent of the population). The country’s largest cities – Stockholm, Gothenburg, Malmö, Uppsala, Vesterås, Öre-bro and Linköping – offer very good employment oppor-tunities for highly qualified people due to their eco - nomic dynamism. This radiates into the surrounding municipalities, where the highest average gross monthly income in the country can be earned (32,589 SEK, about 3,222 euros). Geographically large but sparsely populat-ed areas in the far north of the country occupy a special position, which also belong to the group with the best living conditions in Sweden. Here, the mining industry for the extraction of iron ores managed to profit from the metal demand of a greening economy. In the urban catchment areas, the infrastructure is very well devel-oped and the risk of child poverty is low. Great satisfac-tion is expressed here in the country’s highest turnout in parliamentary elections (90 per cent). The flip side of this positive dynamic is the rising cost of living, which can be seen in property prices, for example. As a result, social polarization, gentrification and displacement of disad-vantaged households are increasing. The social risks are correspondingly greater in the cities than in the sur-rounding suburban regions (poverty risk for children: 19.7 per cent). While all Swedish regions show negative migration balances, the metropolitan areas are destina-tions for newcomers to the country who, in search of employment, increase competition, especially in the low-wage sector of simple services, which has expanded strongly since the 1990s. This fuels segregation in the expensive urban centres.
B. Sweden’s solid middle (ochre): Spread throughout the country are areas whose socioeconomic indicators are around the respective national average (40 per cent of all counties). With 2.1 million inhabitants, almost 21 per cent of the Swedish population lives here. Employ-ment opportunities and income are not bad, but the share of highly qualified people is low at 22.3 per cent. Many young and more highly qualified people leave these regions in search of better labour market options, and the ratio of young to old measured in the depend-ency ratio (73.2 per cent) is correspondingly poor. The cost of living is relatively low here, measured by house prices. In contrast, the health infrastructure (employees in the health sector: 32.9 per 100 inhabitants) is not much better developed than in the regions with the greatest problems.
C. The periphery (violet): Those regions whose indica-tors are below average are concentrated in the centre and north of the country. These are characterised by their generally greater distances from larger urban areas, where higher educational institutions have settled and economic dynamics can develop (exceptions: Helsing-borg and Eskilstuna with low population density). These rural areas are home to 1.3 million Swedes (about 13 per cent of the population). Here, the decline of the manu-facturing sector in the 1980s has never been absorbed,
nor has the dismantling of the public sector after the crises of the 1990s. In the remaining sectors of industry and agriculture, automation has created fewer jobs. The employment rate is the lowest in the country at 77.4 per cent, as is the average gross income (30,126 SEK, about 2,978 euros). This leads to a strong migration to other regions (over 30 per 1,000 inhabitants). The population that stays behind is on average older (dependency ratio: 74.3 per cent), has fewer highly qualified people (19.2 per cent) and lives in an oversized infrastructure that is costly to maintain. Of the indicators examined, only house prices and the gender wage gap perform better (that is: relatively low) than in the other regions.
Overall, the analysis of regional inequalities scratches at Swe-den’s image as a prime example and model of universal wel-fare capitalism. Its most formative times are long gone. The social democratic welfare system with its high level of social protection, expanded public services and full employment came under heavy fire during the economic crises of the 1990s and was successively transformed into the economic imperatives of privatisation, marketisation and strict budget-ary policy that had already been tried and tested elsewhere. Even though Sweden is one of the richest countries in Europe (cf. chapter 2.2.4), inequalities have developed that can be explained in a detailed regional analysis. For example, a de-velopment began 30 years ago in which the metropolitan regions successfully managed adjustments to the Swedish model by investing in export-oriented production as well as
Figure 17Disparity map of Sweden
Source: Andersson et al. 2021: 11.
Umeå
Falun
Luleå
Växjö Kalmar
Örebro
Halmstad
Karlstad
Sundsvall
Jönköping
Östersund
Karlskrona
Eskilstuna
Helsingborg
Örnsköldsvik
Gävle
Malmö
UppsalaVästerås
Linköping
Göteborg
Stockholm
Umeå
Falun
Luleå
Växjö Kalmar
Örebro
Halmstad
Karlstad
Sundsvall
Jönköping
Östersund
Karlskrona
Eskilstuna
Helsingborg
Örnsköldsvik
Gävle
Malmö
UppsalaVästerås
Linköping
Göteborg
Stockholm
27REGIONAL DISPARITIES IN COMPARISON

new service sectors. In contrast, structural change could not be shaped in other parts of the country. Here, a vicious cycle of diminishing employment prospects, out-migration, an ageing population structure and inadequate infrastructure has developed. The political focus on growth has widened the polarization even further, as it is primarily the already dynamically positioned metropolitan regions that benefit from this and thus become attractive magnets for immi-grants from Germany and abroad. But even their success shows cracks in the façade: with the employment opportuni-ties for the highly qualified, new service jobs in the low-paid service segment have emerged at the same time. This labour market continues to split, also through different ways of fi-nancing living expenses, while living expenses continue to in-crease. In particular, the competitive housing market, a heav-ily burdened public infrastructure and the increasing segre- gation accompanied by social exclusion are consequences of this development.
3.2 PATTERN OF INTERREGIONAL DISPARITIES
The results of the eight individual studies on multidimension-ally understood regional inequality in the eight EU countries examined here revealed country-specific features: Germany’s former East is still suffering from the transition effects of uni-fication; Estonia and Romania also have enduring legacies from their transitions from socialist systems that can explain some unequal developments in these countries. Finland and Sweden, especially in the far north, have large, sparsely popu lated regions with particular socioeconomic develop-ments that are unique. Italy’s particularly pronounced north-south divide has worsened in the last thirty years where dis-parate development also dates back to the 19th century. France had long lived centralism tailored to the capital, Paris, before it was adapted as a role model for the country’s next largest cities. And in Spain, the decentralisation implemented with democratisation after the end of Franco’s dictatorship has not been able to completely eliminate its regional eco-nomic-structural prioritisation. There are many other special features that result not least from geographic locations, natu ral conditions and climates: How successful can agricul-ture, tourism, raw material extraction or even permanent set-tlement be in certain regions?
Despite all the country- and region-specific differences, the comparative analysis of the socioeconomic spatial types nev-ertheless reveals clear patterns of regional disparities. These can be found in (3.2.1) economic structural change and other causal factors, (3.2.2) in the contrasting development be-tween economically developed centres and peripheral re-gions, (3.2.3) and in the resulting development cycles.
3.2.1 STRUCTURAL CHANGE AND INFLUENCING FACTORS
Although some regional inequalities have historical roots, all eight country studies point to an intensification of these ex-isting inequalities over the last 30 years. After the end of the
Cold War, market liberalism and globalisation gained momen-tum and created new socioeconomic divides – a worldwide phenomenon (see chapter 2.1) that is also reflected in the EU. While post-socialist states faced the conditions of a newly implemented market economy with an expansive wave of privatisation (Romania, Estonia, East Germany), comprehen-sive (Sweden 1990s) or gradual changes (Germany 2000s) in established market economies have also occurred as a re-sult of economic crises. The opportunities offered by the in-crease in global trade were exploited at different speeds and in different ways, but the fixation on growth in the national economy and the emphasis on employment as the best in-surance against poverty and exclusion reached all the coun-tries studied here as conceptual ideas. What became possi-ble in the EU at the time was an accelerated shift away from the primary and secondary sectors through automation pro-cesses, the growing digital “new economy”, expanded inter-national production and supply chains, and relocation. Large-scale industrial plants and manufacturing could only be made viable in particularly innovative and in-demand segments and increasingly focused on exports (the German automotive industry, for example). In contrast, with a few exceptions (Sweden’s north, for example), classical heavy industry and mining have lost much of their relevance every-where. The same applies to the still regionally strong share of agriculture in gross value added in some countries (Roma-nia, Spain, Italy).
The economic sectoral shift towards service societies and world-market-driven specialisation in production was accom-panied by a redefinition of the role of the state in market activity. Reminiscences of Keynesian overall economic man-agement models have long survived in many countries. In the U.S. and the UK, the shift to neoclassical and monetarist eco-nomic policy concepts first took place as early as the 1980s, while in many Central Eastern European countries these eco-nomic approaches were quickly introduced after the abrupt change to a free market economy in 1989/90, but state ac-tivity in the old West of the EU was not persistently ques-tioned until the global era began. In Sweden and Finland, the economic crises of the 1990s catalysed this process; in Ger-many, the process culminated in the 2000s; and in France, Spain and Italy, with the global economic and euro crises of the 2010s. In the course of the reassessment of market and state spheres of influence, the limitation of government spending played a central role alongside the focus on growth and (cross-border) competition in the sectors of the economy with a promising future. The increasingly dominant neoclas-sical economic theory aims to impose as few restraints as possible on the free play of market forces and to prevent high government deficits that could lead to inflation – especially in a monetary union (see section 2.2.1), where fiscal free riding (“moral hazard”) at the expense of the other members is to be prevented. For Finland, Germany, Italy, Spain and France, the 1990s were the preparatory period for joining EMU, and the convergence criteria mention, among other things, price level stability and public deficit and debt limi-tation.
The cost containment of the public sector is evident even beyond the conditions for joining the euro area and the
28FRIEDRICH-EBERT-STIFTUNG – POLITICS FOR EUROPE

budget rules subsequently made permanent in the Stability and Growth Pact. In Sweden, for example, the financial via-bility of the relatively large public sector was questioned in the wake of the economic crises (Andersson et al. 2021: 5f.). Or in Romania, where the massive upheavals in the transition to a market economy were not initially accompanied by social investment programs (Fina/Heider/Rat 2021: 14), and the so-cial reforms implemented from the late 1990s onward were primarily aimed at containing exploding social expenditures in relation to the still modest economic output (Hacker 2007: 72f.). The dismantling of the universal welfare state in Swe-den, the Agenda 2010 reforms in Germany, the rigid state austerity policy in Italy and the implementation of conditions from the euro crisis management in Spain are well-known examples of a reduction in state social benefits and a lack of investment in public services, infrastructure and economic and employment promotion. In addition to the economic crises, during and after which the call for limiting public debt became particularly loud, the intra-European tax competition that opened up with the completion of the single market has also played its part in tight government purse strings: As ear-ly as 1994, Estonia was the first country in Europe to intro-duce a uniform flat tax rate for corporate income tax, which it kept at 20 per cent even after joining the EU: a locational advantage in European and global competition, but at the same time a clear restriction of the state’s radius of action and, moreover, an incentive for a negative spiral of mutual undercutting in the EU.
3.2.2 CONTRAST BETWEEN ECONOMICALLY DEVELOPED CENTRES AND PERIPHERAL REGIONS
The analysis in the disparity reports from eight countries shows a clear dualism between advantaged regions in and around metropolitan areas that are integrated into global value chains, and outlying regions that either have not been able to cope with structural change and suffer from the phe-nomenon of deindustrialisation or are highly rural and domi-nated by the agricultural economy. The cleavages between agrarian countryside and industrial cities or between urban decision-making centres and disadvantaged peripheries are a historically tangible phenomenon, as Seymor Martin Lipset and Stein Rokkan described early on (1967: 47) with regard to the formation of party systems and the allocation of vot-ers. In the eight countries studied here, however, the identi-fied divergence between economically developed centres and peripheral regions is somewhat more differentiated. This dualism is reminiscent of a reissue of a development eco-nomics debate on the relevancy of economic spill over from rich to poor countries, as has been criticised by Hans Wolf-gang Singer (1970: 62): “[V]ery few would now say that the rapid growth of the richer countries, or even a rapid expan-sion of their trade with the poorer countries if it were associ-ated with it, would be a sufficient as well as necessary condi-tion for their continued or rapid growth.”
The transition to a service economy has promoted the for-mation and strengthening of regional centres in and around large cities that are responsible for a large part of the nation-
wide economic dynamics and value creation. This is where comprehensive, especially higher education, is concentrated – often in historically evolved structures – and where there are a variety of employment opportunities and a steady demand for labour shaped by economic activity. Here, infrastructure, public services and social benefits are usually well developed and life appears to be worth living and full of opportunities. In almost all cases examined here15, the catchment areas of the large and medium-sized cities in the individual countries are the highest winners of the urbanisation process: Here, in the respective country comparison, per capita incomes are highest on average and social problems are lowest.
The drivers of economic dynamism in the metropolises are modern industries integrated into global value chains, and a knowledge-based service sector in the fields of finance and insurance, information and communication, as well as cor-porate and public service providers. Here, the transformation of the economic sectors and the establishment of a stand-ing in the new European and global competitive order was achieved in an exemplary manner, mostly on the basis of ex-isting foundations, for example in the form of university tra-ditions and long-established companies. The situation is com-pletely different in peripheral regions: No large conurbations have emerged here; people live in separate small towns or in rural villages. However, rural regions are divided into those with classically average socioeconomic working and living conditions and those that have already fallen behind.
Unlike those around the national average, the peripheral re-gions usually have a special economic history. They are areas that have seen a sharp decline in once important industries, such as mining in Germany’s Ruhr region, textile manufactur-ing in Estonia’s northeast, and obsolete industries in Roma-nia’s border regions, Italy’s southern parts, France’s northeast, and Germany’s eastern states. In some relatively poor regions of Spain, Sweden and Romania, it is the loss of importance of agriculture as both a value-added sector of the national econo-my, and, with the effects of automation and mechanisation, as a major employer. In these regions in Sweden, after manu-facturing and agriculture, the public sector has also been side-lined as an important source of demand for labour since the 1990s. In the peripheral and less urbanised areas, far removed from the national average and even further from the prosper-ous metropolitan regions, educational opportunities are few and far between; in particular, university attendance is often not possible due to a lack of nearby institutions. Well-paid employment opportunities are therefore scarce, and infra-structure and public social services were either never com-prehensively developed or are oversized reminders of better times that incur high upkeep costs. This is especially true in view of the low revenues of the public sector in line with the lack of economic momentum. At the same time, rising social costs due to unemployment, an increasing risk of poverty, and an aging society, are problems from which younger peo-ple have long since turned their backs in search of better prospects in other parts of the country.
15 The country study Spain presents findings for the metropolises of the country, but no analysis of their suburbs was carried out, cf. Colina et al. 2020.
29REGIONAL DISPARITIES IN COMPARISON

There is almost nowhere in the peripheral regions that have managed the leap into service societies without strong urban centres. This is not the case in areas with a high share of tourism activities, such as the Mediterranean regions of Spain, France and southern Italy, as well as national parks and wilderness conservation areas in northern Scandinavia. However, tourism is a double-edged sword: While it offers good employment options, the services demanded here fall into the service sector rather than the knowledge sector and are correspondingly low paid. Moreover, apart from in his-torical and cultural urban epicentres, tourism is highly sea-sonal and has a limited impact on improving living conditions and economic dynamics.
In view of the divergences between economically developed centres that are fit for modern service societies and global competition, in contrast to peripheral regions that are less able to cope with structural change, we can speak of a dou-ble spatial and social polarization across all eight countries.
3.2.3 IDENTIFICATION OF DEVELOPMENT CYCLES
The regional disparities of different countries compared here show similar cyclical developments. For the peripheral re-gions, a repetitive vicious cycle is evident (see figure 18; see also Fink/Tiemann 2017): With the disappearance of indus-trial centres, without a designed transformation, what re-mains is only a concentration on the low-wage service sec-tor, such as in tourism and/or agriculture. Low growth and poor educational opportunities lead to an exodus of well- educated and especially younger people, leaving the elderly and less mobile people behind. High unemployment often occurs in connection with disappearing industries; in agricul-ture and the service sector, employment is more erratic, and in tourism employment is often seasonal.
Local authorities are then quickly overwhelmed in the face of oversized, decaying infrastructure, the lack of higher educa-
tion/tertiary education and employment opportunities that cannot be quickly remedied, the fight against unemploy-ment and, as a result, rising poverty and social exclusion, in addition to the expanded needs for social and health services of older residents. Growing social and infrastructural mainte-nance expenditures and dwindling tax revenues are increas-ing public debt, so that urgently needed public investments cannot be made. Thus, no new economic dynamics can de-velop, and in the long run, the municipality or county cannot withstand the deterioration of social and infrastructural living conditions. This, in turn, makes the regions even more unat-tractive; those industries that are still left then finally relocate, and the exodus of people important for igniting new eco-nomic strength continues to increase.
Just as peripheral regions have experienced a negative spiral, the exact opposite spiral is evident in the economically devel-oped centres, starting with the establishment of modern manufacturing (often for export) and knowledge-based ser-vices (see figure 19). The demand for highly qualified em-ployees can be met by the existing educational opportuni-ties. The labour market attracts those who do not see adequate career prospects in the outlying regions. High em-ployment rates and the growing tax revenues resulting from economic success enable local authorities to make invest-ments when public finances are good. Following on from this, economic development measures, expanded infrastruc-ture, modern public services and a good range of social ser-vices make the already developed region even more attrac-tive. This is followed by the establishment and influx of new companies, as well as an uninterrupted stream of immigrants who want to find better working and living prospects.
But this purely positive, idealistic portrayal has a weighty downside that is also evident in all the studies compared here. An effect is emerging which, although less evident in the wealthy suburbs of the metropolises, is omnipresent in the large and medium-sized cities: the success of the eco-nomic and labour market dynamics quickly leads to higher living costs, which are particularly noticeable on the housing
Source: Own illustration.
Figure 18Viscous cycle of peripheral regions
low employment rates; social expenditure increases
Industries disappear (or never existed); low growth
concentration on lowskilled service sector & agriculture
educated people leave to other regions
dependency ratio worsens
infrastructure declines further
low public investments; no new economic dynamics
low tax revenues; hight public indebtedness
30FRIEDRICH-EBERT-STIFTUNG – POLITICS FOR EUROPE

market. At the same time, it is not only highly qualified peo-ple who are moving from disadvantaged areas to the met-ropolises. The labour market is becoming dualised between the well-paid workers with tertiary education and the low-paid service and manual labour jobs, for example in trans-port, catering, cleaning and the care sectors. Those who have not been able to invest that much in their own education to earn enough to afford the high living standards of large cities are dropping out of the increasing competition for high-qual-ity employment and comfortable housing and living condi-tions. This creates new problems of social exclusion and pov-erty risk, especially for children growing up in these families, in addition to segregation of poor and rich populations by neighbourhoods enabled by gentrification and displace-ment. All capital cities and many other next-largest metro-politan areas in the eight countries studied here are familiar with this phenomenon, in which the double spatial and so-cial polarization identified above is repeated in a small but densely populated area.
This means that socioeconomic disparities are by no means only a problem for regions over the last thirty years that have been unable to set the course for a successful transition to the modern service society in the global environment. Even the metropolitan regions that would appear to be models of a sucessful transition show great internal disparities. They are approached by a strange reciprocal relationship: The periph-eral regions need the economically developed centres as an emigration option, and the economically developed centres tap the better educated or the future workforce available there for their own development. This dynamic has contrib-uted to the solidification of the gap between peripheral re-
gions and economically developed centres, as has the long-held belief that metropolitan regions can simply be an example to be emulated. This overlooks the fact that, thirty years ago, the conditions for a knowledge-based, competi-tive economic model had long since been established in eco-nomically developed centres, namely higher educational in-stitutions, diversification of economic sectors, their accumulated experience, and dynamic population change.
Moreover, many attempts to promote state-organised growth in stagnant regions have failed, as only the already dynamically operating and economically successful urban centres could provide the conditions for economic growth: “In the rhetoric of growth policy, it aims to be spatially tai-lored in its design to make the most of the competitive ad-vantages that each region’s resources holds. In practice, the growth policy may potentially work in regions that already show dynamic growth, whereas stagnating regions receive less support, if any, by attempts to create a competitive and innovative local economy from the top down” (Andersson et al. 2021: 7). Adopting the principle of market-based com-petition to a competitive juxtaposition of entire regions does not unearth any new champions, but only confirms and strengthens the champions themselves – the winner takes it all.
Resilience in times of economic crisis is similar: Economically developed centres may be more dependent on global eco-nomic fluctuations and initially more affected by the collapse in economic output than regions where the exposure and potential to be hit by a recession is low. However, while busi-nesses hit in already stagnant regions and the accompanying
Source: Own illustration.
Figure 19Virtuous cycle in economically developed centres
high employment rates
modern industries & high qualified services establish
demand in high educated employees
in-migration due to job perspectives
improving dependency ratio
infrastructure improves
high public investments; further economic dynamics
high tax revenues; low public indebtedness
higher living costs strong competition on jobs; growing low-wage sector
increasing risk of segregation and social exclusion
31REGIONAL DISPARITIES IN COMPARISON

rise in unemployment are difficult to repair, economic mo-mentum in metropolitan areas ensures that the crisis is quick-ly overcome. Viewed over time, the structurally weak regions thus lose more as a result of the economic slump than the structurally strong ones. Accordingly, the disparity reports point to the deepening socioeconomic divisions caused by the global economic crisis and the euro crisis, and some also to the corona crisis. In particular, the social consequences of the different crises – such as rising unemployment and a higher risk of poverty and social exclusion – can only be com-bated with considerable difficulty in less dynamic places such as outlying and rural areas. Here, the people affected see the only chance of changing their own situation in emigration, a decision that leads to new polarizations in the medium term, even in the metropolises.
3.3 INTERIM CONCLUSION: DOUBLE SOCIAL AND SPATIAL DUALISM
By means of the results of the studies with the summaries of their most important findings that are and comparatively evaluated in this chapter, the eight disparity reports allow a more detailed insight into the geographical and social distri-bution of regional inequality and its background in the Euro-pean member states. The multidimensional approach taken and the identification of success stories and problem cases at the small-scale regional and local level brought a number of issues to light. These could not be gleaned from a purely aggregate view – often not even at the NUTS 2 region level.
For all the country-specific and regional peculiarities, the presence of patterns of social and regional inequality is re-markably obvious. The rise in inequality is dated everywhere to the period of the last 30 years, as severe economic crises and the policies implemented in response to them have ac-celerating divergent developments. Many developments co-incide over the three decades since 1990, and a monocausal explanation of the rise in regional inequality is clearly inad-equate. Contributory factors have been the structural change in the economy, with the replacement of the industrial soci-ety by the service society, the end of the East-West conflict, accelerated globalisation, the heyday of the market-liberal paradigm in economic policy, and ultimately the implemen-tation of competitive and budgetary objectives through the major European projects of the internal market and mone-tary union (see Chapter 2.2).
In all of the countries examined here, contrasts have emerged between economically booming centres and peripheral rural or industrialised areas that are less able to cope with structur-al change. This is evident in a double social and spatial dual-ism, with a cluster of average socioeconomic outcomes relat-ed to the respective areas in between. Economically already developed centres had the unequally better starting condi-tions into the new national, European, even global competi-tive order and were able to tie up resources of economic dy-namism, human capital and infrastructure development. By contrast, their sister regions in the periphery, struggling with structural change and external influences, are losing their life-force: Finances, workforce, future prospects and public
services all disappear and do not return. Two cyclical devel-opments – one positive, one negative – are emerging that are mutually dependent and yet mutually damaging in the long run. This is evident not only in the regions that have been thrown back, but also in their wealthy sisters: Rising living costs and people sorted out by the merciless competition for jobs and happiness in life encounter an intensified form of social exclusion in booming urban areas, from which they have partly tried to escape in the countryside.
32FRIEDRICH-EBERT-STIFTUNG – POLITICS FOR EUROPE

The authors of the eight disparity reports make a number of recommendations to address the described regional diver-gences. Not only do the studies lead to very similar analyses of the double social and spatial polarization in all eight coun-tries, but the authors’ policy recommendations are also unanimous: there must be a shift away from the interregio-nal competition principle that inhibits those trailing behind from ever catching up, a shift away from the short-sighted focus on growth promotion, and more movement towards the state taking an active role in regional development. More public investment is required, most especially in infrastruc-ture projects and supporting education and employment in disadvantaged areas, while there is a need for national dis-cussions about competencies, responsibilities and financial resources between central and local governments.
It is very clear that most country analyses fundamentally question the principle of competition between regions, and the overriding focus on their growth contribution to national GDP. The market principle of productive competition among companies does not work for the far more complex regional forms of organisation. Even if each region succeeded in high-lighting, promoting and advertising its on-site specifics in terms of a particular product, this business approach does not guarantee success. Since the 1990s, regions that are com-ing from very different starting points have been increasingly thrust into internal competition at the national and Euro pean level. At the same time, metropolitan areas with diversified economic structures have enjoyed much greater benefits than rural and outlying areas that have limited innovative po-tential and inadequate infrastructure. Instead of promoting a perpetuum mobile of supporting the good pupils in class, regional policy should focus on the principle of “equivalence of living conditions” (Fina et al. 2019: 70) as a state objec-tive. The attention of a new funding policy should be particu-larly focussed on the regions that are most affected by struc-tural changes and new challenges.
The full story of socioeconomic divisions can only be under-stood if social developments are considered alongside eco-nomic growth targets. The attractiveness of a region does not depend solely on high growth and employment rates, but also on the quality of work, the wage structure, educa-tional and development opportunities, the accompanying infrastructural and social circumstances and many other as-pects. Growth and employment do not automatically mean prosperity; labour productivity is already influenced by the
4
POLICY RECOMMENDATIONS
existing infrastructural capital stock, the technical progress made, the education-related human capital and, last but not least, the institutional and informal social capital of a society. In order to achieve greater well-being and quality of life, along with the usual socioeconomic indicators, different issues must be taken into account, such as wealth distribu-tion, individual capabilities and sustainable development, and especially with regard to climate and the local environ-ment. (Stiglitz/Sen/Fitoussi 2010). However, since the market only pays limited attention to these important aspects of development, as they cannot be priced or can only be priced with difficulty and only over a longer period of time, the state should once again play a more active role in regional policy: “The state’s withdrawal must no longer be at the expense of the more vulnerable areas” (Le Bras/Warnant 2020: 20). Structural change must be moderated and shaped by the state, as must also be the case with new challenges posed by demographic changes, digitalisation, climate change, Euro peanisation and globalisation. All of these multidimen-sional aspects must be taken into account. Relying solely on the market and the competition of the most assertive regions will not result in an optimal allocation of good living condi-tions and future opportunities (Fina/Heider/Masso 2021).
A new policy goal of strategically shaping global challenges for the development of the regions would have to be formu-lated for the active accompaniment and shaping of structural changes and their social effects. In this context, economic development would remain at the centre, but would be ex-panded from today’s fixation on growth to include the di-mension of individual life and development opportunities: “To address the rising spatial inequality, a new policy needs to be formulated that should support the adaptation to the ongoing structural transformation of the economy, and finds ways of helping all individuals make the most of their lives equally and take an active part in the value created in the economy” (Andersson et al. 2021: 18). Moreover, many country reports emphasise the devastating effect of eco-nomic crises and their management on the widening of regional disparities, especially with regard to the austerity course in the euro crisis, which is completely detrimental to a sustainably overcoming socioeconomic crisis. A policy that balances the effects of hyper-globalisation and protects against the kind of transnational crises and challenges that have characterised the 21st century to date would have to breathe new life into economic, social, and territorial solidar-ity in the face of free market forces: “A new political formula
33POLICY RECOMMENDATIONS

is emerging that, under the slogan of the return of the state, links the necessary environmental protection, social justice, territorial cohesion, and democratic renewal” (Leron 2021: 7, own translation).
The recommendations derived from such a new policy goal can be clustered according to (4.1) national measures to over-come disparities and – including findings from this study – (4.2) European measures to overcome double spatial and social polarization.
4.1 NATIONAL MEASURES TO OVERCOME DISPARITIES
To inform a new objective for state regional policy, the coun-try reports make numerous concrete proposals for new or expanded state activities. Similar directions of the recom-mended targeted measures become clear over and above the specifics of each case. For example, only a few proposals are aimed at concrete state support for specific sectors of the economy, and although these are usually viewed quite criti-cally in public debate, economist Mariana Mazzucato (2018) identifies them as being quite successful. For Romania’s rural areas, state investment in green and modern agriculture is particularly highlighted; in Sweden, promising economic sec-tors are seen as being renewable energy production, as well as the development of batteries and carbon-free steel linked to the booming mining industry in the north.
The most common starting point is investment in infrastruc-ture and the labour market, which are called for in all eight disparity reports compared here. Areas mentioned include publicly financed housing construction (Sweden, Germany, France, Spain, Italy), improved digital infrastructure (Spain, France, Germany), support for the creation of a decarbon-ised economy (Romania, Germany, Finland, Estonia, Spain), strengthening public social and health-related services (Italy, Romania, Germany, Finland, Spain, France), expanding pub-lic transport services (Germany, Finland, France, Italy). In ad-dition, the state should invest more in regional education, training and science programs – this is emphasised as a par-ticularly important point in all countries, with varying de-grees of emphasis.
With the exception of the reports on Germany, Estonia and France, the remaining five reports present concrete ideas for promoting employment in the region, albeit with very differ-ent starting points: For Finland, a concept of spatial and life-cycle-related work flexibility is proposed; for Spain, the idea of subsidies for employers setting up in disadvantaged re-gions; in Romania, the focus is on social security for employ-ees via occupational safety measures and improved access to social benefits as well as the reduction of precarious employ-ment relationships. In addition, public employment programs are called for in Sweden and Italy.
How will the suggested programs be financed and imple-mented on the ground? This is where the differences be-tween the countries studied here are greatest, which can be traced back to different federal or unitary traditions. For Italy,
more centralisation is advocated because decentralised poli-cy would lose sight of the differences between the regions and the Community goal of cohesion: “What we are actually seeing are regional authorities that impose themselves as major decision-makers while central government is losing in-fluence. The weakened legitimacy of the national state has involved the loss of a shared national commitment to territo-rial justice and the erosion of inter-regional solidarity […]” (Fina/Heider/Prota 2021: 21f.). Similarly, in the area of social policies for Romania, a clarification of responsibilities be-tween regional and central levels is suggested, with the gov-ernance and financing of minimum income remaining at the state level.
The country studies for France, Spain and Estonia argue quite differently: Here, people are tired of the centralised approach to regional policies, classifying the one-size-fits-all concepts of development approaches as inappropriate for the very di-verse regions. To effectively combat inequality, it is important to focus on regionally different preconditions, developments and development prospects that can be better assessed and locally administered: “For this reason, it seems necessary to give greater power to the intermediate levels, such as regu-latory authorities. This option, if adopted, should aim for an asymmetrical decentralisation and promote efforts to adapt the powers assigned to local authorities to the economic, social and geographic reality of each region or subregion.” (Le Bras/Warnant 2020: 18).
Administrative responsibilities are usually accompanied by questions of financing regional and local tasks. In Germany, Finland and Sweden, particular attention is paid to the role of municipalities: In Germany, the debt of many municipalities in disadvantaged regions has become a constraint on their ability to act, “which in turn reduces their attractiveness to businesses and households” (Fina et al. 2019: 70). Therefore, a debt relief initiative is proposed. In Finland, municipalities have extensive scope for action, but they often lack the nec-essary resources to do so, as these are in turn administered at the state level and allocated down to the local level. A system of regional taxation is therefore proposed for Finland. In Swe-den, municipalities also have extensive responsibilities, but the tax system penalises municipalities in disadvantaged re-gions through higher taxes and low social benefits. A tax reform is proposed in which the relevance of place of resi-dence disappears and a return is made to a solidarity-based high redistribution ratio between rich and poor. A more pro-gressive income tax is also being discussed for France. In Ro-mania, the proposal is to introduce a progressive taxation system to replace the current single tax system.
In all countries, a rethinking of the distribution of tax reve-nues and tax expenditures is suggested, whereby coopera-tion ideas and equalisation mechanisms should also be adapted or redesigned. Here, too, the country reports differ widely in line with their financial constitutions for central gov-ernment and local authorities. The authors of the reports agree that different regional financial needs should be better reflected in systems of tax revenues and allocations.
34FRIEDRICH-EBERT-STIFTUNG – POLITICS FOR EUROPE

4.2 A NEW ROLE FOR THE EU AS A PROTECTIVE BUFFER AGAINST GLOBAL CHALLENGES
The European level is addressed in all of the country studies. This is partly due to the important role of EU cohesion policy in regional development, and partly due to the EU’s capacity to positively or negatively influence and shape many external factors that affect regional development. None of the dis-parity reports refute the important role that Brussels plays in shaping 21st century challenges. EU guidelines, support programs and directives for many specific policies are seen as being helpful in addressing socioeconomic divergences. When talking about limiting regional disparities, the EU’s cohesion policy in particular is a standard term. Its project- related funding arrives and can be measured – depending on its scope – as a contribution to increasing national per capita income. However, the concrete impact of cohesion policy in reducing socioeconomic disparities between regions is con-sidered to be low: “[…T]he impact on regional economic de-velopment was highly limited and any long-term effect dif-ficult to find. The EU policies directed at regional and structural development have, if anything, had a limited ca-pacity to reduce regional disparities in a country” (Andersson et al. 2021: 17). Nevertheless, their existence is considered very important: “In summary, it is reasonable to say that without the European Cohesion Policy the regional dispari-ties in Italy would have been even worse” (Fina/Heider/Prota 2021: 5).
However, the above-mentioned competition and growth paradigm (cf. chapter 3.2) that is strongly criticised from a regional perspective, is not only attributed to an omnipotent globalisation that is always described in a nebulous way, but specifically as an overriding objective of the EU, which has been implementing this paradigm since the 1990s with the completed single market and EMU as well as its growth strat-egies (Lisbon, Europe 2020). Accordingly, the country reports critically question why the supranational level does not op-pose the dominance of growth and competition fixation in regional policy. In all eight studies, the fixation on growth and regional competition for funding are rated as ineffective in reducing socioeconomic disparities between metropolitan and outlying regions. This precipitates a number of ques-tions: whether the actual goal of economic, social and terri-torial cohesion is obscured by the desire for the highest pos-sible contributions to growth for the member state; whether the funding programs are too strongly tailored to the already successful metropolitan regions; or whether sufficient ad-ministrative support is provided for stagnating regions to even apply for EU funds.
The role of the EU as a crisis manager is particularly under discussion. In view of the major economic crises of the last decade, the EU is not accorded a praiseworthy role in limiting regional disparities. The imposition of pro-competitive struc-tural reforms and expenditure-limiting budget policies propa-gated by the European institutions without regard to losses seems to have deepened not only the rift between member states (see chapter 2.2.4) but also regional disparities. Within the euro area, insufficient fiscal resources in the region can-
not be blamed solely on national distribution and budgetary problems but must be linked to the Stability and Growth Pact, later the Fiscal Compact, and the macroeconomic ad-justment programs for crisis states by the troika of the Euro-pean Commission, the European Central Bank and the Inter-national Monetary Fund during the euro crisis. Particularly in the more affected countries Spain and Italy, the financial and euro crises are perceived as a turning point in which the EU’s imposed austerity policy has reversed many of the successes of its convergence efforts achieved from the decades before: “A case in point is the disruptive financial crises of 2008 that forced Italy to align its economic policies to European Union austerity paradigm” (Fina/Heider/Prota 2021: 8). The report warns against new conditionalities in cohesion policy. Instead of positive incentives for catching up, there is the threat of sanctions if the overriding goals are not met. These overrid-ing goals of economic governance are operationalised in the European Semester, which centrally includes budget restric-tions.
The combination of identified regional divergences and the surrounding economic policy, as well as poorly contoured so-cial framework, all point to the need for three main demands for a reorientation of EU policies: A (4.2.1) focus on cohesion instead of internal competition between regions, the (4.2.2) development of an integrated European economic and social policy, and the (4.2.3) joint management of new challenges.
4.2.1 FOCUS ON COHESION INSTEAD OF INTERNAL COMPETITION BETWEEN REGIONS
The EU should put cohesion back at the forefront of its poli-cies and not promote unequal competition between rich and poor regions. Competitiveness is important, but simply imposing market principles of competition used for compa-nies upon welfare states and regions perpetuates imbal-ances. The EU’s position in the 21st century is in a world of global competitiveness. Accordingly, competitiveness should be considered in aggregate terms: How competitive is the EU as a whole in a global environment? Contrary to what has been practiced for the past 30 years, it should be clear today that there is no automatic spill-over from interregional and intergovernmental competitiveness to ensure the Union’s global competitiveness.
EU cohesion policy does not need a comprehensive reformu-lation, but rather its execution should be aligned with its mis-sion along the treaty objectives of economic, social and terri-torial cohesion. It would be able to increase its effectiveness in preventing, limiting and overcoming the identified double, social and spatial polarization, if its growth fixation makes way for a broader set of target perspectives. In this context, the additional criteria put forward by the current European Commission for the funding period until 2027 look promis-ing. In addition to the traditional indicator of GDP per capita, these criteria will also take into account regional youth unem-ployment, the level of education, climate change, migration and integration for the allocation of funds. The clearer linking of cohesion policy with overarching objectives (including digi-talisation, climate change mitigation and the energy transi-
35POLICY RECOMMENDATIONS

tion, network expansion, social policy, proximity to citizens) could also help to better capture the diversity of regional needs. Strengthening the multidimensionality of cohesion policy in this way could help to address the different needs of the regions in a more targeted way, both to level out the major contrast between outlying and metropolitan regions and to address the phenomenon of increasing polarization within large and medium-sized cities. Support for the most remote regions could also be achieved by fixing their maxi-mum co-financing rate (that is the amount invested by the EU) at 85 per cent (originally planned to be lowered) with a simultaneous reduction of the rate for highly developed re-gions from 50 per cent to 40 per cent (transition regions will remain at 60 per cent). However, in the future, a region will only count as highly developed if it exceeds 100 per cent of the average per capita income of the EU instead of 90 per cent. Here it remains questionable whether better-developed regions have not thereby secured access to a larger share of financial resources that would be more urgently needed else-where.
For the new funding period, the multidimensional approach is counteracted by the even stronger adherence to the condi-tionalisation of financial resources. This is because the asym-metry of the European Semester described above will primari-ly sort the reform policies of the member states according to budgetary and competition-related criteria rather than other macroeconomic, employment and social policy aspects (Hacker 2019). Here, there is a risk of a procyclical develop-ment that penalises those states that urgently need subsidies to overcome crisis situations and makes it possible for pro-jects to be halted for extraneous reasons in the case of pure-ly structural measures. If this idea were to be passed on to the regional level within the member states, the metropoli-tan regions would once again have a better hand in the allo-cation of financial support, since they are the model students of structural reforms and reorganised budgets. The condi-tionalisation with the European Semester should therefore be resolved again, as originally also demanded by the Euro-pean Parliament (2019).
From a regional policy perspective, the regular juste retour thinking of the member states in the negotiations for a new EU MFF has also been criticised: If the goals of cohesion and catching-up development are to be seriously implemented, there must be a certain degree of financial redistribution in the EU. In addition, a higher cohesion policy budget is needed, as the reports on Italy and France indicate. In this context, Leron (2021: 8) argues for a shift away from allo-cations from member states, and towards financing the EU budget through a dedicated tax capacity for structural is-sues and a European unemployment insurance to combat cyclical shocks. With the Corona pandemic, the first steps in the proposed direction have been taken in both areas via EU borrowing and agreement on repayments via new EU taxes to be introduced as part of the Next Generation EU package, as well as with the support instrument for short-time work programs, SURE, which should be made permanent.
4.2.2 THE DEVELOPMENT OF AN INTEGRATED EUROPEAN ECONOMIC AND SOCIAL POLICY
The previous orientation towards growth and competition is clearly unsuccessful in levelling disparities between regions with different levels of development, or between member states. An economic and social model for the EU that is understood in terms of solidarity and sustainability must not make the mistake of formulating social goals for an unsuit-able economic framework in which they will be lost (cf. Antonucci/Corti 2020). If more is to be achieved than an orientation towards the principles of the major integration projects of the single market and EMU, given the aspects of increased competition and restrictive budgetary policy al-ready criticised above, it is necessary to eliminate the EU’s constitutional asymmetry between market creation and market shaping that has been fuelled by the management of the euro crisis.
This is possible by avoiding a return to austerity policies that are less flexible and characterised by budgetary discipline, since cuts in national budgets translate into decaying and undeveloped infrastructure in the region. The analysis of re-gional imbalances has clearly shown the extent to which the economic and social consequences of misguided crisis man-agement contributes to the persistence of inequality and the deepening of divisions. The double polarization is evident at both the interregional and the intergovernmental level: The crisis-induced regression of a country like Spain, which has been catching up with the EU average since the 1980s with the help of EU policies, shows the dangers of inadequate macroeconomic policies for both the cyclical and the struc-tural dimension. It is also detrimental to neighbouring coun-tries and trading partners if the EU’s fourth-largest economy falls behind in most economic and social indicators and moves away from the European average.
In regions already beset with problems, severe economic slumps and protracted stagnation are often predetermined breaking points on the road to being left further behind. Disappearing companies and migrating, well-educated em-ployees rarely return to regions cut off from future prospects and infrastructure development. The cyclical developments that have been identified in peripheral regions are quite dif-ferent to those identified in economically developed centres (cf. chapter 3.2.3). This difference is also mirrored among EU member states in major economic crises: Here, too, eco-nomic and social resilience is distributed differently; while some countries exude an attractive appeal due to their eco-nomic dynamism, employment prospects and social bene-fits, others remain trapped in vicious cycles of economic re-cession, high unemployment, rising poverty risk, high debt and poor credit ratings. Many people take advantage of the guaranteed freedom of movement and seek their profes-sional and personal fulfilment elsewhere, leaving the crisis contexts of their home countries behind. In times of crisis, the interregional migration flows take place on a larger scale between EU member states, and intra-EU labour mi-gration between poor and rich countries increases.
36FRIEDRICH-EBERT-STIFTUNG – POLITICS FOR EUROPE

On the other hand, this can be addressed by establishing an EU social policy that views social cohesion and economic growth as two sides of the same coin. Collective workers’ rights, guaranteed access to social insurance, the fight against child poverty and other social principles important for all EU states should be protected via the European Pillar of Social Rights (EPSR). This means that the EPSR needs to be legally binding. In addition, the European Commission’s Action Plan (2021b) opens the door to the concrete imple-mentation of the Pillar through indicator-based targets. Oth-er current initiatives in the social field, such as a framework for European minimum wages, common principles of basic security systems and the European Child Guarantee to fight child poverty, also contribute to the implementation of the principles of the EPSR and to strengthening the importance of social Europe. In this context, the balance between eco-nomic and social objectives is important for member states and regions alike.
The policy meant to address the Corona crisis with its central instrument of the 750-billion-euro Next Generation EU Fund can be seen as a special opportunity to exit the economic slump while simultaneously supporting structural, environ-mental, and social goals. Without sensible public investment in infrastructure, education and employment, services of general interest, health services and social protection, all re-gions – whether economically dynamic or not – will have a difficult future. Public investments are only a burden for poli-ticians setting budgets; otherwise, they are an opportunity for a shaped future. Part of the task of a new European eco-nomic and social policy should be the reformulation of an integrated stability, growth and social pact. This should re-cast the numerical budget criteria (Dullien et al. 2020) and balance the goals for social progress and for combating ine-quality against macroeconomic objectives.
4.2.3 MANAGING NEW CHALLENGES TOGETHER
The prerequisite for the proposals made above is no less than a new way of thinking about the roles of the market and politics. The market and globalisation euphoria of the early 1990s has long since faded, as the hoped-for equitable allo-cations of wealth, economic strength, quality of life and pro-gress dynamics have simply not materialised. In the disparity studies, it is evident in all countries – albeit at different levels – that the dissatisfaction felt by the populations in these areas concerning both their own future prospects as well as that of their surroundings is being expressed in increasing political abstinence. The “system” is perceived being an unjust mecha-nism by which an “elite” (such as those living in wealthy met-ropolitan areas) have consistently secured their own interests and ensured that those from outlying regions remain as small cogs in wheels that keep turning but do not provide for their professional advancement and individual fulfillment. The be-lief that there can be change in the “system” further dwin-dles among those left behind in increasingly disconnected regions. Those who are mobile set off for more promising regions and thus inadvertently ensure the further decline of the place they came from.
Those who become disconnected and frustrated by these mechanisms who are often otherwise politically disengaged, fall prey to political populists who increasingly take advan-tage of the intensification of social and spatial contrasts that exist on a larger scale and everywhere in Europe. The rise of the extreme right and its entry into many parliaments across the continent is, among many other factors, a rampant pro-test against globalisation.16 Not leaving this field to the half-baked and dangerous ideas of nationalists and welfare chau-vinists should be a priority for the EU. Because of its size and economic strength, the EU has the potential to serve as a protective buffer against changes brought about by glob-alisation: Not simply letting change happen but moderating and shaping it to mitigate “voting with one’s feet” through internal migration to metropolitan regions by highlighting remaining and newly identified or created opportunities. An EU that succeeds in doing this also creates the conditions for the development of a European identity among its citizens.
The challenges of the 21st century are numerous – climate change, digitalisation, increasing inequality, trade conflicts, economic crises and pandemics – and more will follow. Ac-tively shaping these, and not surrendering to alleged global imperatives, could become the expert discipline of the EU. The EU is already demonstrating its power to shape global rules – for example, in free trade agreements, climate protec-tion, and the General Data Protection Regulation (Bradford 2020). To this end, however, it is not enough to load the Euro-pean agenda with new policy areas and goals. The EU’s pro-tective function must benefit all of its 450 million citizens by moderating the changes taking place through the market all the way to the regional level: “The EU’s transition agenda (i.e. energy, digital and industrial) creates specific challenges for lagging regions since successful transitions imply that certain capacities, such as skills and know-how, investment and governance, are in place. In regions where these are ab-sent or in short supply – as is the general case for lagging regions –, successful transitions are unlikely to materialise. This further threatens the vulnerability and stability of these regions. Furthermore, the COVID-19 crisis is exacerbating this instability” (Pilati/Hunter 2020:10).
The current Commission’s major policy dossiers are helpful since they already take future challenges for structural change into account. One example is the implementation of the re-quirements to limit climate change. The Green Deal and the associated Just Transition Fund to achieve climate neutrality for the EU by 2050 are designed to include support for re-gional structural change through green economic moderni-sation and mitigation of negative impacts. It must be made clear here that the creation of ever new competitive spaces trimmed for growth is a similarly ecologically unsustainable goal. So too, should the modified Common Agricultural Policy, also under the banner of the Green Deal, give greater priority to environmental sustainability and promote devel-opment in rural areas. This should neither be exclusively about economic exploitability; the EU can and should want
16 The discontent with globalisation is also raised by left-wing populists; the variations of the protest are manifold and require a sharp look at motivations and objectives, cf. Koch 2020.
37

to afford the preservation and restoration of regional biodi-versity to protect the quality of life of its citizens.
Major pan-European projects in the transport sector such as is suggested in the Finnish Disparities Report would also be in line with the climate goals: An accelerated expansion of rail lines of the Trans European Network (TEN) – such as Rail Baltica, a modern sleeper network or the revival of the Trans-Europe Express (TEE), which was discontinued in 1987 – could take on a lighthouse function for intra-European connectivity. This would contribute to climate protection, promote intra-European mobility, improve infrastructure and create employment – but above all, it would connect regions with different levels of development across countries.
38FRIEDRICH-EBERT-STIFTUNG – POLITICS FOR EUROPE

Socioeconomic imbalances are found both between and within EU member states. Even countries that exhibit high economic and social standards in aggregate form show the same patterns of spatial disparities as their neighbours that lag behind in development. When examined in detail territo-rially, inequality reveals both its cyclical and structural origins. The degrees of unequal development and the specific condi-tions surrounding them differ greatly between European re-gions, so that simple comparisons of indicators are just as out of the question as one-size-fits-all recipes for remedying them. Accordingly, the orientation of regional policies to-wards undifferentiated growth and competitiveness targets since the 1990s must be viewed critically. So far, these have ensured that economically developed centres continue to rise, while rural and structurally weak peripheral regions con-tinue to fall. The divergence has long been reflected on a small scale even within the advantaged metropolitan regions and on a large scale between the member states, especially after the economic crises of the last decade.
The double spatial and social polarization identified across all eight countries analysed here should not remain an issue dealt with purely within local authorities or within nation states. Measured against its treaty objectives of strengthen-ing intra-European cohesion and intergovernmental solidari-ty, the role of the EU must also be considered, which has so far been insufficient beyond its role as financier of invest-ment cohesion funds. Nicolas Leron (2021: 7, own transla-tion) rightly laments “the relative insignificance of the EU in spatial planning policy.” After all, the EU has played a signifi-cant role in imposing the growth and competition paradigm as well as the dominance of structural reforms and budget constraints down to the smallest local level. In particular, aus-terity policies in the euro crisis have increased social and spa-tial disparities, with which the EU has wantonly reversed al-ready achieved successes of European cohesion.
In the 21st century, the vulnerability of the EU and its mul-ti-level system is demonstrated by the rapid and ever faster succession of transnational risks, crises and challenges. A strong EU is needed to manage economic crises and pan-demics, to shape structural changes brought about by cli-mate change, digitalisation, and demographic processes, and to correct inequalities in income and wealth. To address existing disparities and prevent new ones, and to strengthen its own resilience, the EU should therefore:
I. Pursue cohesion policy instead of competition policy!
II. Develop an integrated European economic and social policy!
III. Tackle challenges together!
The unique quality of the European Union – especially in view of increasing political nationalism – does not lie in being a catalyst for globalisation. The unique quality of the European Union lies in its ability to embody a Community that thrives on the commonality of “unity in diversity” maintained and strengthened by advancing a differentiated economic and social model characterised by European specificities, and resolutely defended right through to every outlying region, protecting its citizens in the face of global challenges.
5
CONCLUSION
39CONCLUSION

Bibliography
Andersson, Lars Frederik; Bengtsson, Håkan A.; Fina, Stefan; Heider, Bastian 2021: Unequal Sweden. Regional Socio-Economic Dis-parities in Sweden, Friedrich-Ebert-Stiftung Nordic Countries, Stockholm.
Antonucci, Lotenza; Corti, Francesco 2020: Inequalities in the Euro-pean Semester, Foundation for Progressive Studies, Brussels.
Atkinson, Anthony B. 2015: Inequality: What Can Be Done? Harvard.
Bachtler, John; Berkowitz, Peter; Hardy, Sally; Muravska, Tatjana 2017: Reassessing the Performance and Direction of EU Cohesion Policy in 2014–20, in Bachtler, John; Berkowitz, Peter; Hardy, Sally; Muravska, Tatjana (eds.): EU Cohesion Policy. Reassessing Performance and Direction, London/New York, pp. 1–8.
Bailey, David J. 2009: The Political Economy of European Social Democ-racy. A Critical Realist Approach, London/New York.
Baum-Ceisig, Alexandra; Busch, Klaus; Hacker, Björn; Nospickel, Claudia 2008: Wohlfahrtsstaaten in Mittel- und Osteuropa. Entwicklun-gen, Reformen und Perspektiven im Kontext der europäischen Integra-tion, Baden-Baden.
Becker, Peter 2015: Europas soziale Dimension. Die Suche nach der Ba-lance zwischen europäischer Solidarität und nationaler Zuständigkeit, SWP- Studie S 21, November 2015, Stiftung Wissenschaft und Politik, Berlin.
Becker, Peter 2020a: Die europäische Kohäsionspolitik und die Struktur- fonds. Von der Förderung regionaler Konvergenz zum Instrument euro- päischer Wirtschaftspolitik, in: Becker, Peter; Lippert, Barbara (eds.): Handbuch Europäische Union, Wiesbaden, pp. 869–885.
Becker, Peter 2020b: Eine europäische Wirtschaftspolitik im Werden. Erfolge mit bescheidenen Mitteln, SWP-Studie 2020/S 16, August 2020, Stiftung Wissenschaft und Politik, Berlin.
Becker, Peter 2020c: Die Verhandlungen über den Haushalt der Europä-ischen Union – zwischen Kontinuität und Pandemie-Zäsur, in: integration, Vol. 43, Nr. 4/2020, pp. 257–277.
Bradford, Anu 2020: The Brussels Effect. How the European Union Rules the World, Oxford.
Brunnermeier, Markus K.; James, Harold; Landau, Jean-Pierre 2016: The Euro and the Battle of Ideas, Princeton/Oxford.
Busch, Klaus 2005: Die Perspektiven des Europäischen Sozialmodells, Arbeitspapier 932, Hans-Böckler-Stiftung, Düsseldorf.
Colino, César; Jaime-Castillo, Antonio M.; Kölling, Mario 2020: Desigualdades territoriales en España, Universidad Nacional de Educación a Distancia/Friedrich-Ebert-Stiftung España, Madrid.
Collier, Paul 2018: The Future of Capitalism: Facing the New Anxieties, New York.
Crescenzi, Riccardo; Giua, Maria 2017: Different Approaches to the Analysis of EU Cohesion Policy: Leveraging Complementarities for Evi-dence-Based Policy Learning, in: Bachtler, John; Berkowitz, Peter; Hardy, Sally; Muravska, Tatjana (eds.): EU Cohesion Policy. Reassessing Perfor-mance and Direction, London/New York, pp. 21–32.
Crouch, Colin 2004: Post-Democracy, Cambridge.
Crouch, Colin 2011: The Strange Non-Death of Neo-Liberalism, Cam-bridge.
Dauderstädt, Michael 2014: Convergence in Crisis. European Integra-tion in Jeopardy, International Policy Analysis, Friedrich-Ebert-Stiftung, Berlin.
Dauderstädt, Michael 2021: Covid 19 and Europe-Wide Income Dispar-ities. The Pandemic Stopped the Previous Decline of Inequality, Interna-tional Policy Analysis, Friedrich-Ebert-Stiftung, Berlin.
De la Porte, Caroline 2013: Social OMCs. Ideas, Policies and Effects, in: Greve, Bent (ed.): The Routledge Handbook of the Welfare State, Oxon/New York: pp. 410–418.
Deaton, Agnus 2013: The Great Escape: Health, Wealth, and the Origins of Inequality, Princeton.
Dullien, Sebastian; Herr, Hansjörg; Kellermann, Christian (eds.) 2011: Decent Capitalism. A Blueprint for Reforming our Economies, London.
Dullien, Sebastian; Paetz, Christoph; Watt, Andrew; Watzka, Sebastian 2020: Vorschläge zur Reform der europäischen Fiskalregeln und Economic Governance, IMK Report 159, Institut für Makroökonomie und Konjunkturforschung, Düsseldorf.
Eribon, Didier 2009: Retour à Reims, Paris.
Esping-Andersen, Gøsta 1990: Three Worlds of Welfare Capitalism, Princeton.
European Commission 1994: European Social Policy. A Way Forward for the Union, A White Paper, COM(94) 333, 27.07.1994, Brussels.
European Commission 2012: Communication. A Blueprint for a Deep and Genuine Economic and Monetary Union Launching a European Debate, COM(2012) 777 final, 28.11.2012, Brussels.
European Commission 2014: Communication. Guidelines on the Appli-cation of the Measures Linking Effectiveness of the European Structural and Investment Funds to Sound Economic Governance According to Ar-ticle 23 of Regulation (EU) 1303/2013, COM(2014) 494 final, 30.07.2014, Brussels.
European Commission 2017: My Region, My Europe, Our Future: The Seventh Report on Economic, Social and Territorial Cohesion, Brussels.
European Commission 2021a: Employment and Social Developments in Europe 2021, Luxembourg.
European Commission 2021b: The European Pillar of Social Rights Action Plan, Publications Office of the European Union, Luxembourg.
European Parliament 2019: Common Provisions on the European Re-gional Development Fund, the European Social Fund Plus, the Cohesion Fund, and the European Maritime and Fisheries Fund and Financial Rules for Those, TA(2019)0096, 13.02.2019, Strasbourg/Brussels.
Ferrera, Maurizio 1996: The “Southern Model” of Welfare in Social Eu-rope, in: Journal of European Social Policy, Vol. 6, Nr. 1, pp. 17–37.
Fina, Stefan; Heider, Bastian; Masso, Märt 2021: Unequal Estonia, Regional Socio-Economic Disparities in Estonia, Friedrich-Ebert-Stiftung Baltic States, Riga.
Fina, Stefan; Heider, Bastian; Matila, Maija; Rautiainen, Pauli; Sihvola, Mikko-Waltteri; Vatanen, Kaisa 2021: Unequal Finland. Regional Socio-Economic Disparities in Finland, Friedrich-Ebert-Stiftung Nordic Countries, Stockholm.
Fina, Stefan; Heider, Bastian; Prota, Francesco 2021: Unequal Italy. Regional Socio-Economic Disparities in Italy, Friedrich-Ebert-Stiftung Italy, Rome.
Fina, Stefan; Heider, Bastian; Rat, Cristina 2021: Unequal Romania. Regional Socio-Economic Disparities in Romania, Friedrich-Ebert-Stiftung Romani, Bucharest.
Fina, Stefan; Osterhage, Frank; Rönsch, Jutta; Rusche, Karsten; Siedentop, Stefan; Zimmer-Hegmann, Ralf; Danielzyk, Rainer 2019: Ungleiches Deutschland. Sozioökonomischer Disparitätenbericht 2019. Karten, Indikatoren und wissenschaftliche Handlungsempfehlun-gen, Friedrich-Ebert-Stiftung: Bonn.
Fink, Philipp; Tiemann, Heinrich 2017: Den Teufelskreis durchbrechen. Neue Strukturpolitik als eine Antwort auf wachsende Disparitäten, wiso direkt, Friedrich-Ebert-Stiftung, Bonn.
40FRIEDRICH-EBERT-STIFTUNG – POLITICS FOR EUROPE

Fratesi, Ugo; Wishdale, Fiona G. 2017: The Impact of European Cohe-sion Policy in Different Contexts, in: Regional Studies, 51:6, pp. 817–821.
Giddens, Anthony 2006: Die Zukunft des Europäischen Sozialmodells, März 2006, Internationale Politikanalyse, Friedrich-Ebert-Stiftung, Berlin.
Grimm, Dieter 2016: Europa ja – aber welches? Zur Verfassung der europäischen Demokratie, München.
Hacker, Björn 2007: Die Transformation der Sozialsysteme in Rumänien nach 1989. Westorientierung mit hausgemachten Hindernissen, in: Süd- osteuropa-Mitteilungen, Vol. 47, Nr. 04/2007, pp. 60–75.
Hacker, Björn 2019: A European Social Semester? The European Pillar of Social Rights in Practice, Etui Working Paper 2019.05, European Trade Union Institute, Brussels.
Hacker, Björn 2020: Behelfsbrücke EU-Politikkoordinierung, in: Becker, Peter; Lippert, Barbara (eds.): Handbuch Europäische Union, Wiesbaden, pp. 645–665.
Hacker, Björn; Koch, Cédric M. 2017: The Divided Eurozone. Mapping Conflicting Interests on the Reform of the Monetary Union, Friedrich-Ebert-Stiftung EU Office, Brussels.
Hall, Peter A.; Soskice, David 2001: Varieties of Capitalism. The Institu-tional Foundations of Comparative Advantage, Oxford.
Hartwig, Ines 2020: Struktur- und Regionalpolitik, in: Weidenfeld, Wer-ner; Wessels, Wolfgang; Tekin, Funda (eds.): Europa von A bis Z. Taschen-buch der europäischen Integration, pp. 547–553.
Herzog-Stein, Alexander; Nüß, Patrick; Stein, Ulrike; Albu, Nora 2020: Arbeits- und Lohnstückkostenentwicklung. Ein gespaltenes Jahr- zehnt geht zu Ende – enorme Herausforderungen warten, IMK Report 158, Juni 2020, Institut für Makroökonomie und Konjunkturforschung, Düsseldorf.
Koch, Cédric M. 2020: Varieties of Populism and the Challenges to Global Constitutionalism. Dangers, Promises and Implications, in: Global Constitutionalism, pp. 1–39.
Kok, Wim 2003: Jobs, Jobs, Jobs. Creating More Employment in Europe, Report of the Employment Taskforce. Office for Official Publications of the European Communities, Luxembourg.
Le Bras, Hervé; Warnant, Achille 2020: Ungleiches Frankreich. Radio- grafie der sozioökonomischen und regionalen Disparitäten, Friedrich- Ebert-Stiftung Frankreich, Paris.
Leron, Nicolas 2021: Regionale Ungleichheit in Frankreich. Debatten und politische Empfehlungen, Friedrich-Ebert-Stiftung Frankreich, Paris.
Lipset, Seymour Martin; Rokkan, Stein 1967: Party Systems and Voter Alignments. Cross-National Perspectives, New York.
Mazzucato, Mariana 2018: The Entrepreneurial State: Debunking Public vs. Private Sector Myths, London.
Milanovic, Branko 2016: Global Inequality: A New Approach for the Age of Globalization, Harvard.
Nachtwey, Oliver 2017: Die Abstiegsgesellschaft. Über das Aufbegeh-ren in der regressiven Moderne, Berlin.
Offe, Claus 2003: The European Model of “Social” Capitalism: Can It Survive European Integration? In: The Journal of Political Philosophy, Jg. 11, H. 4, pp. 437–469.
Piketty, Thomas 2013: Le Capital au XXIe siècle, Paris.
Piketty, Thomas 2019: Capital et idéologie, Paris.
Pilati, Marta; Hunter, Alison 2020: EU Lagging Regions: State of Play and Future Challenges. Research for REGI, European Parliament, Policy Department for Structural and Cohesion Policies, Brussels.
Raworth, Kate 2017: Doughnut Economics. Seven Ways to Think Like a 21st-Century Economist, New York.
Reckwitz, Andreas 2017: Die Gesellschaft der Singularitäten, Berlin.
Rodrik, Dani 2011: The Globalization Paradox: Democracy and the Future of the World Economy, New York.
Scharpf, Fritz W. 2002: The European Social Model: Coping with the Challenges of Diversity, in: Journal of Common Market Studies, Vol. 40, Nr. 4, pp. 645–670.
Schulmeister, Stephan 2018: Der Weg zur Prosperität, Wals bei Salz-burg.
Singer, Hans Wolfgang 1970: Dualism Revisited: A New Approach to the Problems of the Dual Society in Developing Countries, in: The Journal of Development Studies, 7:1, 60–75.
Standing, Guy 2011: The Precariat. The New Dangerous Class, London. Stiglitz, Joseph E. 2002: Globalization and its Discontents, London.
Stiglitz, Joseph E. 2012: The Price of Inequality: How Today’s Divided Society Endangers Our Future, New York.
Stiglitz, Joseph E.; Sen Armartya; Fitoussi, Jean-Paul 2010: Mis-measuring Our Lives: Why GDP Doesn’t Add Up, New York.
41BIBLIOGRAPHY

List of figures
9
9
10
10
11
11
13
14
15
18
19
20
21
22
24
26
27
30
31
Figure 1GDP per capita in PPS, selected countries 2019, EU-27 2020 = 100
Figure 2GDP per capita in PPS, selected countries and years, EU-27 2020 = 100
Figure 3Income ratio s80/s20, selected countries 2019
Figure 4Income ratio s80/s20, selected countries and years
Figure 5Risk of poverty or social exclusion in per cent EU & Eurozone
Figure 6Risk of poverty or social exclusion as per cent of population, selected countries and years
Figure 7Regional gross domestic product (PPS per inhabitant) by NUTS 2 regions, selected countries
Figure 8Number of NUTS 2 regions with strongly changing GDP per capita, selected countries
Figure 9Life expectancy by NUTS 2 regions, selected countries
Figure 10Disparity map of Germany
Figure 11Disparity map of Estonia
Figure 12Disparity map of Spain
Figure 13Disparity map of Finland
Figure 14 a/bDisparity map of France showing selected problem areas
Figure 15Disparity map of Italy
Figure 16Disparity map of Romania
Figure 17Disparity map of Sweden
Figure 18Viscous cycle of peripheral regions
Figure 19Virtuous cycle in economically developed centres
42FRIEDRICH-EBERT-STIFTUNG – POLITICS FOR EUROPE

43


.
IMPRINT
© 2021FES Nordic Countries Dr Philipp Fink
Front cover/Design/Typesetting: Heike WächterDesign concept: www.bergsee-blau.de
The views expressed in this publication are not necessarily those of the Friedrich-Ebert-Stiftung and the partner organisations for this publication. Commercial use of all media published by the Friedrich-Ebert-Stiftung (FES) is not permitted without the written consent of the FES.
Friedrich-Ebert-Stiftung www.fes.deThe Friedrich-Ebert-Stiftung (FES) is the oldest political foundation in Germany with a rich tradition dating back to its foundation in 1925. Today, it remains loyal to the legacy of its namesake and campaigns for the core ideas and values of social de-mocracy: freedom, justice and solidarity. It has close ties to social democracy and the free trade unions. FES promotes the advancement of social democracy, in particular through:
– political educational work to strengthen civil society; – think tanks; – international cooperation with our international network of offices in more
than 100 countries; – support for talented young people; – maintaining the collective memory of social democracy with archives, libraries
and more.
Foundation for European Progressive Studies (FEPS) www.feps-europe.euThe Foundation for European Progressive Studies (FEPS) is the think tank of the social democratic political family at the EU level. Its mission is to develop innovative research, policy advice, training and debates to inspire and inform progressive pol-itics and policies across Europe. FEPS operates as a hub for thinking to facilitate the emergence of progressive answers to the challenges that Europe faces. Today FEPS benefits from a solid network of 68 member organisations. In addition to this network of organisations that are active in the promotion of progressive values, FEPS also has an extensive network of partners, including renowned universities, scholars, policymakers and activists.

More Equality in Europe!The inability of democratic actors and procedures to provide rapid responses to social and economic issues has led to widespread disenchantment of political and democratic systems across Europe. As the benefits of economic growth and in-creasing employment have been unequally spread, therefore creating regional dis-parities, perceived and experienced socialeconomic inequalities and injustices have deepened and played into the hands of right-wing populists. But what are the answers to these challenges? How should policies in the EU member states and the EU tackle regional socio-economic disparities? With the project “Unequal Eu-rope – Tackling Regional Disparities in Europe”, the Friedrich-Ebert-Stiftung and the Foundation for European Progressive Studies (FEPS), put forward progressive policy recommendations based on the disparity reports for several European coun-tries for both the respective national and European level.
https://www.fes.de/en/politics-for-europe/unequal-europe