bitcoin awareness and usage in canada … · bank of canada staff working papers provide a forum...
TRANSCRIPT

Bank of Canada staff working papers provide a forum for staff to publish work-in-progress research independently from the Bank’s Governing
Council. This research may support or challenge prevailing policy orthodoxy. Therefore, the views expressed in this paper are solely those of the authors and may differ from official Bank of Canada views. No responsibility for them should be attributed to the Bank.
www.bank-banque-canada.ca
Staff Working Paper/Document de travail du personnel 2017-56
Bitcoin Awareness and Usage in Canada
Christopher S. Henry, Kim P. Huynh and Gradon Nicholls

2
Bank of Canada Staff Working Paper 2017-56
December 2017
Bitcoin Awareness and Usage in Canada
by
Christopher S. Henry, Kim P. Huynh and Gradon Nicholls
Currency Department Bank of Canada
Ottawa, Ontario, Canada K1A 0G9 [email protected] [email protected]
ISSN 1701-9397 © 2017 Bank of Canada
i
Acknowledgements
We thank Shelley Edwards and Leonard Sabetti for their comments and assistance in the
design and implementation of the Bitcoin Omnibus Survey. We are grateful to Heng
Chen, Ben Fung, Anneke Kosse, Maarten van Oordt, Helmut Stix, Jean-Philippe Vergne
and various participants in seminars and workshops for providing comments.
The views expressed in this paper are those of the authors. No responsibility for them
should be attributed to the Bank of Canada. All remaining errors are the responsibility of
the authors.

ii
Abstract
There has been tremendous discussion of Bitcoin, digital currencies and FinTech.
However, there is limited empirical evidence of Bitcoin’s adoption and usage. We
propose a methodology to collect a nationally representative sample using the Bitcoin
Omnibus Survey (BTCOS) to track the ubiquity and usage of Bitcoin in Canada. We find
that about 64 percent of Canadians have heard of Bitcoin, but only 2.9 percent own it. We
also find that awareness of Bitcoin is strongly associated with men and those with college
or university education: additionally, Bitcoin awareness is more concentrated among
unemployed individuals. On the other hand, Bitcoin ownership is associated with
younger age groups and a high-school education. Furthermore, we construct a test of
Bitcoin characteristics to gauge the level of knowledge held by respondents who were
aware of Bitcoin, including actual owners. We find that knowledge is positively
correlated with Bitcoin adoption. We attempt to reconcile the difference in awareness and
ownership by decomposing the transactional and store-of-value motives for holding
Bitcoin. Finally, we conclude with some suggestions to improve future surveys on digital
currency, in particular, to achieve precise estimates from the hard-to-reach population of
digital currency users.
Bank topics: Bank notes, Digital currencies, Econometric and statistical methods
JEL codes: E4, C12
Résumé
Le bitcoin, les monnaies numériques et les technologies financières font l’objet de vastes
débats. Toutefois, peu de données empiriques témoignent de l’adoption et de l’utilisation
du bitcoin. Nous proposons une méthode visant à composer, par l’entremise de l’enquête-
omnibus sur le bitcoin, un échantillon représentatif à l’échelle nationale afin de suivre
l’évolution du bitcoin au Canada (sa diffusion et son usage). Nous constatons qu’environ
64 % des Canadiens ont entendu parler des bitcoins, mais que seulement 2,9 % en
détiennent. D’une part, nous observons que le bitcoin est surtout connu des hommes et
des personnes ayant fréquenté le collège ou l’université, mais aussi des personnes sans
emploi. D’autre part, la détention de bitcoins se concentre dans les groupes d’âges les
plus jeunes et chez les personnes ayant fait des études secondaires. Nous élaborons
également un test sur les caractéristiques du bitcoin pour essayer de mesurer le degré de
connaissance des répondants pour qui cette monnaie est familière, y compris les
détenteurs eux-mêmes. D’après nos résultats, la connaissance du bitcoin est corrélée

iii
positivement avec son adoption. Nous tentons d’expliquer l’écart entre connaissance et
détention en distinguant deux raisons de détenir des bitcoins : effectuer une transaction ou
les utiliser comme réserves de valeur. Enfin, nous concluons par quelques suggestions
d’améliorations aux futurs sondages sur les monnaies électroniques, surtout pour obtenir
des estimations précises de la population, difficile à atteindre, des utilisateurs de monnaie
électronique.
Sujets : Billets de banque; Monnaies numériques;Méthodes économétriques et
statistiques
Codes JEL : E4, C12

Non-Technical Summary
Media and press discussion of digital currencies such as Bitcoin have increased in prevalence over
the past several years. However, the usage of digital currencies as a payment method has not kept
pace. In this paper, we explore determinants of awareness and ownership of digital currencies in
Canada, focusing on Bitcoin, the most popular digital currency.
Specifically, we utilize data from the Bitcoin Omnibus Survey (BTCOS). The BTCOS is a short,
online, nationally representative survey of Canadians that was commissioned by the Bank of
Canada and conducted by Ipsos, a well-known market research firm. The survey was conducted
in two waves in November (Wave 1) and December (Wave 2) of 2016; it includes questions
concerning Bitcoin in addition to useful demographic information, which allows us to identify
factors associated with awareness and use.
At a high level, we find that 64 percent of Canadians are aware of Bitcoin, but only 2.9 percent are
Bitcoin owners. Awareness of Bitcoin is found to be associated with men, those with a college or
university education, those who are retired or in the labour force, and those from British Columbia.
Ownership, on the other hand, is correlated with a high-school education and residing in Quebec.
In Wave 2 of the BTCOS, we introduced a knowledge test of objective facts related to the Bitcoin
system and its protocol. This test was used to create a score of Bitcoin knowledge, which was also
found to be correlated with Bitcoin ownership.
Using results from the BTCOS, we analyze both transactional and store-of-value motives for
holding Bitcoin to better understand the discrepancy between high levels of awareness and low
ownership. We conclude the paper with some lessons learned, as well as ideas for how to design
future studies focused on Bitcoin and digital currencies more broadly.

1 Introduction
Media and press discussion of digital currencies such as Bitcoin has increased in prevalence
over the last several years. However, the usage of digital currencies as a payment method
has not kept pace. In this paper, we explore determinants of awareness and ownership of
digital currency in Canada. Focusing on Bitcoin, the most popular digital currency, we find
that 64 percent of Canadians are aware of Bitcoin but only about 2.9 percent actually own
Bitcoin.
Understanding developments in alternative payment methods is important for the Bank of
Canada, the sole issuer of banknotes, so that it may undertake its role in an efficient manner
(see Arango et al. (2012) and Fung et al. (2015)). The Bank of Canada has conducted
research on Canadian payments using survey data such as the 2009 and 2013 Methods-Of-
Payment surveys, see Arango and Welte (2012) and Henry et al. (2015). These surveys
provide rich micro data on the usage of cash, debit, and credit cards. The Bank of Canada
also uses these surveys to collect data on newer payment innovations in order to conduct
research and analysis which informs planning for the short run and long run of its currency
function.
As a payment method, Bitcoin offers some intriguing features. For example, while
transactions are recorded on a publically available ledger, they are often considered to be
‘pseudonymous,’ in the sense that the address in the blockchain is not necessarily traceable
to a particular individual. Additionally, no trusted third party is required to verify Bitcoin
transactions, which allows for direct transfer of value between two parties anywhere in the
world, facilitated only by the internet. Therefore, as awareness of Bitcoin and other digital
currencies continues to increase, there is more demand to understand drivers behind their
adoption and use, as well as the potential implications for cash.
A related question for central banks, including the Bank of Canada, concerns the possi-
bility of issuing central bank digital currency (CBDC) - i.e., a digital form of cash. Engert
and Fung (2017) provide a discussion of commonly cited motivations for issuing CBDC.
For example, central banks could issue CBDC to preserve seigniorage revenue in a world
where the use of cash is limited or nonexistent. Alternatively, CBDC is sometimes touted
as a vehicle for new monetary policy tools; for example, by allowing for a direct transfer of
central bank funds to businesses and individuals. Understanding digital currencies such as
Bitcoin, which are currently already available, including the extent to which they are being
used, how they are being used, and by whom, can help in making informed policy decisions
in this area.
Why do we focus on Bitcoin in our study as opposed to digital currencies more broadly?
Historically Bitcoin was the first working example of a so-called ‘cryptocurrency,’ distin-
guishing itself from other electronic forms of payment in part by having a decentralized
2

mechanism (mining) for clearing transactions. Perhaps due to this first-mover effect, the
dominance of Bitcoin over other available digital currencies is notable. Currently, there are
about 740 digital currencies available.1 However, Bitcoin has twice the market capitalization
in US dollars compared with its nearest competitor (Ethereum), and almost ten times that
of the next biggest competitor (Ripple). A similar dominance is observed with respect to
trading volumes.
Despite this dominance, empirical studies of Bitcoin remain somewhat limited. Central
bank studies have often focused on Bitcoin usage by analyzing the history via the blockchain
or distributed ledger to provide a topography of users. (See, for example, Badev and Chen
(2014), Bolt and van Oordt (2016), and Tasca et al. (2016)). However, the characteristics of
the Bitcoin users are not known, since there is only transactional data on digital addresses
owned by users to identify a transaction, and no personal characteristics of the users are
available. A similar approach is also taken in Athey et al. (2016) where they try to overcome
this problem by employing a range of heuristics to collapse digital addresses into categories
such as businesses accepting Bitcoin versus individual consumers.
Another approach along the lines of our work here has been to use survey methodology
to study Bitcoin usage. In Canada, Technology Strategies International’s Canadian Pay-
ments Forecast (Technology Strategies International (2016)) obtained awareness and own-
ership numbers similar to our findings: 63.7 percent awareness with 3.4 percent ownership.
However, their study lacked sufficient detail (e.g., demographics, holdings of Bitcoin, stated
reasons for ownership/non-ownership, etc.) for understanding factors that drive awareness
and ownership. The Federal Reserve Bank of Boston has conducted a detailed payments
survey of the US population that includes questions on Bitcoin and other virtual currencies.
Schuh and Shy (2016) find that in 2015, 40 percent of respondents had heard of Bitcoin,
with only 1.1 percent aware of other virtual currencies. Finally, Polasik et al. (2016) con-
ducted what they consider to be the first global survey of merchants to understand factors
associated with Bitcoin acceptance and composition of sales.
This paper provides a discussion of Bitcoin awareness and ownership using data from the
Bitcoin Omnibus Survey (BTCOS). The BTCOS is a short, online, nationally representative
survey of Canadians that includes questions relating to Bitcoin, in addition to containing
useful demographic information, which allows us to identify factors associated with awareness
and use. We begin in Section 2 with a discussion of the elements of the survey’s design and an
explanation of how the BTCOS functions as a pilot study for future work on surveying digital
currency. Section 3 provides a set of descriptive figures for the awareness and ownership of
Bitcoin while section 4 contains a conditional analysis of the awareness and ownership of
1Source: https://coinmarketcap.com/ accessed on 20 November 2016. Gandal and Halaburda (2014)provide an extensive discussion of cryptocurrency competition.
3

Bitcoin. Section 5 analyzes and reconciles the disparity between awareness and ownership.
We finish by summarizing our results, discussing lessons learned from the pilot, and providing
suggestions on how to proceed with future work in Section 6.
2 The Bitcoin Omnibus Survey
As part of the Bank of Canada’s research agenda on e-money, the focus of this study is on
the adoption and use of Bitcoin specifically, as opposed to digital currencies more broadly
(see Fung and Halaburda (2014)).2
2.1 BTCOS as a pilot study
The Bitcoin Omnibus Survey (BTCOS) was initially conceived as a pilot study on the use of
digital currency in Canada, and there are several reasons why we consider it as such. First,
evidence from both Schuh and Shy (2016) and Technology Strategies International (2016)
suggests that digital currency users are a hard-to-reach population; that is, using traditional
sampling methods it can be difficult to obtain a large sample. For example, assuming that
Bitcoin use is at 3 percent in the population, to obtain a sample of 500 Bitcoin users would
require a total sample size of well over N = 16, 000. We did not consider this to be an
efficient approach. Instead, we chose to limit our expectations and obtain a small sample
of Bitcoin users from which we can begin to understand some of the factors influencing
adoption and holdings. The trade-off is that we are required to use specialized econometric
techniques (e.g., Firth rare events logit; see Section 4), and it is necessary to be qualified
about the conclusions one can draw from such a small sample.
Additionally, we plan to utilize the BTCOS for informing a potential full-scale survey on
digital currencies. A full-scale survey would entail a larger sample of digital currency users
and a more comprehensive set of questions on Bitcoin as well as other digital currencies.
One potential solution for accessing hard-to-reach populations is to use innovative sampling
schemes such as respondent-driven sampling (see Heckathorn (1997)). However, such meth-
ods require careful preparation and execution to achieve the desired statistical properties.
Analysis from the pilot study would be integral to implementing respondent-driven sampling.
Furthermore, the range of responses from the pilot can be used in developing or refining ques-
tions for the full-scale survey. See Section 6 for a further discussion of lessons learned from
the BTCOS and how it will inform a future full-scale study. Thus, the BTCOS pilot study
2More information on the Bank of Canada’s e-money research program is available at the followingwebsite: http://www.bankofcanada.ca/research/e-money/.
4
is an important first step towards a more in-depth understanding of digital currencies in
Canada.
2.2 Survey design
The BTCOS was conducted as an online omnibus survey by Ipsos, a well-known market
research firm. The omnibus format is an ongoing survey that is updated weekly with various
topics and is purposely kept short so as to consistently obtain high response rates. The
online methodology allows respondents to complete the survey on their computer or smart
phone, and provides maximum flexibility in recruiting respondents of certain demographic
profiles. Two waves of the survey were conducted, resulting in a sample size of N = 1, 997
Canadians aged 18 or older. Wave 1 of the BTCOS was conducted November 9-13, 2016
and Wave 2 on December 14-18, 2016. Results are weighted with respect to age, gender,
and region to be representative of the 2016 Canadian population. For more information on
methodology, see Appendix A.
Questions in the BTCOS focused on broad measures concerning awareness and ownership
of Bitcoin specifically, as opposed to digital currencies more broadly. An important lesson
from Schuh and Shy (2016) is that ordinary consumers - as opposed to expert researchers
studying the topic! - can easily become confused by the actual term digital currency, mis-
taking it for other payment technologies such as PayPal, or even sovereign currencies, such
as the euro. Indeed, almost 10 percent of respondents who said they were aware of digital
currency made such a mis-characterization in Schuh and Shy (2016). In addition, as our
survey design was limited to a small set of questions (see below), we did not wish to impose
an additional burden on the respondent by introducing a definition of digital currency, so
that they could reasonably answer questions about the topic.
We refer the reader to Figure 1 for the content and programming logic of the survey
questionnaire. Questions on the survey were as follows. The first question was asked to
gauge awareness: “Have you heard of Bitcoin?” If they answered YES, they proceeded to
the next question, while a NO resulted in the respondent being directed to question five, the
last question of the survey. In the second question, respondents were asked if they currently
had or owned Bitcoin. Next, Bitcoin owners were asked to provide their main reason for
owning Bitcoin and the amount of Bitcoin they owned. Respondents who had heard of
Bitcoin but did not own any were asked to provide their main reason for not owning Bitcoin
as well as if they had owned Bitcoin in the past. Finally, in question five, all respondents
were asked to provide their preferred payment method for making online purchases.
To understand why there was such a low ownership rate despite high awareness of Bitcoin,
we added a knowledge test to Wave 2 of the BTCOS. This knowledge test is inspired by work
on establishing measures of financial literacy using survey questions (see, e.g., Lusardi and
5
Mitchell (2011)). Here, we attempted to create a Bitcoin knowledge score derived from a set
of five true/false questions (see Figure 2) addressing objective facts about Bitcoin. Such a
score could potentially help to ascertain if there was a misclassification or misperception of
Bitcoin as described in Schuh and Shy (2016), and measure the extent of knowledge among
owners and non-owners. The results of the knowledge test were mixed, which we discuss in
Section 3.3; see also Section 6 for a discussion of how to improve the knowledge score using
lessons learned from the pilot.
3 Descriptive Statistics
The two initial questions on the BTCOS were “Have you heard of Bitcoin?” and “Do you
currently have or own any Bitcoin?” From these, two populations are defined: those aware
of Bitcoin and those who own Bitcoin. This section presents descriptive information about
these two populations: demographic breakdowns, reasons for choosing to own or not to
own Bitcoin, the amount of Bitcoin held by owners, the methods of payment preferred for
online purchases, and an assessment of their knowledge of the properties of Bitcoin. For
consistency, any comparisons between groups are discussed only when the differences are
statistically significant.3
3.1 Awareness
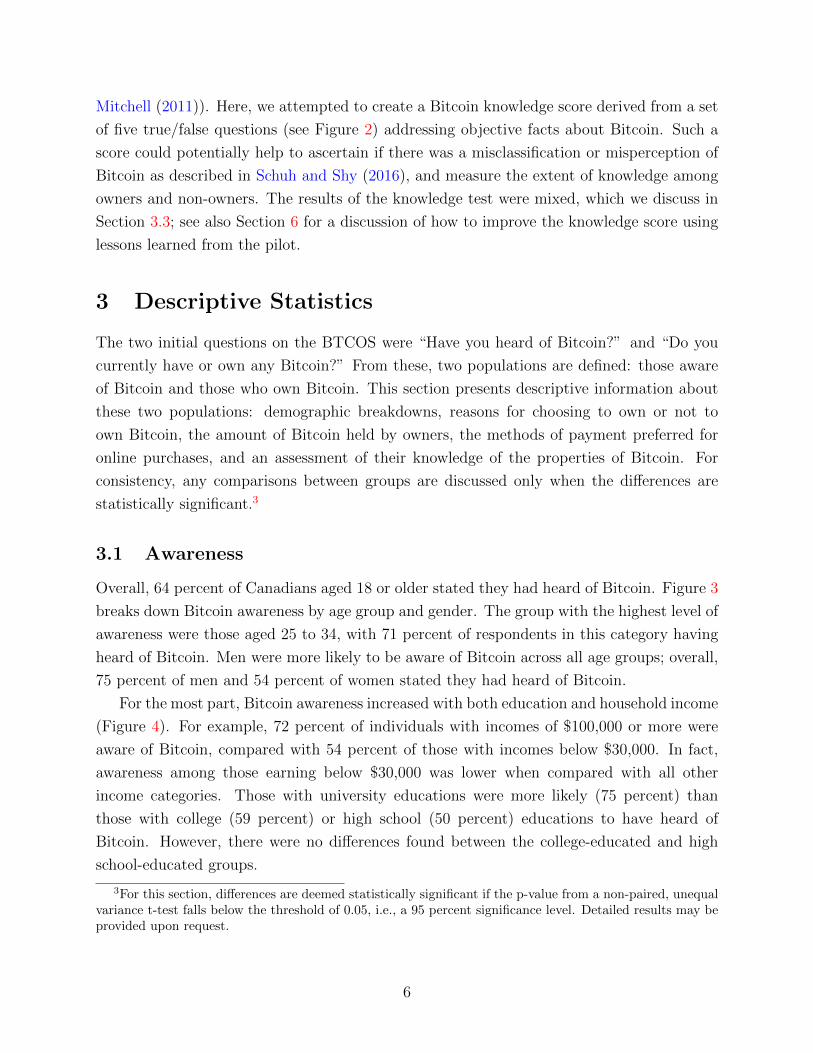
Overall, 64 percent of Canadians aged 18 or older stated they had heard of Bitcoin. Figure 3
breaks down Bitcoin awareness by age group and gender. The group with the highest level of
awareness were those aged 25 to 34, with 71 percent of respondents in this category having
heard of Bitcoin. Men were more likely to be aware of Bitcoin across all age groups; overall,
75 percent of men and 54 percent of women stated they had heard of Bitcoin.
For the most part, Bitcoin awareness increased with both education and household income
(Figure 4). For example, 72 percent of individuals with incomes of $100,000 or more were
aware of Bitcoin, compared with 54 percent of those with incomes below $30,000. In fact,
awareness among those earning below $30,000 was lower when compared with all other
income categories. Those with university educations were more likely (75 percent) than
those with college (59 percent) or high school (50 percent) educations to have heard of
Bitcoin. However, there were no differences found between the college-educated and high
school-educated groups.
3For this section, differences are deemed statistically significant if the p-value from a non-paired, unequalvariance t-test falls below the threshold of 0.05, i.e., a 95 percent significance level. Detailed results may beprovided upon request.
6
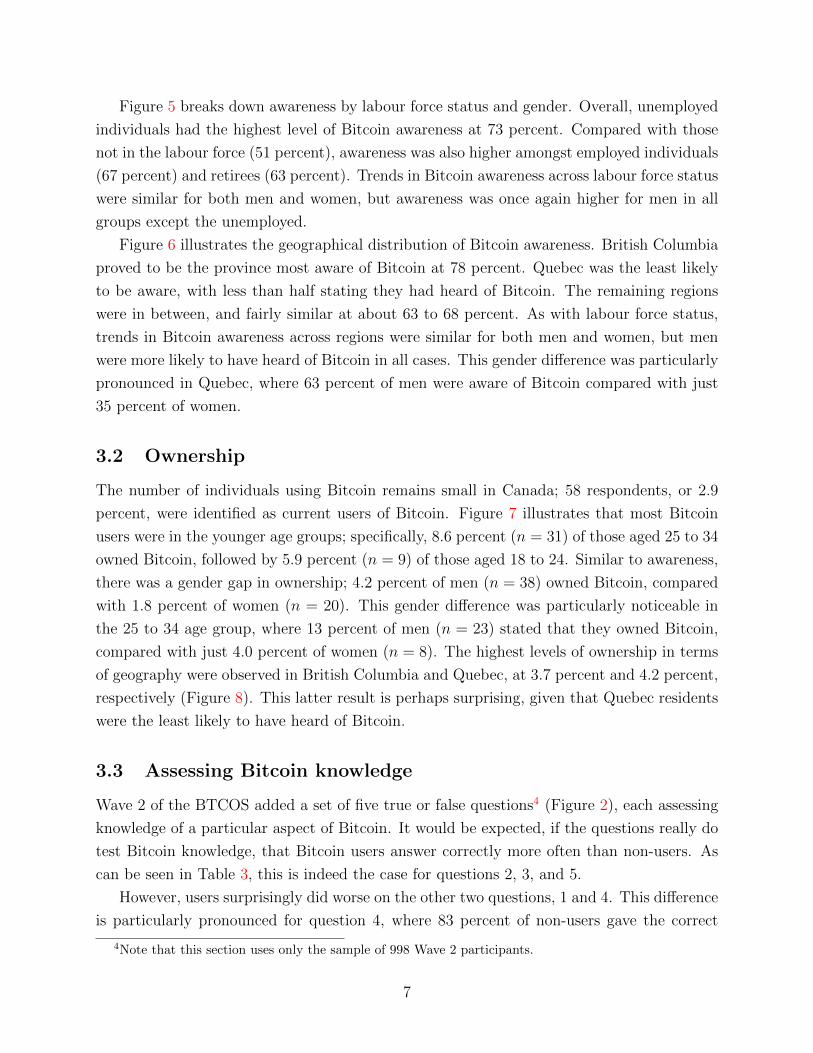
Figure 5 breaks down awareness by labour force status and gender. Overall, unemployed
individuals had the highest level of Bitcoin awareness at 73 percent. Compared with those
not in the labour force (51 percent), awareness was also higher amongst employed individuals
(67 percent) and retirees (63 percent). Trends in Bitcoin awareness across labour force status
were similar for both men and women, but awareness was once again higher for men in all
groups except the unemployed.
Figure 6 illustrates the geographical distribution of Bitcoin awareness. British Columbia
proved to be the province most aware of Bitcoin at 78 percent. Quebec was the least likely
to be aware, with less than half stating they had heard of Bitcoin. The remaining regions
were in between, and fairly similar at about 63 to 68 percent. As with labour force status,
trends in Bitcoin awareness across regions were similar for both men and women, but men
were more likely to have heard of Bitcoin in all cases. This gender difference was particularly
pronounced in Quebec, where 63 percent of men were aware of Bitcoin compared with just
35 percent of women.
3.2 Ownership
The number of individuals using Bitcoin remains small in Canada; 58 respondents, or 2.9
percent, were identified as current users of Bitcoin. Figure 7 illustrates that most Bitcoin
users were in the younger age groups; specifically, 8.6 percent (n = 31) of those aged 25 to 34
owned Bitcoin, followed by 5.9 percent (n = 9) of those aged 18 to 24. Similar to awareness,
there was a gender gap in ownership; 4.2 percent of men (n = 38) owned Bitcoin, compared
with 1.8 percent of women (n = 20). This gender difference was particularly noticeable in
the 25 to 34 age group, where 13 percent of men (n = 23) stated that they owned Bitcoin,
compared with just 4.0 percent of women (n = 8). The highest levels of ownership in terms
of geography were observed in British Columbia and Quebec, at 3.7 percent and 4.2 percent,
respectively (Figure 8). This latter result is perhaps surprising, given that Quebec residents
were the least likely to have heard of Bitcoin.
3.3 Assessing Bitcoin knowledge
Wave 2 of the BTCOS added a set of five true or false questions4 (Figure 2), each assessing
knowledge of a particular aspect of Bitcoin. It would be expected, if the questions really do
test Bitcoin knowledge, that Bitcoin users answer correctly more often than non-users. As
can be seen in Table 3, this is indeed the case for questions 2, 3, and 5.
However, users surprisingly did worse on the other two questions, 1 and 4. This difference
is particularly pronounced for question 4, where 83 percent of non-users gave the correct
4Note that this section uses only the sample of 998 Wave 2 participants.
7
answer, compared with 64 percent of holders of small amounts of Bitcoin and just 24 percent
of holders of large amounts of Bitcoin. For this question, the trend is in the opposite direction
of what one would expect. That being said, about 27 percent of non-users answered ’don’t
know’ to all five questions, whereas all Bitcoin users in the sample answered at least one of
the questions. Thus, it seems that attempting the questions was a good indicator of Bitcoin
knowledge. In order to make appropriate comparisons between users and non-users, those
who answered ‘don’t know’ to all five questions will be excluded from the remaining analysis.
In the case of question 4 specifically, the intention was to determine if individuals knew
whether Bitcoin was backed by a government or not. However, the current phrasing may
have been interpreted as “Is Bitcoin in general similar to government-backed currencies?”
rather than the intended “Is Bitcoin backed by a government?” It is possible that Bitcoin
users are more likely to consider Bitcoin to be similar to standard currencies and so would be
more likely to answer the question ‘incorrectly.’ Given the potential vagueness of question 4
and how badly Bitcoin users scored on it, it is excluded from the following analysis.
Using the remaining four questions, a score was developed to measure overall perfor-
mance. For each question, a correct answer was given a score of +1 while an incorrect
answer was given a score of -1. A respondent who answered ‘don’t know’ got a score of 0.
The overall knowledge score is simply the sum of these values, resulting in an index that
takes values from -4 to 4.
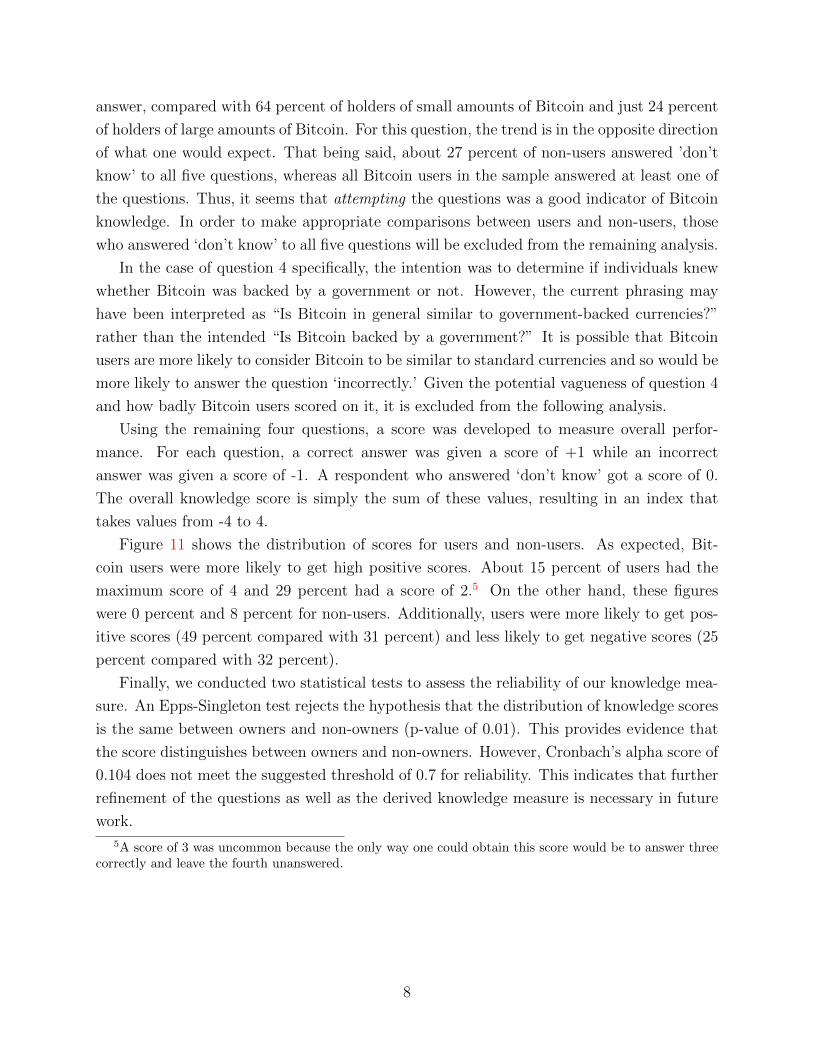
Figure 11 shows the distribution of scores for users and non-users. As expected, Bit-
coin users were more likely to get high positive scores. About 15 percent of users had the
maximum score of 4 and 29 percent had a score of 2.5 On the other hand, these figures
were 0 percent and 8 percent for non-users. Additionally, users were more likely to get pos-
itive scores (49 percent compared with 31 percent) and less likely to get negative scores (25
percent compared with 32 percent).
Finally, we conducted two statistical tests to assess the reliability of our knowledge mea-
sure. An Epps-Singleton test rejects the hypothesis that the distribution of knowledge scores
is the same between owners and non-owners (p-value of 0.01). This provides evidence that
the score distinguishes between owners and non-owners. However, Cronbach’s alpha score of
0.104 does not meet the suggested threshold of 0.7 for reliability. This indicates that further
refinement of the questions as well as the derived knowledge measure is necessary in future
work.
5A score of 3 was uncommon because the only way one could obtain this score would be to answer threecorrectly and leave the fourth unanswered.
8
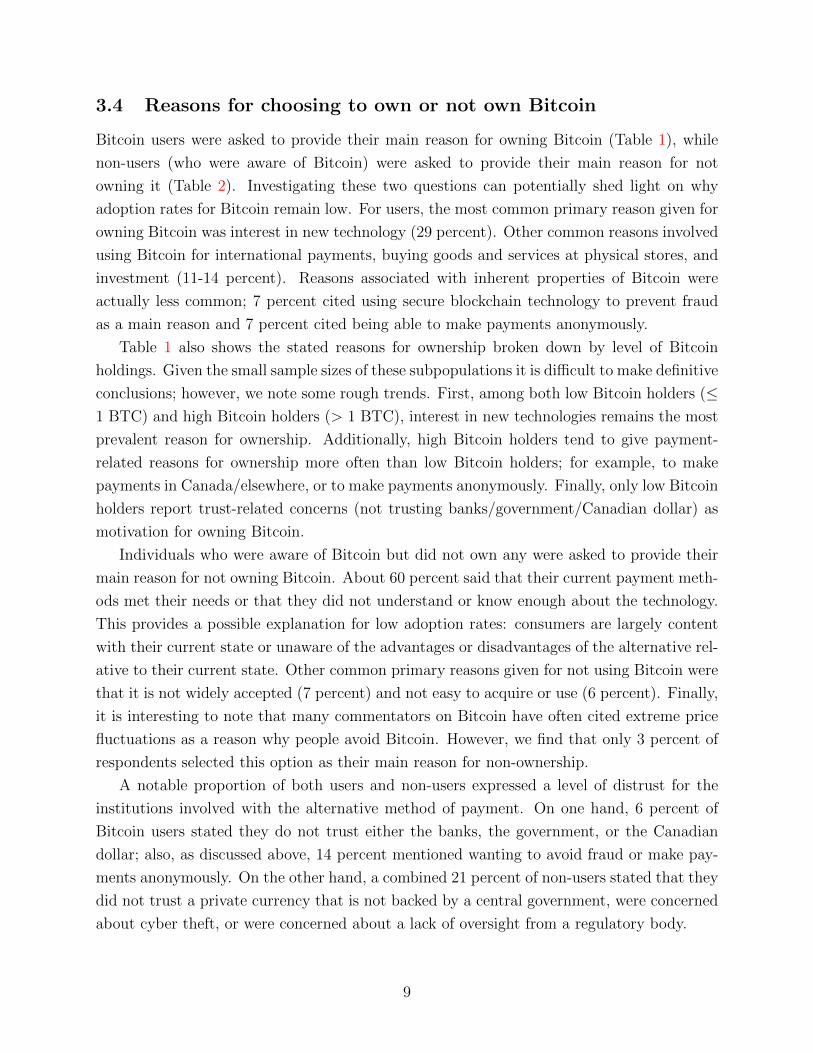
3.4 Reasons for choosing to own or not own Bitcoin
Bitcoin users were asked to provide their main reason for owning Bitcoin (Table 1), while
non-users (who were aware of Bitcoin) were asked to provide their main reason for not
owning it (Table 2). Investigating these two questions can potentially shed light on why
adoption rates for Bitcoin remain low. For users, the most common primary reason given for
owning Bitcoin was interest in new technology (29 percent). Other common reasons involved
using Bitcoin for international payments, buying goods and services at physical stores, and
investment (11-14 percent). Reasons associated with inherent properties of Bitcoin were
actually less common; 7 percent cited using secure blockchain technology to prevent fraud
as a main reason and 7 percent cited being able to make payments anonymously.
Table 1 also shows the stated reasons for ownership broken down by level of Bitcoin
holdings. Given the small sample sizes of these subpopulations it is difficult to make definitive
conclusions; however, we note some rough trends. First, among both low Bitcoin holders (≤1 BTC) and high Bitcoin holders (> 1 BTC), interest in new technologies remains the most
prevalent reason for ownership. Additionally, high Bitcoin holders tend to give payment-
related reasons for ownership more often than low Bitcoin holders; for example, to make
payments in Canada/elsewhere, or to make payments anonymously. Finally, only low Bitcoin
holders report trust-related concerns (not trusting banks/government/Canadian dollar) as
motivation for owning Bitcoin.
Individuals who were aware of Bitcoin but did not own any were asked to provide their
main reason for not owning Bitcoin. About 60 percent said that their current payment meth-
ods met their needs or that they did not understand or know enough about the technology.
This provides a possible explanation for low adoption rates: consumers are largely content
with their current state or unaware of the advantages or disadvantages of the alternative rel-
ative to their current state. Other common primary reasons given for not using Bitcoin were
that it is not widely accepted (7 percent) and not easy to acquire or use (6 percent). Finally,
it is interesting to note that many commentators on Bitcoin have often cited extreme price
fluctuations as a reason why people avoid Bitcoin. However, we find that only 3 percent of
respondents selected this option as their main reason for non-ownership.
A notable proportion of both users and non-users expressed a level of distrust for the
institutions involved with the alternative method of payment. On one hand, 6 percent of
Bitcoin users stated they do not trust either the banks, the government, or the Canadian
dollar; also, as discussed above, 14 percent mentioned wanting to avoid fraud or make pay-
ments anonymously. On the other hand, a combined 21 percent of non-users stated that they
did not trust a private currency that is not backed by a central government, were concerned
about cyber theft, or were concerned about a lack of oversight from a regulatory body.
9
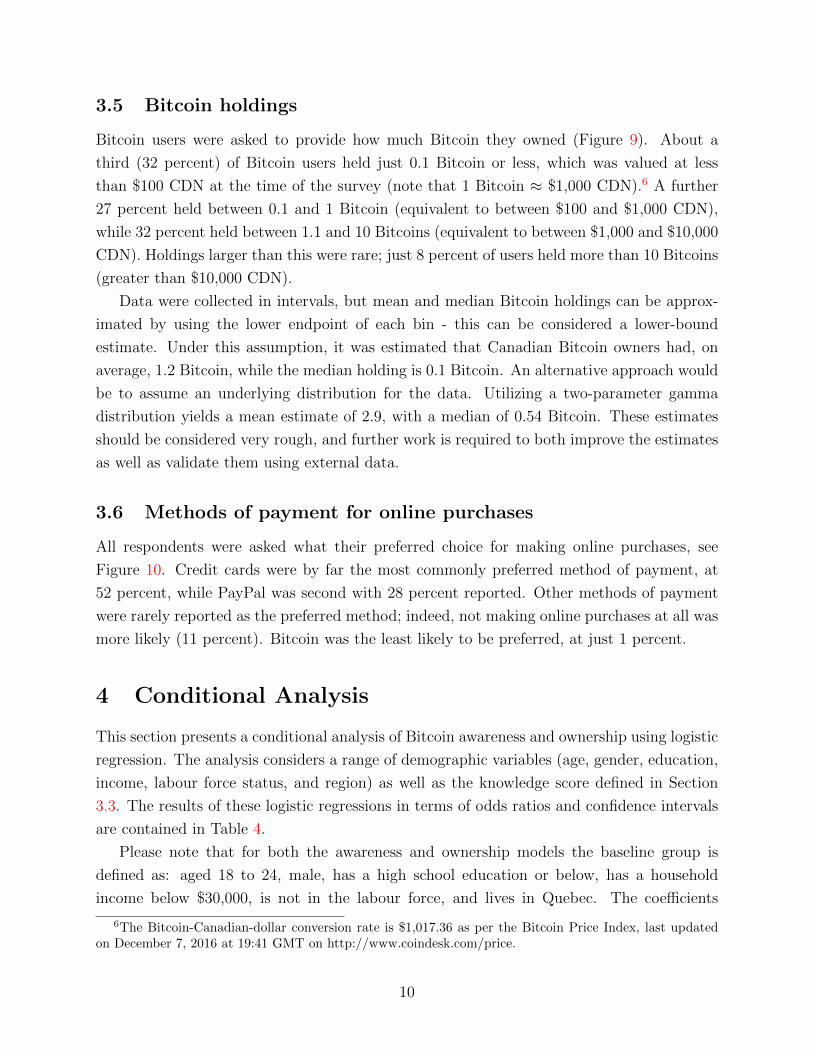
3.5 Bitcoin holdings
Bitcoin users were asked to provide how much Bitcoin they owned (Figure 9). About a
third (32 percent) of Bitcoin users held just 0.1 Bitcoin or less, which was valued at less
than $100 CDN at the time of the survey (note that 1 Bitcoin ≈ $1,000 CDN).6 A further
27 percent held between 0.1 and 1 Bitcoin (equivalent to between $100 and $1,000 CDN),
while 32 percent held between 1.1 and 10 Bitcoins (equivalent to between $1,000 and $10,000
CDN). Holdings larger than this were rare; just 8 percent of users held more than 10 Bitcoins
(greater than $10,000 CDN).
Data were collected in intervals, but mean and median Bitcoin holdings can be approx-
imated by using the lower endpoint of each bin - this can be considered a lower-bound
estimate. Under this assumption, it was estimated that Canadian Bitcoin owners had, on
average, 1.2 Bitcoin, while the median holding is 0.1 Bitcoin. An alternative approach would
be to assume an underlying distribution for the data. Utilizing a two-parameter gamma
distribution yields a mean estimate of 2.9, with a median of 0.54 Bitcoin. These estimates
should be considered very rough, and further work is required to both improve the estimates
as well as validate them using external data.
3.6 Methods of payment for online purchases
All respondents were asked what their preferred choice for making online purchases, see
Figure 10. Credit cards were by far the most commonly preferred method of payment, at
52 percent, while PayPal was second with 28 percent reported. Other methods of payment
were rarely reported as the preferred method; indeed, not making online purchases at all was
more likely (11 percent). Bitcoin was the least likely to be preferred, at just 1 percent.
4 Conditional Analysis
This section presents a conditional analysis of Bitcoin awareness and ownership using logistic
regression. The analysis considers a range of demographic variables (age, gender, education,
income, labour force status, and region) as well as the knowledge score defined in Section
3.3. The results of these logistic regressions in terms of odds ratios and confidence intervals
are contained in Table 4.
Please note that for both the awareness and ownership models the baseline group is
defined as: aged 18 to 24, male, has a high school education or below, has a household
income below $30,000, is not in the labour force, and lives in Quebec. The coefficients
6The Bitcoin-Canadian-dollar conversion rate is $1,017.36 as per the Bitcoin Price Index, last updatedon December 7, 2016 at 19:41 GMT on http://www.coindesk.com/price.
10
should be read in comparison to 1: less than 1 indicates that the group is less likely to be
aware/own relative to the base category, whereas greater than 1 indicates the group is more
likely to be aware/own. For example, consider the 45 to 54 age group in the logit model for
awareness; the conclusion drawn would be that the odds of being aware of Bitcoin are 0.6
times lower than that of the baseline age group (18 to 24) and that this is significant at 5
percent.
4.1 Awareness
Bitcoin awareness was lower among older age groups compared with the 18 to 24 age group.
However, the only significant differences were found in the 45 to 54 age group. Specifically,
compared with the youngest age group, this group had 0.6 times the odds of having heard
of Bitcoin. Gender was also a strong predictor of Bitcoin awareness; the odds of being aware
of Bitcoin were 0.4 times less for women compared with men.
Bitcoin awareness increases with education. College education was associated with an
odds of awareness 1.4 times that of the high school-educated population. For those with a
university education, this figure was 2.6. Household income, on the other hand, was not a
statistically significant predictor of Bitcoin awareness.
As for labour force status, results were again similar to Section 3.1; in particular, the
odds of having heard of Bitcoin were about 2.5 times higher for the unemployed population
compared with those not in the labour force while comparisons to the employed and retired
populations were not significant at 5 percent. This was followed by retirees (1.6 times the
odds) and employed individuals (1.4 times the odds). All the regions were more likely to be
aware of Bitcoin than the comparison region of Quebec, with British Columbia registering
the highest level of awareness. The remaining regions were in between these two and not
significantly different from each other.
4.2 Ownership
Since the rate of ownership or usage of Bitcoin is low, a rare events or Firth logit, proposed
by Firth (1993) is used to estimate the probability of ownership of Bitcoin. The Firth logit
is used instead of a standard logit due to the rare occurrence of Bitcoin owners may result
in extreme parameter estimates.7 To understand this issue, think of the limiting case where
there are no Bitcoin owners in a particular group; using a standard logit would lead to
undefined parameter estimates, since this group of Bitcoin owners would be dropped. To
adjust for these rare events, the Firth logit adds a penalization term, which results in less
7For comparison, we also computed the standard logit model, and found that the results are qualitativelysimilar to those from the Firth logit.
11
extreme estimates and avoids dropping categories. To illustrate this principle, we write out
the likelihood function for the Firth logit. Let `f be the firth penalized log-likelihood, `
be the original log-likelihood, and I the Fisher information matrix; the resulting objective
function is as follows:
`f(β) = `(β) + log(det(I(β))1/2) (1)
The intuition behind this penalization term is that the estimate of β cannot result in a
singular information matrix since the logarithm of the determinant of the information matrix
is negative infinity. Therefore, the estimate of β must result in a positive definite information
matrix so that the second term is finite. This Firth logit is estimated among the population
who are aware of Bitcoin.8
As expected, the older age groups (45 and older) were the least likely to own Bitcoin,
while the younger age groups (18 to 24 and 25 to 34) were the most likely. For example,
those in the 18 to 24 group had 10 times the odds of owning Bitcoin of those in the 55 to 64
group. The 25 to 34 age group was the most likely to own Bitcoin, and this was significant
compared with all age groups except the 18 to 24 group. Based on models 1 and 2, it seems
that while all age groups are fairly similar in their awareness of Bitcoin, actual ownership is
very concentrated among the younger groups. Contrary to the findings in Section 3.2, the
gender gap in Bitcoin ownership was not significant.
While higher education was associated with Bitcoin awareness, it seems the opposite is
true for ownership; the odds of owning Bitcoin for those with college or university educations
were both about 0.4 times smaller compared with those with a high school education or
below. For income and labour force status, trends were similar to the awareness model (i.e.
unemployed persons were more likely than other labour force statuses to own Bitcoin) but
were no longer significant. Results by region were similar to those in Section 3.2; Quebec,
despite having the lowest awareness, had the highest ownership. The remaining regions were
similar to each other, with no statistically significant differences.
In this choice model, we also added a set of indicator variables for negative, zero, and
positive Bitcoin knowledge scores (see Section 3.3). As expected, those with positive scores
had the highest Bitcoin adoption (4.0 times the odds of those with zero scores); however,
this was not significant when compared with those with negative scores. Thus, a previous
observation is reiterated here: simply attempting the questions was associated with Bitcoin
8We use the subsample of users who are aware of Bitcoin, since you can’t own Bitcoin if you haven’t heardof it. Including unaware respondents in the regression would mean that the parameters are measuring boththe effect on ownership and the effect on awareness. By restricting the population to aware participants, theeffects on ownership are isolated.
12

ownership.
5 Reconciling High Awareness and Low Ownership
The BTCOS has found that many Canadians are aware of Bitcoin but few own it, and if
so, they hold few coins (median holding of 0.54 coins). To understand this disconnect, we
review the evidence against the potential purposes of using Bitcoin, i.e., for transactional
and store-of-value purposes.
5.1 Transactional motives
One possible motivation for holding Bitcoin would be as a means of payment for making
retail purchases. However, we find that only 21 percent of owners stated that using Bitcoin
to buy goods/services in a physical store (14 percent) or buy goods/services on the internet
(7 percent) was their main reason for holding Bitcoin. A potential contributing factor for
this low number is that retail payments are inherently a two-sided transaction. Consumers
can only pay with Bitcoin where it is accepted by merchants, and conversely, merchants will
only offer to accept Bitcoin if many consumers want to pay with it; see, for example, the
discussion in Fung et al. (2017). A recent merchant survey by the Bank of Canada finds that
only 1 percent of Canadian merchants accept Bitcoin (see Kosse et al. (2017)). Given that
few merchants accept Bitcoin, it is perhaps not surprising that few consumers own Bitcoin
for making retail type transactions.
Alternatively, consumers may hold Bitcoin in place of bank funds and utilize Bitcoin
ATMs in a way similar to traditional ATMs, to obtain cash that can be used to make pur-
chases. This would also be quite challenging, however, as there were only 205 Bitcoin ATMs
in existence as of 2017.9 This pales in comparison with cash - there are over 65,000 bank
machines in Canada, with 18,711 of these being bank-owned ABMs, having no associated
in-network fees. Therefore, there are relatively few places/opportunities for Bitcoin to be
withdrawn.
The other side of Bitcoin with respect to the transactional motive is that it may be used
to participate in the shadow economy. Christin (2013) provides a comprehensive measure-
ment of the Silk Road that uses Bitcoin as its exchange currency. Due to the difficulty of
measurement, there is no estimate for the size of the Bitcoin-denominated shadow economy
in Canada. However, Dunbar and Fu (2015) use Canadian micro data on consumption and
income and estimate that 14 to 19 percent of Canadian GDP is under-reported. Their find-
ings provide an estimate that the shadow economy is non-trivial in Canada. As a point of
9 As of 14 August 2017, Bitcoin ATMs: https://coinatmradar.com/country/38/bitcoin-atm-canada; CashATMs: Canadian Bankers Association: http://www.cba.ca/abm-market-in-canada.
13
comparison, they bound their estimate with results from Statistics Canada using national
accounts, which finds that the shadow economy is about 3 percent, and with some macroe-
conomic studies, which finds that it is about 15 percent. It is hard to extrapolate the level
of under-reporting of Bitcoin adoption and ownership from these studies. However, if we
assume that respondents who engage in the shadow economy do not respond to surveys or
understate their Bitcoin holdings, then our survey estimates of ownership and holdings of
Bitcoin holdings would be an underestimate.
Finally, to provide additional context to the discussion of the transactional motive, we
compare the profile of Bitcoin adopters with the adoption profiles of other payment inno-
vations geared toward making transactions, both at the point of sale and online. Table 5
compares the logit analysis on Bitcoin ownership from Table 4 with that of selected payment
innovations from the 2013 Methods-of-Payment (MOP) survey, using similar demographic
categories (see Henry et al. (2015) for further details on the 2013 MOP survey). We report
only the significant coefficients from the logit models and show the direction of the sign; ‘+’
indicates groups more likely to adopt, whereas ‘-’ indicates groups less likely, relative to the
base category.
We see that the demographic profile of Bitcoin adopters is noticeably different from these
other payment innovations. In particular, education and regional effects for contactless 10
and mobile payments are in fact the opposite of those for Bitcoin adoption. More-educated
Canadians are more likely to adopt these payment technologies, while less-educated Cana-
dians are adopting Bitcoin. Relative to Quebec, all regions are less likely to adopt Bitcoin;
however, British Columbia and Ontario are more likely to use contactless forms of payment,
and British Columbia is more likely to use mobile payment apps. Finally, higher income is
an important predictor, especially of contactless adoption, whereas this variable does not
appear as significant for Bitcoin. For online payment methods, regional and age predictors
are similar to those for Bitcoin, whereas income and education factors show opposite effects.
It remains unclear – and a topic for future work – exactly what is driving these differ-
ences. They may suggest that Bitcoin is not being used primarily for transactional purposes.
However it is also possible that a different profile of users choose Bitcoin to transact precisely
because of its unique properties; for example, providing anonymity for online transactions.
Indeed, we observe that 7 percent of owners state that making payments anonymously is
their main reason for holding Bitcoin.
10Fung et al. (2014) highlight the impact of contactless credits on cash usage, especially for low-valuetransactions.
14

5.2 Store-of-value motives
From the 2013 Methods-of-Payment survey we observe respondents that hold physical cur-
rency (i.e., Canadian cash) as a store of value, for example for emergency scenarios or due to
a lack of trust in banks. It is possible that respondents may use Bitcoin for the store-of-value
motive as well. For example, 3 percent of owners stated that a lack of trust in banks was their
main reason for owning Bitcoin. Perhaps more relevant for Bitcoin, the store-of-value motive
could also include speculation on the price of Bitcoin. Indeed, the Canada Revenue Agency
has explicitly recognized Bitcoin capital gains as taxable income.11 Further, 12 percent of
Bitcoin owners state that their motivation for holding Bitcoin is as an investment.
Table 6 provides a comparison of demographic characteristics between those who have
high precautionary cash holdings, i.e. other than in their wallets or on their persons, versus
those who have high Bitcoin holdings. The definitions are standardized in terms of value,
i.e., high cash holdings is defined as holding above $1000 in cash; while high Bitcoin holding
is defined as holding greater than 1 BTC ≈ $1000. The demographic profiles are strikingly
different. For example, 70 percent of high Bitcoin holders are aged 18-34 compared with
only 20 percent for high cash holders. For the older demographic group of age 55 plus, this
pattern is reversed, with 44 percent who are high cash holders versus 8 percent who are high
Bitcoin holders. Other striking patterns are in terms of gender and education attainment.
The proportion of high Bitcoin holders is 70 percent male, while the share of cash holders
is almost equally divided between men and women. Of the high Bitcoin holders, 75 percent
are university educated versus the 26 percent proportion who are high cash holders. This
demographic profile suggests that Bitcoin is a vehicle for younger, male, and the more highly
educated to use Bitcoin as a store of value.
Next, we investigate two indirect measures of the speculative motive. First, Bolt and
van Oordt (2016) build a model to decompose the transaction and speculative motives for
holding Bitcoins (see Figure 1 of their paper). Their analysis finds that the speculative
motive accounts for about 80 percent of the price of Bitcoin. The second measure is based
on Google trends, which is used to correlate the relative number of Google searches (as a
proxy for Bitcoin trading and speculation) with the growth rate of the Bitcoin-Canadian-
dollar exchange rate (as a proxy for the price speculative motive) (see Figure 12).12 Our
analysis reveals a positive correlation of 0.23 of these two measures. Therefore, an increased
interest in Bitcoin is associated with an increase in the price of Bitcoin. These two indirect
11The CRA regulations on barter and capital gains are available at the following URL:http://www.cra-arc.gc.ca/E/pub/tp/it490/README.html
http://www.cra-arc.gc.ca/E/pub/tp/it479r/README.html12This analysis was inspired by the following article: https://www.coindesk.com/
using-google-trends-detect-bitcoin-price-bubbles/ The author uses Google trends to forecastprice bubbles and inform trading strategies.
15

measures provide evidence that there is a speculative motive. This result, plus the difference
in the demographic profiles, is consistent with the view that cash is stable in a low-inflation
environment and used by older and less-educated respondents while younger respondents see
Bitcoin’s price volatility as related to higher returns and therefore useful for speculation.
6 Conclusions
We conclude with a discussion of our results and some lessons learned from our pilot study.
6.1 Discussion of results
To obtain measurements on the use of digital currency in Canada, the Bank of Canada
conducted the Bitcoin Omnibus Survey. From a sample of 1,997 Canadians, it was found
that almost 64 percent stated that they had heard of Bitcoin. However, adoption of Bitcoin
remains low, at just 2.9 percent overall (5 percent among those aware of Bitcoin). Conditional
analysis shows that the awareness of Bitcoin was strongly associated with men and those
with college or university educations. Additionally, Bitcoin awareness was more concentrated
among those who are retired or in the labour force, as well as in British Columbia.
Bitcoin ownership, on the other hand, was associated with younger age groups and a high-
school education. Additionally, while Quebec had the lowest awareness, it had the highest
adoption rates. We proposed a knowledge score for Bitcoin, which had mixed results; the
score distinguishes between owners and non-owners; however, it did not meet the required
threshold to be considered ‘reliable’ (see Section 3.3). Further analysis of the transactional
and store-of-value motives for Bitcoin helps provide context for the high awareness and low
ownership. Based on our findings, we are still in the early part of the S-curve of adoption of
Bitcoin, especially for transactional purposes. Similar results are found in the United States
by Schuh and Shy (2016). Even popular payment innovations such as contactless credit cards
take time to penetrate the market (see Chen et al. (2017a)).
The low rate of ownership of Bitcoin may be surprising to some, considering all the
media attention given to Bitcoin. However, a recent study by Catalini and Tucker (2016)
provides additional context for the low Bitcoin ownership. In this study, they conducted an
experiment where they “seeded the S-curve” to increase the adoption of Bitcoin by focusing
on a highly educated and technically savvy population. In 2014, the MIT Digital Economy
laboratory conducted an experiment where all incoming MIT undergraduates were given a
Bitcoin wallet with $100 worth of Bitcoin. One of their main findings was that 11 percent
of the students liquidated their Bitcoin wallets within two weeks of receipt. Given that the
sample contained many of the characteristics we discussed earlier as being correlated with
16

Bitcoin ownership, this suggests that there are still other relevant factors that need to be
considered.
Finally, we provide a back-of-the-envelope calculation to situate our findings with respect
to external network data. Using our lower-bound estimate of mean Bitcoin holdings (1.2),
we extrapolate that there are currently 1,003,000 Bitcoins held in Canada. This amounts
to roughly 6 percent of the total number of Bitcoins in circulation as of Q4 2016, when the
BTCOS was conducted.13 Further validation could potentially be performed using admin-
istrative data from the Canadian Bitcoin exchange; Lohr and Raghunathan (2017) discuss
how to use survey data more efficiently by combining survey data with information from
large data sources.
6.2 Lessons learned and future work
As discussed in Section 2.1, the BTCOS was intended to be a pilot study which could inform
future surveys on digital currencies. What lessons do we draw from this pilot study? First,
we have confirmed that Bitcoin owners are a hard-to-reach population, in the sense that it
is difficult to obtain a large sample via stratified random sampling. A total sample size of
1,997 can be considered large in the realm of survey statistics. However, from a sample of
only 58 Bitcoin users it is more challenging to conduct in-depth cross-sectional analysis due
to the inherently small cell sizes.
To address this, we propose using a methodology called respondent-driven sampling
(RDS), which has to the potential to be a more cost-effective and efficient method for obtain-
ing a sample of digital currency users. In RDS respondents are asked to recruit people they
know to the survey. To motivate participation, respondents are given an incentive for their
response to the survey as well as an additional incentive for each person they successfully
recruit (see Heckathorn (1997)). RDS is similar to snowball sampling (a type of convenience
sample), but aims to produce unbiased and efficient estimates by taking into account that
individuals with more connections are more likely to be sampled and that different groups
have different recruitment patterns. Liebau and Schonlau (2012) provide a Stata command
for performing this analysis.
The BTCOS can inform an RDS study in several ways. Knowing the basic demographic
profile of Bitcoin users allows us to construct simulation studies. In these simulations we can
vary relevant parameters such as the recruitment probability or network size and explore the
resulting impact on the final sample size of digital currency users obtained via RDS. This
helps us to better design the incentive structure for the study and hence understand the cost
trade-offs involved. Work is already under way to experiment with these simulations using
13Data are from https://www.statista.com/statistics/247280/number-of-bitcoins-in-circulation/;there were 16.08 million total Bitcoins in circulation in Q4 of 2016.
17
the data provided by the BTCOS in Chen et al. (2017b).
Further, a subset of Bitcoin owners who completed the BTCOS agreed to participate
in a future study relating to digital currency. Hence, we can tap these respondents to
be part (or all) of the seed population, i.e., the initial respondents who start off the RDS
procedure. Alternatively we may re-contact the respondents to obtain additional data, which
would better prepare us to conduct an RDS study. For example, since RDS relies on the
recruitment of peers, it would be useful to know how many people a respondent typically
knows who have Bitcoin. It is plausible that many Bitcoin users only know other users
through online forums with varying degrees of anonymity. Thus, further questions on the
nature of their relationships with other Bitcoin users could also be a good indicator of how
successful RDS would be.
Additionally, results from the BTCOS will be useful for developing the questionnaire for
a full-scale survey on digital currency. First, we would keep and improve on the knowledge
score by sharing our results with academics and other experts studying digital currency, to
obtain broad agreement about objective facts concerning Bitcoin and taking into account the
considerations discussed in Section 3.3. Ideally, an improved score would meet the reliability
criterion determined by Cronbach’s alpha measure and could be used as a standardized test
of Bitcoin knowledge in other surveys. Second, it is clear that estimates of Bitcoin holdings
need to be more precise; this would allow us to calibrate our survey data to external network
data as suggested above, using the methodology proposed in Lohr and Raghunathan (2017).
This implies that we need to ask directly about the amount of Bitcoin holdings, or at least
increase the number of bins that respondents can select from.
Third, and final, discussion of the BTCOS results have helped us identify where to concen-
trate the focus of a future study, in particular by analyzing the main reasons for ownership.
It is our contention, given the still early state of knowledge of digital currency use, that focus
should be placed on identifying and classifying different types of users; for example, casual
users versus investors/speculators versus shadow economy participants. Understanding the
composition of these types of users would be important for better understanding the future
of digital currency use as well as the implications for the use of cash.
References
Arango C, Huynh KP, Fung B, Stuber G. 2012. The changing landscape for retail payments
in canada and the implications for the demand for cash. Bank of Canada Review 2012
Autumn: 31–40.
Arango C, Welte A. 2012. The bank of canada’s 2009 methods-of-payment survey: Method-
ology and key results. Bank of Canada Discussion Paper 2012-6.
18
Athey S, Parashkevov I, Sarukkai V, Xia J. 2016. Bitcoin Pricing, Adoption, and Usage:
Theory and Evidence. mimeo.
Badev A, Chen M. 2014. Bitcoin: Technical background and data analysis. Finance and
Economics Discussion Series 2014-104, Board of Governors of the Federal Reserve System
(U.S.).
Bolt W, van Oordt M. 2016. On the Value of Virtual Currencies. Staff Working Papers
16-42, Bank of Canada.
Catalini C, Tucker C. 2016. Seeding the S-Curve? The Role of Early Adopters in Diffusion.
NBER Working Papers 22596, National Bureau of Economic Research, Inc.
Chen H, Felt MH, Huynh KP. 2017a. Retail payment innovations and cash usage: accounting
for attrition by using refreshment samples. Journal of the Royal Statistical Society: Series
A (Statistics in Society) 180: 503–530. ISSN 1467-985X.
Chen H, Henry CS, Liu X. 2017b. RDS Simulation Report. mimeo.
Christin N. 2013. Traveling the silk road: A measurement analysis of a large anonymous
online marketplace. In Proceedings of the 22Nd International Conference on World Wide
Web, WWW ’13. New York, NY, USA: ACM. ISBN 978-1-4503-2035-1, 213–224.
Dunbar GR, Fu C. 2015. Sheltered Income: Estimating Income Under-Reporting in Canada,
1998 and 2004. Staff Working Papers 15-22, Bank of Canada.
Engert W, Fung B . 2017. Central Bank Digital Currency: Motivations and Implications.
Staff Discussion Paper 2017-16, Bank of Canada.
Firth D. 1993. Bias reduction of maximum likelihood estimates. Biometrika 80: 27–38.
Fung B, Halaburda H. 2014. Understanding Platform-Based Digital Currencies. Bank of
Canada Review 2014: 12–20.
Fung B, Huynh K, Sabetti L. 2014. The impact of retail payment innovations on cash usage.
Journal of Financial Market Infrastructures 3: 1–29.
Fung B, Huynh KP, Kosse A. 2017. Cash use and acceptance at the Point-Of-Sale. Bank of
Canada Review 2017.
Fung B, Huynh KP, Stuber G. 2015. The Use of Cash in Canada. Bank of Canada Review
2015: 45–56.
19
Gandal N, Halaburda H. 2014. Competition in the Cryptocurrency Market. Staff Working
Papers 14-33, Bank of Canada.
Heckathorn DD. 1997. Respondent-driven sampling: A new approach to the study of hidden
populations. Social Problems 44: 174–199. ISSN 0037-7791.
Henry C, Huynh K, Shen R. 2015. 2013 Methods-of-Payment Survey Results. Discussion
Papers 15-4, Bank of Canada.
Kosse A, Chen H, Felt MH, Jiongo VD, Nield K, Welte A. 2017. The Cost of Point-of-Sale
Payments in Canada. Staff Discussion Paper 2017-4, Bank of Canada.
Liebau E, Schonlau M. 2012. Respondent-driven sampling. Stata Journal 12: 72–93(22).
Lohr S, Raghunathan T. 2017. Combining survey data with other data sources. Statistical
Science 32: 293–312.
Lusardi AM, Mitchell OS. 2011. Financial literacy around the world: An overview. Journal
of Pension Economics and Finance 10: 497–508.
Polasik M, Piotrowska AI, Wisniewski TP, Kotkowski R, Lightfoot G. 2016. Price Fluctu-
ations and the Use of Bitcoin: An Empirical Inquiry. International Journal of Electronic
Commerce 20: 9–49.
Schuh S, Shy O. 2016. U.S. consumers’ adoption and use of bitcoin and other virtual cur-
rencies. Mimeo.
Tasca P, Liu S, Hayes A. 2016. The evolution of the bitcoin economy: Extracting and
analyzing the network of payment relationships. Mimeo.
Technology Strategies International. 2016. Canadian payments forecast: 2016. Technical
report.
20

Figure 1: Schematic of Survey (Wave 1/2)1. Have you heard of Bitcoin?
Yes No
[IF YES TO Q1, ASK Q2, ELSE SKIP TO Q5]
2. Do you currently have or own any Bitcoin?
Yes No
[IF YES TO Q2, ASK Q3a and Q3b, ELSE SKIP TO Q4a]
3a. Please tell us your main reason for owning Bitcoin.
(Select one)
[RANDOMIZE LIST]
I am interested in new technologies
It is an investment
I use it to buy goods and services on the internet in Canada/elsewhere
I use it to buy goods and services in physical stores in Canada/elsewhere
It allows me to make payments anonymously
I use it to make remittances or other international payments
It uses secure blockchain technology to prevent loss and fraud
I do not trust banks
I do not trust the government or the Canadian dollar
[ANCHOR] Other (specify)
3b. How many Bitcoin do you own?
(Select one)
None, Less than 0.1, 0.1 to 1, 1.1-10, More than 10, Unsure/would rather not say
[IF NO TO Q2, ASK Q4a and Q4b, ELSE SKIP TO Q5]
4a. Have you owned or used Bitcoin in the past, but subsequently stopped using it?
Yes, No
4b. Please tell us your main reason for not owning any Bitcoin.
[RANDOMIZE LIST]
I do not understand/know enough about the technology
It is not widely accepted as a method of payment
My current payment methods meet all my needs
The value of Bitcoin varies too much
It is not easy to acquire/use
I do not trust a private currency that is not backed by the central government
I am concerned about cyber theft
I am concerned about lack of oversight from regulatory bodies
I use alternative digital currencies instead (e.g. Dogecoin, Litecoin, Ripple,etc)
[ANCHOR] Other (specify)
[ASK ALL]
5. What is your preferred method of payment for making purchases online?
(Select one)
[RANDOMIZE LIST]
Credit card, PayPal, Interac online, Interac e-transfer, Bitcoin
[ANCHOR 2ND LAST] Other
[ANCHOR LAST] I do not make purchases online
21
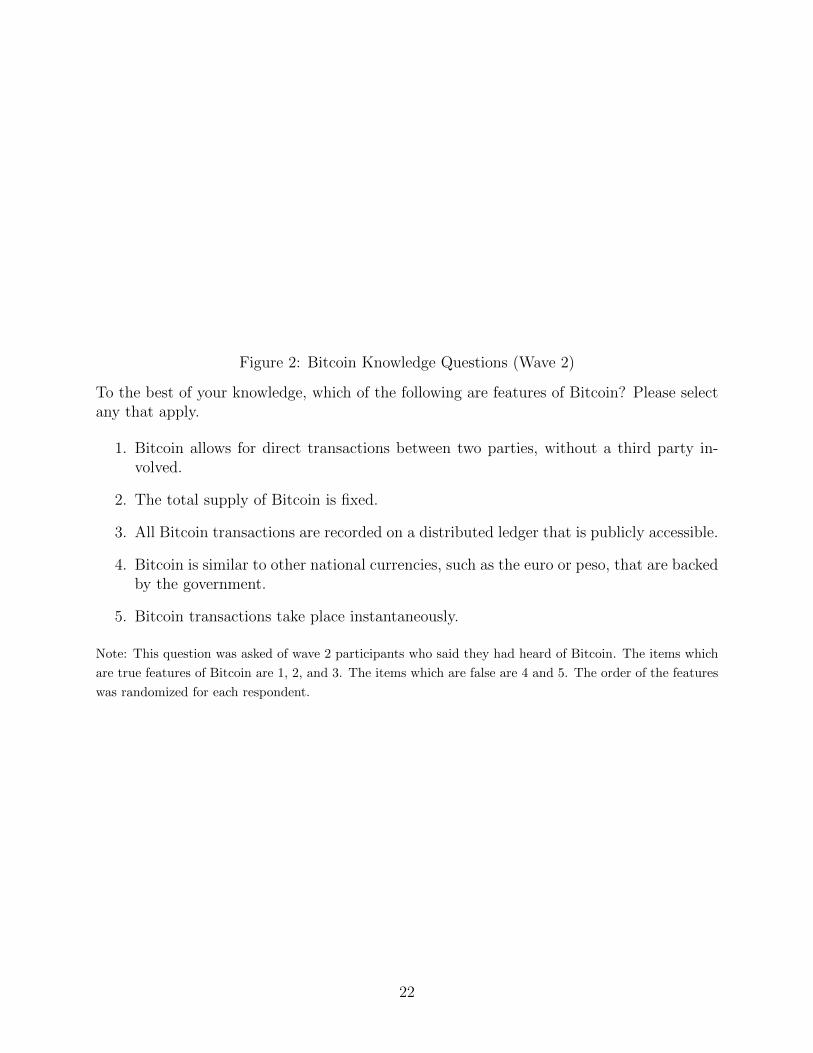
Figure 2: Bitcoin Knowledge Questions (Wave 2)
To the best of your knowledge, which of the following are features of Bitcoin? Please selectany that apply.
1. Bitcoin allows for direct transactions between two parties, without a third party in-volved.
2. The total supply of Bitcoin is fixed.
3. All Bitcoin transactions are recorded on a distributed ledger that is publicly accessible.
4. Bitcoin is similar to other national currencies, such as the euro or peso, that are backedby the government.
5. Bitcoin transactions take place instantaneously.
Note: This question was asked of wave 2 participants who said they had heard of Bitcoin. The items which
are true features of Bitcoin are 1, 2, and 3. The items which are false are 4 and 5. The order of the features
was randomized for each respondent.
22
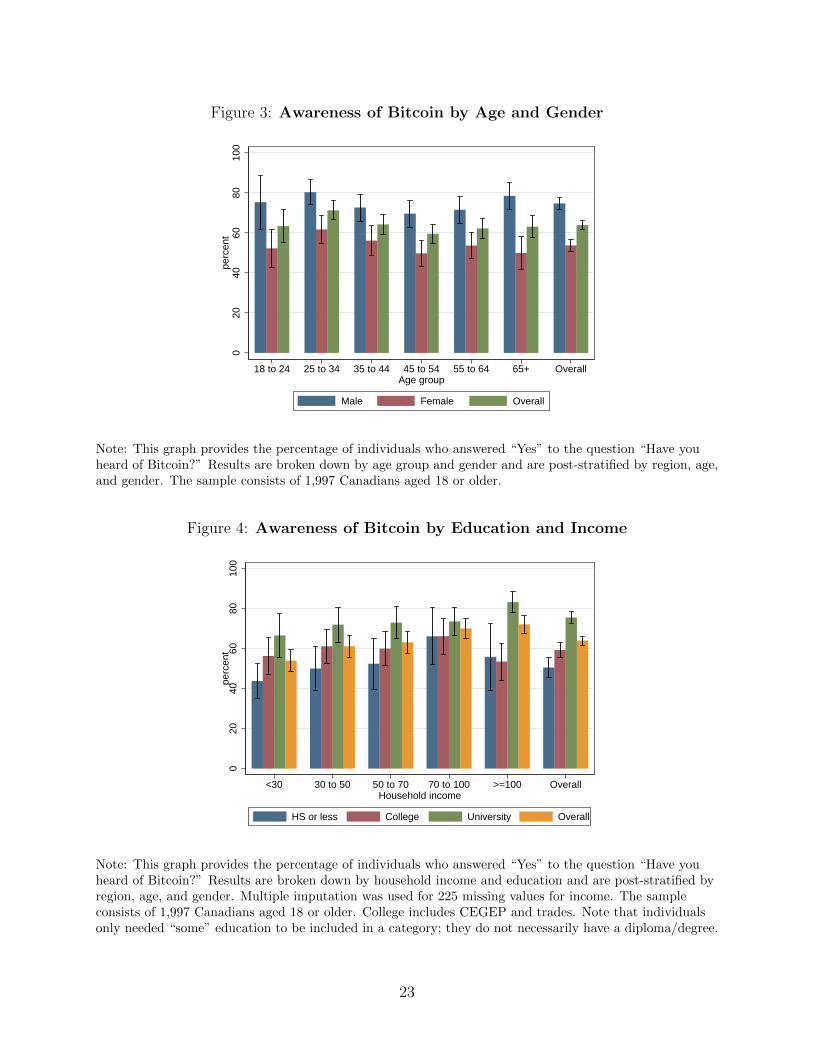
Figure 3: Awareness of Bitcoin by Age and Gender
020
4060
8010
0pe
rcen
t
18 to 24 25 to 34 35 to 44 45 to 54 55 to 64 65+ OverallAge group
Male Female Overall
Note: This graph provides the percentage of individuals who answered “Yes” to the question “Have youheard of Bitcoin?” Results are broken down by age group and gender and are post-stratified by region, age,and gender. The sample consists of 1,997 Canadians aged 18 or older.
Figure 4: Awareness of Bitcoin by Education and Income
020
4060
8010
0pe
rcen
t
<30 30 to 50 50 to 70 70 to 100 >=100 OverallHousehold income
HS or less College University Overall
Note: This graph provides the percentage of individuals who answered “Yes” to the question “Have youheard of Bitcoin?” Results are broken down by household income and education and are post-stratified byregion, age, and gender. Multiple imputation was used for 225 missing values for income. The sampleconsists of 1,997 Canadians aged 18 or older. College includes CEGEP and trades. Note that individualsonly needed “some” education to be included in a category; they do not necessarily have a diploma/degree.
23

Figure 5: Awareness of Bitcoin by Labour Force Status and Gender
020
4060
8010
0pe
rcen
t
Employed UnemployedNot in labour force Retired OverallLabour force status
Male Female Overall
Note: This graph provides the percentage of individuals who answered “Yes” to the question “Have youheard of Bitcoin?” Results are broken down by labour force status and gender and are post-stratified withrespect to region, age, and gender. Multiple imputation was used for 22 missing values for labour forcestatus. The sample consists of 1,997 Canadians aged 18 or older. Employed includes full-time, part-time,self-employed, and military. Unemployed includes those looking for work. Not in labour force includesthose not looking for work, long-term sick or disabled, full-time parents/homemakers, and students/pupils.
Figure 6: Awareness of Bitcoin by Province and Gender
020
4060
8010
0pe
rcen
t
B.C. Prairies Ontario Quebec Atlantic OverallRegion
Male Female Overall
Note: This graph provides the percentage of individuals who answered “Yes” to the question “Have youheard of Bitcoin?” Results are broken down by region and gender and are post-stratified with respect toregion, age, gender, and education. The sample consists of 1,997 Canadians aged 18 or older.
24
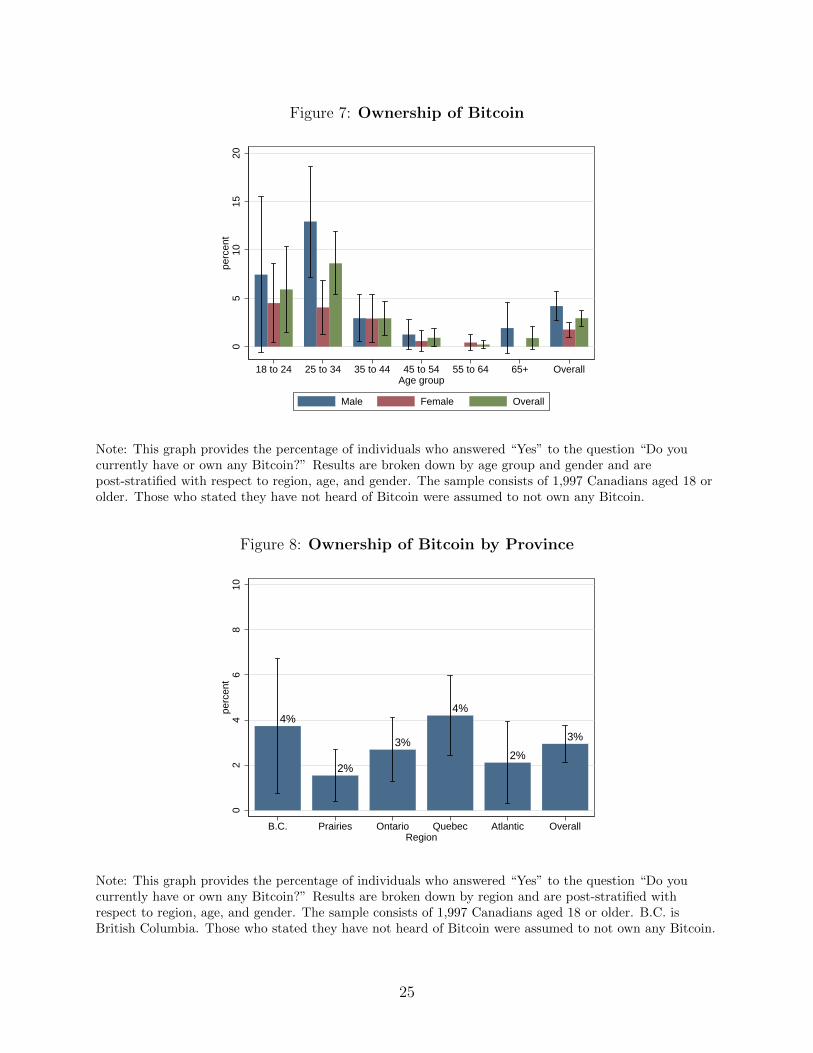
Figure 7: Ownership of Bitcoin
05
1015
20pe
rcen
t
18 to 24 25 to 34 35 to 44 45 to 54 55 to 64 65+ OverallAge group
Male Female Overall
Note: This graph provides the percentage of individuals who answered “Yes” to the question “Do youcurrently have or own any Bitcoin?” Results are broken down by age group and gender and arepost-stratified with respect to region, age, and gender. The sample consists of 1,997 Canadians aged 18 orolder. Those who stated they have not heard of Bitcoin were assumed to not own any Bitcoin.
Figure 8: Ownership of Bitcoin by Province
4%
2%
3%
4%
2%
3%
02
46
810
perc
ent
B.C. Prairies Ontario Quebec Atlantic OverallRegion
Note: This graph provides the percentage of individuals who answered “Yes” to the question “Do youcurrently have or own any Bitcoin?” Results are broken down by region and are post-stratified withrespect to region, age, and gender. The sample consists of 1,997 Canadians aged 18 or older. B.C. isBritish Columbia. Those who stated they have not heard of Bitcoin were assumed to not own any Bitcoin.
25

Figure 9: Holdings of Bitcoin
32%
27%
32%
8%
010
2030
4050
60pe
rcen
t
Less than 0.1 0.1 to 1 1.1 to 10 More than 10Amount of Bitcoin owned
Note: This graph provides the distribution of responses to the question “How many Bitcoin do you own?”Results are post-stratified with respect to region, age, and gender. The sample consists of 57 Canadiansaged 18 or older who said they have or own Bitcoin.
Figure 10: Preferred Method of Online Payments
52%
28%
4% 2% 1% 1%
11%
010
2030
4050
60pe
rcen
t
Credit card PayPal Interaconline
Interacetransfer
Bitcoin Other No onlinepurchases
Method of payment
Note: This graph provides the distribution of responses to the question “What is your preferred method ofpayment for making purchases online?” Results are weighted with respect to region, age, gender, andeducation. The sample consists of 1,997 Canadians aged 18 or older.
26
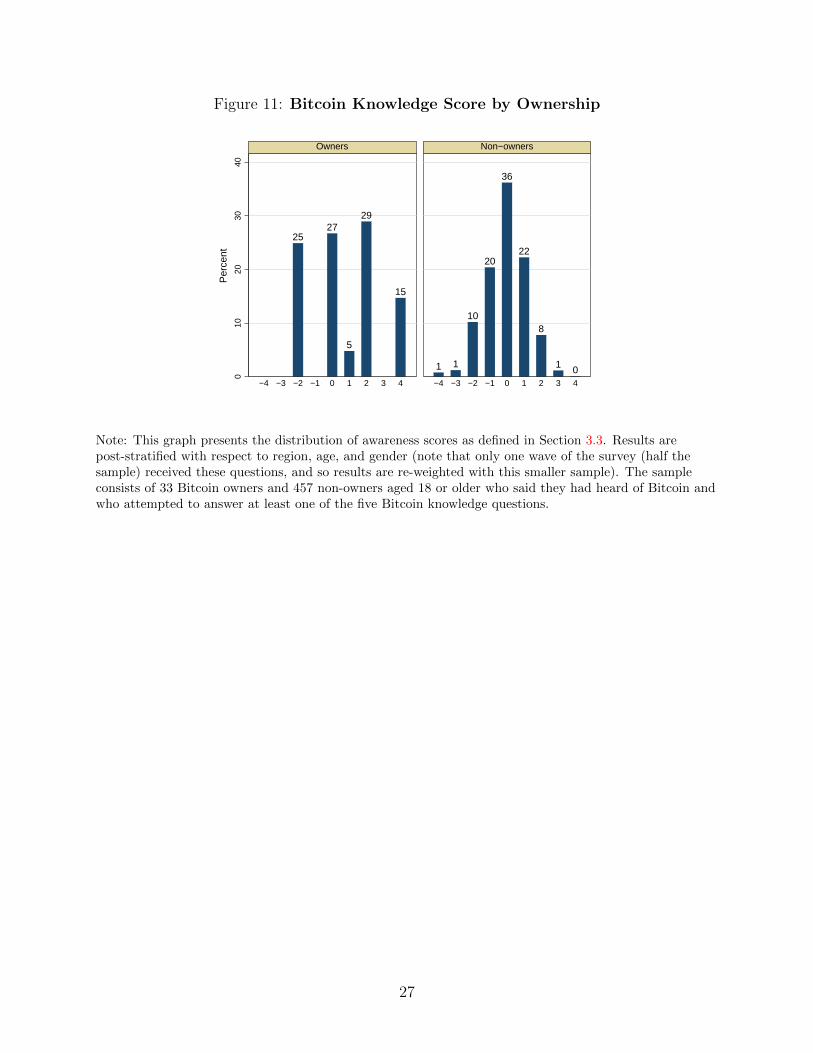
Figure 11: Bitcoin Knowledge Score by Ownership
2527
5
29
15
1 1
10
20
36
22
8
10
010
2030
40
−4 −3 −2 −1 0 1 2 3 4 −4 −3 −2 −1 0 1 2 3 4
Owners Non−owners
Per
cent
Note: This graph presents the distribution of awareness scores as defined in Section 3.3. Results arepost-stratified with respect to region, age, and gender (note that only one wave of the survey (half thesample) received these questions, and so results are re-weighted with this smaller sample). The sampleconsists of 33 Bitcoin owners and 457 non-owners aged 18 or older who said they had heard of Bitcoin andwho attempted to answer at least one of the five Bitcoin knowledge questions.
27

Figure 12: Store-of-value Bitcoin Users in Canada
-.1-.0
50
.05
.1C
AD
2040
6080
100
Rel
ativ
e in
tere
st
10/1/2016 11/1/2016 12/1/2016 1/1/2017Date
Google searches, BTC to CADBTC exchange rate: log, first difference
Note: This graph shows the Google trends analysis for the search “BTC to CAD” from the period ofOctober 1 - December 31, 2016, along with the exchange rate during this period. The exchange rate timeseries has been transformed to a log scale, and we show the first differences. Google searches give a roughproxy for the number of Bitcoin users in Canada who are holding Bitcoin on speculation, or as a store ofvalue. The BTCOS was held November 9-13, 2016 (Wave 1) and December 14-18, 2016 (Wave 2).
28

Table 1: Main reason for ownership
≤1 BTC >1 BTC TotalNo. % No. % No. %
I am interested in new technologies 9 32 8 24 17 29I use it to buy goods and services in physical stores in Canada/elsewhere 3 14 5 14 8 14It is an investment 2 7 4 18 6 12I use it to make remittances or other international payments 3 13 3 8 6 11It uses secure blockchain technology to prevent loss and fraud 3 7 3 8 6 7I use it to buy goods and services on the internet in Canada/elsewhere 1 2 3 15 4 7It allows me to make payments anonymously 1 3 3 13 4 7I do not trust banks 2 6 0 0 2 3I do not trust the government or the Canadian dollar 2 4 0 0 2 3Other 3 12 0 0 3 7Total 29 100 29 100 58 100
Note: This table provides the distribution of responses to the question “Please tell us your main reason forowning Bitcoin.” Results are post-stratified with respect to region, age, and gender. The sample consists of58 Canadians aged 18 or older who said they have or own Bitcoin.
Table 2: Main reason for non-ownership
No. %
My current payment methods meet all my needs 390 32I do not understand/know enough about the technology 340 28I do not trust a private currency that is not backed by the central government 152 12It is not widely accepted as a method of payment 89 7It is not easy to acquire/use 70 6I am concerned about cyber theft 58 5I am concerned about lack of oversight from regulatory bodies 51 4The value of Bitcoin varies too much 38 3Other 22 2I use alternative digital currencies instead (e.g., Dogecoin, Litecoin, Ripple, etc.) 5 0Total 1,214 100
Note: This table provides the distribution of responses to the question “Please tell us your main reason fornot owning Bitcoin.” Results are post-stratified with respect to region, age, and gender. The sampleconsists of 1,214 Canadians aged 18 or older who said they have heard of Bitcoin, but do not have or ownany.
29
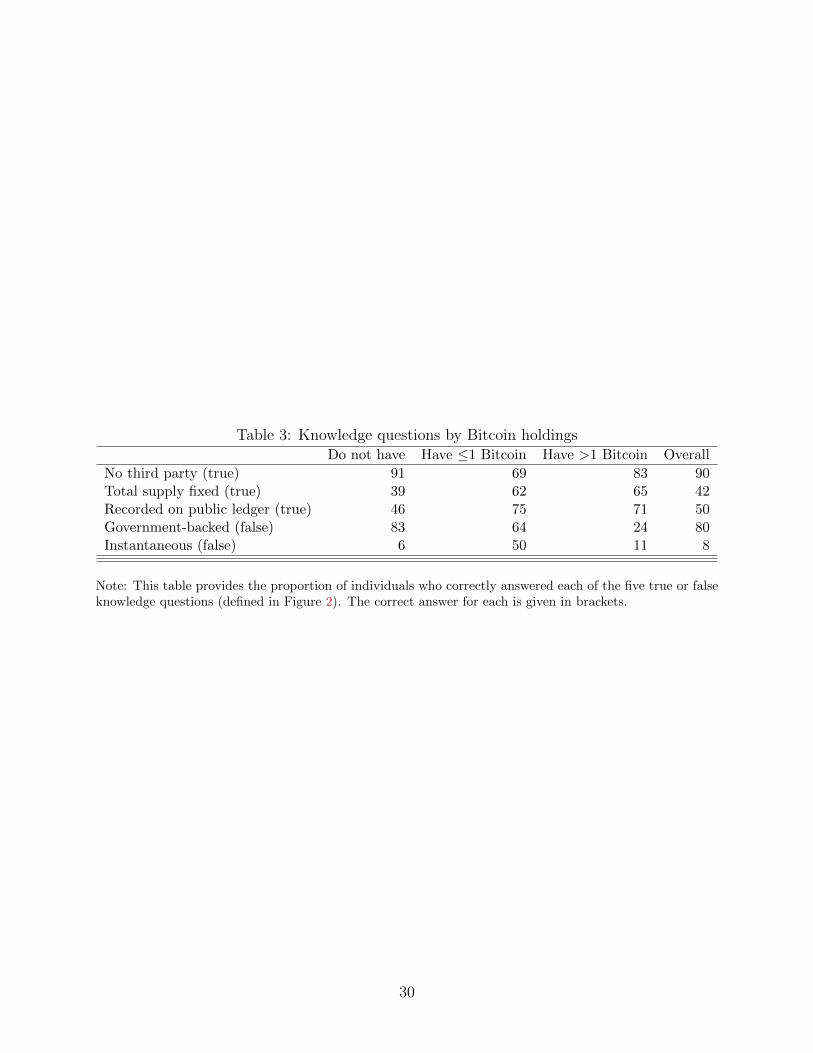
Table 3: Knowledge questions by Bitcoin holdingsDo not have Have ≤1 Bitcoin Have >1 Bitcoin Overall
No third party (true) 91 69 83 90Total supply fixed (true) 39 62 65 42Recorded on public ledger (true) 46 75 71 50Government-backed (false) 83 64 24 80Instantaneous (false) 6 50 11 8
Note: This table provides the proportion of individuals who correctly answered each of the five true or falseknowledge questions (defined in Figure 2). The correct answer for each is given in brackets.
30

Table 4: Bitcoin awareness and ownershipAwareness Ownership
OR CI OR CI25 to 34 0.9 0.6 - 1.5 1.4 0.6 - 3.235 to 44 0.8 0.5 - 1.2 0.6 0.2 - 1.545 to 54 0.6** 0.4 - 1.0 0.2*** 0.0 - 0.555 to 64 0.7 0.4 - 1.1 0.1*** 0.0 - 0.565+ 0.7 0.4 - 1.2 0.1* 0.0 - 1.3Female 0.4*** 0.3 - 0.5 0.7 0.4 - 1.3College 1.4** 1.1 - 1.8 0.4** 0.2 - 0.9University 2.6*** 1.9 - 3.4 0.4** 0.2 - 0.9$30,000 to $49,999 1.2 0.9 - 1.8 1.3 0.5 - 3.5$50,000 to $69,999 1.2 0.8 - 1.6 1.1 0.4 - 2.9$70,000 to $99,999 1.3 0.9 - 1.9 1.5 0.6 - 3.9$100,000 or more 1.3 0.9 - 1.9 1.3 0.5 - 3.4Employed 1.4** 1.0 - 2.0 2.0 0.7 - 5.3Unemployed 2.5*** 1.3 - 4.6 2.8 0.8 - 10.3Retired 1.6** 1.0 - 2.5 1.7 0.2 - 18.6British Columbia 3.8*** 2.6 - 5.4 0.3** 0.1 - 0.9Prairies 2.1*** 1.6 - 3.0 0.2*** 0.1 - 0.6Ontario 2.3*** 1.8 - 3.1 0.4*** 0.2 - 0.8Atlantic 2.0*** 1.3 - 3.0 0.4* 0.1 - 1.1Wave 1 1.2 0.6 - 2.7Knowledge score <0 1.9 0.7 - 5.3Knowledge score >0 4.0*** 1.7 - 9.5Constant 0.7 0.4 - 1.2 0.2*** 0.0 - 0.6Observations 1,997 1,272
Note: (Awareness) The baseline category is a respondent that is aged 18 to 24, male, has a high schooleducation or below, has a household income below $30,000, is not in the labour force, and lives in Quebec.(Ownership) The baseline category is a respondent that is aged 18 to 24, male, has a high school educationor below, has a household income below $30,000, is not in the labour force, lives in Quebec, and received aBitcoin knowledge score of 0. The model is estimated using the method by Firth (1993) which takes intoaccount rare events to reduce bias. It is estimated among the population who said they had heard ofBitcoin. Also note that a dummy for Wave 1 of the survey is included here in order to properly interpretthe effects of the knowledge score, which was only asked among Wave 2 participants.
31

Table 5: Bitcoin vs. other payment innovationsBTC CTC Mobile PayPal Online - debit Online - credit
25 to 3435 to 44 - -45 to 54 - - - - -55 to 64 - - - - -65+ - - - - -
Female - -
College - + + + +University - + + + +
Income 2 + +Income 3 + + +Income 4 + + +Income 5 + + + + +
Employed + + + +UnemployedRetired - +
British Columbia - + + - -Prairies - - - -Ontario - + - -Atlantic -
Adoption rate (%) 2.9 33.4 6.6 31.2 26.9 40.7Observations 1,272 3,495 3,463 3,493 3,486 3,504
Note: BTC - Firth logit analysis from Table 4. CTC - contactless debit/credit; mobile - mobile paymentapplication; PayPal - online payment account not associated with a bank, e.g. PayPal; Online debit -Interac online/e-transfer; Online credit - online payment using a credit card. Columns 2-6 are the results oflogit analysis using data from the 2013 Methods-of-Payment study. Adoption is defined as use in the pastyear. We reports signs of statistically significant coefficients; ‘+’ indicates more likely to adopt comparedwith the base category, and ‘-’ indicates less likely to adopt compared with the base category.
32
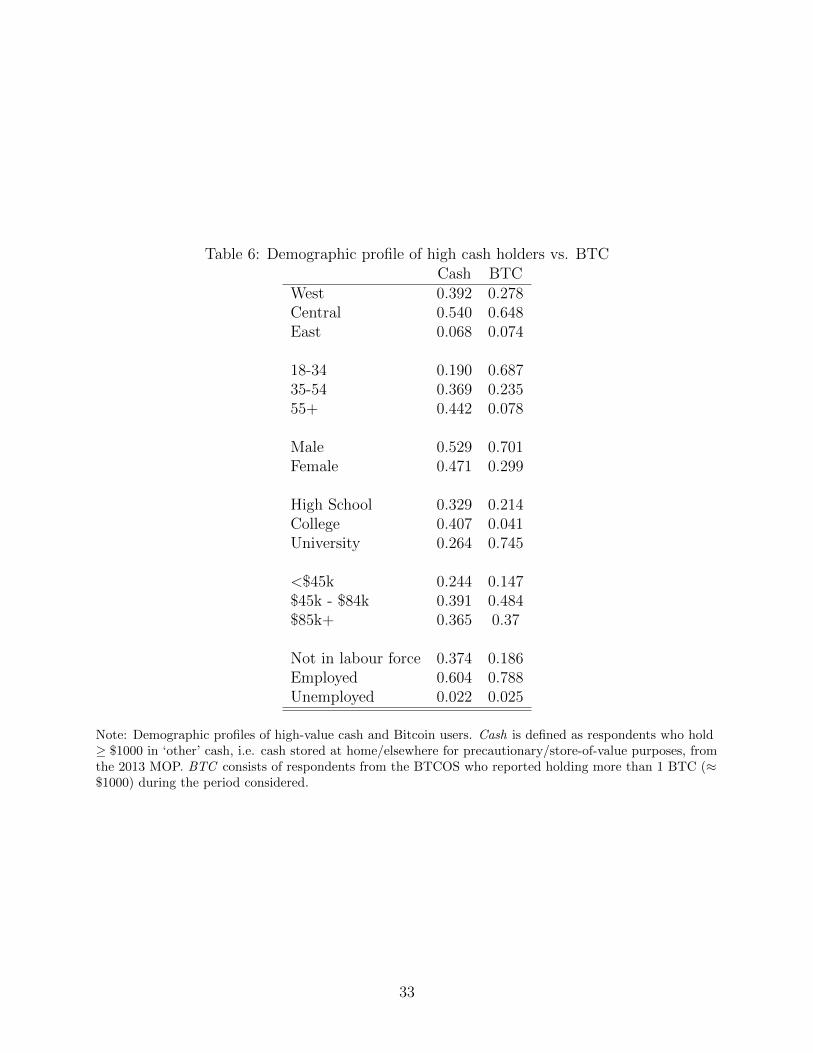
Table 6: Demographic profile of high cash holders vs. BTCCash BTC
West 0.392 0.278Central 0.540 0.648East 0.068 0.074
18-34 0.190 0.68735-54 0.369 0.23555+ 0.442 0.078
Male 0.529 0.701Female 0.471 0.299
High School 0.329 0.214College 0.407 0.041University 0.264 0.745
<$45k 0.244 0.147$45k - $84k 0.391 0.484$85k+ 0.365 0.37
Not in labour force 0.374 0.186Employed 0.604 0.788Unemployed 0.022 0.025
Note: Demographic profiles of high-value cash and Bitcoin users. Cash is defined as respondents who hold≥ $1000 in ‘other’ cash, i.e. cash stored at home/elsewhere for precautionary/store-of-value purposes, fromthe 2013 MOP. BTC consists of respondents from the BTCOS who reported holding more than 1 BTC (≈$1000) during the period considered.
33

A Technical Appendix
A.1 Methodology
A.1.1 Data
The Bitcoin Omnibus Survey (BTCOS) was conducted online in two waves in late 2016: one
from November 9th to 13th and one from December 14th to December 18th. The two waves
are combined under the assumption that they make up one simple random sample from
a single data generating process. In total, 2,001 individuals were sampled. Four of these
reported that they had or owned Bitcoin in Question 1, but then contradicted themselves by
saying they do not own any Bitcoin in Question 3B. These are excluded from the analysis,
leaving a sample of N = 1,997.
A.1.2 Post-stratification
The sample was post-stratified on age, gender, and province using population counts from
the 2016 census.14 Each dimension is grouped as follows:
Table 7: Post-stratification groupsAge Gender Province
18 to 24 Male British Columbia25 to 34 Female Alberta35 to 44 Saskatchewan & Manitoba45 to 54 Ontario55 to 64 Quebec65+ Atlantic provinces
Thus there are 6*2*6 = 72 potential strata. However, to ensure each stratum had at
least 10 observations, age groups were collapsed in a few instances. These collapsed groups
are:
• 18 to 34, Male, British Columbia
• 18 to 34, Male, Alberta
• 18 to 34, Female, Atlantic provinces
• 55+, Female, Atlantic provinces
This has the benefit of removing the more severe outliers from the post-stratification
weights. For variance estimation, the default method in Stata (linearization) is used.
14Statistics Canada Catalogue no. 98-400-X2016001. Note that population totals may not match exactlywith those in the census data due to rounding. As an illustration, consider that the census reports 17,264,200men and 17,887,530 women, suggesting that there are 35,151,730 Canadians. This is a (trivial) contradictionwith the census estimate of 35,151,725 Canadians.
34

A.1.3 Imputation
There are two demographic variables of interest containing missing values for which impu-
tation is desired: income (missing=225) and employment (missing=22). The methodology
used is Multiple Imputation by Chained Equations (MICE), the choice of which is motivated
by two sources. First, imputing multiple times (in this case 50) enables the computation of
standard errors that take into account the uncertainty of imputation. Second, employment
and income are related, so it is important to impute one using the other (and vice versa).
MICE is able to do this by iterating between two regression models; for each step, the re-
gression uses a current iteration of imputed values from one variable to predict new imputed
values for the other. This is repeated until convergence is reached.
The two iterating models used here are both multinomial logits, since income and em-
ployment are recorded as categorical variables. The variables used in these models to predict
income and employment are:
• gender
• age
• province
• whether or not they have children
• education
• marital status
The imputation of income and employment using these variables (and each other) is
justified by running multinomial models on the incomplete data. It was found that, based
on the adjusted R2, 14 percent of the variation in income can be explained and 39 percent
of the variation in employment can be explained.
One final note on using multinomial logits with MICE; sometimes there are instances
where no observations are found in a given category. To avoid this perfect prediction, a
methodology called “augmentation” is used. Augmentation works by filling the empty cat-
egories with a few made-up observations that have small weights.
35

A.2 Sample compositions
Table 8: Sample compositionUnweighted Weighted CIUS
GENDERMale 47 49 49Female 53 51 51AGE18 to 24 9 10 1525 to 34 18 17 1735 to 44 17 16 1645 to 54 21 18 1955 to 64 20 18 1665+ 16 21 18REGIONBritish Columbia 12 14 13Prairies 19 18 17Ontario 36 38 39Quebec 23 23 23Atlantic 9 7 7LABOUR FORCE STATUSEmployed 59 56 64Unemployed 4 4 5Not in labour force 37 40 31HOUSEHOLD INCOMELess than $25,000 15 16 13$25,000 to $45,000 18 18 18$45,000 to $65,000 21 21 18$65,000 or more 45 44 51
Note: Weighted results are based on post-stratification by region, age, and gender in 2016. CIUS resultsare derived from tabulations from Statistics Canada; they represent figures from the 2012 CanadianInternet Use Survey which were weighted with respect to the 2011 National Household Survey. This tablecan thus be used to determine how representative the sample is of the Canadian population (with respectto these demographics) as of 2011.
36