bisen paper nmed-a71232b sup 12-23-15 - media.nature.com · from origene. patient 1, h&e shows...
TRANSCRIPT

1
Supplementary information
Supplementary Figure 1. Alveolar epithelial repair and fibrosis after repeated intratracheal injection of bleomycin (Bleo). (a) Restoration of alveolar epithelial cells (AECs) after mouse repetitive lung injury. At indicated time points after Bleo., distribution of type 1 AECs (AEC1s) was examined by immunostaining of Aquaporin-5 (Aqp-5) and
Podoplanin (Pdn). Percentage of Aqp-5+Pdn
+ AEC1s was quantified from five random high power fields. Each dot
stands for the value of individual animal in this study. n= 10 mice in 1st, 2nd, and 3rd injection groups and 8 mice in 4th and 6th injection groups. *, P < 0.05. (b, c) Proliferation of SFTPC+ type 2 AECs (AEC2s) was determined by
staining BrdU incorporation (white arrow head) (b). Number of BrdU+SFTPC
+ AEC2 was quantified and compared
with PBS treated mice (c). Note the hyperplasia of AEC2s after the sixth Bleo (white arrow). Scale bar, 50 µm. N = 5 mice in 4th, 5th, and 6th injection groups and 7 animals in 1st, 2nd, and 3rd injection groups. Error bar depicts s.e.m. throughout all supplementary figures. (d) Immunoblot of Collagen I was performed at both day 20 and 35 after each Bleo. Representative image is presented in Fig. 1, and quantification of Collagen I level is shown. n = 8 mice in 4th and 6th injection groups and = 10 in 1st, 2nd, and 3rd injection groups. (e) Sirius red staining of PBS-treated lung. Scale bar = 50 µm. (f) Quantification of Sirius red staining of lung slide after injury. n = 8 mice per group. *, P < 0.05. (g) Alveolar morphology was assessed by H&E staining. Scale bar, 50 um. (h) Repair of alveolar epithelial damage after acute and chronic lung injury. There was "loss" of alveolar epithelial structure, perivascular fibroblast activation/scar formation after acute lung injury, and this alveolar damage was followed by "restoration" of both alveolar epithelial function and fibrosis resolution/removal after initial injuries. In contrast, this alveolar epithelial restoration was abrogated by repeated lung injuries, leading to lung fibrosis. P value was determined by one way ANOVA in this figure.
Nature Medicine: doi:10.1038/nm.4035

2
Supplementary Figure 2. Isotype antibody staining on lung slides from indicated mouse groups. Lung
slides were incubated with rat, rabbit, goat, and mouse immunoglobulin G (IgG) and donkey-derived
secondary antibody. For mouse IgG incubation, slides were also treated with Mouse on mouse (M.O.M)
kit from Vector laboratories (BMK-2202). Scale bar, 50 um.
Nature Medicine: doi:10.1038/nm.4035

3
Supplementary Figure 3. Expression of Notch ligand Jagged1 (Jag1) in pulmonary capillary endothelial cell (PCEC) of fibrotic lungs. (a) Isolated PCECs were stained with antibodies against endothelial marker VE-cadherin, CD31, and VEGFR2, fibroblast cell-specific antigen PDGF receptor beta, epithelial cell marker E-cadherin, and hematopoietic cell marker CD45. (b, c) Notch ligand mRNA in PCECs at indicated time after Bleo was compared with PBS-treated groups (b); Protein level of Jag1 in PCECs of indicated mouse groups was tested by immunoblot. Representative image is shown in (c), one lane denotes data from one animal; n = 9 mice per group. (d) Jag1 expression in the lung sections from patients with interstitial pulmonary fibrosis. Sections were stained with antibodies of Jag1 and EC-specific VE-cadherin. Human normal and pulmonary fibrosis samples were purchased from Origene. Patient 1, H&E shows 30% Fibrovascular tissue, 25% Diffuse interstitial fibrosis. Patient 2, H&E shows 25% fibrovascular septae; contains interstitial fibrosis and chronic inflammation. Patient 3, H&E shows fibrovascular septae, and lung with interstitial fibrosis. Scale bar, 50 µm. (e-f) Lung protein levels of SMA and Collagen I in Jag1i∆EC/i∆EC and control Jag1i∆EC/+ mice were determined by immunoblot and Sirius red staining. Representative image is shown in Fig. 2, and quantification is presented. n = 6 mice per group; *, P< 0.05, compared to control group. (g) Notch activation in lung fibroblast of control and Jag1i∆EC/i∆EC mice after 6th Bleo. Jag1i∆EC/i∆EC and mice were crossed with TNR mice to generate TNR+Jag1i∆EC/i∆EC and control TNR+Jag1i∆EC/+ mice. Notch-driven GFP signal in PDGFR-β+ lung fibroblast was assessed by flow cytometry. Flow analysis of unstained total lung cells is also shown in top panel. P value was determined by one way ANOVA in this figure.
Nature Medicine: doi:10.1038/nm.4035
4
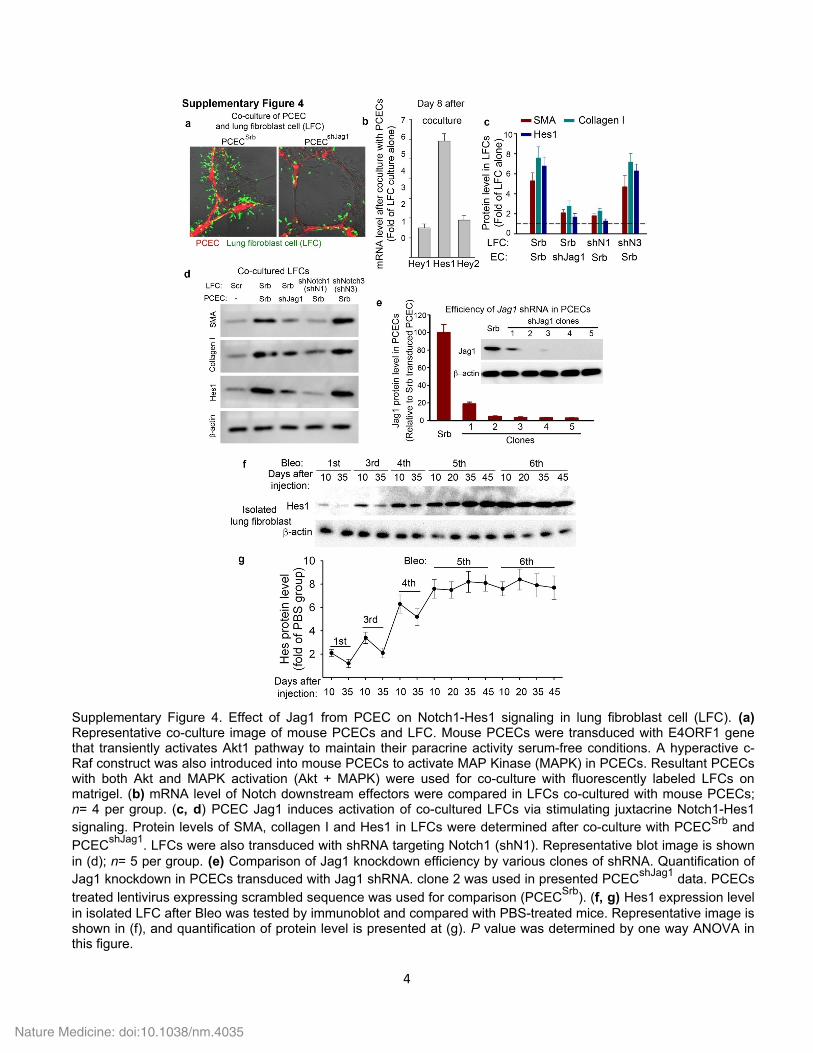
Supplementary Figure 4. Effect of Jag1 from PCEC on Notch1-Hes1 signaling in lung fibroblast cell (LFC). (a) Representative co-culture image of mouse PCECs and LFC. Mouse PCECs were transduced with E4ORF1 gene that transiently activates Akt1 pathway to maintain their paracrine activity serum-free conditions. A hyperactive c-Raf construct was also introduced into mouse PCECs to activate MAP Kinase (MAPK) in PCECs. Resultant PCECs with both Akt and MAPK activation (Akt + MAPK) were used for co-culture with fluorescently labeled LFCs on matrigel. (b) mRNA level of Notch downstream effectors were compared in LFCs co-cultured with mouse PCECs; n= 4 per group. (c, d) PCEC Jag1 induces activation of co-cultured LFCs via stimulating juxtacrine Notch1-Hes1 signaling. Protein levels of SMA, collagen I and Hes1 in LFCs were determined after co-culture with PCECSrb and PCECshJag1. LFCs were also transduced with shRNA targeting Notch1 (shN1). Representative blot image is shown in (d); n= 5 per group. (e) Comparison of Jag1 knockdown efficiency by various clones of shRNA. Quantification of Jag1 knockdown in PCECs transduced with Jag1 shRNA. clone 2 was used in presented PCECshJag1 data. PCECs treated lentivirus expressing scrambled sequence was used for comparison (PCECSrb). (f, g) Hes1 expression level in isolated LFC after Bleo was tested by immunoblot and compared with PBS-treated mice. Representative image is shown in (f), and quantification of protein level is presented at (g). P value was determined by one way ANOVA in this figure.
Nature Medicine: doi:10.1038/nm.4035

5
Supplementary Figure 5. Influence of Jag1 from PCEC on Smad activation in LFCs. (a) Smad3
activation/phosphorylation (p-Smad3) was detected by immunoblot. Protein levels of total Smad3 and β-
actin in LFCs were measured to ensure equivalent protein loading. Representative immunoblot image is
shown. shNotch3 (shN3), shRNA against Notch3. (b) Smad3 activity in LFC nuclear extract was detected
by electrophoretic mobility shift assay (EMSA) (Panomics, Fremont, CA), and activation of Smad was
quantified by densitometry of shifted band (c). *, P< 0.05; n= 4 per group. (c) Smad activation in LFCs of
Jag1i∆EC/i∆EC
and control mice. EMSA was performed to compare Smad activity in LFCs. Representative
image is presented at Figure 2. n = 7 mice per group. Statistical difference was determined by one way
ANOVA in this figure.
Nature Medicine: doi:10.1038/nm.4035

6
Supplementary Figure 6. Effect of EC-specific delivery of Jag1 shRNA on lung fibrosis. (a) Strategy to target viral particle to PCECs. To deliver lentiviral particles to ECs, monoclonal antibody Mec13.3 against EC surface marker CD31 was conjugated with pseudotyped lentivirus bearing IgG binding motif. Inclusion of pseudotyped vector 2.2 in packaging system enables the generation of lentivirus bearing IgG binding motif on surface. Conjugation of IgG Mec13.3 with generated pseudotyped virus expressing shJag1, scrambled (Srb) sequence, or Gfp facilitates in vivo gene transduction in ECs (shJag1EC virus, SrbEC virus, or GfpEC virus). (b, c) Expression of GFP was measured in different organs after injection of GFPEC and IgG conjugated GFP virus. GFP virus conjugated with rat IgG served as control; n = 4 mice; Scale bar, 50 µm. (d-e) Vascular blood perfusion was analyzed by binding of circulating isolectinB4 to VE-cadherin+ PCECs after intravenous injection of shJag1EC virus, SrbEC virus, and equal amounts of mAb Mec13.3. The percentage of VE-cadherin+isolectin+ PCECs in different groups was compared to measure the influence on blood perfusion in the capillary. n = 5 in SrbEC group and 7 in shJag1EC group. Representative image is shown in (e). Scale bar, 50 µm. (f) SMA and Collagen I proteins in the injured lungs were detected by immunoblot
after injection of CD31 mAb, rat IgG, and vehicle. (g, h) Collagen deposition (Sirius red+ area) (g) and LFC Hes1 (h)
levels in mouse lungs after injection of shJag1EC and SrbEC. n = 8 per group; *, P< 0.05 between shJag1EC and SrbEC group. P value was determined by one way ANOVA in this figure.
Nature Medicine: doi:10.1038/nm.4035

7
Supplementary Figure 7. Role of CXCR7 pathway in PCECs on lung repair and fibrosis. (a) Representative immunostaining of CXCR7, VE-cadherin on the lung slide from patients with interstitial pulmonary fibrosis. Scale bar, 50 µm. (b) Protein level of CXCR7 in mouse PCECs after Bleo was analyzed by immunoblot and quantified by optical density. Representative image is shown in Figure 3; n = 7 per time point. (c, d) CXCR7 protein level in ECs of different mouse organs after repeated Bleo and PBS was detected by immunoblot and quantified. n= 7 in both groups. (e) Expression level of chemokine CXCL12 in mouse lungs after repeated Bleo. mRNA level of CXCR7 ligand CXCL12 was measured at the indicated time points after intratracheal injection of bleomycin. After normalization to β-actin, Cxcl12 expression in the injected lung was compared to that of lung without injection. Lung Cxcl12 expression in PBS-injected mice were also measured. *, P< 0.05 compared to PBS mice; n= 5 mice per time point. (f, g) Pulmonary hydroxyproline (f) and collagen (g) level in indicated mouse groups after treatment with TC14012 and vehicle. *, P< 0.05; n= 7 in TC14012 and 8 in vehicle group. (h) AEC1 structure and gas exchange function in the injured mice by locally infused TC14012. Quantification of AEC1 distribution is presented in Figure 3. Scale bar, 50 µm. P value was determined by one way ANOVA in this figure.
Nature Medicine: doi:10.1038/nm.4035

8
Supplementary Figure 8. Effect of locally administered TC14012 on lung fibrosis after repeated Bleo. (a,
b) SMA protein level in wild type (Cxcr7+/+
) and control Cxcr7i∆EC/+
mice after Bleo and PBS.
Representative immunoblot is shown in (a), and quantification is shown (b); n= 7 in wild type group and 8
in Cxcr7i∆EC/+
group. (c, d) SMA and collagen protein levels in the injured lungs after shJag1EC
injection.
Representative immunoblot images of SMA and Collagen I in the treated mouse lungs are presented in
Figure 3; n= 9 per group for Cxcr7+/+
genotype and 7 for Cxcr7i∆EC/i∆EC
genotype. (e) Schema depicting
the interaction between PCEC Jag1 and fibroblast Notch, as well as possible modulation by CXCR7 in
PCEC. P value was determined by one way ANOVA in this figure
Nature Medicine: doi:10.1038/nm.4035

9
Supplementary Figure 9. Contribution of CXCR7 in macrophage-mediated β-catenin activation in PCEC.
(a) LacZ staining of the lung of Axin2-LacZ mice after injection of PBS and Bleo. (b) Jag1 expression in
PCECs treated with Wnt3A and TC14012. Both wild type (Cxcr7+/+
) and Cxcr7-deficient PCECs were
tested. Jag1 protein was tested by immunoblot and then quantified. n= 7 per group; Reprehensive image
is shown in Figure 4. (c, d) Expression of Jag1 and SMA protein in injured mice after
macrophage/monocyte depletion. Generation of EC-specific β-catenin gain of function Ctnnb1-ex3i∆EC/+
mice was described in Figure 4, and macrophages and monocytes were ablated by injection of
clodronate liposome (FormuMax); n= 9 per group. (e, f) Jag1 protein level in Ctnnb1-ex3+/+
and Ctnnb1-
ex3i∆EC/+
mice treated with vehicle or TC14012 after repeated Bleo. Representative immunoblot image is
shown in (e) and quantified (f). n= 7 per group. P value was determined by one way ANOVA in this figure.
Nature Medicine: doi:10.1038/nm.4035

10
Supplementary Figure 10. Influence of VEGFR1+ macrophage/monocyte on lung repair after Bleo. (a) mRNA level
of VEGFR1 ligand placental growth factor (Plgf) in the injured mouse lungs. Expression of Plgf was determined at
indicated time after bleomycin injury. After normalization to β-actin, Plgf level of injected mice was compared to that
of mice without receiving injection. PBS-injected mice were also measured as comparison. n= 5 mice per time point.
*, P< 0.05 versus PBS group; **, P< 0.01 versus PBS. (b) LacZ staining of Vegfr1-lacZ mouse lung cryosection;
Scale bar, 50 µm in this figure. (c) Co-staining of VEGFR1 and CD11b in indicated mouse lung sections. (d)
Generation of mice with macrophage and monocyte-specific deletion of Vegfr1. LysM-Cre mice were crossed with
floxed Vegfr1 mice to generate mice deficient of Vegfr1 in macrophage and monocyte (Vegfr1∆LysM/∆LysM
). (e-h)
Expression of macrophage Wnt3A and PCEC Jag1 in Vegfr1+/+
and Vegfr1∆LysM/∆LysM
mice; Protein were
detected by immunoblot and immunostaining. n= 8 mice per group. (i) Schema depicting the role of VEGFR1+
macrophage in stimulating β-catenin-Jag1 axis in PCEC. This pathway was inhibited by CXCR7 agonist. Statistical
difference was determined by one way ANOVA in this figure.
Nature Medicine: doi:10.1038/nm.4035

11
Supplementary Fig. 11 Lung repair and fibrosis after repetitive intratracheal instillation of hydrochloric
acid (acid). (a-c) Distribution of Aquaporin-5+
Podoplanin+
AEC1s (a, b) and blood oxygen level (c) were
assessed after acid. Each dot denotes data from individual mouse. n = 9 animals in control group and 8
mice in injured group. *, P < 0.05, N.S., not statistically different. Scale bar, 50 µm. (d-e) Collagen protein
deposition and alveolar architecture in treated mouse lungs. Scale bar, 50 µm. P value was determined
by one way ANOVA in this figure.
Nature Medicine: doi:10.1038/nm.4035

12
Supplementary Fig. 12 Therapeutic effect of TC14012 and shJag1EC in acid aspiration injury. (a, b)
Expression of Jag1 and SMA proteins in acid-injured mice after treatment of TC14012 and vehicle; *, P <
0.05; n = 8 in control group and 9 in Cxcr7 EC-specific knockout group. (c-f) Distribution of Aquaporin-5
(Aqp-5)+
Podoplanin (Pdn)+
AEC1 area (c, e) and Sirius red+ fibrotic field (d, f) in acid-injured mice after
indicated treatments. Representative staining image is presented in Fig. 6; *, P < 0.05; n = 8 in vehicle
and TC14012 groups and 9 in SrbEC
and shJag1EC
groups. P value was determined by one way ANOVA
in this figure.
Nature Medicine: doi:10.1038/nm.4035

Nature Medicine: doi:10.1038/nm.4035