bise nvivo how to - visitor studies nvivo how to.pdf ·...
TRANSCRIPT

Running Matrix Queries, Running Coding Queries, and Crea3ng Sets
HOW TO USE THE BISE NVIVO DATABASE

Terms and Defini3ons The BISE Coding Framework refers to codes that are applied to the en3re report as well as codes that are 3ed to specific text within a report. NVivo also uses these categories, but has different terms for them.
BISE Coding Framework NVivo Examples
Report Level Code ALribute Evalua3on Type, Evaluand, Sample Size
Within Report Code Node Evalua3on Ques3ons, Recommenda3ons
The list of BISE codes is found on page 3 of the Coding Framework document. The majority are Report Level Codes (ALributes), but those marked with an asterisk are also Within Report Codes (Nodes).
ALributes “live” in the “Classifica3ons” menu in NVivo, and Nodes “live” in the “Nodes” menu.
1

Visualizing ALributes Let’s say you want to answer the ques3on,
“How many summa,ve evalua,ons are in the BISE Database?”
To answer this ques3on you would need to look at the code “Evalua3on Type,” which is a report level code. Report level codes are found in the NVivo aLributes. Upon opening NVivo, select "Classifica3ons" from the menu bar along the right hand side of the window. 2

You will see one item 3tled ”BISE Report ALributes." Click on the plus sign* to the right to expand the item.
Find and click on the aLribute you are interested in. In this case, "H_Evalua3on Type."
3
*Note: The plus sign is used to expand all item trees in Nvivo. Clicking the minus sign will collapse them.

4
Right click on the desired aLribute. Select "Visualize" from the menu (Second from the boLom) and then "Chart Sources by ALribute Value"
Alterna3vely, you may select “Chart” from the “Explore” tab on the ribbon, and then select “Chart Sources by ALribute Value.”

The results will be shown as a bar chart. Hovering over each bar will show the number of sources for each category. You can also select the "Summary" tab at the right for a table presenta3on.
5
When you are viewing the chart, there are op3ons to change the 3tle, type of chart, and adjust other op3ons for the X and Y axes (such as adding data values) located in the Chart tab before saving the file.
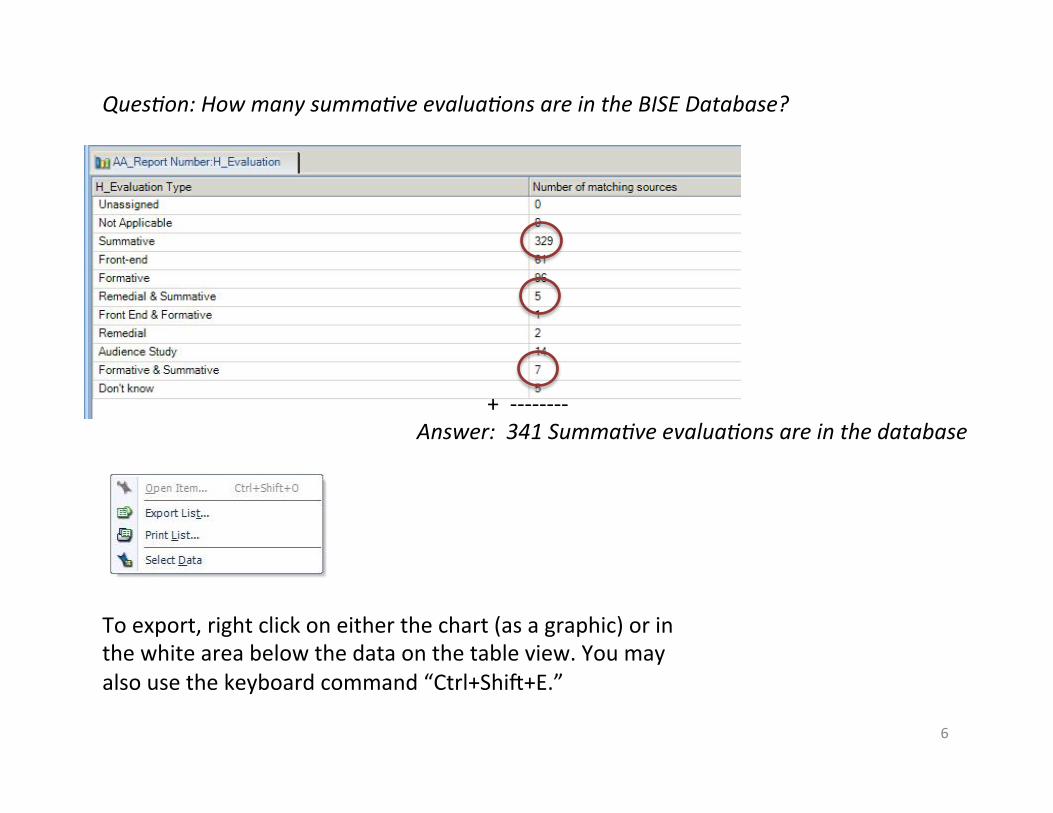
+ -‐-‐-‐-‐-‐-‐-‐-‐ Answer: 341 Summa,ve evalua,ons are in the database
To export, right click on either the chart (as a graphic) or in the white area below the data on the table view. You may also use the keyboard command “Ctrl+Shie+E.”
Ques,on: How many summa,ve evalua,ons are in the BISE Database?
6

ALribute x ALribute Matrix Query Now let’s say you want to answer the ques3on, “How many summa,ve evalua,ons of exhibi,ons are in the BISE Database?”
To answer this ques3on you need to run a query. Upon opening NVivo, you can access the query func3ons one of two ways: 1) Select ”Queries" from the menu bar along the lee hand side of the program window. Then right click in the work area to access the op3ons menu. Access to these op3ons by right clicking is only available when in the Query workspace. 7

2) For Nvivo 9, you can select the “Explore” tab on the ribbon, then click “New Query,” and make your selec3on from the op3ons provided in the drop down. In NVivo 10, queries have their own tab in the ribbon. In this case, we’ll be doing a “Matrix Coding Query.” You may access the query menu regardless of which version of NVivo you are in.
8
NVivo 9
NVivo 10

Aeer you open a new query, a dialog box will open up. The dialog box will ini3ally have two tabs: “Matrix Coding Criteria” and “Query Op3ons.” Checking the box “Add to Project” will create a third tab “General.” This is where you can name your query specifica3ons so they are saved in the NVivo Project. The “Name” field is required. Descrip3on is op3onal, but will only be visible when examining the query proper3es.
9

Next, click the “Matrix Coding Criteria” tab. Think of a Matrix Query as a cross table. First, define the rows by clicking “Select” next to the dropdown menu where “Selected Items” is displayed. This is the default op3on for row defini3on (and suitable for our task).
10

Now you will select the project items for the rows of your query. To answer our ques3on, rows will be “Exhibi3on,” which is under the report level aLribute of Evaluand. So you’ll need to find “ALribute” codes, which are under “Source Classifica3ons.” Then expand the Classifica3on Sheet “BISE Report ALributes.” Since we are interested in only those reports on Exhibi3ons, expand each of the “Evaluand” op3ons and check the “Exhibi3on” box, where available. For this example, it will be Evaluands 1 and 5 (5 not shown). Click “OK.”
11

The Row defini3ons WILL NOT APPEAR UNTIL you click “Add to List.” Here is what it looks like aeer selected items have been added. Then select the “Columns” tab, and click on “Select” to define the columns.
12

For the rows, we need to select “Summa3ve Evalua3ons,” which is under the report level aLribute of “Evalua3on Type.” So you will need to select the “Source Classifica3ons” box, expand the ALributes, then find and expand “H_Evalua3on Type.” Since some reports included Remedial or Forma3ve aspects along with Summa3ve, you will need to check all three boxes that include summa3ve. Then click “OK.”
13

Click “Add to List” to add the column defini3ons. Then click “Query Op3ons.
14

Query Op3ons allows you to save the results of your query. The default sepng for the Op3on dropdown menu is “Preview Only.” Select “Create Results as New Node Matrix” from the dropdown menu. Select the Loca3on where you want to save your results. Then name your results so that you will understand what they are. Click “Run.”
Note: This step is not required, but by saving the query results, you will be able to access them in the future without needing to re-‐run the query. Since the BISE database is large, this eliminates future wai3ng if you need to work with the results again. However, this is a required part of crea3ng a “Set,” which will be discussed later.
15

The results will look like this, however the numbers displayed in the table represent the number of references coded, not the number of sources.
To change the numbers show they show the number of sources, right click on one of the cells and find the “Cell Content” op3on from the menu. Select, “Sources Coded” and click on the ALributes file, which will give you the table below.
Adding up the six cells results in 136 Summa3ve Reports about Exhibi3ons.
Or…
16

If you saved your query results, you can click on the “Results” folder, which will show you the number of sources and references, regardless of if you change the default cell contents.
Ques,on: How many summa,ve evalua,ons of exhibi,ons are in the BISE database? Answer: There are 136 summa,ve evalua,ons of exhibi,ons.
17

Crea3ng a Set From Query Results Sets are helpful because they limit the number of sources you are considering. This decreases the amount of 3me it takes NVivo to process queries, and allows you to ask more refined ques3ons.
In the “Queries” workspace, click on the “Results” folder. This is where the “Summa3ve Exhibi3ons” query results are.
18

Right clicking on results will pull up the op3ons shown below. Click on “Create As,” then “Create As Set.”
19

Change the name to whatever makes the most sense for your project.
Sets are found in the “Collec3ons” folder hierarchy, but are s3ll considered a source when it comes to running queries.
20

ALribute x Node Coding Query Let’s say you also want to answer the ques3on, “What kinds of evalua,on ques,ons do people ask in summa,ve evalua,ons of exhibi,ons?”
To answer our ques3on, you’ll want to create a new query based on report level coding (ALributes) and specific text coded within a report (Nodes). This 3me select “Coding Query.” Make sure to check “Add to Project.” Under the Coding Criteria tab, click “Select” to define the “Node” we want NVivo to isolate.
21
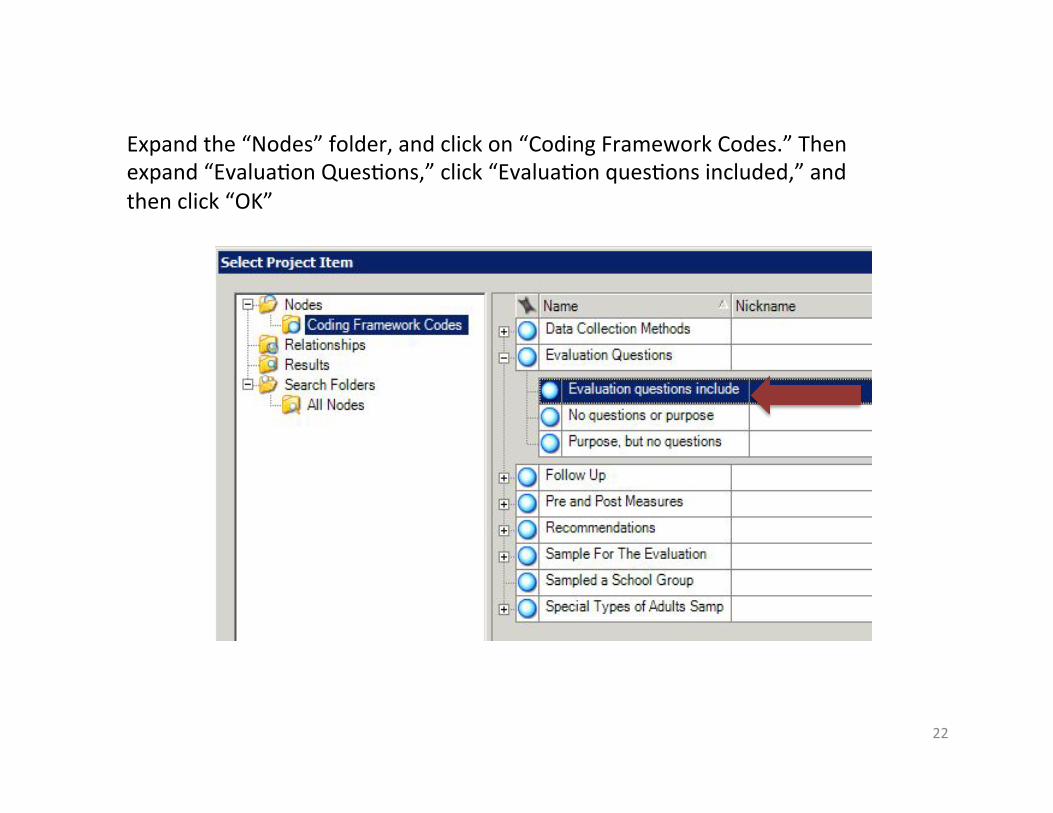
Expand the “Nodes” folder, and click on “Coding Framework Codes.” Then expand “Evalua3on Ques3ons,” click “Evalua3on ques3ons included,” and then click “OK”
22

Choose “Selected Items” from the dropdown menu next to “In” to narrow our sources to only those that include “Summa3ve Exhibi3ons” (the set we created earlier). Click on “Sets” and check “Summa3ve Exhibi3ons,” then click “OK.” Select “Run” to generate the query. See “AQribute x AQribute Query” and “Crea,ng a Set” if you have not already created a set that includes only Summa,ve Evalua,ons of Exhibi,ons.
23
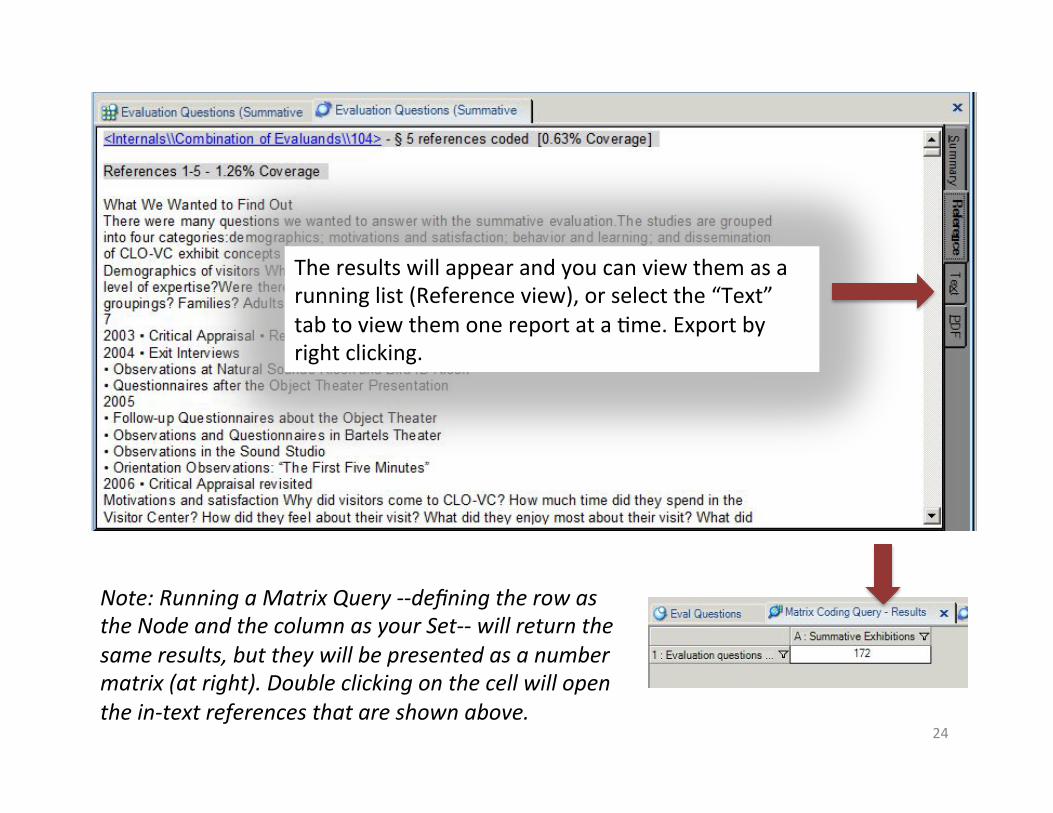
Note: Running a Matrix Query -‐-‐defining the row as the Node and the column as your Set-‐-‐ will return the same results, but they will be presented as a number matrix (at right). Double clicking on the cell will open the in-‐text references that are shown above.
The results will appear and you can view them as a running list (Reference view), or select the “Text” tab to view them one report at a 3me. Export by right clicking.
24