bis working papers · · 2008-02-12abstract central bank ... announcements by examining the...
TRANSCRIPT
BIS Working Papers No 246
Central bank policy rate guidance and financial market functioning by Richhild Moessner and William Nelson
Monetary and Economic Department February 2008
BIS Working Papers are written by members of the Monetary and Economic Department of the Bank for International Settlements, and from time to time by other economists, and are published by the Bank. The views expressed in them are those of their authors and not necessarily the views of the BIS.
Copies of publications are available from:
Bank for International Settlements
Press & Communications
CH-4002 Basel, Switzerland
E-mail: [email protected]
Fax: +41 61 280 9100 and +41 61 280 8100
This publication is available on the BIS website (www.bis.org).
© Bank for International Settlements 2008. All rights reserved. Limited extracts may be reproduced or translated provided the source is stated.
ISSN 1020-0959 (print)
ISSN 1682-7678 (online)

iii
Abstract
Central bank communication has changed dramatically over the past decade, with some central banks providing guidance about or explicit forecasts of likely future policy rates. One frequently made argument against the provision by central banks of such guidance or forecasts is that it runs the risk of impairing market functioning. In this paper, we evaluate the behaviour of financial markets in the United States, the euro area and New Zealand in light of the communication strategies of central banks, in order to assess whether the provision of policy rate guidance by central banks impairs market functioning. While we find evidence that central bank policy rate forecasts influence market prices in New Zealand, we find no evidence that such guidance or forecasts impair market functioning in the United States, the euro area or New Zealand. The results suggest that the risk of impairing market functioning is not a strong argument against central banks’ provision of policy rate guidance or forecasts.
JEL classification: E52, E58, G14.
Keywords: Central bank communication, policy rate forecasts, financial market functioning.

Central bank policy rate guidance and financial market functioning 1
Central bank policy rate guidance and financial market functioning
Richhild Moessner∗ Bank for International Settlements
William Nelson* Bank for International Settlements and Federal Reserve Board
Introduction
There has been a profound transformation in central bank communication practices over the past two decades. Previously, central banks often shrouded their deliberations, policy intentions, and even policy actions in secrecy. Nearly all central banks now announce publicly their policy actions; most provide detailed information about their policy meetings in the form of minutes, press briefings, or even transcripts; many make their policy intentions clear by announcing inflation targets or other objectives; and some release their economic projections. The current cutting edge of the movement towards greater transparency is the issue of whether or not central banks should provide regular forecasts of their own policy rates. The Reserve Bank of New Zealand (RBNZ) has provided forecasts of the ninety-day bank bill rate since June 1997. Among the other major central banks, those of Norway − in November 2005 − and Sweden − in February 2007 − have followed suit.
Some central banks have opted to provide guidance for finite periods of time about the likely near-term path for policy rates. From April 1999 to August 2000 and from March 2001 to July 2006, the Bank of Japan (BOJ) indicated that its target of zero for the interbank rate would be maintained until deflationary concerns were dispelled. The Federal Open Market Committee (FOMC) signaled the trajectory for rates from August 2003 to December 2005, first by stating that rates would remain at 1 percent for a “considerable period”, and then by indicating that the tightening in policy would proceed at a pace that was likely to be “measured.” The European Central Bank (ECB) telegraphed each of its policy moves during the tightening episode from December 2005 to August 2007 by using language inserted in the statement released following the previous month’s policy meeting. “Strong vigilance” always preceded (and was taken by market participants to imply) a tightening at the next meeting, and “close monitoring” preceded unchanged policy.
Little theoretical work has been done so far on whether the provision of forecasts of their own policy rates by central banks is beneficial. Rudebusch and Williams (2006) argue that in an economy where private agents have imperfect information about the determination of monetary policy, central bank communication of interest rate projections is desirable because
∗ We are grateful to Bill Allen, David Archer, Charlie Bean, Meredith Beechey, Claudio Borio, J Benson Durham,
Michael Ehrmann, Luci Ellis, Marcel Fratzscher, Gabriele Galati, Charles Goodhart, Refet Gurkaynak, Patricia Mosser, Brian Sack, Philip Wooldridge, Jonathan Wright, Christian Upper and participants at an ECB seminar and a BIS workshop for helpful comments and discussions, and to Garry Tang for excellent research assistance. The views expressed are those of the authors and do not necessarily reflect the views of the Bank for International Settlements or the Federal Reserve Board.

2 Central bank policy rate guidance and financial market functioning
the projections can help shape financial market expectations and improve macroeconomic performance. Much of the literature on the effect of central bank transparency has focussed on the effects of central bank transparency about exogenous state variables and economic projections, rather than about the policy rate set by the central bank. Sevensson (2004) and Woodford (2005) argue that more transparency is better than less, since greater transparency reduces uncertainty about central bank objectives and enhances accountability. Morris and Shin (2002, 2005) argue that market participants will focus too intently on the public forecasts and pay too little attention to other private sources of information. The inattentiveness of market participants to their own private information reduces the information content of market prices.1
Central bankers typically see advantages and disadvantages in providing interest rate forecasts (see Kohn (2005, 2008), Issing (2005), Rosenberg (2007), Bergo (2007), Archer (2005), Ingves (2007), Tucker (2007), King (2007)). They recognize the value of reducing uncertainty about central bank objectives and tactics. They also note that affecting private sector expectations about future monetary policy is an important means by which central banks influence economic activity. On the other hand, many point out that it can be difficult for monetary policy committees to reach agreement about a forecast for policy rates.
They also frequently note that central bank forecasts of policy rates run the risk of impairing market functioning. For example, in a speech at the 2005 American Economic Association meetings, Donald Kohn, the vice chairman of the Federal Reserve Board, listed two considerations that have constrained the pace of central bank transparency about their outlook: The first consideration is that informational efficiency could be impaired by the provision of policy rate guidance, with financial markets placing too much weight on central bank forecasts, reducing their own analysis of economic developments, and not appreciating sufficiently the uncertainty surrounding these forecasts and their conditionality. The second consideration is the possibility that deviations from policy projections that were too firmly believed by market participants would unsettle financial markets, a possibility that would make it difficult for policy makers to depart from the projected path. For example, Kohn (2005) stated that “In any case, the risks of herding, of overreaction, of too little scope for private assessments of economic developments to show through, would seem to be high for central bank talk about policy interest rates.” Issing (2005) stated that “However, with the use of such code words, the central bank puts itself under pressure to honour a quasi-promise. If, in the meantime, its assessment of the situation has changed, owing to new developments, the central bank will be faced with the dilemma of triggering market disturbances if they ‘disappoint’ expectations, even though they may have convincing arguments to justify their reassessment of the circumstances. For this reason, indications about future decisions must always be seen only as conditional commitments. In practice, however, it is likely to prove extremely difficult to communicate this proviso with sufficient clarity. The more straightforward the ‘announcement’ and the simpler the code, the more difficult it will be to explain its conditionality ex ante.”
In this paper we evaluate these two risks to financial market functioning about which policymakers have expressed concerns, in light of the communication strategies of central banks. We do so by examining the following four questions: Do policy rate forecasts influence market prices? Are market participants inattentive of other developments when central banks provide policy rate forecasts? Do market participants take policy rate forecasts too seriously? And, do deviations from policy rate forecasts unsettle financial markets? We
1 Svensson (2006), however, argues that the conclusions of Morris and Shin (2002) depend on implausible
parameter assumptions.

Central bank policy rate guidance and financial market functioning 3
find evidence that policy rate forecasts do influence market prices, but no evidence that the forecasts impair market functioning.2
An interesting possibility is that providing regular forecasts could have different implications than choosing to provide policy guidance only occasionally. Those central banks that have elected only at certain times to provide guidance on the policy outlook have done so because they wished to manage market expectations. Central banks that periodically publish interest rate forecasts are not making a tactical decision each time they publish. Consequently, the forecasts of the former central banks may more closely resemble unconditional commitments than the forecasts of the latter central banks. As a result, central bankers could overestimate the implications for market functioning of publishing interest rate forecasts if they place too much weight on the consequences of episodic forecasts. Conversely, tests, such as those reported below, of whether policy rate guidance impairs market functioning conducted using the episodic guidance of the United States and the euro area would be more likely to find evidence of adverse effects than tests using periodic forecasts, adding to the significance of our finding no such evidence.
Does policy rate guidance influence market interest rates?
If policy rate guidance does not influence market interest rates, then the guidance would seem unlikely to impair market functioning or, for that matter, be particularly useful. Some studies for the United States have found that policy rate guidance influences US market interest rates. Kohn and Sack (2003) find that statements released by the FOMC significantly affect market interest rates, partly since these statements convey information about the near-term policy inclinations of the FOMC. Gurkaynak, Sack, and Swanson (2004) find that a factor with a structural interpretation as the “future path of policy” significantly influences US market interest rates, with the impact being larger for longer-term US Treasury yields than for shorter-term market interest rates.
We find that the forecasts of future policy rates released by the Reserve Bank of New Zealand have a significant effect on New Zealand interest rate futures. The RBNZ has provided forecasts of the ninety-day bank bill rate since June 1997 at various horizons. We match these forecasts up to eight quarters ahead with market interest rate futures on ninety-day bank bills, in order to study the relationship of the forecasts with expected future market interest rates.
In order to evaluate the effect of the new central bank forecast on market interest rates, we would like to evaluate the reaction of the futures rate on the day of publication of the forecast, (fn(t) − fn(t-1)), to the surprise in the forecast,
fn(t) − fn(t-1) = c + b (fCBn(t) − Et-1fCB
n(t)) + εt
where fCBn(t) is the central banks’ interest rate forecast n quarters ahead made at time t, fn(t)
is the futures rate on the day of publication of the forecast expiring n quarters ahead, fn(t-1) is the futures rate on the day before publication of the forecast, and Et-1fCB
n(t) is the market’s expectation of the central bank’s forecast on the day prior to its publication. In the absence of a perfect measure for this market expectation of the central bank’s forecast, we include two
2 In this paper we do not consider the question of whether low financial market volatility can adversely affect
financial stability in the medium to longer term.
4 Central bank policy rate guidance and financial market functioning
proxy measures for it in the regression. The first proxy is the futures rate on the day prior to publication of the forecast, E(1)
t-1fCBn(t)= fn(t-1), since this should incorporate all the
information available to market participants prior to the publication, according to the efficient markets hypothesis. The second proxy we use is the previous central bank forecast made a quarter ago, E(2)
t-1fCBn(t)= fCB
n+1(t-1q). Here, fCBn+1(t-1q) is the forecast n+1 quarters ahead
made in the previous quarter.3 The first proxy measure is the most timely one, but it may contain term premia, and therefore may not reflect market participants’ expectations accurately. In addition, market participants’ true expectations about future interest rates may differ from those of the central bank. We therefore also include the second proxy measure, the central bank’s previous forecast, which does not suffer from these two drawbacks, and which market participants are likely to factor into their expectations. However, it is a less timely measure and does not include the latest information.
Using these proxies for market expectations of the central bank’s forecast, the regression equation for changes in market interest rates to surprises in forecasts becomes
fn(t) − fn(t-1) = c + b (fCBn(t) − d E(1)
t-1fCBn(t) − (1− d) E(2)
t-1fCBn(t)) + εt
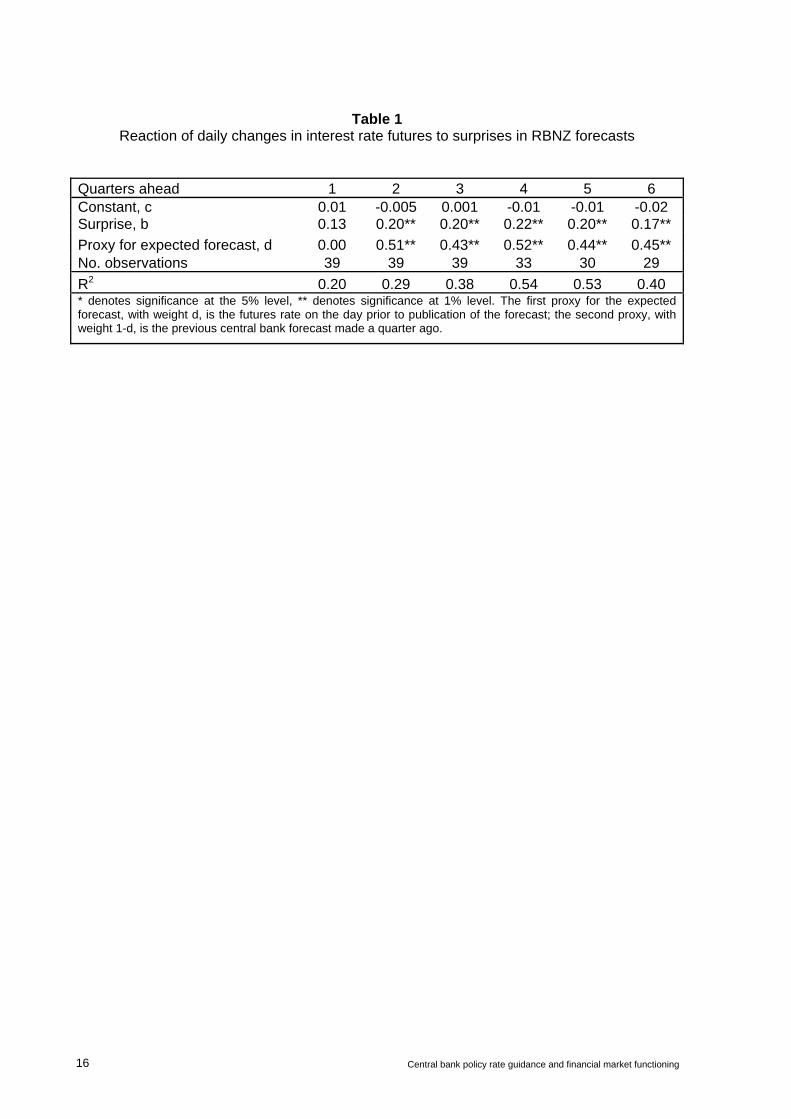
which we estimate using nonlinear least squares. Table 1 reports the results for these regressions, separately for each horizon n. We can see from Table 1 that the surprises in the RBNZ forecasts have a significant influence on financial market interest rates at horizons of two to six quarters ahead, with coefficients between 0.17 and 0.22.4 On the one hand, these coefficients may appear small, with market interest rates not moving one-for-one with surprises in central bank forecasts. This may suggest that market participants ignore central bank forecasts to a large degree, which may be perceived as damaging the central bank’s credibility. On the other hand, we only have imperfect proxy measures available for the market’s expectations of the RBNZ forecasts in the regressions, so that their correspondence is not perfect, and coefficients below one would be expected due to this measurement problem. Moreover, no doubt at least to some extent the central bank forecast is surprising to market participants because the central bank has changed its views about the likely future path for interest rates for reasons that market participants do not find compelling, and so a coefficient below one should be expected.5
As an alternative to the regressions reported in Table 1, we could have first estimated the weights on each of the proxies for the market’s expectations of the forecasts, constructed the surprise component from this regression, and inserted this surprise in a second regression of the change in the futures rate on the day of publication of the forecast on the forecast surprise. Using this alternative approach yields very similar results for the coefficients on the surprises.6 We prefer the specification reported in Table 1, however, since it does not use a derived measure for the surprise in the regression.
3 It refers to n+1 quarters ahead in order to match the n quarter ahead forecast made a quarter later. 4 These results are consistent with those reported in Archer (2005), who finds that the New Zealand yield curve
slope is weakly influenced by surprises in the published interest rate slope. 5 As discussed above, the futures rates will also not equal expected future interest rates because of term
premia. However, term premia might be expected to be fairly small at the horizons we consider. 6 At a horizon of one quarter ahead, while the coefficient on the surprise was very similar, the weight on the first
proxy measure was high at 0.76 and significant using the second approach. It is likely that estimates of the weights at that horizon can vary a lot without much economic significance since the two proxy measures exhibit a high degree of correlation.

Central bank policy rate guidance and financial market functioning 5
Are market participants inattentive of other developments when central banks provide policy rate guidance?
As discussed in the previous section, market participants do adjust their outlook for future interest rates in response to central bank interest rate forecasts. Such reaction is a reasonable response to the information revealed in those forecasts about the central bank’s preferences and views of the economic environment. As noted above, a common concern raised by central bankers, however, is that market participants may pay too much attention when central banks provide policy rate forecasts. Market participants may respond to the availability of the central bank interest rate forecast by reducing their analysis of the economic outlook and expected policy responses based on other sources of information such as macroeconomic data. As a consequence, market prices would become less informative, and central banks and other economic agents would lose a valuable source of information. We examine the response of interest rate futures and option-implied volatilities to macroeconomic data releases and central bank policy announcements below and find no evidence that market participants shift their focus inappropriately to policy announcements when policy guidance is provided at the expense of an analysis of expected future interest rates based on economic data.
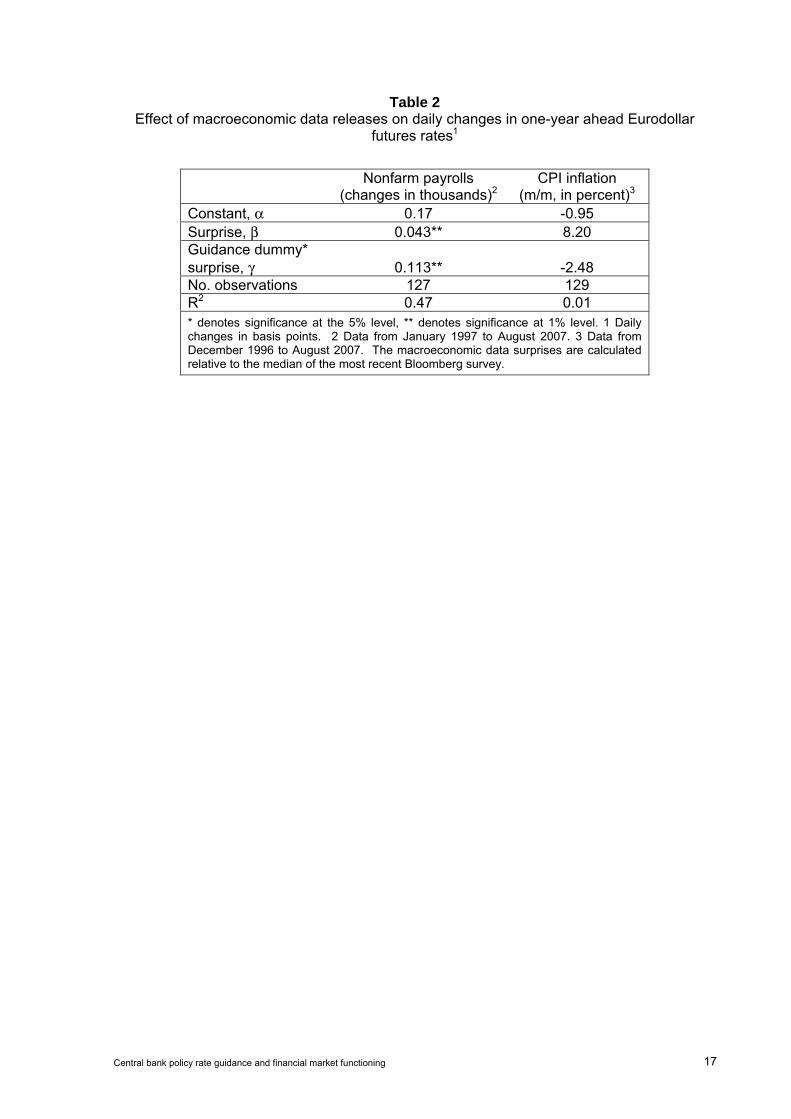
Response of interest rate futures to economic data releases One might expect that during the period when the FOMC was providing clear signals about future monetary policy (August 2003 to December 2005), the sensitivity of asset prices to macroeconomic releases might fall, in so far as the FOMC was signaling that future policy adjustments would be gradual. However, we find that the responsiveness of one-year ahead Eurodollar futures rates to changes in nonfarm payrolls, which is one of the most influential US macroeconomic data releases, was significantly higher during the guidance period (see Table 2). Table 2 reports results for the regressions of daily changes in one-year Eurodollar futures rates (in basis points), y(t)-y(t-1), on the surprise components of the nonfarm payrolls and CPI releases,
y(t) − y(t-1) = α + β (xi(t) − xei(t)) + γ dumg(t) (xi(t) − xe
i(t)) + εt
where the subscript i denotes changes in nonfarm payrolls (in thousands), or CPI inflation (m/m in percent), xi(t) is the actual value of the data release, and xe
i(t) is the Bloomberg survey expectation of the data release, so that xi(t) − xe
i(t) is the surprise component of the data releases. The guidance dummy, dumg(t), is equal to one during periods when the FOMC provided guidance, and zero at all other times. We can see from Table 2 that the coefficient on the guidance dummy is significantly positive for nonfarm payrolls releases, probably because the FOMC pointed to employment growth as a key variable in determining policy during that period. These results suggest that financial market participants continued to pay attention to macroeconomic information during the period when the FOMC was providing guidance on future policy rates, and even to a greater extent in the case of the nonfarm payrolls data. For CPI inflation, neither the surprise nor the guidance dummy are significant.
It is possible that the larger reaction to employment surprises during the guidance period was a manifestation of an inappropriate excess attentiveness to FOMC communication, since the FOMC did indicate that sustained employment growth was an important precondition for raising the federal funds rate up from 1 percent. However, it is also, of course, possible that market participants’ focus on employment data was an appropriate response of their analysis to the economic environment and their understanding of the FOMC’s policy reaction function. Economic activity had begun to pick up in 2003, but employment growth had not, leaving slack in the labor market that continued to place downward pressure on prices. With inflation

6 Central bank policy rate guidance and financial market functioning
running below 1 percent, that downward pressure posed a risk that the US economy would slip into deflation. In the event, the FOMC did not begin to tighten policy until the middle of 2004, once employment growth began to pick up.
Response of interest rate futures to policy announcements As the level of financial market volatility varies over time for a variety of reasons, including due to changes in volatility of the economy, a relevant question for evaluating the hypothesis that market participants shift their focus toward policy announcements when policy rate guidance is provided is whether the responsiveness of the outlook for future interest rates to monetary policy releases increased relative to the response to other sources of information. To examine that hypothesis, we consider the ratio of the absolute values of daily changes in one-year-ahead interest rate futures on monetary policy announcement days to the averages of those changes over recent periods (up to N days previously),
rai(t) = 100│yt − yt-1│i ⁄ ∑
n=1N (│yt-n − yt-n-1│i ⁄ N) , i = 1 or 2
on the view that movements on contiguous non-policy-announcement days will reflect the responsiveness of rates to other sources of information. We then compare the ratio over all the monetary policy days in our sample to those policy days when the central banks were providing guidance about the future path of interest rates. We look at both the FOMC and the ECB. In general, we find no evidence that there is a significant increase in this ratio during the periods with guidance.
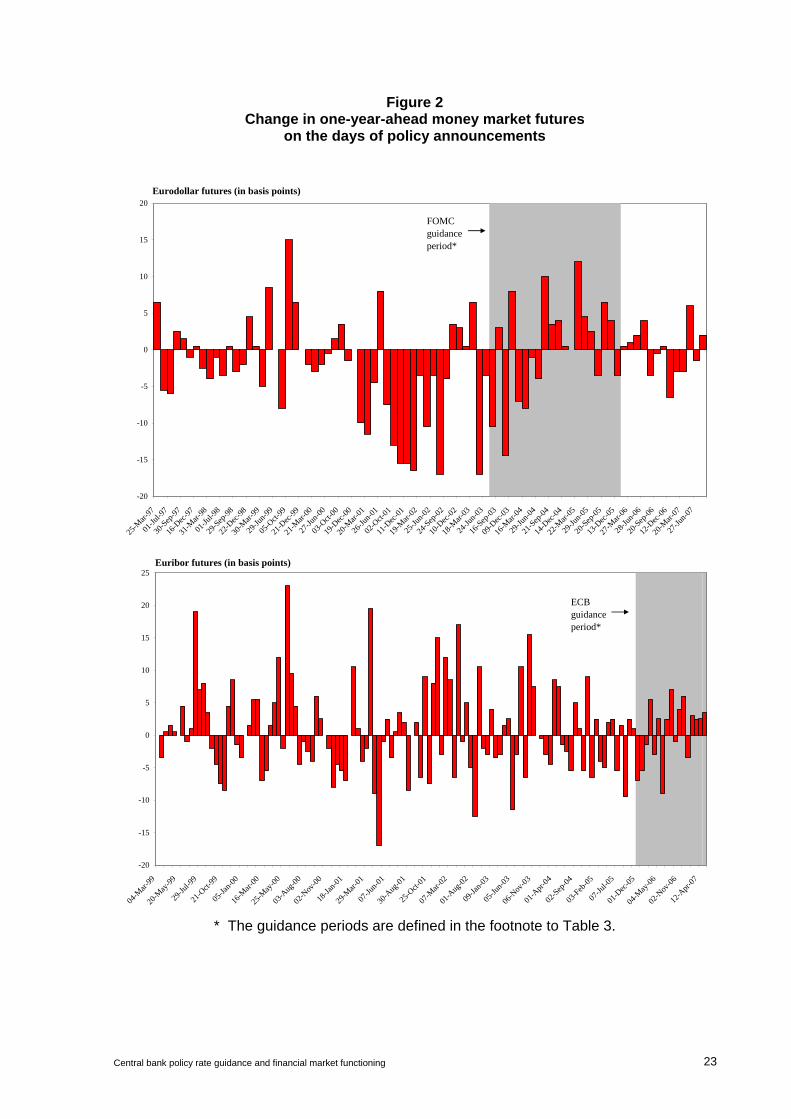
We use changes in one-year money-market interest rate futures as our measure of revisions to the expected path for monetary policy. The one-year horizon is short enough to be determined primarily by expectations about monetary policy. On the other hand, it is long enough to be beyond the period of any implicit commitment to specific monetary policy choices inherent in the central banks’ statements about the outlook for policy rates. During these episodes, the central bank communications were designed to telegraph near-term policy choices and there were virtually no surprises in the precise choice of policy rates at each meeting. Judging by the changes in one-year interest rate futures, however, during the guidance periods, revisions to the outlook for the path of policy beyond the very near term were just about as volatile as during other periods (Figure 2).
For the FOMC, we use the absolute value of daily changes in one-year Eurodollar futures as our measure of the revision to the interest rate outlook. The change on the day of FOMC meetings is divided by the average change over the preceding four weeks (the FOMC meets about every six weeks). The sample begins in 1994, when the FOMC first began releasing press statements when it changed policy. The results for the following regressions are shown in Table 3,
ra(t) = c + b dumg(t)+ εt
where again the guidance dummy, dumg(t), is equal to one during periods when the FOMC provided guidance, and zero at all other times. The absolute changes on all FOMC days average 33 percentage points higher than on other days over the preceding month. The changes are an additional 8 percentage points higher on meeting days when the FOMC was using the “considerable period” and “measured pace” language, but the difference is not statistically significant.

Central bank policy rate guidance and financial market functioning 7
For the ECB, we use the daily changes in one-year Euribor futures and the sample begins in January 2002. We only use a three-week moving average as the denominator so that the period does not include a previous meeting day (the Governing Council of the ECB has met once a month to decide on the policy rate since 2002).7 We test to see if the relative variance on meeting days rose during the period when the ECB’s President Trichet alternated between “strong vigilance” and “close monitoring” to signal if the next move would be a 25 basis point increase or no change, respectively.
The results provide even less evidence that markets became overly attentive to the ECB’s policy announcements or press conferences. For the sample as a whole, the absolute value of the interest rate changes is 58 percent higher on policy announcement days than on other days during the preceding three weeks. The increase in the changes is 7 percentage points less during the signaling period, but the difference is not statistically significant.
In New Zealand, market participants’ and the RBNZ’s forecasts of the ninety-day bill rate have moved together closely over time. This result is illustrated in Figure 1, separately for each horizon n quarters ahead. Figure 1 shows that the mean absolute difference between the published forecast and the futures rate on the day of publication of the forecast, the futures rate on the day prior to publication, and the futures rate the day the previous forecast was published. While the futures rate moves closer to the forecast on the day the forecast is published, that narrowing of the gap is small compared to the narrowing that occurs over the quarter up to the day prior to the forecast. The narrowing of the difference between the futures rates and the forecasts occurring over the quarter up to the day prior to the release of the forecast cannot, of course, reflect a response to the as yet unknown RBNZ forecast. This suggests that both forecasts and futures are to some extent reacting to the same news about the economic outlook arriving between forecast publication dates, or that independent changes in the RBNZ’s policy outlook are partially revealed to the market in speeches, testimonies or by other means. That is, futures rates adjust to new information arriving between the publication of forecasts, and market participants do not just react to published forecasts. Another possible explanation is that the RBNZ forecasts are influenced by movements in interest rate futures.
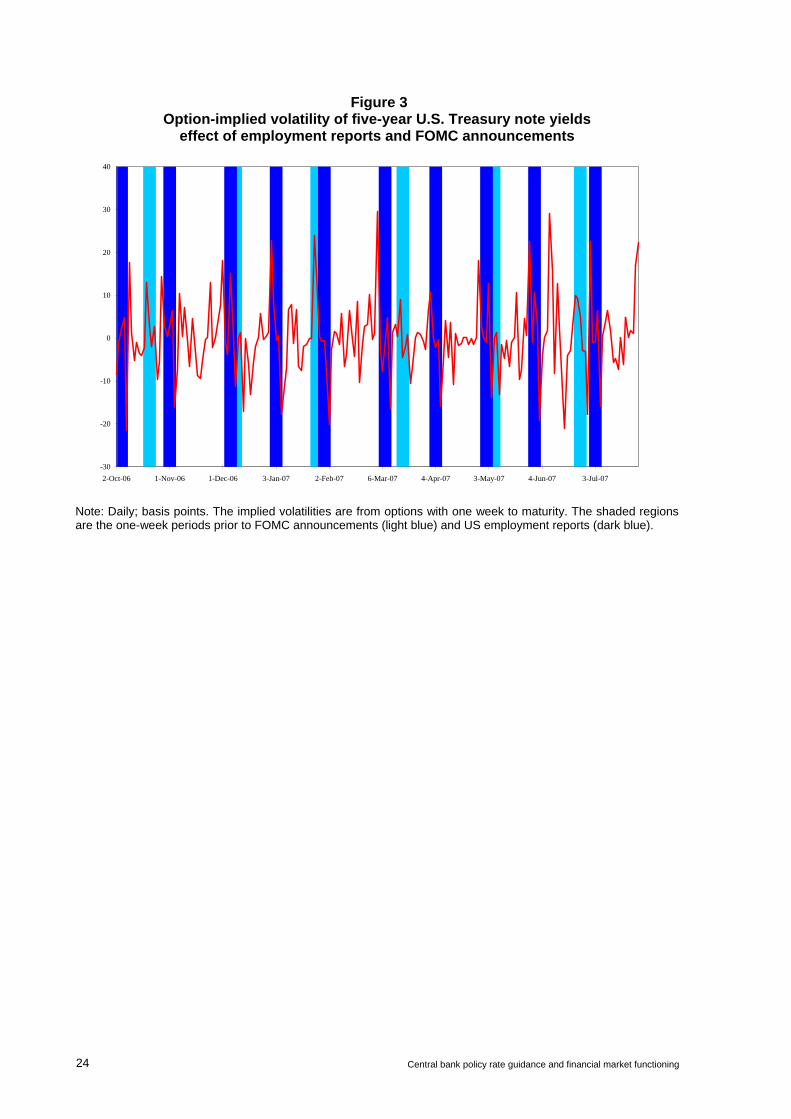
Response of option-implied interest rate volatility We can also evaluate the relative impact on market interest rates of central bank policy announcements by examining the behavior of the option-implied volatility of interest rates. The implied volatilities are taken daily from over-the-counter options with one week to maturity.8 Specifically, we use the implied volatility of the yields of on-the-run five-year Treasury securities.9 The short and constant maturity of the options allows us to measure the increase in implied volatility when specific events enter the relevant window and the decline when the events leave the window (see Figure 3).10 Since these data are only available to us for the United States, we can only test for the impact of US economic news and FOMC announcements, not for other countries. We look at the effects of FOMC
7 We start in 2002 since prior to 2002, the ECB’s Governing Council met twice monthly at scheduled meetings
to decide on monetary policy, although policy rates were generally not changed at the meeting in the middle of the month. In September 2001, the Governing Council met three times for monetary policy decisions.
8 Goldman Sachs has generously provided us with these data. 9 We examine the implied volatility in five-year yields rather than shorter maturities because we do not have
data on shorter maturity securities for options with one week to expiry. Note that the underlying interest rate is a yield to maturity and not a futures rate and so will be significantly influenced by changes in the medium-term outlook for monetary policy.
10 We benefited from discussions with Brian Sack concerning this procedure.

8 Central bank policy rate guidance and financial market functioning
announcements and of macroeconomic releases from March 1994 to the present, and test for any difference in the effects during the period when the FOMC was providing policy outlook guidance. Because of risk premia, implied volatilities are only imperfect proxies for market participants’ true uncertainty. However, daily variations in such risk premia are likely to be small, so that they would not be expected to significantly affect regression results involving daily changes in implied volatilties.
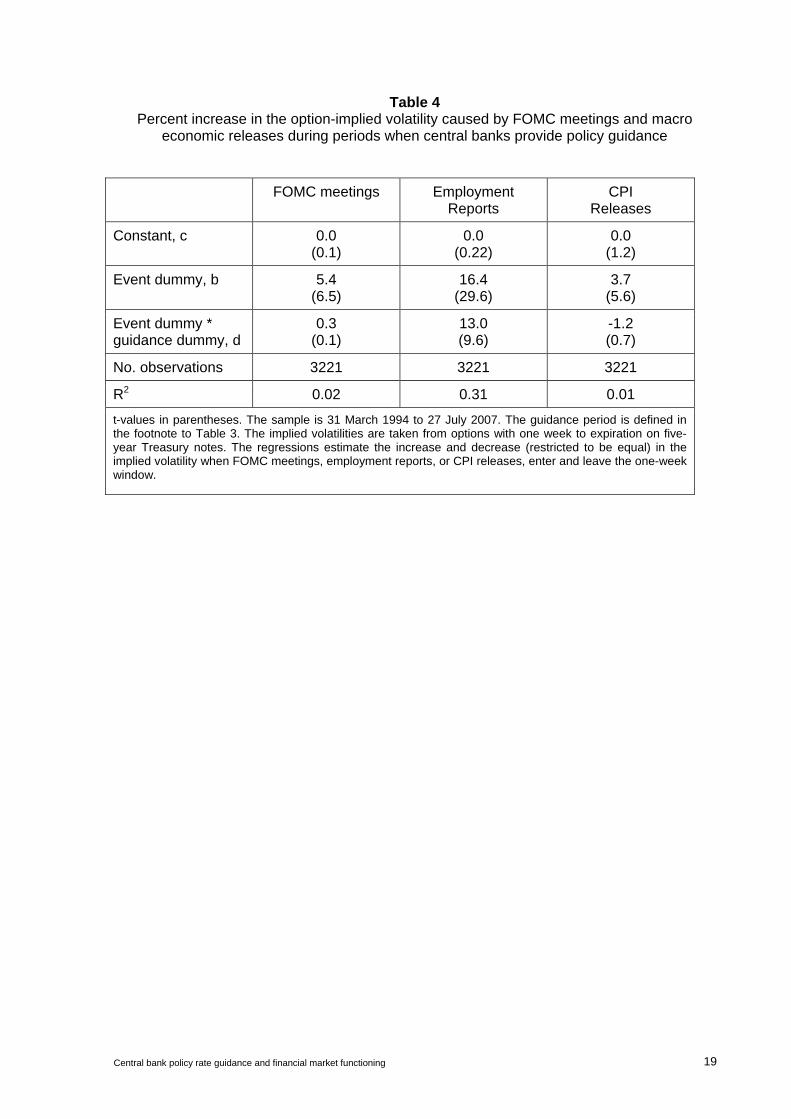
Specifically, we regress the daily log difference in the implied volatility, 100*(log(iv(t))-log(iv(t-1))), on two dummies. The first dummy, the event dummy dume(t), is equal to one on the day one week before the event of interest (when the event can first begin to influence the payoff of the underlying options), and equal to minus one on the day of the event (when the potential influence ends).11 The second dummy is the event dummy interacted with a variable that equals one during the period when the FOMC was providing guidance (dumg(t)). Thus, the regression is of the form
100*(log(iv(t))-log(iv(t-1))) = c + b dume(t) + d dume(t) dumg(t) + εt
where the subscript e denotes FOMC meetings, non farm payroll releases, or CPI releases. The results are reported in Table 4. The implied volatility of the five-year US Treasury yield behaves in a manner consistent with the results reported above. Implied volatilities are higher by about 5 percent when an FOMC meeting occurs during the week before the option expires, and the increase is highly statistically significant. The increase was 0.3 percentage point greater during the considerable period / measured pace period, but the increase is not statistically significant. The employment reports were viewed as much more consequential risk events for five-year yields than FOMC meetings, increasing implied volatilities by 16 percent (see Table 4 and Figure 3). The impact of employment reports rose to 29 percent during the guidance period, a statistically significant increase. CPI releases have on average increased implied volatilities by about 4 percent. That increase fell about a percentage point during the guidance period, but the decline is not significant. In sum, the behavior of implied volatilities provides no evidence that the FOMC’s guidance led market participants to be inattentive of other sources of information. FOMC announcements were expected to have about the same impact on five-year yields as during other times, and macro economic releases were expected to have, if anything, a larger impact.
Do market participants take central bank policy rate guidance too seriously?
A slightly different concern commonly raised by central bankers is that market participants will not understand that central banks’ statements about future policy rates are not commitments, that the statements are conditional on developments or are forecasts subject to uncertainty and error. When evaluating this concern, it seems important to distinguish between providing forecasts on a regular basis, such as is done by the Reserve Bank of New Zealand, the Norwegian central bank, and the Swedish central bank, and including forward-looking language in policy announcements for a temporary period. As noted earlier, when a
11 We are restricting the increases and decreases in implied volatility to be equal, a restriction accepted by the
data.

Central bank policy rate guidance and financial market functioning 9
forecast is released regularly, the central bank is not making a tactical decision to release or not release the forecast, and so the existence of the forecast does not necessarily imply anything about the central banks’ intentions (which is not to say that the content of the forecast does not convey information about the central banks’ intentions).12 However, if a central bank only sometimes provides guidance about future policy, the central bank is making a tactical decision to manage market participants’ expectations. Despite protestations by central banks, when a central bank only sometimes provides guidance, the existence of the guidance might therefore imply some degree of commitment and therefore a lower level of uncertainty about near-term policy rates.
For example, the minutes of the August 2003 FOMC meeting indicate that the FOMC foresaw keeping policy accommodative for a “considerable period” because it was concerned about the risk of deflation and anticipated keeping interest rates lower than normal in the future when the economy strengthened.13 Similarly, when the FOMC adopted the “measured” language in May 2004, it indicated that the tightening would likely be more gradual than normal because inflation was so low.14 We do not have minutes for the ECB’s meetings and so cannot determine the thinking behind its strategy to signal its tightening moves one meeting in advance. It seems likely, however, that the FOMC and the ECB both chose to provide fairly explicit guidance when they were beginning a tightening episode in order to prevent long rates from rising sharply, imparting too large a degree of financial restraint.
In sum, the issue is not whether market participants take central bank statements about future policy as involving some degree of commitment, but whether they take the statements too seriously. To evaluate this possibility, we compare investors’ assessments of the uncertainty in the policy outlook as measured by implied volatilities to realized volatilities or forecast errors. If realized volatilities or forecast errors are larger relative to implied volatilities during periods when central banks provide guidance, then the guidance is possibly being taken too seriously.
We look at option-implied volatilities from futures contracts on money market interest rates with three months to expiration for the United States and the euro area. Implied volatilities are derived from option prices under the assumption that the reference price evolves according to geometric Brownian motion. Under this assumption, it is reasonable to compare implied volatilities to the standard deviation of the daily changes in interest rates. Brownian motion is not, however, a particularly good assumption for interest rate futures prices, since interest rate changes are serially correlated and are subject to jumps, so we also compare the implied volatilities to the realized errors. Neither procedure suggests that market participants are unduly confident about monetary policy when forward-looking guidance is provided by the central bank.
Figure 4 presents the implied volatilities, standard deviations of interest rate changes, and absolute values of the forecast errors for the United States and the euro area. For the United States, the option-implied volatility is for Eurodollar futures with three months to expiration, and the realized standard deviation is for the daily first difference in the underlying Eurodollar futures rate.15 The errors are calculated as the difference between the futures rate with three
12 Although Irma Rosenberg (deputy governor of the Sveriges Riksbank) mentioned in a speech that one of the
motivations for a central bank to publish forecasts of its policy rate was to steer expectations (see Rosenberg (2007)).
13 Minutes of the Federal Open Market Committee, 12 August 2003. 14 Minutes of the Federal Open Market Committee, 4 May 2004. 15 The implied volatility is the normalised “basis point” volatility, not the “interest rate” volatility, and so measures
the uncertainty in absolute terms around the expected rate, not as a percent of that rate.
10 Central bank policy rate guidance and financial market functioning
months to expiration (at the same time as the measurement of implied volatility) and the spot rate at settlement. We are assuming that term premia will have a negligible, or at least a constant, effect on the realized error over the three month horizon. For the euro area, the implied volatilities are from Euribor futures, the standard deviation from Euribor futures rates, and the forecast errors are calculated using the Euribor futures and spot Euribor rate. The dummy is defined for the “vigilance/monitoring” interval.
As can be seen, the implied volatilities, especially in the US, fell to particularly low levels during the period when the central banks were providing interest rate guidance. However, the investor confidence appeared to be warranted, as the realized standard deviations and forecast errors were also quite low.16
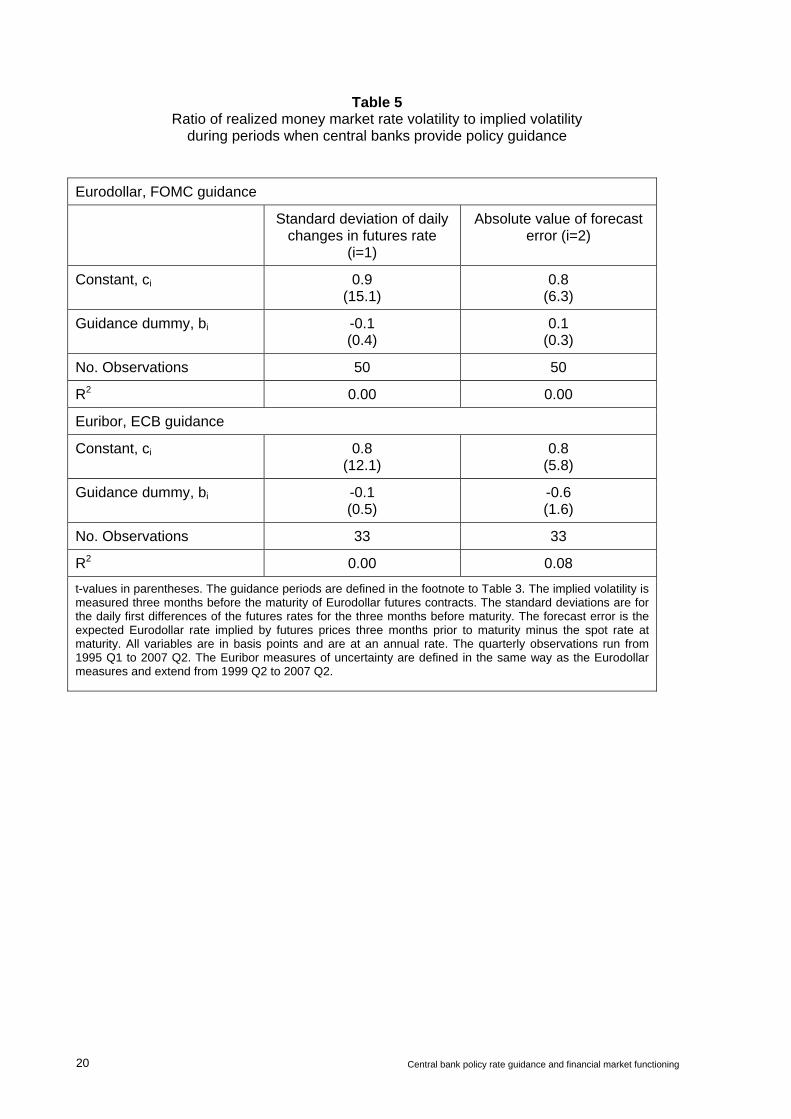
The impressions from Figure 4 are confirmed by regression results reported in Table 5. We regress the ratio of the realized standard deviation, s(t), to the implied volatility, iv(t), or the ratio of the absolute value of the realized forecast errors, fe(t), to the implied volatility on a constant and a dummy for the ‘considerable period/measured pace’ interval for the US and the ‘vigilance/monitoring’ interval for the euro area,
rbi(t) = ci + bi dumg(t)+ εt , i=1 or 2
where rb1(t) = s(t) ⁄iv(t) and rb
2(t) = fe(t) ⁄iv(t).17 In both the United States and the euro area, the standard deviations were a touch lower relative to the implied volatilities during the interval when guidance was provided, but in neither case were the differences statistically significant. The forecast errors were a bit higher in the United States and a bit lower in the Europe relative to the implied volatilities during the relevant periods, but again, neither result is statistically significant.
Market participants have been very confident in their outlooks for near-term money market interest rates when central banks have provided guidance. Judging by the muted changes in interest rates and the accuracy of interest rate forecasts embedded in futures rates, however, that confidence was justified and did not reflect a tendency for investors to take the guidance too seriously. Of course, it remains possible that the stability and predictability of realised rates during the guidance periods are the consequence of the monetary policymakers assiduously avoiding surprises after their guidance was misconstrued, but we find this possibility implausible in part, as discussed in the next section, because there is no evidence that monetary policy surprises have had notably bad effects on financial markets.
We also see no evidence of an overreaction in financial markets to surprises in the Reserve Bank of New Zealand’s interest rate forecasts. As shown in Table 1, surprises in central bank forecasts lead to some reaction of market interest rates, but with a coefficient much less than one at all horizons. Moreover, as mentioned above, Archer (2005) finds that the market yield curve slope in New Zealand is only weakly influenced by surprises in the published interest rate slope, which also suggests no overreaction by financial markets to surprises in the central bank’s interest rate forecasts.
16 Indeed, Swanson (2004) attributes a downward trend in investors’ ability to forecast interest rates and the
reduction in implied volatilities to increased FOMC transparency. 17 More details on the exact definitions of these variables is given in the notes to Table 5.
Central bank policy rate guidance and financial market functioning 11
Do deviations from earlier policy guidance unsettle markets?
The final concern raised by central bankers that we consider is that, in so far as market participants take policy rate guidance too seriously, deviations from the foreshadowed policy paths will unsettle markets. The concern is not only that the stability of financial markets and institutions will be lessened, but also that policymakers’ awareness of the potential consequences of deviations will constrain their future decisions.18
Undoubtedly, as documented in English, Gurkaynak, Nelson, and Perli (in process), central bankers are concerned about the consequences for financial stability of surprising markets. For instance, when the FOMC began tightening policy in 1994 after a long pause, Chairman Greenspan argued that, even though he believed that there was a case on macroeconomic grounds for a 50 basis point tightening, the first tightening should be only 25 basis points because the surprise would rattle financial markets.19 If central bankers believed that their statements about the future would be taken too seriously, then those statements would increase the expected magnitude of monetary policy surprises and so could reasonably be seen as posing a risk of constraining future policy choices.
As shown above, however, we find no empirical evidence that policy guidance is, in fact, taken too seriously. Furthermore, English, Gurkaynak, Nelson, and Perli (in process) find little evidence that monetary policy surprises in the United States rattle financial markets. We build on their analysis by testing for the possibility that monetary policy surprises are more likely to lessen financial stability during periods when central banks are providing guidance. Unsurprisingly, we find no compelling evidence of such increased sensitivity.
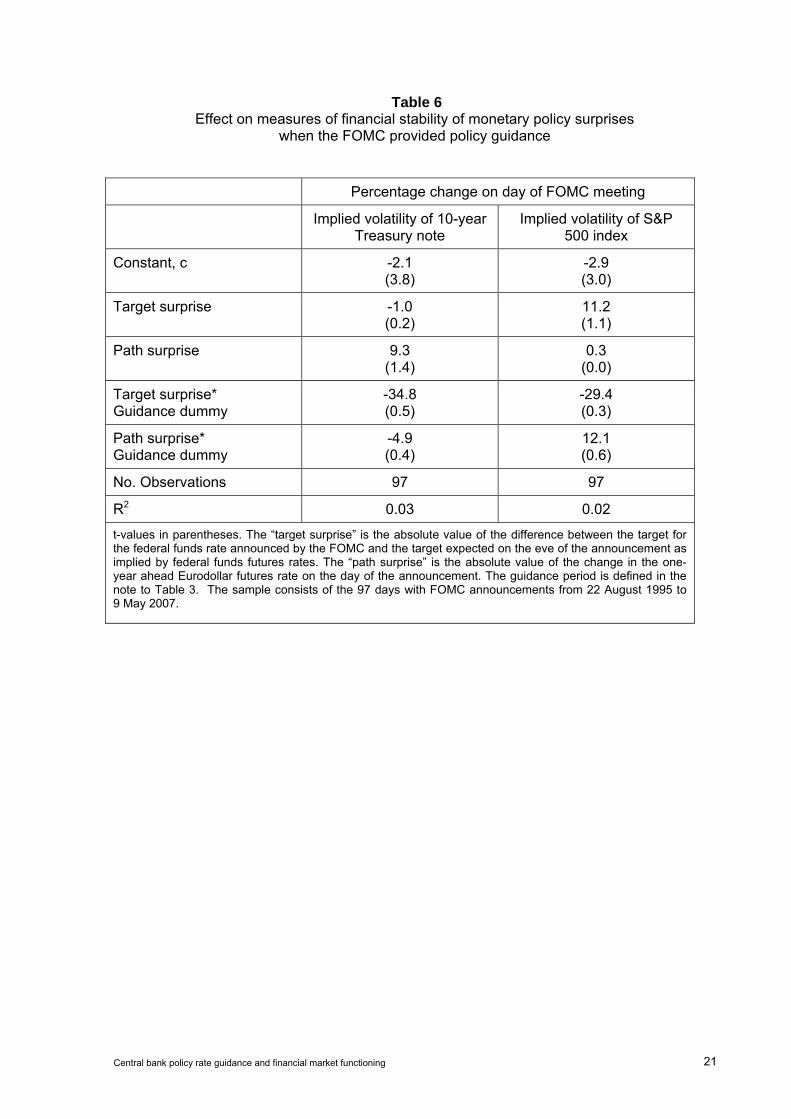
We assess financial stability using two different measures – option-implied volatilities, iv(t), of ten-year Treasury yields and of the S&P 500 stock index. We measure monetary policy surprises, mps(t), using two variables. The first – the target surprise, ts(t) – is the absolute value of the difference on days of FOMC monetary policy announcements between the FOMC’s target federal funds rate and the target expected on the eve of the announcement judging by federal funds futures rates. The second measure – the path surprise, ps(t) – is the absolute value of the change in the one-year-ahead Eurodollar futures rate on announcement days.20 We interact each surprise measure with a dummy, dumg(t), equal to one for the ‘considerable period/measured pace’ interval,
100*(log(iv(t))−log(iv(t-1))) = c + a ts(t) + b ps(t)
+ d dumg(t) ts(t) + f dumg(t) ps(t) + εt
The significance of the coefficient on the interaction term measures the effect of the guidance on market sensitivity to monetary policy surprises.
18 Kohn (2005). 19 FOMC transcript, 3 February 1994, p 55. In the event, there were a number of abrupt jumps in longer term
interest rates, and associated market volatility, during the tightening episode that began in 1994 as the market and the FOMC reacted to economic data that came in stronger than expected. It would seem reasonable to suppose that the 1994 experience contributed to the decision by the FOMC to use the “measured pace” language during the tightening episode that began in 2004.
20 We are following the “target” and “path” surprise terminology of Gurkaynack, Sack, and Swanson (2004), but we do not calculate the path surprise as a residual from a regression of the change in the futures rate on the target surprise.
12 Central bank policy rate guidance and financial market functioning
The results are reported in Table 6. The monetary policy surprise measures do not have a significant effect on these measures of financial stability. In no case was the effect of the policy surprises significantly different during the ‘considerable period/measured pace’ FOMC announcements. By these measures, monetary policy surprises generally do not unsettle markets, and they did not unsettle markets by more when the FOMC was providing forward guidance.21
As noted earlier, however, target surprises were very low during the guidance period because the guidance (and other communications) left little doubt about the policy outcome for each meeting. In this sense, we are not strictly testing the effect of departing from a past policy rate forecast. Still, the path surprises were substantial during the period (see Figure 2). The expectations for the path of policy prior to the FOMC announcements were conditional on the guidance provided in the previous announcements. Revisions to the expected path in response to the new statements, therefore, are an indication that the FOMC was seen as likely to follow a path somewhat at odds with the path previously communicated.
The results for New Zealand presented in Table 1 above suggest that surprises in central bank interest rate forecasts influence changes in market interest rates, with coefficients below 1, suggesting that there is no disorderly overreaction to unexpected changes in projected interest rates, and no unsettling effect on financial markets.
Conclusions
Central bank communication has changed dramatically over the past decade, with some central banks providing guidance about, or explicit forecasts of, likely future policy rates. One frequently made argument against the provision of such guidance or forecasts is that it runs the risk of impairing market functioning. In this paper, we evaluated the behaviour of financial markets in the United States, the euro area and New Zealand in light of the communication strategies of central banks. We found evidence for New Zealand that central bank forecasts of policy rates influence market prices, but no evidence that forecasts or guidance impair market functioning in the United States, the euro area or New Zealand. In particular, market participants do not appear inattentive of other developments when central banks provide policy rate guidance; they do not appear to take central bank policy rate guidance too seriously; and deviations from earlier policy guidance do not appear to unsettle markets. Consequently, this evidence suggests that concerns about impairing market functioning are not a strong argument against central banks’ provision of policy rate guidance or forecasts.
It does not follow, of course, that central banks should therefore provide forecasts of their policy rates. That decision would depend upon the advantages and disadvantages of providing those forecasts. Advantages could include facilitating central bank explanations of policy decisions and strategies, enhancing the transmission of monetary policy through expectations about future interest rates, increasing central bank transparency and accountability, and lessening the odds of market misunderstanding of central bank intentions and the associated added financial market volatility. Moreover, deviations of market interest rate futures from published central bank interest rate forecasts could provide valuable
21 We also evaluated the effect of monetary surprises on two measures of financial stress developed at the
Federal Reserve Board – a broad index of financial stress and the odds that multiple financial institutions will default over the subsequent year (see Nelson and Perli, 2005). The results are the same as those reported above using implied volatilities. The effect of the policy surprises are not significantly different during the ‘considerable period/measured pace’ FOMC announcements for either measure. We also find no significant effect when, instead of the absolute value of the surprises, we use the level of the surprises or the squared surprises.

Central bank policy rate guidance and financial market functioning 13
information to policymakers of how the market participants’ outlook differs from that of the central bank. Since the central bank’s expected policy rates are known to the public, any differences are less likely to be due to a misunderstanding of the central bank’s plans concerning future policy rates. Disadvantages could include the complexity of communicating the policy outlook of independent committee members, the communication challenges associated with revising policy choices that deviate from the forecast or with revising the forecast, and risks to central bank independence. Another possible disadvantage is the potential loss of credibility when policy rate forecasts do not come to pass. However, the evidence cited above that market participants appear to understand that guidance is conditional and subject to error would seem to lessen somewhat the odds that departing from past forecasts would reduce central bank credibility.

14 Central bank policy rate guidance and financial market functioning
References Archer, D (2005): “Central bank communication and the publication of interest rate projections”, mimeo, Bank for International Settlements. Bergo, J (2007): “Interest rate projections in theory and practice,” speech at the foreign exchange seminar of the Association of Norwegian Economists, 26 January. English, W, R Gurkaynak, W Nelson and R Perli (in process): “Monetary policy and financial stability.” Gurkaynak, R, B Sack and E Swanson (2004): “Do actions speak louder than words?”, mimeo, Federal Reserve Board. Ingves, S (2007): “Communications – what demands are made of an independent central bank?”, speech at the Swedish Economics Association, 24 April. Issing, O (2005): “Communication, transparency, accountability — Monetary policy in the twenty-first century”, Federal Reserve Bank of St. Louis Review no 87:2, pp 65–83. King, M (2007): “The MPC ten years on”, lecture delivered on 2 May to the Society of Business Economists. Kohn, D (2005): “Central bank communications”, remarks at the annual meeting of the American Economics Association, 9 January. Kohn, D (2008): “Recent and prospective developments in monetary policy transparency and communications: a global perspective”, remarks at the annual meeting of the Allied Social Science Association, 5 January. Kohn, D and B Sack (2003): “Central bank talk: does it matter and why?”, mimeo, Federal Reserve Board. Morris, S and H Shin (2002): “Social value of public information,” American Economic Review no 92:5, pp 1521–34. ——— (2005), “Central bank transparency and the signal value of prices,” Brookings Papers on Economic Activity no 2005:2, pp 1–66. Nelson, W and R Perli (2005): ''Selected indicators of financial stability'', Irving Fisher Committee's Bulletin on Central Bank Statistics, vol no 23, October, pp 92–105. Rosenberg, I (2007): “Riksbank to introduce own path for the repo rate”, speech at Danske Bank, Stockholm, 17 January. Rudebusch, G and J Williams (2006): “Revealing the secrets of the temple: the value of publishing interest rate projections”, mimeo, Federal Reserve Board. Swanson, E (2004): “Federal Reserve transparency and financial market forecasts of short-term interest rates”, Finance and Economics Discussion Series Working Paper no 2004–6. Svensson, L (2006): “Social value of public information: Morris and Shin (2002) is actually pro-transparency, not con”, American Economic Review, no 96, pp 448–52.

Central bank policy rate guidance and financial market functioning 15
——— (2004), “Challenges for monetary policy”, paper prepared for the Bellagio group meeting at the National Bank of Belgium, 26-27 January. Tucker, Paul (2007): “Central banking and political economy: the example of the UK’s monetary policy committee”, Speech at the Inflation targeting, central bank independence and transparency conference, 15 June. Woodford, M (2005): “Central bank communication and policy effectiveness”, presented at FRB Kansas City Symposium on “The Greenspan era: lessons for the future”, Jackson Hole, Wyoming, 25-27August.
16 Central bank policy rate guidance and financial market functioning
Table 1
Reaction of daily changes in interest rate futures to surprises in RBNZ forecasts
Quarters ahead 1 2 3 4 5 6 Constant, c 0.01 -0.005 0.001 -0.01 -0.01 -0.02 Surprise, b 0.13 0.20** 0.20** 0.22** 0.20** 0.17** Proxy for expected forecast, d 0.00 0.51** 0.43** 0.52** 0.44** 0.45** No. observations 39 39 39 33 30 29 R2 0.20 0.29 0.38 0.54 0.53 0.40 * denotes significance at the 5% level, ** denotes significance at 1% level. The first proxy for the expected forecast, with weight d, is the futures rate on the day prior to publication of the forecast; the second proxy, with weight 1-d, is the previous central bank forecast made a quarter ago.
Central bank policy rate guidance and financial market functioning 17
Table 2 Effect of macroeconomic data releases on daily changes in one-year ahead Eurodollar
futures rates1
Nonfarm payrolls
(changes in thousands)2 CPI inflation
(m/m, in percent)3 Constant, α 0.17 -0.95 Surprise, β 0.043** 8.20 Guidance dummy* surprise, γ 0.113** -2.48 No. observations 127 129 R2 0.47 0.01 * denotes significance at the 5% level, ** denotes significance at 1% level. 1 Daily changes in basis points. 2 Data from January 1997 to August 2007. 3 Data from December 1996 to August 2007. The macroeconomic data surprises are calculated relative to the median of the most recent Bloomberg survey.

18 Central bank policy rate guidance and financial market functioning
Table 3 Ratio of absolute value of changes in interest rate futures on policy announcement days to
other days during periods when central banks provide policy guidance
Federal Reserve ECB
Constant, c 132.7 (11.6)
157.95 (10.6)
Guidance dummy, b 8.4 (0.3)
-6.8 (0.2)
No. observations 109 64
R2 0.00 0.03
t-values in parentheses. The FOMC provided guidance about the likely trajectory for policy from 12 August 2003 to 13 December 2005, when it first indicated that interest rates would be held at 1 percent for a “considerable period” and then stated that policy tightening would proceed at a pace likely to be “measured.” The sample consists of the 109 FOMC meetings from February 1994 to August 2007. The ECB telegraphed its policy moves one month in advance from December 2005 to August 2007. The sample consists of the sixty-four monetary policy announcements from January 2002 to August 2007.
Central bank policy rate guidance and financial market functioning 19
Table 4 Percent increase in the option-implied volatility caused by FOMC meetings and macro
economic releases during periods when central banks provide policy guidance FOMC meetings Employment
Reports CPI
Releases
Constant, c 0.0 (0.1)
0.0 (0.22)
0.0 (1.2)
Event dummy, b 5.4 (6.5)
16.4 (29.6)
3.7 (5.6)
Event dummy * guidance dummy, d
0.3 (0.1)
13.0 (9.6)
-1.2 (0.7)
No. observations 3221 3221 3221
R2 0.02 0.31 0.01
t-values in parentheses. The sample is 31 March 1994 to 27 July 2007. The guidance period is defined in the footnote to Table 3. The implied volatilities are taken from options with one week to expiration on five-year Treasury notes. The regressions estimate the increase and decrease (restricted to be equal) in the implied volatility when FOMC meetings, employment reports, or CPI releases, enter and leave the one-week window.
20 Central bank policy rate guidance and financial market functioning
Table 5 Ratio of realized money market rate volatility to implied volatility
during periods when central banks provide policy guidance
Eurodollar, FOMC guidance
Standard deviation of daily changes in futures rate
(i=1)
Absolute value of forecast error (i=2)
Constant, ci 0.9 (15.1)
0.8 (6.3)
Guidance dummy, bi -0.1 (0.4)
0.1 (0.3)
No. Observations 50 50
R2 0.00 0.00
Euribor, ECB guidance
Constant, ci 0.8 (12.1)
0.8 (5.8)
Guidance dummy, bi -0.1 (0.5)
-0.6 (1.6)
No. Observations 33 33
R2 0.00 0.08
t-values in parentheses. The guidance periods are defined in the footnote to Table 3. The implied volatility is measured three months before the maturity of Eurodollar futures contracts. The standard deviations are for the daily first differences of the futures rates for the three months before maturity. The forecast error is the expected Eurodollar rate implied by futures prices three months prior to maturity minus the spot rate at maturity. All variables are in basis points and are at an annual rate. The quarterly observations run from 1995 Q1 to 2007 Q2. The Euribor measures of uncertainty are defined in the same way as the Eurodollar measures and extend from 1999 Q2 to 2007 Q2.
Central bank policy rate guidance and financial market functioning 21
Table 6 Effect on measures of financial stability of monetary policy surprises
when the FOMC provided policy guidance
Percentage change on day of FOMC meeting
Implied volatility of 10-year Treasury note
Implied volatility of S&P 500 index
Constant, c -2.1 (3.8)
-2.9 (3.0)
Target surprise -1.0 (0.2)
11.2 (1.1)
Path surprise 9.3 (1.4)
0.3 (0.0)
Target surprise* Guidance dummy
-34.8 (0.5)
-29.4 (0.3)
Path surprise* Guidance dummy
-4.9 (0.4)
12.1 (0.6)
No. Observations 97 97
R2 0.03 0.02
t-values in parentheses. The “target surprise” is the absolute value of the difference between the target for the federal funds rate announced by the FOMC and the target expected on the eve of the announcement as implied by federal funds futures rates. The “path surprise” is the absolute value of the change in the one-year ahead Eurodollar futures rate on the day of the announcement. The guidance period is defined in the note to Table 3. The sample consists of the 97 days with FOMC announcements from 22 August 1995 to 9 May 2007.

22 Central bank policy rate guidance and financial market functioning
Figure 1
0.0
0.2
0.4
0.6
0.8
1.0
1.2
1 2 3 4 5 6Quarters ahead
Percentagepoints Mean absolute difference between futuresa and RBNZ forecastsb
Futures at cob of publication date
Futures on day before publication
Futures at cob of previous forecast publication
a Futures on New Zealand 90-day bank bills. b Forecasts by Reserve Bank of New Zealand of 90-day bank bill rates.
Central bank policy rate guidance and financial market functioning 23
Figure 2 Change in one-year-ahead money market futures
on the days of policy announcements
Eurodollar futures (in basis points)
-20
-15
-10
-5
0
5
10
15
20
25-M
ar-97
01-Ju
l-97
30-Sep
-97
16-D
ec-97
31-M
ar-98
01-Ju
l-98
29-Sep
-98
22-D
ec-98
30-M
ar-99
29-Ju
n-99
05-O
ct-99
21-D
ec-99
21-M
ar-00
27-Ju
n-00
03-O
ct-00
19-D
ec-00
20-M
ar-01
26-Ju
n-01
02-O
ct-01
11-D
ec-01
19-M
ar-02
25-Ju
n-02
24-Sep
-02
10-D
ec-02
18-M
ar-03
24-Ju
n-03
16-Sep
-03
09-D
ec-03
16-M
ar-04
29-Ju
n-04
21-Sep
-04
14-D
ec-04
22-M
ar-05
29-Ju
n-05
20-Sep
-05
13-D
ec-05
27-M
ar-06
28-Ju
n-06
20-Sep
-06
12-D
ec-06
20-M
ar-07
27-Ju
n-07
FOMC guidance period*
Euribor futures (in basis points)
-20
-15
-10
-5
0
5
10
15
20
25
04-M
ar-99
20-M
ay-99
29-Ju
l-99
21-O
ct-99
05-Ja
n-00
16-M
ar-00
25-M
ay-00
03-A
ug-00
02-N
ov-00
18-Ja
n-01
29-M
ar-01
07-Ju
n-01
30-A
ug-01
25-O
ct-01
07-M
ar-02
01-A
ug-02
09-Ja
n-03
05-Ju
n-03
06-N
ov-03
01-A
pr-04
02-Sep
-04
03-Feb
-05
07-Ju
l-05
01-D
ec-05
04-M
ay-06
02-N
ov-06
12-A
pr-07
ECB guidance period*
* The guidance periods are defined in the footnote to Table 3.
24 Central bank policy rate guidance and financial market functioning
Figure 3 Option-implied volatility of five-year U.S. Treasury note yields
effect of employment reports and FOMC announcements
-30
-20
-10
0
10
20
30
40
2-Oct-06 1-Nov-06 1-Dec-06 3-Jan-07 2-Feb-07 6-Mar-07 4-Apr-07 3-May-07 4-Jun-07 3-Jul-07
Note: Daily; basis points. The implied volatilities are from options with one week to maturity. The shaded regions are the one-week periods prior to FOMC announcements (light blue) and US employment reports (dark blue).

Central bank policy rate guidance and financial market functioning 25
Figure 4 Implied and realized money-market interest rates volatility
at the three-month horizon Eurodollar (in basis points, annual rate)
0
50
100
150
200
250
1998 1999 2000 2001 2002 2003 2004 2005 2006 2007
FOMC guidance period
Euribor (in basis points, annual rate)
0
10
20
30
40
50
60
70
80
1999 2000 2001 2002 2003 2004 2005 2006 2007
Implied volatility Standard deviation Absolute forecast error
ECB guidance period
Note: Quarterly. The guidance periods are defined in the footnote to Table 3. The implied volatilities are measured three months before maturity of the futures contract. The standard deviations are for the daily first difference of the futures rates for the three months before maturity. The forecast error is the expected money market rate three months prior to maturity minus the spot rate at maturity.