birth defects in south australia 2016 - annual report
TRANSCRIPT

Birth Defects in South Australia
2016
South Australian Birth Defects Register Women’s and Children’s Hospital
Adelaide, South Australia
Women’s & Children’s Hospital

The South Australian Birth Defects Register
Birth Defects in South Australia 2016 2
Birth Defects in South Australia 2016
Children born from 1986 to 2016 with birth defects
notified to the South Australian Birth Defects Register
by 31st March 2017

The South Australian Birth Defects Register
Birth Defects in South Australia 2016 3
Location
Paediatric Rehabilitation Department
Women’s and Children’s Hospital
Women’s and Children’s Health Network
First Floor, Rieger Building
72 King William Road
North Adelaide, South Australia 5006
Telephone: (08) 8161-7368
Email: [email protected]
SABDR Website: http://www.wch.sa.gov.au/services/az/other/phru/birthdefect.html
Staff
Dr Catherine Gibson, Manager, SA Birth Defects Register
Ms Heather Scott, Manager, SA Birth Defects Register
Ms Jennifer Hernandez, Register Officer, SA Birth Defects Register
Advisory Committee
Dr James Rice, Paediatric Rehabilitation Specialist
Prof Chris Barnett, Clinical Geneticist
Dr Peter Muller, Maternal Fetal Medicine Specialist
Dr Geoffrey Martin, General Practitioner
Dr Catherine Gibson, SA Birth Defects Register
Ms Heather Scott, SA Birth Defects Register
Ms Jennifer Hernandez, SA Birth Defects Register
Specialist Advisors to the Register
Prof Chris Barnett, Clinical Genetics
A/Prof Bruce Foster, Orthopaedic Surgery
Mr Peter Cundy, Orthopaedic Surgery
Prof David David, Craniofacial Surgery
Dr Malcolm Richardson, Cardiology
Dr Hilary Boucaut, Urology
Dr Steve Santoreneos, Neurosurgery
A/Prof Tom Revesz, Haematology/Oncology
Dr Peter Muller, Maternal Fetal Medicine
Dr Chris Wilkinson, Obstetrician
Dr Cathy Cord-Udy, General Surgery
Suggested Citation
Gibson CS, Scott H, Hernandez J. Birth Defects in South Australia 2016. Adelaide. SA Birth
Defects Register, Women’s and Children’s Health Network, 2020.
ISSN 2205-228X (online)

Contents
Birth Defects in South Australia 2016 4
Contents
Executive Summary ...................................................................................................................... 7
Introduction .................................................................................................................................... 8
Demographics ............................................................................................................................... 9
Types of birth defects notified ..................................................................................................... 15
Trends in selected birth defects .................................................................................................. 18
Sentinel defects ........................................................................................................................... 24
Deaths associated with birth defects ........................................................................................... 26
Sources of notification ................................................................................................................. 28
Birth defects detected / notified after discharge from the birth hospital ...................................... 28
Prenatal screening for congenital anomalies .............................................................................. 30
Appendix ...................................................................................................................................... 35

Tables, Figures and Appendices
Birth Defects in South Australia 2016 5
Tables, Figures and Appendices
Tables
Table 1: Birth defects in children born in South Australia ....................................................................... 9
Table 2: Cases with birth defects by residence of mother at time of birth ............................................ 10
Table 3: Cases with birth defects by sex of child.................................................................................. 12
Table 4: Cases with birth defects by mother’s race .............................................................................. 13
Table 5: Cases with birth defects by plurality ....................................................................................... 14
Table 6: Cases with specified birth defects by diagnostic category ...................................................... 16
Table 7: Cases of sentinel defects by CURB region ............................................................................ 25
Table 8: Deaths associated with birth defects ...................................................................................... 27
Table 9: Cases with birth defects notified after discharge from the birth hospital by major diagnostic
category ................................................................................................................................. 29
Table 10: Prenatal diagnosis by technique ............................................................................................ 30
Table 11: Chorionic villus sampling and amniocentesis: Utilisation by maternal age, 2014-2016 .......... 31
Table 12: Down syndrome, SA 2014-2016: Cases detected / not detected .......................................... 32
Table 13: Down syndrome, SA 2014-2016: Outcome of cases ............................................................. 32
Table 14: Risk of Down syndrome by maternal age, SA 1986-2016 ..................................................... 33
Table 15: Neural tube defects, SA 2014-2016: Cases detected / not detected ...................................... 34
Table 16: Neural tube defects, SA 2014-2016: Outcome of cases ......................................................... 34
Figures
Figure 1: Birth defects in children born in South Australia ....................................................................... 9
Figure 2: South Australian CURB (Committee on Uniform Regional Boundaries) regions .................... 11
Figure 3: Cases with birth defects by sex of child.................................................................................. 12
Figure 4: Cases with birth defects by mother’s race .............................................................................. 13
Figure 5: Cases with birth defects by plurality ....................................................................................... 14
Figure 6: Cases with birth defects by major diagnostic category (prevalence per 1,000 births) ............ 15
Figure 7: Trends in selected birth defects ............................................................................................. 18
Figure 8: Prevalence of sentinel defects ............................................................................................... 24
Figure 9 Deaths associated with birth defects by death category ........................................................ 26
Figure 10: Sources of notification: Total notifications received ............................................................... 28
Figure 11: Percentage of cases with birth defects notified after discharge from the birth hospital by
diagnostic category ................................................................................................................ 29
Figure 12: Percentage of chorionic villus sampling and amniocentesis by year for all women: all
indications ............................................................................................................................. 30
Figure 13: Chorionic villus sampling and amniocentesis: utilisation by maternal age ............................. 31
Appendix
Appendix 1: Background information on the South Australian Birth Defects Register ............................... 35
Appendix 2: Confidentiality guidelines ....................................................................................................... 36
Appendix 3: Notification form .................................................................................................................... 39
Appendix 4: Birth defect inclusions and exclusions ................................................................................... 40

Acknowledgements
Birth Defects in South Australia 2016 6
Thanks to notifiers and acknowledgements
We wish to thank all the notifiers who supplied the information on which this report is based. We greatly
appreciate their support and advice, the time and effort they spend on completing the forms and their
cooperation in supplying extra information when requested.
We would like to express our thanks to the staff of the particular departments who have data collections or
registers with which the Birth Defects Register interfaces:
Women’s and Children’s Health Network:
The Department of Cardiology for data on congenital heart defects,
The Division of Medical Imaging for radiology and ultrasound information,
The Medical Records Department.
SA Pathology:
Genetics and Molecular Pathology for cytogenetics reports, Down syndrome data, information on
maternal screening, inborn errors of metabolism, abnormal neonatal screening results and data on
prenatal diagnostic tests such as amniocentesis and chorionic villus sampling,
SA Perinatal Autopsy Service for autopsy reports,
Haematology
We also express thanks to the Medical Records Departments of South Australian metropolitan and
regional hospitals, in particular Flinders Medical Centre, Lyell McEwin Health Service, The Memorial
Hospital, Ashford Hospital, Calvary North Adelaide Hospital, St Andrew’s Hospital and Parkwynd Private
Hospital.
We would like to thank all those people who have contributed to the South Australian Birth Defects
Register since its inception. Their ongoing support and practical contribution is much appreciated.
Special thanks are due to the staff of the Pregnancy Outcome Unit, for providing the important perinatal
data, and for their assistance with data linkage and statistical support.
The Birth Defects Register Advisory Committee was established in June 1989 to advise the Register on
issues of confidentiality and to review the activities of the Register. We thank its members for their time,
expertise and valuable advice.
The advice of many clinicians has been sought on the classification and coding of defects in specialised
areas, such as orthopaedics, craniofacial surgery, urology, neurosurgery and cardiology. We would like to
express our gratitude to these consultants for their ongoing guidance.
Thank you to Dr Bill Carey of Softcare Software for the creation and continued support of our computing
software.
Thanks to the WA Register of Developmental Anomalies and the AIHW National Perinatal Statistics Unit
for their ongoing support.

Executive Summary
Birth Defects in South Australia 2016 7
Executive Summary
This report combines the first published notification data on birth defects in South Australia for the 2014-
2016 calendar years.
The Register received 919 (4.6% of total births) notifications of children born with one or more birth defects
in 2016; 1103 (5.5% of total births) for 2015; and 1220 (5.9% of total births) for 2014. The proportion of
total births with birth defects for the period 1986-2016 was 6.0%. The difference represents the additional
notifications, around 30%, received over the Register’s further four year ascertainment period for each
birth year cohort.
It is noteworthy that the percentage of total births with birth defects has not changed significantly since the
Register began to collect data in 1986.
In 2016
Demographics:
The Central Northern CURB region recorded the highest proportions of births with birth defects, with
5.0% of total births, compared to the lowest proportion of 3.2% seen in the Yorke and Lower North
CURB region. These differences are not statistically different and reflect year to year variation in
prevalence of birth defects and in ascertainment between regions. The prevalence of sentinel birth
defects is similar across all regions when assessed over longer time periods.
As seen in previous years, male sex and multiple births are associated with an increased risk of birth
defects.
5.7% of births to Aboriginal mothers had a notifiable birth defect, compared with 4.1% of both
Caucasian and Asian mothers. These data reflect year to year variation, and are likely to alter over
the subsequent years of ascertainment. Over the years 1986-2016, the proportion of birth defects
was highest for Caucasian mothers (5.6%), followed by Aboriginal mothers (5.2%) and Other race
mothers (5.0%). Births to Asian mothers resulted in the lowest proportion of birth defects (4.2%).
Neural tube defects and Down syndrome:
There were 17 births or terminations of pregnancy with neural tube defects. The Register
documented a significant decreasing trend in the prevalence of neural tube defects between 1986
and 2016.
There were 59 births or terminations of pregnancy with Down syndrome. There is an increasing
trend in the total prevalence of Down syndrome between 1986 and 2016, mostly due to increasing
maternal age.
Reported birth defects:
The most commonly reported birth defects were urogenital and musculoskeletal abnormalities with
16.7 and 16.3 cases respectively per 1,000 total births. Chromosomal abnormalities had a
prevalence of 4.6 per 1,000 total births.
Deaths:
15.4% of spontaneous stillbirths and 33.3% of neonatal deaths were associated with birth defects.
Late identification of birth defects:
37% of cardiovascular defects and 26% of gastrointestinal defects were identified after discharge
from the birth hospital.
Reports of Prenatal Screening for Congenital Anomalies are no longer being published as a separate
report. Instead, key tables relating to neural tube defects and Down syndrome have been incorporated
into the current report.

Introduction
Birth Defects in South Australia 2016 8
Introduction
The South Australian Birth Defects Register is a population-based collection of information on birth
defects, including cerebral palsy, from a population with an average of 20,380 births per year over the past
five years. The Register collects information on all children born in South Australia on or after 1st January
1986 who have a significant birth defect detected in the first five years of life. It thus complements and
extends the collection of congenital abnormalities detected in the perinatal period and notified by doctors
to the Pregnancy Outcome Unit of SA Health.
The SA Birth Defects Register aims to provide complete, accurate and up-to-date information for the
following purposes:
Establishing local prevalence rates for birth defects
Monitoring the occurrence of defects over time and by geographical area to allow investigation of
suspected teratogens
Increasing community knowledge about birth defects through education and by acting as a source
of information
Utilisation of local prevalence rates to plan health care facilities
Epidemiological studies on the causation of birth defects
As an accurate diagnostic index for clinical research
The Register defines a birth defect as “any abnormality, structural or functional, identified up to five years
of age, provided that the condition had its origin before birth.” It includes:
Terminations of pregnancy at any gestation performed because of a diagnosis of a birth defect
Stillbirths and newborn babies with birth defects
Children diagnosed with a birth defect after the neonatal period and prior to their fifth birthday
The Register is located in the Women’s and Children’s Hospital in the Paediatric Rehabilitation
Department. This is an ideal location for the following reasons:
The majority of children with birth defects requiring medical or surgical care are referred to the
Women’s and Children’s Hospital for assessment or further management at some stage
The major paediatric diagnostic services and perinatal/paediatric pathology services are located at
the Women’s and Children’s Hospital
Notifications of birth defects come from various sources including:
Doctors and other health professionals involved with the care of children with birth defects in
hospitals, special paediatric assessment, treatment and rehabilitation centres, private practices
The Pregnancy Outcome Unit of SA Health
The SA Perinatal Autopsy Service
Diagnostic services including laboratories diagnosing cytogenetic, molecular genetic or biochemical
abnormalities and organ imaging departments
This annual report presents information for the years 1986-2016, including birth defects notified up to
March 2017 for children born in 2016 and updates the numbers and rates for the years 2010 to 2015.
Notifications for the cohorts of children born between 1986 and 2011 are now complete. All children in the
2011 cohort reached their fifth birthday by the end of 2016 and notifications of defects received by 31st
March 2017 have been accepted for inclusion. After this date the 2011 cohort is considered complete and
no further notifications are added. Similarly, the 2017 report will record complete numbers for the 2012
birth cohort. For a full listing of publications and presentations utilising data from the SA Birth Defects
Register please refer to our website (http://www.wch.sa.gov.au/services/az/other/phru/birthdefect.html).
For further information regarding the SA Birth Defects Register, Confidentiality Guidelines, Inclusion and
Exclusion Lists, and a copy of the Notification Form, please refer to the Appendices at the end of this
report.

Demographics
Birth Defects in South Australia 2016 9
Demographics
This report includes all notifications of birth defects for births and terminations of pregnancy occurring in
South Australia in the years 1986-2016 and received by 31st March 2017. The percentages and numbers
of births with birth defects for the years 1986-2016 are provided in Table 1 and Figure 1 respectively. As
birth defects continue to be diagnosed and notified to the Register up to the age of 5 years, the percentage
of births with birth defects is higher in cohorts with five completed years of ascertainment than in more
recent cohorts (see Table 1). This is particularly true for defects such as congenital heart disease and
urogenital malformations, which often are not diagnosed at birth.
It is noteworthy that the percentage of total births with birth defects has not changed significantly since the
Register began to collect data in 1986.
Table 1: Birth defects in children born in South Australia, 1986 – 2016
Year of Birth Total Births Cases of Birth Defects Percentage of Births with
Birth Defects
1986-2011 498,524 30,431 6.1
2012 20,666 1,276 6.2
2013 20,263 1,276 6.3
2014 20,749 1,220 5.9
2015 20,154 1,103 5.5
2016 20,070 919 4.6
Total 600,426 36,225 6.0
The numerator used in calculation the percentage is all South Australian births and terminations with birth
defects. These consist of livebirths and stillbirths of at least 400g birthweight or 20 weeks gestation, and
terminations of pregnancies of fetuses with birth defects. The denominator used is the total number of
livebirths and stillbirths only, and excludes terminations of pregnancy before 20 weeks gestation. This
makes our statistics comparable with those of other registers, but slightly overestimates the percentage of
births with defects. This denominator has been selected also because accurate statistics on terminations
may not be available elsewhere (as they are in South Australia), and fetuses from terminations in early
pregnancy may not be examined for birth defects. Spontaneous fetal deaths, where weight is less than
400g and gestation is less than 20 weeks, are not included among the Register cases as accurate
statistics on them are unavailable.
Notifications of children with birth defects who were born outside South Australia in the years 1986-2016
but who currently reside in South Australia are not included in the statistics.
Figure 1: Birth defects in children born in South Australia, 1986-2016

Demographics
Birth Defects in South Australia 2016 10
Residence of Mother
Table 2 shows the distribution of cases by residence of mother at time of birth (see Figure 2). Births to
mothers who reside interstate had the highest prevalence of birth defects mainly due to the referral of high
risk pregnancies from interstate to Adelaide tertiary hospitals. In 2016, the Central Northern region
recorded the highest percentage of cases with birth defects (5.0% of total births), compared with the
lowest percentage (3.2%) in the Yorke and Lower North region. For the period 1986-2016, the Central
Northern region had the highest overall percentage of birth defects (6.4%) and the Eyre region had the
lowest overall percentage (5.0%). Over this period there was significant (2 = 172.4, p<0.0001) variation in
the prevalence of total birth defects between CURB regions. However, there was no significant difference
between CURB regions (2 = 2.3, p=0.13) for sentinel defects which are more reliably identified (Table 7).
This suggests that the variation seen for total birth defects is due to differences in ascertainment between
CURB regions.
Table 2: Cases with birth defects by residence of mother at time of birth, SA 1986-2016
Year of Birth Total
1986– 2011 2012 2013 2014 2015 2016 1986-2016
CURB^ Region No. (%*)
No. (%*)
No. (%*)
No. (%*)
No. (%*)
No. (%*)
No. (%*)
Central Northern 9332 405 389 409 353 327 11215
(6.5) (6.1) (6.1) (6.2) (5.5) (5.0) (6.4)
Central Western 4086 154 183 167 143 117 4850
(6.4) (5.9) (7.0) (6.1) (5.6) (4.5) (6.3)
Central Eastern 4666 164 174 169 180 124 5477
(6.3) (5.6) (5.7) (5.6) (6.0) (4.2) (6.1)
Central Southern 6421 314 288 262 233 203 7721
(5.9) (6.6) (6.3) (5.5) (4.9) (4.4) (5.8)
Yorke & Lower North 773 36 25 31 39 15 919
(5.7) (6.8) (5.1) (6.4) (7.9) (3.2) (5.7)
Murraylands 1323 41 44 36 40 25 1509
(5.7) (5.4) (5.5) (4.8) (5.3) (3.5) (5.6)
South East 1175 46 45 49 38 24 1377
(5.1) (5.6) (5.8) (6.1) (5.3) (3.4) (5.1)
Northern 1614 66 71 53 38 44 1886
(5.2) (6.6) (7.1) (5.2) (4.2) (4.8) (5.2)
Eyre 661 27 29 19 19 16 771
(5.1) (5.6) (6.2) (3.9) (4.2) (3.5) (5.0)
Residence – Interstate** or Unknown
380 23 28 25 20 24 500
(10.8) (14.5) (17.1) (19.2) (14.2) (16.8) (11.7)
Total* 30431 1276 1276 1220 1103 919 36225
(6.1) (6.2) (6.3) (5.9) (5.5) (4.6) (6.0)
* Number of children with birth defects in the region divided by the total number of births in the region x 100
** Usual residence interstate but born in South Australia
^ Committee on Uniform Regional Boundaries (CURB)

Demographics
Birth Defects in South Australia 2016 11
Figure 2: South Australian CURB^ Regions

Demographics
Birth Defects in South Australia 2016 12
Sex of Child
The sex distribution of children born between 1986 and 2016 in South Australia with notified birth defects
is shown in Table 3 and Figure 3. For 1986-2016, 56% of children notified were male and the ratio of
males to females for birth defects was 1.35:1, i.e. 35% more male than female births were notified with a
birth defect. This contrasts with a male to female ratio of 1.06:1 for all births. The percentage of male
births with notified defects for the period 1986-2016 was 6.6%; this was significantly higher (relative risk
(RR) = 1.28 (95% CI 1.25-1.30), p<0.0001), than for female births (5.2%).
There are a number of birth defects that are specific to each sex (eg. undescended testis, hypospadias).
Taking into account these sex-specific defects, there is still a greater prevalence of certain defects in
males, for example pyloric stenosis, short segment Hirschsprung’s disease and congenital talipes
equinovarus.
Table 3: Cases with birth defects by sex of child, SA 1986-2016
Year of Birth Total
1986– 2011 2012 2013 2014 2015 2016 1986-2016
Sex No. (%*)
No. (%*)
No. (%*)
No. (%*)
No. (%*)
No. (%*)
No. (%*)
Male 17282 717 745 658 573 468 20443
(6.7) (6.7) (7.1) (6.2) (5.6) (4.5) (6.6)
Female 12592 541 510 542 413 430 15128
(5.2) (5.4) (5.2) (5.4) (5.2) (4.4) (5.2)
Indeterminate 18 0 1 1 0 2 22
- - - - - - -
Not specified# 539 18 20 19 17 19 632
- - - - - - -
Total 30431 1276 1276 1220 1103 919 36225
(6.1) (6.2) (6.3) (5.9) (5.5) (4.6) (6.0)
* Percentage of births of that category in that year
# These were all terminations of pregnancy
Figure 3: Cases with birth defects by sex of child, SA 1986-2016
male56%
female42%
not specified2%
Demographics
Birth Defects in South Australia 2016 13
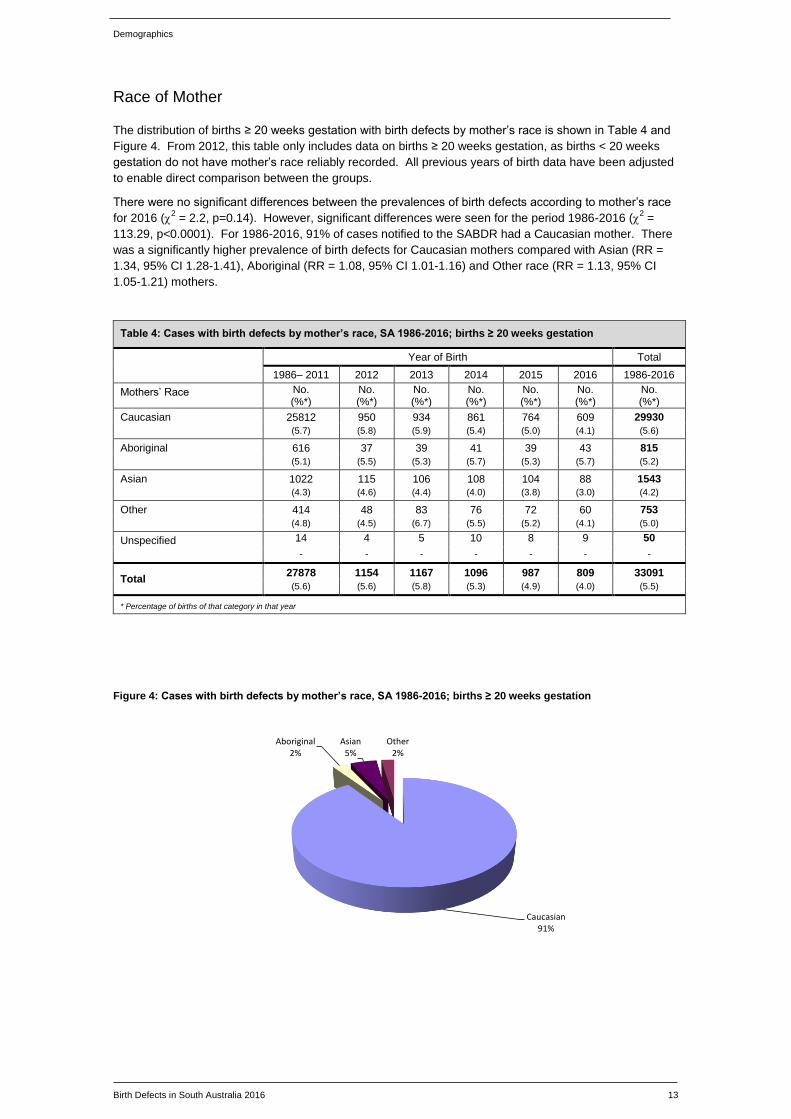
Race of Mother
The distribution of births ≥ 20 weeks gestation with birth defects by mother’s race is shown in Table 4 and
Figure 4. From 2012, this table only includes data on births ≥ 20 weeks gestation, as births < 20 weeks
gestation do not have mother’s race reliably recorded. All previous years of birth data have been adjusted
to enable direct comparison between the groups.
There were no significant differences between the prevalences of birth defects according to mother’s race
for 2016 (2 = 2.2, p=0.14). However, significant differences were seen for the period 1986-2016 (
2 =
113.29, p<0.0001). For 1986-2016, 91% of cases notified to the SABDR had a Caucasian mother. There
was a significantly higher prevalence of birth defects for Caucasian mothers compared with Asian (RR =
1.34, 95% CI 1.28-1.41), Aboriginal (RR = 1.08, 95% CI 1.01-1.16) and Other race (RR = 1.13, 95% CI
1.05-1.21) mothers.
Table 4: Cases with birth defects by mother’s race, SA 1986-2016; births ≥ 20 weeks gestation
Year of Birth Total
1986– 2011 2012 2013 2014 2015 2016 1986-2016
Mothers’ Race No. (%*)
No. (%*)
No. (%*)
No. (%*)
No. (%*)
No. (%*)
No. (%*)
Caucasian 25812 950 934 861 764 609 29930
(5.7) (5.8) (5.9) (5.4) (5.0) (4.1) (5.6)
Aboriginal 616 37 39 41 39 43 815
(5.1) (5.5) (5.3) (5.7) (5.3) (5.7) (5.2)
Asian 1022 115 106 108 104 88 1543
(4.3) (4.6) (4.4) (4.0) (3.8) (3.0) (4.2)
Other 414 48 83 76 72 60 753
(4.8) (4.5) (6.7) (5.5) (5.2) (4.1) (5.0)
Unspecified 14 4 5 10 8 9 50
- - - - - - -
Total 27878 1154 1167 1096 987 809 33091
(5.6) (5.6) (5.8) (5.3) (4.9) (4.0) (5.5)
* Percentage of births of that category in that year
Figure 4: Cases with birth defects by mother’s race, SA 1986-2016; births ≥ 20 weeks gestation
Caucasian91%
Aboriginal2%
Asian5%
Other 2%

Demographics
Birth Defects in South Australia 2016 14
Plurality
The distribution of cases of birth defects by plurality is shown in Table 5 and Figure 5. Although 96% of
cases notified for the 30 year period 1986-2016 were singleton births, the percentage of cases among
multiple births was 8.1%, and was significantly higher (RR = 1.36, CI 1.29-1.43, p<0.0001) than among
singleton births, with 5.9%. Certain birth defects are associated with twin pregnancies, in particular
monozygotic twins. Examples of defects that occur more often in monozygotic twins are sirenomelia,
VATER association, holoprosencephaly and anencephaly.
Table 5: Cases with birth defects by plurality, SA 1986-2016
Year of Birth Total
1986– 2011 2012 2013 2014 2015 2016 1986-2016
Plurality No. (%*)
No. (%*)
No. (%*)
No. (%*)
No. (%*)
No. (%*)
No. (%*)
Single 29205 1223 1201 1161 1060 886 34736
(6.0) (6.1) (6.1) (5.8) (5.4) (4.6) (6.0)
Multiple 1226 53 75 59 43 33 1489
(8.1) (7.1) (11.2) (9.9) (6.5) (5.5) (8.1)
Total 30431 1276 1276 1220 1103 919 36225
(6.1) (6.2) (6.3) (5.9) (5.5) (4.6) (6.0)
* Percentage of births of that category in that year
Figure 5: Cases with birth defects by plurality, SA 1986-2016
Single96%
Multiple4%
Types of birth defects notified
Birth Defects in South Australia 2016 15
Types of birth defects notified
The diagnostic categories used by the Register for coding are those of the British Paediatric Association
(BPA) Classification of Diseases, 1979, a 5-digit system compatible at the 4-digit level with the ninth
revision of the International Classification of Diseases (ICD9). Its Congenital Anomaly codes are those in
the range 74000-75999. The BPA also provides codes outside this range for some disorders which are
included in the Register’s collection. For disorders without a BPA code the Register uses the ICD9
classification.
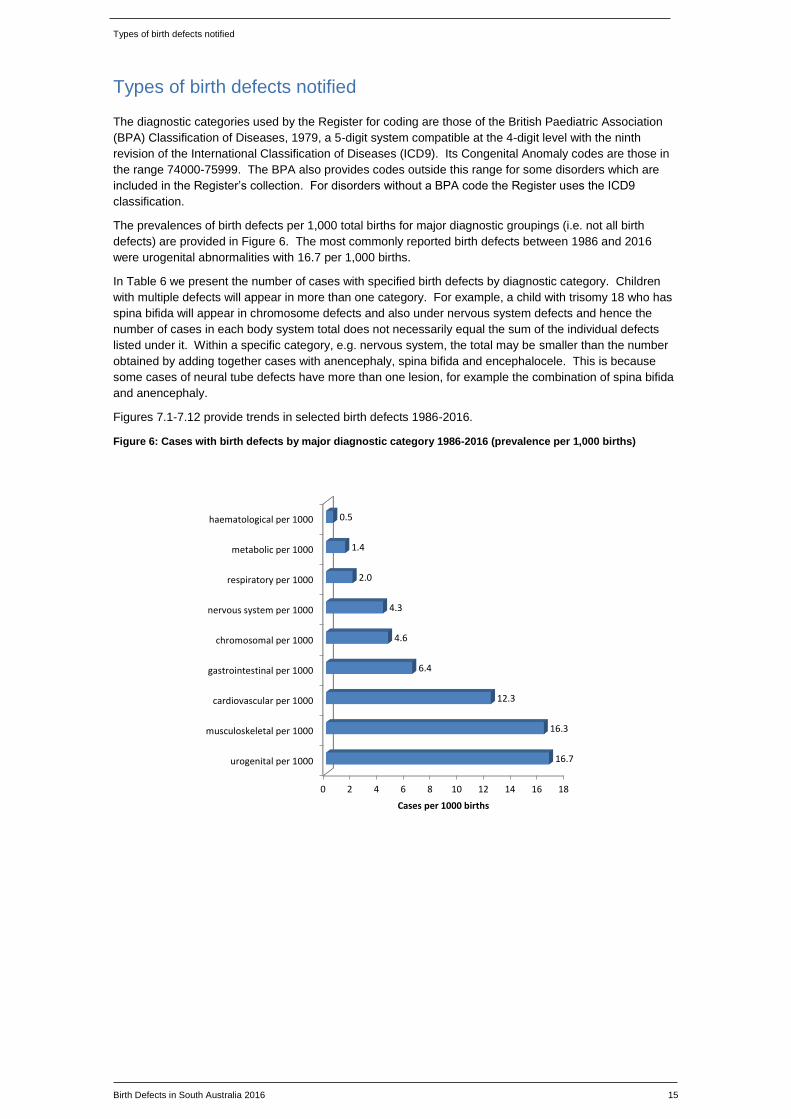
The prevalences of birth defects per 1,000 total births for major diagnostic groupings (i.e. not all birth
defects) are provided in Figure 6. The most commonly reported birth defects between 1986 and 2016
were urogenital abnormalities with 16.7 per 1,000 births.
In Table 6 we present the number of cases with specified birth defects by diagnostic category. Children
with multiple defects will appear in more than one category. For example, a child with trisomy 18 who has
spina bifida will appear in chromosome defects and also under nervous system defects and hence the
number of cases in each body system total does not necessarily equal the sum of the individual defects
listed under it. Within a specific category, e.g. nervous system, the total may be smaller than the number
obtained by adding together cases with anencephaly, spina bifida and encephalocele. This is because
some cases of neural tube defects have more than one lesion, for example the combination of spina bifida
and anencephaly.
Figures 7.1-7.12 provide trends in selected birth defects 1986-2016.
Figure 6: Cases with birth defects by major diagnostic category 1986-2016 (prevalence per 1,000 births)
0 2 4 6 8 10 12 14 16 18
urogenital per 1000
musculoskeletal per 1000
cardiovascular per 1000
gastrointestinal per 1000
chromosomal per 1000
nervous system per 1000
respiratory per 1000
metabolic per 1000
haematological per 1000
16.7
16.3
12.3
6.4
4.6
4.3
2.0
1.4
0.5
Cases per 1000 births

Types of birth defects notified
Birth Defects in South Australia 2016 16
Table 6: Cases with birth defects by major diagnostic category 1986-2016 (prevalence per 1,000 births)
Year of Birth Total
Diagnostic Category (BPA Code)
1986-2011 2012 2013 2014 2015 2016 1986-2016
No. (per 1000*)
No. (per
1000*)
No. (per
1000*)
No. (per
1000*)
No. (per
1000*)
No. (per
1000*) No. per 1000*
Nervous System (74000-74299)
2103 90 90 100 98 76 2557 4.3
(4.2) (4.4) (4.4) (4.8) (4.9) (3.8)
Neural tube defects 804 25 26 24 32 17 928 1.5
Anencephaly 338 14 13 13 14 7 399 0.7
Spina bifida 407 8 9 8 16 9 457 0.8
Encephalocele 71 4 4 4 2 1 86 0.1
Microcephaly 251 7 10 11 11 10 300 0.5
Congenital hydrocephalus
412 16 19 20 20 18 505 0.8
Cardiovascular (74500-74799)
6132 266 272 259 253 216 7398 12.3
(12.3) (12.9) (13.4) (12.5) (12.6) (10.8)
Transposition of great vessels
313 6 12 11 12 13 367 0.6
Tetralogy of Fallot 183 9 5 10 8 13 228 0.4
Ventricular septal defect
3032 123 134 115 126 97 3627 6.0
Atrial septal defect 1288 27 40 36 25 22 1438 2.4
Hypoplastic left heart syndrome
147 7 7 7 8 7 183 0.3
Patent ductus arteriosus
948 48 44 32 37 50 1159 1.9
Coarctation of aorta 296 10 6 14 9 7 342 0.6
Respiratory (74800-74899)
891 42 51 68 69 67 1188 2.0
(1.8) (2.0) (2.5) (3.3) (3.4) (3.3)
Pulmonary hypoplasia/dysplasia
472 18 18 19 19 20 566 0.9
Gastrointestinal (74900-75199)
3247 116 133 138 111 127 3872 6.4
(6.5) (5.6) (6.6) (6.7) (5.5) (6.3)
Cleft palate 485 25 17 19 22 15 583 1.0
Cleft lip 200 4 5 5 8 8 230 0.4
Cleft lip with cleft palate
372 11 11 18 9 17 438 0.7
Tracheo-oesophageal fistula, oesophageal atresia & stenosis
195 5 7 10 10 5 232 0.4
Pyloric stenosis 874 20 24 24 20 18 980 1.6
Rectal/anal atresia & stenosis
267 9 10 6 6 13 311 0.5
Hirschsprung disease
103 4 0 5 3 6 121 0.2
Urogenital (75200-75399)
8667 288 337 283 255 184 10014 16.7
(17.4) (13.9) (16.6) (13.6) (12.7) (9.2)
Undescended testicle
2540 77 88 55 42 13 2815 4.7
Hypospadias 1970 70 73 65 59 34 2271 3.8
Renal agenesis & dysgenesis
293 13 10 11 15 20 362 0.6
Vesico-ureteric reflux
1390 21 30 29 21 18 1509 2.5
* Prevalence per 1,000 total births

Trends in selected birth defects
Birth Defects in South Australia 2016 17
Table 6: Cases with birth defects by major diagnostic category 1986-2016 (prevalence per 1,000 births)
Year of Birth Total
Diagnostic Category (BPA Code)
1986-2011
2012 2013 2014 2015 2016 1986-2016
No. (per
1000*)
No. (per
1000*)
No. (per
1000*)
No. (per
1000*)
No. (per
1000*)
No. (per
1000*) No. per 1000*
Musculoskeletal (75400-75699)
8194 335 325 355 294 273 9776 16.3
(16.4) (16.2) (16.0) (17.1) (14.6) (13.6)
Developmental dysplasia of hip
3429 125 97 114 101 76 3942 6.6
Talipes equinovarus 1118 61 49 50 43 44 1365 2.3
Polydactyly 569 29 44 37 34 27 740 1.2
Syndactyly 371 11 12 12 9 15 430 0.7
Reduction deformities of limbs
414 19 20 17 14 25 509 0.8
Diaphragmatic hernia 195 2 11 7 5 11 231 0.4
Exomphalos 194 2 5 9 8 9 227 0.4
Gastroschisis 128 14 7 15 7 6 177 0.3
Achondroplasia 23 2 2 1 1 1 30 0.0
Osteogenesis imperfecta 66 5 1 3 4 5 84 0.1
Chromosome (75800-75899)
2156 145 123 118 119 125 2786 4.6
(4.3) (7.0) (6.1) (5.7) (5.9) (6.2)
Down syndrome 1018 67 61 60 48 59 1313 2.2
Trisomy 13 92 7 6 7 11 7 130 0.2
Trisomy 18 264 18 9 8 17 20 336 0.6
Turner syndrome 159 10 9 3 5 6 192 0.3
Metabolic (24390-27790)
738 22 36 28 21 16 861 1.4
(1.5) (1.1) (1.8) (1.3) (1.0) (0.8)
Congenital hypothyroidism
186 2 5 12 4 4 213 0.4
Phenylketonuria 38 1 4 1 0 2 46 0.1
Galactosaemia 17 0 0 0 0 0 17 0.0
Albinism 39 2 1 3 2 2 49 0.1
Cystic fibrosis 204 9 5 2 6 4 230 0.4
Other metabolic 251 7 21 10 9 4 302 0.5
Haematological/Immune (28200-28699)
271 6 17 10 9 9 322 0.5
(0.5) (0.3) (0.8) (0.5) (0.4) (0.4)
Haemolytic anaemias 35 1 2 2 3 1 44 0.1
Thalassaemias 43 1 1 3 4 4 56 0.1
Coagulation defects 96 2 8 3 1 1 111 0.2
Other selected
Congenital syphilis syndrome
11 0 0 0 0 0 11 0.0
Congenital rubella syndrome
2 0 0 0 0 0 2 0.0
Fetal alcohol syndrome 15 1 1 0 0 0 17 0.0
Non-immune fetal hydrops
269 9 18 14 12 24 346 0.5
Haemangioma 400 29 40 36 38 33 576 0.8
Lymphangioma 266 6 9 9 10 13 313 0.5
Anotia/Microtia 74 7 3 10 4 4 102 0.2
* Prevalence per 1,000 total births

Trends in selected birth defects
Birth Defects in South Australia 2016 18
Trends in selected birth defects, SA 1986-2016
Figure 7.1: Prevalence of neural tube defects, SA 1986-2016
There was a significant downward trend in the prevalence of all neural tube defects for the period 1986-
2016 (Poisson regression, p<0.0001), and may be due to the increased use of periconceptional folic acid.
However, a slowing of the downward trend occurred in 2009 and 2010 due to an increase in neural tube
defect cases; after investigation*, it was concluded that the increase was likely due to chance. The need
to improve universal health promotion messages regarding periconceptional folic acid supplementation in
pregnancy is recognised.
*Flood L, Sheil W, Nguyen A, Sage L, Scott J. An increase in neural tube defect notifications, South Australia, 2009-2010. Western
Pacific Surveillance and Response 2013; 4(2): 1-10.
Figure 7.2: Prevalence of anencephaly, SA 1986-2016
There was no significant downward trend in the prevalence of anencephaly for the period 1986-2016
(Poisson regression, p=0.077).
All neural tube defects
Year
case
s pe
r 10
00 b
irths
1986 1990 1994 1998 2002 2006 2010 2014 2018
0.0
0.5
1.0
1.5
2.0
2.5
one-year prevalencefive year prevalence2 - 4 year prevalencep (linear trend) << 0.0001
Anencephaly
Year
case
s pe
r 10
00 b
irths
1986 1990 1994 1998 2002 2006 2010 2014 2018
0.0
0.5
1.0
1.5
one-year prevalencefive year prevalence2 - 4 year prevalencep (linear trend) 0.077
Trends in selected birth defects
Birth Defects in South Australia 2016 19
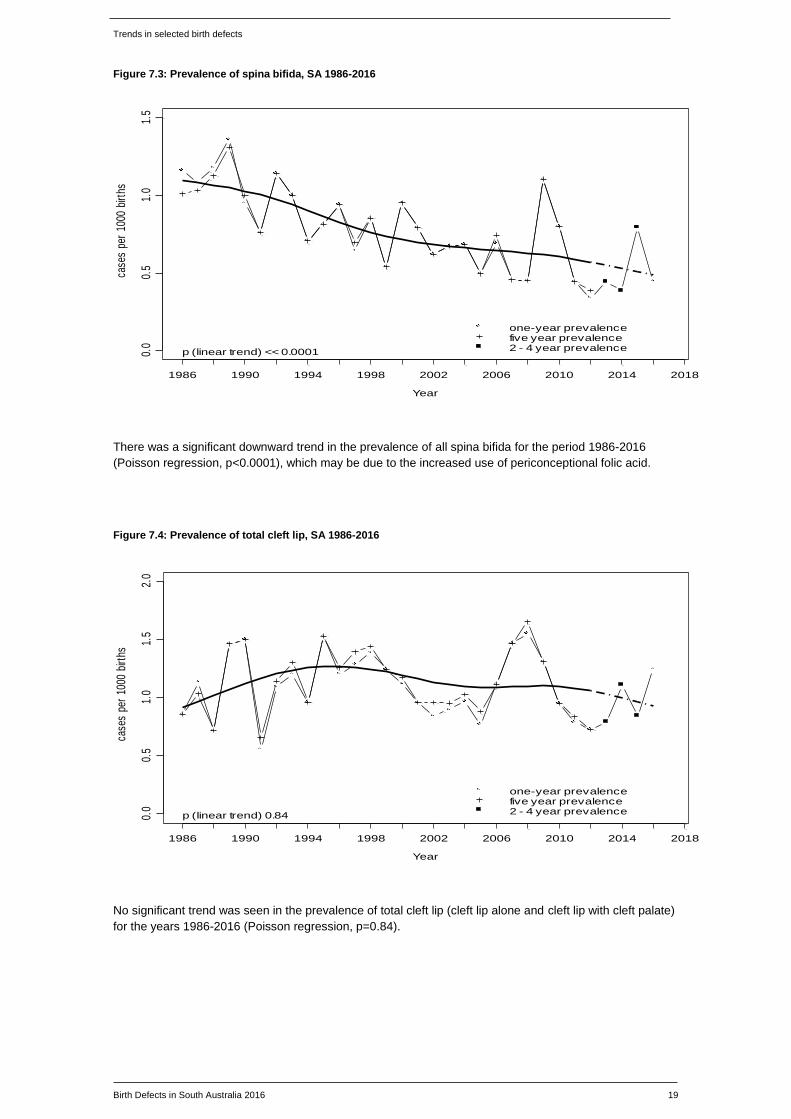
Figure 7.3: Prevalence of spina bifida, SA 1986-2016
There was a significant downward trend in the prevalence of all spina bifida for the period 1986-2016
(Poisson regression, p<0.0001), which may be due to the increased use of periconceptional folic acid.
Figure 7.4: Prevalence of total cleft lip, SA 1986-2016
No significant trend was seen in the prevalence of total cleft lip (cleft lip alone and cleft lip with cleft palate)
for the years 1986-2016 (Poisson regression, p=0.84).
Spina bifida
Year
case
s pe
r 10
00 b
irths
1986 1990 1994 1998 2002 2006 2010 2014 2018
0.0
0.5
1.0
1.5
one-year prevalencefive year prevalence2 - 4 year prevalencep (linear trend) << 0.0001
Total cleft lip
Year
case
s pe
r 10
00 b
irths
1986 1990 1994 1998 2002 2006 2010 2014 2018
0.0
0.5
1.0
1.5
2.0
one-year prevalencefive year prevalence2 - 4 year prevalencep (linear trend) 0.84

Trends in selected birth defects
Birth Defects in South Australia 2016 20
Figure 7.5: Prevalence of tetralogy of Fallot, SA 1986-2016
No significant trend was seen in the prevalence of tetralogy of Fallot for the years 1986-2016 (Poisson
regression, p=0.12).
Figure 7.6: Prevalence of transposition of the great vessels, SA 1986-2016
No significant trend was seen in the prevalence of transposition of the great vessels for the years 1986-
2016 (Poisson regression, p=0.015).
Tetralogy of Fallot
Year
case
s pe
r 10
00 b
irths
1986 1990 1994 1998 2002 2006 2010 2014 2018
0.0
0.2
0.4
0.6
0.8
one-year prevalencefive year prevalence2 - 4 year prevalencep (linear trend) 0.12
Transposition of great vessels
Year
case
s pe
r 10
00 b
irths
1986 1990 1994 1998 2002 2006 2010 2014 2018
0.0
0.5
1.0
1.5
one-year prevalencefive year prevalence2 - 4 year prevalencep (linear trend) 0.015

Trends in selected birth defects
Birth Defects in South Australia 2016 21
Figure 7.7: Prevalence of coarctation of the aorta, SA 1986-2016
No significant trend was seen in the prevalence of coarctation of the aorta for the years 1986-2016
(Poisson regression, p=0.24).
Figure 7.8: Prevalence of developmental dysplasia of the hip, SA 1986-2016
There was a significant downward trend in the prevalence of developmental dysplasia of the hip over the
period 1986-2016 (Poisson regression, p=0.00021), but the prevalence appears to have been relatively
stable from 1995 onwards.
Coarctation of the aorta
Year
case
s pe
r 10
00 b
irths
1986 1990 1994 1998 2002 2006 2010 2014 2018
0.0
0.2
0.4
0.6
0.8
1.0
one-year prevalencefive year prevalence2 - 4 year prevalencep (linear trend) 0.24
Developmental dysplasia of the hip
Year
case
s pe
r 10
00 b
irths
1986 1990 1994 1998 2002 2006 2010 2014 2018
34
56
78
9
one-year prevalencefive year prevalence2 - 4 year prevalence
p (linear trend) 0.00021

Trends in selected birth defects
Birth Defects in South Australia 2016 22
Figure 7.9: Prevalence of hypospadias, SA 1986-2016
There was a significant upward trend in the five year prevalence of hypospadias for the years 1986-2016
(Poisson regression, p=0.00014). From 1995, validation reviews between the SABDR and hospital data
led to improved ascertainment and validation of cases not recorded at birth and undergoing surgery at a
later date. There was no significant trend for the one year prevalence of hypospadias.
Figure 7.10: Prevalence of renal agenesis and dysgenesis, SA 1986-2016
No significant trend was seen in the prevalence of renal agenesis/dysgenesis for the years 1986-2016
(Poisson regression, p=0.82).
Hypospadias
Year
case
s pe
r 10
00 b
irths
1986 1990 1994 1998 2002 2006 2010 2014 2018
01
23
45
one-year prevalencefive year prevalence2 - 4 year prevalencep (linear trend) 0.00014
Renal agenesis dysgenesis
Year
case
s pe
r 10
00 b
irths
1986 1990 1994 1998 2002 2006 2010 2014 2018
0.0
0.2
0.4
0.6
0.8
1.0
one-year prevalencefive year prevalence2 - 4 year prevalencep (linear trend) 0.82

Trends in selected birth defects
Birth Defects in South Australia 2016 23
Figure 7.11: Prevalence of Down syndrome, SA 1986-2016
Over the period 1986-2016, there was a significant increasing trend in the total prevalence of Down
syndrome (Poisson regression, p<0.0001). In the past, this increase has been attributed to increasing
maternal age. However, even after adjustment for maternal age (using Poisson regression with cubic
splines) the prevalence of Down syndrome still increases by 0.81% (95% CI 0.17% to 1.46%) with the
passing of every calendar year. This indicates that other factors, in addition to maternal age, may be
influencing the prevalence of Down syndrome. The risk of a future pregnancy being affected by Down
syndrome is known to be increased for women who have already had a Down syndrome pregnancy*.
Other potential explanations that may contribute to this increase include paternal age, and technological
advances in prenatal screening and diagnosis resulting in earlier case ascertainment prior to potential fetal
demise.
* De Souza E, Halliday J, Chan A, Bower C, Morris J. Recurrence risks for Trisomies 13, 18 and 21. Am J Med Genet
149A: 2716-2722 (2009).
Figure 7.12: Incidence of Down syndrome by maternal age, SA 1986-2016
As demonstrated by this figure, there is an exponential increase in the risk of Down syndrome with
increasing maternal age.
Down syndrome
Year
case
s pe
r 10
00 b
irths
1986 1990 1994 1998 2002 2006 2010 2014 2018
01
23
one-year prevalencefive year prevalence2 - 4 year prevalencep (linear trend) << 0.0001
Incidence of Down Syndrome - SA (1986 - 2016)
maternal age
case
s pe
r 10
00 o
f D
own
Syn
drom
e
15 20 25 30 35 40 45
05
1015
2025

Sentinel defects
Birth Defects in South Australia 2016 24
Sentinel defects
A number of readily identifiable defects have been chosen as ‘sentinel’ defects for monitoring purposes by
the International Clearinghouse for Birth Defects Surveillance and Research. We define ‘sentinel’ as those
defects which are very likely to be obvious at birth. These defects can be considered to be fully
ascertained and therefore a true prevalence rate reported. Figure 8 and Table 7 present sentinel defects
by CURB region for the period 1986-2016. The totals for individual defects may be less than those shown
in Table 6 as births to women who are interstate residents have been excluded from this table. This
tabulation is an important tool for detecting regional and temporal clusters of birth defects. The SABDR
monitors the occurrence of defects over time and by geographical area in this way. The Register
assesses the significance of variations in prevalence by comparing the observed and expected numbers
for each region using the Poisson distribution.
The prevalence of Down syndrome in the Central Eastern Region between 1986 and 2016 was again
significantly greater than in the rest of South Australia (RR = 1.41, 95% CI 1.23-1.62, p<0.001). This was
shown to be related to the older age of mothers in that region. After adjustment for maternal age, no
significant difference was seen (Mantel-Haenszel RR = 1.01, 95% CI 0.88-1.16, p=0.94).
The prevalence of hypospadias in the Central Northern Region between 1986 and 2016 was found to be
significantly greater than in the rest of South Australia (RR = 1.13, 95% CI 1.01-1.27, P<0.01), however
there was no significant increase for the 2016 birth year. Further, when analysis was confined to the years
1995-2016, no significant difference was seen. These variations in prevalence are likely attributable to
improved administrative processes and practices from 1995, when reviews between the SABDR and
hospital data led to improved ascertainment and validation of cases not recorded at birth and undergoing
surgery at a later date.
There were no other significant regional increases in prevalence (p<0.01) between 1986 and 2016.
Figure 8: Prevalence of sentinel defects, SA 1986-2016
*Cleft lip with or without cleft palate
0 1 2 3 4 5
Anencephaly
Spina bifida
Encephalocele
Hydrocephalus
Cleft palate
Total cleft lip*
Tracheo-oesophageal fistula, atresia and stenosis
Anorectal atresia and stenosis
Hypospadias
Renal agenesis and dysgenesis
Limb reduction defects
Diaphragmatic hernia
Exomphalos
Gastroschisis
Transposition of great vessels
Hypoplastic left heart
Down syndrome
Anotia and microtia
0.65
0.73
0.14
0.82
0.96
1.09
0.38
0.50
3.78
0.60
0.83
0.37
0.36
0.25
0.60
0.29
2.17
0.16
Prevalence per 1000 total births

Sentinel defects
Birth Defects in South Australia 2016 25
Table 7: Cases of sentinel defects by CURB region, SA 1986-2016
CURB Region
% State Births Central North
Central West
Central East
Central South
Yorke &
Low Nth
Murray Lands
South East
North Eyre Total
29.5% 13.0% 14.9% 22.3% 2.7% 4.5% 4.5% 6.0% 2.6% 100% No. (per 1000*)
No. (per 1000*)
No. (per 1000*)
No. (per 1000*)
No. (per 1000*)
No. (per 1000*)
No. (per 1000*)
No. (per 1000*)
No. (per 1000*)
No. (per 1000*)
Anencephaly 101 65 53 84 12 17 14 28 13 387
(0.57) (0.82) (0.59) (0.63) (0.75) (0.63) (0.52) (0.78) (0.85) (0.65)
Spina bifida 122 69 64 89 9 22 20 30 13 438
(0.69) (0.89) (0.72) (0.67) (0.56) (0.81) (0.74) (0.83) (0.85) (0.73)
Encephalocele 29 10 14 15 3 1 4 4 2 82
(0.17) (0.13) (0.16) (0.11) (0.19) (0.04) (0.15) (0.11) (0.13) (0.14)
Hydrocephalus 145 65 72 121 11 20 16 28 8 486
(0.83) (0.84) (0.81) (0.91) (0.69) (0.74) (0.59) (0.78) (0.52) (0.82)
Cleft palate 186 75 75 119 11 31 29 30 19 575
(1.06) (0.97) (0.84) (0.90) (0.69) (1.14) (1.08) (0.83) (1.24) (0.96)
Total Cleft lip# 206 61 90 144 22 36 26 44 18 647
(1.17) (0.79) (1.01) (1.09) (1.37) (1.33) (0.96) (1.22) (1.18) (1.09)
Tracheo-oesophageal fistula, atresia & stenosis
68 30 46 45 5 10 5 15 4 228
(0.39) (0.39) (0.52) (0.34) (0.31) (0.37) (0.19) (0.42) (0.26) (0.38)
Ano-rectal atresia & stenosis
91 40 49 67 7 11 11 16 7 299
(0.52) (0.52) (0.55) (0.50) (0.44) (0.41) (0.41) (0.44) (0.46) (0.50)
Hypospadias 728 286 304 463 64 110 98 133 67 2253
(4.14) (3.70) (3.41) (3.49) (4.00) (4.06) (3.63) (3.69) (4.38) (3.78)
Renal agenesis & dysgenesis
96 45 58 78 12 17 12 29 8 355
(0.55) (0.58) (0.65) (0.59) (0.75) (0.63) (0.45) (0.81) (0.52) (0.60)
Limb reduction defects
161 58 68 91 16 32 21 35 15 497
(0.92) (0.75) (0.76) (0.69) (1.00) (1.18) (0.78) (0.97) (0.98) (0.83)
Diaphragmatic hernia
55 27 36 44 8 13 13 20 6 222
(0.31) (0.35) (0.40) (0.33) (0.50) (0.48) (0.48) (0.56) (0.39) (0.37)
Exomphalos 57 26 32 49 7 10 9 20 6 216
(0.32) (0.34) (0.36) (0.37) (0.44) (0.37) (0.33) (0.56) (0.39) (0.37)
Gastroschisis 55 20 12 32 2 10 4 15 2 152
(0.31) (0.26) (0.13) (0.24) (0.12) (0.37) (0.15) (0.42) (0.13) (0.25)
Transposition of great vessels
99 50 47 101 11 17 12 16 7 360
(0.56) (0.65) (0.53) (0.76) (0.69) (0.63) (0.45) (0.44) (0.46) (0.60)
Hypoplastic left heart
47 25 27 47 4 4 9 8 4 175
(0.27) (0.32) (0.30) (0.35) (0.25) (0.15) (0.33) (0.22) (0.26) (0.29)
Down syndrome 325 185 258 322 39 51 49 44 20 1293
(1.85) (2.39) (2.90) (2.43) (2.43) (1.88) (1.82) (1.22) (1.31) (2.17)
Anotia & Microtia 27 17 14 23 4 2 4 4 3 98
(0.15) (0.22) (0.16) (0.17) (0.25) (0.07) (0.15) (0.11) (0.20) (0.16)
Total 2420 1075 1219 1794 220 383 333 474 201 8119
(13.77) (13.90) (13.68) (13.52) (13.73) (14.14) (12.35) (13.17) (13.14) (13.62)
* Prevalence per 1,000 total births in region # Cleft lip with or without cleft palate

Deaths associated with birth defects
Birth Defects in South Australia 2016 26
Deaths associated with birth defects
In Table 8, the number of deaths associated with birth defects is listed by death category. Note that the
birth defect is not necessarily the cause of death. In 2016, spontaneous stillbirths with birth defects
represented 15.4% of all spontaneous stillbirths in South Australia and neonatal deaths with birth defects
represented 33.3% of all neonatal deaths in the same period.
Overall, for the period 1986-2016, spontaneous stillbirths with birth defects represented 13.7% of all
spontaneous stillbirths, whilst neonatal deaths with birth defects represented 31.4% of all neonatal deaths.
Figure 9 shows deaths associated with birth defects for the years 1986-2016 by category of death.
The different death categories are mutually exclusive. For example, the stillbirth category does not include
terminations of pregnancy ≥ 20 weeks gestation.
In the category “termination of pregnancy < 20 weeks gestation”, the Register distinguishes between first
and second trimester diagnoses. Some notifications specify whether testing has been by chorionic villus
sampling or amniocentesis. Otherwise, classification into these two groups is based on gestation. At a
gestation of < 14 weeks, diagnosis is assumed to be via chorionic villus sampling or ultrasound. At a
gestation of ≥ 14 weeks, diagnosis is assumed to be via amniocentesis or ultrasound.
Figure 9: Deaths associated with birth defects by death category, SA 1986-2016
Post Neonatal Deaths5%
Neonatal Deaths11%
Stillbirths ≥ 20 weeks11%
Terminations of pregnancy < 20 weeks
51%
Terminations of pregnancy ≥ 20 weeks
22%

Deaths associated with birth defects
Birth Defects in South Australia 2016 27
Table 8: Deaths associated with birth defects, SA 1986-2016
Year of Birth Total
1986– 2011 2012 2013 2014 2015 2016 1986-2016
Death category No. (%*)
No. (%*)
No. (%*)
No. (%*)
No. (%*)
No. (%*)
No. (%*)
Post Neonatal Death (death of a liveborn infant between 28 days of age and the first birthday)
243 3 8 5 9 7 275
(6.0) (1.4) (4.0) (2.3) (4.1) (3.4) (5.4)
Neonatal Death (death of a liveborn infant before 28 days of age)
506 13 14 16 11 13 573
(12.5) (6.1) (7.0) (7.2) (5.0) (6.4) (11.2)
Stillbirth (spontaneous fetal death ≥ 20 weeks gestation)
438 20 21 24 31 21 555
(10.8) (9.4) (10.4) (10.8) (14.2) (10.3) (10.8)
Termination of Pregnancy (≥ 20 weeks gestation)
859 55 50 54 52 56 1126
(21.2) (25.9) (24.9) (24.3) (23.7) (27.5) (22.0)
Termination of Pregnancy (< 20 weeks gestation)
Diagnosis by chorionic villus sampling and/or ultrasound in first trimester
462 32 30 33 39 43 639
(11.4) (15.1) (14.9) (14.9) (17.8) (21.1) (12.5)
Diagnosis by amniocentesis, cordocentesis and/or ultrasound after first trimester
1550 89 78 90 77 64 1948
(38.2) (42.0) (38.8) (40.5) (35.2) (31.4) (38.1)
All Termination of Pregnancy (any gestation)
2871 176 158 177 168 163 3713
(70.7) (83.0) (78.6) (79.7) (76.7) (79.9) (72.6)
Total 4058 212 201 222 219 204 5116
* Percentage of total deaths associated with birth defects in that year

Sources of notification and Birth defects detected / notified after discharge from the birth hospital
Birth Defects in South Australia 2016 28
Sources of notification
The sources of notification for cases born in 1986-2016 are provided in Figure 10. As outlined earlier,
each case may be notified by more than one source and considerable checking is required by the Register
to validate the information.
Notifications from the Pregnancy Outcome Unit are obtained from all obstetric units as well as homebirth
midwives in South Australia.
Figure 10: Sources of notification, SA 1986-2016: Total notifications received*
*Each case may have multiple notifications
Birth defects detected/notified after discharge from the birth hospital
Table 9 and Figure 11 use diagnostic categories to show the number and proportion of cases of birth
defects in 1986-2016 which were detected and notified after discharge from the birth hospital. Over 50%
of cardiovascular, urogenital, haematological/immune and metabolic defects were notified after discharge
from the birth hospital.
The value of the Register in collecting later diagnosed defects is clearly illustrated by the proportions of
cases in these latter categories, especially for earlier birth cohorts where collection has been of longer
duration. The use of the Integrated South Australian Activity Collection (ISAAC), which is an admitted
patient morbidity data collection, largely contributes to the validation of cases by SABDR staff, as shown in
Figure 10.
Examples of birth defects that are commonly notified after discharge from the birth hospital are ventricular
septal defects, vesico-ureteric reflux, craniosynostosis and pyloric stenosis.
SABDR verification of notifications
52%
Pregnancy Outcome Unit34%
Perinatal Autopsy4%
Other Sources10%

Sources of notification and Birth defects detected / notified after discharge from the birth hospital
Birth Defects in South Australia 2016 29
Table 9: Cases with birth defects notified after discharge from the birth hospital by major diagnostic category,
SA 1986-2016
Year of Birth Total
1986– 2011 2012 2013 2014 2015 2016 1986-2016
Diagnostic category No. (%*)
No. (%*)
No. (%*)
No. (%*)
No. (%*)
No. (%*)
No. (%*)
Nervous system 662 32 24 19 20 12 771
(31.5) (35.6) (26.7) (19.0) (22.4) (15.8) (30.2)
Cardiovascular 3251 118 128 102 105 79 3783
(53.0) (44.4) (47.1) (39.4) (41.5) (36.6) (51.1)
Respiratory 159 9 13 27 19 7 234
(17.8) (21.4) (25.5) (39.7) (27.5) (10.4) (19.7)
Gastrointestinal 1297 39 40 46 30 33 1485
(39.9) (33.6) (30.1) (33.3) (27.0) (26.0) (38.4)
Urogenital 5207 143 157 132 115 42 5796
(60.1) (49.7) (46.6) (46.6) (45.1) (22.8) (57.9)
Musculoskeletal 2612 130 116 115 116 68 3157
(31.9) (38.8) (35.7) (32.4) (39.5) (24.9) (32.3)
Chromosomal 237 12 13 6 14 13 295
(11.0) (8.3) (10.6) (5.1) (11.8) (10.4) (10.6)
Metabolic 483 12 20 10 9 8 542
(65.4) (54.5) (55.6) (35.7) (42.9) (50.0) (63.0)
Haematological/Immune disorders
173 4 10 5 4 3 199
(63.8) (66.7) (58.8) (50.0) (44.4) (33.3) (61.8)
* Percentage of total cases per category, per year
Figure 11: Percentage of cases with birth defects notified after discharge from the birth hospital by diagnostic
category, SA 1986-2016
0 10 20 30 40 50 60 70 80 90 100
Metabolic %
Haematological/immune disorders %
Urogenital %
Cardiovascular %
Gastrointestinal %
Musculoskeletal %
Nervous system %
Respiratory %
Chromosomal %
63.0
61.8
57.9
51.1
38.4
32.3
30.2
19.7
10.6
Percentage

Prenatal screening for congenital anomalies
Birth Defects in South Australia 2016 30
Prenatal screening for congenital anomalies
Reports of Prenatal screening for congenital anomalies are no longer being published as a separate report. Instead, key tables and figures relating to screening and diagnosis in pregnancy, neural tube defects and Down syndrome are presented on the following pages.
Trends in chorionic villus sampling and amniocentesis
Since 1986, the percentage of all women undertaking prenatal diagnostic chorionic villous sampling (CVS) or amniocentesis peaked at 12% in 1996 (Figure 12). In 2016, this figure has dropped to only 2.5% of women who gave birth (Table 10). A contributing factor to the fall in recent years has been a decrease in the proportion of women 35 years and older using CVS and amniocentesis, following the introduction of first trimester Down syndrome screening, advances in ultrasound technology, and more recently, the introduction of non-invasive prenatal testing.
Figure 12: Percentage of chorionic villus sampling and amniocentesis by year for all women: all indications,
1986-2016
Table 10: Prenatal diagnosis by technique
Year CVS Amniocentesis Total
Percentage of women
who gave birth
n % total n % total n %
1986-1990 747 13.4 4810 86.6 5557 5.7
1991-1995 1412 16.8 7012 83.2 8424 8.6
1996-2000 995 10.0 8908 90.0 9903 10.9
2001-2005 842 11.0 6790 89.0 7632 8.7
2006-2010 1160 20.1 4604 79.9 5764 5.9
2011-2013 865 23.9 2757 76.1 3622 6.0
2014 185 24.7 565 75.3 750 3.7
2015 153 25.9 437 74.1 590 3.0
2016 159 31.8 341 68.2 500 2.5
0.0
2.0
4.0
6.0
8.0
10.0
12.0
14.0
1986 1988 1990 1992 1994 1996 1998 2000 2002 2004 2006 2008 2010 2012 2014 2016
Perc
enta
ge o
f w
om
en w
ho g
ave b
irth
Year
Total
Amniocentesis
CVS

Prenatal screening for congenital anomalies
Birth Defects in South Australia 2016 31
Although there has been a decrease in the number of women undergoing invasive prenatal testing, Table 11 and Figure 13 demonstrate that for those that do have this testing, more of them are aged 35 and over.
Table 11: Chorionic villus sampling and amniocentesis: Utilisation by maternal age, 2014-2016
Age* CVS Amniocentesis Total No. of women who gave
birth Percentage
^
<20 3 15 18 1663 1.1
20-24 29 121 150 7809 1.9
25-29 97 235 332 17157 1.9
30-34 152 412 564 20943 2.7
35-39 142 383 525 10189 5.2
40-44 66 160 226 2108 10.7
45+ 8 17 25 162 15.4
Total 497 1343 1840 60031 3.1
*Age in years at expected delivery date; ^Percentage of women who gave birth in that age range
Figure 13: Chorionic villus sampling and amniocentesis: Utilisation by maternal age, 2014-2016
0.0
2.0
4.0
6.0
8.0
10.0
12.0
< 20 20 – 24 25 – 29 30 – 34 35 – 39 40 – 44 45+
Per
cen
tage
of
wo
men
wh
o g
ave
bir
th
Mother's age in years at expected delivery date
Amniocentesis
CVS

Prenatal screening for congenital anomalies
Birth Defects in South Australia 2016 32
Screening for Down syndrome
There are both screening and diagnostic tests for Down syndrome during pregnancy. The screening tests
include nuchal translucency (NT) screening, 1st trimester maternal serum screening (MSS), and the most
commonly used 1st trimester test, combined NT and 1
st trimester MSS. Second trimester MSS is also
available if 1st trimester screening has not been performed. Integrated screening is also offered for
patients who have had both 1st and 2
nd trimester screening. More recently, non-invasive prenatal testing
has become available in South Australia. This screening test involves taking a sample of blood from the
mother as early as 10 weeks’ gestation and testing millions of short fragments of DNA, some of which will
have come from the placenta.
Diagnostic tests are invasive and carry a small risk to the pregnancy; they are CVS performed in the 1st
trimester, and amniocentesis performed in the 2nd
trimester. They are generally performed after a high risk
screen. Patients will choose the most appropriate test for them after counselling. Some choose to
proceed to diagnostic testing without screening tests.
Pregnancies are screened in the 1st trimester by the combination of nuchal translucency screening and
maternal serum screening (free βHCG and PAPP-A). Software developed by SAMSAS or the Fetal
Medicine Foundation (FMF) is used to estimate the risk for each pregnancy, based on blood analyte and
nuchal translucency results and maternal age. Pregnancies are screened in the 2nd
trimester by MSS.
NT thickness for each fetus in multiple pregnancies parallels that of singleton pregnancies. For dichorionic
twins, a Down syndrome risk for each fetus is issued using the combination of NT thickness and maternal
age. For monochorionic twins, who should be genetically identical, a single risk assessment is reported.
These twins will have an identical maternal age-related Down syndrome risk, but may show different NT
thickness; the greater risk is reported for counselling purposes. A 75% detection rate of affected multiple
pregnancies is achievable according to published data using 1:250 as the cut-off. The use of serum
markers for multiple pregnancies greater than twins is currently not offered in SA but marker levels are
measured for future studies to assess their possible utility.
Tables 12 and 13 show data for cases of Down syndrome born or terminated in 2014, 2015 or 2016,
irrespective of when they were eligible for antenatal screening. 96.2% of the 157 cases that underwent
some form of pregnancy screening were detected during pregnancy.
Table 12: Down syndrome, SA 2014-2016: Cases detected / Not detected
1. Cases detected: Pregnancies screened (by screening method n=151)*
First trimester screening (nuchal translucency plus MSS+) 107
Second trimester screening (MSS+) 10
CVS (without prior screening) 2
Amniocentesis (without prior screening) 0
Ultrasound 5
Non-invasive prenatal testing** 27
2. Not detected prenatally (n=16)
First trimester screening (nuchal translucency plus MSS+) 6
Second trimester screening (MSS+) 0
Integrated screening (first and second trimester screening markers) 0
Not screened (diagnosed after birth) 10
Total 167
+MSS = maternal serum screening;
**includes cases for which other screening methods such as 1st trimester screening were also used

Prenatal screening for congenital anomalies
Birth Defects in South Australia 2016 33
Table 13: Down syndrome, SA 2014-2016: Outcome of cases
Livebirth 41
Stillbirth 2
Termination of pregnancy 124
Total 167
Table 14 presents SA data (1986-2016) for the risk that a woman of a given age will give birth to a baby
with Down syndrome. As illustrated in the table below, this data is comparable with published international
data. Variations seen within and between the two datasets may reflect a number of factors: the relatively
small number of women in different age groups; the approximate number of births recorded (SA: 599,358
vs International: 6,000,000); and the data collection periods (SA: 1986-2016 vs International: 1990-1998).
Table 14: Risk of Down syndrome by maternal age, SA 1986-2016
Mother’s age at delivery South Australia International*
16 1:2475 1:2013
17 1:2667 1:1599
18 1:1215 1:1789
19 1:1724 1:1440
20 1:2445 1:1441
21 1:1698 1:1409
22 1:1012 1:1465
23 1:1183 1:1346
24 1:1309 1:1396
25 1:1248 1:1383
26 1:1163 1:1187
27 1:1169 1:1235
28 1:1049 1:1147
29 1:1236 1:1002
30 1:828 1:959
31 1:686 1:837
32 1:575 1:702
33 1:426 1:589
34 1:330 1:430
35 1:259 1:338
36 1:199 1:259
37 1:223 1:201
38 1:122 1:162
39 1:120 1:113
40 1:64 1:84
41 1:58 1:69
42 1:46 1:52
43 1:38 1:37
44 1:31 1:38
45+ 1:40 1:30
*Data obtained from:
Morris JK, Mutton DE and Alberman E. Revised estimates of the maternal age specific live birth prevalence of Down’s syndrome. Journal of Medical Screening 2002; 9: 2 (for maternal ages 16-44)
Morris JK, De Vigan C, Mutton DE and Alberman E. Risk of a Down syndrome live birth in women 45 years of age and older. Prenatal Diagnosis 2005; 25: 275-278 (for maternal ages 45 and greater)

Screening for neural tube defects
Birth Defects in South Australia 2016 34
Screening for neural tube defects
Neural tube defects (NTDs) are a group of congenital conditions, including anencephaly, spina bifida and
encephalocele. In normal embryo development, the neural tube closes by the end of the fourth week after
conception and develops into the central nervous system (brain and spinal cord). When any part of the
neural tube fails to close, a neural tube defect occurs.
95.9% of cases neural tube defects were detected prenatally (Table 15), by screening for maternal serum
alpha-fetoprotein or ultrasound, or both.
Table 15: Neural tube defects, SA 2014-2016: Cases detected / Not detected
Method of detection Anencephaly Spina bifida Encephalocele Total
1. AFP screen abnormal, as first
indication of neural tube defect 0 2 0 2
2. Ultrasound abnormal, as first
indication of neural tube defect
(a) No serum AFP 3 22 6 31
(b) Serum AFP normal 0 2 0 2
(c) Too early for AFP 31 3 1 35
3. Not detected on AFP and/or
ultrasound screening 0 3 0 3
4. No screening 0 0 0 0
Total#
34 32 7 73
AFP = alpha-fetoprotein; #Neural tube defects detected as a result of maternal serum AFP and/or ultrasound
screening or elective testing because of previous affected child, or from examination of child at delivery.
Table 16: Neural tube defects, SA 2014-2016: Outcome of cases
Outcome Anencephaly Spina bifida Encephalocele Total
Livebirth 0 7 2 9
Stillbirth 0 0 0 0
Termination of pregnancy 34 25 5 64
Total# 34 32 7 73
#Neural tube defects detected as a result of maternal serum AFP and/or ultrasound screening or elective testing because of previous affected child, or from examination of child at delivery

Appendix 1
Birth Defects in South Australia 2016 35
Appendix 1: Background information on the SA Birth Defects
Register
1. Aims
The South Australian Birth Defects Register aims to provide complete, accurate and up-to-date information
for the following purposes:
Establishing local prevalence rates for birth defects
Monitoring the occurrence of defects over time and by geographical area to allow investigation of
suspected teratogens
Increasing community knowledge about birth defects through education and by acting as a source of
information
Utilisation of local prevalence rates to plan health care facilities
Epidemiological studies on the causation of birth defects
As an accurate diagnostic index for clinical research
2. Sources of notification
Cases notified to the Register include those with birth defects detected in a variety of circumstances:
Pregnancies terminated because of a diagnosis of a birth defect in the fetus
Late fetal deaths (stillbirths)
Newborn babies
Children diagnosed after the neonatal period and prior to their fifth birthday
The sources of notification include:
Doctors and other health professionals involved with the care of children with birth defects in hospitals,
special paediatric assessment, treatment and rehabilitation centres and private practices
The Pregnancy Outcome Statistics Unit of SA Health
The State Perinatal Autopsy Service and other pathology services
Diagnostic services including laboratories diagnosing cytogenetic or biochemical abnormalities, and
organ imaging departments.
While notifications of defects detected prenatally are made by doctors to the Pregnancy Outcome
Statistics Unit, it is recognised that many defects, for example some congenital heart defects or
malformations of the urinary tract, may not be detected at the time of birth. Moreover, diagnoses made in
the neonatal period may change with time. The Register, by extending the period of time for receiving
notifications, and receiving them from multiple sources, achieves more complete ascertainment of birth
defects in South Australian children (the notification form is included in Appendix 3).
3. Definition of a birth defect
A birth defect is defined within the Register as any abnormality, structural or functional, identified up to five
years of age, provided that the condition had its origin before birth. Thus, structural (eg. spina bifida),
chromosomal (eg. Down syndrome) and biochemical (eg. phenylketonuria) defects are included. For
Register purposes, single gene defects, eg Neurofibromatosis, cystic fibrosis and muscular dystrophy, are
also considered to be birth defects, although clinical manifestations may not appear until well after birth,
and some may not cause malformations. Most minor malformations are excluded unless they are
disfiguring, require treatment, or accompany another defect. (A list of inclusions and exclusions is
provided in Appendix 4).
4. Ascertainment and accuracy of diagnoses
Ascertainment of birth defects will be incomplete in the first few years of life of each birth cohort. Data
collection to five years of age, the use of multiple notification sources, and confirmation of diagnoses by
clinicians and pathologists increases the accuracy of final diagnoses, and with it the value of the Register.
5. Confidentiality of data
The Register has detailed and comprehensive confidentiality guidelines (Appendix 2). The guidelines
ensure the confidentiality of the Register’s data, while allowing research to be carried out in accordance
with the National Health and Medical Research Council Guidelines for Epidemiological Research.
Confidentiality of Register data is overseen by the SABDR Advisory Committee. This Committee reviews
operations of the Register and comments on research proposals involving Register data.

Appendix 2
Birth Defects in South Australia 2016 36
Appendix 2: Confidentiality guidelines
The South Australian Birth Defects Register receives notifications of children with birth defects under the
provisions of Part 7 of the South Australian Health Care Act, 2008. Although notification does not require
parental consent, provisions are made to inform public and parents about the Register. Part 7 requires the
Register to maintain the confidentiality of notified information, whilst allowing the release of data to certain
persons for specified purposes. The Register has developed guidelines to enable the confidential
management of personal information in accordance with the provisions of Part 7. Since September 1999,
notification of children with birth defects identified later, ie after discharge from the hospital of birth but
before the child’s fifth birthday, has been required under legislation (South Australian Health Care
Regulations, 2008). This notification is required to be made to the Pregnancy Outcome Statistics Unit of
SA Health, which also receives notification of birth defects detected at birth under the same legislation.
The Pregnancy Outcome Statistics Unit has asked the SA Birth Defects Register to assist it in the
collection of late notifications of children with birth defects. The historical data collected under the South
Australian Health Care Act continue to be subject to the privacy provisions of that Act.
Purpose of confidentiality guidelines
The purpose of confidentiality guidelines is:
To protect the privacy of children and women notified to the Register and the confidentiality of the
information received;
To ensure confidentiality by documenting procedures for managing personal information in a
confidential manner;
To ensure a balance between individual privacy and the confidentiality of information held by the
Register, and the public benefit arising from knowledge of the frequency, cause, prevention and
treatment of birth defects through the use of the Register;
To ensure that the Register data are of the best quality possible. Data quality is dependent on the use
of identified personal information in a confidential manner in accordance with these guidelines;
To ensure that the Register retains the support of notifying health professionals by managing the
information they notify in a confidential manner;
To facilitate the best possible use of Register data for the benefit of the community and promotion of
best practice medicine.
Responsibility for confidentiality
Responsibility for the confidentiality of the Birth Defects Register’s data lies with the Head, Paediatric
Rehabilitation Unit and ultimately with WCH Governing Board through the hospital’s line management
structure. The SA Birth Defects Advisory Committee advises the Register on the preservation of
confidentiality of data collected by the Register as required. Membership of the Advisory Committee is:
Dr James Rice, Paediatric Rehabilitation Specialist
Prof Chris Barnett, Clinical Geneticist
Dr Peter Muller, Maternal Fetal Medicine Specialist
Dr Geoffrey Martin, General Practitioner
Dr Catherine Gibson, SA Birth Defects Register
Ms Heather Scott, SA Birth Defects Register
Ms Jennifer Hernandez, SA Birth Defects Register
Ethical principles governing research conducted by the Register
The Register uses the National Health and Medical Research Council’s National Statement on Ethical
Conduct in Research Involving Humans when considering research proposals.
Principles and procedures for ensuring confidentiality while managing personal information
1. Release of Information
1.1. Routine reports
All routine reports from the Register, such as the Annual Report, are in statistical form without the
identification of individual patients, doctors or hospitals. Unnamed statistical information that may be
identifiable to particular recipients is not released.
1.2. Non-routine statistical reports
Ad hoc requests for grouped statistical information on birth defects will, in general, be provided freely.
Information which may be of concern to the public will be released at the discretion of the SA Birth Defects

Appendix 2
Birth Defects in South Australia 2016 37
Register Advisory Committee. Unnamed statistical information that may be identifiable to particular
recipients is not released to the person or agency making the request.
1.3. Release of identifying data
No information about identified individuals is provided to non-Register staff unless that person was the
original notifier or that person is assisting the Register in its work.
1.3.1. Release of identifying data for purposes other than research
The Register does not provide personal information for individual patient management, insurance, sick
fund, child disability allowance or other administrative purposes. The Health Care Act, 2008, protects staff
from any legal obligation to divulge information.
The Register does not provide any information directly to parents or children about notified birth defects.
The parent or child is referred to their doctor as information provided by their doctor is more clinically
relevant, up to date, clinically accurate and accompanied by appropriate counselling. Because the
information collected by the Register was not given by the family in the first instance, the Register would
harm the doctor-patient relationship by divulging information gained from medical notes without
consultation with that doctor. In some circumstances, notified information may be provided to the doctor
for release to parents and children as part of the broader information available to the doctor, and with
relevant counselling.
Identifying data will not be released for clinical audit or another clinical purpose unless the clinician or
agency requiring the information was the original source of all cases required for that purpose.
1.3.2. Release of identifying information for research purposes
No information about identified individuals is provided to people for research projects unless that person
was the original notifier or that person is assisting the Register in its work. The following section provides
guidelines for facilitating research with Register data while maintaining the Register’s ethical and legal
obligations for confidentiality.
2. Research projects
The Register encourages and facilitates research, using personal information where necessary, and in
accordance with these guidelines. In particular, access to personal information is provided for research
projects that promote the understanding, prevention or alleviation of health problems associated with
pregnancy, delivery, infancy and birth defects and result in no harm to notified individuals in any way.
2.1. Research conducted by Register staff
Research projects performed by Register staff or other people/agencies authorised under The Health Care
Act, 2008, are considered internal research projects. The Register defines “research” as a project
designed to generate new knowledge, with the aim of publishing the results in a peer reviewed journal.
Approval from an appropriate Health Research Ethics Committee is required for internal research projects,
in compliance with the NHMRC Statement on the Ethical Conduct in Research involving Humans, 2007
(Updated 2018).
The Register conducts internal research projects in accordance with the section 2.4, “Procedures for
ensuring confidentiality while conducting research projects”.
2.2. Co-opted researchers
From time to time the Register co-opts researchers to perform a research project in collaboration with its
staff. The Register retains control over the conduct of the research and the output from the research
group.
Access to personal information on the Register is granted to co-opted outside people/agencies for
epidemiological or other research purposes only if:
It is considered that the proposed use of the data would promote the understanding, prevention or
alleviation of health problems associated with pregnancy, delivery, infancy and birth defects;
It is considered unlikely to harm notified individuals in any way;
Any costs incurred for the research are borne by the relevant body;
A copy of final reports or papers for publication is provided, prior to publication, to the Register.
The minimum data set needed for the research project is provided to the co-opted researcher. This data
set may include identifying information.

Appendix 2
Birth Defects in South Australia 2016 38
The co-opted researcher must undertake to comply with the confidentiality procedures of the Register, in
particular section 2.4, “Procedures for ensuring confidentiality while conducting research projects”.
Approval from an appropriate Health Research Ethics Committee must be sought before identified data
can be released.
2.3. Other researchers
Identified information will not be provided to researchers from outside the Register who are not co-opted
by the Register. However, unidentified information on individuals may be sufficient to achieve the aims of
the research. The Register makes every effort to encourage and facilitate research and will try to provide
information for research projects within the constraints of these confidentiality guidelines.
2.4. Procedures for ensuring confidentiality while conducting research projects
The need for confidentiality must be balanced with the benefits of research and the need to facilitate
participation of notifiers in research projects. The following procedures are considered within the
interpretation of “not divulging confidential information”.
2.4.1. When additional clinical information is required for a research project but no contact with
patients is needed
The Register will review the medical records which it is authorised to access.
If further information is required, the original notifier will be approached first.
If the original notifier does not have the required information, permission will be sought from him/her to
contact the appropriate health professional. It may also be necessary to identify the patient’s most
appropriate health professional from the original notifier.
The appropriate health professional can then be approached for their assistance with the research
project.
If the Pregnancy Outcome Statistics Unit (POSU) of SA Health is the only notifier, it will approach its
original notifier to obtain the information.
2.4.2. When contact with patients is required for the research project
Permission in writing will be sought from the original notifier to contact a family for the purposes of
gathering data for a research study.
If the original notifier does not consider himself/herself to be the child’s managing clinician the
permission will be sought from the managing clinician.
The family will be contacted through the managing clinician.
Subsequently, the procedures for obtaining consent from families to enter their child into a research
study will be followed.
3. Other aspects of confidentiality
3.1. Staff aspects
All Register staff are instructed regarding the need for, and maintenance of, confidentiality. On
appointment to the Register, staff are required to sign a declaration, as part of their contract of service, that
no information on data in the Register will be disclosed, except under the conditions stated in the above
section “Release of Information”. This also applies to any other information of a confidential nature they
might hear or see in respect to subjects notified or their families, and apply even after employment ceases.
The terms of employment make it clear that a deliberate breach of confidentiality may lead to severe
disciplinary action.
3.2. Storage of data
Keys giving access to files are held by members of the Register staff only. Files are locked when not in
use or when the rooms are unattended. Data are kept on a secure computing system within the Register.

Appendix 3
Birth Defects in South Australia 2016 39
Appendix 3: Notification form

Appendix 4
Birth Defects in South Australia 2016 40
Appendix 4: Birth defect inclusions and exclusions
Diagnostic Information
A birth defect is defined by the Register as any abnormality of prenatal origin. Thus, structural (eg. Spina
bifida), genetic and chromosomal (eg. Down syndrome) and biochemical (eg. Phenylketonuria) defects are
included. Excluded are most minor malformations unless they are disfiguring or require treatment.
The following list of birth defects is not complete, but many of the common defects included in the
Register are mentioned. This list contains examples only. If a birth defect is not listed here or if in
doubt, please notify the defect, unless it is on the exclusion list.
Inclusions (examples only)
Nervous system Teratogens Gastrointestinal system
Anencephaly Fetal alcohol syndrome Cleft lip, palate
Spina bifida Fetal hydantoin syndrome Tracheo-oesophageal fistula
Encephalocele Pyloric stenosis
Congenital hydrocephalus Musculoskeletal system Intestinal atresia
Microcephaly Developmental dysplasia of hip Hirschsprung disease
Dandy Walker syndrome Congenital talipes equinovarus Ectopic anus
Craniosynostosis Polydactyly Imperforate anus
Cerebral palsy Syndactyly Exomphalos
Absence (complete or partial) of limbs
Gastroschisis
Genital system Osteogenesis imperfecta
Undescended testis (requiring Congenital spinal anomalies Metabolic disorders
treatment) Congenital torticollis Phenylketonuria
Hypospadias Congenital scoliosis Cystic fibrosis
Indeterminate Sex Bone dysplasias Congenital hypothyroidism
Muscular dystrophy Adreno-genital syndrome
Urinary system Glycogen storage disorders
Cystic kidney Chromosomal anomalies Lipid storage disorders
Absent kidney Down syndrome (Trisomy 21) Mucopolysaccharidoses
Ectopic kidney Trisomy 13 Albinism
Double ureter Trisomy 18
Ectopic ureter ± ureterocoele Turner syndrome Eye
Vesico-ureteric reflux Cri-du-chat syndrome Microphthalmia/Anophthalmia
Congenital glaucoma
Cardiovascular system Respiratory system Congenital cataract
Congenital heart defects Pulmonary hypoplasia Coloboma
Coarctation of the aorta Diaphragmatic hernia
Patent ductus Arteriosus* Choanal atresia Skin
Dextrocardia Congenital lung cyst Cystic hygroma
Birthmarks If >4cm2
multiple or requiring surgery
Blood Congenital infection Haemangiomas
Thalassaemia major Toxoplasmosis Naevi
Sickle cell anaemia Rubella Ichthyosis congenital
Haemophilia Cytomegalovirus Epidermolysis bullosa
Herpes simplex
Syphilis
*CRITERIA FOR INCLUSION OF PATENT DUCTUS ARTERIOSUS (PDA)
1. All term babies (37 weeks and beyond) where the duct remains open after 72 hours
2. All preterm babies where the duct remains open past the expected date of delivery
NB if PDA exists in the presence of other congenital heart disease it is always notified

Appendix 4
Birth Defects in South Australia 2016 41
Exclusion List
Excluded from the Register are the following, when occurring in isolation:
This is not a complete list of exclusions. If in doubt, please notify.
Balanced translocation in normal individual Laryngeal stridor unless treated
Blocked tear duct Laryngomalacia
Broncho-pulmonary dysplasia Low birth weight
Calcaneovalgus deformity Lymphangioma, haemangioma, naevus or other birthmark under 4cm
2 (include if >4cm
2 or multiple)
Clicky hips Meconium ileus (unless the result of cystic fibrosis)
Congenital pneumonia Mental retardation in isolation
Delayed milestones Metatarsus adductus even if treated
Deviated nasal septum Mongolian blue spot
Ear anomalies – minor Sacral dimple
Epigastric hernia Sacral sinus unrelated to occult spinal dysraphism
Epilepsy Single palmar crease
Failure to thrive Skin tag
Foot deformities – minor positional(not requiring treatment)
Single umbilical artery
Gastro-oesophageal reflux Strabismus
Hydrocele testis Submucous retention cyst
Hydrops – immune (Include non-immune hydrops) Supraventricular tachycardia
Hypoglycaemia Thalassaemia minor
Imperforate hymen Toe anomalies – minor
Infection in utero if no associated birth defect Tongue tie, even if surgery
Inguinal hernia Trigger finger/thumb
Intrauterine growth retardation Umbilical hernia
Intussusception Undescended testis (unless treated)
Labial adhesion or fusion Wide suture lines
Large fontanelles Webbing of 2nd
and 3rd toes (minor degrees)
Revised December 1990