bird migration through a mountain pass studied with high
TRANSCRIPT

Swarthmore College Swarthmore College
Works Works
Biology Faculty Works Biology
4-1-2001
Bird Migration Through A Mountain Pass Studied With High Bird Migration Through A Mountain Pass Studied With High
Resolution Radar, Ceilometers, And Census Resolution Radar, Ceilometers, And Census
Timothy C. Williams , '64 Swarthmore College, [email protected]
J. M. Williams
P. G. Williams
P. Stokstad
Follow this and additional works at: https://works.swarthmore.edu/fac-biology
Part of the Biology Commons
Let us know how access to these works benefits you
Recommended Citation Recommended Citation Timothy C. Williams , '64; J. M. Williams; P. G. Williams; and P. Stokstad. (2001). "Bird Migration Through A Mountain Pass Studied With High Resolution Radar, Ceilometers, And Census". Auk. Volume 118, Issue 2. 389-403. DOI: 10.1642/0004-8038(2001)118[0389:BMTAMP]2.0.CO;2 https://works.swarthmore.edu/fac-biology/255
This work is brought to you for free by Swarthmore College Libraries' Works. It has been accepted for inclusion in Biology Faculty Works by an authorized administrator of Works. For more information, please contact [email protected].
American Ornithologists' Union is collaborating with JSTOR to digitize, preserve and extend access to The Auk.
http://www.jstor.org
Bird Migration through a Mountain Pass Studied with High Resolution Radar, Ceilometers, andCensus Author(s): Timothy C. Williams, Janet M. Williams, Peter G. Williams and Paul Stokstad Source: The Auk, Vol. 118, No. 2 (Apr., 2001), pp. 389-403Published by: American Ornithologists' UnionStable URL: http://www.jstor.org/stable/4089800Accessed: 27-04-2015 14:35 UTC
REFERENCESLinked references are available on JSTOR for this article:
http://www.jstor.org/stable/4089800?seq=1&cid=pdf-reference#references_tab_contents
You may need to log in to JSTOR to access the linked references.
Your use of the JSTOR archive indicates your acceptance of the Terms & Conditions of Use, available at http://www.jstor.org/page/info/about/policies/terms.jsp
JSTOR is a not-for-profit service that helps scholars, researchers, and students discover, use, and build upon a wide range of contentin a trusted digital archive. We use information technology and tools to increase productivity and facilitate new forms of scholarship.For more information about JSTOR, please contact [email protected].
This content downloaded from 130.58.65.20 on Mon, 27 Apr 2015 14:35:24 UTCAll use subject to JSTOR Terms and Conditions
The Auk 118(2):389-403, 2001
BIRD MIGRATION THROUGH A MOUNTAIN PASS STUDIED WITH HIGH RESOLUTION RADAR, CEILOMETERS, AND CENSUS
TIMOTHY C. WILLIAMS, 15 JANET M. WILLIAMS,' PETER G. WILLIAMS,2,3,6 AND
PAUL STOKSTAD4
'Department of Biology, Swarthmore College, Swarthmore, Pennsylvania 19081, USA; 2ROQ Box 58, Franconia, New Hampshire 03580, USA;
3College of the Atlantic, Bar Harbor, Maine 04609, USA; and 4150 Hill Road, Berkeley, California 94708, USA
ABSTRACT.-Autumnal migration was studied with high-resolution radar, ceilometer, and daily census in the area of Franconia Notch, a major pass in the northern Appalachian Moun- tains. Under synoptic conditions favorable for migration, broadfront movements of migrants toward the south passed over the mountains, often above a temperature inversion. Birds at lower elevations appeared to be influenced by local topography. Birds moving southwest were concentrated along the face of the mountain range. Birds appeared to deviate their flights to follow local topography through the pass. Specific migratory behavior was not as- sociated with species or species groups. Under synoptic conditions unfavorable for south- ward migration, multimodal movements probably associated with local flights were as dense as the southward migrations described above. Avian migrants reacting to local terrain may result in concentrations of migrants over ridge summits or other topographic features. Re- ceived 29 November 1999, accepted 2 November 2000.
NORTH AMERICAN nocturnal migrants as ob- served with radar, a light beam (ceilometer), or by moon-watching appear to use broadfront migration, moving in waves hundreds of kilo- meters wide and rarely responding to features of the terrain until they descend for landing (Lowery and Newman 1966, Able 1972, Rich- ardson 1972, Williams et al. 1977). Evidence for deviation of nocturnal flights along features of the terrain such as rivers, coastlines, or hills is rare in North America (Richardson 1978a, Bingman et al. 1982, McCrary et al. 1983). In contrast to North America, moon-watching, in- frared, and radar observations in Europe have revealed birds deviating to follow coastlines, river systems, and most obviously the Alps (Eastwood 1967, Bruderer 1978, 1999; Bruderer and Jenni 1988, 1990; Jellmann 1988, Liechte et al. 1996, Bruderer and Liechte 1999). It is not clear whether those differences are due to North American birds relying more heavily on fixed-heading orientation (Wiltschko and Wiltschko 1978, Berthold 1990, Williams 1991, Williams and Webb 1996) or to other factors. Mountains, especially those presenting a bar-
5E-mail: [email protected] 6 Present address: SE Group, Mountain View Cen-
ter II, 610 Main St., P.O. Box 2729, Frisco, Colorado 80443, USA.
rier transverse to the direction of migration, would present the most critical test of theories that posit fixed-heading migrations for North American migrants. The behavior of nocturnal migrants in mountainous areas is also impor- tant for conservation issues because alpine ar- eas are increasingly developed in North Amer- ica for projects such as communication towers and- wind-powered generators.
Bruderer and his coworkers have observed bird migration in the Swiss Alps (Bruderer 1978, 1996; Bruderer and Jenni 1988, 1990), but the orientation and flight behavior of nocturnal avian migrants in mountainous terrain has been rarely studied in North America (Seilman et al. 1981, McCrary et al. 1983). Radar is poorly suited for use in mountainous areas due to ech- oes from surfaces rising above the horizontal. To study nocturnal migration in mountains, it is necessary to use high-resolution short-range radars and move the instruments either be- tween nights, as was done by Bruderer and Jen- ni (1990), or use a mobile radar and move it rapidly between sites within a single night as did Seilman et al. (1981). Alternatively, one can use ceilometers or a number of moon-watching stations as did Liechti et al. (1996). In side-by- side tests, ceilometers and short range, high- resolution radars produce highly correlated
389
This content downloaded from 130.58.65.20 on Mon, 27 Apr 2015 14:35:24 UTCAll use subject to JSTOR Terms and Conditions
390 WILLIAMS ET AL. [Auk, Vol. 118
measures of direction and density of bird mi- gration and survey a similar range of altitudes above ground level (Williams et al. 1981, Bru- derer 1999).
If birds use a variety of orientation systems in North America, it would be important to identify which species of birds use which sys- tem. Birds observed with radar or ceilometers, however, can rarely be identified to species (Williams and Williams 1980). Changes in the numbers of birds on the ground (diurnal cen- sus) have been only weakly associated with nocturnal radar or ceilometer observations (Drury and Keith 1962, Nisbet and Drury 1967, Williams et al. 1977, Bruderer and Jenni 1990). Williams et al. (1981) paired radar, ceilometer, and intensive mist-netting in southeastern Massachusetts. Numbers of birds detected with radar and ceilometers were highly corre- lated with each other, but were not significantly correlated with numbers of birds netted the next morning.
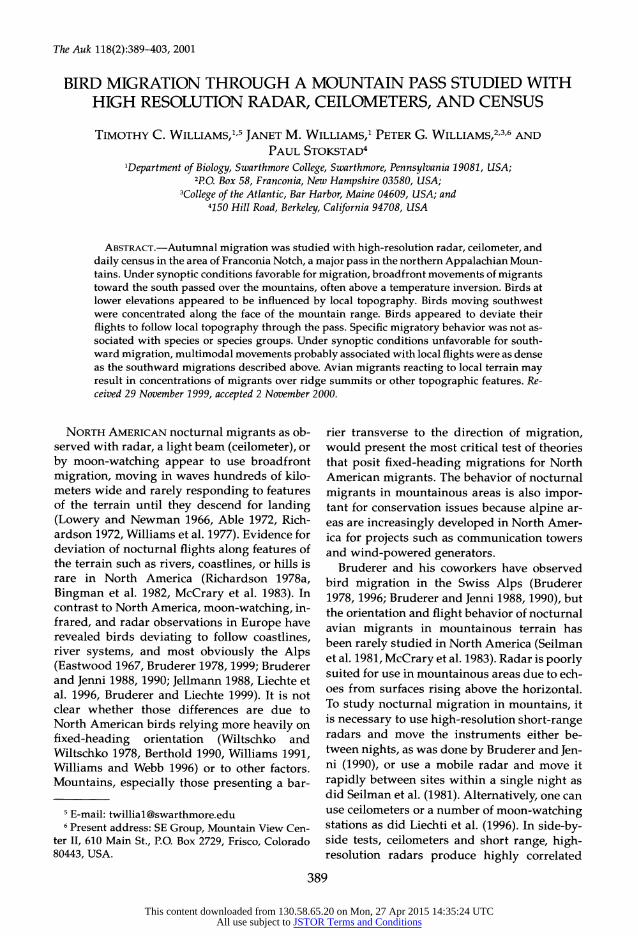
The present study reports radar and ceil- ometer observations of nocturnal migration in the Franconia Range of the White Mountains of New Hampshire and simultaneous daily cen- suses of birds at several sites in a variety of hab- itats. Those mountains are part of the Appala- chian Mountain chain, which stretches from the breeding grounds of numerous migrant species in New England and Canada to wintering grounds of many North American migrants in the southeastern United States (see Fig. 1, in- set). The Franconia Range runs northeast to southwest and rises about 1,000 m from the lowlands that stretch northwest to the Con- necticut River. Franconia Notch is a pass that runs roughly north to south through this bar- rier (Fig. 1). The mountain range is large enough to interrupt flight of birds, but low enough that they can easily fly over it (East- wood 1967, Williams et al. 1977).
Previous radar studies have shown two prin- cipal directions of autumnal migration in New England. Neotropical migrants move through that area toward the south and southeast on a route to Central and South America whereas North American migrants move southwest par- allel to the coastline (Drury and Keith 1962, Williams et al. 1977). For the Neotropical mi- grants, those mountains constitute the largest mountain barrier on the route from Canada to the North American coast and the Neotropics.
Con Arm Radar Ske ~ ~ tuy it
1 ~ ~ 6 km 13
'1km SOO~99 660 660 *: . 30
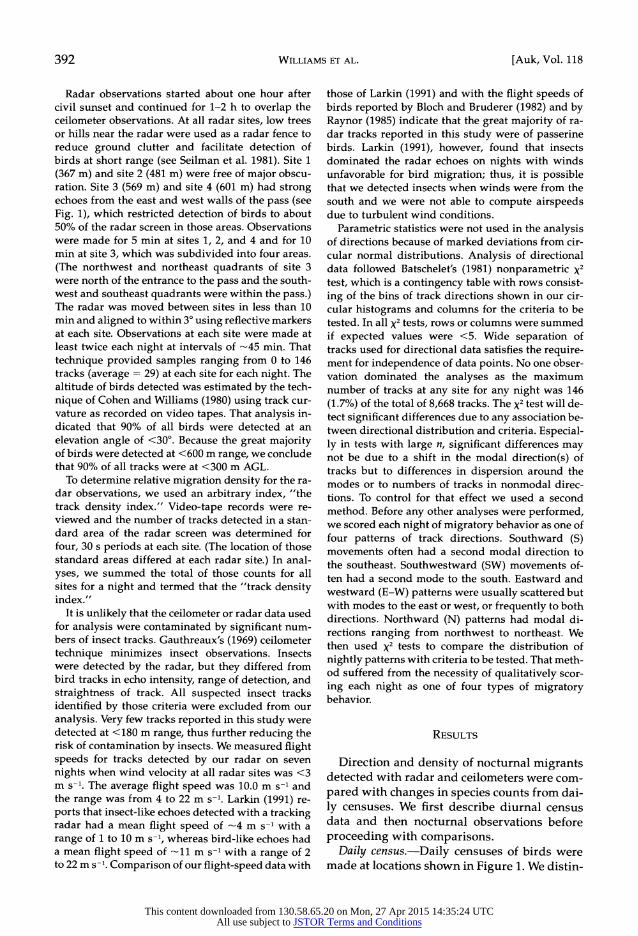
FIG. 1. Franconia Notch in the White Mountains of New Hampshire, 44?10'N, 71041 'W. The Franconia Range of mountains stretches northeast to southwest across the figure. Contour intervals are 330 m. The floor of the notch (F) is flanked by Cannon Mountain (C) and Mt. Lafayette (L). Greenleaf Hut (G) is lo- cated on a shoulder of Mt. Lafayette. Nocturnal ob- servation sites identified by number. Large circles show maximum range for detection of birds by radar at observation sites 1-4. At sites 3 and 4, significant areas within this maximum were obscured by local topography. Small circles indicate ceilometer obser- vation at sites 5 and 6. Hatched areas indicate census areas. Inset indicates location of Franconia Notch in the Appalachian Mountain chain and movements of Neotropical (southsoutheast) and North American (southwest) migrants.
For the North American migrants, the moun- tains form a major topographical feature par- allel to their migration. If migrants were guid- ed by fixed-heading orientation, we would expect broadfront migration to move as a wave up and over the mountains. If we found signif- icant differences in the orientation of birds in the lowlands and over the mountains, that might indicate the existence of a second orien- tation system based on topography.
METHODS
We performed daily point-count and area-count censuses from near local sunrise to noon EST in the
This content downloaded from 130.58.65.20 on Mon, 27 Apr 2015 14:35:24 UTCAll use subject to JSTOR Terms and Conditions
April 2001] Bird Migration Through a Mountain Pass 391
3 to 10 ha areas shown in Figure 1. We made obser- vations in all but the most northern area daily from 26 August to 11 October 1992. From 22 August to 17 October 1993, we observed daily at the most north- ern site. That was a mixed forest site in the lowlands (400 m), which included coniferous and hardwood forest, fields, and wetlands, 3 km northwest of the Franconia Range. The ecology of the multiple sites used in 1992 were as follows: the alpine sites around Greenleaf Hut on the shoulder of Mount (Mt.) Lafay- ette (1,300 to 1,400 m, see Fig. 1) and on the summit of Cannon Mountain (1,300 m) included areas of al- pine meadow, krumholtz, and alpine coniferous for- est. All vegetation at those sites was <4 m high and in most areas <2 m. Two lower elevation areas on the floor of the northern end of Franconia Notch (650 m, Fig. 1) included open fields, lake shore, and mixed forest.
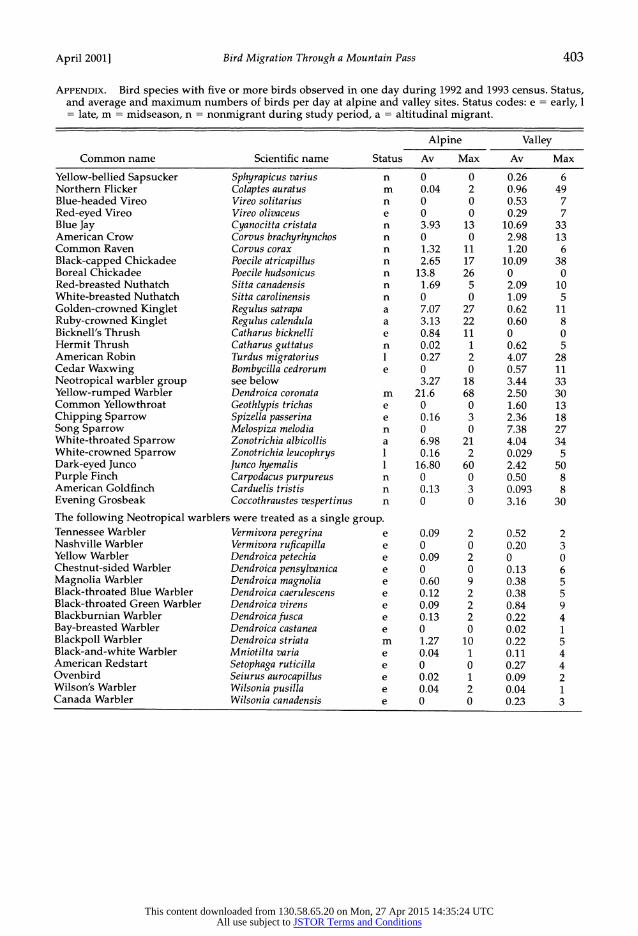
We restricted our analysis to species for which we observed at least five individuals in one day. The 42 species of passerines and 2 species of woodpeckers that met that criterion are listed in Appendix. A group of Neotropical warbler species, which often moved in mixed flocks in association with each other, were treated as a single species for analysis. All the species in Appendix, both migrants and nonmi- grants, except for the Bay-breasted Warbler, the Wil- son's Warbler, and the White-crowned Sparrow, breed within the study area and were observed at lower densities during the breeding season.
The raw numbers of birds seen per day could not be used as a measure of migratory activity, especially in alpine areas. Local weather conditions ranged from clear, windless days at 25?C to 15 m s-' winds, snow and-10?C. To correct for fluctuations in num- ber of birds counted due to changes in local weather, we created an index of migratory activity. Each day's count of migrant species was expressed relative to the abundance of nonmigrant species and then com- pared with the previous day to produce a three-point index of major change in numbers of migrants (>50% change), minor change (50 to 21% change), and stable numbers (<20% change).
Wind direction and speed, temperature, cloud cov- er, and visibility conditions were recorded at ground level for each site during both morning and noctur- nal observations. We also obtained hourly surface weather observations from the Fairbanks Museum in St. Johnsbury, Vermont (37 km northwest of the study site, elevation 175 m) and from the Mt. Wash- ington Observatory (32 km northeast, elevation 2,068 m). We used surface and 850 mb weather charts and our local weather measurements to code synoptic weather on a five-point scale. The synoptic weather code, based on Gauthreaux (1980), reflects the syn- optic weather system that most strongly affects local weather and does not always correspond to the syn- optic feature geographically closest to the study area on a given night. Wind velocity was too variable
within the mountainous areas to permit reliable cal- culation of headings from track and wind velocities; we frequently recorded differences of 120? and 5 m s-i within distances of 100 m. Measurements by local meteorologists (Pat Gannon pers. comm.) indicate that such large deviations are common up to 100 m above ground level (AGL) in the study area. Thermal inversions were identified directly by comparison of temperature readings at different altitudes.
We observed nocturnal migration at two alpine sites (site 5 at 1,396 m and site 6 at 1,315 m; see Fig. 1) by watching birds pass through a vertically di- rected conical light beam, or ceilometer, as described by Gauthreaux (1969) and Able and Gauthreaux (1975). We observed with either 10 x 50 or 8.5 x 44 binoculars. On Cannon Mountain, we used a GE Ceilometer bulb 100PAR64. At Greenleaf Hut, where battery power was at a premium, we used a Custom Accessories model 58886, 300,000 candle power spot- light. Although beam width was not specified, tests showed that the beam on this unit was narrower and the range of detection similar to that of the ceilom- eter bulb.
We made simultaneous observations with ceilom- eter and radar for one hour on all 30 nights with suit- able weather from 28 August to 10 October 1992, starting one hour after civil sunset. Observations were not made in rain, snow, or fog, or when the cloud ceiling was less than 100 m AGL. On eight ad- ditional nights without heavy rain in the same pe- riod, we were able to observe with radar alone. Gauthreaux (1969) and Able and Gauthreaux (1975) report that the maximum altitude of detection of the ceilometer we used is 500 m AGL for thrush-sized passerines. We estimated that most birds we detect- ed were between 10 and 300 m AGL based on image size and rate of passage through the light beam.
We used a mobile, high resolution, modified ma- rine radar to record nocturnal migration at sites 1, 2, 3, and 4 shown in Figure 1. The Furuno FR-8100 X- band marine radar (peak power 10 kW, beam width 1.8 x 250, antenna rotation 24 RPM) was operated at 0.91 km range and 0.08 ,us pulse length. The radar was modified by tilting the antenna upwards 12.50 above horizontal and was mounted on a van. Data from the display of the radar were recorded on video tape. We used a 30 s echo trail function allowing im- mediate recognition of bird echoes on the radar screen. Direction of movement was read with the electronic bearing line to ?2?. To ensure that all az- imuths of the radar display had an equal probability of being detected, we began observations at 00 azi- muth of the radar and moved constantly clockwise to select the next track, always completing the full 3600 before repeating an azimuth. The great majority of tracks were separated by 100 m to 1 km. Those tracks were not used to determine the density of mi- gration (see below).
This content downloaded from 130.58.65.20 on Mon, 27 Apr 2015 14:35:24 UTCAll use subject to JSTOR Terms and Conditions
392 WILLIAMS ET AL. [Auk, Vol. 118
Radar observations started about one hour after civil sunset and continued for 1-2 h to overlap the ceilometer observations. At all radar sites, low trees or hills near the radar were used as a radar fence to reduce ground clutter and facilitate detection of birds at short range (see Seilman et al. 1981). Site 1 (367 m) and site 2 (481 m) were free of major obscu- ration. Site 3 (569 m) and site 4 (601 m) had strong echoes from the east and west walls of the pass (see Fig. 1), which restricted detection of birds to about 50% of the radar screen in those areas. Observations were made for 5 min at sites 1, 2, and 4 and for 10 min at site 3, which was subdivided into four areas. (The northwest and northeast quadrants of site 3 were north of the entrance to the pass and the south- west and southeast quadrants were within the pass.) The radar was moved between sites in less than 10 min and aligned to within 30 using reflective markers at each site. Observations at each site were made at least twice each night at intervals of -45 min. That technique provided samples ranging from 0 to 146 tracks (average = 29) at each site for each night. The altitude of birds detected was estimated by the tech- nique of Cohen and Williams (1980) using track cur- vature as recorded on video tapes. That analysis in- dicated that 90% of all birds were detected at an elevation angle of <300. Because the great majority of birds were detected at <600 m range, we conclude that 90% of all tracks were at <300 m AGL.
To determine relative migration density for the ra- dar observations, we used an arbitrary index, "the track density index." Video-tape records were re- viewed and the number of tracks detected in a stan- dard area of the radar screen was determined for four, 30 s periods at each site. (The location of those standard areas differed at each radar site.) In anal- yses, we summed the total of those counts for all sites for a night and termed that the "track density index."
It is unlikely that the ceilometer or radar data used for analysis were contaminated by significant num- bers of insect tracks. Gauthreaux's (1969) ceilometer technique minimizes insect observations. Insects were detected by the radar, but they differed from bird tracks in echo intensity, range of detection, and straightness of track. All suspected insect tracks identified by those criteria were excluded from our analysis. Very few tracks reported in this study were detected at <180 m range, thus further reducing the risk of contamination by insects. We measured flight speeds for tracks detected by our radar on seven nights when wind velocity at all radar sites was <3 m s-1. The average flight speed was 10.0 m s-1 and the range was from 4 to 22 m s-1. Larkin (1991) re- ports that insect-like echoes detected with a tracking radar had a mean flight speed of -4 m s-1 with a range of 1 to 10 m s-1, whereas bird-like echoes had a mean flight speed of -11 m s-1 with a range of 2 to 22 m s-1. Comparison of our flight-speed data with
those of Larkin (1991) and with the flight speeds of birds reported by Bloch and Bruderer (1982) and by Raynor (1985) indicate that the great majority of ra- dar tracks reported in this study were of passerine birds. Larkin (1991), however, found that insects dominated the radar echoes on nights with winds unfavorable for bird migration; thus, it is possible that we detected insects when winds were from the south and we were not able to compute airspeeds due to turbulent wind conditions.
Parametric statistics were not used in the analysis of directions because of marked deviations from cir- cular normal distributions. Analysis of directional data followed Batschelet's (1981) nonparametric X2 test, which is a contingency table with rows consist- ing of the bins of track directions shown in our cir- cular histograms and columns for the criteria to be tested. In all X2 tests, rows or columns were summed if expected values were <5. Wide separation of tracks used for directional data satisfies the require- ment for independence of data points. No one obser- vation dominated the analyses as the maximum number of tracks at any site for any night was 146 (1.7%) of the total of 8,668 tracks. The X2 test will de- tect significant differences due to any association be- tween directional distribution and criteria. Especial- ly in tests with large n, significant differences may not be due to a shift in the modal direction(s) of tracks but to differences in dispersion around the modes or to numbers of tracks in nonmodal direc- tions. To control for that effect we used a second method. Before any other analyses were performed, we scored each night of migratory behavior as one of four patterns of track directions. Southward (S) movements often had a second modal direction to the southeast. Southwestward (SW) movements of- ten had a second mode to the south. Eastward and westward (E-W) patterns were usually scattered but with modes to the east or west, or frequently to both directions. Northward (N) patterns had modal di- rections ranging from northwest to northeast. We then used X2 tests to compare the distribution of nightly patterns with criteria to be tested. That meth- od suffered from the necessity of qualitatively scor- ing each night as one of four types of migratory behavior.
RESULTS
Direction and density of nocturnal migrants detected with radar and ceilometers were com- pared with changes in species counts from dai- ly censuses. We first describe diurnal census data and then nocturnal observations before proceeding with comparisons.
Daily census.-Daily censuses of birds were made at locations shown in Figure 1. We distin-
This content downloaded from 130.58.65.20 on Mon, 27 Apr 2015 14:35:24 UTCAll use subject to JSTOR Terms and Conditions

April 2001] Bird Migration Through a Mountain Pass 393
50 Neotropical U Alpine Early 4 Warblers 0 Valley 30+ L 201 .ll.r ~
80 T Yellow-rumped MId-season
60 Warrs
201 -A 9
Llat o> 30- - American Robins V 115 D
l.. P .l l _
F 60 White-throated Sparrows and Altitudinal mlgrants 50 KingletS 40~ 30+
Dark-eyed Juncos Braoding population + migrants 60-
40 _ TV
August | September I October
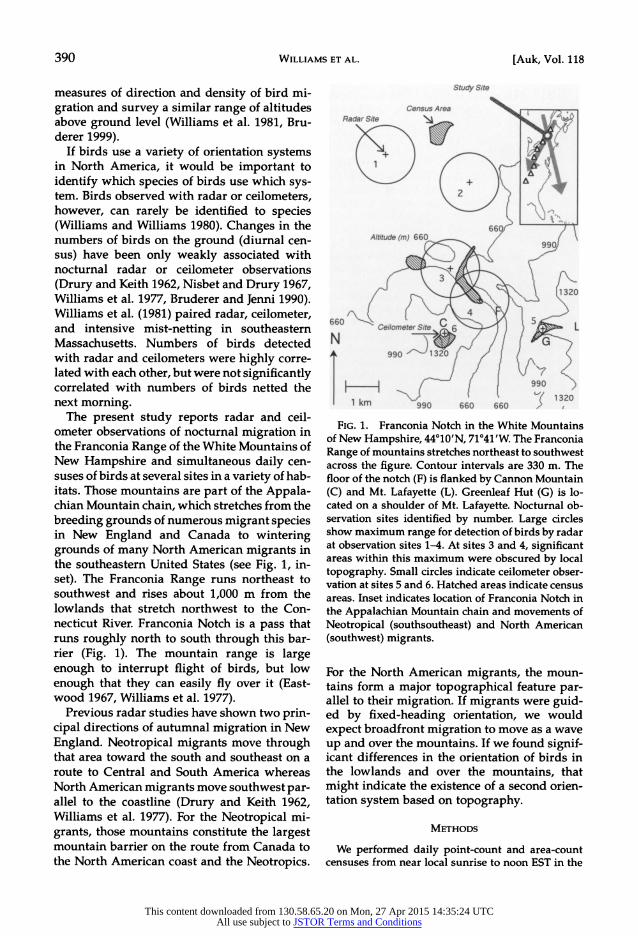
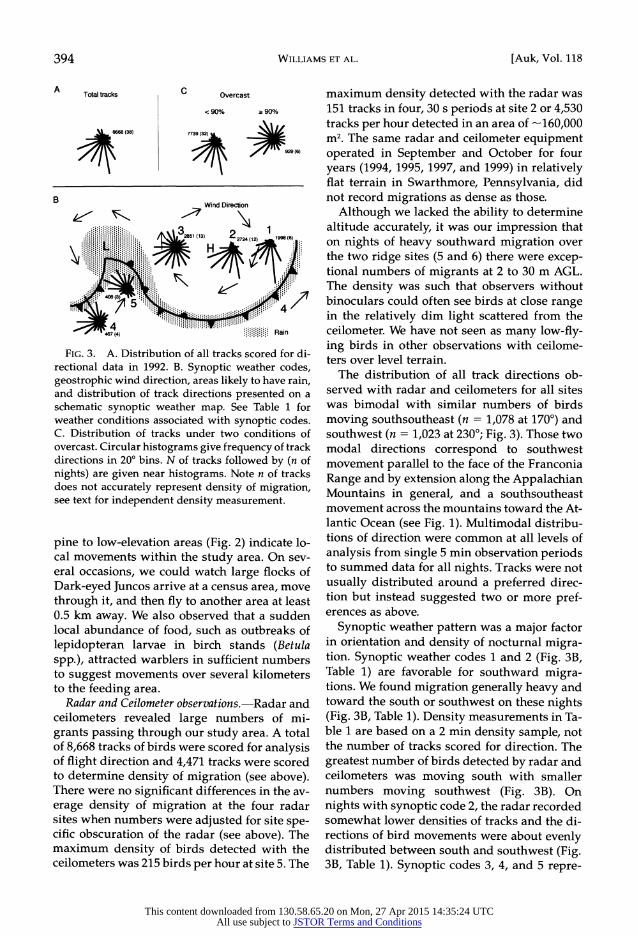
FIG. 2. Daily census of most numerous species for all major migrant status groups we observed in the area of Franconia Notch, New Hampshire in 1992 and 1993 (see Appendix A for other species). Solid squares (alpine) are data from observations at 1,300- 1,400 m elevation (see text for habitat descriptions). Open squares (valley) are data from observations at 500-600 m elevation. Neotropical Warblers do not in- clude Yellow-rumped Warblers. High counts in late September included in early migrants are Blackpoll Warblers which are mid-season migrants but are in- cluded in Neotropical warbler group.
guished five status groups of birds (described below) based on these. Appendix gives the sta- tus of each of the 42 species used in analysis and daily average and maximum counts of birds for each species at alpine and low-eleva- tion areas. Daily counts for the most numerous species in each status group are given in Figure 2. Early migrants consisted of warblers and small numbers of other passerines that showed peak numbers at valley locations in August and early September and then decreased in mid September (Fig. 2, Early). Yellow-rumped War- blers at alpine locations were the most numer- ous midseason migrants. They increased in numbers in early to mid September and de- creased in mid to late September (Fig. 2, Mid- season). Blackpoll Warblers, mid-season mi- grants, were included with other Neotropical warblers in Figure 2 (Early) and show up as peaks in mid and late September. Late-season migrants, primarily American Robins and
Dark-eyed Juncos at valley locations, increased in September and early October and did not de- crease during the period of our observations (Fig. 2, Late). Altitudinal migrants, mainly White-throated Sparrows and Golden- crowned Kinglets (Regulus satrapa), shifted from alpine to low-elevation areas (Fig. 2, Al- titudinal). Dark-eyed Juncos (Fig. 2, Breeding + migration) illustrate the interaction of sev- eral factors: an alpine breeding population in August was joined at alpine sites by migrants, formed large flocks and moved between alpine and valley sites depending on weather condi- tions. At each site, we also defined a group of "nonmigrant" species that did not show any significant change in numbers during the pe- riod of our observations, although those spe- cies may migrate in other areas or later in the season. Blue Jays, Black-capped Chickadees, nuthatches, Song Sparrows, and Evening Grosbeaks constituted the majority of the non- migrant birds.
Simultaneous censuses in alpine and low-el- evation communities revealed major differenc- es in the numbers of migrants. Most migrant species arrived and departed at different times in those areas (Fig. 2). Alpine migrants con- sisted primarily of Yellow-rumped Warblers with smaller numbers of Bicknell's Thrushes and Blackpoll Warblers. Most other early and midseason migrants, including warbler species migrating to the Neotropics, were seen in greater numbers at lower elevations although small numbers were often seen at alpine sites the morning after a migration. Late-season mi- grants such as American Robins appeared pri- marily at lower elevations during October (Fig. 2, Late).
Migratory activity, scored on a three-point migration index (see above), was associated with changes in synoptic weather conditions over the study area. Synoptic weather was cod- ed on a five-point scale illustrated in Figure 3B and described in Table 1. Heavy migration as indicated by large changes in numbers of mi- grants was associated with weather code 1. Mi- nor changes in numbers of migrants were as- sociated both with synoptic weather code 2 and with codes 4 and 5. Stable numbers of migrants were associated with weather code 3 (X2 =
12.70, df = 4, P = 0.0129). Site-to-site fluctuations during periods of
overall stable populations and shifts from al-
This content downloaded from 130.58.65.20 on Mon, 27 Apr 2015 14:35:24 UTCAll use subject to JSTOR Terms and Conditions
394 WILLIAMS ET AL. [Auk, Vol. 118
A Total tracks C Overcast
< 90% 2 90%
8668(38) T739 (32)
t t ( 6~~~~~~~~~~~~~~~~~~~~~~~~~~~~()
B Wind Direction
# 811322 242 19986(6)
A ~~~~~~44 46(4) Rain
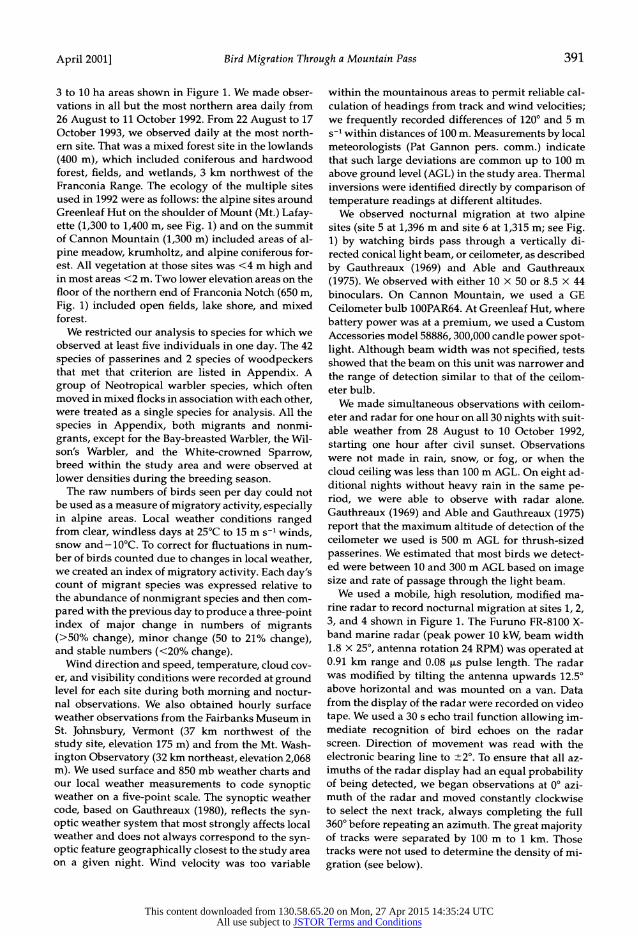
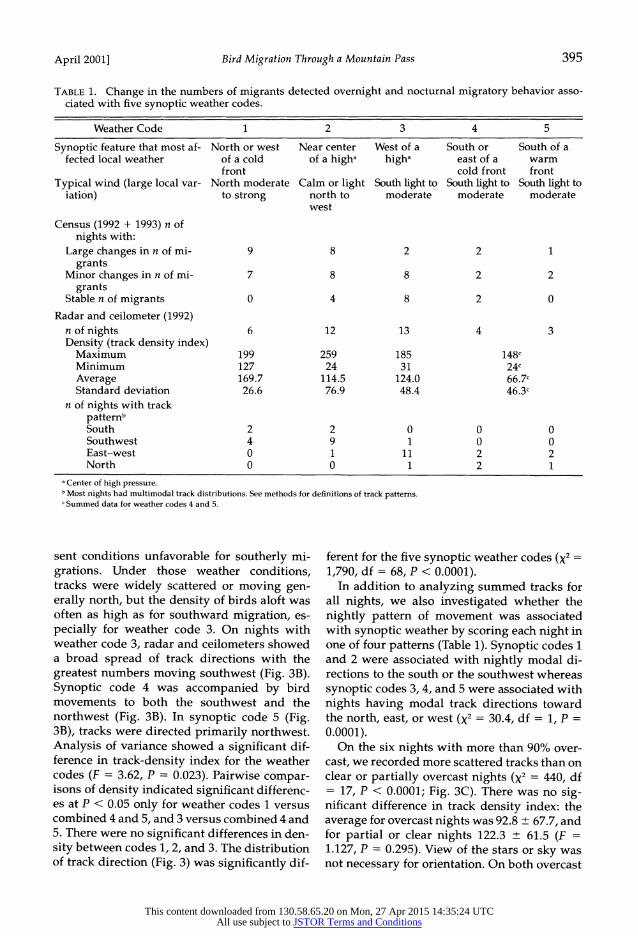
FIG. 3. A. Distribution of all tracks scored for di- rectional data in 1992. B. Synoptic weather codes, geostrophic wind direction, areas likely to have rain, and distribution of track directions presented on a schematic synoptic weather map. See Table 1 for weather conditions associated with synoptic codes. C. Distribution of tracks under two conditions of overcast. Circular histograms give frequency of track directions in 20? bins. N of tracks followed by (n of nights) are given near histograms. Note n of tracks does not accurately represent density of migration, see text for independent density measurement.
pine to low-elevation areas (Fig. 2) indicate lo- cal movements within the study area. On sev- eral occasions, we could watch large flocks of Dark-eyed Juncos arrive at a census area, move through it, and then fly to another area at least 0.5 km away. We also observed that a sudden local abundance of food, such as outbreaks of lepidopteran larvae in birch stands (Betula spp.), attracted warblers in sufficient numbers to suggest movements over several kilometers to the feeding area.
Radar and Ceilometer observations.-Radar and ceilometers revealed large numbers of mi- grants passing through our study area. A total of 8,668 tracks of birds were scored for analysis of flight direction and 4,471 tracks were scored to determine density of migration (see above). There were no significant differences in the av- erage density of migration at the four radar sites when numbers were adjusted for site spe- cific obscuration of the radar (see above). The maximum density of birds detected with the ceilometers was 215 birds per hour at site 5. The
maximum density detected with the radar was 151 tracks in four, 30 s periods at site 2 or 4,530 tracks per hour detected in an area of -160,000 mi2. The same radar and ceilometer equipment operated in September and October for four years (1994, 1995, 1997, and 1999) in relatively flat terrain in Swarthmore, Pennsylvania, did not record migrations as dense as those.
Although we lacked the ability to determine altitude accurately, it was our impression that on nights of heavy southward migration over the two ridge sites (5 and 6) there were excep- tional numbers of migrants at 2 to 30 m AGL. The density was such that observers without binoculars could often see birds at close range in the relatively dim light scattered from the ceilometer. We have not seen as many low-fly- ing birds in other observations with ceilome- ters over level terrain.
The distribution of all track directions ob- served with radar and ceilometers for all sites was bimodal with similar numbers of birds moving southsoutheast (n = 1,078 at 1700) and southwest (n = 1,023 at 2300; Fig. 3). Those two modal directions correspond to southwest movement parallel to the face of the Franconia Range and by extension along the Appalachian Mountains in general, and a southsoutheast movement across the mountains toward the At- lantic Ocean (see Fig. 1). Multimodal distribu- tions of direction were common at all levels of analysis from single 5 min observation periods to summed data for all nights. Tracks were not usually distributed around a preferred direc- tion but instead suggested two or more pref- erences as above.
Synoptic weather pattern was a major factor in orientation and density of nocturnal migra- tion. Synoptic weather codes 1 and 2 (Fig. 3B, Table 1) are favorable for southward migra- tions. We found migration generally heavy and toward the south or southwest on these nights (Fig. 3B, Table 1). Density measurements in Ta- ble 1 are based on a 2 min density sample, not the number of tracks scored for direction. The greatest number of birds detected by radar and ceilometers was moving south with smaller numbers moving southwest (Fig. 3B). On nights with synoptic code 2, the radar recorded somewhat lower densities of tracks and the di- rections of bird movements were about evenly distributed between south and southwest (Fig. 3B, Table 1). Synoptic codes 3, 4, and 5 repre-
This content downloaded from 130.58.65.20 on Mon, 27 Apr 2015 14:35:24 UTCAll use subject to JSTOR Terms and Conditions
April 2001] Bird Migration Through a Mountain Pass 395
TABLE 1. Change in the numbers of migrants detected overnight and nocturnal migratory behavior asso- ciated with five synoptic weather codes.
Weather Code 1 2 3 4 5
Synoptic feature that most af- North or west Near center West of a South or South of a fected local weather of a cold of a higha higha east of a warm
front cold front front Typical wind (large local var- North moderate Calm or light South light to South light to South light to
iation) to strong north to moderate moderate moderate west
Census (1992 + 1993) n of nights with:
Large changes in n of mi- 9 8 2 2 1 grants
Minor changes in n of mi- 7 8 8 2 2 grants
Stable n of migrants 0 4 8 2 0
Radar and ceilometer (1992) n of nights 6 12 13 4 3 Density (track density index)
Maximum 199 259 185 148c Minimum 127 24 31 24c Average 169.7 114.5 124.0 66.7c Standard deviation 26.6 76.9 48.4 46.3c
n of nights with track patternb South 2 2 0 0 0 Southwest 4 9 1 0 0 East-west 0 1 11 2 2 North 0 0 1 2 1
aCenter of high pressure. bMost nights had multimodal track distributions. See methods for definitions of track patterns. I Summed data for weather codes 4 and 5.
sent conditions unfavorable for southerly mi- grations. Under those weather conditions, tracks were widely scattered or moving gen- erally north, but the density of birds aloft was often as high as for southward migration, es- pecially for weather code 3. On nights with weather code 3, radar and ceilometers showed a broad spread of track directions with the greatest numbers moving southwest (Fig. 3B). Synoptic code 4 was accompanied by bird movements to both the southwest and the northwest (Fig. 3B). In synoptic code 5 (Fig. 3B), tracks were directed primarily northwest. Analysis of variance showed a significant dif- ference in track-density index for the weather codes (F = 3.62, P = 0.023). Pairwise compar- isons of density indicated significant differenc- es at P < 0.05 only for weather codes 1 versus combined 4 and 5, and 3 versus combined 4 and 5. There were no significant differences in den- sity between codes 1, 2, and 3. The distribution of track direction (Fig. 3) was significantly dif-
ferent for the five synoptic weather codes (X2 =
1,790, df = 68, P < 0.0001). In addition to analyzing summed tracks for
all nights, we also investigated whether the nightly pattern of movement was associated with synoptic weather by scoring each night in one of four patterns (Table 1). Synoptic codes 1 and 2 were associated with nightly modal di- rections to the south or the southwest whereas synoptic codes 3, 4, and 5 were associated with nights having modal track directions toward the north, east, or west (X2 = 30.4, df = 1, P =
0.0001). On the six nights with more than 90% over-
cast, we recorded more scattered tracks than on clear or partially overcast nights (X2 = 440, df = 17, P < 0.0001; Fig. 3C). There was no sig- nificant difference in track density index: the average for overcast nights was 92.8 ? 67.7, and for partial or clear nights 122.3 ? 61.5 (F = 1.127, P = 0.295). View of the stars or sky was not necessary for orientation. On both overcast
This content downloaded from 130.58.65.20 on Mon, 27 Apr 2015 14:35:24 UTCAll use subject to JSTOR Terms and Conditions
396 WILLIAMS ET AL. [Auk, Vol. 118
nights with synoptic code 1 or 2, tracks were directed southwest. On the two nights with synoptic codes 4 or 5, tracks were directed northwest to northeast. On two nights with code 3, tracks were generally southwest. The multimodal nature of the distributions and the small number of overcast nights prevented our testing whether downwind flight was more common under overcast.
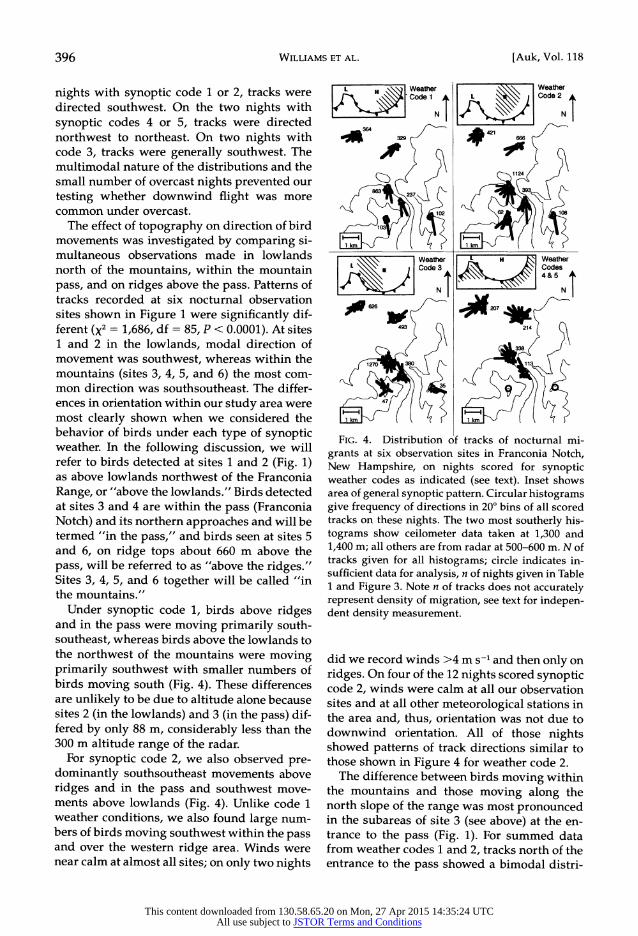
The effect of topography on direction of bird movements was investigated by comparing si- multaneous observations made in lowlands north of the mountains, within the mountain pass, and on ridges above the pass. Patterns of tracks recorded at six nocturnal observation sites shown in Figure 1 were significantly dif- ferent (X2 = 1,686, df = 85, P < 0.0001). At sites 1 and 2 in the lowlands, modal direction of movement was southwest, whereas within the mountains (sites 3, 4, 5, and 6) the most com- mon direction was southsoutheast. The differ- ences in orientation within our study area were most clearly shown when we considered the behavior of birds under each type of synoptic weather. In the following discussion, we will refer to birds detected at sites 1 and 2 (Fig. 1) as above lowlands northwest of the Franconia Range, or "above the lowlands." Birds detected at sites 3 and 4 are within the pass (Franconia Notch) and its northern approaches and will be termed "in the pass," and birds seen at sites 5 and 6, on ridge tops about 660 m above the pass, will be referred to as "above the ridges." Sites 3, 4, 5, and 6 together will be called "in the mountains."
Under synoptic code 1, birds above ridges and in the pass were moving primarily south- southeast, whereas birds above the lowlands to the northwest of the mountains were moving primarily southwest with smaller numbers of birds moving south (Fig. 4). These differences are unlikely to be due to altitude alone because sites 2 (in the lowlands) and 3 (in the pass) dif- fered by only 88 m, considerably less than the 300 m altitude range of the radar.
For synoptic code 2, we also observed pre- dominantly southsoutheast movements above ridges and in the pass and southwest move- ments above lowlands (Fig. 4). Unlike code 1 weather conditions, we also found large num- bers of birds moving southwest within the pass and over the western ridge area. Winds were near calm at almost all sites; on only two nights
L H Weather I& \\\ Weather
II:v F Code 1 L [N al Code 2N
4364 *2
4112
am 3
<19 62
6
Weather L H J 1 Weather L 9 Code 3 45Codes
N N
p626 0? 207i*K
493 214
FIG. 4. Distribution of tracks of nocturnal mi- grants at six observation sites in Franconia Notch, New Hampshire, on nights scored for synoptic weather codes as indicated (see text). Inset shows area of general synoptic pattern. Circular histograms give frequency of directions in 200 bins of all scored tracks on these nights. The two most southerly his- tograms show ceilometer data taken at 1,300 and 1,400 m; all others are from radar at 500-600 m. N of tracks given for all histograms; circle indicates in- sufficient data for analysis, n of nights given in Table 1 and Figure 3. Note n of tracks does not accurately represent density of migration, see text for indepen- dent density measurement.
did we record winds >4 m s-1 and then only on ridges. On four of the 12 nights scored synoptic code 2, winds were calm at all our observation sites and at all other meteorological stations in the area and, thus, orientation was not due to downwind orientation. All of those nights showed patterns of track directions similar to those shown in Figure 4 for weather code 2.
The difference between birds moving within the mountains and those moving along the north slope of the range was most pronounced in the subareas of site 3 (see above) at the en- trance to the pass (Fig. 1). For summed data from weather codes 1 and 2, tracks north of the entrance to the pass showed a bimodal distri-
This content downloaded from 130.58.65.20 on Mon, 27 Apr 2015 14:35:24 UTCAll use subject to JSTOR Terms and Conditions
April 2001] Bird Migration Through a Mountain Pass 397
bution with about half the birds moving into the pass (mode = 1700) and half moving across the entrance (mode = 2300). Within the pass, tracks showed a unimodal distribution cen- tered around 1800.
Differences in modal track directions be- tween the lowlands and the mountain sites were associated with presence of thermal in- versions. We recorded thermal inversions on 11 nights with synoptic weather codes 1 or 2. Winds on those nights were calm to light over the lowlands and on the floor of the pass, and typically 5 to 12 m s-I from the north at ridge summits. On 9 of these 11 nights, the pattern of migration at lowland and mountain sites had different modal directions; on 2 nights they had the same pattern. Of the seven nights without inversions, five showed the same modal pat- terns for lowland and mountain sites and only two showed differences (X2 = 5.1, df = 1, P = 0.02). The differences in track direction above and below the inversion in most cases could be ascribed to differences in wind velocity, but on three nights with inversions winds were re- corded as calm at all locations in the area, as described above. On all these nights, we re- corded differences in track directions between lowlands and mountain sites which were not due to differences in wind velocity.
Synoptic code 3 resulted in widely scattered tracks at all sites (Fig. 4). In many cases, often on the same night, birds appeared to move in almost opposite directions at neighboring sites. Movements above lowlands were primarily northeast and southwest parallel to the moun- tain range. In the pass and above ridges, move- ments often did not follow contour lines and it was difficult to discern any influence of local topography on direction of movement. Local winds for those observations were calm or <8 m s-1 southerly.
Under synoptic codes 4 and 5, ridge sites were usually obscured by clouds, but on two of eight nights there were sufficient breaks in the clouds to use the ceilometers; a total of only three birds was seen on both nights indicating a paucity of migrants at those altitudes. In the pass, birds were moving northwest. Move- ments above lowlands were widely scattered. We conclude that those conditions, generally favorable for northward (spring) migration, were associated with north or northwest move- ments at low elevation and few birds flew at
>1,000 m altitude. Winds were southerly at 5 to 8 m s-1. (No statistical test was done combining sites and weather codes because both summed sites for all weather codes and summed weath- er codes for all sites gave significant differences [see above] and we wished to avoid repeated tests.)
On a few occasions, we observed birds in process of encountering a change in wind con- ditions without appearing to change orienta- tion. Within the pass itself, we repeatedly ob- served tracks of birds that moved south into the pass and then appeared to slowly retrace their path northward. These "retro" birds (Larkin and Thompson 1980) were seen on nights when strong south winds were recorded in the moun- tains, but not north of the Notch. We interpret- ed those tracks as birds encountering strong south winds and then being blown backwards without reorienting their flights. On 17 Sep- tember 1992, we were able to directly observe the phenomenon with a ceilometer. A passerine entered the light beam at Cannon Mountain as it encountered the southerly wind above the summit. The bird maintained its southward heading, beating its wings steadily without making forward progress. It then began to move slowly backwards still heading south and beating its wings until it disappeared.
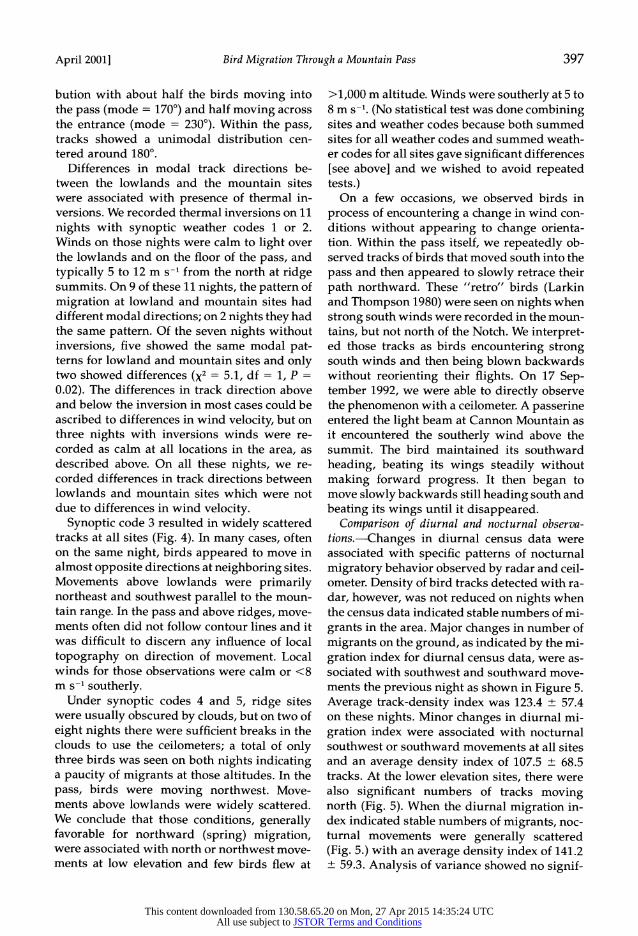
Comparison of diurnal and nocturnal observa- tions.-Changes in diurnal census data were associated with specific patterns of nocturnal migratory behavior observed by radar and ceil- ometer. Density of bird tracks detected with ra- dar, however, was not reduced on nights when the census data indicated stable numbers of mi- grants in the area. Major changes in number of migrants on the ground, as indicated by the mi- gration index for diurnal census data, were as- sociated with southwest and southward move- ments the previous night as shown in Figure 5. Average track-density index was 123.4 ? 57.4 on these nights. Minor changes in diurnal mi- gration index were associated with nocturnal southwest or southward movements at all sites and an average density index of 107.5 + 68.5 tracks. At the lower elevation sites, there were also significant numbers of tracks moving north (Fig. 5). When the diurnal migration in- dex indicated stable numbers of migrants, noc- turnal movements were generally scattered (Fig. 5.) with an average density index of 141.2 ? 59.3. Analysis of variance showed no signif-
This content downloaded from 130.58.65.20 on Mon, 27 Apr 2015 14:35:24 UTCAll use subject to JSTOR Terms and Conditions
398 WILLIAMS ET AL. [Auk, Vol. 118
Major changes Minor changes No change
665
679 7708 3201~M4
814 ~~~~~~~~254
1590 10
446 258 210~~~~~11 2
IN 51 26N
FIG. 5. Distribution of tracks of nocturnal migrants in Franconia Notch, New Hampshire, for three levels of migratory index derived from census counts the next morning: major changes in relative numbers of migrants from previous day (16 nights), minor changes (15 nights), and no discernible change (7 nights). Circular his- tograms as in Figure 4.
icant difference between the density of tracks under the three migratory index conditions (F = 0.661, P = 0.523). The Batschelet X2 test showed a significant association between those migration-index categories and direction of mi- grants recorded at all nocturnal observation sites (X2 = 277, df = 34, P < 0.0001). Nights with modal track patterns of south, southwest, or north were associated with large or moder- ate changes in diurnal census, whereas nights with modal track patterns east-west were as- sociated with minor changes or stable numbers of migrants (X2 = 9.2, df = 2, P = 0.01).
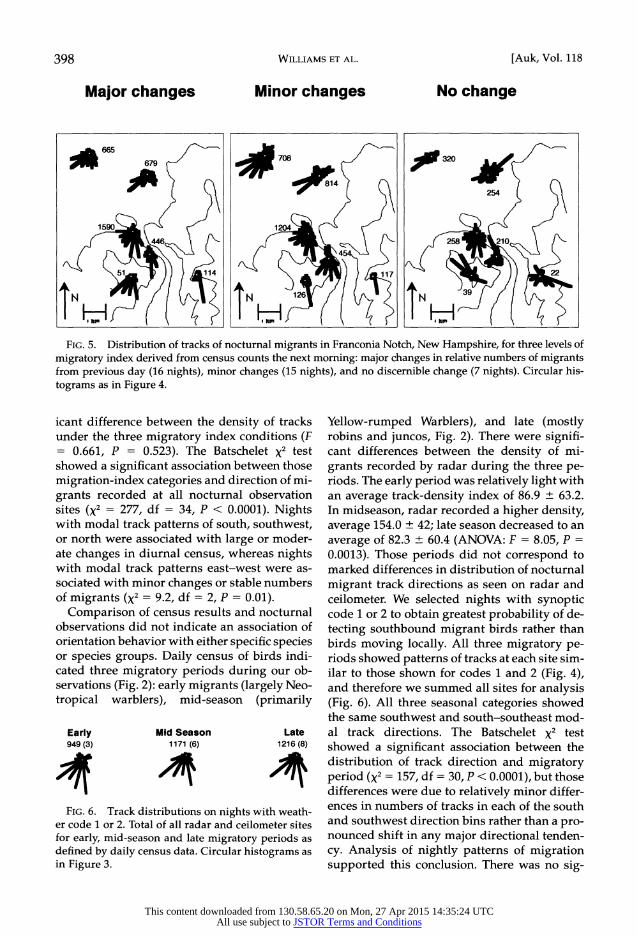
Comparison of census results and nocturnal observations did not indicate an association of orientation behavior with either specific species or species groups. Daily census of birds indi- cated three migratory periods during our ob- servations (Fig. 2): early migrants (largely Neo- tropical warblers), mid-season (primarily
Early Mid Season Late 949(3) 1171 (6) 1216(8)
FIG. 6. Track distributions on nights with weath- er code 1 or 2. Total of all radar and ceilometer sites for early, mid-season and late migratory periods as defined by daily census data. Circular histograms as in Figure 3.
Yellow-rumped Warblers), and late (mostly robins and juncos, Fig. 2). There were signifi- cant differences between the density of mi- grants recorded by radar during the three pe- riods. The early period was relatively light with an average track-density index of 86.9 ? 63.2. In midseason, radar recorded a higher density, average 154.0 ? 42; late season decreased to an average of 82.3 ? 60.4 (ANOVA: F = 8.05, P = 0.0013). Those periods did not correspond to marked differences in distribution of nocturnal migrant track directions as seen on radar and ceilometer. We selected nights with synoptic code 1 or 2 to obtain greatest probability of de- tecting southbound migrant birds rather than birds moving locally. All three migratory pe- riods showed patterns of tracks at each site sim- ilar to those shown for codes 1 and 2 (Fig. 4), and therefore we summed all sites for analysis (Fig. 6). All three seasonal categories showed the same southwest and south-southeast mod- al track directions. The Batschelet X2 test showed a significant association between the distribution of track direction and migratory period (X2 = 157, df = 30, P < 0.0001), but those differences were due to relatively minor differ- ences in numbers of tracks in each of the south and southwest direction bins rather than a pro- nounced shift in any major directional tenden- cy. Analysis of nightly patterns of migration supported this conclusion. There was no sig-
This content downloaded from 130.58.65.20 on Mon, 27 Apr 2015 14:35:24 UTCAll use subject to JSTOR Terms and Conditions
April 2001] Bird Migration Through a Mountain Pass 399
nificant association between nights with modal directions to the south versus soutwest and season, or with any group of species in diurnal census counts.
DISCUSSION
The combination of high-resolution radar, ceilometers, and daily ground counts at multi- ple sites provided a view of autumnal migra- tion through complex topography at a resolu- tion not previously attained in North America. The lowest 300 m of bird migration (which we observed) probably represent the most dense stratum of nocturnal migrants (Eastwood 1967, Able 1970, Bruderer and Jenni 1988). Direction of movements we observed at low altitude agree well with those observed at greater alti- tudes by Drury and Keith (1962) and Williams et al. (1977) using surveillance and weather ra- dars on Cape Cod. Primary directions of move- ment in both those studies were to the south- west and south-southeast. Drury and Keith (1962) interpreted those as movements along the New England coastline (southwest) and away from the coast, over the Atlantic Ocean. We found those same primary directions of movement 120 km inland. As in previous radar studies in North America, we found synoptic weather to be the most important factor in stimulating and maintaining autumnal migra- tion. Southward migration is heaviest west of a cold front and east of a high-pressure center. Southward movements are less dense west of high pressure and after passage of a warm front (Drury and Keith 1962, Lowery and New- man 1966, Richardson 1972, 1978b; Williams et al. 1977, Able 1980). Our results differ from those studies primarily in the high density movements we recorded at low altitudes dur- ing periods of unfavorable weather, such as weather code 3 (compare Richardson 1978b). That difference is not entirely due to low alti- tude of migrants we observed. Able (1973) also observed low-altitude migrants in the south- eastern United States, but did not record dense movements under unfavorable conditions. Our observations were made within breeding areas of most species we used for analysis. We also ended the study before killing frosts removed most insects from the area. Our diurnal obser- vations suggested movement to abundant food sources and avoidance of hazardous local
weather conditions, as well as southward mi- gration, as a reason for movement. Richardson (1982) reviews other possible interpretations of reverse migration and Williams and Webb (1996) have shown the importance of search be- havior in evolution of bird migration in North America. Our observations suggest that such movements are performed at night perhaps to avoid predation or to maximize feeding oppor- tunities during the day. Alerstam (1978), Lind- strom and Alerstam (1986), and Lindstrom (1990) reached similar conclusions for migrants in northern Europe.
The principal difference between our results and those of previous studies in North America is departure from broadfront migration. We found clear differences in distribution of track directions above lowlands northwest of the mountains and within the mountains. It is our interpretation that those differences in direc- tion of migration may be due to both topogra- phy and altitude, but not to local winds. Dif- ferences between orientation in lowlands and within Franconia Notch are probably due at least in part to topography. Sites are too close in altitude for differences to be due to elevation alone. Birds appear to move southwest along the face of the Franconia Range and deviate southward as they move through the pass. That is especially evident at site 3 where birds out- side the entrance moved southwest and birds within the pass moved primarily southsouth- east. Altitude may play a more important role in simultaneous southwest movement of birds above lowlands and southward movements over the mountain ridges often observed dur- ing synoptic weather codes 1 and 2. We inter- pret those data as two strata of migrating birds often separated by a thermal inversion. The lower layer in lowlands and valleys moves pri- marily southwest and the upper layer moves south or southeast. Depending upon altitude of the inversion, the upper layer may move up and over the mountain ridges in broadfront mi- gration or may flow along the contours of the pass. Persistence of those patterns under calm wind conditions argues against downwind ori- entation to local wind conditions as the source of differences.
Our results are similar to extensive radar, in- frared, and moon-watching studies within the area of the Alps in western Switzerland. Bru- derer and Jenni (1990) found that although au-
This content downloaded from 130.58.65.20 on Mon, 27 Apr 2015 14:35:24 UTCAll use subject to JSTOR Terms and Conditions

400 WILLIAMS ET AL. [Auk, Vol. 118
tumnal migration is broadfront in the sense that birds are moving over the entire area in the same general direction, land forms have a sig- nificant guiding effect. Birds within mountain valleys flying at 30 to 1,000 m AGL were more influenced by topography and showed more variability in direction over the study area than were those above 1,000 m AGL. When ap- proaching the Alps, birds flying at <1,000 m tend to deviate to fly parallel to mountain ridg- es unless those ridges are more or less perpen- dicular to their flight. Birds moving above 1,500 m and those meeting ridges perpendic- ular to their flight direction tend to fly over ridges in broadfront migration (Bruderer 1978, 1996; Bruderer and Jenni 1990). Southward mi- grating birds encountering the Alps deviate their flight southwest and move parallel to the face of the mountain range with smaller num- bers penetrating through passes in the moun- tains (Liechti et al. 1996, Bruderer and Liechti 1999). Other similarities between our work and Bruderer's include an increased effect of topo- graphical cues in unfavorable winds, dense movements in seasonally inappropriate direc- tions, and retro flights of birds encountering strong winds as they crest a ridgeline (Bruderer 1999). Liechti and Bruderer (1995) also found birds responding to topography over high- lands of southern Israel although the effect was not as pronounced as in the Alps. McKernan and his coworkers used ceilometers in moun- tain passes of southern California and found that ". . . topographic relief (mountain passes) have greater magnitude [of migration] than other sites without relief (e.g. Mojave and Col- orado Deserts). Mean angles for those noctur- nal migrants within the topographic relief were aligned with the orientation of the relief." (R. McKernan pers. comm.).
Arrivals and departures of birds inferred from our diurnal visual census were clearly re- lated to nocturnal flight behavior as observed with ceilometers and radar. Southward or northward nocturnal movements were more clearly associated with changes in ground counts than in previous studies (Nisbet and Drury 1967, Williams et al. 1981). That was probably due to our summing data from sev- eral sites for nocturnal observations and sev- eral widely separated, ecologically diverse ar- eas for diurnal census counts.
Our observations suggest a range of orien- tation techniques for nocturnal migrants de- pending upon weather conditions. Broadfront migration and observations of retro birds un- der synoptic codes 1 and 2 suggest fixed-head- ing orientation. Local flights and altitudinal movements under weather codes 3, 4, and 5, and reaction to topography of the Franconia Range and the mountain pass under all weath- er conditions suggest importance of land forms in other phases of orientation. Able (1982) also found differences in orientation depending on weather conditions, but he found birds exhib- iting downwind orientation under conditions of overcast. A definitive test of importance of local wind direction was not possible for our data because wind direction and speed often differed greatly over the range of a single radar site or within the altitude range of the radar or ceilometer. However, synoptic weather codes predicted patterns of migration even in calm winds and we often observed a multimodal distribution of simultaneous tracks at a single site, presumably under similar wind condi- tions. Birds migrating through the turbulent and unpredictable wind conditions in moun- tains might find it dangerous to rely on down- wind flight for orientation. Although local winds are relatively constant over flat terrain, birds migrating through the Franconia Range might benefit from using a more reliable fea- ture such as synoptic weather or topography.
We were not able to relate nocturnal migra- tory behavior to specific species or groups of species with similar migratory goals, such as Neotropical warblers. Ground counts revealed that was probably because both Neotropical and North American migrants responded sim- ilarly to synoptic weather stimuli for migration. Both early and midseason migrations con- tained birds heading for both the Neotropics (southsoutheast) and southern North America (southwest), for example movements in late September contained not only Yellow-rumped Warblers and Northern Flickers, but also Black- poll Warblers and Bicknell's Thrushes. Aler- stam (1996) presents evidence for a range of orientation techniques across a much broader taxonomic spectrum than our birds, which were primarily passerines.
Our observations and those of Bruderer and his coworkers indicate that broadfront migra- tion should not be assumed for the passage of
This content downloaded from 130.58.65.20 on Mon, 27 Apr 2015 14:35:24 UTCAll use subject to JSTOR Terms and Conditions
April 2001] Bird Migration Through a Mountain Pass 401
avian migrants over mountainous areas (Bruder- er 1996, Liechte et al. 1999). That is important for evaluation of structures such as wind-powered electrical generators or communication towers on ridge lines. Although our studies were not de- signed to observe concentration of migrants at to- pographical features, reaction of migrants to to- pography that we did observe suggested such concentrations during both favorable and unfa- vorable conditions. Concentrations could result either as birds moved along a corridor, such as a pass or ridge line, or they could result from birds moving up and over a ridge meeting migrants al- ready at that altitude and thus producing large numbers of birds a few tens of meters above the ridge summit. Our ceilometer observations of large numbers of birds near crests of ridges are particularly relevant in that regard.
ACKNOWLEDGMENTS
We thank Eric Lane, Lisa Mosca, Hope Sieck, R. Douglas Sloane, and Rosanna Webb for their invalu- able assistance in collection and analysis of data, Robert 0. Williams, for help with equipment; Gud- mund Iverson, Anne W. Lane, and Elizabeth Mallory for statistical advice; and Eric Lane, Ronald Larkin, W. John Richardson, and Rosanna Webb for com- ments on the manuscript. We are indebted to the Ap- palachian Mountain Club, the U.S. Forest Service, Franconia Notch State Park, and Cannon Mountain Ski Area for permission to use facilities and areas un- der their jurisdiction and for their cooperation in all phases of the project. The Appalachian Mountain Club provided communications equipment, and food and lodging at the Greenleaf Hut. The Cannon Mountain Ski Area provided transportation and lodging for operations at the summit station of Can- non Mountain. This project was supported by the Ex- plorers Club Youth Activities Fund and by Swarth- more College through the Meinkoth and Enders Funds, the Lande Fund, the Natural Sciences Re- search Fund, the Faculty Research Fund, the Depart- ment of Biology, and the Faculty Leave Program.
LITERATURE CITED
ABLE, K. P. 1970. A radar study of the altitude of noc- turnal passerine migration. Journal of Field Or- nithology 41:282-290.
ABLE, K. P. 1972. Fall migration in coastal Louisiana and the evolution of migration patterns in the Gulf region. Wilson Bulletin 84:231-242.
ABLE, K. P. 1973. The role of weather variables and flight direction in determining the magnitude of nocturnal bird migration. Ecology 54:1031-1041.
ABLE, K. P. 1980. Mechanisms of orientation, navi- gation, and homing. Pages 283-373 in Animal Migration, Orientation, and Navigation (S. A. Gauthreaux, Jr., Ed.). Academic Press, New York.
ABLE, K. P. 1982. Field studies of avian nocturnal mi- gratory orientation I. Interaction of sun, wind, stars as directional cues. Animal Behaviour 30: 761-767.
ABLE, K. P., AND S. A. GAUTHREAUX, JR. 1975. Quan- tification of nocturnal passerine migration with a portable ceilometer. Condor 77:92-96.
ALERSTAM, T. 1978. Reoriented bird migration in coastal areas: dispersal to suitable resting grounds? Oikos 30:405-408.
ALERSTAM, T. 1996. The geographical scale factor in orientation of migrating birds. Journal of Exper- imental Biology 199:9-19.
BATSCHELET, E. 1981. Circular Statistics in Biology. Academic Press, New York.
BERTHOLD, P. 1990. Genetics of migration. Pages 269- 283 in Bird Migration: Physiology and Ecophys- iology (E. Gwinner, Ed.). Springer Verlag, Berlin.
BINGMAN, V. P., K. P. ABLE, AND P. KERLINGER. 1982. Wind drift, compensation, and the use of land- marks by nocturnal bird migrants. Animal Be- haviour 30:49-53.
BLOCH, R., AND B. BRUDERER. 1982. The air speed of migrating birds and its relationship to the wind. Behavioral Ecology and Sociobiology 11:19-24.
BRUDERER, B. 1978. Effects of alpine topography and winds on migrating birds. Pages 252-265 in An- imal Migration, Navigation, and Homing (K. Schmidt-Koenig and W. Keeton, Eds.). Springer- Verlag, Berlin.
BRUDERER, B. 1996. Vogelzugforschung im Bereich der Alpen 1980-1995. Der Ornitologische Beo- bachter 93:119-130.
BRUDERER, B. 1999. Three decades of tracking radar studies on bird migration in Europe and the Middle East. Pages 107-141 in Proceedings In- ternational Seminar on Birds and Flight Safety in the Middle East (Y. Leshem, Y. Mandelik, and J. Shamoun-Baranes, Eds.). Tel-Aviv, Israel.
BRUDERER, B., AND L. JENNI. 1988. Strategies of bird migration in the area of the Alps. Pages 2150- 2161 in Acta XIX Congressus Internationalis Or- nitologici (H. Ouellet, Ed.). National Museum of Natural Science, Ottawa, Ontario.
BRUDERER, B., AND L. JENNI. 1990. Migration across the Alps. Pages 61-77 in Bird Migration: Physi- ology and Ecophysiology (E. Gwinner, Ed.). Springer Verlag, Berlin.
BRUDERER, B., AND F. LIECHTI. 1999. Bird migration across the Mediterranean. Pages 1983-1999 in Proceedings XXII International Ornithology
This content downloaded from 130.58.65.20 on Mon, 27 Apr 2015 14:35:24 UTCAll use subject to JSTOR Terms and Conditions
402 WILLIAMS ET AL. [Auk, Vol. 118
Congress (N. J. Adams and R. H. Slotow, Eds.). University of Natal, Durban, South Africa.
COHEN, B., AND T. C. WILLIAMS. 1980. Short-range corrections for migrant bird tracks on search ra- dars. Journal of Field Ornithology 51:248-251.
DRURY, W H., AND J. A. KEITH. 1962. Radar studies of songbird migration in coastal New England. Ibis 104:449-489.
EASTWOOD, E. 1967. Radar Ornithology. Methuen, London.
GAUTHREAUX, S. A., JR. 1969. A portable ceilometer technique for studying low level nocturnal mi- gration. Journal of Field Ornithology 40:309- 319.
GAUTHREAUX, S. A., JR. 1980. Direct visual and radar methods for the detection, quantification, and prediction of bird migration. Special Publication no. 2, Department of Zoology, Clemson Univer- sity, Clemson, South Carolina.
JELLMANN, J. 1988. Leitlinienwirkung auf den nacht- lichen Vogelzug im Bereich der MuAndungen von Elbe und Weser nach Radarbeobachtungen. Die Vogelwarte 34:208-215.
LARKIN, R. P. 1991. Flight speeds observed with ra- dar, a correction: Slow "birds" are insects. Be- havioral Ecology and Sociobiology 29:221-224.
LARKIN, R. P., AND D. THOMPSON. 1980. Flight speeds of birds observed with radar: Evidence for two phases of flight. Behavioral Ecology and Socio- biology 7:301-317.
LIECHTI, F., AND B. BRUDERER. 1995. Direction, speed, and composition of nocturnal bird migration in the south of Israel. Israel Journal of Zoology 41: 501-515.
LIECHTI, F., D. PETER, R. LARDELLI, AND B. BRUDERER. 1996. Herbstlicher Vogelzug im Alpenraum nach Mondbeobactungen-Topographie und Wind beeinflussen den Zugverlauf. Der Ornithologis- che Beobachter 93:131-152.
LINDSTROM, A. 1990. The role of predation in habitat selection in migrating Bramblings Fringilla mon- tifringilla. Behavioral Ecology 1:102-106.
LINDSTROM, A., AND T. ALERSTAM. 1986. Adaptive significance of reoriented migration of Chaf- finches Fringilla coelebs and Bramblings F mon- tifringilla during autumn in southern Sweden. Behavioral Ecology and Sociobiology 19:417- 424.
LOWERY, G. H., JR., AND R. J. NEWMAN. 1966. A con- tinent wide view of bird migration on four nights in October. Auk 83:547-586.
MCCRARY, M. D., R. L. McKERNAN, W. D. WAGNER, R. E. LANDRY, AND R. W. SCHREIBER. 1983. Noc- turnal avian migration assessment of the San Gorgonia wind resource study area, spring 1982. Report 83-RD-108 for Southern California Edison Co., Research and Development Division Los Angeles, California.
NISBET, I. C. T., AND W. H. DRURY. 1967. Orientation of spring migrants studied by radar. Bird-Band- ing 38:173-186.
RAYNOR, J. 1985. Flight, speeds of. Pages 224-226 in A Dictionary of Birds (B. Campbell and E. Lack, Eds.). Poyser, Staffordshire, United Kingdom.
RICHARDSON, W. J. 1972. Autumn migration and weather in eastern Canada: A radar study. American Birds 26:10-17.
RICHARDSON, W. J. 1978a. Reorientation of nocturnal landbird migrants over the Atlantic Ocean near Nova Scotia in autumn. Auk 95:717-732.
RICHARDSON, W. J. 1978b. Timing and amount of bird migration in relation to weather: A review. Oikos 30:224-272.
RICHARDSON, W. J. 1982. Northeastward reverse mi- gration of birds over Nova Scotia, Canada, in au- tumn. Behavioral Biology and Sociobiology 10: 193-206.
SEILMAN, M. S., L. A. SHERIFF, AND T. C. WILLIAMS. 1981. Nocturnal migration at Hawk Mountain, Pennsylvania. American Birds 35:906-909.
WILLIAMS, T. C. 1991. Constant compass orientation for North American autumnal migrants. Journal of Field Ornithology 62:218-225.
WILLIAMS, T. C., J. E. MARSDEN, T. L. LLOYD-EVANS, V. KRAUTHAMER, AND H. KRAUTHAMER. 1981. Spring migration studied by mist-netting, ceil- ometer, and radar. Journal of Field Ornithology 52:177-190.
WILLIAMS, T. C., AND T. WEBB III. 1996. Neotropical bird migration during the ice ages: Orientation and ecology. Auk 113:105-118.
WILLIAMS, T. C., AND J. M. WILLIAMS. 1980. A Peter- son's Guide to radar ornithology? American Birds 34:738-741.
WILLIAMS, T. C., J. M. WILLIAMS, L. C. IRELAND, AND J. M. TEAL. 1977. Autumnal bird migration over the western North Atlantic Ocean. American Birds 31:251-267.
WILTSCHKO, W., AND R. WILTSCHKO. 1978. A theo- retical model for migratory orientation and homing in birds. Oikos 30:177-187.
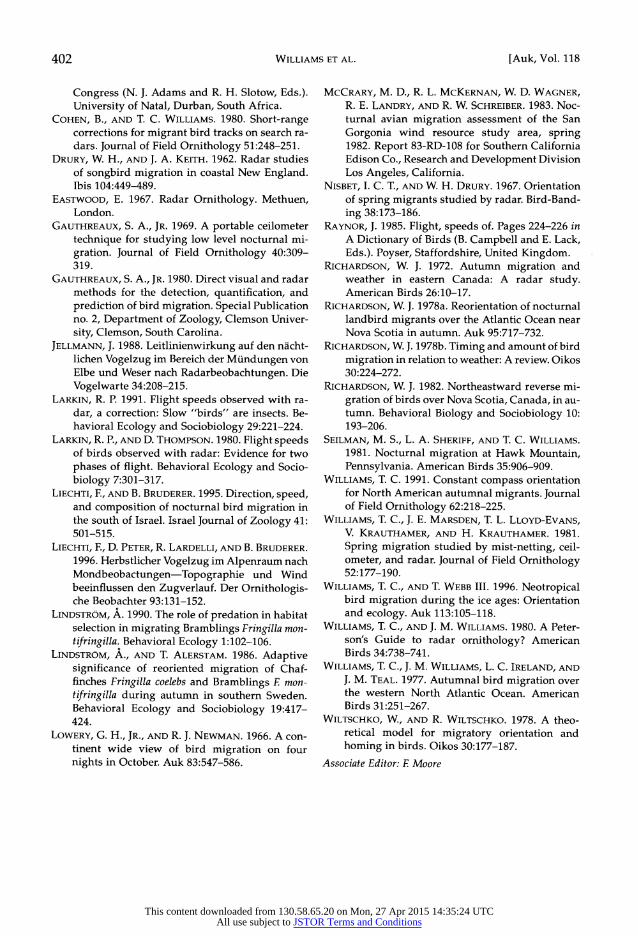
Associate Editor: F Moore
This content downloaded from 130.58.65.20 on Mon, 27 Apr 2015 14:35:24 UTCAll use subject to JSTOR Terms and Conditions
April 2001] Bird Migration Through a Mountain Pass 403
APPENDIX. Bird species with five or more birds observed in one day during 1992 and 1993 census. Status, and average and maximum numbers of birds per day at alpine and valley sites. Status codes: e = early, 1 = late, m = midseason, n = nonmigrant during study period, a = altitudinal migrant.
Alpine Valley
Common name Scientific name Status Av Max Av Max
Yellow-bellied Sapsucker Sphyrapicus varius n 0 0 0.26 6 Northern Flicker Colaptes auratus m 0.04 2 0.96 49 Blue-headed Vireo Vireo solitarius n 0 0 0.53 7 Red-eyed Vireo Vireo olivaceus e 0 0 0.29 7 Blue Jay Cyanocitta cristata n 3.93 13 10.69 33 American Crow Corvus brachyrhynchos n 0 0 2.98 13 Common Raven Corvus corax n 1.32 11 1.20 6 Black-capped Chickadee Poecile atricapillus n 2.65 17 10.09 38 Boreal Chickadee Poecile hudsonicus n 13.8 26 0 0 Red-breasted Nuthatch Sitta canadensis n 1.69 5 2.09 10 White-breasted Nuthatch Sitta carolinensis n 0 0 1.09 5 Golden-crowned Kinglet Regulus satrapa a 7.07 27 0.62 11 Ruby-crowned Kinglet Regulus calendula a 3.13 22 0.60 8 Bicknell's Thrush Catharus bicknelli e 0.84 11 0 0 Hermit Thrush Catharus guttatus n 0.02 1 0.62 5 American Robin Turdus migratorius 1 0.27 2 4.07 28 Cedar Waxwing Bombycilla cedrorum e 0 0 0.57 11 Neotropical warbler group see below 3.27 18 3.44 33 Yellow-rumped Warbler Dendroica coronata m 21.6 68 2.50 30 Common Yellowthroat Geothlypis trichas e 0 0 1.60 13 Chipping Sparrow Spizella passerina e 0.16 3 2.36 18 Song Sparrow Melospiza melodia n 0 0 7.38 27 White-throated Sparrow Zonotrichia albicollis a 6.98 21 4.04 34 White-crowned Sparrow Zonotrichia leucophrys 1 0.16 2 0.029 5 Dark-eyed Junco Junco hyemalis 1 16.80 60 2.42 50 Purple Finch Carpodacus purpureus n 0 0 0.50 8 American Goldfinch Carduelis tristis n 0.13 3 0.093 8 Evening Grosbeak Coccothraustes vespertinus n 0 0 3.16 30
The following Neotropical warblers were treated as a single group. Tennessee Warbler Vermivora peregrina e 0.09 2 0.52 2 Nashville Warbler Vermivora ruficapilla e 0 0 0.20 3 Yellow Warbler Dendroica petechia e 0.09 2 0 0 Chestnut-sided Warbler Dendroica pensylvanica e 0 0 0.13 6 Magnolia Warbler Dendroica magnolia e 0.60 9 0.38 5 Black-throated Blue Warbler Dendroica caerulescens e 0.12 2 0.38 5 Black-throated Green Warbler Dendroica virens e 0.09 2 0.84 9 Blackburnian Warbler Dendroicafusca e 0.13 2 0.22 4 Bay-breasted Warbler Dendroica castanea e 0 0 0.02 1 Blackpoll Warbler Dendroica striata m 1.27 10 0.22 5 Black-and-white Warbler Mniotilta varia e 0.04 1 0.11 4 American Redstart Setophaga ruticilla e 0 0 0.27 4 Ovenbird Seiurus aurocapillus e 0.02 1 0.09 2 Wilson's Warbler Wilsonia pusilla e 0.04 2 0.04 1 Canada Warbler Wilsonia canadensis e 0 0 0.23 3
This content downloaded from 130.58.65.20 on Mon, 27 Apr 2015 14:35:24 UTCAll use subject to JSTOR Terms and Conditions