bird migration monitoring in the aes geo power wind park ... migration - autumn 2012.pdf · 1 bird...
TRANSCRIPT

1
Bird migration monitoring in the AES Geo Power Wind Park
territory, Kaliakra region, in autumn 2012, and analysis of
potential impact after three years’ operation
Dr. Pavel Zehtindjiev
Institute of Biodiversity and Ecosystem Research, Bulgarian Academy of Sciences,
1113, Sofia, 2 Gagarin St., Bulgaria
e-mail: [email protected]
Dr. D. Philip Whitfield
Natural Research Projects Ltd, Banchory, UK
November 2012
Report to AES Geo Energy OOD, Chervena Stena 38, 1421 Sofia, Bulgaria

2
TERMS OF USE
You understand and agree that the information in, or derived from, this document may not be copied, republished, redistributed, transmitted, altered, edited, used or exploited in any manner for any purpose, without the express written permission of AES Geo Energy OOD ("AES"). You also agree that AES and its data providers shall not be liable for any errors in the content, or for any actions taken by you, or any third-party, in reliance thereon. Facts and other information discussed in this document have been obtained from sources considered reliable, but are not guaranteed, and AES makes no representation or warranty as to the accuracy or completeness of the information contained in this document or any other document or website referred to it or accessed through a hyperlink on AES' website. When you access a non-AES website, you understand that it is independent from AES, and that AES has no control over the content on that website. In addition, a link to a non-AES website does not mean that AES endorses or accepts any responsibility for the content, or the use, of such website. In no event will AES be liable to any party for any direct, indirect, special or other consequential damages for any use of this document, including, without limitation, any breach of law, any lost profits, business interruption, loss of programs or other data on your information handling system or otherwise, even if we are expressly advised of the possibility of such damages. All information is provided by AES on an "as is" basis only. AES provides no representations and warranties, express or implied, including the implied warranties of fitness for a particular purpose, merchantability and non-infringement. Except as explicitly stated otherwise, any notices of any dispute with respect to these Terms of Use or document shall be given by mail to AES Geo Energy OOD, 72 Ljuben Karavelov Street, Sofia 1142, Bulgaria. Any disputes arising out of your use of this document shall be governed in all respects by the laws of Bulgaria. Both parties submit to the jurisdiction of the Court of Arbitration at the Bulgarian Chamber of Commerce and Industry in compliance with its rules for litigation based on arbitration agreements. Copyright © AES Geo Energy 2009. All rights reserved.
3
Contents
SUMMARY ......................................................................................................................................... 4
INTRODUCTION .................................................................................................................................. 5
METHODS .......................................................................................................................................... 6
THE STUDY AREA ................................................................................................................................ 6
STUDY DURATION AND EQUIPMENT .................................................................................................. 6
DIURNAL RADAR OBSERVATIONS ...................................................................................................... 7
NOCTURNAL RADAR OBSERVATIONS ................................................................................................. 7
BASIC VISUAL OBSERVATION PROTOCOL ........................................................................................... 7
LIST OF PARTICIPANTS IN THE OBSERVATIONS, 2012: ........................................................................ 9
SPECIFIC VISUAL OBSERVATION PROTOCOL ..................................................................................... 10
SPECIES .......................................................................................................................................... 10 NUMBER (ABUNDANCE) ..................................................................................................................... 11 DISTANCE (HORIZONTAL AND VERTICAL) OF THE FLYING FLOCKS AND SINGLE BIRDS’ TRAJECTORIES ......................... 11 FLIGHT DIRECTION ............................................................................................................................. 12 WEATHER CONDITIONS ...................................................................................................................... 12
RECORDING OF THE DATA ................................................................................................................ 13
COLLISION VICTIM MONITORING ..................................................................................................... 13
STATISTICAL METHODS .................................................................................................................... 14
TURBINE SHUTDOWN SYSTEM ......................................................................................................... 15
RESULTS ........................................................................................................................................... 16
COMPOSITION OF SPECIES AND NUMBER OF BIRDS PASSING THROUGH THE WIND PARK TERRITORY......................................................................................................................................................... 16
ALTITUDE OF AUTUMN MIGRATION ................................................................................................ 26
DIRECTION OF AUTUMN BIRD MIGRATION ...................................................................................... 30
THE RADAR DATA ............................................................................................................................. 43
SPATIAL AND TEMPORAL DISTRIBUTION OF OBSERVED ‘MAJOR’ INFLUXES OF SOARING MIGRANTS......................................................................................................................................................... 44
TURBINE SHUTDOWN SYSTEM ......................................................................................................... 45
COLLISION VICTIM MONITORING ..................................................................................................... 45
REFERENCES ..................................................................................................................................... 49

4
SUMMARY
1. This report presents the comparative results of five autumn seasons’ study of
birds at the St Nikola Wind Farm (SNWF), with a special focus on the
possible impact of SNWF on migrating birds.
2. Spatial and temporal dynamics in the numbers of different species passing
through the wind park territory during autumn migration 2012 (15 August to
30 September) are presented.
3. The data gathered from visual observations are analysed.
4. The data from the autumn monitoring in 2008, 2009, 2010, 2011 and 2012 are
used to test the potential change in species composition, numbers, altitude or
the flight direction of passing birds in autumn, as a result of SNWF’s presence.
5. The variations in numbers of species, absolute number of birds, overall
altitudes of flight and migratory direction do not indicate an adverse effect of
the wind farm on diurnal migrating birds.
6. The Turbine Shutdown System probably contributed to a reduced risk of
collision during all years of operation within infrequent periods of intensive
soaring bird migration and provided a safety mechanism to reduce collision
risk for both single birds of endangered target bird species and/or flocks
passing through the wind park territory.
7. The low number of victims of collision found in four autumn seasons in
systematic 7 day (or less) interval searches for casualties under every turbine
does not provide evidence for additional mortality caused by SNWF as a threat
to populations of any bird species migrating through the territory.
8. The data to date indicate that SNWF does not constitute a major obstacle or
threat, either physically or demographically, to important populations of
diurnal autumn migrants.

5
INTRODUCTION
In NE Bulgaria, close to the Black Sea coast, AES Geo Energy OOD constructed a
156 MW wind farm consisting of 52 turbines in 2009: the St Nikola Wind Farm
(SNWF). In autumn 2008, SNWF did not exist; in autumn 2009 the facility was built
but not operational (i.e. turbine blades were not moving), and in the autumns of 2010
and 2011 SNWF was operational. In the last eight years, several field studies have
investigated the spatial and temporal distribution of the migratory and the breeding
birds within this area. The main results of the autumn monitoring of bird migration in
the vicinity of SNWF in previous years are published at:
http://www.aesgeoenergy.com/site/Studies.html. In these studies no collision
mortality of migrating birds was found indicating a high avoidance rate of the turbines
by migrating bird species. On the other hand, strong fluctuations in numbers of
different species were correlated significantly with the wind direction especially when
westerly winds occur in the peak of soaring bird migration period. It was evident that
SNWF does not lie on the main migration route of the Via Pontica (likely because of
its proximity to the Black Sea and that it is on a cape, at Kaliakra) and only receives
major migratory ‘traffic’ when (unusual) westerly winds push birds from the main
route (Figure 1).
Figure 1. Schematic representation of the main autumnal migratory flyway - the Via
Pontica (blue arrows), and the location of SNWP (SNWF) territory in red.

6
In the previous 2011 autumn report the major question addressed was whether SNWF
potentially has a barrier effect on birds migrating through the territory. The analysis of
the data until autumn 2011 showed no evidence for cumulative long term changes in
the migratory bird fauna.
The present report updates the information on spatial distribution and temporal
presence of observed species in autumn 2012 in the wind park territory as well as the
efficiency of the applied - for the third year - Turbine Shutdown System (TSS) for the
reduction of collision risk.
METHODS
The study area
SNWF is located in NE Bulgaria, close to the Black Sea coast near the cape of
Kaliakra. The wind farm lies between the road from the village of Bulgarevo to St.
Nikola (municipality of Kavarna), and the 1st class road E 87 Kavarna – Shabla, as
shown in previous reports (and in Fig. 2). SNWF consists mainly of arable land with
different crops (wheat, sunflower, rapeseed), intercepted with roads and wooded
shelter belts. The development area is outside the NATURA 2000 site “Kaliakra”.
Study duration and equipment
The study was carried out in the period 15 August – 30 September 2012 in the same
study period as in 2008 - 2011, covering a total of 45 days: the period of the most
intensive migration. The surveys were made during the day, in a standard interval of
time between 8 AM and 6 PM Astronomic time.
Radar observations were made permanently during the day time and for 15 minutes
per every hour of the night (20 h – 05 h) during the whole period of the survey in
2012 according to the following scanning program:

7
Diurnal Radar Observations
1. Four minutes at 30 mills, or as low as ground clutter permits (equivalent to
approximately 25-275 m elevation at 5 km distance);
2. Four minutes at 80 mills (equivalent to 275-525 m at 5 km distance);
3. Four minutes at 130 mills (equivalent to 525-775 m at 5 km distance);
4. Four minutes at 180 mills (equivalent to 775-1025 m at 5 km distance);
5. The magnetron then rested for one minute, and then the cycle was
recommenced.
Nocturnal Radar Observations
1. Four minutes at 30 mills; (equivalent to approximately 25-275 m elevation at 5
km distance);
2. Four minutes at 150 mills (equivalent to 675-825 m at 5 km distance);
3. Four minutes at 700 mills (equivalent to 3375-3625 m at 5 km distance);
4. The magnetron then rested for 48 minutes, and then the cycle was
recommenced.
Visual observations were used in the analysis and comparison of different years and
changes in absolute numbers of birds, altitudes of flight and directional distributions,
to maintain consistency across years of study. The radar data can, nevertheless, have a
number of analytical applications as regards cross-checking of visual records and their
accumulation can allow further analyses e.g. they will be analysed in respect to the
nocturnal migration under request of AES Geo Energy. The radar was also applied in
the collision risk reduction system for correct estimation of altitude of the flocks
passing through the wind park territory.
Basic Visual Observation Protocol
The study in autumn 2012 involved direct visual survey of all passing birds from
several observation points (Figure 2). Field observations followed the census
techniques according to Bibby et al. (1992). Point counts were performed by scanning
the sky in all directions. Height estimates and distances to the birds were verified with
land mark constructions around the observation points prevously measured and
calibrated by GPS. The surveys were carried out by means of optics, every surveyor

8
having a pair of 10x binoculars and all observation points were equipped with 20 –
60x telescope, compass, GPS, and digital camera.
Figure 2. Locations of the wind farm turbines (numbered yellow dots), radar beam
and the observation points (numbered black dots). The location of the radar and its
scan was the same as in 2010 (see http://www.aesgeoenergy.com/site/Studies.html).
All observations during period of autumn migration 2008 – 2012 birds are involved in
the present comparative analysis. The basic protocol is unlikely to have made a major
difference in the records collected between years because the observation effort was
capable of coping with the volume of avian migratory traffic, and no observer was
‘swamped’ in time under the circumstances outlined by Madders and Whitfield
(2006).
All observers were qualified specialists in carrying out the surveys of bird migration
for many years including previous autumn surveys at SNWF. Some of the observers
are active members of the BSPB (BirdLife Bulgaria).

9
List of participants in the observations, 2012:
Dr Pavel Zehtindjiev
Institute of Zoology
Bulgarian Academy of Sciences
Senior Field Ornithologist
Victor Metodiev Vasilev
Senior researcher in the Faculty of Biology
University of Shumen, Bulgaria
Member of BSPB since 1992
Dr Dimitar Vladimirov Dimitrov
Institute of Biodiversity and Ecosystem Research, Bulgarian Academy of Sciences,
Member of the BSPB since 2000
Ivailo Antonov Raykov
PhD student
Museum of Natural History, Varna
Member of BSPB since 1999
Strahil Georgiev Peev
Student in Faculty of Biology
Sofia University
Karina Ivanova
Student in Faculty of Biology
Sofia University
MSc Martin Petrov Marinov
PhD student in Institute of Biodiversity and Ecosystem Research, Bulgarian Academy
of Sciences

10
Specific Visual Observation Protocol
During the visual surveys the following records of flying birds were noted by
observers:
Species and (if possible) gender and/or age;
Number;
Distance from observer;
Direction from the observation point;
Altitude;
Direction of flight (flight path);
Behaviour (notably flight behaviour) concerning existing wind farm
constructions;
Supplementary behavioural observations;
Weather conditions;
Precise position of birds simultaneously registered at the radar screen and by
observers birds were recorded in order to ascribe specific echo signatures of target
species (i.e. Pelicans, Storks and Raptors) to known species.
Species
All soaring birds, flying in the surveyors’ scope of view were identified to the level of
species, if possible, and recorded. The characteristics of gender (male or female) and
age (adult, subadult, immature, juvenile) were also recorded for certain species when
conditions allowed. Because of the difficulty in distinguishing between similar species
in harsh conditions (e.g. bad visibility, great distance, etc.), if exact identification was
not possible both possible species were recorded (e.g. Aquila pomarina / clanga or
Aquila clanga / pomarina, depending on which of the two species was more
probable). In certain cases when it was not possible to identify the bird of prey
species, the bird was recorded to the lowest possible taxonomic category (e.g. genus,
e.g. Circus sp.). When conditions did not allow identification of a bird of prey to a
lower taxonomic category it was recorded as NBP (non-identified bird of prey).

11
Number (abundance)
The surveyors counted all migrating soaring birds, flying in their scope of view,
regardless of the possibility to distinguish their species or higher taxonomic category
(as described in the previous point). When the data were recorded, single birds (or
pairs), as well as discrete flocks, were noted along with their number and species
composition. In the case of larger flocks (e.g. white stork), when the counting of
every single individual was impossible, birds were counted in groups of 5 or 10 birds
after the flock started planing to the next thermal.
For the comparative analysis of the numbers data from constant observation points
were used.
Distance (horizontal and vertical) of the flying flocks and single birds’ trajectories
Along with counting migrant soaring birds, recording the spatial location and flight
trajectories of migrants was among the most important tasks of the study. The
distance from the observation point and flight altitude was noted for each bird or
flock.
Recording flight height estimates and distances to birds was assisted by reference to
land marks near the observation points which had been previously measured and
calibrated using GPS. Additionally, all human visual observers and radar observations
were tested before observations commenced in a series of trials using a GPS device
attached to a kite, flown at various heights and distances (Photo 1 in Autumn
Monitoring Report for 2009). In each trial, the kite was independently observed (i.e.
the kite controller and observer were independent) with height and distance recorded
by the observer. These records were then compared with data on height and distance
from the GPS device attached to the kite during the same trial. Differences between
the ‘observed’ (human) records and the ‘true’ (GPS) records were then used to
calibrate subsequent estimates for any consistent biases in records of birds observed
during migration. The radar data, with precise measurements of distances and
altitudes, were also used for the calibration of visually estimated altitudes of soaring
migrants.

12
Flight direction
Flight direction was recorded as the geographic direction on which the bird or flock
was heading relative to the observation point. To facilitate definition of the flight
direction a geographic compass and GPS device was provided for every observation
point. Direction was defined whenever possible on an exact compass bearing or, for a
dispersed flock, as one of 16 possible sectors of the geographic compass (every sector
being limited to 22.5 degrees), as follows: N (north), NNE (north-northeast), NE
(northeast), ENE (east – northeast), E (east), ESE (east – southeast), SE (southeast),
SSE (south – southeast), S (south), SSW (south – southwest), SW (southwest), WSW
(west – southwest), W (west), WNW (west – northwest), NW (northwest), NNW
(north – northwest). In the database flight direction of the bird was transcribed in
degrees as a mean angle of the sector.
Weather conditions
Weather is an obvious potential influence on bird migration and the capacity to record
birds visually. Hence, the following measures were recorded:
Wind direction;
Wind strength;
Air temperature;
Cloud cover;
Rainfall;
Visibility.
The direction and strength of the wind as well as temperature were precisely measured
by the AES Geo Energy meteorological masts and kindly offered for analysis. Cloud
cover was recorded as the relative cover (in %) of the visible part of the sky. Visibility
was taken as the maximum distance at which permanent geographic landmarks could
be seen, defined and recorded in metres
Weather records were made every morning at the start of the surveys, at every full
hour subsequently, and when surveys stopped in the evening, as well as at any time

13
when a considerable change in visibility occurred due to factors like fog or mist. The
presence of factors, like fog, mist and other phenomena deteriorating the visibility
was also taken into account in analysis.
Recording of the data
All the data of the surveys were entered in a diary. The data were processed daily and
transcribed to a database designed in an Excel workbook. The protocol of primary
data processing is a modified version of the Protocol of risk and bird mortality, used
by the National Laboratory for Renewable Energy Sources of the USA (Morrison,
1998).
The diary was kept in the following manner:
1. In the morning, with the start of the surveys, the date and the exact time were
entered (the data were recorded by the astronomic hour, which is 1 hour
behind the summer hour schedule, during the whole period of the study), as
well as the values of the physical factors of the environment (weather
conditions, as described above) and the names of the surveyors.
2. When observing a migrating bird or flock, first the exact time was taken down,
the species, genus or family Latin name, (gender and age, if possible), then the
numbers, the vertical and horizontal distance from the watch point, the flight
direction. After these obligatory data, additional ones, like soaring, “chimney”
formation of flocks, landing birds with the exact location of landing, etc., were
also recorded.
Meanwhile, if changes in the weather or other interesting and/or important
phenomena should be registered, they were also entered in the diary with the
exact time of the observation.
3. In the evening, when finishing the surveys, the exact time, weather conditions
and the names of the surveyors were taken down again.
Collision Victim Monitoring
The collision monitoring methodology followed that developed in the USA for bird
collision monitoring at wind farms (Morrison 1998). The detailed description of the

14
protocol is given in the Owners Ornithological Plan. Results of the monitoring were
reported to the Regional Inspectorate of the Bulgarian Ministry of Environment and
Waters in Varna every month during the first year of the operation. A final report has
been prepared based on the results of the monitoring after one year operation period
of the wind park (March 2011).
It is well known that searches for victims of collision with operational wind turbines
fail to find all dead birds, for several reasons, with the two principal factors being
searcher efficiency (searchers fail to find all dead birds) and removal/disappearance of
dead birds before the searcher can potentially find them. Accounting for these two
potential biases can substantially improve estimates of collision mortality at
operational wind farms derived from searches around turbine bases. As described, in
number of reports, trials were undertaken in order to provide for such correction (see
details in own ornithological plan at:
http://www.aesgeoenergy.com/site/Studies.html.)
An important objective of the trials was to examine the frequency of the searches
concerning efficiency for collision victims, calibrated for the removal rate of
carcasses and check that the search interval protocol for collision victims proposed by
the EMMP (7 days apart, at every turbine) was appropriate. The 2009 and 2010 trials
during autumn were similar in their results and confirmed that the adopted protocol of
a seven day search interval during autumn migration will detect about half of all
collision victims of medium to large species (i.e. those species which are of primary
conservation concern at SNWF during autumn: migrating raptors, storks, and
pelicans).
Statistical methods
The number of observed species, individuals as well as their average altitude of flight
(by species and years) is presented in number of tables for direct comparision of the
seasons of 2008 - 2012.
The altitude of migration in different seasons was evaluated for significance by its
mean value, standard error and standard deviation in data analysis software system

15
STATISTICA (StatSoft, Inc. (2004, version 7. www.statsoft.com.). The mean flight
direction as well as its significance level, for every species and group of species was
calculated according to standard circular statistics (Batschelet 1981). Circular
statistics was performed by Oriana (Oriana - Copyright © 1994-2009 Kovach
Computing Services). This program allows comparing two or more sets of circular
distributions (directions) to determine if they differ. The tests were performed as
pairwise, where each pair of samples is compared.
Many of the basic statistical parameters are based on the concept of the mean vector.
A group of observations (or individual vectors) have a mean vector that can be
calculated by combining each of the individual vectors (the calculations are explained
in most books about circular statistics). The mean vector will have two properties; its
direction (the mean angle, µ) and its length (often referred to using the letter r). The
length will range from 0 to 1; a larger r value indicates that the observations are
clustered more closely around the mean than a lower one. Details about the Oriana
software and statistical test used are available at: http://www.kovcomp.com/
Turbine Shutdown System
The general principles, which provide a procedural checklist, were previously
described in autumn report 2010 (http://www.aesgeoenergy.com/site/Studies.html). It
should be noted that, due to the complexity of possible combinations of conditions
that may be experienced on site, the principles are not scenario based (i.e. the
potential number of scenarios, when considering all species and circumstances at any
one time, would be too numerous to prescribe).
The TSS protocol was followed in order to reduce risk during the period of intensive
migration in autumn 2012 between 15 August and 30 September. Turbine shutdowns
are ordered by the Senior Field Ornithologist or -when delegated to- field
ornithologists in case of any perceived risk, such risk as per the discretion of the
ornithologist.

16
RESULTS
Composition of species and number of birds passing through the wind park
territory
The occurrence of species across all years is presented in Table 1. A total of 113 bird
species have been observed in the wind park territory during the five consecutive
autumn seasons of 2008, 2009, 2010, 2011 and 2012. The number of all observed
species varied from 48 to 79 in different years. Most species (79) were observed in
2009 and 2012, the year when the wind park had been constructed and in the third
autumn after construction, respectively. There is no significant difference in the
number of species observed in 2008 (before the construction of the wind park) and
during the later period when the wind farm was present (2009 – 2012).
Table 1. List of species observed in the wind park territory during period 15th August
– 30th September in preconstruction (2008) and postconstruction (2009, 2010, 2011
and 2012 in grey) periods of SNWF. Hatched cells represent the years when the
species was registered in SNWF territory.
Species 2008 2009 2010 2011 2012
A. apus
A. arvensis
A. brevipes
A. campestris
A. cervinus
A. chrysaetos
A. cinerea
A. gentilis
A. heliaca
A. melba
A. nisus
A. pennata
A. pomarina
A. pratensis
A. purpurea
A. trivialis
B. buteo
B. oedicnemus
B. rufinus
B. vulpinus
C. aeruginosus

17
Species 2008 2009 2010 2011 2012
C. cannabina
C. canorus
C. carduelis
C. chloris
C. ciconia
C. coccothraustes
C. corax
C. cornix
C. coturnix
C. cyaneus
C. frugilegus
C. gallicus
C. garrulus
C. livia domestica
C. macrourus
C. monedula
C. nigra
C. olor
C. palumbus
C. pygargus
D. major
D. urbica
E. alba
E. calandra
E. garzetta
E. hortulana
F. cherrug
F. coelebs
F. eleonorae
F. naumanni
F. parva
F. peregrinus
F. subbuteo
F. tinnunculus
F. vespertinus
G. fulvus
G. glandarius
H. daurica
H. icterina
H. pallida
H. rustica
J. torquila
L. cachinnans

18
Species 2008 2009 2010 2011 2012
L. collurio
L. megarhynchos
L. melanocephalus
L. minor
L. ridibundus
M. alba
M. apiaster
M. calandra
M. cinerea
M. flava
M. migrans
M. milvus
M. striata
N. percnopterus
O. hispanica
O. isabellina
O. oenanthe
O. oriolus
O. pleschanka
P. apivorus
P. caeruleus
P. crispus
P. haliaetus
P. leucorodia
P. major
P. montanus
P. onocrotalus
P. perdix
P. pica
P. viridis
Ph. carbo
Ph. collybita
Ph. trochilus
Pl. falcinellus
R. riparia
S. borin
S. communis
S. curruca
S. rubetra
S. vulgaris
St. hirundo
Str. decaocto
Str. turtur

19
Species 2008 2009 2010 2011 2012
T. nebularia
T. tadorna
Tr. ochropus
U. epops
V. vanellus
Ph. ochrurus
Ph. phoenicurus
Number of species 76 79 48 71 79
Most variations in the species observed by year were due to single observations of
rare bird species or small passerine birds whose registration in open agricultural fields
was highly dependent on the location of observation points and surrounding
vegetation. Such observations do not allow quantitative analysis of the data becouse
of the low sample sizes involved.
25 species were observed only one year, 22 species were observed in two years and
19 species were observed in three years. Only 11 species were observed every autumn
season in the period 2008 – 2012. Among the irregularly recorded bird species, seven
were observed in 2008 before the construction and did not appear in any of the
autumns after construction of SNWF. Four passerine birds: M. cinerea, H. icterina, H.
pallida and C. corax were observed only in 2008. The first three of these are small
forest birds and open habitats of agricultural fields are not their preferred habitat. The
common raven C. corax is a non migratory species primarily found in mountainous
regions. The number of this species in Bulgaria has gradually increased in recent
years and its appearance in SNWF territory can be considered as a result of dispersal.
Anyway, none of these species can be considered as endangered or limited by the
SNWF construction and therefore their appearance only in 2008 is probably a matter
of rarity in the region and vagrancy, and not an effect of construction.
Three soaring bird species: A. heliaca, P. crispus, F. naumanni were also registered as
two, three and one individuals, respectively, only in autumn 2008. All three species
are rare in general and these sporadic observations are probably unrelated to SNWF
preconstruction and postconstruction periods. By contrast, another 27 species of birds
were not recorded in 2008, but observed in the postcostruction period. Among such
species were, for example, many birds of prey like A. chrysaetos, F. cherrug, M.

20
milvus; waders like V. vanellus, Tr. ochropus, Tr. nebularia, B. oedicnemus; herons
like A. purpurea, E. alba, E. garzetta; and many small passerine bird species. The
occurrence of these species after construction should probably not be attributed to any
beneficial effect of SNWF’s presence, but (again) to vagrancy.
Two vulture species were also registered only after construction of SNWF. Both
species are not present in any available literature concerning the region including
standard forms of nearest NATURA 2000 zones. Griffon vulture (Gyps fulvus) was
observed in autumn 2010 and 2012. This species does not qualify as threatened, near
threatened, or conservation dependent according to IUCN and is in the category as
least concern; but it is a rare species in Bulgaria. A number of individuals of this
species are currently being introduced to Bulgaria from Spain and the Bulgarian
population is increasing in number. The griffon vulture observed in autumn 2012 (Fig.
3) was identified after exchange of information with conservation organizations
working on reintroduction of the species in Bulgaria as an individual ringed in Croatia
(Cres Island on 9th
of May 2012). In autumn 2012 the same individual was observed
on three dates in the SNWF territory (15th
September, 20th September and 22
nd
September), mostly flying around the coast but including a crossing of the wind farm
on the first date.
The Egyptian vulture (Neophron percnopterus) is an Endangered (IUCN 3.1)[1] species
observed for the first time in autumn 2012, on 7th
September, making a flying circuit
close to the coast of the cape between the wind farm and the Black Sea. This species
is widely distributed from southwestern Europe and northern Africa to India.
Populations of this species have declined in the 20th century and some island
populations are endangered by hunting, accidental poisoning, and collision with
power lines. The Egyptian vulture observed near SNWF in autumn 2012 was
equipped with satellite transmitter. Immediate exchange of information with the field
team of the LIFE + project “Urgent measures to secure the survival of the Egyptian
vulture (Neophron percnopterus) in Bulgaria and Greece” allowed identification of
the bird as a juvenile from a nest near Beloslav (Varna district).

21
Figure 3. Griffon Vulture observed in the region of Kaliakra in September 2012
(Photographs courtesy of Robert Carr, UK).

22
These isolated observations do not allow an estimation of any changes in the number
of birds, flight charachteristics or behavior and we can only say that the listed species
are not typical for the region in autumn migration as they were observed only
occasionally during the period of the study (2008 – 2012). As such species are
uncommon in the study area then any impact, including a barrier effect, will clearly be
immaterial in its consequences on populations, even if it occurs.
Absolute numbers of soaring species which were most numerous, together with some
additional species with high conservation value are presented in Table 2.
Table 2. Numbers of birds recorded as passing through SNWF territory (primarily
soaring water birds and birds of prey) in five autumn seasons of preconstruction
(2008) and postconstruction (2009 – 2012) periods.
Species 2008 2009 2010 2011 2012
A. brevipes 95 210 976 290 94
A. chrysaetos 2 2 1
A. cinerea 120 259 26 40 56
A. gentilis 10 6 5 11 22
A. heliaca 2
A. nisus 44 44 70 73 44
A. pennata 5 1 9
A. pomarina 44 9 80 76 31
A. purpurea 59 11 1 7
B. buteo 146 390 180 459 238
B. oedicnemus 1 1
B. rufinus 163 151 34 30 33

23
Species 2008 2009 2010 2011 2012
C. aeruginosus 327 268 341 271 179
C. ciconia 2998 87 24980 620 2525
C. cyaneus 5 1 1
C. gallicus 29 19 18 25 60
C. macrourus 8 27 18 4 7
C. nigra 8 8 8 1 13
C. olor 1 3
C. palumbus 10 1
C. pygargus 32 17 111 151 55
E. alba 1 1
E. garzetta 7
F. cherrug 7 2 1
F. eleonorae 7 1 1
F. naumanni 1
F. peregrinus 2 4 1
F. subbuteo 48 125 120 96 66
F. tinnunculus 138 357 45 120 67
F. vespertinus 11 180 1773 63 793
G. fulvus 1 1
H. pennatus 4 3 17 4 1
M. migrans 18 6 32 17 21

24
Species 2008 2009 2010 2011 2012
M. milvus 1 1
N.percnopterus 1
P. apivorus 58 76 1549 152 115
P. crispus 4
P. haliaetus 15 13 14 12 7
P. leucorodia 117 83 56 48
P. onocrotalus 120 1190 252 277 1700
Ph. carbo 267 354 494 75 131
Ph.pygmaeus 19
Pl. falcinellus 5 738
St. hirundo 71
T. tadorna 94 3
Tr. ochropus 8 1
V. vanellus 1
Total 4855 4890 31229 2927 6585
Number of species 30 35 33 33 30
This result shows that the constructed wind park did not appear to change the
fundamental migratory habits of the species crossing the territory. The fluctuations in
soaring bird numbers were apparently highly dependent on the occurrence of western
winds in the period of migration of the most numerous species, notably the white
stork C. ciconia which can comprise 80% of all soaring migrants. The fluctuations of
white storks were the most influential on overall numbers of soaring birds during the

25
period 2008 – 2012. The numbers of all soaring bird species varied by years with no
trend for decrease after the park was constructed and started its operation (Figure 4).
Figure 4. Variations in total number of soaring birds observed during autumn
migration in five years (preconstruction and operational period) in the wind park
territory.
Other species with relatively high numbers during all five years of study included in
the present report were bee-eaters, swifts and swallows. The recording of these
species highly depends on the distance from the observer because of the small size of
the birds. Therefore visual observations on these species are limited to a few hundred
metres and can not be considered as absolute numbers for a given area and at all
altitudes. The results on the numbers of bee-eaters and swallows registered in the
period 2008 – 2012 are given in Table 3 below.
Table 3. The number of bee-eaters, swifts and swallows in SNWF in five autumn
seasons as observed in the period 15 August – 30 September.
Species 2008 2009 2010 2011 2012
A. apus 79 10 6 8 17
A. melba 515 16 536 234 47
D. urbica 1007 697 180 3

26
Species 2008 2009 2010 2011 2012
H. daurica 2 8 4 1
H. rustica 2979 4234 1735 164 5994
M. apiaster 4625 3355 5024 2107 2733
Grand Total 9207 8320 7301 2697 8795
Altitude of autumn migration
Because of the variations in species composition and number of different species (see
previous section) as well as limitations of the visual observations as a method that is
applicable mainly for registration of soaring birds, not all the observed species allow
comparative analysis of the flight altitudes in long term period of five autumn
seasons. Distribution of altitudes of birds recorded during autumn migration at SNWF
was reported in number of reports for 2008, 2009, 2010 and 2011 available at:
http://www.aesgeoenergy.com/site/Studies.html. The same species were used in order
to keep a standard statistical approach in autumn 2012.
In order to test whether there has been change in altitude distribution of birds between
the preconstruction and operational periods we have calculated average altitude per
year of all species of diurnal migrants regularly passing through the wind park
territory in autumn. The results are presented in Table 4.
Table 4. Average flight altitude, by species, of diurnal migrants observed in SNWF
across five autumn seasons, 2008-2012: the years of commercial operation of the
wind farm are highlighted in grey.
Species 2008 2009 2010 2011 2012
A. brevipes 132 171 171 160 142
A. cinerea 201 239 263 386 190
A. gentilis 181 176 230 199 151
A. nisus 150 135 162 141 119

27
Species 2008 2009 2010 2011 2012
A. pennata 150 283 251 213 295
A. pomarina 244 273 234 234 241
B. buteo 165 199 206 197 158
B. rufinus 109 200 230 183 147
C. aeruginosus 158 139 235 150 128
C. ciconia 199 174 434 347 358
C. cyaneus 136 100 10
C. gallicus 256 144 258 242 218
C. macrourus 251 90 240 195 86
C. nigra 462 325 375 350 388
C. pygargus 196 115 285 106 79
F. subbuteo 97 119 161 161 127
F. tinnunculus 49 96 109 70 79
F. vespertinus 106 106 224 289 121
M. migrans 175 183 166 152 233
P. apivorus 320 175 268 283 204
P. haliaetus 314 208 224 433
P. leucorodia 433 285 667 317
P. onocrotalus 100 159 417 400 265
Ph. carbo 180 179 277 271 254
All species 157 154 246 179 156

28
The comparative analysis showed that birds passed higher in 2010 than in the other
four autumn seasons of our study. A statistical difference was found only in average
altitudes in autumn of 2010 in respect to the average altitudes of the autumn
migrations in 2008 and 2009. The observed difference between 2010, 2011 and 2012
was marginally not significant with a relatively lower average in 2012 (Figure 5).
There is no statistically significant difference in the altitude of autumn migration in
preconstruction and operational period when all species are considered together.
Flight aletudes of soaring migrants over SNWP territoty in five autumn
seasons
Median
25%-75%
Non-Outlier Range
Outliers
Extremes
2008 2009 2010 2011 2012-100
0
100
200
300
400
500
600
700
Figure 5. Median altitude of autumn bird migration in 2008, 2009, 2010, 2011 and
2012, with measures of variance. The species included in the calculations are
presented in Table 4.
Comparison of the mean altitude of soaring birds passing through the territory in
autumn 2008 when the SNWF was not yet constructed with every autumn season of
post construction period provide is presented below (Figure 6). The altitude of autumn
migration was lower in 2008 compared to 2010 and 2011, but was the same as in 2009
and 2012.

29
Figure 6. Comparison of the mean altitude of soaring migrants passing through the
study area in autumn 2008 when SNWF was not yet constructed, with every autumn
season of the post construction period.
The bee-eaters and swallows, as mentioned before in the present report, were
analyzed despite the fact of unreliable information collected by visual observation as a
method limited by distance-to-observer. Nevertheless, the average altitude of bee-
eaters and swallows was in line with the results concerning altitude of migration of
soaring bird species (Table 5).
Table 5. Average altitude of flight during autumn migration of bee-eaters and
swallows in the period 2008 – 20012 observed in SNWF territory.
Species 2008 2009 2010 2011 2012
H. rustica 28 51 66 19 37
M. apiaster 73 68 128 71 83
Average per year 56 61 121 65 71
These analyses suggest that changes in the flight altitude of soaring migrants have had
no consistent character across years but seem unlikely to be related to the operation of

30
SNWF. Climatic factors are likely to be involved. Regardless, any energetic
consequences for migrants avoiding the turbines by way of a change in flight altitude
will be immaterial to overall migratory energy budgets (Masden et al. 2009, 2010); if
they occur. To date there is no obvious evidence that they do occur.
Direction of autumn bird migration
Taking the same 24 species of soaring birds that were relatively constantly-recorded
across years (observed in at least three of the autumn seasons: Table 4) an analysis of
flight direction across years involved 4454 observations. In this analysis each flock
was considered as a single observation (datum) even if it consisted of, for example,
1000 or more individuals. The number of data (measurements of direction) for 2008,
2009, 2010, 2011, and 2012 were, respectively, 427, 1195, 1343, 696, and 793.
The mean recorded direction of the 24 species is presented in Table 6. Superficially, it
was apparent that for all species the directional distribution of recorded flocks varied
to only a small degree across years with exception of 2009 when the observation
points were moved northward in order to test an early warning system for approaching
flocks of birds. Prevailing directions of autumn migration seem to reflect the guiding
role of the coast and do not indicate changes in migratory direction through a response
to SNWF in years when there was greater consistency in the location of observation
points.
Table 6. Mean observed flight direction of autumn migration by species in different
years. Directions are given in degrees starting from 0 (North). The species included in
the analysis are given in Table 5.
Average flight
direction
Year
Species 2008 2009 2010 2011 2012 Total
A. brevipes 172 151 185 175 179 175
A. cinerea 248 178 146 138 203 173
A. gentilis 195 162 171 180 149 163
A. nisus 218 155 186 193 174 184
A. pennata 180 150 182 165 216 187
A. pomarina 225 173 204 183 193 196
B. buteo 195 150 177 179 179 170

31
Average flight
direction
Year
B. rufinus 150 158 227 186 188 171
C. aeruginosus 197 150 191 188 175 178
C. ciconia 207 154 209 210 209 201
C. cyaneus 90 180 225 165
C. gallicus 203 150 144 151 129 148
C. macrourus 141 154 180 231 109 162
C. nigra 270 191 225 180 231 225
C. pygargus 237 148 182 183 174 182
F. subbuteo 186 148 174 196 196 177
F. tinnunculus 144 148 177 161 191 156
F. vespertinus 180 159 177 204 218 182
M. migrans 241 153 211 207 189 204
P. apivorus 227 187 201 200 208 203
P. haliaetus 161 190 168 198 169 178
P. leucorodia 180 173 195 180 178
P. onocrotalus 146 195 257 232 207
Ph. carbo 178 162 192 160 121 171
All 24 species 191 154 189 186 182 178
Table 7. Basic statistical parameters of empirical flight directions obtained from
visual observations during five autumn seasons in SNWF territory for the 24 ‘core’
soaring bird species.
Variable 2008 2009 2010 2011 2012
Number of species 23 24 23 24 22
Mean Vector (µ) 193,49° 161,115° 186,935° 188,292° 184,535°
Length of Mean
Vector (r)
0,79 0,969 0,939 0,906 0,853
Concentration 2,743 16,601 8,497 5,581 3,716
Circular Variance 0,21 0,031 0,061 0,094 0,147
Circular Standard
Deviation
39,369° 14,285° 20,295° 25,526° 32,3°
The circular (compass) distributions of flight directions of soaring birds are presented
in graphs below for each year (Figure 7).

32
2008N
E
S
W
2009N
E
S
W

33
2010N
E
S
W
2011N
E
S
W

34
2012N
E
S
W
Figure 7. Graphical representations of the average flight directions of the 24 ‘core’
soaring bird species by year: each record = 1 species (see Table 4).
Not surprisingly these graphs (Figure 7) confirm the descriptive statistics presented in
Table 6. They illustrate the exceptional nature of the 2009 records (as noted
previously, likely due to the radical change in the observation points in this year) and
no evidence for a major deviation of the migratory direction of the principle soaring
bird species as a consequence of SNWF.
Acknowledging the caveats that should be applied to the observations of hirundines
(swifts, martins, swallows) and bee-eaters, as described above, analysis of the data for
these birds may nevertheless serve to illuminate further this issue. In order to reduce
the level of subjective error in estimation of flight direction for species such as
swallows and bee-eaters, that generally flying in dispersed flocks, the data were
grouped in 16 (22.5 degree) sectors. Average results for the barn swallow and the bee-
eater are tabulated in Table 8.

35
Table 8. Average flight directions of barn swallows H. rustica and bee-eaters M.
apiaster as observed in SNWF territory across five autumn seasons.
Species 2008 2009 2010 2011 2012 Total
H. rustica 158 144 204 169 172 157
M. apiaster 191 142 192 186 187 176
Grand Total 179 143 193 184 183 171
Further analysis of bee-eater M. apiaster flight directions is presented below through
descriptive statistics (Table 9) and graphically (Figure 8).
Table 9. Basic statistical parameters of empirical flight directions obtained from
visual observations during five autumn seasons in SNWF territory for the bee-eater M.
apiaster.
Variable 2008 2009 2010 2011 2112
Data Type Angles Angles Angles Angles Angles
Number of
Observations
461 213 159 100 108
Data Grouped? Yes Yes Yes Yes Yes
Group Width (&
Number of Groups)
22,5° (16) 22,5° (16) 22,5° (16) 22,5° (16) 22,5° (16)
Mean Vector (µ) 201,237° 162,006° 199,725° 192,084° 199,845°
Length of Mean
Vector (r)
0,476 0,298 0,768 0,709 0,632
Concentration 1,081 0,624 2,516 2,062 1,649
Circular Variance 0,524 0,702 0,232 0,291 0,368
Circular Standard
Deviation
69,802° 89,164° 41,682° 47,543° 54,855°

36
2008N
E
S
W
= 5 observations
2009N
E
S
W
= 4 observations

37
2010N
E
S
W
= 3 observations
2011N
E
S
W
= 3 observations
38
Figure 8. Graphical representations of the flight directions of bee-eaters by year.
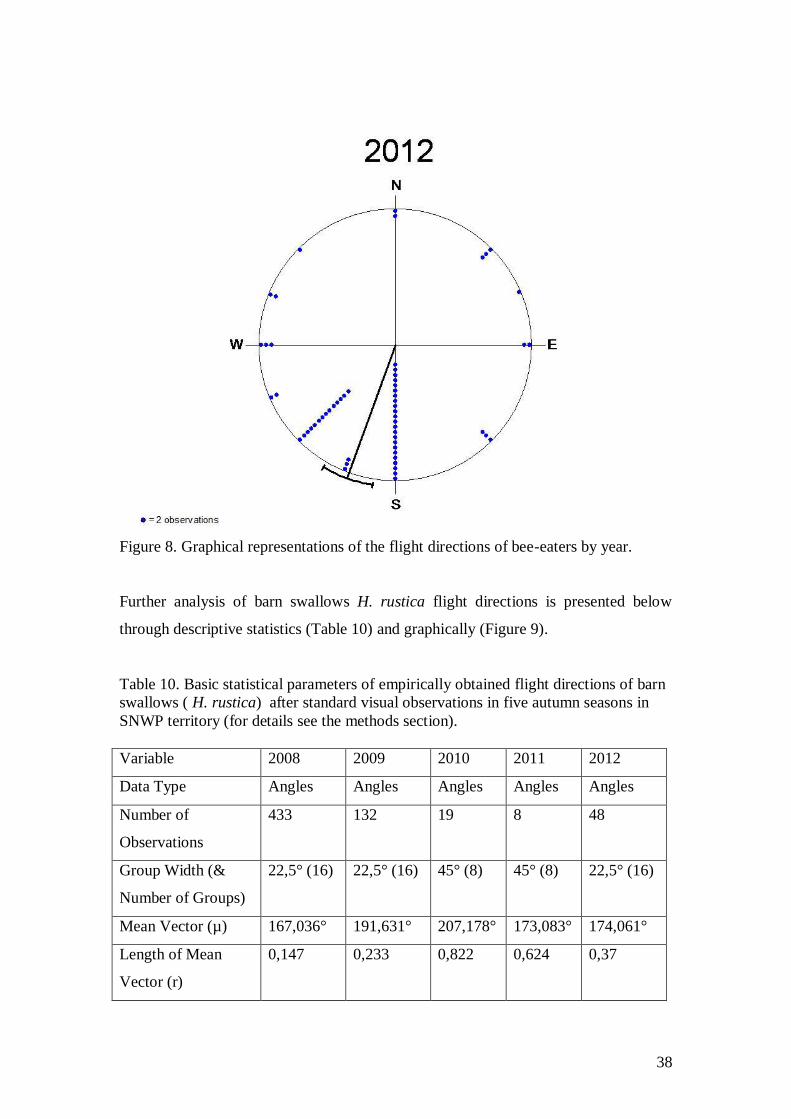
Further analysis of barn swallows H. rustica flight directions is presented below
through descriptive statistics (Table 10) and graphically (Figure 9).
Table 10. Basic statistical parameters of empirically obtained flight directions of barn
swallows ( H. rustica) after standard visual observations in five autumn seasons in
SNWP territory (for details see the methods section).
Variable 2008 2009 2010 2011 2012
Data Type Angles Angles Angles Angles Angles
Number of
Observations
433 132 19 8 48
Group Width (&
Number of Groups)
22,5° (16) 22,5° (16) 45° (8) 45° (8) 22,5° (16)
Mean Vector (µ) 167,036° 191,631° 207,178° 173,083° 174,061°
Length of Mean
Vector (r)
0,147 0,233 0,822 0,624 0,37

39
Variable 2008 2009 2010 2011 2012
Concentration 0,297 0,479 3,155 1,455 0,797
Circular Variance 0,853 0,767 0,178 0,376 0,63
Circular Standard
Deviation
112,186° 97,802° 35,9° 55,655° 80,764°
2008N
E
S
W
= 5 observations

40
2009N
E
S
W
= 3 observations
2010N
E
S
W

41
2011N
E
S
W
2012N
E
S
W
Figure 8. Graphical representations of the flight directions of barn swallows by year.

42
Circular statistics of observed directional distributions of bee-eaters and swallows
largely corresponded to those obtained from soaring birds in the same periods. Barn
swallow flight directions were relatively less concentrated which reflected the feeding
behaviour of the species during migration, when feeding activity around observation
points lead to registrations in multiple directions that did not always correspond with
the broad seasonal migration direction in autumn.
Table 11. Results of statistical analyses (Watson-Williams F-tests) comparing the
directional distributions (vectors) for all bird flocks/individuals recorded across five
autumn seasons. Significant differences are highlighted in grey.
F scores (lower half) and probabilities
(upper half)
2008 2009 2010 2011 2012
2008 ----- 0,004 0,292 0,907 0,645
2009 9,853 ----- 1,07E-04 0,004 3,92E-04
2010 1,15 19,888 ----- 0,218 0,48
2011 0,014 10,044 1,582 ----- 0,536
2012 0,217 15,92 0,511 0,391 -----
Statistical comparisons of the directional distributions between the five autumn
seasons are presented in Table 11. It is apparent from these comparisons that 2009
was an ‘exceptional’ year: mean direction of the autumn migration in 2009 was not
only significantly different to that in 2008 (preconstruction), but also when compared
to the direction in 2010, 2011 and 2012 (active operational) periods. These differences
are most likely related to location of observation points in autumn 2009, which were
moved northward in order to observe the behaviour of the approaching birds in
relation to testing the early warning system for the first time in this season.
The pooled direction of autumn migration for all species across the five years of study
does not deviate markedly from a southerly seasonal autumn migration direction (as
expected in the absence of the wind farm, and the location of study area), even though
a deviational effect of the wind farm (in some form) should have been obvious, given
the wind farm’s presence in four of the five years of study (Figure 9).

43
Figure 9. Pooled data on direction of autumn migration of all species across the five
years of the study in SNWF territory.
Overall, therefore, there is no evidence under the scale and form of analysis for a
major directional change in the flight orientation behaviour of autumn migrants
(macro-avoidance) as a result of the wind farm. At the scales considered, birds that
were observed to enter the vicinity of the wind farm did not demonstrate any macro-
avoidance of the turbines which could thereby be considered as a change of migratory
direction and, consequently, contribute to a major change in migratory route or any
detrimental effect on energy budgets.
The radar data
Location of the fixed beam Bird Scan radar in autumn 2012 was the same as in
autumn 2010, as noted earlier. The program for the day time operation of the radar
during the autumn 2012 study period provided information for flocks and single birds
in the altitudinal zone between 25 and 250 metres as in previous autumn seasons since
44
2009. All registered flocks were identified and used to calibrate the analysis of visual
observations presented above.
The data gathered during nocturnal measurements of bird migration have been
archived and will be analysed in order to compare dynamics and altitudinal
distributions. These results will be the subject of a special report concerning nocturnal
migration in spring and autumn for the period of radar operation in the wind park
territory, 2009 - 2012.
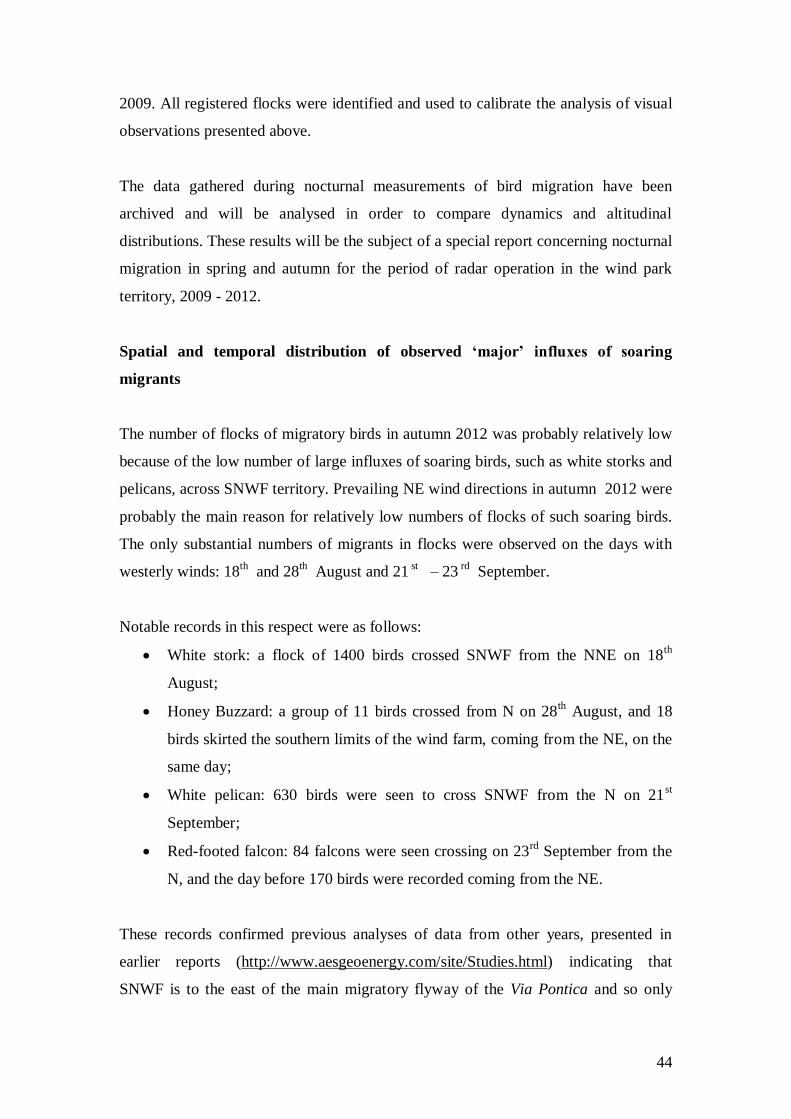
Spatial and temporal distribution of observed ‘major’ influxes of soaring
migrants
The number of flocks of migratory birds in autumn 2012 was probably relatively low
because of the low number of large influxes of soaring birds, such as white storks and
pelicans, across SNWF territory. Prevailing NE wind directions in autumn 2012 were
probably the main reason for relatively low numbers of flocks of such soaring birds.
The only substantial numbers of migrants in flocks were observed on the days with
westerly winds: 18th
and 28th August and 21
st – 23
rd September.
Notable records in this respect were as follows:
White stork: a flock of 1400 birds crossed SNWF from the NNE on 18th
August;
Honey Buzzard: a group of 11 birds crossed from N on 28th August, and 18
birds skirted the southern limits of the wind farm, coming from the NE, on the
same day;
White pelican: 630 birds were seen to cross SNWF from the N on 21st
September;
Red-footed falcon: 84 falcons were seen crossing on 23rd
September from the
N, and the day before 170 birds were recorded coming from the NE.
These records confirmed previous analyses of data from other years, presented in
earlier reports (http://www.aesgeoenergy.com/site/Studies.html) indicating that
SNWF is to the east of the main migratory flyway of the Via Pontica and so only

45
hosts major numbers of migrants when unusual westerly wind conditions shift birds
from the flyway.
Turbine Shutdown System
All of these flocks in 2012, likely shifted by a change in weather, were anticipated
climatically and then physically traced by the system of observation points and the
radar system: their presence transmitted to the Turbine Shutdown System (TSS). The
TSS was applied in these instances, and also in cases when it was known that single
birds of conservation importance were present in the vicinity of SNWF. Hence, the
TSS was applied to groups of turbines for several hours throughout the period of the
monitoring 15th
August – 30th September, but particularly in the periods 18
th and
28th August and 21
st – 23
rd September when a change in wind conditions brought
greater numbers of soaring migrants into the wind park territory.
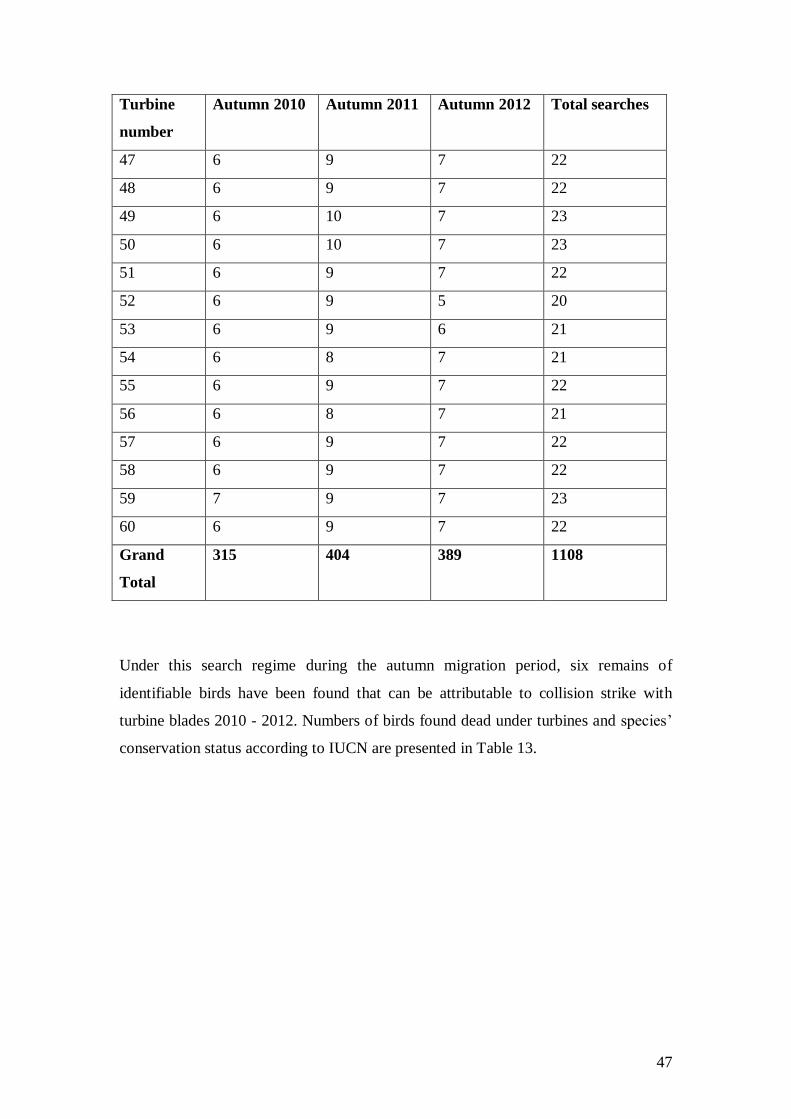
Collision victim monitoring
The numbers of turbines searched during every autumn of operational period of the
wind park are presented in Table 12.
Table 12. Number of carcass searches per autumn and turbine in the operational
period of SNWF.
Turbine
number
Autumn 2010 Autumn 2011 Autumn 2012 Total searches
8 6 8 8 22
9 6 8 7 21
10 6 7 10 23
11 6 7 9 22
12 6 10 9 25
13 6 9 9 24
14 6 9 7 22
15 6 9 7 22

46
Turbine
number
Autumn 2010 Autumn 2011 Autumn 2012 Total searches
16 6 6 9 21
17 6 6 9 21
18 6 4 8 18
19 6 8 9 23
20 6 9 10 25
21 1 6 8 15
22 6 6 8 20
23 6 6 8 20
24 6 7 7 20
25 6 2 8 16
26 6 8 8 22
27 6 2 8 16
28 6 2 5 13
29 6 8 7 21
31 1 9 7 17
32 6 9 8 23
33 6 8 7 21
34 6 8 7 21
35 7 8 7 22
36 6 9 7 22
37 6 9 9 24
38 6 9 6 21
39 6 8 7 21
40 6 7 8 21
41 6 7 6 19
42 7 7 7 21
43 11 9 7 27
44 11 7 7 25
45 6 8 8 22
46 6 9 8 23
47
Turbine
number
Autumn 2010 Autumn 2011 Autumn 2012 Total searches
47 6 9 7 22
48 6 9 7 22
49 6 10 7 23
50 6 10 7 23
51 6 9 7 22
52 6 9 5 20
53 6 9 6 21
54 6 8 7 21
55 6 9 7 22
56 6 8 7 21
57 6 9 7 22
58 6 9 7 22
59 7 9 7 23
60 6 9 7 22
Grand
Total
315 404 389 1108
Under this search regime during the autumn migration period, six remains of
identifiable birds have been found that can be attributable to collision strike with
turbine blades 2010 - 2012. Numbers of birds found dead under turbines and species’
conservation status according to IUCN are presented in Table 13.

48
Table 13. The number of carcasses found in periods of autumn migration during three
years of operation of SNWF. For details see Methods and reports on the autumn
migration period in previous years.
Species Intact bodies
found
Conservation status
according to IUCN
Acrocephalus palustris 1 Least Concern (IUCN 3.1
Delichon urbicum 2 Least Concern (IUCN 3.1
Gyps fulvus 1 Least Concern (IUCN 3.1
Lanius collurio 1 Least Concern (IUCN 3.1
Sylvia atricapilla 1 Least Concern (IUCN 3.1
Grand Total 6 Least Concern (IUCN 3.1
CONCLUSIONS
1. The numbers of species varied across years with no trend for a decrease after
SNWF was constructed and started its operation.
2. The absolute number of observed birds naturally varied by years but with no
trend for a decrease after SNWF was constructed and started its operation.
3. The altitude of flight also varied by years but with no overall trend for an
increase after SNWF was constructed and started its operation.
4. There is no evidence for change in migratory direction (avoidance) associated
with the wind park territory. Records from 2009 were exceptional and this was
probably because of a major shift in observation point location in this year. At
a gross scale, birds did not demonstrate macro-avoidance of the turbines that
could be considered as a change of migratory direction and, thereby, a change
of migratory route.
5. The occurrence of autumn migrants in all autumn seasons was strongly
correlated with typically short periods of a few days when strong westerly
winds occurred.
6. The number of collision victims recorded during the operational period of the
wind park in periods of autumn migration was extremely low, considering the

49
number of birds passing through the wind farm. Records of collision mortality
do not indicate any possibility of an adverse impact of SNWF on any bird
population.
7. The application of TSS may have had a significant mitigation effect on the
potential collisison risk and direct mortality registered in the operational
period of SNWF.
8. The substantial data collected to date indicate that the operation of SNWF
does not constitute a major obstacle or threat, either physically or
demographically, to populations of migrants passing through its environs.
REFERENCES
Batschelet E. 1981. Circular Statistics in Biology. Academic Press Inc., New York.
Bibby, C. J., Burgess, N.D. & Hill, D.H. 1992. Bird Census Techniques. London, UK:
Academic Press.
Madders, M. & Whitfield, D.P. 2006. Upland raptors and the assessment of wind farm
impacts. Ibis 148 (Suppl. 1), 43-56.
Masden, E.A., Haydon, D.T., Fox, A.D., Furness, R.W., Bullman, R., and Desholm,
M. 2009. Barriers to movement: impacts of wind farms on migrating birds. ICES J.
Mar. Sci. 66, 746–753.
Masden, E.A., Haydon, D.T., Fox, A.D., and Furness, R.W. 2010. Barriers to
movement: modelling energetic costs of avoiding marine wind farms amongst
breeding seabirds. Marine Pollution Bulletin 60, 1085–1091.
Morrison, M. 1998. Avian Risk and Fatality Protocol. Report NREL/SR-500-24997.
National Renewable Energy Laboratory. U.S. Department of Energy. 29