biotechnology november 2011 - ibef... june 2011; aranca research market overview and trends ......
TRANSCRIPT
1 1
Biotechnology
For updated information, please visit www.ibef.org
NOVEMBER
2011
2 2
Contents
Advantage India
Market overview and trends
Growth drivers
Success stories: Biocon
Opportunities
Useful information
For updated information, please visit www.ibef.org
Biotechnology NOVEMBER
2011
3 3
Biotechnology
For updated information, please visit www.ibef.org ADVANTAGE INDIA
Advantage India
NOVEMBER
2011
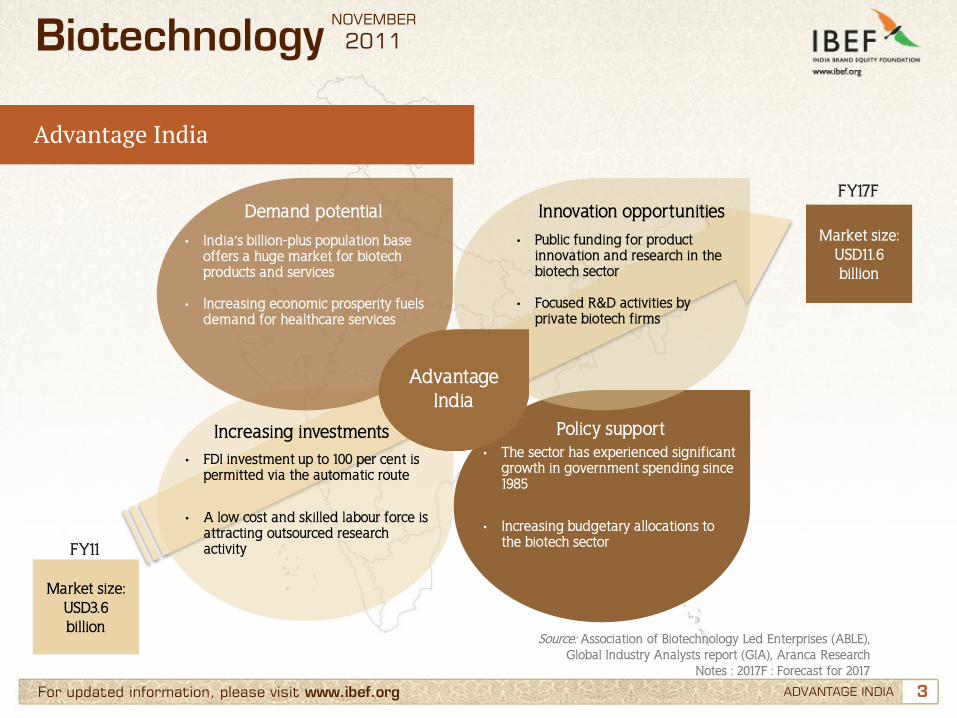
Advantage India
• India’s billion-plus population base offers a huge market for biotech products and services
• Increasing economic prosperity fuels
demand for healthcare services
• Public funding for product innovation and research in the biotech sector
• Focused R&D activities by private biotech firms
• FDI investment up to 100 per cent is permitted via the automatic route
• A low cost and skilled labour force is attracting outsourced research activity
• The sector has experienced significant growth in government spending since 1985
• Increasing budgetary allocations to the biotech sector
Market size: USD11.6 billion
FY17F
Market size: USD3.6 billion
FY11
Source: Association of Biotechnology Led Enterprises (ABLE), Global Industry Analysts report (GIA), Aranca Research
Notes : 2017F : Forecast for 2017
Demand potential Innovation opportunities
Increasing investments Policy support
4 4
Contents
Advantage India
Market overview and trends
Growth drivers
Success stories: Biocon
Opportunities
Useful information
For updated information, please visit www.ibef.org
Biotechnology NOVEMBER
2011
5 5 For updated information, please visit www.ibef.org MARKET OVERVIEW AND TRENDS
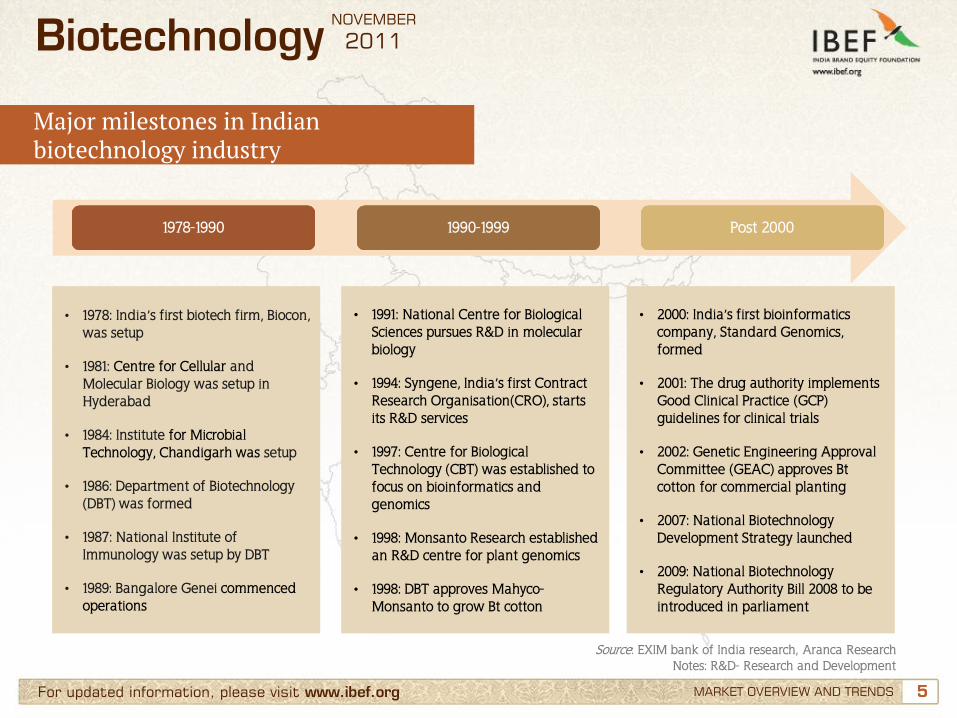
Major milestones in Indian biotechnology industry
Biotechnology NOVEMBER
2011
• 1978: India’s first biotech firm, Biocon, was setup
• 1981: Centre for Cellular and Molecular Biology was setup in Hyderabad
• 1984: Institute for Microbial Technology, Chandigarh was setup
• 1986: Department of Biotechnology (DBT) was formed
• 1987: National Institute of Immunology was setup by DBT
• 1989: Bangalore Genei commenced operations
• 1991: National Centre for Biological Sciences pursues R&D in molecular biology
• 1994: Syngene, India’s first Contract Research Organisation(CRO), starts its R&D services
• 1997: Centre for Biological Technology (CBT) was established to focus on bioinformatics and genomics
• 1998: Monsanto Research established an R&D centre for plant genomics
• 1998: DBT approves Mahyco-Monsanto to grow Bt cotton
• 2000: India’s first bioinformatics company, Standard Genomics, formed
• 2001: The drug authority implements Good Clinical Practice (GCP) guidelines for clinical trials
• 2002: Genetic Engineering Approval Committee (GEAC) approves Bt cotton for commercial planting
• 2007: National Biotechnology Development Strategy launched
• 2009: National Biotechnology Regulatory Authority Bill 2008 to be introduced in parliament
1978-1990 1990-1999 Post 2000
Source: EXIM bank of India research, Aranca Research Notes: R&D- Research and Development
6 6 For updated information, please visit www.ibef.org
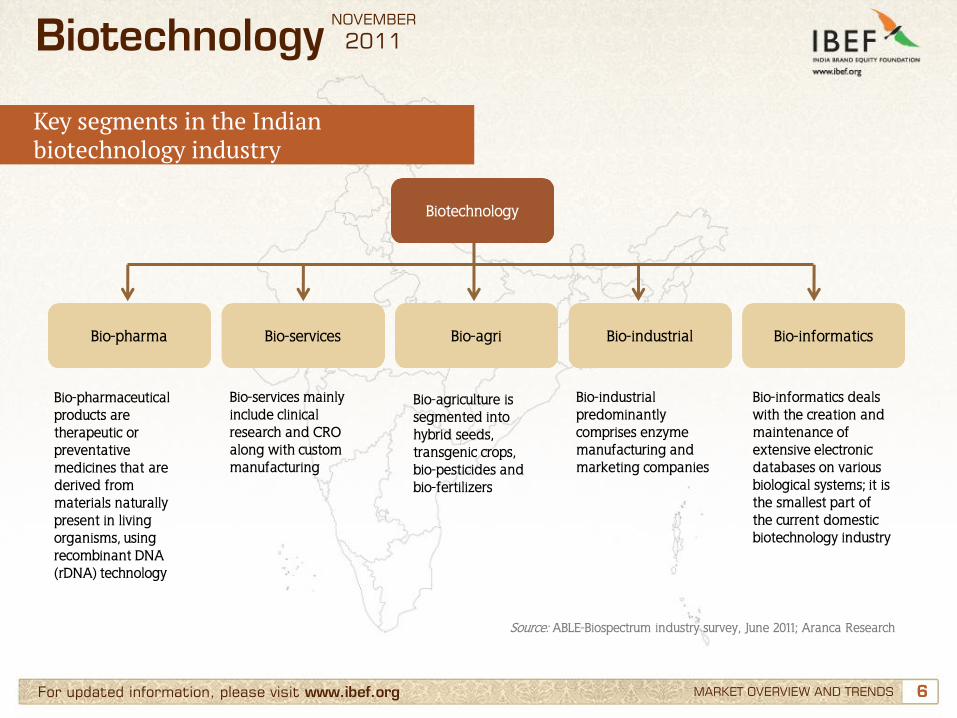
Key segments in the Indian biotechnology industry
Source: ABLE-Biospectrum industry survey, June 2011; Aranca Research
MARKET OVERVIEW AND TRENDS
Biotechnology NOVEMBER
2011
Bio-pharmaceutical products are therapeutic or preventative medicines that are derived from materials naturally present in living organisms, using recombinant DNA (rDNA) technology
Bio-services mainly include clinical research and CRO along with custom manufacturing
Bio-agriculture is segmented into hybrid seeds, transgenic crops, bio-pesticides and bio-fertilizers
Bio-industrial predominantly comprises enzyme manufacturing and marketing companies
Bio-informatics deals with the creation and maintenance of extensive electronic databases on various biological systems; it is the smallest part of the current domestic biotechnology industry
Bio-pharma Bio-services Bio-agri Bio-industrial Bio-informatics
Biotechnology
7 7 For updated information, please visit www.ibef.org
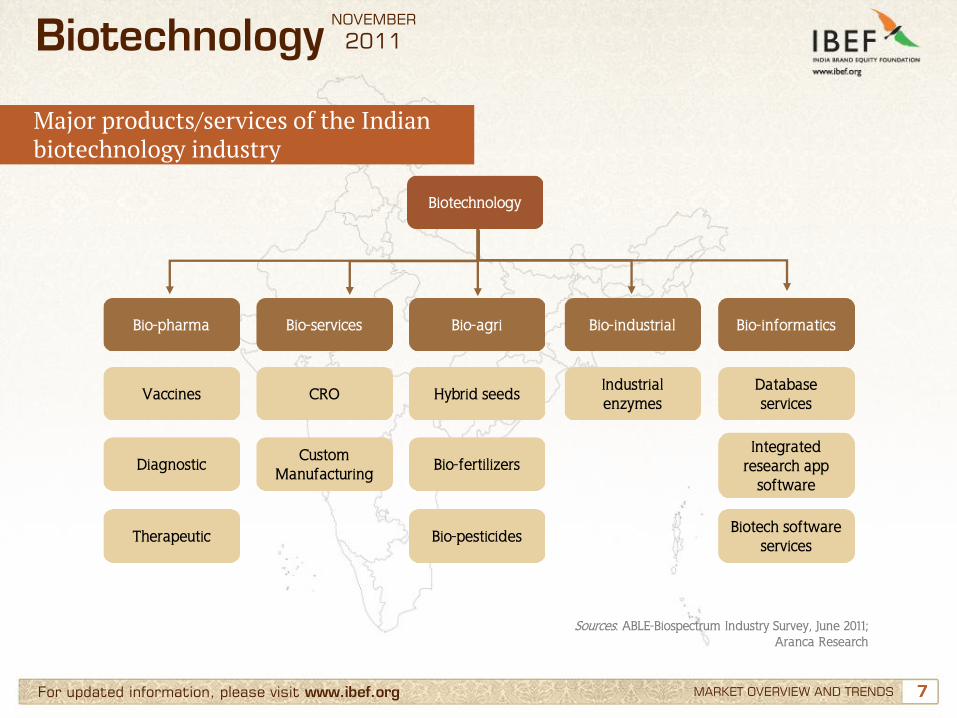
Major products/services of the Indian biotechnology industry
MARKET OVERVIEW AND TRENDS
Sources: ABLE-Biospectrum Industry Survey, June 2011; Aranca Research
Biotechnology NOVEMBER
2011
Biotechnology
Bio-pharma Bio-services Bio-agri Bio-industrial Bio-informatics
Vaccines
Diagnostic
Therapeutic
Custom Manufacturing
CRO Hybrid seeds
Bio-fertilizers
Bio-pesticides
Industrial enzymes
Database services
Integrated research app
software
Biotech software services
8 8 For updated information, please visit www.ibef.org MARKET OVERVIEW AND TRENDS
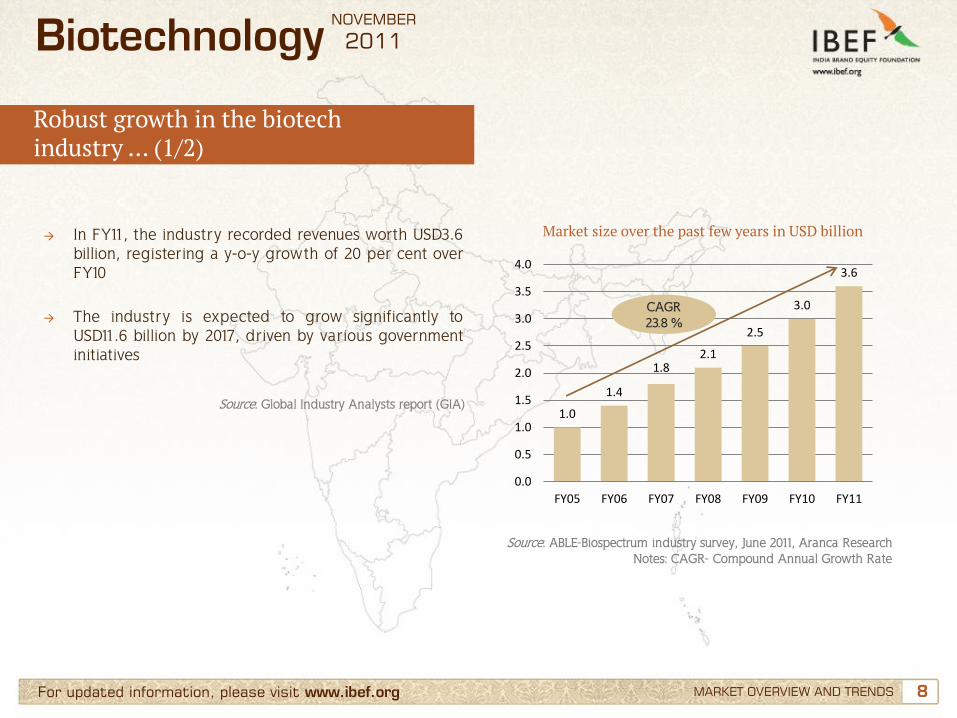
→ In FY11, the industry recorded revenues worth USD3.6 billion, registering a y-o-y growth of 20 per cent over FY10
→ The industry is expected to grow significantly to USD11.6 billion by 2017, driven by various government initiatives
Market size over the past few years in USD billion
Source: ABLE-Biospectrum industry survey, June 2011, Aranca Research Notes: CAGR- Compound Annual Growth Rate
Robust growth in the biotech industry … (1/2)
Biotechnology NOVEMBER
2011
1.0
1.4
1.8 2.1
2.5
3.0
3.6
0.0
0.5
1.0
1.5
2.0
2.5
3.0
3.5
4.0
FY05 FY06 FY07 FY08 FY09 FY10 FY11
CAGR 23.8 %
Source: Global Industry Analysts report (GIA)
9 9 For updated information, please visit www.ibef.org MARKET OVERVIEW AND TRENDS
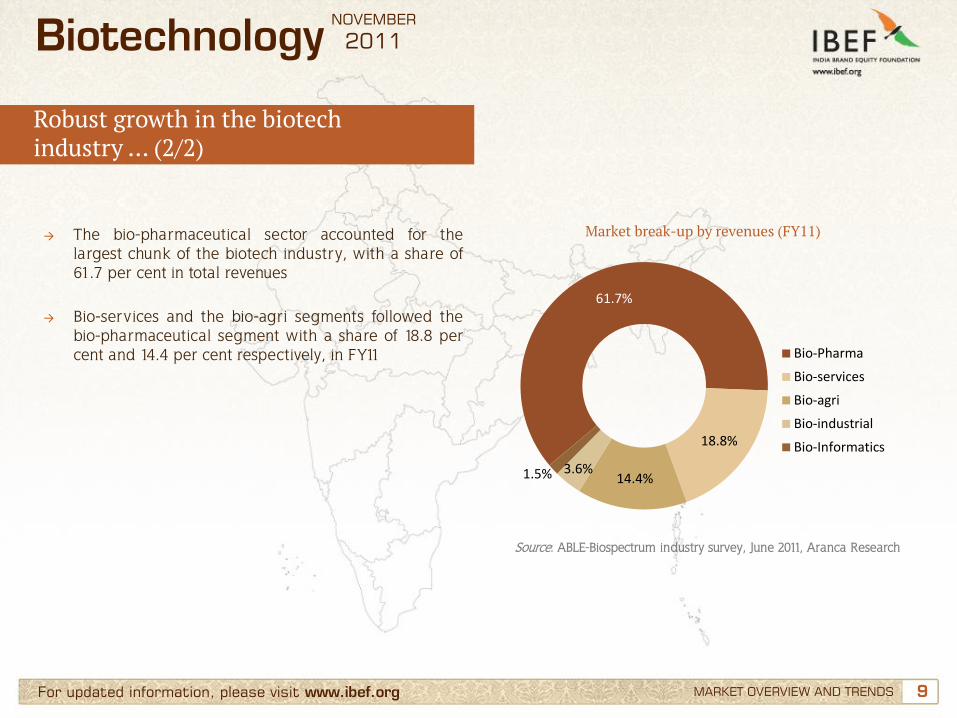
→ The bio-pharmaceutical sector accounted for the largest chunk of the biotech industry, with a share of 61.7 per cent in total revenues
→ Bio-services and the bio-agri segments followed the bio-pharmaceutical segment with a share of 18.8 per cent and 14.4 per cent respectively, in FY11
Market break-up by revenues (FY11)
Source: ABLE-Biospectrum industry survey, June 2011, Aranca Research
Robust growth in the biotech industry … (2/2)
Biotechnology NOVEMBER
2011
61.7%
18.8%
14.4% 3.6% 1.5%
Bio-Pharma
Bio-services
Bio-agri
Bio-industrial
Bio-Informatics
10 10 For updated information, please visit www.ibef.org
… driven by both domestic and export markets … (1/2)
MARKET OVERVIEW AND TRENDS
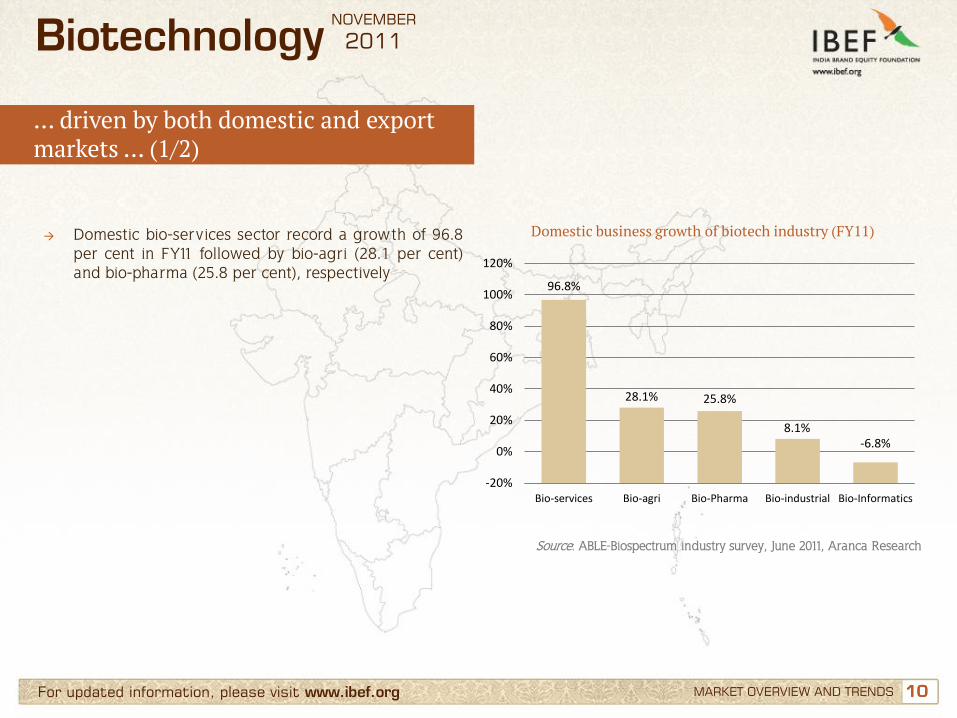
→ Domestic bio-services sector record a growth of 96.8 per cent in FY11 followed by bio-agri (28.1 per cent) and bio-pharma (25.8 per cent), respectively
Domestic business growth of biotech industry (FY11)
Source: ABLE-Biospectrum industry survey, June 2011, Aranca Research
Biotechnology NOVEMBER
2011
96.8%
28.1% 25.8%
8.1% -6.8%
-20%
0%
20%
40%
60%
80%
100%
120%
Bio-services Bio-agri Bio-Pharma Bio-industrial Bio-Informatics
11 11 For updated information, please visit www.ibef.org MARKET OVERVIEW AND TRENDS
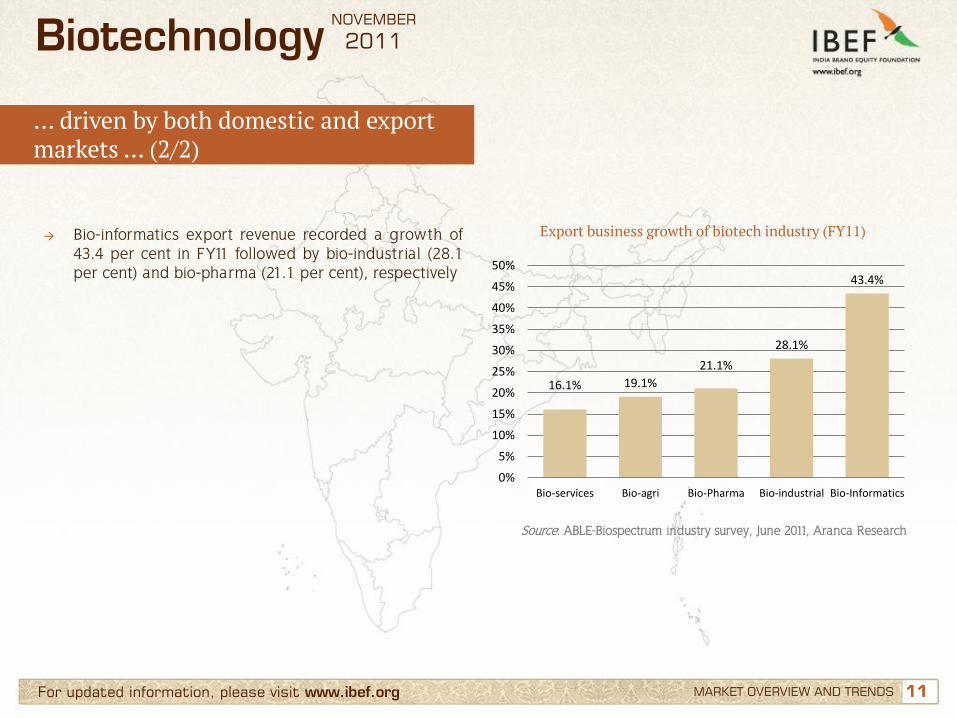
→ Bio-informatics export revenue recorded a growth of 43.4 per cent in FY11 followed by bio-industrial (28.1 per cent) and bio-pharma (21.1 per cent), respectively
Export business growth of biotech industry (FY11)
Source: ABLE-Biospectrum industry survey, June 2011, Aranca Research
… driven by both domestic and export markets … (2/2)
Biotechnology NOVEMBER
2011
16.1% 19.1%
21.1%
28.1%
43.4%
0%
5%
10%
15%
20%
25%
30%
35%
40%
45%
50%
Bio-services Bio-agri Bio-Pharma Bio-industrial Bio-Informatics
12 12 For updated information, please visit www.ibef.org
Bio-pharma leads the export earning business
MARKET OVERVIEW AND TRENDS
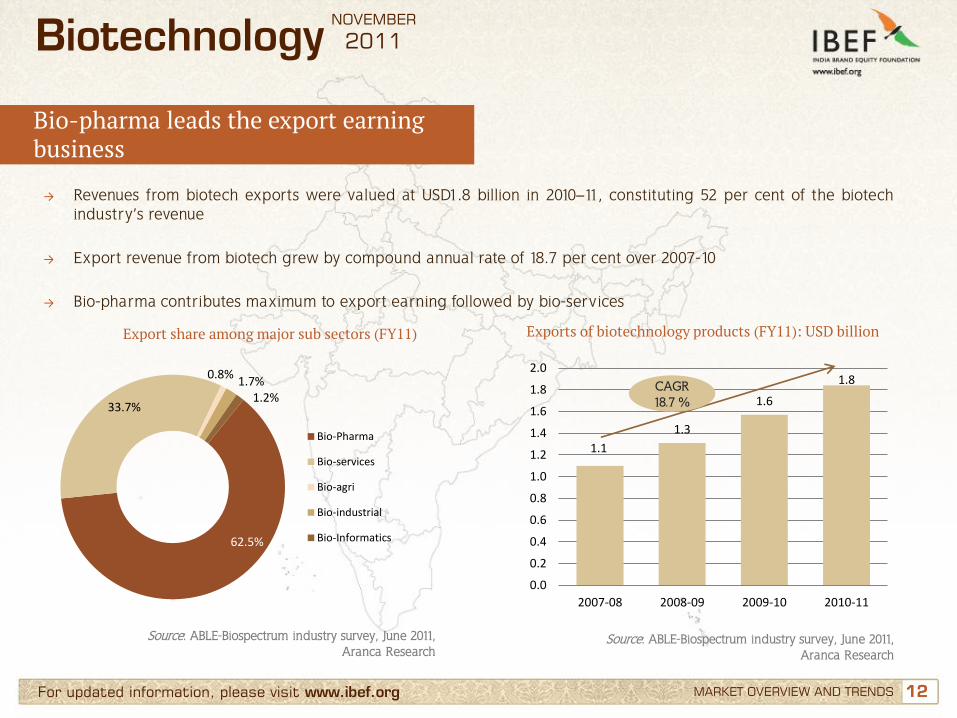
→ Revenues from biotech exports were valued at USD1.8 billion in 2010–11, constituting 52 per cent of the biotech industry’s revenue
→ Export revenue from biotech grew by compound annual rate of 18.7 per cent over 2007-10
→ Bio-pharma contributes maximum to export earning followed by bio-services
Exports of biotechnology products (FY11): USD billion
Source: ABLE-Biospectrum industry survey, June 2011, Aranca Research
Biotechnology NOVEMBER
2011
Export share among major sub sectors (FY11)
Source: ABLE-Biospectrum industry survey, June 2011, Aranca Research
62.5%
33.7%
0.8% 1.7%
1.2%
Bio-Pharma
Bio-services
Bio-agri
Bio-industrial
Bio-Informatics
1.1
1.3
1.6
1.8
0.0
0.2
0.4
0.6
0.8
1.0
1.2
1.4
1.6
1.8
2.0
2007-08 2008-09 2009-10 2010-11
CAGR 18.7 %
13 13 For updated information, please visit www.ibef.org MARKET OVERVIEW AND TRENDS
Source: ABLE-Biospectrum industry survey, June 2011,Aranca Research
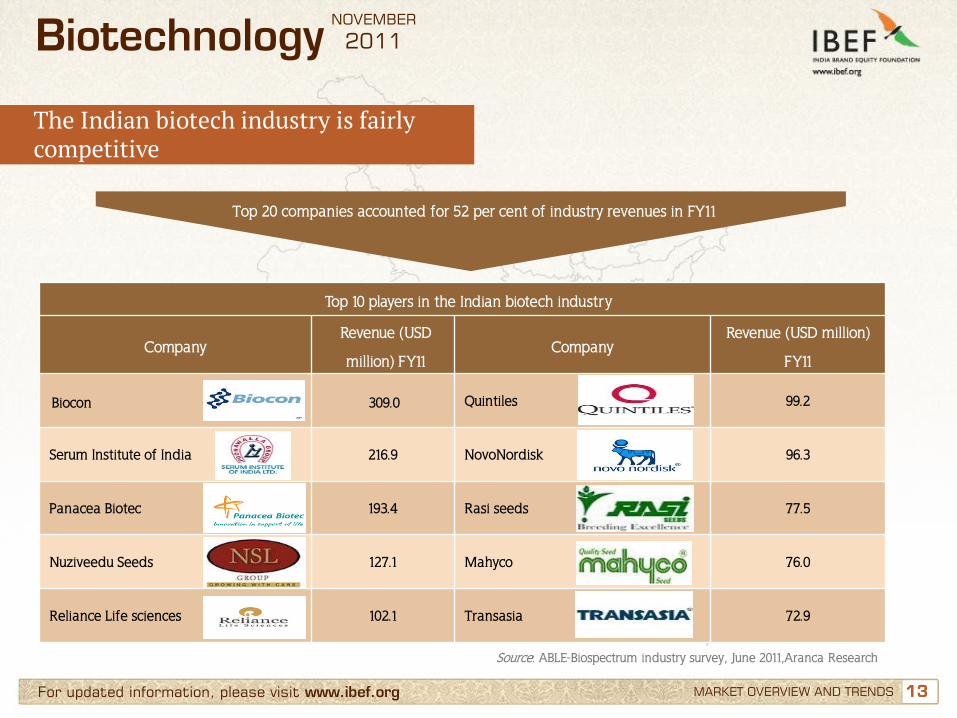
The Indian biotech industry is fairly competitive
Biotechnology NOVEMBER
2011
Top 10 players in the Indian biotech industry
Company Revenue (USD
million) FY11 Company
Revenue (USD million)
FY11
Biocon 309.0 Quintiles 99.2
Serum Institute of India 216.9 NovoNordisk 96.3
Panacea Biotec 193.4 Rasi seeds 77.5
Nuziveedu Seeds 127.1 Mahyco 76.0
Reliance Life sciences 102.1 Transasia 72.9
Top 20 companies accounted for 52 per cent of industry revenues in FY11
14 14 For updated information, please visit www.ibef.org MARKET OVERVIEW AND TRENDS
Source: Aranca Research, Indian Law Offices
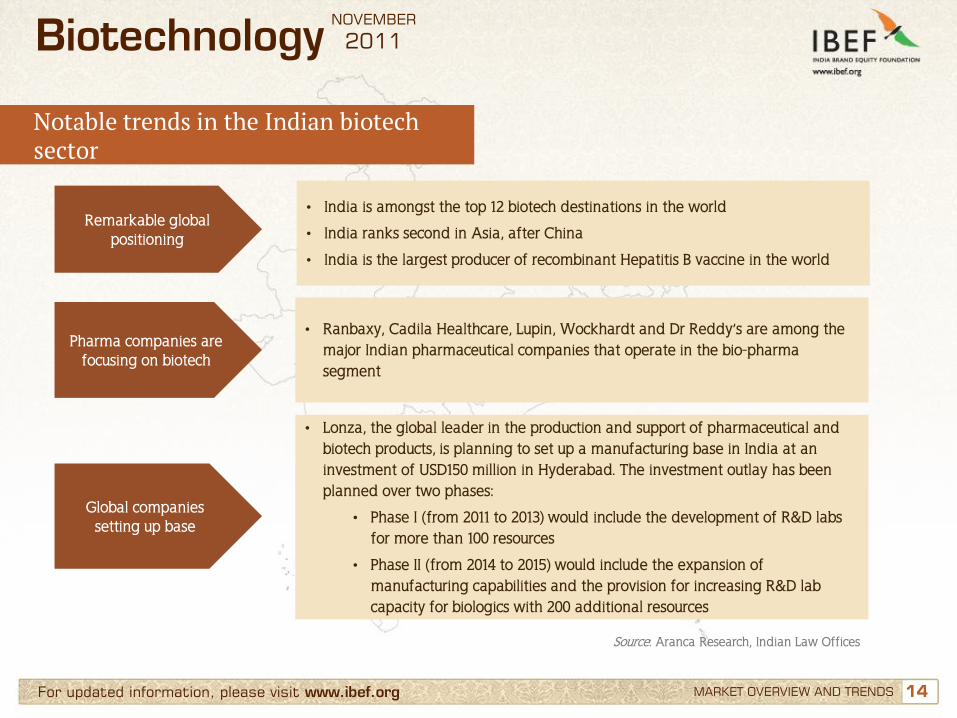
Notable trends in the Indian biotech sector
Biotechnology NOVEMBER
2011
Remarkable global positioning
Pharma companies are focusing on biotech
• Ranbaxy, Cadila Healthcare, Lupin, Wockhardt and Dr Reddy’s are among the major Indian pharmaceutical companies that operate in the bio-pharma segment
Global companies setting up base
• Lonza, the global leader in the production and support of pharmaceutical and biotech products, is planning to set up a manufacturing base in India at an investment of USD150 million in Hyderabad. The investment outlay has been planned over two phases:
• Phase I (from 2011 to 2013) would include the development of R&D labs for more than 100 resources
• Phase II (from 2014 to 2015) would include the expansion of manufacturing capabilities and the provision for increasing R&D lab capacity for biologics with 200 additional resources
• India is amongst the top 12 biotech destinations in the world
• India ranks second in Asia, after China
• India is the largest producer of recombinant Hepatitis B vaccine in the world
15 15
Contents
Advantage India
Market overview and trends
Growth drivers
Success stories: Biocon
Opportunities
Useful information
For updated information, please visit www.ibef.org
Biotechnology NOVEMBER
2011
16 16 For updated information, please visit www.ibef.org GROWTH DRIVERS
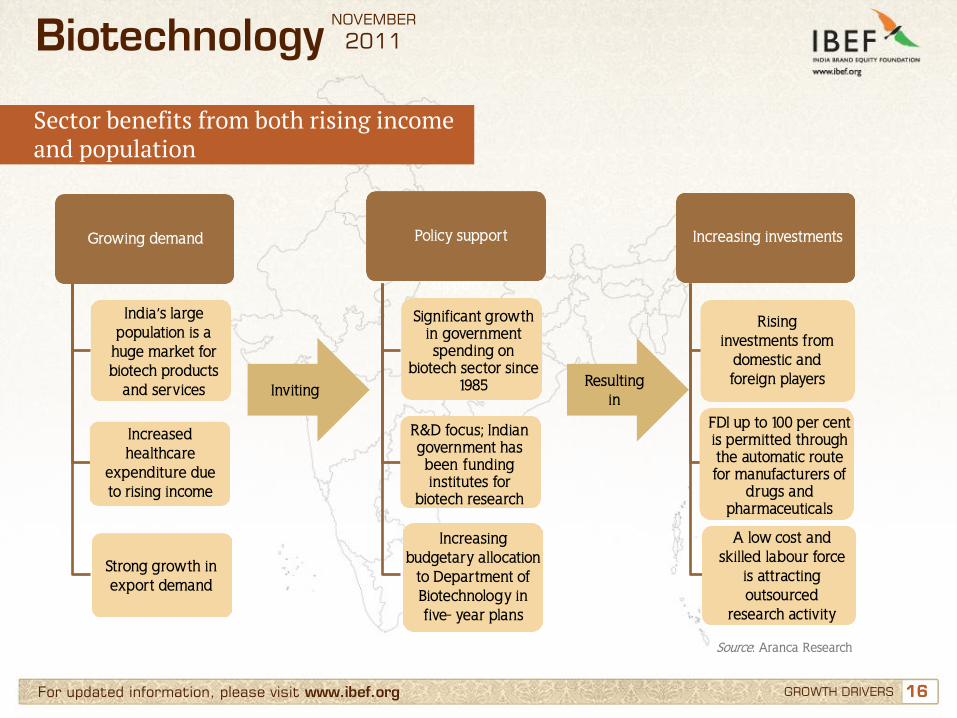
Sector benefits from both rising income and population
Biotechnology NOVEMBER
2011
Strong
government
support
Large domestic
market
Growing demand
Inviting Resulting
in
Growing demand Increasing investments Policy support
India’s large population is a
huge market for biotech products
and services
Increased healthcare
expenditure due to rising income
Strong growth in export demand
Significant growth in government spending on
biotech sector since 1985
R&D focus; Indian government has been funding institutes for
biotech research
Increasing budgetary allocation
to Department of Biotechnology in five- year plans
Rising investments from
domestic and foreign players
FDI up to 100 per cent is permitted through the automatic route for manufacturers of
drugs and pharmaceuticals
A low cost and skilled labour force
is attracting outsourced
research activity
Source: Aranca Research
17 17 For updated information, please visit www.ibef.org
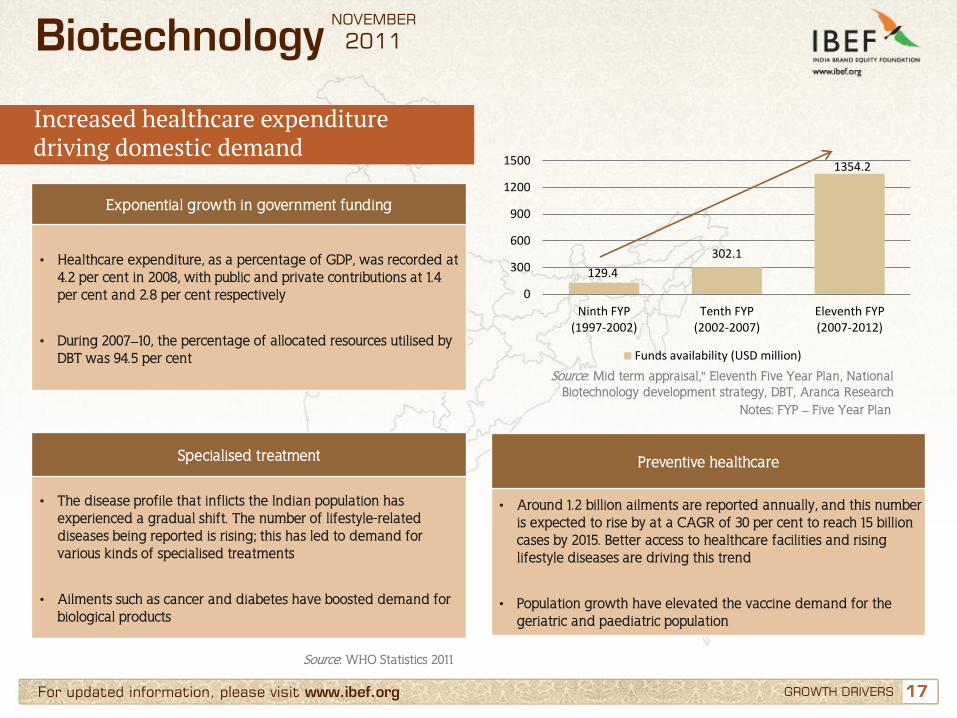
Source: Mid term appraisal," Eleventh Five Year Plan, National Biotechnology development strategy, DBT, Aranca Research
Increased healthcare expenditure driving domestic demand
GROWTH DRIVERS
Biotechnology NOVEMBER
2011
Exponential growth in government funding
• Healthcare expenditure, as a percentage of GDP, was recorded at 4.2 per cent in 2008, with public and private contributions at 1.4 per cent and 2.8 per cent respectively
• During 2007–10, the percentage of allocated resources utilised by DBT was 94.5 per cent
Preventive healthcare
• Around 1.2 billion ailments are reported annually, and this number is expected to rise by at a CAGR of 30 per cent to reach 15 billion cases by 2015. Better access to healthcare facilities and rising lifestyle diseases are driving this trend
• Population growth have elevated the vaccine demand for the geriatric and paediatric population
Specialised treatment
• The disease profile that inflicts the Indian population has experienced a gradual shift. The number of lifestyle-related diseases being reported is rising; this has led to demand for various kinds of specialised treatments
• Ailments such as cancer and diabetes have boosted demand for biological products
Source: WHO Statistics 2011
Notes: FYP – Five Year Plan
129.4
302.1
1354.2
0
300
600
900
1200
1500
Ninth FYP(1997-2002)
Tenth FYP(2002-2007)
Eleventh FYP(2007-2012)
Funds availability (USD million)
18 18 For updated information, please visit www.ibef.org
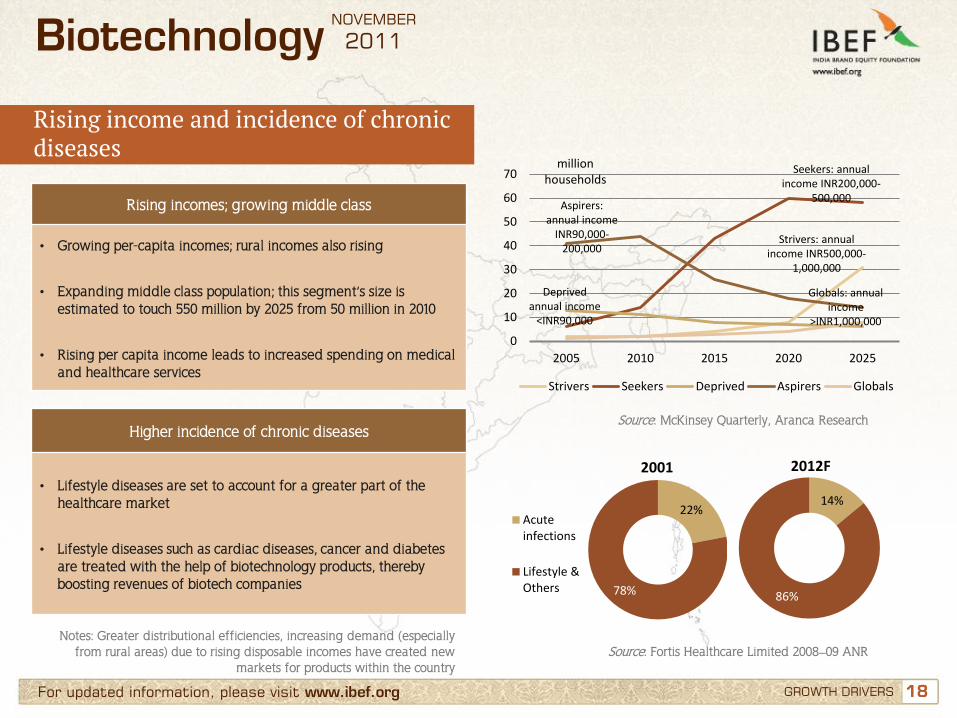
Source: Fortis Healthcare Limited 2008–09 ANR
Rising income and incidence of chronic diseases
GROWTH DRIVERS
Biotechnology NOVEMBER
2011
Rising incomes; growing middle class
• Growing per-capita incomes; rural incomes also rising
• Expanding middle class population; this segment’s size is estimated to touch 550 million by 2025 from 50 million in 2010
• Rising per capita income leads to increased spending on medical and healthcare services
Higher incidence of chronic diseases
• Lifestyle diseases are set to account for a greater part of the healthcare market
• Lifestyle diseases such as cardiac diseases, cancer and diabetes are treated with the help of biotechnology products, thereby boosting revenues of biotech companies
Notes: Greater distributional efficiencies, increasing demand (especially from rural areas) due to rising disposable incomes have created new
markets for products within the country
22%
78%
2001
Acuteinfections
Lifestyle &Others
14%
86%
2012F
0
10
20
30
40
50
60
70
2005 2010 2015 2020 2025
Strivers Seekers Deprived Aspirers Globals
Source: McKinsey Quarterly, Aranca Research
Aspirers: annual income
INR90,000-200,000
million households
Seekers: annual income INR200,000-
500,000
Deprived annual income
<INR90,000
Globals: annual income
>INR1,000,000
Strivers: annual income INR500,000-
1,000,000
19 19 For updated information, please visit www.ibef.org
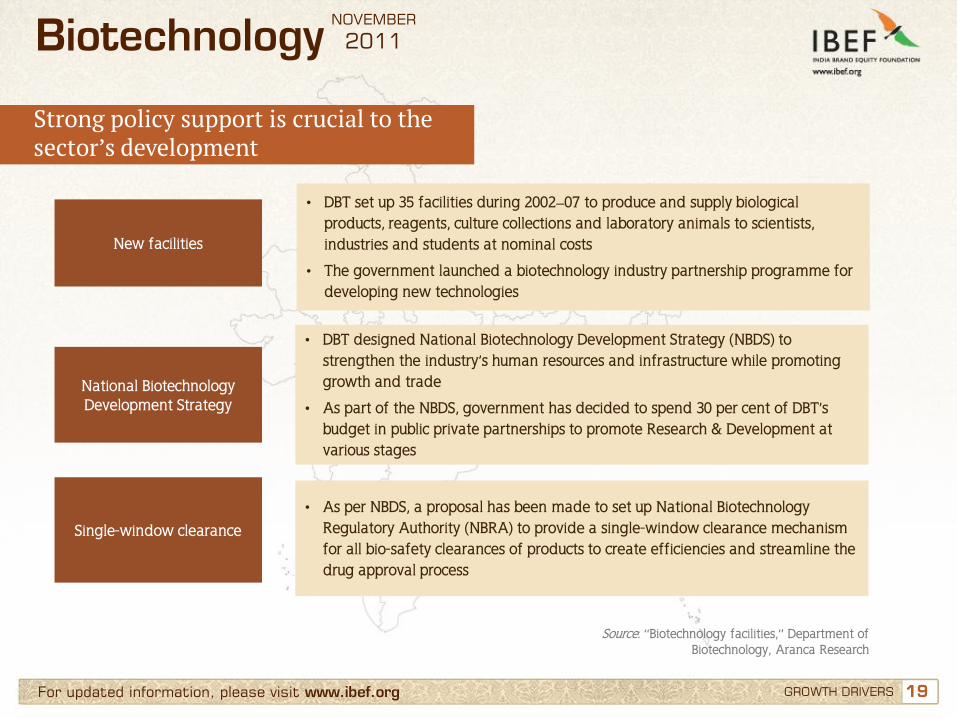
Strong policy support is crucial to the sector’s development
GROWTH DRIVERS
Biotechnology NOVEMBER
2011
Source: “Biotechnology facilities,” Department of Biotechnology, Aranca Research
• As per NBDS, a proposal has been made to set up National Biotechnology Regulatory Authority (NBRA) to provide a single-window clearance mechanism for all bio-safety clearances of products to create efficiencies and streamline the drug approval process
New facilities
National Biotechnology Development Strategy
• DBT designed National Biotechnology Development Strategy (NBDS) to strengthen the industry’s human resources and infrastructure while promoting growth and trade
• As part of the NBDS, government has decided to spend 30 per cent of DBT’s budget in public private partnerships to promote Research & Development at various stages
Single-window clearance
• DBT set up 35 facilities during 2002–07 to produce and supply biological products, reagents, culture collections and laboratory animals to scientists, industries and students at nominal costs
• The government launched a biotechnology industry partnership programme for developing new technologies
20 20 For updated information, please visit www.ibef.org
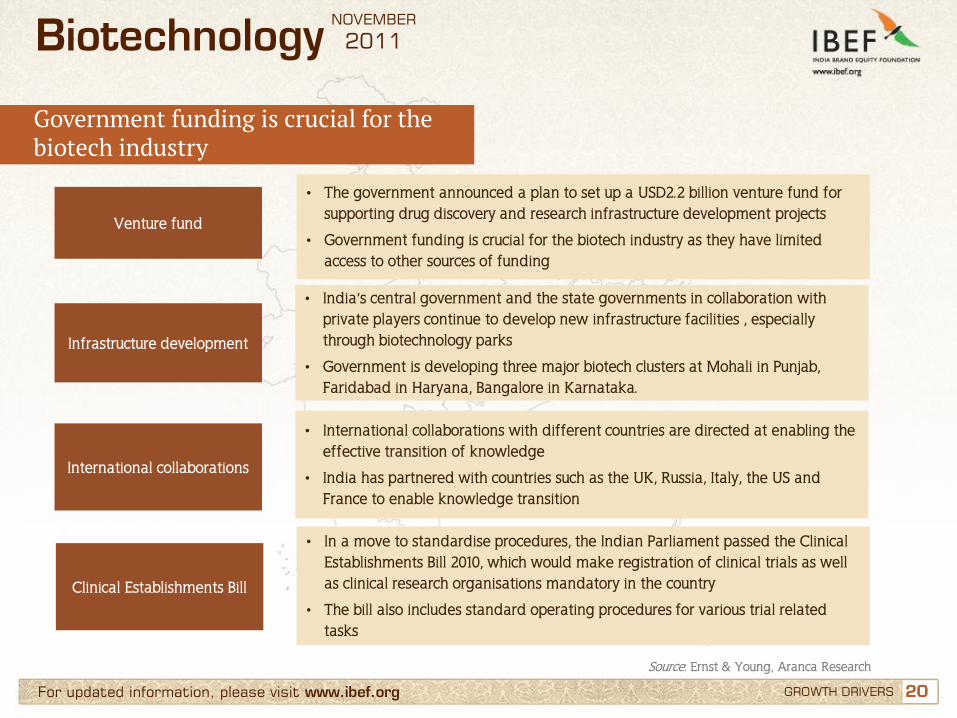
Government funding is crucial for the biotech industry
GROWTH DRIVERS
Biotechnology NOVEMBER
2011
Source: Ernst & Young, Aranca Research
Venture fund
Infrastructure development
• India’s central government and the state governments in collaboration with private players continue to develop new infrastructure facilities , especially through biotechnology parks
• Government is developing three major biotech clusters at Mohali in Punjab, Faridabad in Haryana, Bangalore in Karnataka.
International collaborations
• International collaborations with different countries are directed at enabling the effective transition of knowledge
• India has partnered with countries such as the UK, Russia, Italy, the US and France to enable knowledge transition
• The government announced a plan to set up a USD2.2 billion venture fund for supporting drug discovery and research infrastructure development projects
• Government funding is crucial for the biotech industry as they have limited access to other sources of funding
Clinical Establishments Bill
• In a move to standardise procedures, the Indian Parliament passed the Clinical Establishments Bill 2010, which would make registration of clinical trials as well as clinical research organisations mandatory in the country
• The bill also includes standard operating procedures for various trial related tasks
21 21 For updated information, please visit www.ibef.org
Source: Policy and rules,” Department of Biotechnology website, Aranca Research
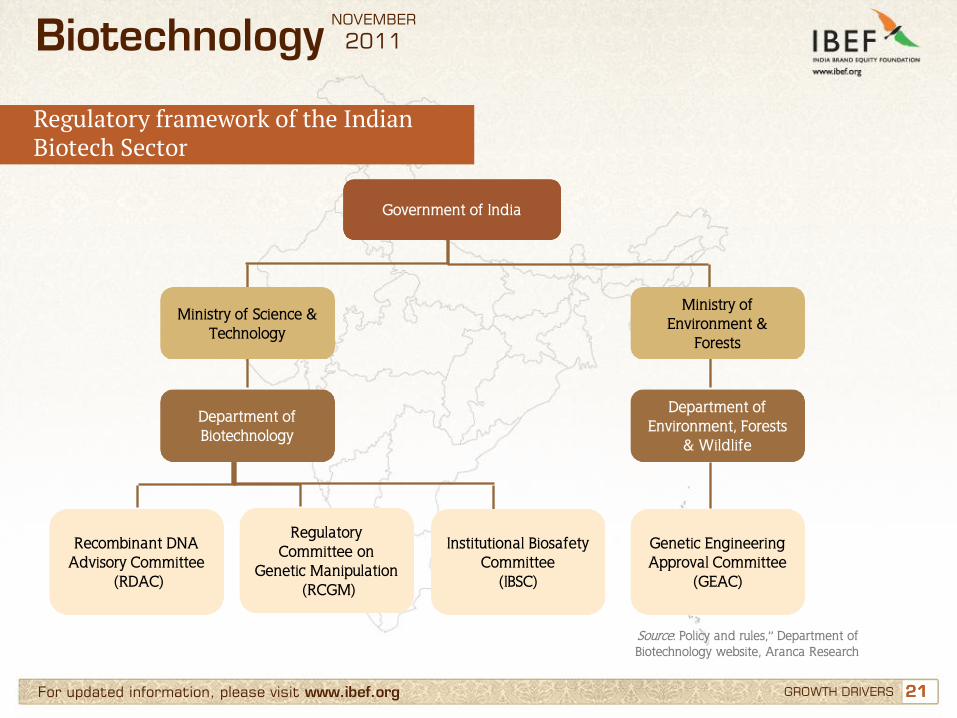
Regulatory framework of the Indian Biotech Sector
GROWTH DRIVERS
Biotechnology NOVEMBER
2011
Government of India
Ministry of Science & Technology
Ministry of Environment &
Forests
Department of Biotechnology
Department of Environment, Forests
& Wildlife
Recombinant DNA Advisory Committee
(RDAC)
Regulatory Committee on
Genetic Manipulation (RCGM)
Institutional Biosafety Committee
(IBSC)
Genetic Engineering Approval Committee
(GEAC)
22 22 For updated information, please visit www.ibef.org
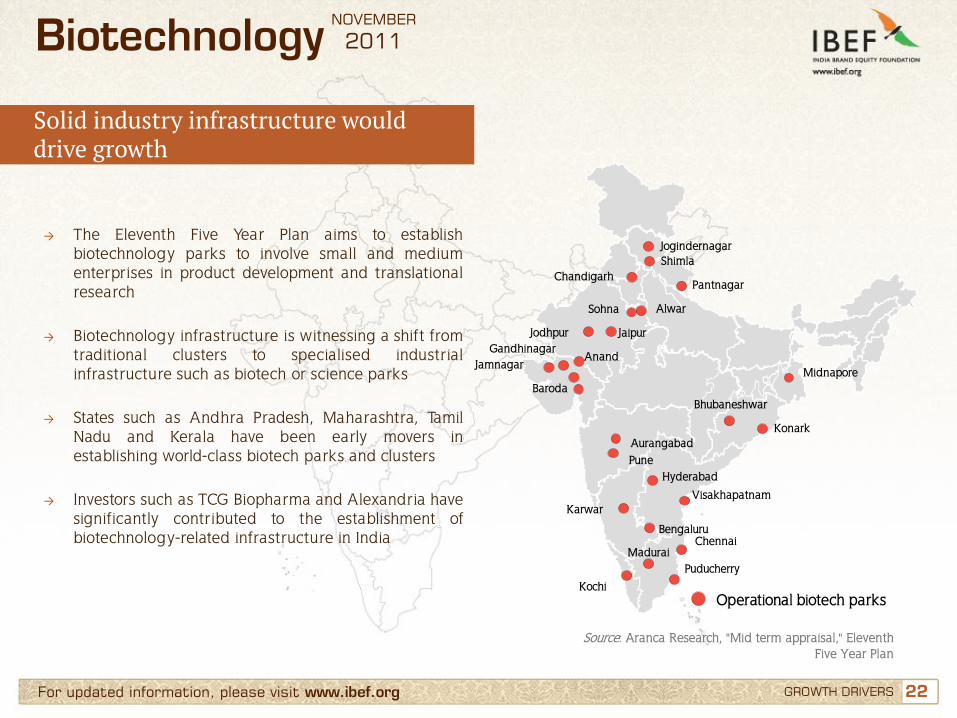
→ The Eleventh Five Year Plan aims to establish biotechnology parks to involve small and medium enterprises in product development and translational research
→ Biotechnology infrastructure is witnessing a shift from traditional clusters to specialised industrial infrastructure such as biotech or science parks
→ States such as Andhra Pradesh, Maharashtra, Tamil Nadu and Kerala have been early movers in establishing world-class biotech parks and clusters
→ Investors such as TCG Biopharma and Alexandria have significantly contributed to the establishment of biotechnology-related infrastructure in India
Source: Aranca Research, "Mid term appraisal," Eleventh Five Year Plan
Solid industry infrastructure would drive growth
GROWTH DRIVERS
Biotechnology NOVEMBER
2011
Jogindernagar Shimla
Chandigarh
Alwar Sohna
Jodhpur Jaipur Gandhinagar
Anand Jamnagar
Baroda
Aurangabad Pune
Hyderabad
Bhubaneshwar
Konark
Midnapore
Pantnagar
Bengaluru Chennai
Puducherry
Visakhapatnam
Kochi
Karwar
Madurai
Operational biotech parks
23 23 For updated information, please visit www.ibef.org
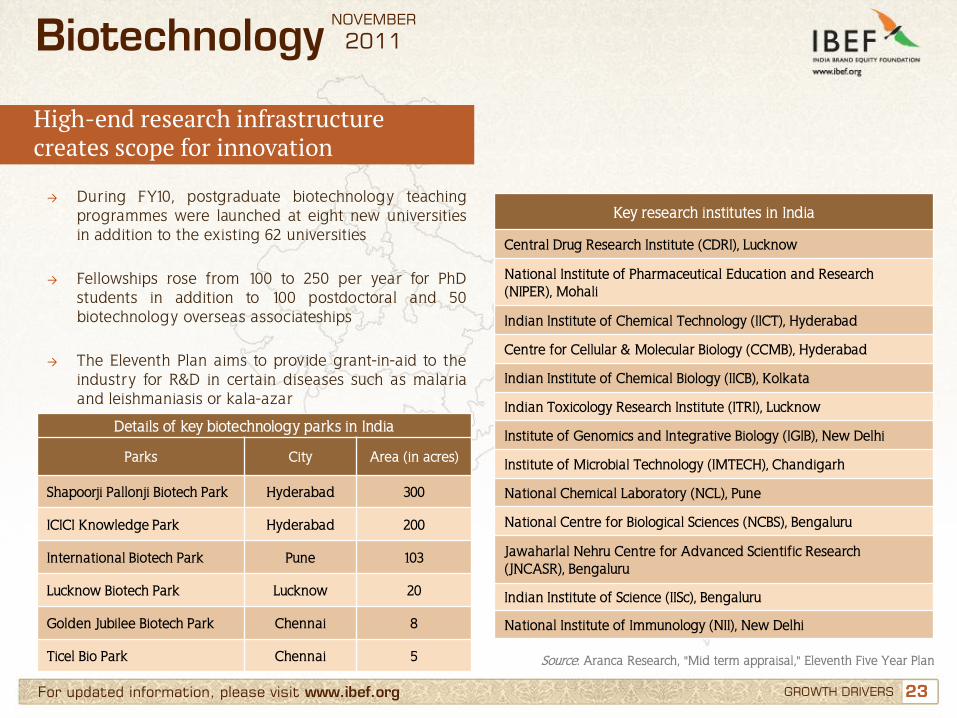
→ During FY10, postgraduate biotechnology teaching programmes were launched at eight new universities in addition to the existing 62 universities
→ Fellowships rose from 100 to 250 per year for PhD students in addition to 100 postdoctoral and 50 biotechnology overseas associateships
→ The Eleventh Plan aims to provide grant-in-aid to the industry for R&D in certain diseases such as malaria and leishmaniasis or kala-azar
High-end research infrastructure creates scope for innovation
GROWTH DRIVERS
Biotechnology NOVEMBER
2011
Details of key biotechnology parks in India
Parks City Area (in acres)
Shapoorji Pallonji Biotech Park Hyderabad 300
ICICI Knowledge Park Hyderabad 200
International Biotech Park Pune 103
Lucknow Biotech Park Lucknow 20
Golden Jubilee Biotech Park Chennai 8
Ticel Bio Park Chennai 5
Key research institutes in India
Central Drug Research Institute (CDRI), Lucknow
National Institute of Pharmaceutical Education and Research (NIPER), Mohali
Indian Institute of Chemical Technology (IICT), Hyderabad
Centre for Cellular & Molecular Biology (CCMB), Hyderabad
Indian Institute of Chemical Biology (IICB), Kolkata
Indian Toxicology Research Institute (ITRI), Lucknow
Institute of Genomics and Integrative Biology (IGIB), New Delhi
Institute of Microbial Technology (IMTECH), Chandigarh
National Chemical Laboratory (NCL), Pune
National Centre for Biological Sciences (NCBS), Bengaluru
Jawaharlal Nehru Centre for Advanced Scientific Research (JNCASR), Bengaluru
Indian Institute of Science (IISc), Bengaluru
National Institute of Immunology (NII), New Delhi
Source: Aranca Research, "Mid term appraisal," Eleventh Five Year Plan
24 24 For updated information, please visit www.ibef.org
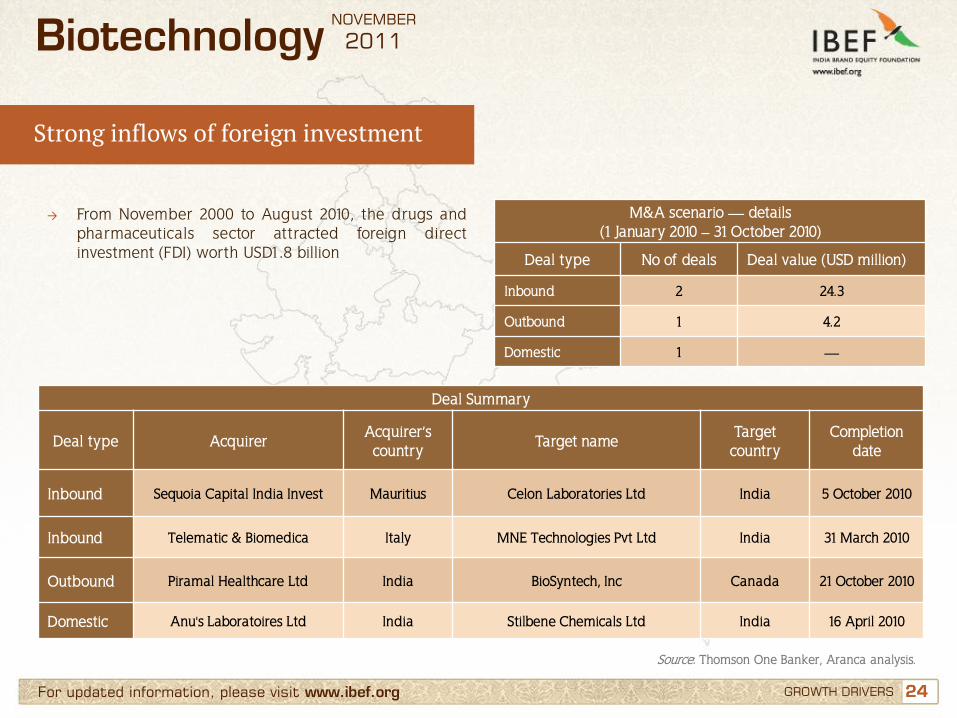
→ From November 2000 to August 2010, the drugs and pharmaceuticals sector attracted foreign direct investment (FDI) worth USD1.8 billion
Strong inflows of foreign investment
GROWTH DRIVERS
Biotechnology NOVEMBER
2011
Deal Summary
Deal type Acquirer Acquirer’s country
Target name Target country
Completion date
Inbound Sequoia Capital India Invest Mauritius Celon Laboratories Ltd India 5 October 2010
Inbound Telematic & Biomedica Italy MNE Technologies Pvt Ltd India 31 March 2010
Outbound Piramal Healthcare Ltd India BioSyntech, Inc Canada 21 October 2010
Domestic Anu's Laboratoires Ltd India Stilbene Chemicals Ltd India 16 April 2010
M&A scenario — details (1 January 2010 – 31 October 2010)
Deal type No of deals Deal value (USD million)
Inbound 2 24.3
Outbound 1 4.2
Domestic 1 —
Source: Thomson One Banker, Aranca analysis.
25 25
Contents
Advantage India
Market overview and trends
Growth drivers
Success stories: Biocon
Opportunities
Useful information
For updated information, please visit www.ibef.org
Biotechnology NOVEMBER
2011
26 26 For updated information, please visit www.ibef.org SUCCESS STORIES: BIOCON
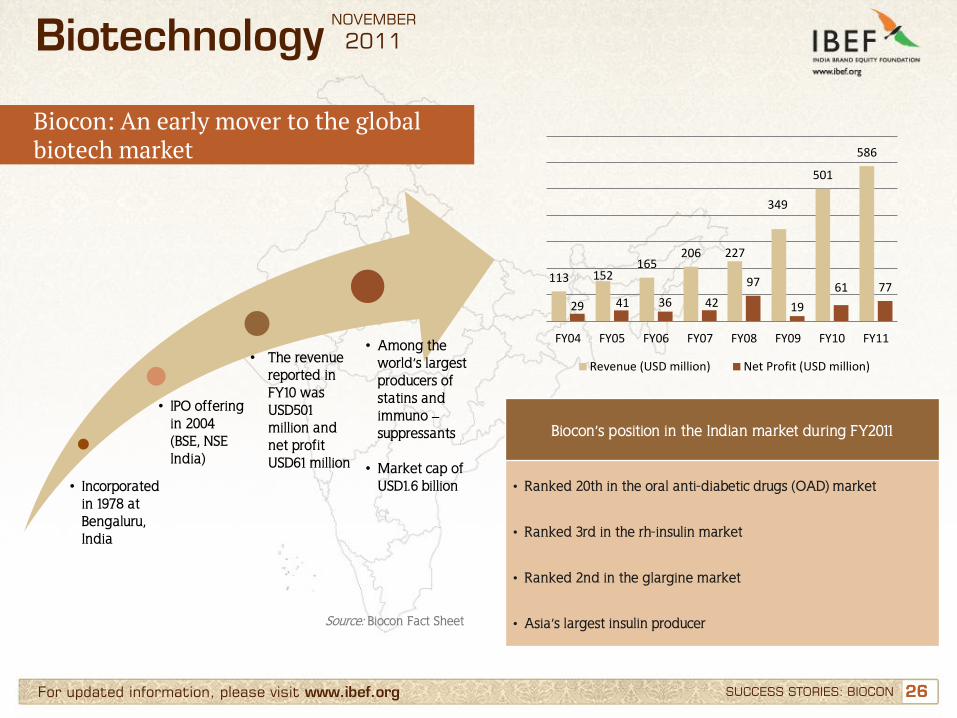
Biocon: An early mover to the global biotech market
Biocon’s position in the Indian market during FY2011
• Ranked 20th in the oral anti-diabetic drugs (OAD) market
• Ranked 3rd in the rh-insulin market
• Ranked 2nd in the glargine market
• Asia’s largest insulin producer
Biotechnology NOVEMBER
2011
113 152 165
206 227
349
501
586
29 41 36 42
97
19
61 77
FY04 FY05 FY06 FY07 FY08 FY09 FY10 FY11
Revenue (USD million) Net Profit (USD million)
• Incorporated in 1978 at Bengaluru, India
• IPO offering in 2004 (BSE, NSE India)
• The revenue reported in FY10 was USD501 million and net profit USD61 million
• Among the world’s largest producers of statins and immuno –suppressants
• Market cap of USD1.6 billion
Source: Biocon Fact Sheet
27 27
Contents
Advantage India
Market overview and trends
Growth drivers
Success stories: Biocon
Opportunities
Useful information
For updated information, please visit www.ibef.org
Biotechnology NOVEMBER
2011
28 28 For updated information, please visit www.ibef.org
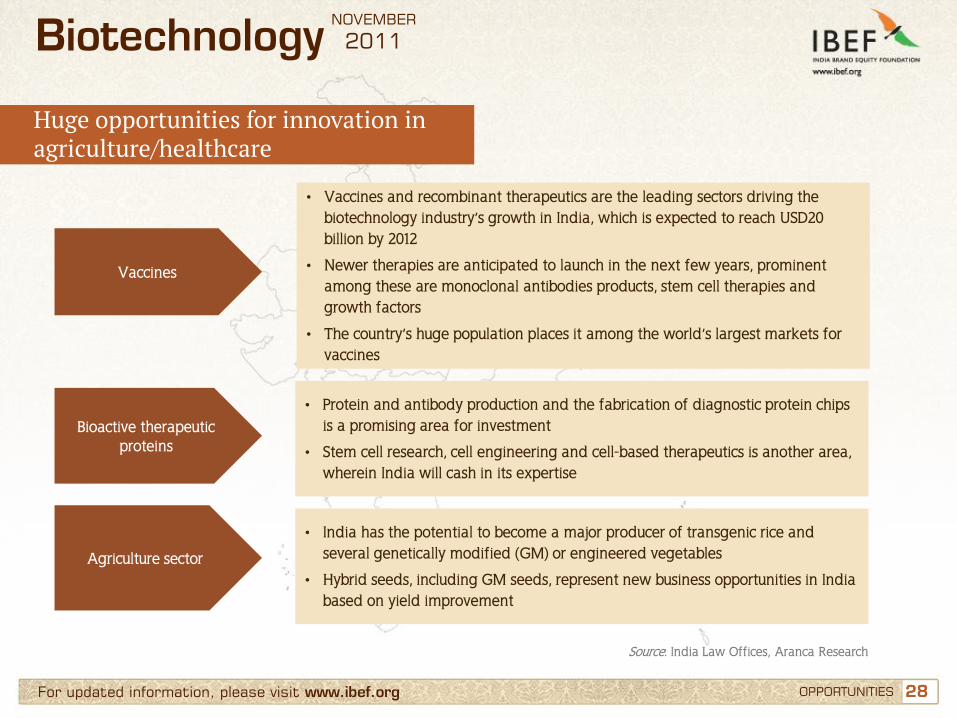
Source: India Law Offices, Aranca Research
Huge opportunities for innovation in agriculture/healthcare
Biotechnology NOVEMBER
2011
• India has the potential to become a major producer of transgenic rice and several genetically modified (GM) or engineered vegetables
• Hybrid seeds, including GM seeds, represent new business opportunities in India based on yield improvement
Vaccines
Bioactive therapeutic proteins
• Protein and antibody production and the fabrication of diagnostic protein chips is a promising area for investment
• Stem cell research, cell engineering and cell-based therapeutics is another area, wherein India will cash in its expertise
Agriculture sector
• Vaccines and recombinant therapeutics are the leading sectors driving the biotechnology industry’s growth in India, which is expected to reach USD20 billion by 2012
• Newer therapies are anticipated to launch in the next few years, prominent among these are monoclonal antibodies products, stem cell therapies and growth factors
• The country’s huge population places it among the world’s largest markets for vaccines
OPPORTUNITIES
29 29 For updated information, please visit www.ibef.org
Source: India Law Offices, Aranca Research
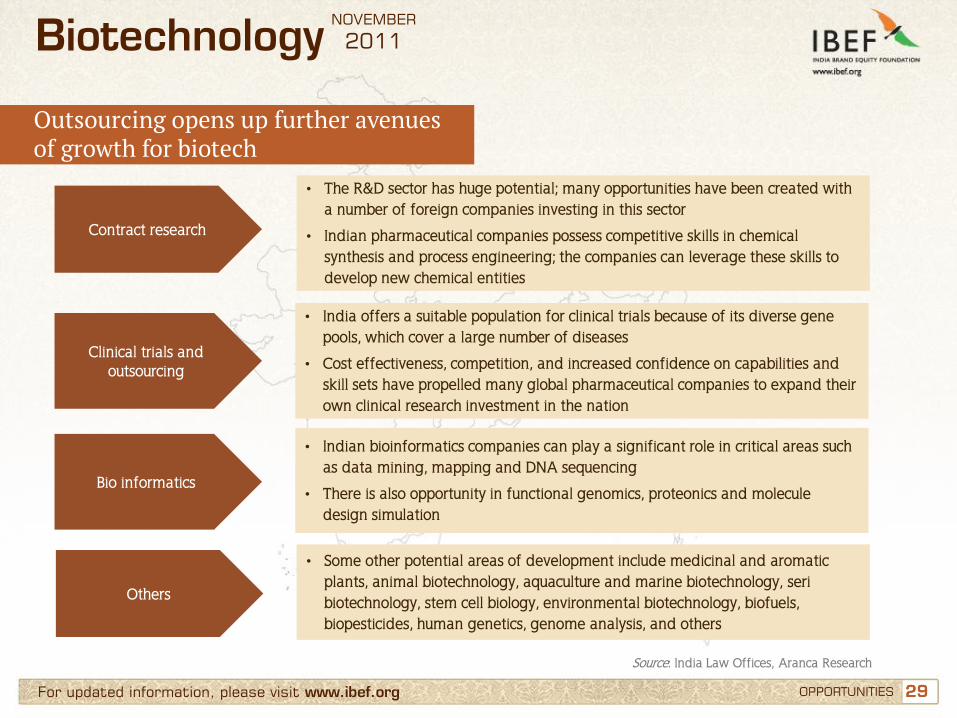
Outsourcing opens up further avenues of growth for biotech
Biotechnology NOVEMBER
2011
• Indian bioinformatics companies can play a significant role in critical areas such as data mining, mapping and DNA sequencing
• There is also opportunity in functional genomics, proteonics and molecule design simulation
Contract research
Clinical trials and outsourcing
• India offers a suitable population for clinical trials because of its diverse gene pools, which cover a large number of diseases
• Cost effectiveness, competition, and increased confidence on capabilities and skill sets have propelled many global pharmaceutical companies to expand their own clinical research investment in the nation
Bio informatics
• The R&D sector has huge potential; many opportunities have been created with a number of foreign companies investing in this sector
• Indian pharmaceutical companies possess competitive skills in chemical synthesis and process engineering; the companies can leverage these skills to develop new chemical entities
• Some other potential areas of development include medicinal and aromatic plants, animal biotechnology, aquaculture and marine biotechnology, seri biotechnology, stem cell biology, environmental biotechnology, biofuels, biopesticides, human genetics, genome analysis, and others
Others
OPPORTUNITIES
30 30
Contents
Advantage India
Market overview and trends
Growth drivers
Success stories: Biocon
Opportunities
Useful information
For updated information, please visit www.ibef.org
Biotechnology NOVEMBER
2011

31 31 For updated information, please visit www.ibef.org USEFUL INFORMATION
Industry Associations
Association of Biotechnology Led Enterprises (ABLE) # 123/C, 16th Main Road, 5th Cross, 4th Block Near Sony World Showroom/Headstart School Koramangala, Bengaluru – 560034 Phone: 91 80 41636853 25633853 E-mail: [email protected] Website: www.ableindia.org All India Biotech Association (AIBA) "VIPPS Center" 2. Local Shopping Centre Block EFGH, Masjid Moth, Greater Kailash-II, New Delhi-110048 Tel: 91 11 29211487 (Direct), 29220546/547 Fax: 91 11 29223089, 29229166 Email: [email protected] Website: www.aibaonline.com
Biotechnology NOVEMBER
2011
32 32 For updated information, please visit www.ibef.org
Glossary
→ Bt: Bacillus thuringiensis
→ CAGR: Compound Annual Growth Rate
→ CRO: Contract Research Organisation
→ DNA: Deoxyribonucleic acid
→ FYP: Five Year Plan
→ GCP: Good Clinical Practice
→ INR: Indian Rupee
→ NBTB: National Biotechnology Board
→ OAD: Oral anti-diabetic drugs
→ R&D: Research And Development
→ FY: Indian financial year (April to March)
→ So FY10 implies April 2009 to March 2010
→ USD: US Dollar
→ Conversion rate used: USD1= INR 48
→ Wherever applicable, numbers have been rounded off to the nearest whole number
USEFUL INFORMATION
Biotechnology NOVEMBER
2011
33
India Brand Equity Foundation (IBEF) engaged Aranca to prepare this presentation and the same has been prepared by Aranca in consultation with IBEF. All rights reserved. All copyright in this presentation and related works is solely and exclusively owned by IBEF. The same may not be reproduced, wholly or in part in any material form (including photocopying or storing it in any medium by electronic means and whether or not transiently or incidentally to some other use of this presentation), modified or in any manner communicated to any third party except with the written approval of IBEF. This presentation is for information purposes only. While due care has been taken during the compilation of this
presentation to ensure that the information is accurate to the best of Aranca and IBEF’s knowledge and belief, the content is not to be construed in any manner whatsoever as a substitute for professional advice. Aranca and IBEF neither recommend nor endorse any specific products or services that may have been mentioned in this presentation and nor do they assume any liability or responsibility for the outcome of decisions taken as a result of any reliance placed on this presentation. Neither Aranca nor IBEF shall be liable for any direct or indirect damages that may arise due to any act or omission on the part of the user due to any reliance placed or guidance taken from any portion of this presentation.
Disclaimer
For updated information, please visit www.ibef.org DISCLAIMER
Biotechnology NOVEMBER
2011