biosorption of cu(ii) from water by banana peel based ...jwsponline.org/uploadpic/magazine/pp 87-104...
TRANSCRIPT

* Corresponding to: [email protected]
Biosorption of Cu(II) From Water by Banana Peel Based
Biosorbent: Experiments and Models of Adsorption and Desorption
M. A. Hossain, H. H. Ngo*, W. S. Guo and T. V. Nguyen Centre for Technology in Water and Wastewater, School of Civil and Environmental Engineering, University of
Technology Sydney, Broadway, NSW 2007, Australia.
ABSTRACT
Banana peel, a discarded agricultural waste was used to produce bioadsorbent through easy and environmental
friendly processes. This banana peel based biosorbent was evaluated for adsorptive removal of copper from water
and its desorption capability. The characterisation results showed this biosorbent had very high specific surface area,
potential binding sites and functional groups. The optimal conditions for biosorption were found at pH 6.5, biosor-
bent size of less than 75µ, dose of 0.5g/100ml and 1-hour contact time. Thermodynamic analysis also indicated that
its adsorption was spontaneous. Significant desorption of copper (94%) was obtained when using 0.1N H2SO4. Both
adsorption and desorption equilibrium data were well described by Langmuir, SIPS and Koble-Corrigan models
whilst kinetics data by pseudo-first order, Elovich and Intraparticle diffusion models. Models’ parameters were
optimised by MATLAB’s non-linear modelling. All models had good fitness with the experimental data from high
R2 (0.970-1.00), low non-linear errors - RMSE (0.004-10.00) and low χ2 (0.0004-10.00). The maximum adsorption
and desorption capacities were 20.37 and 32.40 mg/g, respectively. The adsorption processes were controlled by
chemisorption. Both adsorption and desorption processes could be described by the pseudo-first order kinetic. The
potential applicability of banana peel based bioadsorbent could be further examined in a large-scale.
Keywords: Banana peel; Adsorption isotherm; Desorption isotherm; Copper removal; Regeneration
1. INTRODUCTION
It is well known that the consumption of copper contained water causes various health problems to living organism and transmits to the food, especially shellfish, liver, mush-rooms and nuts (Antunes et al., 2003). Intake of over dosed copper by humans may cause to severe mucosal irritation, hepatic and renal damage, widespread capillary damage, gas-trointestinal irritation and central nervous problems (Larous et al., 2005; Madhava Rao et al., 2006). Presence of high copper com-pound in the body may also effect on aging,
schizophrenia, mental illness, Indian child-hood cirrhosis, Wilson’s and Alzheimer’s diseases (Brewer, 2007; Faller, 2009; Hureau and Faller, 2009). Copper in the blood system may generate reactive free oxygen species and damage the protein, lipids and DNA (George J, 2010). Excessive copper in the marine system has been found to damage marine life (Van Genderen et al., 2005) and damage the gills, liver, kidneys, the nervous system and chang-ing sexual life of fishes (Flemming and Trevors, 1989). Therefore, the copper concen-tration must be reduced to acceptable level by treating the effluent from industrial wastewa-ter before entering receiving water bodies.
Adsorption technology has the potentiality to remove, recover and recycle of metals from
Journal of Water Sustainability, Volume 2, Issue 1, March 2012, 87–104
© University of Technology Sydney & Xi’an University of Architecture and Technology

88 M. A. Hossain et al. / Journal of Water Sustainability 1 (2012) 87-104
wastewaters (Bhattacharyya and Gupta, 2006). Activated carbon is a widely used adsorbent for metals removal due to its high specific surface area and affinity to metals. However, its high cost and technical prepara-tion lead to a development of new adsorbents with similar characteristics (Özcan et al., 2005). Thus, there is a scope to discover an alternative adsorbent which has low cost and high efficiency. Many researchers have investigated low-cost adsorbents originated from agro-wastes for heavy metals removal (Gao et al., 2008; Sari et al., 2008; Yang and Chen, 2008). In this aspect, an agricultural waste such as banana peel has been used as bioadsorbents for the copper adsorption. Banana peels are readily available, low cost and cheap, environment friendly bio-materials. A step was taken for preparing bioadsorbents from banana peels for removal of copper from water.
The main aims of this study were: (i) to prepare adsorbent and characterization, and (ii) to evaluate the effectiveness of banana peel for copper removal by determining the maximum adsorption capacities. The regen-eration of exhausted banana peel and recovery of copper were examined by desorption capacities. Langmuir, SIPS and Koble- Corri-gan isotherm models were used to fit the equilibrium data from adsorption. At first time by this research, the models fitness was examined with the data from desorption equilibrium of copper from banana peel based biosorbent. The adsorption and desorption kinetic characteristics were determined using pseudo-first-order, Elovich and Intra-particle diffusion models. Thermodynamic of copper adsorption were also evaluated. 2. MATERIALS AND METHODS
2.1 Materials
Copper sulphate (CuSO4.5H2O) was dissolved in 1L of milli-Q water for preparing stock
solution of copper (1000 mg/l Cu2+) and used for all experiments with required dilution with distilled water. The banana peels (Cavendish bananas) were collected from kitchen and used for whole experiments.
2.2 Methods
2.2.1 Preparation and Characterization of
Adsorbent
Collected banana peels were cut it into small pieces (< 5 mm), washed three times with tap water and three times with distilled water to remove external dirt. Wetted banana peels were kept in air for removing the free water from the surface and dried in oven for 24 hours at 105°C. The dried banana peels were grounded into powder and kept in an air tied bottle prior to the experiments. Grounded banana peel was characterised by FT-IR, SEM and BET test. 2.2.2 Effects of Experiment Conditions
The effects of experiment conditions such as pH, particle sizes, doses, contact time and temperature were investigated for copper adsorption onto banana peel. The pH depend-ent experiments were conducted in 100 ml water with 10 mg/l copper and 0.5g banana peel between 1.18 to 13.5 pH. The grounded banana peels were graded to six particles sizes i.e., 600, 420, 300, 150, 75 and < 75 µm with standard sieves. The effect of particle sizes on removal of copper were evaluated with 0.5g banana peels from each particle sizes after adding to six Erlenmeyers with 100 ml water contained 10 mg/l copper. The effect of bioadsorbent doses on equilibrium uptake of copper was investigated with adsorbent masses of 0.05, 0.1, 0.2, 0.5 and 1 g per 100 ml of water contained 1, 2, 5, 10 and 15 mg/l of copper. The Erlenmeyers were shaken for 24 hours with 120 rpm at room temperature.

M. A. Hossain et al. / Journal of Water Sustainability 1 (2012) 87-104 89
The effect of temperature and contact time on adsorption of copper were examined with different temperature (30-70°C) and time (3h) for 10 mg/l copper concentration with 0.5 g banana peels in 100 ml water. 2.2.3 Desorption Study
Desorption of copper from banana peels were studied using 8 types of eluents including tape water, milli-Q water, distilled water, 0.1N H2SO4, 0.1N HCl, 0.1N HNO3, 0.1N NaOH and 0.1 N CH3COOH. Pre-adsorbed banana peel (0.5g) was taken in 100 ml of above mentioned medium and shaken at 120 rpm for 24 hr. The eluents were filtered and tested for desorbed copper. The filtrated banana peels were washed with distilled water and again used for second time adsorption of copper. These adsorption-desorption cycles of banana peel were conducted till nine times with the best eluent. 2.2.4 Study of Adsorption and Desorption
Equilibrium
Three set of equilibrium adsorption experi-ments were conducted in 100 ml water with copper concentration ranges from 1 to 500 mg/l. Grounded banana peel (0.05, 0.5 and 1g) were added in each sets of experiments. The Erlenmeyers were shaken for 24 hours with 120 rpm at room temperature with pH be-tween 6-6.5. The water samples were then filtered and analysed in terms of Cu. The filtered banana peel were used for desorption equilibrium after washing. Three doses (0.05, 0.5 and 1g) were added in 100ml of best eluent found from desorption study and shaken at 120 rpm for 24 hours.
2.2.5 Study of Adsorption and Desorption
Kinetics
Kinetic experiments were conducted by
agitating a 1L of water with 10, 50 and 100 mg/l copper concentration and 5 g of banana peels at room temperature (20oC) with pH of 6-6.5. The water was agitated at a constant speed of 120 rpm for 3 hours. 5 ml samples were withdrawn at different time intervals and, filtered and analysed in terms of copper. Desorption kinetics experiments were per-formed with same banana peel (after filtered and washing) in 1L of best eluents found from desorption study. 2.2.6 Analysis, Calculation and Models’
Fitness
The water samples were filtered with What-mann filter GF/C (1.2µm) and copper con-centration in water were analysed by Atomic Absorption Spectrometer (ContraAA 300, Analytikjena, Germany). The equilibrium adsorptions/desorption of copper by/from adsorbent were calculated as follows:
m)CV(C
q eOe
−= (1)
where, qe, the equilibrium adsorption capacity (mg/g); Co and Ce, the initial and equilibrium copper concentrations in the water (mg/l), respectively; V, volume of used water (L); and m, the mass of dried (grounded powder) bioadsorbent (g). The equilibrium data for adsorption and desorption were fitted with Langmuir, SIPS and Koble-Corrigan isotherm models. All equilibrium model parameters were evaluated and optimised by non-linear regression using MATLAB (R2010b). The evaluation of fitness of the model equations with experimental data requires an error function with optimization (Ho et al., 2002). The models fitness was signified by the coefficient of determination (R2), non-linear error functions: the residual root mean square error (RMSE) and the chi-square test (χ2). The standard equations are as follows:

90 M. A. Hossain et al. / Journal of Water Sustainability 1 (2012) 87-104
( )
( )∑
∑
=
=
−
−−
=n
n
enen
n
n
mnen
R
1
2
1
2
2
1 (2)
( )∑
=
−−
=n
n
mnen qqn
RMSE1
2
11
( )∑
=
−=
n
n en
mnen
q
1
22χ
where, qe is the equilibrium adsorption ca-pacity found from the batch experiment, qm is the prediction from the isotherm model for corresponding to Ce and n is the number of observations. The small values of RMSE and χ2 indicate the better model fitting and the similarity of model with the experimental data respectively (Ho et al., 2002).
In the kinetics tests, the copper retained in the biosorbent phase (qt, mg/g) was calculated by the following equation:
( )m
VCCq t
t
−= 0 (5)
where: C0 and Ct are the initial and concentra-tions of the copper at ‘t’ time in the water (mg/l), V is the water volume (l) and m is the mass of dried (grounded powder) biosorbent (g). The kinetics data for adsorption and desorption were fitted to the Pseu-do-First-order, Elovich and Intra-particle diffusion models. The parameters of the models were optimised by non-linear analyses. Along with the coefficient of determination (R2), the degree of fitness of kinetics models were judged by two non-linear errors: the normalized standard deviation (NSD) and average relative error (ARE). The equations are defined as:
2
111
100i
N
i te
tmte
q
NNSD ∑
=
−
−×= (6)
∑=
−=
N
i ite
tmte
q
NARE
1
100 (7)
where, qte and qtm (mg/g) are experimental (‘e’) and model (‘m’) predicted amount of copper adsorbed onto banana peel at time‘t’ and ‘N’ is the number of observations made. The smaller values of NSD and ARE will indicate the better fitted model. 3. RESULTS AND DISCUSSION
3.1 Environment Friendly Preparation
Formations of particles’ size and shape, surface morphology as well as specific surface area of bioadsorbent fully depend on the preparation method. In addition, easy to prepare, easy to use, hazard free and environ-ment friendly treatments are the requirement for sustainable preparation of bioadsorbents. In this circumstances, this research adopted a simple and non-treated preparation method rather than the expensive and high-tech pyrolysis and non-environment friendly acid/base treated methods (Al-Asheh et al., 2000; Al-Rub, 2006; Özcan et al., 2005). The novelty of this research is that simply banana peels were cut, wash, dry and ground to powder and used for experiments. 3.2 Characterisation of Banana Peel
3.2.1 FT-IR
To understand the nature of the functional groups present in banana peel, the FT-IR spec-tra were obtained by SHIMADZU FTIR 8400S
(Kyoto, Japan). FT-IR spectra (Figure 1) dis-played a number of peaks and indicated a complex nature of the adsorbent. Bands appearing at 3620.54, between 3537.60- 3348.57, 3147.96-3102.63, 2957.97- 2850.91, 2360.97-2347.47, 1654.03, 1560.48, 1459.21-
(3)
(4)

M. A. Hossain et al. / Journal of Water Sustainability 1 (2012) 87-104 91
1411.95 and 996.28-936.48 cm-1 were as-signed to OH stretch, free hydroxyl (Alcohols, phenols), OH stretch, H-bonded (Alcohols, phenols), OH stretch (carboxylic acids), ≡C-H stretch (alkanes), C≡N stretch (Nitriles), -C=C- stretch (alkanes), N-H bend (primary amines), C-H bend (alkanes) and O-H bend (carboxylic acid or ester) respectively. Among the active groups carboxylic acid and hy-droxyl groups could play major role for copper adsorption (Annadurai et al., 2002; Memon et al., 2008). 3.2.2 Scanning Electronic Microscopy
(SEM)
Zeiss (JEOL-JSM-35CF, UK) Scanning Electronic Microscope (SEM), operating in variable pressure (VP) mode at 0.3 Tor and 20kV accelerating voltage was used for studying the surface morphology of the banana peel (Figure 2). Figure 2(a) shows the original banana peel which revealed the combination of small and large particles size, heterogeneous rough and porous surfaces with crater-like pores (Memon et al., 2008). Its surface also exhibited a micro-rough texture, which could promote the adherence of copper (Annadurai et al., 2002). Figure 2(b) shows
the BSE image of banana peel after adsorption of copper and it was changed to homogeneous surface from heterogeneous rough and porous surfaces after adsorption of copper (Albarelli et al., 2011). 3.2.3 Pore Structure and Pore Size Dis-
tribution
The BET surface areas of banana peel were determined from N2 adsorption isotherm by Nano Porosity System (Micrometrics ASAP 2020, Mirae SI, Korea). The BET surface area, Langmuir surface area and average pore diameter of banana peel were 22.59 m2/g, 4.82 m2/g and 8.71 Å, respectively. This BET area (specific surface area) was higher than chito-san flakes and pine bark (Ngah and Fatinathan, 2006; Vázquez et al., 2007) but lower than palm oil fruit shell (Hossain et al., 2012). On the contrary, the surface area was low com-pared to pyrolysis produced activated carbon (Table 4), but it could be considered as it was produced from the non-treated, low cost and simple processes. According to International Union of Pure and Applied Chemistry (IUPAC) classification, the majority of pores were mesopore (83%).
Figure 1 FTIR spectra of banana peel
750100012501500175020002500300035001/cm
0
15
30
45
60
75
90
%T
3620
.54
3537
.60
3510
.60
3421
.87
3348
.57
3147
.96
3102
.63
2957
.97
2921
.32
2850
.91
2360
.97
2347
.47
1654
.03
1560
.48 14
59.2
1
1411
.95
996.
28
936.
48

92 M. A. Hossain et al. / Journal of Water Sustainability 1 (2012) 87-104
Figure 2 BSE (backscattered electron) images of banana peel (2000× ) taken by SEM
3.3 Effect of Experimental Conditions
The experimental conditions such as pH, particle sizes, doses and contact time, thermal effect on copper adsorption were investigated for banana peel and the results are shown in Figure 3. 3.3.1 pH
pH is one of the most important parameter which controls the surface properties of adsorbents, functional groups and ionic state of metal’s species. The adsorption capacities of copper from water onto banana peel were strongly affected by the pH (Figure 3(a)). The adsorption capacities were increased from 0.7 mg/g to 1.76 mg/g with the increase in pH from pH 2 to pH 6. Copper adsorption was significantly increased between pH 4 and 6. This can explained as Cu2+, Cu(OH)+ and Cu(OH)2 species are available for adsorption at below pH 6 (Wang and Qin, 2005). The adsorption capacity decreased after pH 6 and continued to decreases till pH 12. Low ad-sorption capacities were observed at both low and high pH. At low pH, H3O
+ ion competes with Cu2+ for binding and surrounded hy-dronium ions (H+) preventing the copper ions from approaching the binding sites and it could be responsible for low adsorption capacities (Karthikeyan et al., 2007). At
higher pH, the binding site may not be acti-vated in basic condition (Demirbas, 2009). Above pH 6, the copper started precipitating as Cu(OH)2+, so the removal was not com-pletely by adsorption (Memon et al., 2008). 3.3.2 Particle Sizes
The exposure and availability of binding sites depend on particle shapes and sizes of ad-sorbent. Figure 3(b) indicates that the removal of copper was increased from 74 to 96% by decreasing the particle sizes from 600µm to <75µm. This behaviour can be attributed to the effective surface area increased as the particle size decreased (Sengil and Özacar, 2008).
3.3.3 Doses
Dose dependent experiments show that copper removal was low at lower doses and gradually increased with increasing in doses (Figure 3(c)). Latter at higher doses, the copper removal again decreased. The highest copper removal (88%) was obtained by the initial copper concentration of 10 mg/l and dose of 5g/l. The partial aggregation among the available active binding sites at higher doses and lack of active binding site at lower doses retards the copper adsorption onto banana peel (Anwar et al., 2010; Karthikeyan et al., 2007).
(a) Original banana (b) Banana peel after copper adsorption

M. A. Hossain et al. / Journal of Water Sustainability 1 (2012) 87-104 93
Figure 3 Effect of experimental condition (a) Effect of pH (b) Effect of particle sizes (c) Effect of doses (d) Effect of contact time
Table 1 Calculated value of thermodynamic parameters for the equilibrium adsorption of copper onto banana peel
T (°C) qm(mg/g) ∆G°(kJ/mol) ∆H°(kJ/mol) ∆S° (kJ/mol.°K)
Lang Tem Lang Tem Lang Tem 30 4.082 -6.945 1.950 0.057 0.011 -24.4 -1.32 40 2.203 -6.268 2.224 50 0.710 -5.521 2.391 70 0.884 -4.626 2.425
* Lang : Langmuir ; Tem : Temkin 3.3.4 Contact Time
The effect of contact time on copper adsorp-tion is shown in Figure 3(d). Figure 3(d) indicates that the rate of copper adsorption was very rapid during first 30 min, and there-after, the rate of copper removal remained stable. There were no significant increases found after 60 minutes of experiment and eventually it was the equilibrium time (Karthikeyan et al., 2007). Initially, there were large number of vacant active binding sites available at the first phase of experiment and
large amount of copper ions were bound rapidly on banana peel at a faster adsorption rate. The binding site was shortly become limited and the remaining vacant surface sites were difficult to be occupied by copper ions due to the formation of repulsive forces between the copper on the solid surface and the liquid phase (Anwar et al., 2010).
3.3.5 Thermodynamic Parameters
Normally temperature stimulates the mole-cules, functional groups and surface mor-
0
0.5
1
1.5
2
2.5
0 2 4 6 8 10 12 14
qe
(mg/l
)
pH
a. Effect pH
0
20
40
60
80
100
0 20 40 60 80 100
%re
moval
of
cop
per
Adsorbent doses g/l
c. Effect of doses
Cu: 1 mg/lCu: 2.5 mg/lCu: 5 mg/lCu: 10 mg/lCu: 15 mg/l
0
5
10
15
20
25
0 50 100 150 200q
t (m
g/g
)
Contact time (mins)
d. Effect of contact time
Co: 10 mg/l
Co: 50 mg/l
Co:100 mg/l
0
20
40
60
80
100
120
600µm 420µm 300µm 150µm 75µm <75µm
% r
emo
va
l o
f C
u
Particle sizes
b. Effect of particle sizes

94 M. A. Hossain et al. / Journal of Water Sustainability 1 (2012) 87-104
phology of the adsorbent and metals during adsorptions processes. To determine the thermal effects of copper adsorption onto banana peel, temperature variation experi-ments were conducted at 30, 40, 50 and 70°C, with an initial copper concentration between 1-200 mg/l. The experimental data show that the equilibrium adsorptions (qm) were de-creased with an increase in temperature (Table 1), suggesting that higher temperature helped to desorb the copper or retard the copper adsorption onto banana peel. From the data the thermodynamic parameters such as Gibbs free energy (∆G°), enthalpy change (∆H°), and entropy change (∆S°) were calculated. The magnitude of ∆G° (kJ/mol) was calcu-lated using the following equation:
ao RTlnKG −=∆ (8)
Where, R is universal gas constant, 0.008314 kJ/mol °K; T is absolute tempera-ture (°K) and Ka the sorption equilibrium constant from Langmuir and Temkin Isotherm and ∆H° (kJ/mol) was calculated by the following equation:
ooo ST∆G∆H ∆+= (9)
A plot of ∆G° versus T was found to be linear and both values of ∆H° and ∆S° were calculated from the slope and intercept. The thermodynamic parameters calculated for both Langmuir isotherm and Temkin isotherm are shown in Table 1. The ∆G° values were opposite in nature (-ve and +ve) calculated from Langmuir and Temkin isotherm. The negative nature of ∆G° has confirmed that the adsorption process was spontaneous in nature (Memon et al., 2008). The values of ∆G° were decreased from -6.95 to -4.63 kJ/mol for Langmuir isotherm and increased from 1.95 to 2.43 kJ/mol for Temkin isotherm at the tem-perature increases from 30 to 70°C. The positive value of ∆H° indicated that the adsorption reaction was endothermic and has strong affinity of banana peels towards copper
ions. It was also suggested some structural changes in copper ions and banana peel (Gupta, 1998). In addition, the negative value of ∆S° (for both isotherms) also suggested that the adsorption was enthalpy driven and spontaneous in nature (Memon et al., 2008). 3.4 Regeneration of Banana Peel
The regeneration of exhausted banana peel is crucial to reuse and recovery of valuable metals and to reduce the operating cost for any type of water treatment. Regeneration experiments were done with eight eluents. The batch desorption results with eight eluents and adsorption-desorption cycle with 0.1N H2SO4 is presented in Figure 4. Among the solvents, the highest (94%) recovery was found when using 0.1N H2SO4. In desorption system, H+ released from acids which replaced Cu2+ on the surface of the banana peel (Wang and Qin, 2005). The adsorption and desorption cycles were continued till nine times with 0.1N H2SO4 (Figure 4(b)). Figure 4(b) showed that the banana peel could be reused till seven cycles without any significant change of efficiency. After first phase of desorption process the both adsorption and desorption efficiency were significantly increased. The acid solution might dissolve the organic portion of banana peel and activate the bind-ing site, and consequently help to increase the efficiency. 3.5 Adsorption and Desorption Equilib-
riums
Adsorption as well as desorption process can be quantified by isotherm equation. Isotherm helps to understand the adsorption and de-sorption behaviour of bioadsorbents. The parameters used to derive the mathematical equation in isotherm are related to the surface properties and affinity of the adsorbent (Montazer-Rahmati et al., 2011). Three

M. A. Hossain et al. / Journal of Water Sustainability 1 (2012) 87-104 95
isotherm models namely Langmuir, SIPS and Koble-Corrigan were employed to describe the adsorption as well as desorption of copper
onto banana peel. The model predictions are plotted in Figure 5 and tabulated in Table 2.
Figure 4 Regeneration of banana peel and adsorption and desorption cycles
Figure 5 Isotherm modelling of adsorption and desorption of copper onto banana peel with different doses (Co: 1-500 mg/l; d: 0.05-1 g; t: 24h: pH: 6-6.5; rpm: 120; T: 20°C)
a. Desorption of copper with different solvents
0
20
40
60
80
100
120
Tap water Mill-Q water Distilled water 0.1 N H2SO4 0.1 N HCl 0.1 N HNO3 0.1 N
CH3COOH
0.1 N NaOH
Name of solvent
% d
eso
rp
tio
n o
f co
pp
er
b. Desorption cycle of copper with H2SO4
0
20
40
60
80
100
120
1 2 3 4 5 6 7 8 9No. of uses for adsorption and desorption
% A
dso
rpti
on
an
d
des
orp
tio
n o
f co
pp
er
Adsorption
Desorption

96 M. A. Hossain et al. / Journal of Water Sustainability 1 (2012) 87-104
Generally both two-parameter (Langmuir) and three-parameter models (SIPS and Koble-Corrigan) were shown good fitness with experimental data obtained at doses of 0.05, 0.5 and 1 g for both adsorption and desorption processes. It can be due to the presence of both heterogeneous and homoge-neous surface on the banana peel (Febrianto et al., 2009). Among the three doses, data from 1g dose was shown better association with all three models for both adsorption and desorp-tion equilibrium (R2: 0.998 to 1). Low RMSE and small χ2 values were also found from that dose. Monolayer adsorption capaci-ties (qm) were 20.37 and 32.40 mg/g from adsorption and desorption processes, respec-tively. This adsorption and desorption capaci-ties (qm) of copper were higher than other bioadsorbent reported in literature (Montazer-Rahmati et al., 2011). Lower values of KL (< 1) were noticed from both adsorption and desorption process (Table 2) which indicated the higher affinity of banana
peel to copper (Davis et al., 2003; Febrianto et al., 2009). In comparison with RMSE values of three models, the lowest RMSE values (0.0003, 1.914 and 0.323) were predicted by Langmuir model for the used three doses. Similarly the lowest χ2 values (7.85, 0.240 and 0.036) were also predicted from Langmuir model. The calculated values of exponent (βS) from SIPS model were close to unity for both adsorption and desorption of copper. It was signified that copper adsorption and desorp-tion processes in this study was more of Langmuir form rather than that of Freundlich (Foo and Hameed, 2010). From the analysis of three isotherm models and the knowledge of the most important parameters (qm, R2, RMSE and χ2), the isotherms can be arranged ac-cording to their capacity to predict their efficiency in forecasting the experimental behaviour of the banana peel-copper system. Therefore, the best fit of adsorption isotherm models were in the order of: Langmuir > Koble-Corrigan>Sips.
Table 2 Predicted parameters of isotherm models for adsorption and desorption of copper onto
banana peel Adsorption (Doses) Desorption (Doses)
Isotherm models Parameters 0.05g 0.5g 1g 0.05g 0.5g 1g
1. Langmuir
eL
eLme CK1
CKqq
+=
qm KL R2
χ2 RMSE
298.30 0.020 0.995 7.86 0.0003
58.90 0.013 0.989 0.240 1.914
20.37 0.016 0.998 0.036 0.323
637.05 0.001 0.993 0.024 0.937
125.39 0.001 0.968 1.049 0.019
32.40 0.004 0.996 9E-05 0.165
2. SIPS
s
s
βes
βes
e Cα1CK
q+
=
Ks αS βS R2 χ2 RSME
1.839 0.007 1.370 0.992 5.550 9.892
0.318 0.006 1.251 0.991 10.447 01.974
0.440 0.020 0.912 0.998 0.003 0.369
0.563 0.001 1.129 0.995 0.023 1.766
0.220 0.752 0.051 0.984 0.615 0.949
0.104 0.001 0.985 1.000 0.001 0.006
3.Koble-Corrigan
peKC
peKC
e CB1CA
q+
=
AKC BKC p R2 χ2 RSME
1.788 0.007 1.372 0.992 6.028 9.942
1.034 0.016 0.904 0.986 0.401 1.836
0.440 0.020 0.911 0.998 0.6585 0.3688
0.655 0.000 1.083 0.995 1.704 0.002
0.371 0.523 0.115 0.990 0.500 0.893
0.097 0.0004 1.013 1.000 0.0004 0.004
M. A. Hossain et al. / Journal of Water Sustainability 1 (2012) 87-104 97
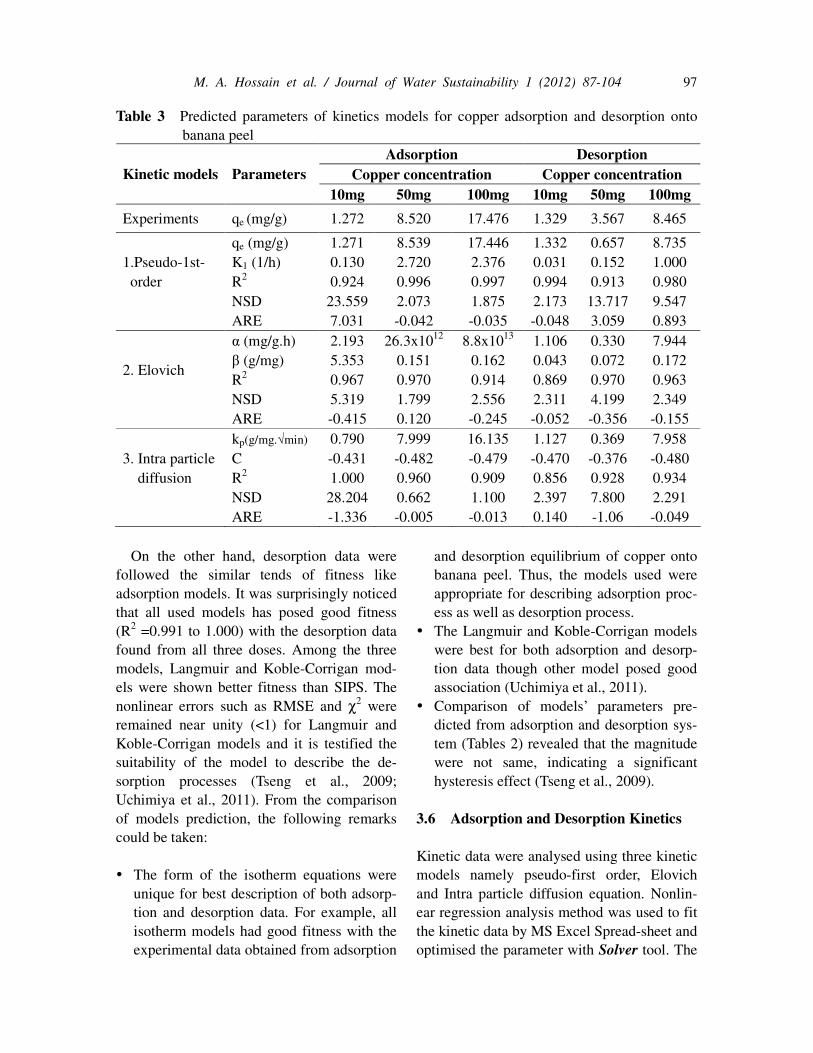
Table 3 Predicted parameters of kinetics models for copper adsorption and desorption onto banana peel
Adsorption Desorption
Copper concentration Copper concentration Kinetic models Parameters
10mg 50mg 100mg 10mg 50mg 100mg
Experiments qe (mg/g) 1.272 8.520 17.476 1.329 3.567 8.465
1.Pseudo-1st- order
qe (mg/g) K1 (1/h) R2 NSD ARE
1.271 0.130 0.924
23.559 7.031
8.539 2.720 0.996 2.073 -0.042
17.446 2.376 0.997 1.875 -0.035
1.332 0.031 0.994 2.173 -0.048
0.657 0.152 0.913
13.717 3.059
8.735 1.000 0.980 9.547 0.893
2. Elovich
α (mg/g.h) β (g/mg) R2 NSD ARE
2.193 5.353 0.967 5.319 -0.415
26.3x10¹²
0.151 0.970 1.799 0.120
8.8x10¹³
0.162 0.914 2.556 -0.245
1.106 0.043 0.869 2.311 -0.052
0.330 0.072 0.970 4.199 -0.356
7.944 0.172 0.963 2.349 -0.155
3. Intra particle diffusion
kp(g/mg.√min)
C R2 NSD ARE
0.790 -0.431 1.000
28.204 -1.336
7.999 -0.482 0.960 0.662 -0.005
16.135 -0.479 0.909 1.100 -0.013
1.127 -0.470 0.856 2.397 0.140
0.369 -0.376 0.928 7.800 -1.06
7.958 -0.480 0.934 2.291 -0.049
On the other hand, desorption data were
followed the similar tends of fitness like adsorption models. It was surprisingly noticed that all used models has posed good fitness (R2 =0.991 to 1.000) with the desorption data found from all three doses. Among the three models, Langmuir and Koble-Corrigan mod-els were shown better fitness than SIPS. The nonlinear errors such as RMSE and χ2 were remained near unity (<1) for Langmuir and Koble-Corrigan models and it is testified the suitability of the model to describe the de-sorption processes (Tseng et al., 2009; Uchimiya et al., 2011). From the comparison of models prediction, the following remarks could be taken:
� The form of the isotherm equations were
unique for best description of both adsorp-tion and desorption data. For example, all isotherm models had good fitness with the experimental data obtained from adsorption
and desorption equilibrium of copper onto banana peel. Thus, the models used were appropriate for describing adsorption proc-ess as well as desorption process.
� The Langmuir and Koble-Corrigan models were best for both adsorption and desorp-tion data though other model posed good association (Uchimiya et al., 2011).
� Comparison of models’ parameters pre-dicted from adsorption and desorption sys-tem (Tables 2) revealed that the magnitude were not same, indicating a significant hysteresis effect (Tseng et al., 2009).
3.6 Adsorption and Desorption Kinetics
Kinetic data were analysed using three kinetic models namely pseudo-first order, Elovich and Intra particle diffusion equation. Nonlin-ear regression analysis method was used to fit the kinetic data by MS Excel Spread-sheet and optimised the parameter with Solver tool. The

98 M. A. Hossain et al. / Journal of Water Sustainability 1 (2012) 87-104
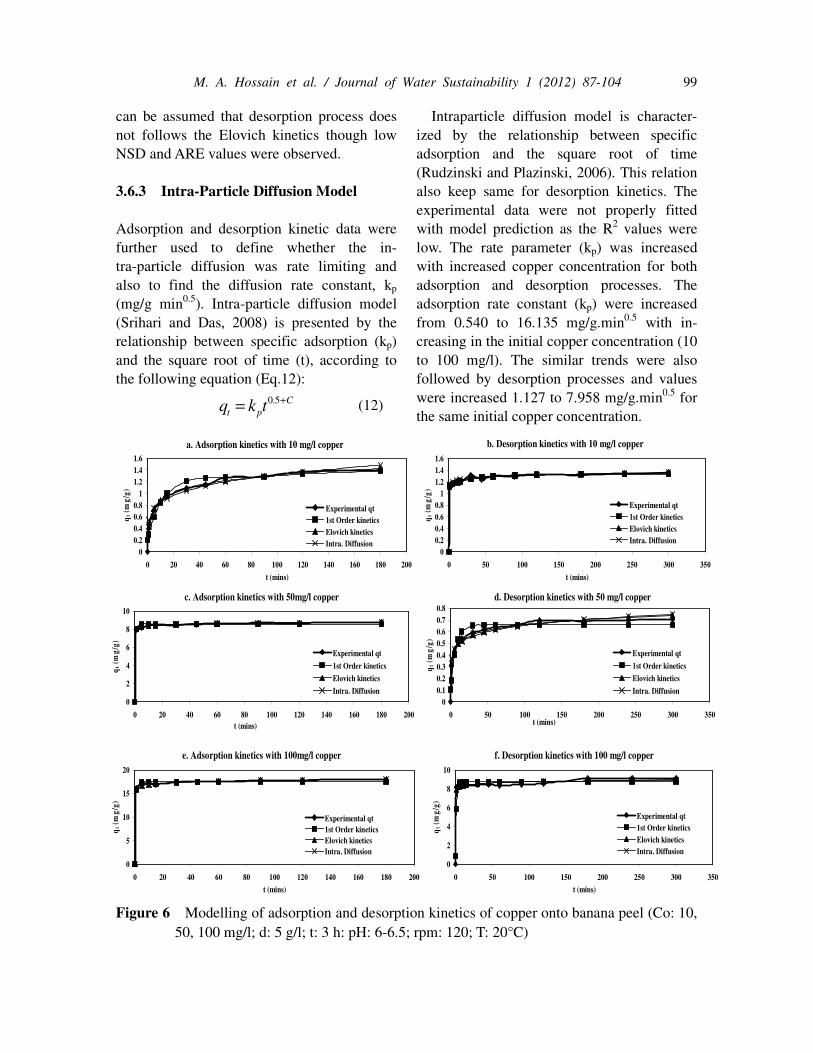
association between the experimental data and the model-predicted values was examined by R2, the normalized standard deviation (NSD) and average relative error (ARE). The nonlin-ear fitting curves of the pseudo-first-order, Elovich and Intra particle diffusion equations for adsorption and desorption of copper onto banana peel are presented in Figure 6 and parameters are summarised in Table 3. 3.6.1 Pseudo-First Order Model
The pseudo-first-order kinetic model (Tseng et al., 2009) can be represented by Eq. (10):
)( 1tk
eet eqqq−−= (10)
where k1 (1/min) is the pseudo-first-order kinetic rate constant and t (min) the contact time. Adsorption and desorption kinetics were very fast at the beginning of processes. The adsorption processes reached equilibrium after 60, 30 and 20 min for the initial copper concentration of 10, 50 and 100 mg/l, respec-tively. The initial faster rate of copper adsorp-tion onto banana peel may be due to the availability of the non-used binding sites (Renaud et al., 2011). Desorption process reached equilibrium after 100, 100 and 50 min for the same doses. The equilibrium adsorp-tion and desorption capacities increased with increasing in initial copper concentration and close to experimental values (Table 3). This strongly suggests that the adsorption and desorption could be represented by a pseu-do-first order kinetic model (Bueno et al., 2008; Khambhaty et al., 2009). The values of pseudo-first order kinetics constant (K1) for adsorption were 0.130, 2.720 and 2.376 Lh-1 for the initial copper concentration of 10, 50 and 100 mg/l while being 0.031, 0.152 and 1.00 l/h for desorption processes. The value of K1 increases with increasing of initial copper concentration for both adsorption and desorp-tion kinetics. The K1 values were near unity which revealed that the processes were con-
trolled by chemisorption and suitability of the model (Ho and Ofomaja, 2006; Ho et al., 2000; Khambhaty et al., 2009). The signifi-cantly small values of NSD and ARE’ were also testified the statement. 3.6.2 The Elovich Equation
The Elovich kinetic equation (Behnamfard and Salarirad, 2009) is given by Eq. (11).
)ln(.qt αβtβ=
where α (mg/g.min) is the initial biosorp-tion rate and β (g/mg) the desorption constant related to the extent of surface coverage and activation energy for chemisorption. The adsorption and desorption processes were also tried to describes by Elovich kinetic model. In fact, this model was shown a moderate fitness (R2: 0.914 to 0.970) with the experimental data for adsorption but not with desorption data (R2= 0.869 to 0 0.970). The low correla-tion coefficients indicating that this model was not applicable in the present case. Parameters α and β, were used to interpret and understand the initial rate of the process as well as the nature of sites involved in the adsorption processes. An opposite trend was noticed from the calculated values of α and β. The α in-creased from 2.193 to 8.8x10¹³ mg/g.h for adsorption and from 1.106 to 7.944 mg/g.h for desorption while copper concentrations lied between 10 to 100 mg/l. On the other hand, β decreased from 5.353 to 0.160 g/mg for adsorption and increased from 0.043 to 0.172 g/mg for desorption while copper concentra-tions were same. This is the general trend of variation for α and β with increase in initial copper concentration in case of adsorption and proved that activation energies required for chemisorptions corresponding to the hetero-geneity in the nature of the active sites of banana peel (Behnamfard and Salarirad, 2009; Viswanathan, 2004). However, desorption process did not follow the trend of α and β. It
(11)
M. A. Hossain et al. / Journal of Water Sustainability 1 (2012) 87-104 99
a. Adsorption kinetics with 10 mg/l copper
0
0.2
0.4
0.6
0.8
1
1.2
1.4
1.6
0 20 40 60 80 100 120 140 160 180 200
t (mins)
qt
(mg
/g)
Experimental qt
1st Order kinetics
Elovich kinetics
Intra. Diffusion
b. Desorption kinetics with 10 mg/l copper
0
0.2
0.4
0.6
0.8
1
1.2
1.4
1.6
0 50 100 150 200 250 300 350
t (mins)
qt
(mg
/g)
Experimental qt
1st Order kinetics
Elovich kinetics
Intra. Diffusion
c. Adsorption kinetics with 50mg/l copper
0
2
4
6
8
10
0 20 40 60 80 100 120 140 160 180 200
t (mins)
qt
(mg
/g)
Experimental qt
1st Order kinetics
Elovich kinetics
Intra. Diffusion
d. Desorption kinetics with 50 mg/l copper
0
0.1
0.2
0.3
0.4
0.5
0.6
0.7
0.8
0 50 100 150 200 250 300 350t (mins)
qt
(mg
/g)
Experimental qt
1st Order kinetics
Elovich kinetics
Intra. Diffusion
e. Adsorption kinetics with 100mg/l copper
0
5
10
15
20
0 20 40 60 80 100 120 140 160 180 200
t (mins)
qt
(mg
/g)
Experimental qt
1st Order kinetics
Elovich kinetics
Intra. Diffusion
f. Desorption kinetics with 100 mg/l copper
0
2
4
6
8
10
0 50 100 150 200 250 300 350
t (mins)
qt
(mg
/g)
Experimental qt
1st Order kinetics
Elovich kinetics
Intra. Diffusion
can be assumed that desorption process does not follows the Elovich kinetics though low NSD and ARE values were observed. 3.6.3 Intra-Particle Diffusion Model
Adsorption and desorption kinetic data were further used to define whether the in-tra-particle diffusion was rate limiting and also to find the diffusion rate constant, kp (mg/g min0.5). Intra-particle diffusion model (Srihari and Das, 2008) is presented by the relationship between specific adsorption (kp) and the square root of time (t), according to the following equation (Eq.12):
C
pt tkq+= 5.0
Intraparticle diffusion model is character-ized by the relationship between specific adsorption and the square root of time (Rudzinski and Plazinski, 2006). This relation also keep same for desorption kinetics. The experimental data were not properly fitted with model prediction as the R2 values were low. The rate parameter (kp) was increased with increased copper concentration for both adsorption and desorption processes. The adsorption rate constant (kp) were increased from 0.540 to 16.135 mg/g.min0.5 with in-creasing in the initial copper concentration (10 to 100 mg/l). The similar trends were also followed by desorption processes and values were increased 1.127 to 7.958 mg/g.min0.5 for the same initial copper concentration.
Figure 6 Modelling of adsorption and desorption kinetics of copper onto banana peel (Co: 10, 50, 100 mg/l; d: 5 g/l; t: 3 h: pH: 6-6.5; rpm: 120; T: 20°C)
(12)

100 M. A. Hossain et al. / Journal of Water Sustainability 1 (2012) 87-104
Table 4 Comparison of performance of copper adsorption by biosorbent produces from agricultural wastes
Name Temp.
(°C) pH RPM
C0
(mg/l)
qm
(mg/g)
BET
area(m2/g)
References
Activated carbon form
Rubber wood dust 30 6.0 180 10-40 5.73 1674
(Kalavathy et al., 2005)
Hazelnut shells 25 5.0 90 8500 200 1651
(Milenković et al., 2009)
Peanut shells NA 4.8 300 818-3177 50.4 725 (Wilson et al., 2006) Ceiba pentandra
hulls 30 6.0 - 40-100 20.8 521
(Madhava Rao et al., 2006)
Peanut hulls 30 5.0 180 10-20 65.57 208.0
(Goswami et al., 2005)
Hazelnut shells 18 - 170 - 39.54 10.1 (Şayan, 2006) Hazelnut husk
18 5.7 200 200 6.645 4.31 (Imamoglu and Tekir, 2008)
Normal grounded form
Macroalgae (Fucus
vesiculosus) 20 4.2 350 100 114.9 0.22
(Cochrane et al., 2006)
Crab carapace (Cancer pagurus)
20 5 350 100 79.4 33.4 (Cochrane et al., 2006)
Wheat bran 20 5 150 0-100 51.5 7.72 (Özer et al., 2004) Palm oil fruit shell
20 NA 120 1-35 20-60 39.76 (Hossain et al., 2012)
Tree fern 30 NA 100 30-150 11.7 2.39 (Ho, 2003) Irish peat moss
25 2-8 NA 5-100 17.6 203.41 (Sen Gupta et al., 2009)
Cellulose pulp waste 22 <6.0 NA 65-200 4.98 2.64
(Ulmanu et al., 2003)
Compost 22 7.3 NA 0-100 12.77 1.36
(Ulmanu et al., 2003)
Aquatic plant 25 5-6 NA 2-70 10.37 1.56
(Keskinkan et al., 2004)
Banana peel Room temp.
NA 120 1-500 20.37 22.59 Present study
*NA = Not adjusted / Not Available
* AC = Activated Carbon
3.7 Comparison of Performances
The acceptability of bioadsorbent depends on the metal adsorption capacity, specific surface area, consumer friendly, availability and environment friendly applications. In this
context, the adsorption capacities (calculated from the Langmuir isotherm model) of copper with other parameters obtained from banana peel and other adsorbents and activated carbon produced from agricultural wastes were compared in Table 4. Table 4 indicates

M. A. Hossain et al. / Journal of Water Sustainability 1 (2012) 87-104 101
that the banana peel based bioadsorbent adsorbs more copper ions from water than others.
CONCLUSIONS
Banana peels is a low cost and readily avail-able materials for preparing bioadsorbent. This study has explored the economically viable bioadsorbents for copper removal from water. The banana peel could be regenerated and reused till seven times without reducing efficiency. The data from adsorption and desorption equilibrium were well fitted with three models used showing the variation for degrees of fitness. Langmuir model were predicted the maximum equilibrium adsorp-tion and desorption capacities from a 1g dose and the values found were higher than some bioadsorbent and activated carbon. The kinetics of adsorption of copper onto banana peels could follow a pseudo-first-order equa-tion and chemisorption controls of the adsorp-tion process. Desorption processes were also well fitted with kinetics models. The reuse of banana peel was viable as the desorption study revealed. Hence, the banana peel based biosorbent can be a favourable alternative for copper removal from water and wastewater. ACKNOWLEDGEMENT
This research was supported by the Coordina-tor, Research Theme - Wastewater Treatment and Reuse Technologies for Sustainable Water, Centre for Technology in Water and Wastewater, School of Civil and Environ-mental Engineering, University of Technology, Sydney (UTS) and UTS International Post-graduate Research Scholarship. REFERENCES
Al-Asheh, S., Banat, F., Al-Omari, R.,
Duvnjak, Z. (2000). Predictions of binary
sorption isotherms for the sorption of heavy metals by pine bark using single isotherm data. Chemosphere, 41(5), 659-665.
Al-Rub, F.A.A. (2006). Biosorption of zinc on palm tree leaves: Equilibrium, kinetics, and thermodynamics studies. Separation
Science and Technology, 41(15), 3499-3515.
Albarelli, J.Q., Rabelo, R.B., Santos, D.T., Beppu, M.M., Meireles, M.A.A. (2011). Effects of supercritical carbon dioxide on waste banana peels for heavy metal removal. The Journal of Supercritical
Fluids, 58(3), 343-351. Annadurai, G., Juang, R.S., Lee, D.J. (2002).
Adsorption of heavy metals from water using banana and orange peels. Water
Science and Technology, 47(1), 185-190. Antunes, W.M., Luna, A.S., Henriques, C.A.,
Costa, A.C.A.d. (2003). An evaluation of
copper biosorption by a brown seaweed
under optimized conditions. Anwar, J., Shafique, U., Waheed uz, Z.,
Salman, M., Dar, A., Anwar, S. (2010). Removal of Pb(II) and Cd(II) from water by adsorption on peels of banana. Bioresource Technology, 101(6), 1752-1755.
Behnamfard, A., Salarirad, M.M. (2009). Equilibrium and kinetic studies on free cyanide adsorption from aqueous solution by activated carbon. Journal of Hazardous
Materials, 170(1), 127-133. Bhattacharyya, K.G., Gupta, S.S. (2006).
Kaolinite, montmorillonite, and their modified derivatives as adsorbents for removal of Cu(II) from aqueous solution. Separation and Purification Technology, 50(3), 388-397.
Brewer, G.J. (2007). Iron and copper toxicity in diseases of aging, particularly atherosclerosis and Alzheimer's disease. Expermental Biol. Med., 232(2), 323-35.
Bueno, B.Y.M., Torem, M.L., Molina, F., de

102 M. A. Hossain et al. / Journal of Water Sustainability 1 (2012) 87-104
Mesquita, L.M.S. (2008). Biosorption of lead(II), chromium(III) and copper(II) by R. opacus: Equilibrium and kinetic studies. Minerals Engineering, 21(1), 65-75.
Cochrane, E.L., Lu, S., Gibb, S.W., Villaescusa, I. (2006). A comparison of low-cost biosorbents and commercial sorbents for the removal of copper from aqueous media. Journal of Hazardous
Materials, 137(1), 198-206. Davis, T.A., Volesky, B., Mucci, A. (2003). A
review of the biochemistry of heavy metal biosorption by brown algae. Water
Research, 37(18), 4311-4330. Demirbas, A. (2009). Agricultural based
activated carbons for the removal of dyes from aqueous solutions: A review. Journal
of Hazardous Materials, 167(1-3), 1-9. Faller, P. (2009). Copper and Zinc Binding to
Amyloid-β: Coordination, Dynamics, Aggregation, Reactivity and Metal-Ion Transfer. ChemBioChem, 10(18), 2837- 2845.
Febrianto, J., Kosasih, A.N., Sunarso, J., Ju, Y.-H., Indraswati, N., Ismadji, S. (2009). Equilibrium and kinetic studies in adsorption of heavy metals using biosorbent: A summary of recent studies. Journal of Hazardous Materials, 162(2–3), 616-645.
Flemming, C.A., Trevors, J.T. (1989). Copper toxicity and chemistry in the environment: a review. Water, Air, andamp; Soil
Pollution, 44(1), 143-158. Foo, K.Y., Hameed, B.H. (2010). Insights into
the modeling of adsorption isotherm systems. Chemical Engineering Journal, 156(1), 2-10.
Gao, H., Liu, Y., Zeng, G., Xu, W., Li, T., Xia, W. (2008). Characterization of Cr(VI) removal from aqueous solutions by a surplus agricultural waste--Rice straw. Journal of Hazardous Materials, 150(2), 446-452.
George J, B. (2010). Copper toxicity in the
general population. Clinical Neuro-
physiology, 121(4), 459-460. Goswami, S., Chatterjee, B., Mallik, M.
(2005). Proof-of-Presence of Unusually Naturally Occurring Homologous Series of Fifteen Saturated Odd and Even Fatty Acids in Acanthus ilicifolius L. (Acanthaceae). ChemInform, 36(10), 696- 706.
Gupta, V.K. (1998). Equilibrium Uptake, Sorption Dynamics, Process Development, and Column Operations for the Removal of Copper and Nickel from Aqueous Solution and Wastewater Using Activated Slag, a Low-Cost Adsorbent. Industrial and
Engineering Chemistry Research, 37(1), 192-202.
Ho, Y. S. (2003). Removal of copper ions from aqueous solution by tree fern. Water
Research, 37(10), 2323-2330. Ho, Y. S., Ofomaja, A.E. (2006). Biosorption
thermodynamics of cadmium on coconut copra meal as biosorbent. Biochemical
Engineering Journal, 30(2), 117-123. Ho, Y. S., Huang, C.T., Huang, H.W. (2002).
Equilibrium sorption isotherm for metal ions on tree fern. Process Biochemistry, 37(12), 1421-1430.
Ho, Y. S., Ng, J.C.Y., McKay, G. (2000). Kinetics of pollutant sorption by biosorbents: review. Separation and
Purification Reviews, 29(2), 189-232. Hossain, M.A., Ngo, H.H., Guo, W.S.,
Nguyen, T.V. (2012). Palm oil fruit shells as biosorbent for copper removal from water and wastewater: Experiments and sorption models. Bioresource Technology, 113(0), 97-101.
Hureau, C., Faller, P. (2009). Abeta-mediated ROS production by Cu ions: structural insights, mechanisms and relevance to Alzheimer's disease. Biochimie., 91(10), 1212-7.
Imamoglu, M., Tekir, O. (2008). Removal of copper (II) and lead (II) ions from aqueous

M. A. Hossain et al. / Journal of Water Sustainability 1 (2012) 87-104 103
solutions by adsorption on activated carbon from a new precursor hazelnut husks. Desalination, 228(1–3), 108-113.
Kalavathy, M.H., Karthikeyan, T., Rajgopal, S., Miranda, L.R. (2005). Kinetic and isotherm studies of Cu(II) adsorption onto H3PO4-activated rubber wood sawdust. Journal of Colloid and Interface Science, 292(2), 354-362.
Karthikeyan, S., Balasubramanian, R., Iyer, C.S.P. (2007). Evaluation of the marine algae Ulva fasciata and Sargassum sp. for the biosorption of Cu(II) from aqueous solutions. Bioresource Technology, 98(2), 452-455.
Keskinkan, O., Goksu, M.Z.L., Basibuyuk, M., Forster, C.F. (2004). Heavy metal adsorption properties of a submerged aquatic plant (Ceratophyllum demersum). Bioresource Technology, 92(2), 197-200.
Khambhaty, Y., Mody, K., Basha, S., Jha, B. (2009). Kinetics, equilibrium and thermodynamic studies on biosorption of hexavalent chromium by dead fungal biomass of marine Aspergillus niger. Chemical Engineering Journal, 145(3), 489-495.
Larous, S., Meniai, A.H., Lehocine, M.B. (2005). Experimental study of the removal of copper from aqueous solutions by adsorption using sawdust. Desalination, 185(1–3), 483-490.
Madhava Rao, M., Ramesh, A., Purna Chandra Rao, G., Seshaiah, K. (2006). Removal of copper and cadmium from the aqueous solutions by activated carbon derived from Ceiba pentandra hulls. Journal of Hazardous Materials, 129(1–3), 123-129.
Memon, J.R., Memon, S.Q., Bhanger, M.I., Memon, G.Z., El-Turki, A., Allen, G.C. (2008). Characterization of banana peel by scanning electron microscopy and FT-IR spectroscopy and its use for cadmium removal. Colloids and Surfaces B:
Biointerfaces, 66(2), 260-265. Milenković, D.D., Dašić, P.V., Veljković, V.B.
(2009). Ultrasound-assisted adsorption of copper(II) ions on hazelnut shell activated carbon. Ultrasonics Sonochemistry, 16(4), 557-563.
Montazer-Rahmati, M.M., Rabbani, P., Abdolali, A., Keshtkar, A.R. (2011). Kinetics and equilibrium studies on biosorption of cadmium, lead, and nickel ions from aqueous solutions by intact and chemically modified brown algae. Journal
of Hazardous Materials, 185(1), 401-407. Ngah, W.S.W., Fatinathan, S. (2006). Chitosan
flakes and chitosan–GLA beads for adsorption of p-nitrophenol in aqueous solution. Colloids and Surfaces A:
Physicochemical and Engineering Aspects, 277(1–3), 214-222.
Özcan, A., Özcan, A.S., Tunali, S., Akar, T., Kiran, I. (2005). Determination of the equilibrium, kinetic and thermodynamic parameters of adsorption of copper(II) ions onto seeds of Capsicum annuum. Journal
of Hazardous Materials, 124(1–3), 200-208.
Özer, A., Özer, D., Özer, A. (2004). The adsorption of copper(II) ions on to dehydrated wheat bran (DWB): determination of the equilibrium and thermodynamic parameters. Process
Biochemistry, 39(12), 2183-2191. Renaud, F., Oberhänsli, F., Teyssié, J.-L.,
Miramand, P., Temara, A., Warnau, M. (2011). Sorption–desorption kinetics and toxic cell concentration in marine phytoplankton microalgae exposed to Linear Alkylbenzene Sulfonate. Marine
Pollution Bulletin, 62(5), 942-947. Rudzinski, W., Plazinski, W. (2006). Kinetics
of Solute Adsorption at Solid/Solution Interfaces: A Theoretical Development of the Empirical Pseudo-First and Pseudo-Second Order Kinetic Rate Equations, Based on Applying the

104 M. A. Hossain et al. / Journal of Water Sustainability 1 (2012) 87-104
Statistical Rate Theory of Interfacial Transport. The Journal of Physical
Chemistry B, 110(33), 16514-16525. Sari, A., Mendil, D., Tuzen, M., Soylak, M.
(2008). Biosorption of Cd(II) and Cr(III) from aqueous solution by moss (Hylocomium splendens) biomass: Equilibrium, kinetic and thermodynamic studies. Chemical Engineering Journal, 144(1), 1-9.
Şayan, E. (2006). Ultrasound-assisted preparation of activated carbon from alkaline impregnated hazelnut shell: An optimization study on removal of Cu2+ from aqueous solution. Chemical
Engineering Journal, 115(3), 213-218. Sen Gupta, B., Curran, M., Hasan, S., Ghosh,
T.K. (2009). Adsorption characteristics of Cu and Ni on Irish peat moss. Journal of
Environmental Management, 90(2), 954-960.
Sengil, I.A., Özacar, M. (2008). Biosorption of Cu(II) from aqueous solutions by mimosa tannin gel. Journal of Hazardous
Materials, 157(2-3), 277-285. Srihari, V., Das, A. (2008). The kinetic and
thermodynamic studies of phenol-sorption onto three agro-based carbons. Desalination, 225(1–3), 220-234.
Tseng, J.Y., Chang, C.Y., Chang, C.F., Chen, Y.H., Chang, C.C., Ji, D.R., Chiu, C.Y., Chiang, P.C. (2009). Kinetics and equilibrium of desorption removal of copper from magnetic polymer adsorbent. Journal of Hazardous Materials, 171(1–3), 370-377.
Uchimiya, M., Klasson, K.T., Wartelle, L.H., Lima, I.M. (2011). Influence of soil properties on heavy metal sequestration by biochar amendment: 2. Copper desorption isotherms. Chemosphere, 82(10), 1438-1447.
Ulmanu, M., Marañón, E., Fernández, Y.,
Castrillón, L., Anger, I., Dumitriu, D. (2003). Removal of Copper and Cadmium Ions from Diluted Aqueous Solutions by Low Cost and Waste Material Adsorbents. Water, Air, and Soil Pollution, 142(1), 357-373.
Van Genderen, E.J., Ryan, A.C., Tomasso, J.R., Klaine, S.J. (2005). Evaluation of acute copper toxicity to larval fathead minnows (Pimephales promelas) in soft surface waters. Environmental Toxicology and
Chemistry, 24(2), 408-414. Vázquez, G., González-Álvarez, J., García,
A.I., Freire, M.S., Antorrena, G. (2007). Adsorption of phenol on formaldehyde- pretreated Pinus pinaster bark: Equilibrium and kinetics. Bioresource Technology, 98(8), 1535-1540.
Venkata Mohan, S., Chandrasekhar Rao, N., Karthikeyan, J. (2002). Adsorptive removal of direct azo dye from aqueous phase onto coal based sorbents: a kinetic and mechanistic study. Journal of Hazardous
Materials, 90(2), 189-204. Viswanathan, B. (2004). Adsorption of small
molecules on metallic surfaces. Bulletin of
the Catalysis Society of India, 3, 43-53. Wang, X.-s., Qin, Y. (2005). Equilibrium
sorption isotherms for of Cu2+ on rice bran. Process Biochemistry, 40(2), 677-680.
Williams, C.J., Aderhold, D., Edyvean, R.G.J. (1998). Comparison between biosorbents for the removal of metal ions from aqueous solutions. Water Research, 32(1), 216-224.
Wilson, K., Yang, H., Seo, C.W., Marshall, W.E. (2006). Select metal adsorption by activated carbon made from peanut shells. Bioresource Technology, 97(18), 2266- 2270.
Yang, L., Chen, J.P. (2008). Biosorption of hexavalent chromium onto raw and chemically modified Sargassum sp. Bioresource Technology, 99(2), 297-307.