biosimilars: evolution and trends - aeseg
TRANSCRIPT

Insert date here
Biosimilars: Evolution and trends
Dr. Gabriel Morelli, Country Manager Spain, IMS HEALTH
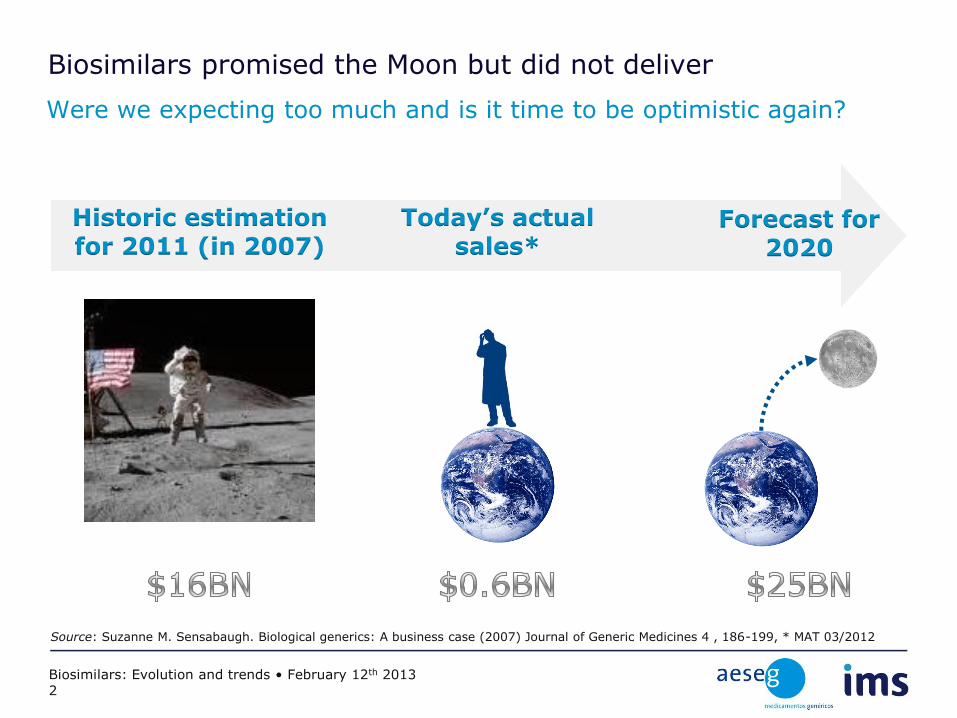
Biosimilars promised the Moon but did not deliver
Were we expecting too much and is it time to be optimistic again?
Forecast for 2020
Historic estimation for 2011 (in 2007)
Today’s actual sales*
Source: Suzanne M. Sensabaugh. Biological generics: A business case (2007) Journal of Generic Medicines 4 , 186-199, * MAT 03/2012
Biosimilars: Evolution and trends • February 12th 2013 2
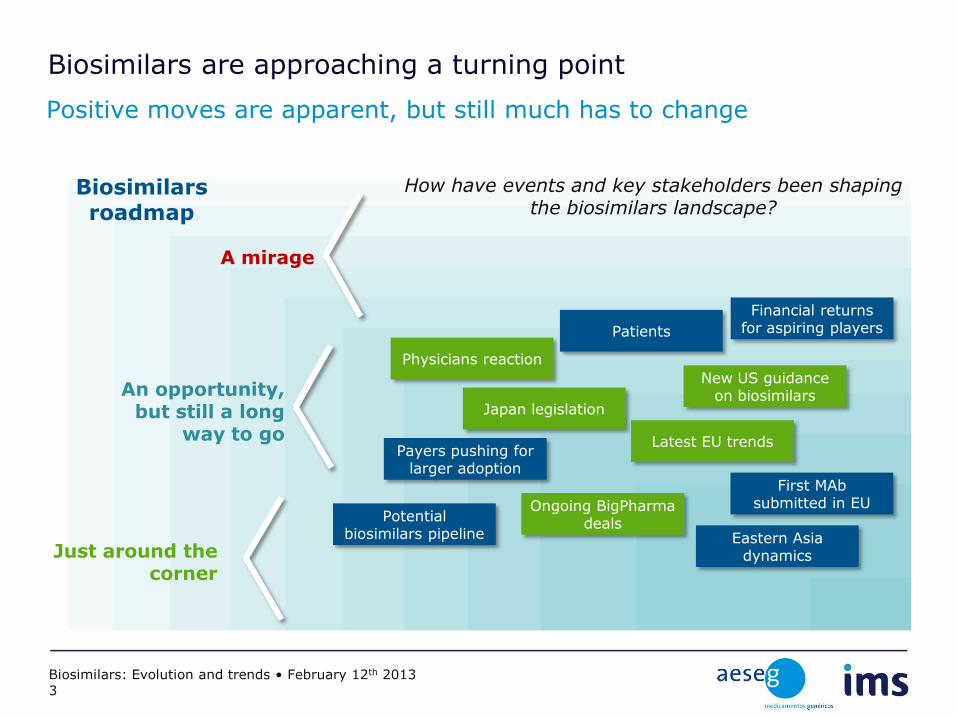
Biosimilars are approaching a turning point
Positive moves are apparent, but still much has to change
New US guidance on biosimilars
Biosimilars roadmap
Latest EU trends
Japan legislation
Eastern Asia dynamics
First MAb submitted in EU Ongoing BigPharma
deals Potential
biosimilars pipeline
Payers pushing for larger adoption
Physicians reaction
Just around the corner
An opportunity, but still a long
way to go
A mirage
Patients
Financial returns for aspiring players
How have events and key stakeholders been shaping the biosimilars landscape?
Biosimilars: Evolution and trends • February 12th 2013 3
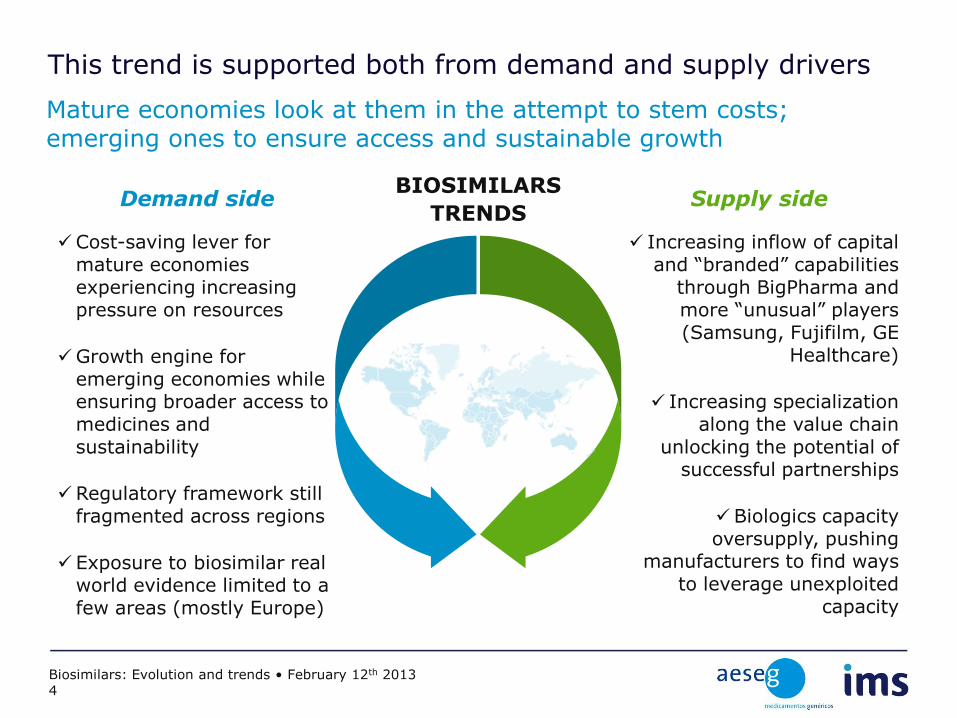
This trend is supported both from demand and supply drivers
Mature economies look at them in the attempt to stem costs; emerging ones to ensure access and sustainable growth
BIOSIMILARS
TRENDS Demand side Supply side
Cost-saving lever for mature economies experiencing increasing pressure on resources
Growth engine for emerging economies while ensuring broader access to medicines and sustainability
Regulatory framework still fragmented across regions
Exposure to biosimilar real world evidence limited to a few areas (mostly Europe)
Increasing inflow of capital and “branded” capabilities
through BigPharma and more “unusual” players (Samsung, Fujifilm, GE
Healthcare)
Increasing specialization along the value chain
unlocking the potential of successful partnerships
Biologics capacity oversupply, pushing
manufacturers to find ways
to leverage unexploited capacity
Biosimilars: Evolution and trends • February 12th 2013 4
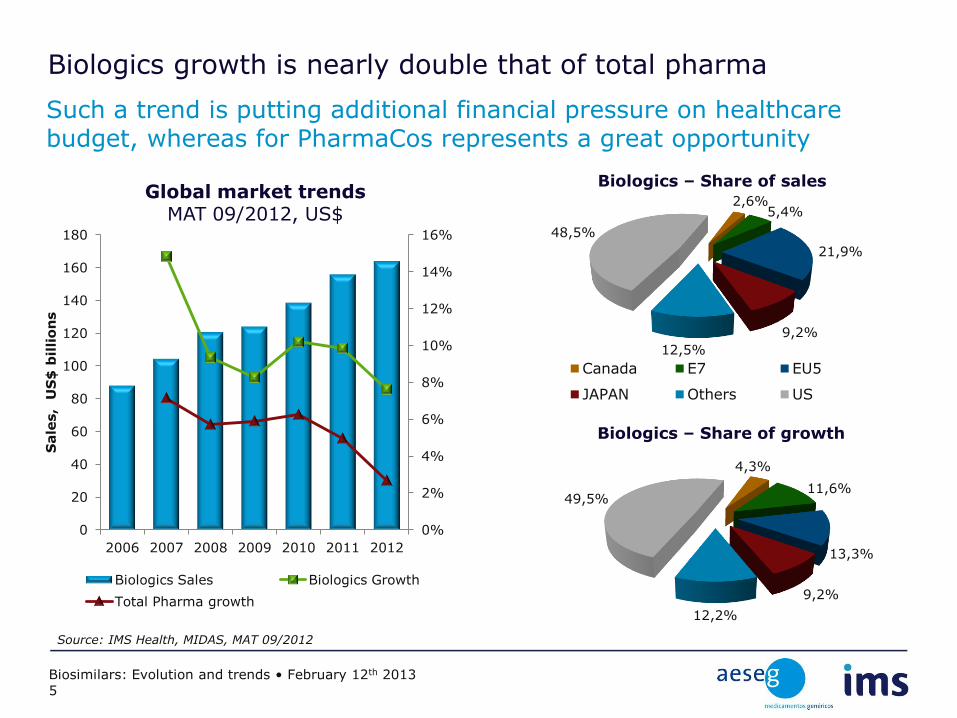
Biologics growth is nearly double that of total pharma
Such a trend is putting additional financial pressure on healthcare budget, whereas for PharmaCos represents a great opportunity
Source: IMS Health, MIDAS, MAT 09/2012
Biosimilars: Evolution and trends • February 12th 2013 5
0%
2%
4%
6%
8%
10%
12%
14%
16%
0
20
40
60
80
100
120
140
160
180
2006 2007 2008 2009 2010 2011 2012
Sale
s,
US
$ b
illio
ns
Biologics Sales Biologics Growth
Total Pharma growth
2,6% 5,4%
21,9%
9,2%
12,5%
48,5%
Canada E7 EU5
JAPAN Others US
4,3%
11,6%
13,3%
9,2%
12,2%
49,5%
Biologics – Share of sales
Biologics – Share of growth
Global market trends MAT 09/2012, US$
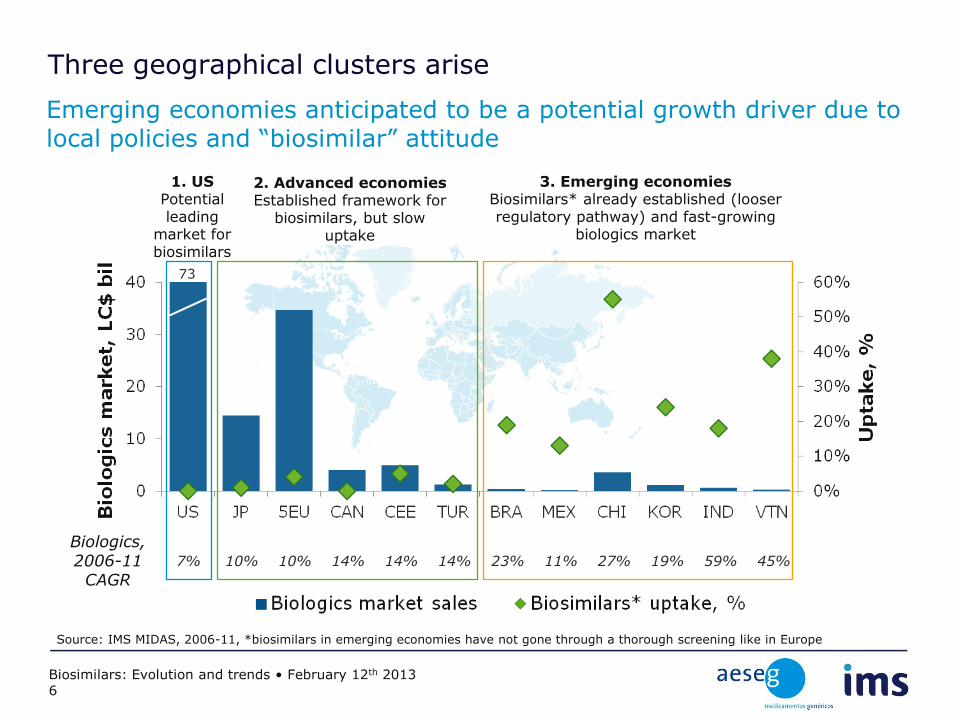
Three geographical clusters arise
Emerging economies anticipated to be a potential growth driver due to local policies and “biosimilar” attitude
7% 10% 10% 14% 14% 14% 23% 11% 27% 19% 59% 45%
Biologics, 2006-11
CAGR
73
1. US Potential leading
market for biosimilars
2. Advanced economies Established framework for
biosimilars, but slow uptake
3. Emerging economies Biosimilars* already established (looser regulatory pathway) and fast-growing
biologics market
Source: IMS MIDAS, 2006-11, *biosimilars in emerging economies have not gone through a thorough screening like in Europe
Biosimilars: Evolution and trends • February 12th 2013 6
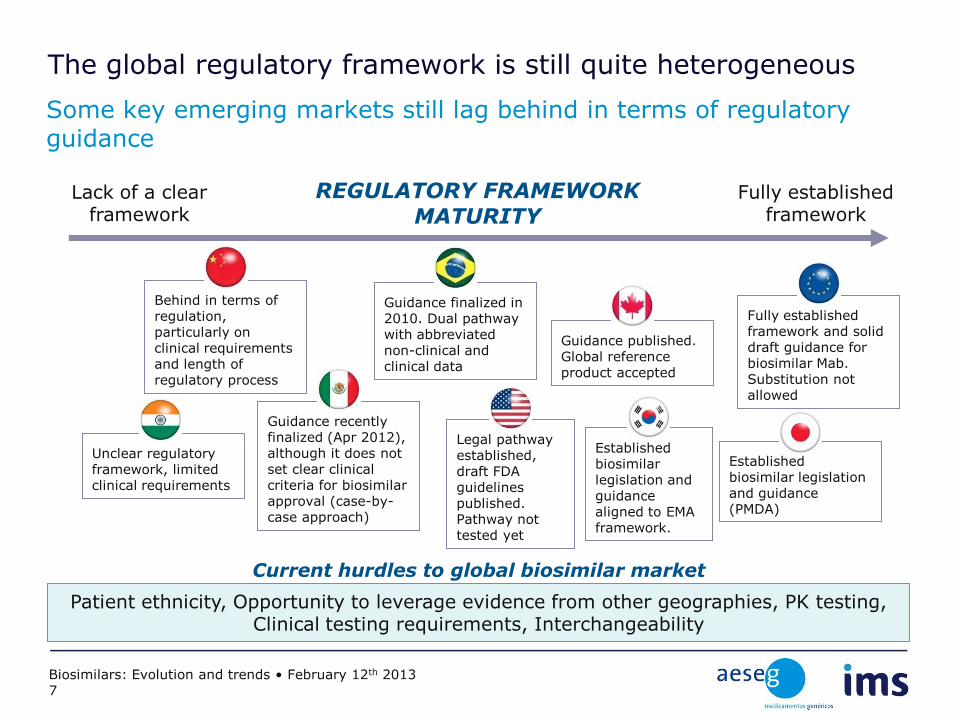
The global regulatory framework is still quite heterogeneous
Some key emerging markets still lag behind in terms of regulatory guidance
Lack of a clear framework
Fully established framework
REGULATORY FRAMEWORK MATURITY
Established biosimilar legislation and guidance aligned to EMA framework.
Fully established framework and solid draft guidance for biosimilar Mab. Substitution not allowed
Guidance published. Global reference product accepted
Behind in terms of regulation, particularly on clinical requirements and length of regulatory process
Guidance finalized in 2010. Dual pathway with abbreviated non-clinical and clinical data
Guidance recently finalized (Apr 2012), although it does not set clear clinical criteria for biosimilar approval (case-by-case approach)
Established biosimilar legislation and guidance (PMDA)
Unclear regulatory framework, limited clinical requirements
Legal pathway established, draft FDA guidelines published. Pathway not tested yet
Patient ethnicity, Opportunity to leverage evidence from other geographies, PK testing, Clinical testing requirements, Interchangeability
Current hurdles to global biosimilar market
Biosimilars: Evolution and trends • February 12th 2013 7
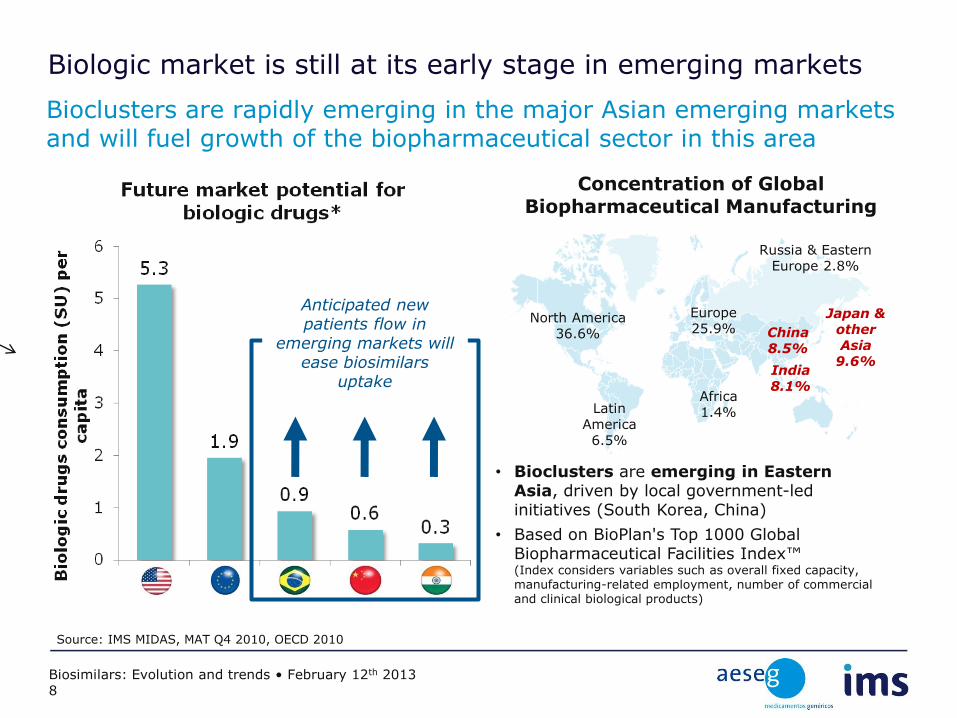
Biologic market is still at its early stage in emerging markets
Bioclusters are rapidly emerging in the major Asian emerging markets and will fuel growth of the biopharmaceutical sector in this area
Source: IMS MIDAS, MAT Q4 2010, OECD 2010
Anticipated new patients flow in
emerging markets will ease biosimilars
uptake
North America 36.6%
Latin America 6.5%
Africa 1.4%
India 8.1%
China 8.5%
Japan & other Asia
9.6%
Russia & Eastern Europe 2.8%
Europe 25.9%
Concentration of Global Biopharmaceutical Manufacturing
• Bioclusters are emerging in Eastern Asia, driven by local government-led initiatives (South Korea, China)
• Based on BioPlan's Top 1000 Global Biopharmaceutical Facilities Index™ (Index considers variables such as overall fixed capacity, manufacturing-related employment, number of commercial and clinical biological products)
Biosimilars: Evolution and trends • February 12th 2013 8
0%
10%
20%
30%
40%
50%
60%
70%
80%
90%
100%
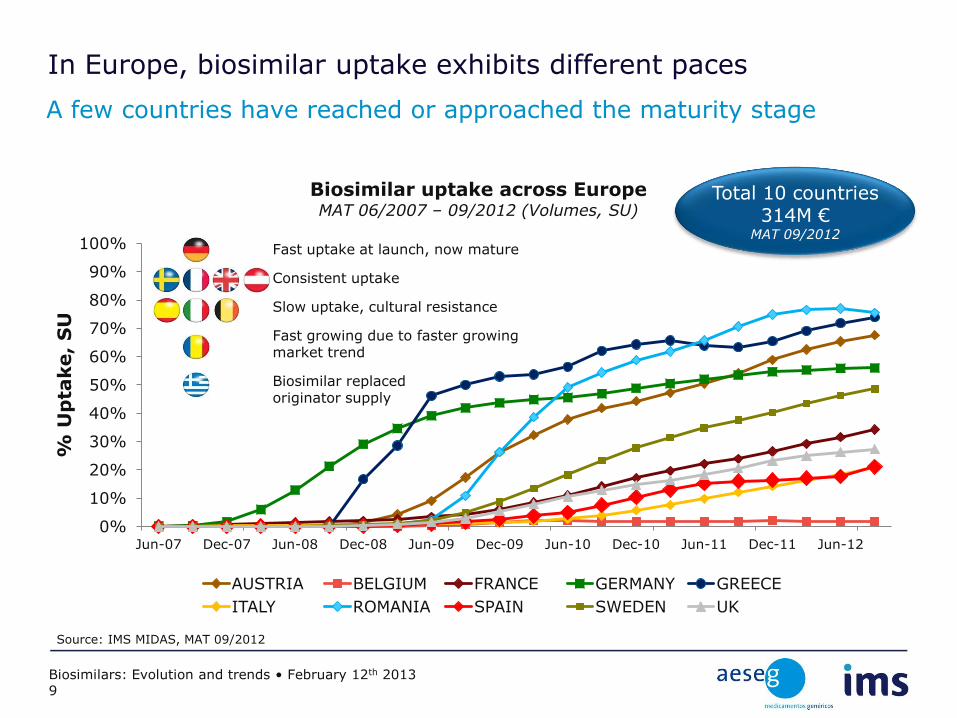
Jun-07 Dec-07 Jun-08 Dec-08 Jun-09 Dec-09 Jun-10 Dec-10 Jun-11 Dec-11 Jun-12
% U
pta
ke,
SU
Biosimilar uptake across Europe MAT 06/2007 – 09/2012 (Volumes, SU)
AUSTRIA BELGIUM FRANCE GERMANY GREECE
ITALY ROMANIA SPAIN SWEDEN UK
Total 10 countries 314M €
MAT 09/2012 Fast uptake at launch, now mature
Consistent uptake
Slow uptake, cultural resistance
Fast growing due to faster growing market trend
Biosimilar replaced originator supply
In Europe, biosimilar uptake exhibits different paces
A few countries have reached or approached the maturity stage
Source: IMS MIDAS, MAT 09/2012
Biosimilars: Evolution and trends • February 12th 2013 9
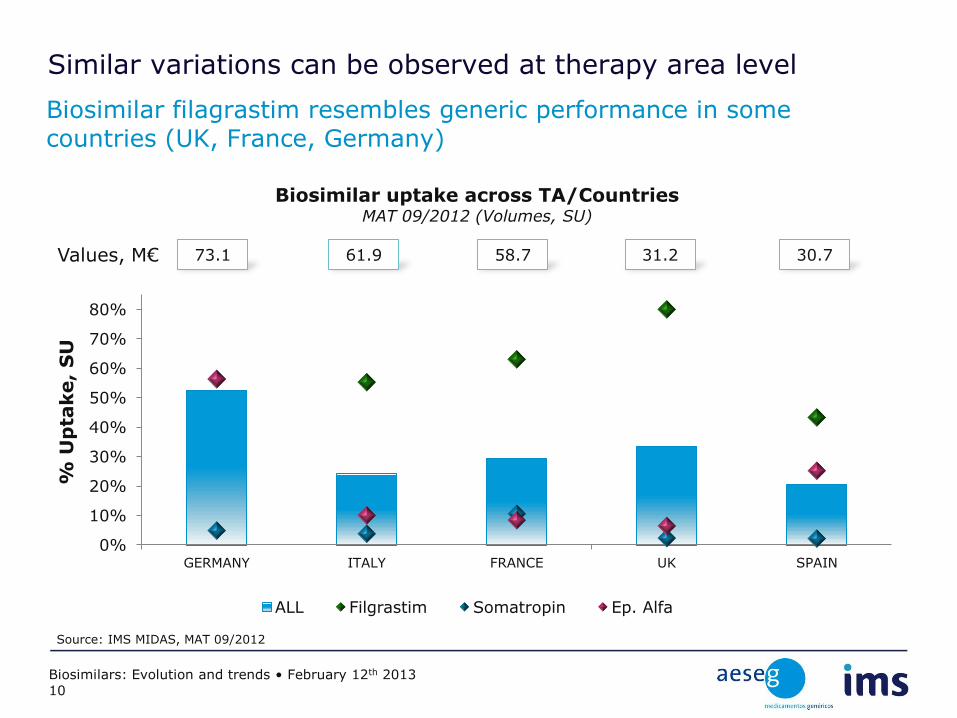
Similar variations can be observed at therapy area level
0%
10%
20%
30%
40%
50%
60%
70%
80%
GERMANY ITALY FRANCE UK SPAIN
% U
pta
ke,
SU
Biosimilar uptake across TA/Countries MAT 09/2012 (Volumes, SU)
ALL Filgrastim Somatropin Ep. Alfa
73.1 61.9 58.7 31.2 30.7 Values, M€
Biosimilar filagrastim resembles generic performance in some countries (UK, France, Germany)
Source: IMS MIDAS, MAT 09/2012
Biosimilars: Evolution and trends • February 12th 2013 10
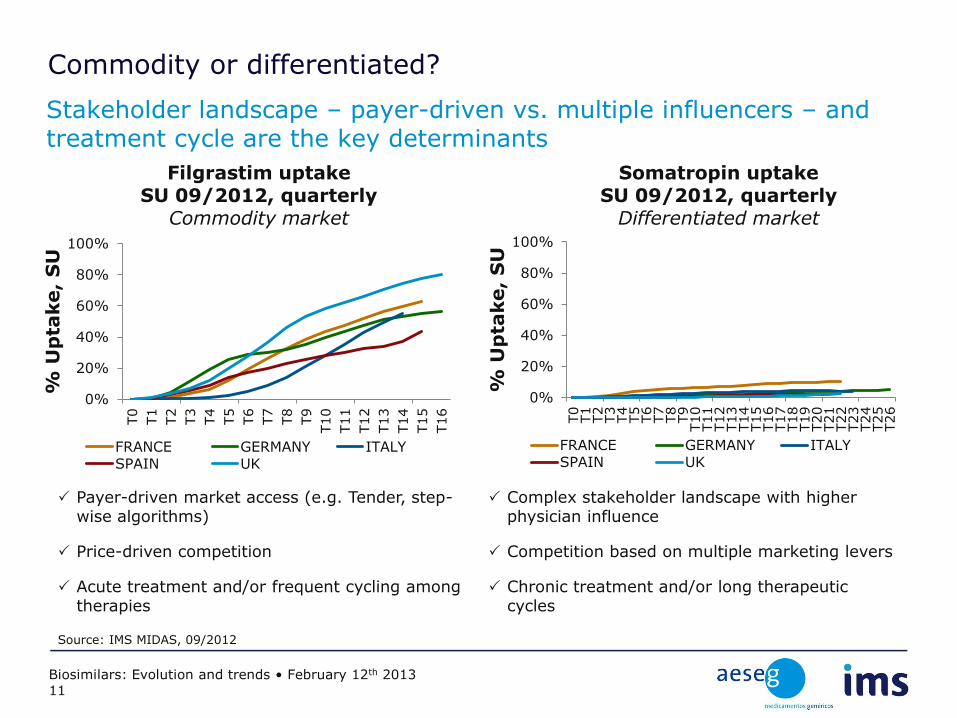
Commodity or differentiated?
Stakeholder landscape – payer-driven vs. multiple influencers – and treatment cycle are the key determinants
Source: IMS MIDAS, 09/2012
Filgrastim uptake SU 09/2012, quarterly
Commodity market
Somatropin uptake SU 09/2012, quarterly
Differentiated market
Payer-driven market access (e.g. Tender, step-wise algorithms)
Price-driven competition
Acute treatment and/or frequent cycling among therapies
Complex stakeholder landscape with higher physician influence
Competition based on multiple marketing levers
Chronic treatment and/or long therapeutic cycles
Biosimilars: Evolution and trends • February 12th 2013 11
0%
20%
40%
60%
80%
100%
T0
T1
T2
T3
T4
T5
T6
T7
T8
T9
T10
T11
T12
T13
T14
T15
T16
% U
pta
ke,
SU
FRANCE GERMANY ITALY SPAIN UK
0%
20%
40%
60%
80%
100%
T0
T1
T2
T3
T4
T5
T6
T7
T8
T9
T10
T11
T12
T13
T14
T15
T16
T17
T18
T19
T20
T21
T22
T23
T24
T25
T26
% U
pta
ke,
SU
FRANCE GERMANY ITALY SPAIN UK
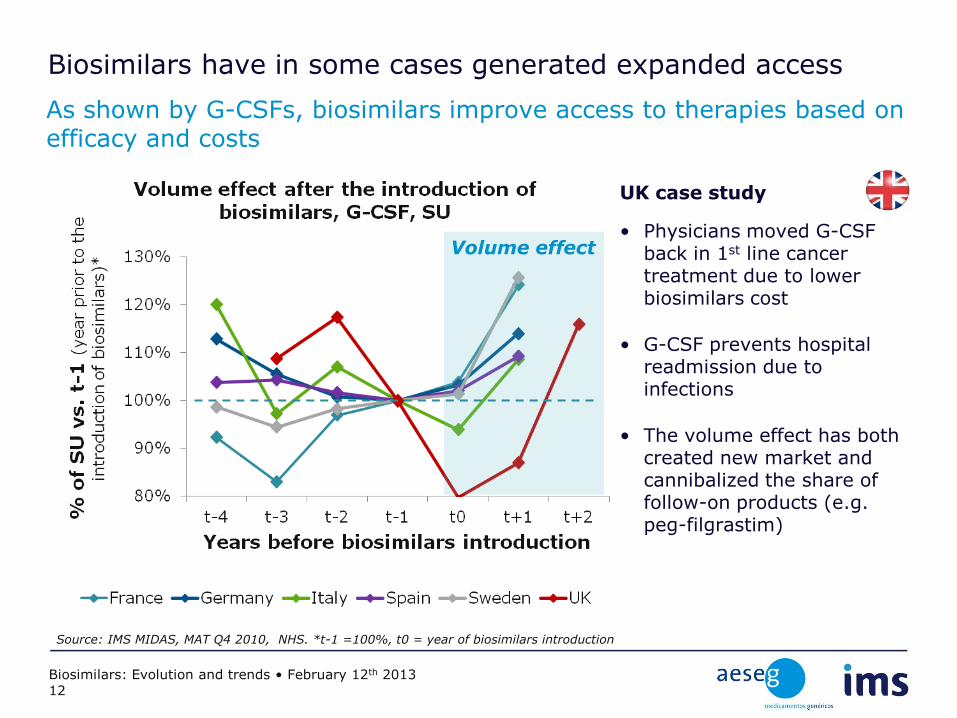
Biosimilars have in some cases generated expanded access
As shown by G-CSFs, biosimilars improve access to therapies based on efficacy and costs
UK case study
• Physicians moved G-CSF back in 1st line cancer treatment due to lower biosimilars cost
• G-CSF prevents hospital readmission due to infections
• The volume effect has both created new market and cannibalized the share of follow-on products (e.g. peg-filgrastim)
Volume effect
Source: IMS MIDAS, MAT Q4 2010, NHS. *t-1 =100%, t0 = year of biosimilars introduction
Biosimilars: Evolution and trends • February 12th 2013 12
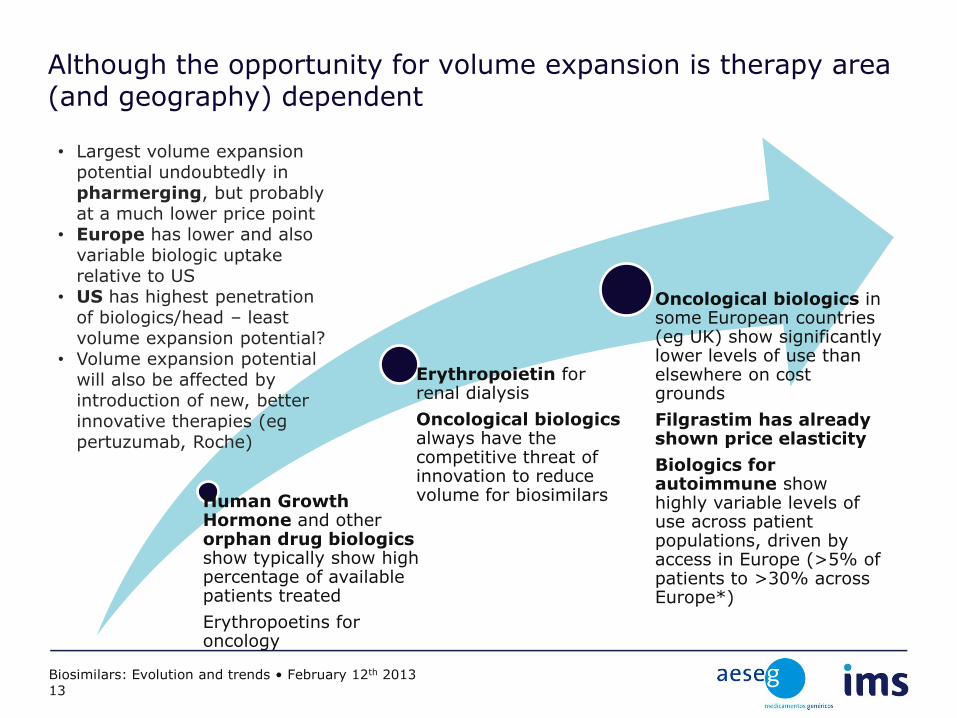
Although the opportunity for volume expansion is therapy area (and geography) dependent
Human Growth Hormone and other orphan drug biologics show typically show high percentage of available patients treated
Erythropoetins for oncology
Erythropoietin for renal dialysis
Oncological biologics always have the competitive threat of innovation to reduce volume for biosimilars
Oncological biologics in some European countries (eg UK) show significantly lower levels of use than elsewhere on cost grounds
Filgrastim has already shown price elasticity
Biologics for autoimmune show highly variable levels of use across patient populations, driven by access in Europe (>5% of patients to >30% across Europe*)
• Largest volume expansion potential undoubtedly in pharmerging, but probably at a much lower price point
• Europe has lower and also variable biologic uptake relative to US
• US has highest penetration of biologics/head – least volume expansion potential?
• Volume expansion potential will also be affected by introduction of new, better innovative therapies (eg pertuzumab, Roche)
Biosimilars: Evolution and trends • February 12th 2013 13
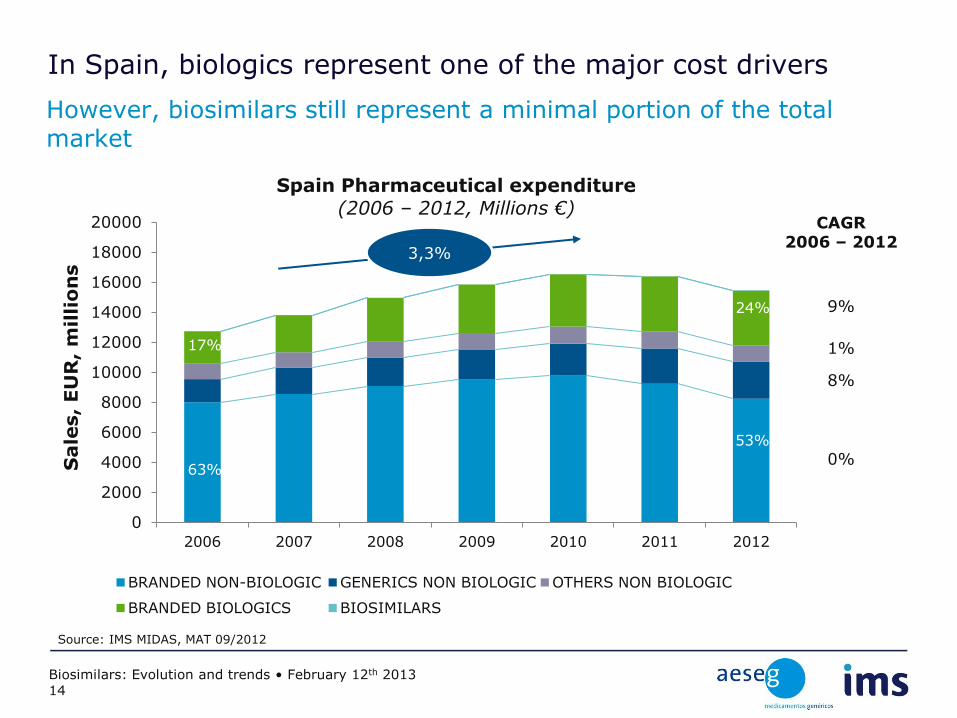
0
2000
4000
6000
8000
10000
12000
14000
16000
18000
20000
2006 2007 2008 2009 2010 2011 2012
Sale
s, EU
R,
mil
lio
ns
Spain Pharmaceutical expenditure (2006 – 2012, Millions €)
BRANDED NON-BIOLOGIC GENERICS NON BIOLOGIC OTHERS NON BIOLOGIC
BRANDED BIOLOGICS BIOSIMILARS
CAGR 2006 – 2012
9%
1%
8%
0%
24%
53%
17%
63%
Source: IMS MIDAS, MAT 09/2012
3,3%
In Spain, biologics represent one of the major cost drivers
However, biosimilars still represent a minimal portion of the total market
Biosimilars: Evolution and trends • February 12th 2013 14
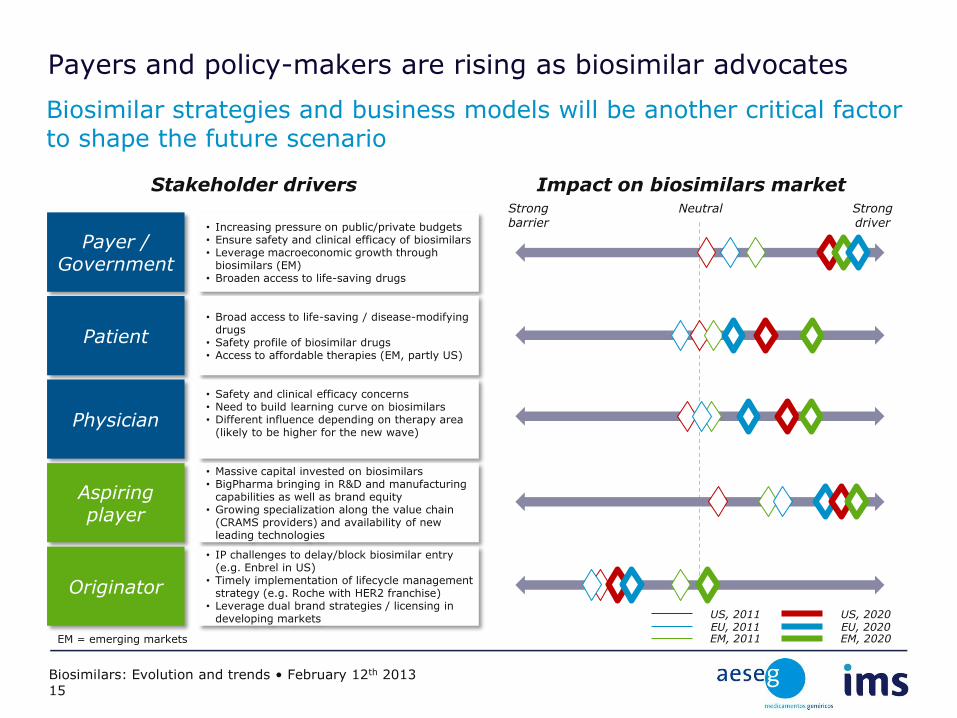
Payers and policy-makers are rising as biosimilar advocates
Biosimilar strategies and business models will be another critical factor to shape the future scenario
Payer / Government
Patient
Physician
Aspiring player
Originator
• Increasing pressure on public/private budgets • Ensure safety and clinical efficacy of biosimilars • Leverage macroeconomic growth through
biosimilars (EM) • Broaden access to life-saving drugs
• Broad access to life-saving / disease-modifying drugs
• Safety profile of biosimilar drugs • Access to affordable therapies (EM, partly US)
• Safety and clinical efficacy concerns • Need to build learning curve on biosimilars • Different influence depending on therapy area
(likely to be higher for the new wave)
• Massive capital invested on biosimilars • BigPharma bringing in R&D and manufacturing
capabilities as well as brand equity • Growing specialization along the value chain
(CRAMS providers) and availability of new leading technologies
• IP challenges to delay/block biosimilar entry (e.g. Enbrel in US)
• Timely implementation of lifecycle management strategy (e.g. Roche with HER2 franchise)
• Leverage dual brand strategies / licensing in developing markets
Stakeholder drivers Impact on biosimilars market
US, 2011 EU, 2011 EM, 2011
US, 2020 EU, 2020 EM, 2020 EM = emerging markets
Neutral Strong barrier
Strong driver
Biosimilars: Evolution and trends • February 12th 2013 15
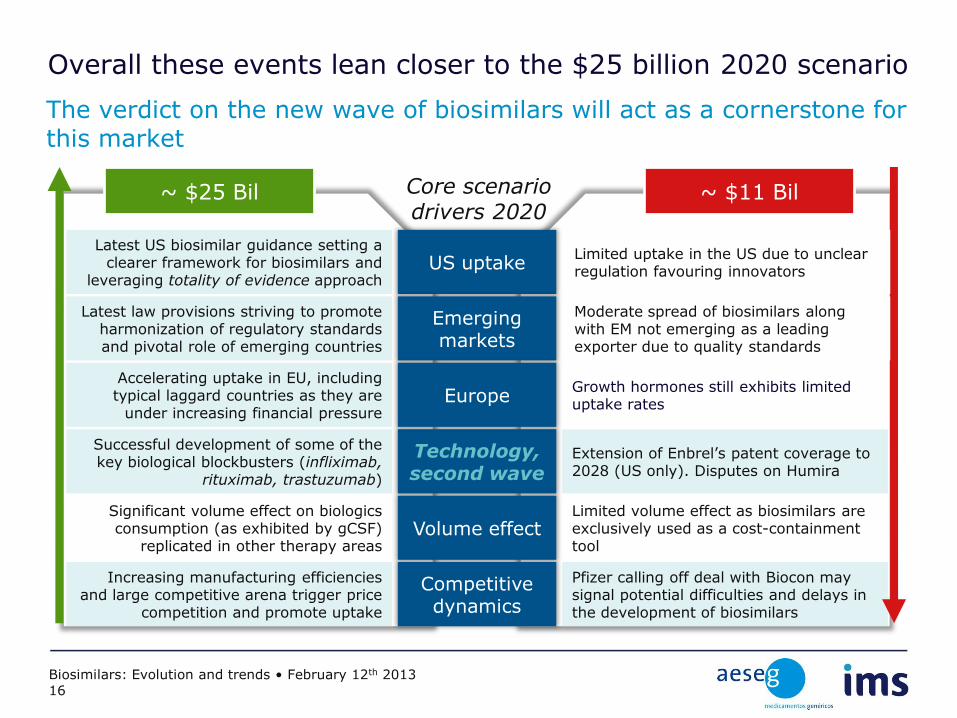
Overall these events lean closer to the $25 billion 2020 scenario
The verdict on the new wave of biosimilars will act as a cornerstone for this market
US uptake
Technology, second wave
Volume effect
Emerging markets
Europe
Competitive dynamics
Core scenario drivers 2020
~ $25 Bil ~ $11 Bil
Latest US biosimilar guidance setting a clearer framework for biosimilars and
leveraging totality of evidence approach
Successful development of some of the key biological blockbusters (infliximab,
rituximab, trastuzumab)
Significant volume effect on biologics consumption (as exhibited by gCSF)
replicated in other therapy areas
Latest law provisions striving to promote harmonization of regulatory standards and pivotal role of emerging countries
Accelerating uptake in EU, including typical laggard countries as they are
under increasing financial pressure
Increasing manufacturing efficiencies and large competitive arena trigger price
competition and promote uptake
-
Extension of Enbrel’s patent coverage to 2028 (US only). Disputes on Humira
Limited volume effect as biosimilars are exclusively used as a cost-containment tool
-
Growth hormones still exhibits limited uptake rates
Pfizer calling off deal with Biocon may signal potential difficulties and delays in the development of biosimilars
Limited uptake in the US due to unclear regulation favouring innovators
Moderate spread of biosimilars along with EM not emerging as a leading exporter due to quality standards
Biosimilars: Evolution and trends • February 12th 2013 16
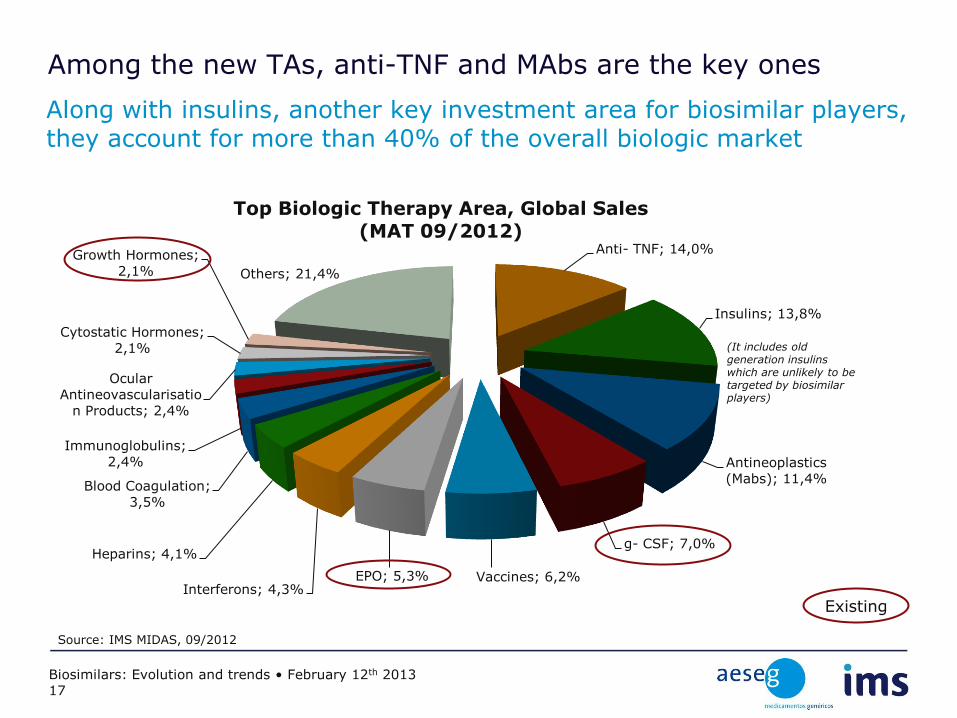
Among the new TAs, anti-TNF and MAbs are the key ones
Along with insulins, another key investment area for biosimilar players, they account for more than 40% of the overall biologic market
Existing
Biosimilars: Evolution and trends • February 12th 2013 17
Anti- TNF; 14,0%
Insulins; 13,8%
Antineoplastics
(Mabs); 11,4%
g- CSF; 7,0%
Vaccines; 6,2% EPO; 5,3% Interferons; 4,3%
Heparins; 4,1%
Blood Coagulation;
3,5%
Immunoglobulins;
2,4%
Ocular
Antineovascularisatio
n Products; 2,4%
Cytostatic Hormones;
2,1%
Growth Hormones; 2,1% Others; 21,4%
Top Biologic Therapy Area, Global Sales (MAT 09/2012)
(It includes old generation insulins which are unlikely to be targeted by biosimilar players)
Source: IMS MIDAS, 09/2012
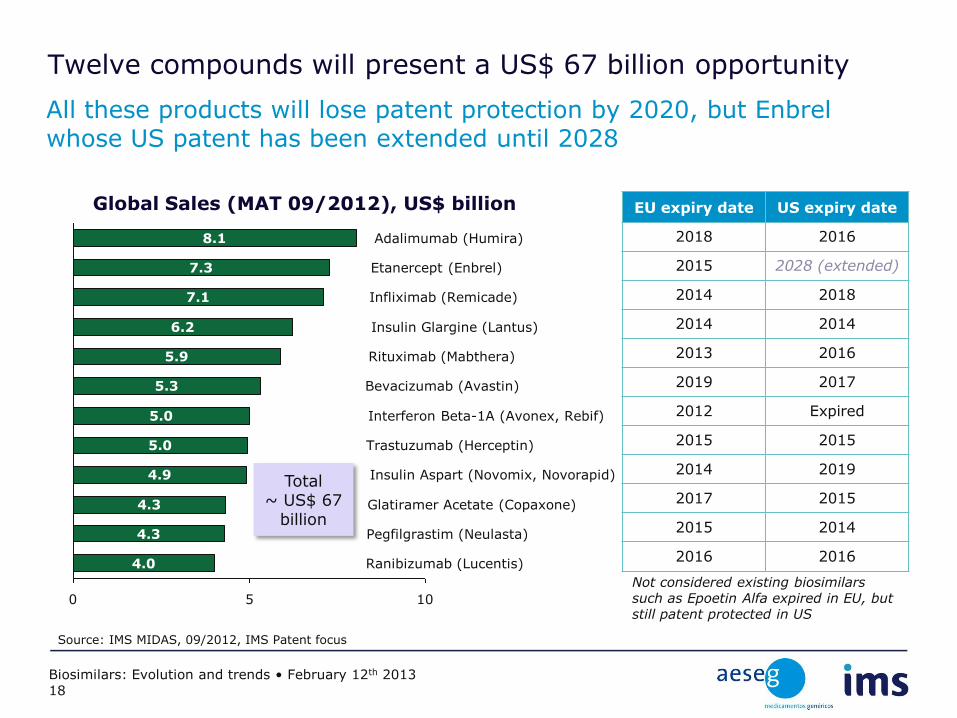
Twelve compounds will present a US$ 67 billion opportunity
All these products will lose patent protection by 2020, but Enbrel whose US patent has been extended until 2028
EU expiry date US expiry date
2018 2016
2015 2028 (extended)
2014 2018
2014 2014
2013 2016
2019 2017
2012 Expired
2015 2015
2014 2019
2017 2015
2015 2014
2016 2016
Not considered existing biosimilars such as Epoetin Alfa expired in EU, but still patent protected in US
Source: IMS MIDAS, 09/2012, IMS Patent focus
Biosimilars: Evolution and trends • February 12th 2013 18
10 5 0
4.9
Trastuzumab (Herceptin) 5.0
Interferon Beta-1A (Avonex, Rebif) 5.0
Bevacizumab (Avastin) 5.3
Rituximab (Mabthera) 5.9
Insulin Glargine (Lantus) 6.2
Infliximab (Remicade)
Ranibizumab (Lucentis) 4.0
Pegfilgrastim (Neulasta) 4.3
Glatiramer Acetate (Copaxone) 4.3
Insulin Aspart (Novomix, Novorapid)
7.1
Etanercept (Enbrel) 7.3
Adalimumab (Humira) 8.1
Global Sales (MAT 09/2012), US$ billion
Total ~ US$ 67
billion
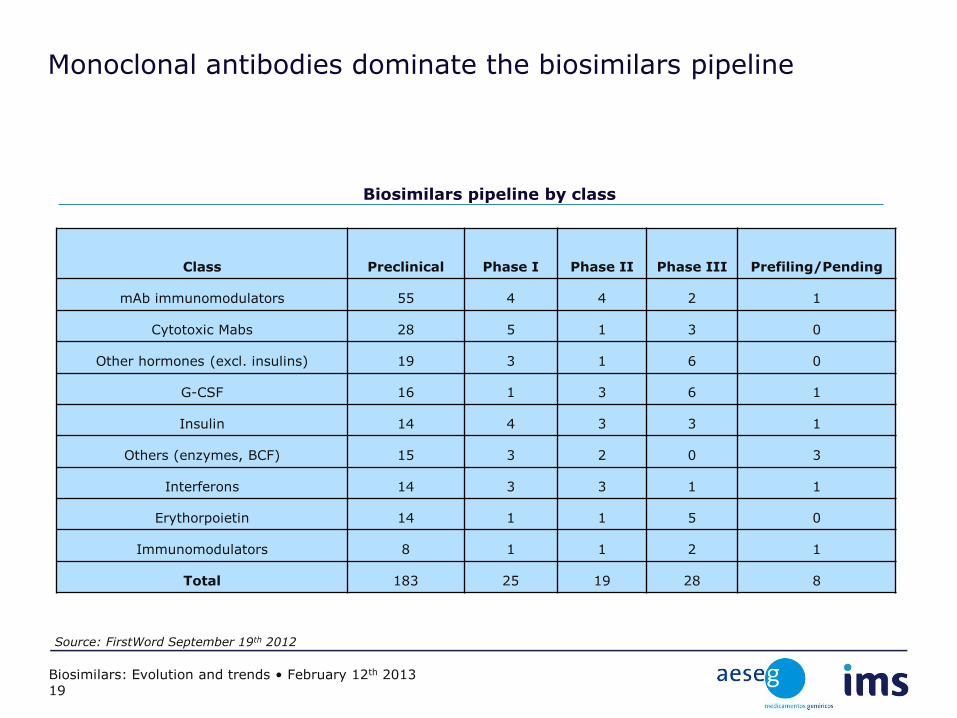
Monoclonal antibodies dominate the biosimilars pipeline
Class Preclinical Phase I Phase II Phase III Prefiling/Pending
mAb immunomodulators 55 4 4 2 1
Cytotoxic Mabs 28 5 1 3 0
Other hormones (excl. insulins) 19 3 1 6 0
G-CSF 16 1 3 6 1
Insulin 14 4 3 3 1
Others (enzymes, BCF) 15 3 2 0 3
Interferons 14 3 3 1 1
Erythorpoietin 14 1 1 5 0
Immunomodulators 8 1 1 2 1
Total 183 25 19 28 8
Biosimilars pipeline by class
Source: FirstWord September 19th 2012
Biosimilars: Evolution and trends • February 12th 2013 19
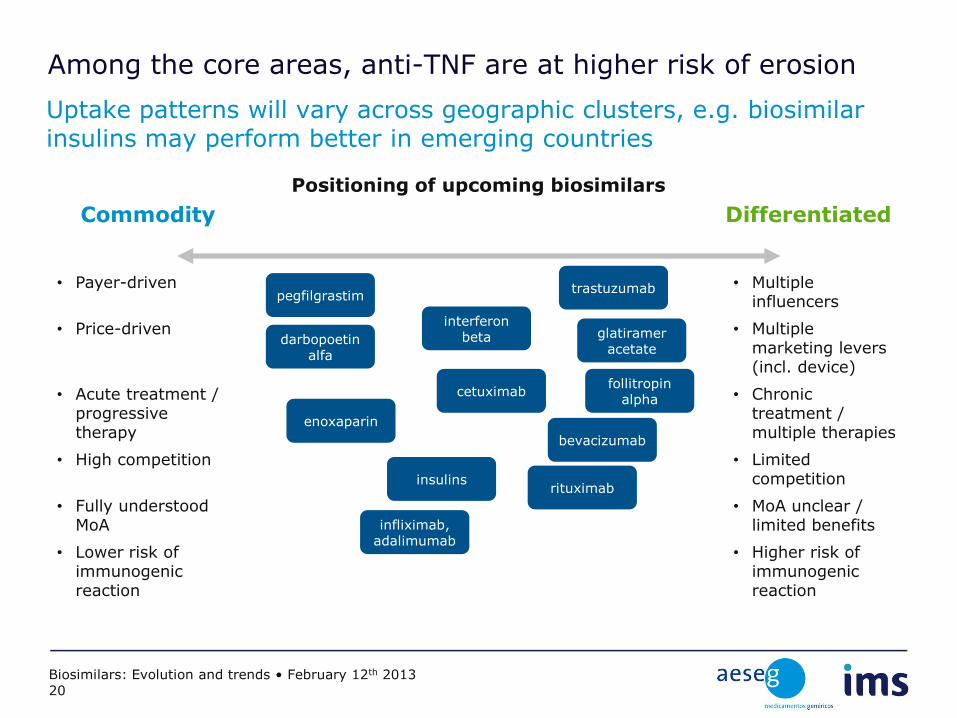
Among the core areas, anti-TNF are at higher risk of erosion
Uptake patterns will vary across geographic clusters, e.g. biosimilar insulins may perform better in emerging countries
• Payer-driven
• Price-driven
• Acute treatment / progressive therapy
• High competition
• Fully understood MoA
• Lower risk of immunogenic reaction
• Multiple influencers
• Multiple marketing levers (incl. device)
• Chronic treatment / multiple therapies
• Limited competition
• MoA unclear / limited benefits
• Higher risk of immunogenic reaction
Commodity Differentiated
Positioning of upcoming biosimilars
infliximab, adalimumab
rituximab
bevacizumab
cetuximab
interferon beta glatiramer
acetate darbopoetin
alfa
insulins
pegfilgrastim
enoxaparin
trastuzumab
follitropin alpha
Biosimilars: Evolution and trends • February 12th 2013 20
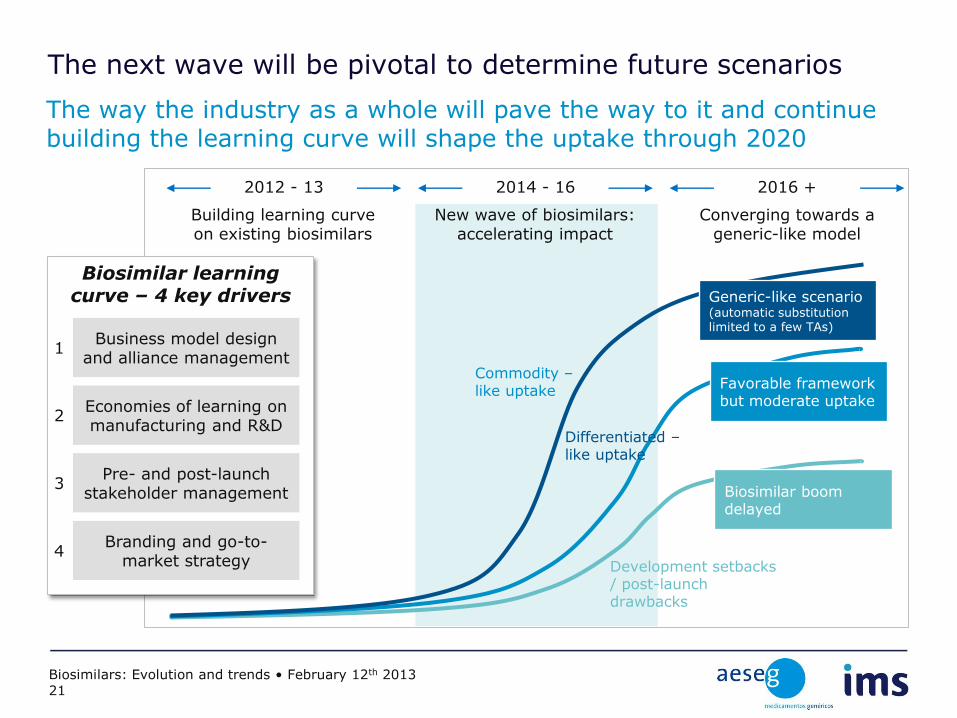
The next wave will be pivotal to determine future scenarios
The way the industry as a whole will pave the way to it and continue building the learning curve will shape the uptake through 2020
2014 - 16 2012 - 13 2016 +
Building learning curve on existing biosimilars
New wave of biosimilars: accelerating impact
Converging towards a generic-like model
Differentiated –like uptake
Commodity –like uptake
Development setbacks / post-launch drawbacks
Generic-like scenario (automatic substitution limited to a few TAs)
Favorable framework but moderate uptake
Biosimilar boom delayed
Biosimilar learning curve – 4 key drivers
Economies of learning on manufacturing and R&D
Branding and go-to-market strategy
Pre- and post-launch stakeholder management
Business model design and alliance management
1
2
3
4
Biosimilars: Evolution and trends • February 12th 2013 21
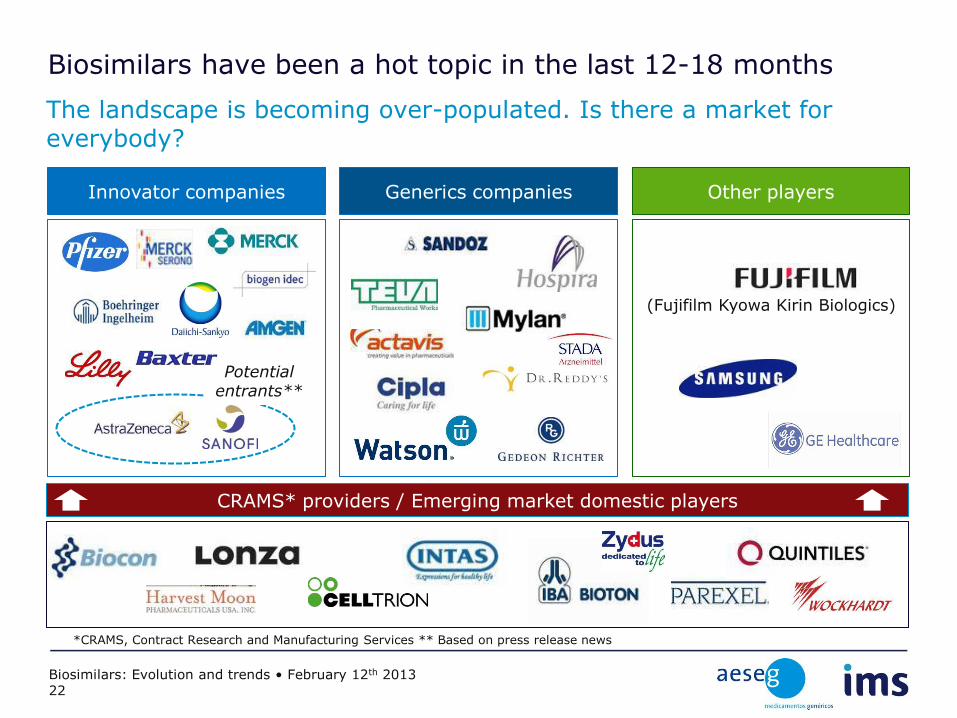
Biosimilars have been a hot topic in the last 12-18 months
The landscape is becoming over-populated. Is there a market for everybody?
Innovator companies Generics companies Other players
CRAMS* providers / Emerging market domestic players
*CRAMS, Contract Research and Manufacturing Services ** Based on press release news
Potential entrants**
(Fujifilm Kyowa Kirin Biologics)
Biosimilars: Evolution and trends • February 12th 2013 22
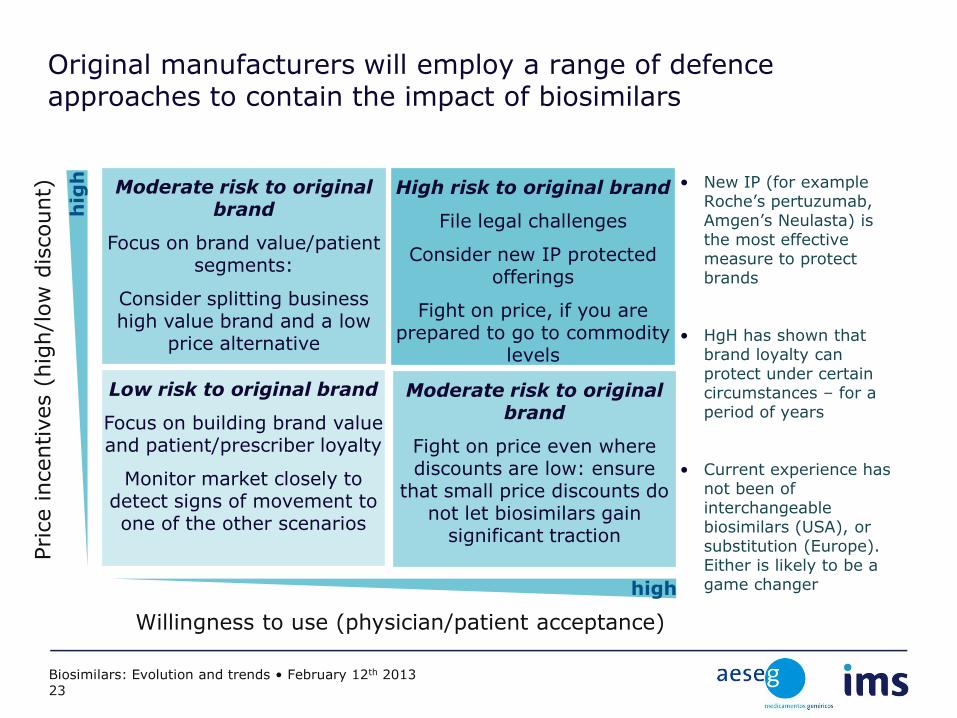
Original manufacturers will employ a range of defence approaches to contain the impact of biosimilars
Moderate risk to original brand
Focus on brand value/patient segments:
Consider splitting business high value brand and a low
price alternative
high
hig
h
High risk to original brand
File legal challenges
Consider new IP protected offerings
Fight on price, if you are prepared to go to commodity
levels
Moderate risk to original brand
Fight on price even where discounts are low: ensure
that small price discounts do not let biosimilars gain
significant traction
Low risk to original brand
Focus on building brand value and patient/prescriber loyalty
Monitor market closely to detect signs of movement to one of the other scenarios
• New IP (for example Roche’s pertuzumab, Amgen’s Neulasta) is the most effective measure to protect brands
• HgH has shown that brand loyalty can protect under certain circumstances – for a period of years
• Current experience has not been of interchangeable biosimilars (USA), or substitution (Europe). Either is likely to be a game changer
Price incentives (
hig
h/l
ow
dis
count)
Willingness to use (physician/patient acceptance)
Biosimilars: Evolution and trends • February 12th 2013 23
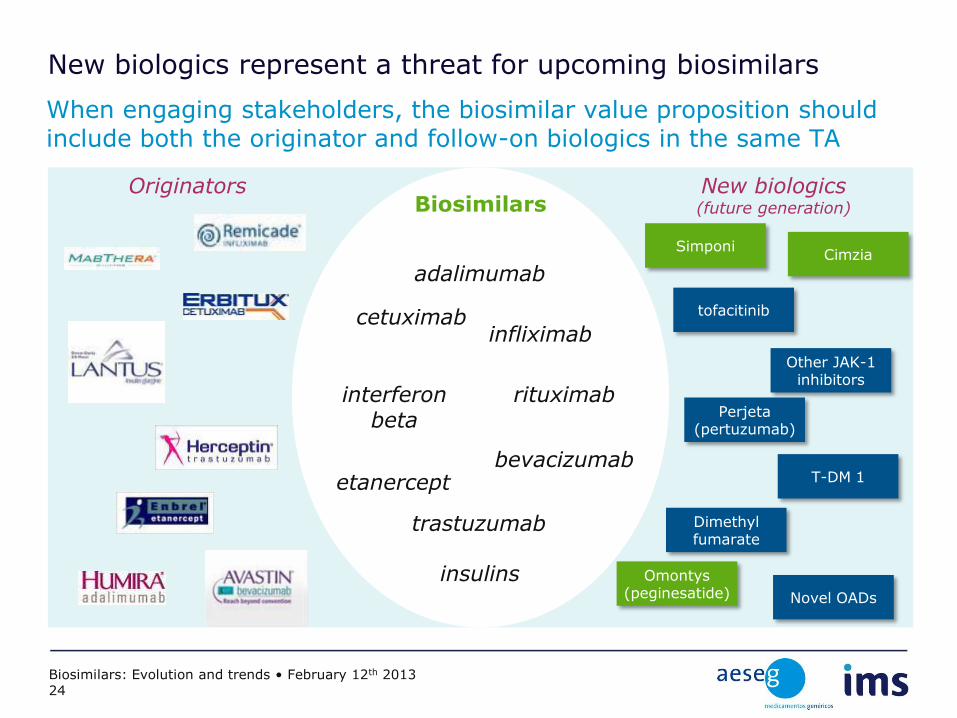
New biologics represent a threat for upcoming biosimilars
When engaging stakeholders, the biosimilar value proposition should include both the originator and follow-on biologics in the same TA
Biosimilars Originators New biologics
(future generation)
adalimumab
rituximab
trastuzumab
etanercept
infliximab
interferon beta
cetuximab
insulins
bevacizumab
Simponi Cimzia
Other JAK-1 inhibitors
Perjeta (pertuzumab)
T-DM 1
Novel OADs
tofacitinib
Omontys (peginesatide)
Dimethyl fumarate
Biosimilars: Evolution and trends • February 12th 2013 24
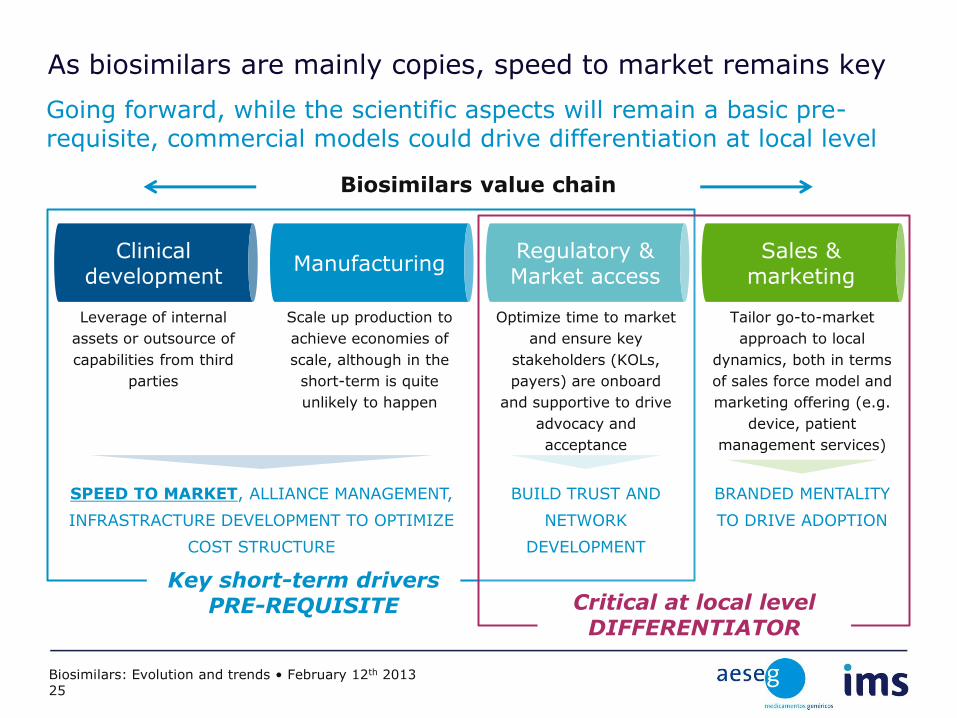
As biosimilars are mainly copies, speed to market remains key
Going forward, while the scientific aspects will remain a basic pre-requisite, commercial models could drive differentiation at local level
Clinical development
Manufacturing Regulatory & Market access
Sales & marketing
Biosimilars value chain
Leverage of internal
assets or outsource of
capabilities from third
parties
Optimize time to market
and ensure key
stakeholders (KOLs,
payers) are onboard
and supportive to drive
advocacy and
acceptance
Scale up production to
achieve economies of
scale, although in the
short-term is quite
unlikely to happen
Tailor go-to-market
approach to local
dynamics, both in terms
of sales force model and
marketing offering (e.g.
device, patient
management services)
SPEED TO MARKET, ALLIANCE MANAGEMENT,
INFRASTRACTURE DEVELOPMENT TO OPTIMIZE
COST STRUCTURE
BUILD TRUST AND
NETWORK
DEVELOPMENT
BRANDED MENTALITY
TO DRIVE ADOPTION
Critical at local level DIFFERENTIATOR
Key short-term drivers PRE-REQUISITE
Biosimilars: Evolution and trends • February 12th 2013 25

Go-to-market models are soon expected to transform
The evolving competitive arena and more complex biosimilars portfolios to manage will drive the transition
Biosimilar go-to-market evolution
First wave Second wave
Established market
Payer-driven model
Focus on creating awareness and building trust among stakeholders (payer focus)
Price-driven value proposition
Tender-based competition
Simple portfolio (maximum 3 products)
Branded specialty model
More complex portfolio to manage
Higher incidence of differentiated products
Increasing and more diverse competition (GenericCos and PharmaCos)
Go-to-market shifting towards branded infrastructure
Need to consider the broader marketing mix
Innovative go-to-market model?
Need to offset the value losses from price competition by growing demand pools (e.g. Expanded access, new developing geographies)
Promote one-stop-shop for affordable medicines (generics + biosimilars)
Shift focus away from drugs to solution (to differentiate the value proposition in a commodity-like environment) Go-to-market model
complexity
Biosimilars: Evolution and trends • February 12th 2013 26
Insert date here
Biosimilars: Evolution and trends
Dr. Gabriel Morelli, Country Manager Spain, IMS HEALTH