biomechanicalconstraints underlying motor primitives
TRANSCRIPT

Faculty Scholarship
2016
BiomechanicalConstraints Underlying Motor Primitives Derived BiomechanicalConstraints Underlying Motor Primitives Derived
from the Musculoskeletal Anatomy of the Human Arm from the Musculoskeletal Anatomy of the Human Arm
Valeriya Gritsenko
Russell L. Hardesty
Mathew T. Boots
Sergiy Yakovenko
Follow this and additional works at: https://researchrepository.wvu.edu/faculty_publications
Part of the Medicine and Health Sciences Commons

RESEARCH ARTICLE
Biomechanical Constraints Underlying MotorPrimitives Derived from the MusculoskeletalAnatomy of the Human ArmValeriya Gritsenko1,2,3, Russell L. Hardesty1,3, Mathew T. Boots2,3, Sergiy Yakovenko1,2,3*
1 Department of Human Performance, School of Medicine, West Virginia University, Morgantown, West
Virginia, 26506, United States of America, 2 Department of Mechanical and Aerospace Engineering,
Benjamin M. Statler College of Engineering and Mineral Resources, West Virginia University, Morgantown,
West Virginia, 26506, United States of America, 3 Centers for Neuroscience, School of Medicine, West
Virginia University, Morgantown, West Virginia, 26506, United States of America
AbstractNeural control of movement can only be realized though the interaction between the
mechanical properties of the limb and the environment. Thus, a fundamental question is
whether anatomy has evolved to simplify neural control by shaping these interactions in a
beneficial way. This inductive data-driven study analyzed the patterns of muscle actions
across multiple joints using the musculoskeletal model of the human upper limb. This
model was used to calculate muscle lengths across the full range of motion of the arm and
examined the correlations between these values between all pairs of muscles. Musculo-
skeletal coupling was quantified using hierarchical clustering analysis. Muscle lengths
between multiple pairs of muscles across multiple postures were highly correlated. These
correlations broadly formed two proximal and distal groups, where proximal muscles of the
arm were correlated with each other and distal muscles of the arm and hand were corre-
lated with each other, but not between groups. Using hierarchical clustering, between 11
and 14 reliable muscle groups were identified. This shows that musculoskeletal anatomy
does indeed shape the mechanical interactions by grouping muscles into functional clus-
ters that generally match the functional repertoire of the human arm. Together, these
results support the idea that the structure of the musculoskeletal system is tuned to solve
movement complexity problem by reducing the dimensionality of available solutions.
Introduction
Movements are the product of interactions between neural control signals and the musculo-skeletal dynamics that depend on limb anatomy [1]. This complex dynamical system dependson the active and passive forces that arise directly or indirectly frommuscle contractions andsegmental inertia, and requires complex control by the neural motor system. The skeletal limbstructure can simplify the control complexity, for example locomotor dynamics is stabilized by
PLOS ONE | DOI:10.1371/journal.pone.0164050 October 13, 2016 1 / 18
a11111
OPENACCESS
Citation: Gritsenko V, Hardesty RL, Boots MT,
Yakovenko S (2016) Biomechanical Constraints
Underlying Motor Primitives Derived from the
Musculoskeletal Anatomy of the Human Arm.
PLoS ONE 11(10): e0164050. doi:10.1371/journal.
pone.0164050
Editor: Kelvin E Jones, University of Alberta,
CANADA
Received: April 7, 2016
Accepted: September 19, 2016
Published: October 13, 2016
Copyright: © 2016 Gritsenko et al. This is an open
access article distributed under the terms of the
Creative Commons Attribution License, which
permits unrestricted use, distribution, and
reproduction in any medium, provided the original
author and source are credited.
Data Availability Statement: The minimal dataset
to recreate results and figures is posted at the
following site: Gritsenko, Valeriya, 2016,
"Replication Data for: Biomechanical constraints
underlying motor primitives quantified from the
musculoskeletal anatomy of the human
arm", doi:10.7910/DVN/58PLZ8, Harvard
Dataverse, V1 [UNF:6:NnKFETjajv2xxMBpk8Td
Gw==]
Funding: This research was sponsored by the U.S.
Army Research Office and the Defense Advanced
Research Projects Agency (DARPA) under

advantageous passive dynamics [2]. Musculoskeletal morphology has traditionally been viewedas an additional complexity with redundant characteristics that the central nervous system(CNS) is required to solve [3]. However, evidence has beenmounting for the simplifying roleof muscle anatomy through increased stability due to viscoelastic properties, which help resistperturbations [4–8]. These properties may even contribute to shaping the multidimensionaland state-dependent control parameter space for volitional movements in the “uncontrolledmanifold" theory [9]. In particular, Kutch and Valero-Cuevas have suggested that muscularanatomy may help reduce the dimensionality of control space through mechanical couplingeven in the absence of a common neural command [10]. However, the extent and topographyof muscle coupling across more than several muscles has not been previously described. In thecurrent study, we have used an inductive data-driven approach to further test this idea and toquantify the dimensionality reduction accomplished by the mechanical coupling of muscleactions across the physiological range of arm and hand postures using a validated dynamicmusculoskeletalmodel [11–13].
Muscles have been traditionally classified into agonist and antagonist pairs using theiranatomy [14,15] or innervation and participation in sensory-evokedactions [16,17]. Forexample, stimulation of sensory pathways activates ilia-psoas, tibialis anterior, and extensordigitorum longus that together participate in flexion of hip and ankle of the lower limb [7].Using this definition, excitation and inhibition patterns give the physiological binary mem-bership of muscles in mutually-opposing functional groups. This idea has been extended fur-ther to the concept of motor primitives or synergies, where a smaller subset of groupedmuscle actions can accomplish a variety of tasks [18–22]. Alternatively, the anatomical joint-based nomenclature can be used to identify muscle actions around specific joints. For exam-ple, the biceps brachii and triceps brachii act as antagonists around the elbow, because theformer causes elbow flexion, while the latter causes elbow extension. The latter definitiondoes not rely on neural activations and is purely due to the anatomy of muscle origins andinsertions on the bone and their moment arms around the joints. In this study, our goal wasto quantify mechanical coupling that underlies the basic functionality and dimensionality ofthe musculoskeletal system and represents the lowest hierarchical level of movement control.This coupling constrains neural actions and, thus, bears directly on the concept of motorprimitives or synergies.
Methods
Model
The musculoskeletalmodel based on the dynamic upper limb model created by Saul et al.(2015)[11] was constructed in OpenSim (version 3.0, Stanford University, Stanford, CA,USA) (Fig 1) and modified in several aspects. Separate bodies for each segment of the handdigits were created to recreate an additional 16 DOFs of the human hand. Metacarpals of dig-its 2 through 5 (index through little fingers) were modeled as a single body with the inertia ofa right rectangular prism. All carpometacarpal joints but the first one were represented by asingle wrist joint with 2 DOFs. These corresponded to the rotations between the fusedmeta-carpals 2–5 and ulna coordinate systems around the x-axis for flexion/extension (Fig 1C).Pronation and supination was achieved by the rotation of radius around ulna as in the pub-lished model. The first carpometacarpal joint of the thumb was modeled with 2 DOFs. Thesecorresponded to the rotations between the first proximal phalanx and radius coordinate sys-tems around the x-axis for flexion/extension and around the Z axis for abduction/adduction.A single DOF (flexion/extension)was assigned to all metacarpophalangeal joints corre-sponding to the rotations around the x-axes of the coordinate systems of the proximal
Musculoskeletal Constraints
PLOS ONE | DOI:10.1371/journal.pone.0164050 October 13, 2016 2 / 18
Cooperative Agreement Number W911NF-15-2-
0016 (http://www.darpa.mil). The views and
conclusions contained in this document are those
of the authors and should not be interpreted as
representing the official policies, either expressed
or implied, of the Army Research Office, Army
Research Laboratory, or the U.S. Government. The
U.S. Government is authorized to reproduce and
distribute reprints for Government purposes
notwithstanding any copyright notation hereon.
This study was also supported by National Institute
of Health, National Institute of General Medical
Sciences (NIH/NIGMS) U54GM104942 to RLH
(https://www.nigms.nih.gov). MTB was supported
by the Ruby Distinguished Doctoral Fellowship
(http://graduate.wvu.edu/funding-and-costs/
fellowships-and-scholarships/ruby-distinguished-
doctoral-fellowships). SY and VG were also
supported with salary support by the NIH/NIGMS
Centers of Biomedical Research Excellence
(CoBRE) award P20GM109098 (https://www.
nigms.nih.gov/research/crcb/IDeA/pages/COBRE.
aspx). The content is solely the responsibility of the
authors and does not necessarily represent the
official views of the NIH. The funders had no role in
study design, data collection and analysis, decision
to publish, or preparation of the manuscript.
Competing Interests: The authors have declared
that no competing interests exist.

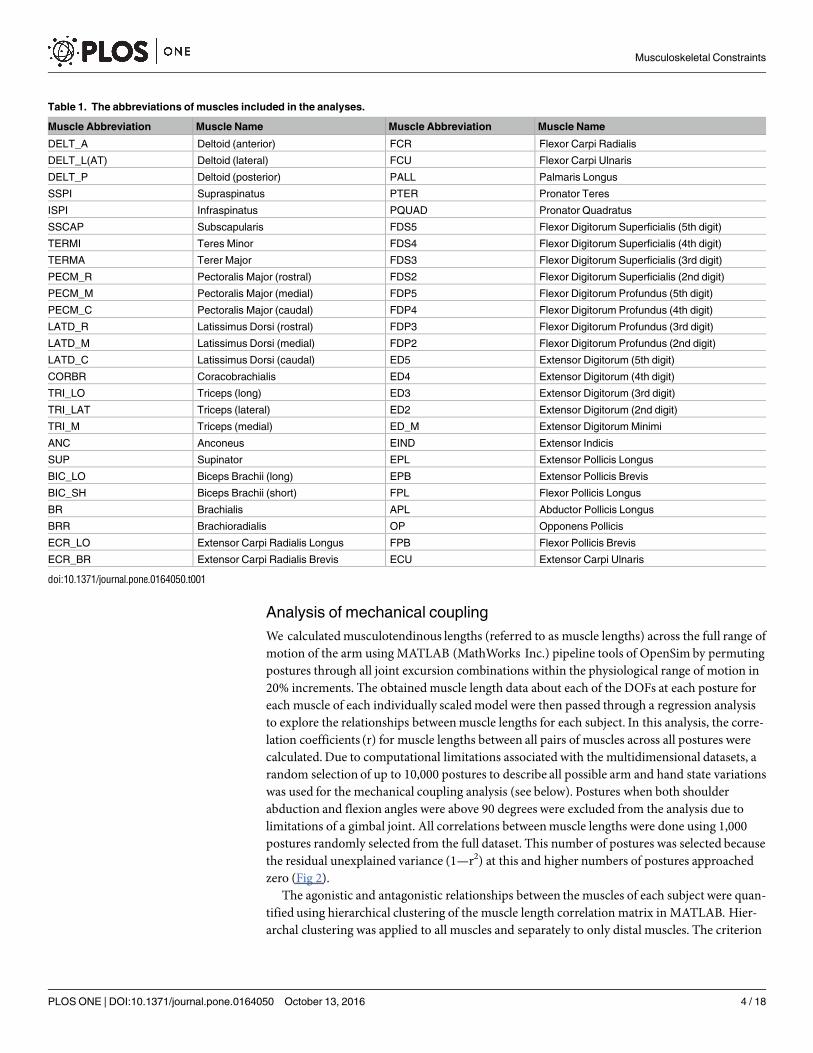
phalanges 2–5 and the correspondingmetacarpals (Fig 1C). Phalanges were modeled as cyl-inders with lengths and radii of a human subject. A single DOF (flexion/extension)wasassigned to all proximal and distal interphalangeal joints. The axes of rotations of all joints ofthe arm, with the exception of pronation/supination of the forearm, were adjusted to corre-spond to Euler angles between adjacent body Cartesian coordinate systems (Fig 1C) to maxi-mize the utility of this analysis for forward and inverse dynamics, where the motion isdescribed in terms of changes in joint Euler angles caused by muscle and inertial torques.The total number of model DOFs, including the arm and hand, was 23. The list of abbrevi-ated names of musculotendinous actuators included in the model and the muscles they rep-resent is in Table 1. Two intrinsic hand muscles, the Opponens Pollicis (OP) and FlexorPollicis Brevis (FPB), were added to the published model, with their origin and insertionpoints estimated from Gray’s anatomy [23].
Human subjects
This research was approved by theWest Virginia University Institutional ReviewBoards(IRBs) for Protection of Human Research Subjects (protocol number 1311129283A004).Informed written consent was obtained on the forms approved by IRBs from 10 healthy younghuman subjects. The subjects were 5 males and 5 females of mean age 26.2 ± 6.2 (standarddeviation, SD) years, mean weight 77.5 ± 14.1 kg, and mean height 1.74 ± 0.04 m. In additionto participant height and weight, the lengths of all major arm segments represented as individ-ual bodies in our model were measured (Table 1). These measurements were used to scale themodel (subject 0) to the dimensions of each individual (subjects 1–10). Each of the model seg-ments and origins and insertions of all muscles were scaled proportionally to the length of eachsubject’s segment [12].
Fig 1. Illustration of the model and local coordinate systems. (A) and (B) Musculotendinous paths from anatomical origins to insertions on the
skeleton are illustrated with red lines with selected labels. (C) Coordinate systems for each segment are illustrated with the color-coded cartesian
exes in red, yellow, and green for x-, y- and z-axes respectively. Euler angles around these axes represent joint angles. The illustrated posture of
the model corresponds to all joint angels at zero. The local coordinate systems are shown only for thumb and index finger. The coordinate systems
of the other digits follow the orientation of the coordinate systems for the index finger.
doi:10.1371/journal.pone.0164050.g001
Musculoskeletal Constraints
PLOS ONE | DOI:10.1371/journal.pone.0164050 October 13, 2016 3 / 18
Analysis of mechanical coupling
We calculatedmusculotendinous lengths (referred to as muscle lengths) across the full range ofmotion of the arm usingMATLAB (MathWorks Inc.) pipeline tools of OpenSim by permutingpostures through all joint excursion combinations within the physiological range of motion in20% increments. The obtainedmuscle length data about each of the DOFs at each posture foreach muscle of each individually scaledmodel were then passed through a regression analysisto explore the relationships betweenmuscle lengths for each subject. In this analysis, the corre-lation coefficients (r) for muscle lengths between all pairs of muscles across all postures werecalculated. Due to computational limitations associated with the multidimensional datasets, arandom selection of up to 10,000 postures to describe all possible arm and hand state variationswas used for the mechanical coupling analysis (see below). Postures when both shoulderabduction and flexion angles were above 90 degrees were excluded from the analysis due tolimitations of a gimbal joint. All correlations betweenmuscle lengths were done using 1,000postures randomly selected from the full dataset. This number of postures was selected becausethe residual unexplained variance (1—r2) at this and higher numbers of postures approachedzero (Fig 2).
The agonistic and antagonistic relationships between the muscles of each subject were quan-tified using hierarchical clustering of the muscle length correlation matrix in MATLAB. Hier-archal clustering was applied to all muscles and separately to only distal muscles. The criterion
Table 1. The abbreviations of muscles included in the analyses.
Muscle Abbreviation Muscle Name Muscle Abbreviation Muscle Name
DELT_A Deltoid (anterior) FCR Flexor Carpi Radialis
DELT_L(AT) Deltoid (lateral) FCU Flexor Carpi Ulnaris
DELT_P Deltoid (posterior) PALL Palmaris Longus
SSPI Supraspinatus PTER Pronator Teres
ISPI Infraspinatus PQUAD Pronator Quadratus
SSCAP Subscapularis FDS5 Flexor Digitorum Superficialis (5th digit)
TERMI Teres Minor FDS4 Flexor Digitorum Superficialis (4th digit)
TERMA Terer Major FDS3 Flexor Digitorum Superficialis (3rd digit)
PECM_R Pectoralis Major (rostral) FDS2 Flexor Digitorum Superficialis (2nd digit)
PECM_M Pectoralis Major (medial) FDP5 Flexor Digitorum Profundus (5th digit)
PECM_C Pectoralis Major (caudal) FDP4 Flexor Digitorum Profundus (4th digit)
LATD_R Latissimus Dorsi (rostral) FDP3 Flexor Digitorum Profundus (3rd digit)
LATD_M Latissimus Dorsi (medial) FDP2 Flexor Digitorum Profundus (2nd digit)
LATD_C Latissimus Dorsi (caudal) ED5 Extensor Digitorum (5th digit)
CORBR Coracobrachialis ED4 Extensor Digitorum (4th digit)
TRI_LO Triceps (long) ED3 Extensor Digitorum (3rd digit)
TRI_LAT Triceps (lateral) ED2 Extensor Digitorum (2nd digit)
TRI_M Triceps (medial) ED_M Extensor Digitorum Minimi
ANC Anconeus EIND Extensor Indicis
SUP Supinator EPL Extensor Pollicis Longus
BIC_LO Biceps Brachii (long) EPB Extensor Pollicis Brevis
BIC_SH Biceps Brachii (short) FPL Flexor Pollicis Longus
BR Brachialis APL Abductor Pollicis Longus
BRR Brachioradialis OP Opponens Pollicis
ECR_LO Extensor Carpi Radialis Longus FPB Flexor Pollicis Brevis
ECR_BR Extensor Carpi Radialis Brevis ECU Extensor Carpi Ulnaris
doi:10.1371/journal.pone.0164050.t001
Musculoskeletal Constraints
PLOS ONE | DOI:10.1371/journal.pone.0164050 October 13, 2016 4 / 18

for inclusion into distal (hand-related) or proximal (shoulder-related) clusters was the levelof muscle length correlation between the muscle of interest and either the muscles spanningthe shoulder joint or the muscles spanning the wrist joint in all subjects. For clustering, thecorrelation matrix was transformed into the heterogeneous variance explained (HVE) asdescribednext. The transformation ensured that agonist muscle pairs grouped together, i.e.had small distance values in proportion to shared variance, whereas antagonist musclesappeared relatively far apart, i.e. had larger distance values. Agonist muscles were character-ized by positive r-values, and antagonists were characterized by negative r-values. The coeffi-cient of determination (r2) was used in the HVE equation as the measure of shared variancebetween the changes in lengths of muscle pairs. The HVE for agonists was thus set to beequal to (1—r2), while the HVE for antagonists was equal to (1 + r2). This resulted in agonistmuscle pairs with large positive r-values being defined by short distances close to 0, whileantagonist muscle pairs with large negative r-values were defined by long distances close to 2.Zero or insignificant correlations were defined by intermediate distances close to 1. Hierar-chical clustering was applied using the linkage function with unweighted average distancemethod to the HVE matrix to identify between 2 and 20 clusters in each subject. The reliabil-ity of clustering was evaluated based on the number of muscles that did not fall into the samecluster across subjects. Trivial results with single-muscle clusters were excluded from the reli-ability analysis.
Unless otherwise stated, all data is referenced by mean ± SD.
Fig 2. The difference between r2 values for the correlations between muscle lengths as a function of the
number of selected postures. Error bars show standard deviations around the mean.
doi:10.1371/journal.pone.0164050.g002
Musculoskeletal Constraints
PLOS ONE | DOI:10.1371/journal.pone.0164050 October 13, 2016 5 / 18

Results
The musculoskeletalmodel comprised 52 musculotendinous actuators (model muscles) thatspanned 23 DOFs. Of the 52 actuators, 26 represented compartments of 7 muscles, e.g. 3 tri-ceps actuators representing long, lateral, and medial heads of the triceps brachii. Thus, themodel represented the anatomical arrangement of 33 individual muscles. There were 15 actua-tors that spanned only the shoulder joint (3 DOFs), 3 actuators that spanned both the shoulderand elbow (4 DOFs) joints, 6 actuators that spanned only the elbow joint (2 DOFs due to flex-ion-extension and pronation-supination), and 8 actuators that spanned both the elbow andwrist (3 DOFs, not including pronation/supination) joints, with the remaining 20 actuatorsspanning the wrist and at least 1 finger joint. Thus, most muscles were associated with severalDOFs. For example, the length of the pronator teres depends on the angles of forearm prona-tion/supination and elbow flexion/extension shown in Fig 3. The lengths of the actuatorschanged non-linearly as a function of the DOFs they controlled, as do their moment arms [24].This implies that a constant activation of a given muscle results in a different contribution ofthat muscle to the net joint torque when the arm is held at different postures or throughout themotion. These non-linearities are the result of complex anatomical paths that the muscles takeas they wrap around each joint, particularly joints with multiple DOFs.
The action of each musculotendinous actuator in the model depends on its attachment tothe bones and the path it takes around the joint. These data are based on human anatomicaldata [11]. To investigate the effect of individual skeletal proportions on mechanical coupling,the lengths of arm segment were scaled to the values from each of 10 human subjects. Thischanged the values for muscle lengths associated with each arm posture. The skeletal propor-tions across subjects varied with SD, ranging from 5% to 27% of the average segment length(Table 2). However, the relationships betweenmuscle lengths were highly stable across sub-jects, as described in detail in the following sections.
As expected, the muscle lengths across muscles were highly correlated in agonistic or antag-onistic fashion (Fig 4A). Positive correlations indicate that the muscle length increases ordecreases together, representing agonistic action across multiple arm postures (Fig 4B). Here,the method is limited to the examination under the isometric condition that does not take intoaccount dynamics or history-dependentmuscle properties [25–27]. Negative correlations indi-cate coincident increase of one muscle length while the other is decreased, representing antago-nistic action. Not surprisingly, the lengths of all actuators representing compartments of thesame muscle were highly correlated (bright yellow squares around the unity line in Fig 4A).Surprisingly, however, most of the muscles showed strong correlations that broadly formedtwo large clusters, where proximal muscles of the arm were correlated with each other and dis-tal muscles of the arm and hand were correlated with each other, but not as much with theproximal cluster. For example, the length of LATD_M was highly correlated with that ofPECM_C (r2 = 0.594), but the correlation with the distal cluster was minimal (r2 = 0.004 withFDP5). Similarly, the length of ED5 was highly correlated with that of ED_M (r2 = 0.793), butthe correlation with the proximal cluster was minimal (r2 = 0.004 with LATD_C). This is thefirst time the agonistic and antagonistic actions of muscles have been quantified across thewhole workspace of the human arm.
The hierarchical clustering analysis of muscle lengths quantitatively identifiedmusclegroups at multiple levels of detail. The first 2 clusters in all subjects represented broadly flexorand extensor actions across all joints or DOFs (Fig 5C, dark blue and red clusters emanatingfrom the center). However, two groups were insufficient for the consistent classification of allmuscles across subjects. Somemuscles may be classified differently for different subsets of sub-jects. For example, the subgroup that contains latissimus dorsi and pectoralismajor was
Musculoskeletal Constraints
PLOS ONE | DOI:10.1371/journal.pone.0164050 October 13, 2016 6 / 18

clustered either with extensors in 5 out of 11 subjects or with flexors in the rest of the subjects(see Fig 5C, subgroup marked � in two different subjects). Note that the composition of this
Fig 3. Examples of muscle lengths for the pronator teres, a single 2-DOF muscle originating on the
humerus and attaching on the radius, in two subjects. The data points (circles) correspond to muscle
lengths throughout the physiological range of motion for each DOF.
doi:10.1371/journal.pone.0164050.g003
Musculoskeletal Constraints
PLOS ONE | DOI:10.1371/journal.pone.0164050 October 13, 2016 7 / 18

subgroup remained unchanged. The separate analysis of distal musculature showed the samepattern of clusters as the analysis of all muscles. For example, the same subgroup consisting ofthumb muscles remained unchanged in both analyses (see Fig 5C, subgroup marked ^ in thesame subject).
The consistency of muscle cluster assignment across subjects changes as a function of thenumber of clusters selected in the analysis (Fig 6). The number of unclassifiedmuscles was gen-erally high whenmuscles were divided into 3 to 8 clusters, which means less consistent clustersacross subjects (Fig 6A). This followed by a plateau of 9 to 13 more consistent clusters, inwhich the same muscle groups were identified across subjects. Further subdivision into morethan 13 clusters generated increasingly more trivial results with single-muscle clusters, which isevidencedby increasing normalized number of unclassifiedmuscles (Fig 6A, right plot). Whenthe inclusion threshold for cluster assignment across subjects was increased from 50% (musclebelongs to the same cluster in 50% of subjects) to 100% (muscle belongs to the same cluster inall subjects), the number of unclassifiedmuscles changed for the different numbers of clusters.All muscles were classified into the same clusters in at least half of all subjects when 2 or 9–16clusters were selected (Fig 6A, dark blue line). The increase in the inclusion threshold to 100%,i.e. the muscle had to belong to the same cluster across all subjects, increased the peak numberof unclassifiedmuscles from 15 to 30 (Fig 6A red line on left plot). The most reliable numberof clusters, based on the minimal number of unclassifiedmuscles across all thresholds, was 11(Fig 6A, black arrows). Normalizing the number of unclassifiedmuscles to cluster size did notchange this estimate (Fig 6A, right). Similar trends were seen in the reliability of clustering ofdistal muscles (Fig 6B). Here, the most reliable number of clusters was 6 (Fig 6B, black arrows).This analysis identified the minimum number of reliable clusters, which are illustrated on the
Table 2. The summary of anthropometric measurements. All distance measurements, unless indicated
otherwise in brackets, were made between the estimated centers of joint rotation.
Segment name Length (m) Length (% of subject height)
Thorax 0.217 ± 0.032 12.5 ± 1.9
Shoulder (between clavicle and scapula acromial tip) 0.194 ± 0.016 11.2 ± 0.8
Humerus 0.279 ± 0.026 16.1 ± 1.4
Ulna 0.262 ± 0.014 15.1 ± 0.8
Radius 0.262 ± 0.014 15.1 ± 0.8
Hand (mean metacarpal length of phalanges 2–5) 0.085 ± 0.009 4.9 ± 0.5
First metacarpal 0.046 ± 0.009 2.7 ± 0.5
First proximal phalanx 0.0369 ± 0.004 2.1 ± 0.3
First distal phalanx 0.0276 ± 0.004 1.6 ± 0.2
Second proximal phalanx 0.046 ± 0.005 2.7 ± 0.2
Second middle phalanx 0.028 ± 0.003 1.6 ± 0.1
Second distal phalanx 0.023 ± 0.002 1.3 ± 0.1
Third proximal phalanx 0.048 ± 0.009 2.8 ± 0.5
Third middle phalanx 0.033 ± 0.004 1.9 ± 0.2
Third distal phalanx 0.024 ± 0.002 1.4 ± 0.1
Forth proximal phalanx 0.043 ± 0.010 2.5 ± 0.0
Forth middle phalanx 0.031 ± 0.005 1.8 ± 0.2
Forth distal phalanx 0.023 ± 0.002 1.3 ± 0.0
Fifth proximal phalanx 0.035 ± 0.008 2 ± 0.4
Fifth middle phalanx 0.023 ± 0.006 1.3 ± 0.3
Fifth distal phalanx 0.012 ± 0.003 1.1 ± 0.2
doi:10.1371/journal.pone.0164050.t002
Musculoskeletal Constraints
PLOS ONE | DOI:10.1371/journal.pone.0164050 October 13, 2016 8 / 18

Fig 4. Examples of the correlations between muscle lengths in a single subject. Only significant
correlations are plotted (p < 0.05). (A) Pearson correlation coefficient (r) between muscle lengths of all
muscle pairs. Blue colors indicate negative correlations; yellow colors indicate positive correlations. (B)
Histogram of r-values for each subject across all muscle pairs. The bar plots are binned with 0.2 increments,
and only significant values were included in the analysis.
doi:10.1371/journal.pone.0164050.g004
Musculoskeletal Constraints
PLOS ONE | DOI:10.1371/journal.pone.0164050 October 13, 2016 9 / 18

Musculoskeletal Constraints
PLOS ONE | DOI:10.1371/journal.pone.0164050 October 13, 2016 10 / 18

Fig 5. Hierarchical clustering methodology and examples for two subjects. (A) Geometric illustration of heterogenous variance
explained (HVE). HVE distance is determined by the correlations of musculotendon length between muscle pairs determined by the
equation in (B). (B) The equation for calculating HVE distance. The negative regressions (r-) indicate opposite or antagonistic actions of
muscle pairs, when the positive ones (r+) correspond to the synergistic or agonistic actions. Insert shows a histogram of HVE values for
one subject across all muscle pairs. (C) Examples of hierarchical clustering for individual subjects. Clustering across all muscles is
shown in the top two polar dendrograms. The bottom plot shows clustering across only the distal muscles for one of the subjects. Lines
emanating from the center indicate the distance between muscle clusters calculated from HVE. The main agonist-antagonist division can
be established using a high clustering threshold (2 clusters with dark red and dark blue lines), and further subdivisions are revealed by
the progressive lowering of the threshold. Example matching clusters are marked by outside brackets with * or ^.
doi:10.1371/journal.pone.0164050.g005
Fig 6. Reliability of clustering across subjects. (A) The average number of unclassified muscles is shown as a
function of the number of clusters. Each colored line corresponds to the level of stringency for the variability in
classification across subjects, e.g. 100% stringency corresponds to the same classification in all subjects. The
right panel shows the same values normalized to the average number of muscles in all clusters. (B) The same
analysis as in A for distal muscles only. Vertical black arrow indicates the nontrivial minimum for the number of
clusters (11 clusters for all and 6 clusters for distal muscles), which represents the most reliable number of muscle
clusters.
doi:10.1371/journal.pone.0164050.g006
Musculoskeletal Constraints
PLOS ONE | DOI:10.1371/journal.pone.0164050 October 13, 2016 11 / 18

mean polar dendrogram across all subjects in Fig 7. These clusters of muscles that span multi-ple joints represent the simplest actions that can be accomplished throughmechanicalcoupling.
Discussion
In this work, we have described for the first time the low-dimensional structure of agonistic orantagonistic mechanical actions, termed the mechanical coupling, of major arm and hand mus-cles across their physiological range of motion.We demonstrated that a low-dimensional struc-ture emerges even from the musculoskeletal anatomy without the presence of common neuralfeedforward or feedback signals (Fig 7). We found that there exists an optimal range for thenumber of clusters that reliably group muscles according to actions (Fig 6). Thus, these resultsmay help us address the unresolved controversies associated with the definition of motor
Fig 7. Mean hierarchical clustering across all subjects. The polar dendrogram illustrates hierarchical
clustering as described in Fig 5C. Inserts along the perimeter illustrate the directions of motion (green arrows)
produced by the activation of muscles in the model shown in Fig 1. Only muscles that belong to the corresponding
cluster are shown on each insert.
doi:10.1371/journal.pone.0164050.g007
Musculoskeletal Constraints
PLOS ONE | DOI:10.1371/journal.pone.0164050 October 13, 2016 12 / 18

primitives by detailing the lowest level in the bottom-up organization of the motor control sys-tem. This mechanical coupling betweenmuscles defines the natural repertoire of actions thatthe musculoskeletal system can produce in presence of inertial and gravitational forces, exter-nal perturbations, and neural control signals. Therefore, our results provide further evidence tosupport the idea that musculoskeletal anatomy helps to reduce the dimensionality of controlspace through the mechanical coupling [4–8,10].
One prevalent theoretical explanation of how the nervous system resolves limb controlproblems is based on the idea of motor primitives, i.e. groups of muscles sharing the same com-mon source of neural activation [19–22]. Inherent in this concept is the idea that motor primi-tives reduce the complexity of neural control signals by enabling the production of anymovement from a smaller selection of control actions [19,20]. However, the theory of motorprimitives, or synergies, defined this way has recently come under increased scrutiny due to theindivisible interaction and mutual dependency between neural control of muscle activationsand biomechanics of the resulting movement [28]. These interactions and dependenciesmayemerge in the synergy analyses when limb movement engages sensory feedback frommechani-cally coupled muscle groups [8] or, alternatively, constitute evidence for common feedforwarddrive within neural code [29–31]. The common neural drive would also originate if the neuralnetworks are embeddingmovement dynamics for processing motor commands. The conceptof central pattern generators (CPG) in the spinal cord, in particular, is a representative exampleof low-dimensional neural processing for rhythm generation that is coupled to mechanicaloscillations between limbs and the environment to produce locomotion [6]. Also, the evolvingpredominant view is that neural processing can be represented by a dynamical system actingthrough available neuromuscular elements to generate appropriate signals for desiredmove-ments [32]. Taken together, neural activity within the hierarchical CNS contains the represen-tation of downstream processing that may reflect the low-dimensional representations oftargeted mechanisms resulting in neural signals consistent with the idea of common drive.
The neuromechanical tuning may be used to redefinemotor primitives in terms of individ-ual actions being controlled. The hierarchal structure of both the neural motor system and themechanical coupling implies that the control complexity can be broken down into specificactions produced by common signals to muscle groups at different levels of the identifiedmechanical coupling hierarchy. Then, CPGs in the spinal cord, which are modeled as a dynam-ical system [1], could be viewed as neural motor primitives that are entrained with the invertedpendulum oscillator formed by the mechanical interactions of limbs with the ground [6,33,34].Because the entraining originates in the sensors associated with muscles, the musculoskeletalorganization has bearing on this unit of control. The CPG generates antagonistic activity thatresults in gross mechanical oscillatory actions through interactions between antagonisticgroups of muscles [35]. The CPGs are also thought to contribute to armmotor control[6,33,34,36,37]. The antagonistic groups observed in our analysis as the first two clusters in themechanical coupling diagrammay reflect the same concept (Fig 5C). When dexterous move-ments are required, e.g. to step over obstacles during locomotion or reaching, the gross CPGmotor primitive must be fractioned into smaller components specific to the task [30]. In ouranalysis, this would be equivalent to following the polar dendrogram from the center with grossrepresentations to peripherywith fractured fine representations (Fig 7). The neighboring finemotor primitives in our analysis could be combined to represent functionalmovements.Defensive limb movements can be generated by three combinations of 10, 5, and 6 groups;feedingmovement can arise from the recruitment of all groups in 6–8; and the manipulationmovements can be generated by four combinations 2, 6, and 11, followed by 7 for grasping.While these combinations are qualitatively similar to those observed in response to the long-
Musculoskeletal Constraints
PLOS ONE | DOI:10.1371/journal.pone.0164050 October 13, 2016 13 / 18

train intracorticalmicrostimulation of the motor cortex [38–40], the link between neural activ-ity and the composition of coupled muscle groups remains to be tested in future studies.
Another result in this study is the salient separation betweenmuscle motor primitives ofproximal and distal arm joints. This is unexpected, because the subsets of proximal and distalmuscles span the same elbow joint and contribute to pronation/supination DOF. Only sparsecorrelations between the pairs of muscles spanning primarily proximal and primarily distaljoints are present in our study (Fig 4). This result indicates that the anatomical arrangement ofmuscles is consistent with the idea of two distinct control targets: proximal arm and distalhand groups. Coincidentally, the spatiotemporal separation between the activation of proximaland distal muscles is present in goal-directed reaching movements that are traditionally sepa-rated into two phases: gross armmotion to transport the hand to the desired location and finehand motion to manipulate objects. It has also been suggested that these phases are controlledseparately by the nervous system [41,42]. Such muscle organization and the possible separationwithin neural control pathways may be the result of evolutionarily-driven expansion of distalmusculature to enable the increased dexterity of object manipulation characteristic of primates.The spatiotemporal separation of muscle activity during limb transfer, generally controlled byproximal muscles, and limb placement, generated by distal musculature, is also evident in theregulation of evolutionarily connected phases of reaching movement and precise modificationsin quadruped stepping. Moreover, these separate temporal phases are correlated to the activityof distinct corticospinal circuits [30].
Our analysis uses the incidence of length excursions in different postures as a measure offunctional similarity in muscle actions. The analysis is based on sampling representative pos-tures within the physiological range of motion (ROM); yet, this posture space may not be func-tionally homogenous. It included both likely and unlikely joint configurations based on thefrequency of observing their representation in daily use [43,44]. For these subsets of joint con-figurations there may exist distinct relationships within subsets of muscles. The method of uni-form sampling used here may not capture the coupling or uncoupling among the muscle pairswithin these subsets of likely and unlikely postures. Then there may also be a subset of muscleswith changing relationships within different postures. Because these muscle pairs would havelow correlations in our analysis, the only groups that could be affected would be those associ-ated with the weak relationships between antagonistic muscles acting on scapular (groups 3 &5 of Fig 7). Fig 4 shows that these are the only large groups with r-values within medium to lowcorrelations, i.e. between -0.5 and 0.5 values, that may be affected. It is tempting to speculatethat the proximal armmuscles may change their functional affiliation based on the familiaritywith task. This could be reflected in different biomechanical advantages or affordances thatinfluencemovement planning [45]. This question will be addressed in the future research. Inthe presented analysis, the correlations across postures indicate the shared dependence on jointconstraints to define functionally similar muscles over the full physiological ROM that includesall possible limb postures with the exclusion of extremes.
Severalmethods are commonly used to derive motor primitives frommuscle activity, andall rely on extracting shared signal redundancy among neural discharge and/or muscle activity[21,30,46–49]. Cumulatively, these studies support the idea that muscle motor primitives arereflected in the neural activity; however, the confounding factors may offer alternative explana-tions for coupled activity [8,10,50]. The mechanical coupling derived from the correlations ofmuscle lengths across physiological postures qualitatively matches the groups observed in thedecomposition analyses. For example, the biceps long, brachioradialis, brachialis, and pronatorteres are in the same muscle group 6 (Fig 7) and are also part of theW1 synergy identifiedwithtime-varying synergy analysis [51]. Similarly, the teres major and latissimus dorsi are part of asingle muscle group 3 and posterior deltoid is a part of an adjacent group 5 identified through
Musculoskeletal Constraints
PLOS ONE | DOI:10.1371/journal.pone.0164050 October 13, 2016 14 / 18
the mechanical coupling analysis (Fig 7) and are also part of theW5 synergy identifiedwithtime-varying synergy analysis [51]. This result is consistent with observations that the underly-ing musculoskeletal dynamics can constrain the space of neural commands to a low-dimen-sional subspace identifiedwith decompositionmethods [10]. Thus, the existence of themechanical coupling of muscles generally agrees with the findings of alternative methods.
In conclusion, our analysis of arm and hand muscles is a quantitative description of thefunctional organization within the musculoskeletal system that contributes to the concept ofmotor primitives. The organization of movement derived from the musculoskeletal architec-ture offers a novel perspective on the motor control problem solved by CNS.
Acknowledgments
The authors wish to thank Drs. Robert Gaunt and Lee Fischer, and Mr. Anton Sobinov fortheir contributions to the discussion of analysis in this study.
Author Contributions
Conceptualization: SY VG.
Data curation:VG RH SY.
Formal analysis:VG RH SY.
Funding acquisition: SY VG RH.
Investigation: VG SY.
Methodology:SY VG RHMB.
Project administration: SY.
Resources:VG SY.
Software:VG SY.
Supervision:SY VG.
Validation: VG SYMB.
Visualization:VG RH.
Writing – original draft:VG SY.
Writing – review& editing: SY VG MB RH.
References1. Yakovenko S. A hierarchical perspective on rhythm generation for locomotor control. Prog Brain Res.
2011; 188: 151–166. doi: 10.1016/B978-0-444-53825-3.00015–2 PMID: 21333808
2. Collins S, Ruina A, Tedrake R, Wisse M. Efficient bipedal robots based on passive-dynamic walkers.
Science. 2005; 307: 1082–1085. doi: 10.1126/science.1107799 PMID: 15718465
3. Bernstein NA. The co-ordination and regulation of movements. First English edition. Pergamon Press
Ltd; 1967. doi: 10.1234/12345678
4. Asatryan D, Feldman AG. Functional tuning of the nervous system with control of movements or main-
tenance of a steady posture: I. Mechanographic analysis of the work of the joint on execution of a pos-
tural tasks. Biophysics. 1965; 10: 925–935.
5. Brown IE, Loeb GE. A Reductionist Approach to Creating and Using Neuromusculoskeletal Models.
Biomechanics and Neural Control of Posture and Movement. New York, NY: Springer New York;
2000. pp. 148–163. doi: 10.1007/978-1-4612-2104-3_10
Musculoskeletal Constraints
PLOS ONE | DOI:10.1371/journal.pone.0164050 October 13, 2016 15 / 18

6. Prochazka A, Yakovenko S. The neuromechanical tuning hypothesis. Prog Brain Res. 2007; 165:
255–265. doi: 10.1016/S0079-6123(06)65016-4 PMID: 17925251
7. Yakovenko S, Gritsenko V, Prochazka A. Contribution of stretch reflexes to locomotor control: a
modeling study. Biol Cybern. Springer-Verlag; 2004; 90: 146–155. doi: 10.1007/s00422-003-0449-z
PMID: 14999481
8. Valero-Cuevas FJ, Cohn BA, Yngvason HF, Lawrence EL. Exploring the high-dimensional structure of
muscle redundancy via subject-specific and generic musculoskeletal models. J Biomech. 2015; 48:
2887–2896. doi: 10.1016/j.jbiomech.2015.04.026 PMID: 25980557
9. Latash ML, Scholz JP, Schoner G. Motor control strategies revealed in the structure of motor variabil-
ity. Exer sport sci rev. 2002; 30: 26–31.
10. Kutch JJ, Valero-Cuevas FJ. Challenges and new approaches to proving the existence of muscle syn-
ergies of neural origin. Diedrichsen J, editor. PLoS Comput Biol. Public Library of Science; 2012; 8:
e1002434. doi: 10.1371/journal.pcbi.1002434 PMID: 22570602
11. Saul KR, Hu X, Goehler CM, Vidt ME, Daly M, Velisar A, et al. Benchmarking of dynamic simulation
predictions in two software platforms using an upper limb musculoskeletal model. Computer Methods
in Biomechanics and Biomedical Engineering. Taylor & Francis; 2015; 18: 1445–1458. doi: 10.1080/
10255842.2014.916698 PMID: 24995410
12. Delp SL, Anderson FC, Arnold AS, Loan P, Habib A, John CT, et al. OpenSim: open-source software
to create and analyze dynamic simulations of movement. IEEE Trans Biomed Eng. 2007; 54: 1940–
1950. doi: 10.1109/TBME.2007.901024 PMID: 18018689
13. Thelen DG, Anderson FC. Using computed muscle control to generate forward dynamic simulations of
human walking from experimental data. J Biomech. 2006; 39: 1107–1115. doi: 10.1016/j.jbiomech.
2005.02.010 PMID: 16023125
14. Lombard WP. The Action of Two-Joint Muscles. American Physical Education Review. 1903; 8: 141–
145. doi: 10.1080/23267224.1903.10649915
15. Kuo AD. The action of two-joint muscles: the legacy of WP Lombard. In: Latash M, Zatsiorsky V, edi-
tors. Classics in Movement Science. Classics in movement science Champaign; 2001. pp. 289–315.
16. Sherrington CS. Reciprocal Innervation of Antagonistic Muscles. Fourteenth Note.-On Double Recip-
rocal Innervation. Proceedings of the Royal Society of London Series B. 1909; 81: 249–268. doi: 10.
2307/80379
17. Sherrington CS. Flexion-reflex of the limb, crossed extension-reflex, and reflex stepping and standing.
J Physiol. 1910; 40: 28–121. PMID: 16993027
18. Patla AE. Some characteristics of EMG patterns during locomotion: implications for the locomotor con-
trol process. J Mot Behav. 1985; 17: 443–461. PMID: 15140675
19. Giszter SF, Mussa-Ivaldi FA, Bizzi E. Convergent force fields organized in the frog’s spinal cord. J Neu-
rosci. 1993; 13: 467–491. PMID: 8426224
20. Bizzi E, Mussa Ivaldi F, Giszter S. Computations underlying the execution of movement: a biological
perspective. Science. 1991; 253: 287–291. PMID: 1857964
21. d’Avella A, Saltiel P, Bizzi E. Combinations of muscle synergies in the construction of a natural motor
behavior. Nat Neurosci. 2003; 6: 300–308. doi: 10.1038/nn1010 PMID: 12563264
22. Tresch MC, Saltiel P, Bizzi E. The construction of movement by the spinal cord. Nat Neurosci. 1999; 2:
162–167. doi: 10.1038/5721 PMID: 10195201
23. Gray H. Anatomy of the human body. 2000 ed. Lewis WH, editor. New York: Bartleby.com. ed. W. H.
Lewis. 20th edition. Philadelphia: Lea & Febiger; 1918.
24. Sartori M, Reggiani M, van den Bogert AJ, Lloyd DG. Estimation of musculotendon kinematics in large
musculoskeletal models using multidimensional B-splines. J Biomech. Elsevier; 2012; 45: 595–601.
doi: 10.1016/j.jbiomech.2011.10.040 PMID: 22176708
25. Joyce GC, Rack PM. Isotonic lengthening and shortening movements of cat soleus muscle. J Physiol.
Wiley-Blackwell; 1969; 204: 475–491. PMID: 5824648
26. Rack P, Westbury D. The short range stiffness of active mammalian muscle and its effect on mechani-
cal properties. J Physiol. 1974; 240: 331–350. PMID: 4424163
27. Gillard DM, Yakovenko S, Cameron T, Prochazka A. Isometric muscle length-tension curves do not
predict angle-torque curves of human wrist in continuous active movements. J Biomech. 2000; 33:
1341–1348. PMID: 10940392
28. Tresch MC, Jarc A. The case for and against muscle synergies. 2009; 19: 601–607. doi: 10.1016/j.
conb.2009.09.002 PMID: 19828310
Musculoskeletal Constraints
PLOS ONE | DOI:10.1371/journal.pone.0164050 October 13, 2016 16 / 18

29. Rana M, Yani MS, Asavasopon S, Fisher BE, Kutch JJ. Brain Connectivity Associated with Muscle
Synergies in Humans. J Neurosci. Society for Neuroscience; 2015; 35: 14708–14716. doi: 10.1523/
JNEUROSCI.1971-15.2015 PMID: 26538643
30. Yakovenko S, Drew T. Similar Motor Cortical Control Mechanisms for Precise Limb Control during
Reaching and Locomotion. J Neurosci. 2015; 35: 14476–14490. doi: 10.1523/JNEUROSCI.1908-15.
2015 PMID: 26511240
31. Overduin SA, d’Avella A, Roh J, Carmena JM, Bizzi E. Representation of Muscle Synergies in the Pri-
mate Brain. J Neurosci. Society for Neuroscience; 2015; 35: 12615–12624. doi: 10.1523/
JNEUROSCI.4302-14.2015 PMID: 26377453
32. Shenoy KV, Sahani M, Churchland MM. Cortical control of arm movements: a dynamical systems per-
spective. Annu Rev Neurosci. 2013; 36: 337–359. doi: 10.1146/annurev-neuro-062111-150509 PMID:
23725001
33. Taga G, Yamaguchi Y, Shimazu H. Self-organized control of bipedal locomotion by neural oscillators
in unpredictable environment. Biol Cybern. 1991; 65: 147–159. PMID: 1912008
34. Full RJ, Koditschek DE. Templates and anchors: neuromechanical hypotheses of legged locomotion
on land. J Exp Biol. 1999; 202: 3325–3332. PMID: 10562515
35. Yakovenko S, Mushahwar V, VanderHorst V, Holstege G, Prochazka A. Spatiotemporal activation of
lumbosacral motoneurons in the locomotor step cycle. J Neurophysiol. 2002; 87: 1542–1553. PMID:
11877525
36. Drew T, Marigold DS. Taking the next step: cortical contributions to the control of locomotion. Curr
Opin Neurobiol. 2015; 33: 25–33. doi: 10.1016/j.conb.2015.01.011 PMID: 25643847
37. Zehr EP, Balter JE, Ferris DP, Hundza SR, Loadman PM, Stoloff RH. Neural regulation of rhythmic
arm and leg movement is conserved across human locomotor tasks. J Physiol. 2007; 582: 209–227.
doi: 10.1113/jphysiol.2007.133843 PMID: 17463036
38. Graziano MSA, Taylor C, Moore T. Complex movements evoked by microstimulation of precentral cor-
tex. Neuron. 2002; 34: 841–851. doi: 10.1016/S0896-6273(02)00698-0 PMID: 12062029
39. Stepniewska I, Fang P-CY, Kaas JH. Organization of the posterior parietal cortex in galagos: I. Func-
tional zones identified by microstimulation. J Comp Neurol. 2009; 517: 765–782. doi: 10.1002/cne.
22181 PMID: 19852065
40. Graziano MSA, Aflalo TN. Mapping behavioral repertoire onto the cortex. Neuron. 2007; 56: 239–251.
doi: 10.1016/j.neuron.2007.09.013 PMID: 17964243
41. Jeannerod M, Paulignan Y, Weiss P. Grasping an object: one movement, several components. Novar-
tis Found Symp. 1998; 218: 5–16– discussion 16–20. PMID: 9949813
42. Kawato M, Samejima K. Efficient reinforcement learning: computational theories, neuroscience and
robotics. Curr Opin Neurobiol. 2007; 17: 205–212. doi: 10.1016/j.conb.2007.03.004 PMID: 17374483
43. Howard IS, Ingram JN, Kording KP, Wolpert DM. Statistics of natural movements are reflected in
motor errors. J Neurophysiol. American Physiological Society; 2009; 102: 1902–1910. doi: 10.1152/jn.
00013.2009 PMID: 19605616
44. Ingram JN, Kording KP, Howard IS, Wolpert DM. The statistics of natural hand movements. Experi-
mental brain research. Springer-Verlag; 2008; 188: 223–236. doi: 10.1007/s00221-008-1355-3 PMID:
18369608
45. Cos I, Duque J, Cisek P. Rapid prediction of biomechanical costs during action decisions. J Neurophy-
siol. American Physiological Society; 2014; 112: 1256–1266. doi: 10.1152/jn.00147.2014 PMID:
24899673
46. Krouchev N, Drew T. Motor cortical regulation of sparse synergies provides a framework for the flexible
control of precision walking. Front Comput Neurosci. Frontiers; 2013; 7: 83. doi: 10.3389/fncom.2013.
00083 PMID: 23874287
47. Cheung VCK, Piron L, Agostini M, Silvoni S, Turolla A, Bizzi E. Stability of muscle synergies for volun-
tary actions after cortical stroke in humans. Proc Natl Acad Sci USA. 2009; 106: 19563–19568. doi: 10.
1073/pnas.0910114106 PMID: 19880747
48. Tresch MC, Cheung VCK, d’Avella A. Matrix factorization algorithms for the identification of muscle
synergies: evaluation on simulated and experimental data sets. J Neurophysiol. 2006; 95: 2199–2212.
doi: 10.1152/jn.00222.2005 PMID: 16394079
49. Yakovenko S, Krouchev NI, Drew T. Sequential activation of motor cortical neurons contributes to
intralimb coordination during reaching in the cat by modulating muscle synergies. J Neurophysiol.
2011; 105: 388–409. doi: 10.1152/jn.00469.2010 PMID: 21068260
50. Kutch JJ, Kuo AD, Bloch AM, Rymer WZ. Endpoint force fluctuations reveal flexible rather than syner-
gistic patterns of muscle cooperation. J Neurophysiol. 2008; 100: 2455–2471. doi: 10.1152/jn.90274.
2008 PMID: 18799603
Musculoskeletal Constraints
PLOS ONE | DOI:10.1371/journal.pone.0164050 October 13, 2016 17 / 18

51. d’Avella A, Portone A, Fernandez L, Lacquaniti F. Control of fast-reaching movements by muscle syn-
ergy combinations. J Neurosci. 2006; 26: 7791–7810. doi: 10.1523/JNEUROSCI.0830-06.2006 PMID:
16870725
Musculoskeletal Constraints
PLOS ONE | DOI:10.1371/journal.pone.0164050 October 13, 2016 18 / 18