biomaterial approaches for cell-based therapies
TRANSCRIPT

Biomaterial Approaches for Cell-Based Therapies
A DISSERTATIONSUBMITTED TO THE FACULTY OF THE GRADUATE SCHOOL
OF THE UNIVERSITY OF MINNESOTABY
Daisy Phan Cross
IN PARTIAL FULFILLMENT OF THE REQUIREMENTSFOR THE DEGREE OF
DOCTOR OF PHILOSOPHY
Chun Wang, Adviser
October 2012

© Daisy Phan Cross 2012

i
Acknowledgements
First and foremost, I’d like to thank my advisor, Dr. Chun Wang, for his advice and guidance throughout the years. It was quite difficult to return back to graduate school after working in industry for more than eight years. I appreciate his taking a chance on an older, non-traditional student, and the very different kinds of baggage that came along with someone in my position. I thank him for his patience and understanding as I tended to all the various aspects of my life. I’m sure he’ll never forget the day when I came into his office and said, through tears, “We’ve been chosen for a last-minute adoption and I’m going to be a mom tomorrow…Oh, and I’ll be taking six weeks of maternity leave.”
I’d also like to thank my committee members—Dr. Robert Tranquillo, Dr. Wei Shen, and Dr. Jianyi (Jay) Zhang—for taking the time to review my work.
Thank you to all of the Wang Lab members with whom I’ve had the privilege of crossing paths: Noelle Palumbo, Dr. Lakshmi Nagarajan, Sunny Choh, Dave Panus, Weihang Ji, Xiao Zhong, Dr. Rupei Tang, Wenqing Han, Dr. Lixin Liu, Dr. Wenshou Wang, and Dr. Xiaoze Jiang and to the undergraduates who have assisted me, Nayi Wang, Kellin Krick, Chris Kuehl, and Saif Rahman. Sunny’s hyaluronic acid tutorials were invaluable, as was Dave’s microscopy and imaging help. Thank you, too, to the talented chemists of the Wang Lab—Weihang, Dr. Jiang, and Dr. Wang; without their help, a significant portion of this dissertation would not have been possible. Lastly, I cannot thank Wenqing enough for her help with the in vivo studies, histological staining, her willingness to work on weekends, and for her all-around moral support.
Many individuals provided technical assistance throughout the years, and for this, I am forever grateful. While some received proper acknowledgement at the end of each chapter, unfortunately some helped with projects that did not make it into this thesis. Thank you to everyone: Victor Lai (biomechanics, collagen gels, nanoindentation, cryoSEM), John Oja (confocal microscopy), Dominique Seetapun (phalloidin staining and microscopy imaging), Noelle Palumbo (mouse lymphocyte isolation), Sara Jouzdani (nanoindentation), Drs. Ye Lei and Qiang Xiong (porcine MSCs), Nathan

ii
Weidenhamer and Trevor Huynh (human MSCs), Krissy Morin (Cell Tracker), Chandru Ramasubramanian (Instron instrument), Ravali Raju and Siguang Sui (cell microcarriers and PNIPAm), Chris Fretham (cryoSEM), and David Giles (rheology).
I am grateful for the funding I received from an NIH Biotechnology Training Grant award (and the grant’s intellectual architect, Dr. Wei-Shou Hu) and from a University of Minnesota Doctoral Dissertation Fellowship.
Thanks to my friends and former colleagues from Medtronic who continue to include me in their “Team Building” gatherings, and for assuring me that my decision to leave industry and go back to graduate school was a sane one.
I’ve made many friends during my time at this university, but I would especially like to thank Victor Lai, Noelle Palumbo, and Clay Sheaff. In addition to his help with coursework and technical aspects of my research, Victor listened to my incessant complaints and became a valued friend. As a fellow mother-and-graduate-student, I valued Noelle’s advice and moral support. Mid-week game and movie nights with Clay helped remind me of the beneficial aspects and flexibility of the life of a graduate student. (I also appreciate his immense efforts to inform a certain Scottish actor of my existence.)
The support I’ve received from my parents, John and Tina; my sister, Rosie; and my in-laws, Jackie and Glen, has been invaluable. I’m not sure how I would have survived being a mother in graduate school without their help.
To my sweet son, Ian…thank you for being such a well-behaved two-year-old. After I graduate, I will work hard to decouple the words “Mamá” and “work.”
And last, but not least, thank you to Nathan for all of his encouragement and support throughout the years. Obtaining a doctoral degree was a lifelong goal of mine. Without him, I would not have had the courage to go back to school. Thank you, Nathan, for playing so many roles during our twenty years together—best friend, therapist, comic, house tech, single parent, personal chef, homework assistant, research advisor, thesis formatter—but, most importantly, for being my loving husband.

iii
Abstract
Cell-based therapy is a method to treat diseases by introducing new cells into an injured organ. The approach has been investigated for treatment of a range of ailments, including myocardial infarction. Therapeutic cells can be introduced in several ways, including the direct injection of exogenous cells and the injection of chemoattractant molecules that recruit endogenous cells. In the case of treating cardiovascular diseases, clinical studies in patients have shown that these cell-based therapies are generally safe, but have yet to show substantial efficacy in improving heart function.
A major hurdle facing the translation of cell therapy from the laboratory to the patient is that it is difficult to maintain a sufficient number of the therapeutic cells at the site into which they are recruited or injected. The work described in this dissertation, therefore, focused on biomaterial-based approaches to address the problems of poor recruitment, attachment, and retention of transplanted cells. First, biodegradable polymer microspheres were developed to release a chemoattractant molecule, SDF-1α, in a sustained manner and resulted in the successful recruitment of stem cells in vitro. Second, charged polymers were deposited onto cell surfaces and successfully demonstrated that the coatings modified the attachment of cells to surfaces. Lastly, two different types of hyaluronic acid-based hydrogels were developed that may be used to immobilize cells in a depot and improve cell retention at the site of injection: an environmentally-responsive chemically crosslinked hydrogel that gels based on in vivo physiology, and a physically crosslinked hydrogel that undergoes shear reversible gelation. The results of this body of work demonstrate in model systems the types of strategies that can be used to create biomaterials for cell-based therapies. These approaches may be implemented in the future to improve the clinical outcomes of these therapies.

iv
Table of Contents
Acknowledgements i
Abstract iii
Table of Contents iv
List of Figures viii
List of Tables xi
Chapter 1 | Introduction 1
1.1 Cell-Based Therapy for the Treatment of Disease 1
1.2 Biomaterials for Cell-Based Therapy Applications 2
1.2.1 Biomaterial microspheres for sustained release delivery of biologics 21.2.2 Biomaterials for cell surface engineering 41.2.3 Hydrogel biomaterials as cell delivery vehicles and retention depots 6
1.3 Statement of objectives and overview of this thesis 8
Chapter 2 | Stromal Derived Factor-1a Loaded PLGA Microspheres for Stem Cell Recruitment 10
2.1 Introduction 10
2.2 Materials and Methods 12
2.2.1 Materials 122.2.2 Fabrication of microspheres 132.2.3 Characterization of microspheres 13
2.2.3.1 Analysis of microsphere size 132.2.3.2 Determination of encapsulation efficiency 14

v
2.2.3.3 Characterization of the release of SDF-1a from microspheres 142.2.4 Stem cell migration assay 142.2.5 Statistical analysis 15
2.3 Results 16
2.3.1 Microsphere fabrication and release studies 162.3.2 Encapsulation efficiency 172.3.3 Microsphere sizing and morphology 182.3.4 Bioactivity of released SDF-1a� 18
2.4 Discussion 25
2.5 Conclusions 30
Chapter 3 | Layer-by-Layer Polyelectrolyte Assembly onto Cell Surfaces for Controlling Cell Adhesion 31
3.1 Introduction 31
3.2 Materials and Methods 34
3.2.1 Materials 343.2.2 Cell coating 343.2.3 Confocal fluorescence microscopy 353.2.4 Zeta potential measurements 363.2.5 Cell viability 363.2.6 Synthesis of HA pyridyl disulfide (PD) derivative 363.2.7 Chemical crosslinking of polymer coatings on cell surface 363.2.8 Preparation of attachment substrates 37
3.2.8.1 Charged surfaces 373.2.8.2 Extracellular matrix (ECM) mimic surfaces 37
3.2.9 Cell adhesion to surfaces 383.2.9.1 Cell adhesion to charged surfaces 383.2.9.2 Cell adhesion to ECM mimic surfaces 38
3.2.10 Persistence of cell coating 383.2.11 Statistical analysis 39
3.3 Results 39
3.3.1 Demonstration of polyelectrolyte coating on cells in 2-D and 3-D 393.3.2 Stabilization of cell coatings by chemical crosslinking 42

vi
3.3.3 Effect of coating on cell viability 433.3.4 Control of cell adhesion to substrates 453.3.5 Persistence of the cell coatings 47
3.4 Discussion 49
3.5 Conclusions 53
Chapter 4 | In situ Gelation of Hyaluronic Acid with Exogenous and Endogenous Thiols 54
4.1 Introduction 54
4.2 Materials and Methods 55
4.2.1 Chemicals 554.2.2 Synthesis of HA pyridyl dithiol (PD) derivative 554.2.3 In vitro gelation studies 564.2.4 In vivo gelation and tissue response studies 564.2.5 Gel dissolution experiments 574.2.6 Glutathione gelation experiments 574.2.7 Unconfined compression test 58
4.3 Results & Discussion 58
4.4 Conclusions 66
Chapter 5 | Injectable Hybrid Hydrogels of Hyaluronic Acid Crosslinked by Well-Defined Synthetic Polycations: Preparation and Characterization In Vitro and In Vivo 67
5.1 Introduction 67
5.2 Experimental Section 69
5.2.1 Chemicals 695.2.2 Polymer Synthesis 695.2.3 Assessment of physical state of HA and cation mixtures, and gel fraction
determination 705.2.4 Rheological characterization 715.2.5 Gel stability and gel fraction determination 715.2.6 In vitro cell encapsulation and cytotoxicity 725.2.7 In vivo assessments and histological analyses 73

vii
5.3 Results and Discussion 74
5.3.1 Qualitative assessment of physical states: HA and cation mixtures 745.3.1.1 Qualitative scoring of mixtures 745.3.1.2 Effect of solvent 775.3.1.3 Effect of polymer architecture 775.3.1.4 Effect of cationic arm length 78
5.3.2 Quantitative characterization of HA + 4PEG12 gels 795.3.2.1 Dynamic moduli measurements 795.3.2.2 Determination of shear reversible gelling behavior 82
5.3.3 Biological assessments 835.3.3.1 Cell encapsulation 835.3.3.2 Cytotoxicity 845.3.3.3 Microsphere retention 865.3.3.4 In vivo assessment 87
5.3.4 Hyaluronic-Based Physical Hydrogels for Biomedical Applications 89
5.4 Conclusions 90
Chapter 6 | Conclusions and Future Directions 91
6.1 Biomaterial microspheres for sustained release delivery of biologics 91
6.2 Biomaterials for cell surface engineering 92
6.3 Hydrogel biomaterials as cell delivery vehicles and retention depots 93
6.4 Combination approaches 95
References 96

viii
List of Figures
Chapter 1 | Introduction 1
Figure 1.1 Chemical structure of poly(lactide-co-glycolide) (PLGA). 3
Figure 1.2 Schematic of the W1/O/W2 solvent extraction/evaporation method to fabricate microspheres. 4
Figure 1.3 A schematic of the layer-by-layer (LbL) method as performed on inorganic surfaces. 6
Figure 1.4 Chemical structure of hyaluronic acid (HA). 7
Figure 1.5 Biomaterial strategies explored for cell-based therapies. 8
Chapter 2 | Stromal Derived Factor-1a Loaded PLGA Microspheres for Stem Cell Recruitment 10
Figure 2.1 Cumulative release of SDF-1a from PLGA microspheres. 17
Figure 2.2 Representative brightfield optical microscopy images of microspheres. 19
Figure 2.3 Histograms of microsphere particle size distribution. 20
Figure 2.4 Representative fluorescence microscopy images of the migration of GFP-expressing porcine MSCs to control samples. 21
Figure 2.5 The effect of TNFa pre-incubation on porcine MSC migration in response to SDF-1a. 22
Figure 2.6 Representative fluorescence microscopy images of the migration of GFP-expressing porcine MSCs to release samples from Formulation A microspheres. 23
Figure 2.7 Migration of porcine MSCs in response to microsphere release samples. 24
Chapter 3 | Layer-by-Layer Polyelectrolyte Assembly onto Cell Surfaces for Controlling Cell Adhesion 31
Figure 3.1 Schematic illustration of cell surface coating by the LbL method using poly-L-lysine (PLL) and hyaluronic acid (HA). 35
Figure 3.2 Confocal fluorescence and brightfield images of adherent T98G cells coated with fluorescently labeled PLL and HA. 40

ix
Figure 3.3 Confocal fluorescence and brightfield images of T98G cells coated in buffer suspension with fluorescently labeled PLL and HA. 41
Figure 3.4 Zeta potential measurements of T98G cells that were subjected to polyelectrolyte time course incubation studies. 42
Figure 3.5 The effect on cell surface coating stability by chemical crosslinking. 43
Figure 3.6 Fluorescence images of T98G cells stained with the LIVE/DEAD assay. 44
Figure 3.7 Adhesion of single (PLL) and double (PLL/HA) coated T98G cells to charged hydrogel substrates. 45
Figure 3.8 Adhesion of uncoated, single coated (PLL), double coated (PLL/HA), and double-coated/enzyme-treated (PLL/HA/HAase) T98G cells to ECM mimic substrates. 46
Figure 3.9 Zeta potential measurements for assessing the persistence of single (PLL) and double (PLL/HA) coatings on T98G cells during one week in culture. 47
Figure 3.10 Confocal fluorescence microscopy for assessing the persistence of single (PLL) coatings on T98G cells during one week in culture. 48
Figure 3.11 Confocal fluorescence microscopy for assessing the persistence of double (PLL/HA) coatings on T98G cells during one week in culture. 49
Chapter 4 | In situ Gelation of Hyaluronic Acid with Exogenous and Endogenous Thiols 54
Figure 4.1 Chemical structure of pyridyl-disulfide modified HA (HA-PD). 59
Figure 4.2 Explanted material one day after injections of mid MW HA-PD. 61
Figure 4.3 Proposed mechanism for gelation of HA-PD solutions in the presence of a free thiol. 63
Figure 4.4 Unconfined compression of explanted material from mid MW HA-PD injections. 64
Figure 4.5 Representative tissue sections showing H&E staining of explanted tissue at Day 3 post-injection. 65
Chapter 5 | Injectable Hybrid Hydrogels of Hyaluronic Acid Crosslinked by Well-Defined Synthetic Polycations: Preparation and Characterization In Vitro and In Vivo 67

x
Figure 5.1 Chemical structure of polymers that were synthesized (A) and a schematic illustration of hydrogel assembly (B). 75
Figure 5.2 Representative images of HA + 4PEG12 gel and control. 76
Figure 5.3 Storage and loss moduli of HA + 4PEG12 gel or HA control dissolved into different solvents. 80
Figure 5.4 Storage and loss moduli of different molecular weights of HA when combined with either 4PEG12 or PBS. 81
Figure 5.5 Shear reversible gelling behavior of the HA + 4PEG12 gel. 82
Figure 5.6 Cell Tracker Green-labeled hMSCs encapsulated into HA+4PEG12 gels in isotonic glucose solvent. 84
Figure 5.7 Cytotoxicity assessment of HA and 4PEG12 in hMSCs using the MTT assay. 85
Figure 5.8 In vivo distribution of blue polystyrene microbeads one day after subcutaneous injection. 86
Figure 5.9 Representative tissue sections showing H&E staining of explanted tissues. 87
Figure 5.10 Representative tissue sections showing positive ED-1 staining indicative of the inflammatory response. 88

xi
List of Tables
Chapter 2 | Stromal Derived Factor-1a Loaded PLGA Microspheres for Stem Cell Recruitment 10
Table 2.1 Details of microsphere formulations 13
Chapter 4 | In situ Gelation of Hyaluronic Acid with Exogenous and Endogenous Thiols 54
Table 4.1 Results of HA Modification by TNBSA 59
Table 4.2 Physical state of HA-PD mixtures 60
Table 4.3 Physical state of mixtures of mid-MW HA-PD and glutathione 63
Chapter 5 | Injectable Hybrid Hydrogels of Hyaluronic Acid Crosslinked by Well-Defined Synthetic Polycations: Preparation and Characterization In Vitro and In Vivo 67
Table 5.1 Physical state of mixtures of HA and cationic polymers 75

1
1.1 Cell-Based Therapy for the Treatment of Disease
Disease is the malfunction of a body’s normal processes and frequently involves the subsequent loss of tissues and cells. Hence, cell therapy—the introduction of new cells into an injured organ—has come to light as a possible solution to replace such malfunctioning or lost cells. This therapy has been investigated for treatment of a wide range of ailments such as neurodegenerative diseases,1,2 diabetes,3 skin repair and wound healing,4 lung injuries,5 and heart attacks.6
Heart attacks were, in fact, what initially motivated our work. Technically known as a myocardial infarction (MI), this condition is a result of blood vessel blockage and leads to the development of necrotic tissue. Though the heart has some capacity for healing after an infarct, it is not ideal. Infarcted cardiac tissue is left scarred, and vasculature and elasticity are compromised.7 Arrhythmias can often develop.8 Eventually, infarct injury can lead to heart failure.9 The body’s endogenous healing mechanisms are not sufficient to completely regenerate myocardial tissue and restore its function after MI, thus making this illness a worthy candidate for cell replacement therapies.
In these therapies, cells can be introduced into the injured tissue in several ways. Chemoattractants, which are molecules that can cause a patient’s own cells to migrate, can be injected into the diseased organ.10 Alternatively, cells themselves can be directly transplanted into the body. Many types of cells have been delivered, including skeletal myoblasts, hematopoietic precursor cells, embryonic stem cells, mesenchymal stem cells, and induced pluripotent stem cells.11,12
Chapter 1 Introduction

Chapter 1 | Introduction 2
But while the potential exists for cell-based therapies to treat and cure diseases, these therapies have yet to deliver on their promise. In the case of treating cardiovascular diseases, for example, clinical studies have shown that these cell-based therapies are generally safe, but have not shown substantial efficacy to improve heart function.8,12 In essence, one major hurdle is the difficulty in maintaining sufficient numbers of the therapeutic cells at the part of the body into which they are recruited or injected. Chemoattractant molecules that are delivered in a bolus dose may not persist long enough to cause cells to travel to the injury site.13 Many chemoattractants are proteins, which may lose their biological activity in the body and are prone to breakdown by enzymes.14 Cell delivery, too, may not be optimal due to poor attachment, engraftment, and survival of the cells at the site of injection.15-17 Of the number of cells implanted into the heart as treatment after a heart attack, studies report that less than 10% remain in the area where they are injected.18,19
The goals of our research, therefore, focused on ways that biomaterials could address the problems of poor recruitment, attachment, and retention of transplanted cells.
1.2 Biomaterials for Cell-Based Therapy Applications
We envisioned that biomaterials could be used to improve the efficacy of cell-based therapies in three ways. First, cell recruitment could be increased by the use of biodegradable polymers for the encapsulation and release of chemoattractant molecules. Second, cell attachment could be improved via cell surface engineering. Third, cell retention at the site of injection could boosted by delivering and temporarily immobilizing cells within a hydrogel depot. Technical details and results of each approach are detailed in later chapters, but the background of each of these technologies are summarized below.
1.2.1 Biomaterial microspheres for sustained release delivery of biologics
Several cell signaling and chemoattractant molecules have been found to play a role in the natural healing response after cardiac injury.20 In general, however, these molecules are only transiently expressed. It has been shown that sustained release of these molecules are more beneficial than bolus doses, e.g. in stem cell recruitment.13

Chapter 1 | Introduction 3
Microspheres made of biodegradable polymers have been extensively studied as a method to deliver bioactive agents, such as drugs and proteins, in a controlled manner.21 Microspheres are desirable since they can be delivered via minimally invasive means (e.g., needle or catheter).
Many biodegradable polymers have been studied for microencapsulation and drug delivery applications, including polycaprolactone, polyanhydrides, poly(ortho esters), poly(lactic acid) (PLA), and poly(glycolic acid) (PGA), and are extensively reviewed elsewhere.22 Poly(lactide-co-glycolide) (PLGA) (Figure 1.1), a copolymer of PLA and PGA, was chosen for our work since it is already in use in many FDA-approved medical devices.23,24
There are three main methods used to fabricate microspheres: spray-drying, phase separation (coacervation), and solvent extraction/evaporation.21 Spray-drying is a simple method amenable to high-throughput production,21 and high concentrations of proteins can be encapsulated;25 however, it is difficult to control particle size and the high temperatures involved in this method may compromise bioactivity of the encapsulated compound.21 Residual solvent is frequently a problem using the phase separation technique, as well as the ability to make low micrometer-sized microparticles.21 For our work, the solvent extraction/evaporation technique presented an acceptable compromise. This method would be amenable to high throughput fabrication without using high temperatures, and microspheres of a controlled size range can be produced.
Several properties can affect microsphere formation and, consequently, release of the bioactive compound.26,27 These variables include, but are not limited to: choice of polymer, molecular weight of the polymer, chemical modifications of the parent polymer (main chain or endgroup), excipients, protein concentration, choice of solvent, solubility
Figure 1.1 Chemical structure of poly(lactide-co-glycolide) (PLGA). The ester end group PLGA is
represented by R = CH3; the acid end group PLGA when R = H.

Chapter 1 | Introduction 4
of polymer in solvent, and phase volumes. Modification of these variables can result in different release profiles, and therefore enables the ability to tune release kinetics for a specific therapeutic application. In our work, we employed the use of the water-in oil-in water (W1/O/W2) double emulsion solvent extraction/evaporation technique to produce microspheres (Figure 1.2).
1.2.2 Biomaterials for cell surface engineering
Adhesion of cells to each other and to their environment is crucial in biological systems. In normal human development, adhesion is important for many aspects, including cell survival and tissue formation. It is known that most cells prefer to be adhered to a surface—and when they cannot attach, they die.29 The disruption of normal cell adhesion has serious consequences that can lead to disease, and vice versa. In cancer, for example, tumor cells show decreased adhesive properties, allowing them to detach and spread throughout the body.30 Understanding the phenomenon of cell adhesion is not only to help refine and improve stem cell-based therapy for the treatment of various diseases (such
Inner aqueous phaseProtein
Outer aqueous phaseEmulsion stabilizer (PVA)
Organic phasePolymer, surfactant
EmulsificationWater-in-oil
EmulsificationWater-oil-water
ExtractionRemoval of solvent from nascent microsphere dropletsLyophilization
Removal of waterand residual solvent from microspheres
Figure 1.2 Schematic of the
W1/O/W2 solvent extraction/
evaporation method to
fabricate microspheres.
(Adapted and re-drawn from
Hanes et al.28)

Chapter 1 | Introduction 5
as heart disease), but also to offer better tools to understand disease mechanisms (such as cancer). Our research sought to investigate how we could use biomaterials to modify the surfaces of individual cells, and subsequently observe how their adhesion to different substrates was affected.
Some of the first attempts to modify cell surfaces dates back to the 1970s, when biomaterials were used to “coat” and encapsulate cells for the immunoisolation of xenogenic islet transplants.31 The rationale was that semi-permeable barriers would allow nutrients and oxygen to reach the cells inside of the capsule and wastes to diffuse out of the capsule, but block entry of cytotoxic components of the immune system.32,33 The capsules, however, were quite large (100-800 μm), and were found to limit proper mass transport. In the years since, the techniques of cell encapsulation have evolved, yielding considerable decreases in encapsulation thickness.34
As more techniques to encapsulated cells are being developed, the thinner cell encapsulation methods have now sprung a category of biotherapeutics termed “cell surface engineering.” This field is still in its infancy, but it has already found applications ranging from prevention of immune rejection to cell targeting.35 Though several methods have being explored to engineer the surfaces of cells (see Chapter 3 for more detail), we were interested in the technique of layer-by-layer (LbL) assembly. Pioneered by Gero Decher, LbL assembly involves the deposition of alternate layers of positively- and negatively-charged polymers (so called “polyelectrolytes”) onto a surface.36 The LbL assembly is a technique most often used on non-living surfaces (Figure 1.3), but it has been recently demonstrated that this technique can be used on living cells.37,38

Chapter 1 | Introduction 6
1.2.3 Hydrogel biomaterials as cell delivery vehicles and retention depots
Hydrogels are unique materials that can hold large volumes of water despite their low solid content. These chemically diverse materials can be synthesized to be biocompatible and biomimetic, and have been studied for their use in drug delivery, cell transplantation, tissue engineering, and medical devices.40,41 It has been recognized that environmental cues and material structure profoundly affect cell attachment, migration, growth, and proliferation.17 Consequently, hydrogels can be particularly beneficial for cell delivery and transplantation because their porous, malleable, three-dimensional matrix can provide support for cell adhesion while allowing greater freedom of movement and proliferation capacity over solid, two-dimensional structures. When combined with cells, the gel can serve as a depot to temporarily immobilize the cells and allow them to migrate to and from the surrounding tissue at their own pace.
Because of their high water content, mechanical stability of hydrogels is provided by either chemical (covalent) crosslinks or physical (non-covalent) bonds.42,43 Most hydrogels are stabilized by chemical crosslinks, which can be formed by an extensive
Polyanion PolycationWash Wash
Multilayered Film
100 nm
Figure 1.3 A schematic of the layer-by-layer (LbL) method as performed on inorganic surfaces. Surfaces are
dipped in a solution of one polyelectrolyte, washed, then dipped into the oppositely charged polyelectrolyte
and washed again; the process can be repeated to build up nanometer thick layers. (Adapted and re-drawn
from Jewell et al. 39)

Chapter 1 | Introduction 7
number of chemistries that will not be discussed here, but are reviewed nicely by Kopeček44 and Hennink.45
Hydrogels for cell encapsulation and transplantation can also be assembled via physical, non-covalent crosslinks. Mechanisms of physical gelation include hydrogen bonds, hydrophobic association, crystallization, protein interactions, and ionic coacervation.42,44-46 Because physical gels are non-covalently bound, these materials have transient crosslinks that can break and re-form. The ability of a physically crosslinked gel to “heal” or “recover” has been shown to allow improved cell movement and proliferation over chemically crosslinked hydrogels.47,48
There are several aspects of hydrogels that would be particularly desirable for cell delivery applications. First, the material should be able to be injected via minimally invasive means. Not only can this be a safer approach, but it is more palatable and acceptable to patients.49,50 Second, the gels should can form in situ based on physiological conditions. Many in situ covalently gelling hydrogels are so-called “injectable” but after the chemical reaction with an exogenous crosslinker has been initiated, injectability decreases with time and cannot be reversed. A material that can covalently gel only at the site of delivery has the capability to be pre-mixed in a delivery device, and be injectable after an indefinite amount of time. Third, hydrogels based on natural extracellular (ECM) components may be the most amenable for biocompatible and efficacious therapies, especially for the delivery of sensitive cells like stem cells.41 ECM-based materials that have been studied for cell encapsulation include gelatin, collagen, fibrin, and hyaluronic acid (HA).51,52
HA is particularly attractive due to its role in tissue development, embryogenesis, and wound healing.53,54 Because of these attributes, it is a material that is common to much of the work presented in this thesis. HA is a linear, anionic polymer consisting repeating disaccharides of β-1,4-linked glucuronic acid and β-1,3-linked N-acetyl-D-glucosamine (Figure 1.4). A fair number of chemically-crosslinked HA hydrogels have been studied
x
Figure 1.4 Chemical structure of hyaluronic acid (HA).

Chapter 1 | Introduction 8
for drug and cell delivery.55,56 A relatively small number of physically crosslinked HA hydrogels have also been developed.57-62
1.3 Statement of objectives and overview of this thesis
The research presented in this dissertation focused on biomaterial-based approaches that may be used to address the problems of poor recruitment, attachment, retention of transplanted cells. Figure 1.5 shows a schematic of the four different strategies in which the use of biomaterials were investigated: 1) Biodegradable microspheres for stem cell recruitment, 2) cell surface engineering, 3) chemically crosslinked hydrogels, and 4) physically crosslinked hydrogels.
Stem Cell
SDF-1
SDF-1
RECRUIT & RETAIN
SDF-1
Strategy 1: Biomaterial microspheres for stem cell recruitment Strategy 2: Biomaterials for cell surface engineering
Strategy 3: Chemically crosslinked biomaterial hydrogel Strategy 4: Physically crosslinked biomaterial hydrogel
-
-- -
-
---
-
HAPLL-
-- -
-
---
-
+
++ +
+
+++
+
PLL
PLL (+) HA (-)
- - -
+
+
+
+
+ - - - - + +
+
+ + + +
- -
- - - - - -
-
-
(Hydrogel)
Biomaterial Approaches for Cell-Based Therapies
Figure 1.5 Biomaterial strategies explored for cell-based therapies.

Chapter 1 | Introduction 9
Beyond this chapter, the thesis is organized into five chapters. Chapter 2 presents research in which a chemoattractant was encapsulated into biodegradable polymer microspheres for the recruitment of stem cells. Chapter 3 used biomaterials to examine cell-matrix interactions in an effort to understand and control cell adhesion. Chapter 4 compares, contrasts, and characterizes the gelation behavior of a chemically crosslinked hydrogel, both in vitro and in vivo. Chapter 5 discusses the development of a novel semi-synthetic physically crosslinked hydrogel. Chapter 6 contextualizes the entire body of results, presents strategies for improvement, and offers future directions for the work.

10
2.1 Introduction
Stem cell therapy has come to the forefront as a promising method to treat a wide variety of medical conditions, including neural degeneration,2,63 chronic wounds,4 lung diseases,5 and ischemic heart diseases.6 Benefits of stem cell therapy include direct increase in the density of the live cells in the injured area and improved survival and function of existing tissue due to stem cell-secreted factors.
Despite significant progress in the field, stem cell therapy has yet to deliver on its promise as a cure for these diseases. One major reason is that poor cell survival and engraftment after stem cell transplantation has been observed in many cases such as with embryonic stem cells for Parkinson’s disease,63 and bone marrow mononuclear cells for the treatment of myocardial infarction (MI).64 Of the stem cells implanted into the heart to treat tissue damage resulting from a heart attack, it is estimated that less than 10% are retained in the area where they are injected.18 Moreover, once in the area of transplant, the surviving cells do not proliferate in sufficient numbers to produce therapeutic effects.6,63 Consequently, clinical studies in patients with cardiovascular diseases have shown that
Chapter 2Stromal Derived Factor-1a Loaded PLGA Microspheres for Stem Cell Recruitment†‡
† This work is supported in part by the University of Minnesota’s Institute for Engineering in Medicine (IEM) and a NIH Biotechnology Training Grant (Grant Number T32 GM008347). Special thanks to Dr. Jianyi Zhang (Department of Medicine, University of Minnesota) for kindly providing the GFP-expressing porcine MSCs. We are also grateful to Dr. Nathan Lockwood for his careful review and critique of the manuscript.
‡ Reprinted with permission from Cross, D. P. and Wang, C. (2011) Pharmaceutical Research, 28(10):2477-89. © 2011 Springer Science + Business Media.

Chapter 2 | Microspheres for stem cell recruitment 11
cell-based therapies are generally safe but do not show substantial efficacy in improving heart function.8
It has been realized that the transplanted cells do not receive adequate signals for proper retention, recruitment, and engraftment in the host tissue. One such signal is stromal-derived factor-1 alpha (SDF-1a). SDF-1a is an 8-kDa protein that can induce mobilization of many cell types, including lymphocytes, monocytes, hematopoietic progenitor cells, and stem cells.20,65,66 SDF-1a is thought to play a role in neo-angiogenesis and cardiogenesis,20 and is neuroprotective in cases of Parkinson’s disease.67 A recent review suggested that a strategy to improve the homing and engraftment of stem cells—and therefore efficacy of stem cell therapy — is to pre-treat the host tissue with a local injection of SDF-1a before the transplantation of stem cells.64 Indeed, injection of SDF-1a has been shown to recruit stem cells to ischemic myocardium.13,68,69
Although direct injection of SDF-1a has shown some benefit in cell therapy, bolus injections of the molecule is transient and the effects short-lived. Consequently, various methods have been developed to prolong the persistence of SDF-1a at the site of injection. Different cell types including fibroblasts,68 skeletal myoblasts,70 and MSCs71 have been engineered genetically to over-express SDF-1a and have shown to increase stem cell homing and improve cardiac function in animal models. Methods that enhance the in vivo lifetime of SDF-1a through inhibiting proteolysis of the molecule have also improved cardiac function after infarct.14,72 There may be drawbacks of these biological approaches, however. In particular, the methods involving genetic modification of cells could present a safety concern since they can result in a permanent increase in SDF-1a expression. Regulating the duration of SDF-1a expression to meet the need of wound healing can also be challenging. Therefore, a biomaterial-based approach would be more desirable because SDF-1a could potentially be delivered in a sustained, transient, and controlled manner.
To our knowledge, only one study has used a biomaterial to deliver SDF-1a in a sustained manner: Zhang et al.13 designed a PEGylated fibrin patch in which this chemokine was gradually released over a 10-day time frame, and was shown to recruit more stem cells than bolus doses. Because the natural compensatory mechanisms of the infarcted heart results in increased SDF-1a expression for 7 days post-MI,68 the 10-day time frame would not be long enough to offer long-term improvements in

Chapter 2 | Microspheres for stem cell recruitment 12
cardiac function. Consequently, we sought to develop a biomaterial-based method that could deliver SDF-1a for longer than 10 days, and also be deliverable by minimally invasive means (e.g., injection via a needle). We hypothesized that biodegradable microspheres could be designed for this purpose. While both PEGylated fibrin material13 and microspheres are able to be delivered through a needle, the PEGylated fibrin must be injected before it sets up as a gel. On the contrary, there is no time constraint on microsphere delivery, which provides much convenience and flexibility to the surgeon.
The goal of our work was to fabricate a robust microsphere formulation that could offer long-term, sustained-release of SDF-1a, whose bioactivity could be preserved after encapsulation and release. We chose poly(lactide-co-glycolide) (PLGA) to fabricate microspheres because this polymer is biodegradable and already in use as a part of FDA-approved medical devices.73,74 We sought to investigate various microsphere fabrication parameters that would affect the release of SDF-1a, and characterized the morphology of the resulting formulations. Lastly, and most importantly, we set out to show that the bioactivity of SDF-1a could be preserved and could stimulate the migration of stem cells throughout the entire duration of release from the microspheres.
2.2 Materials and Methods
2.2.1 Materials
Recombinant mouse stromal derived factor-1 alpha (SDF-1a) was purchased from R&D Systems (Minneapolis, MN). PLGA with ester end-groups was from Boehringer Ingelheim (Cat No. RG103; Ridgefield, CT). PLGA with free acid end-groups was from Lakeshore Biomaterials (Cat No. DLG4A; Birmingham, AL). All PLGA samples had the composition of 50:50 D,L-lactide:glycolide and Mw of 53 kDa. Bovine serum albumin (BSA) and porcine gelatin (Type A) were purchased from Sigma (St. Louis, MO). TE-lactose consisted of 10 mM Tris-HCl, 1 mM EDTA, 300 mM a-lactose, pH 8.0. Polyvinyl alcohol (PVA) was obtained from Polysciences (MW 25,000; Warrington, PA). RPMI-1640 medium, fetal bovine serum (FBS), and Dulbecco’s phosphate buffered saline (DPBS) was purchased from Gibco Invitrogen (Carlsbad, CA); FBS was not heat-inactivated before use.

Chapter 2 | Microspheres for stem cell recruitment 13
2.2.2 Fabrication of microspheres
Microencapsulation of proteins was accomplished using the water-in oil-in water (W1/O/W2) solvent extraction/evaporation technique; details of formulations are shown in Table 2.1. PLGA (100 mg) was dissolved in dichloromethane (0.7 mL or 2.0 mL) and constituted the dispersed phase (DP). The internal aqueous phase (66.5 µL or 125 µL) consisted of TE-lactose with SDF-1a (2 µg or 0.002% w/w), BSA (5 mg or 5% w/w), or a combination of the two proteins. This inner aqueous solution was added to the dissolved PLGA and sonicated for 10 sec at 6-8 Watts (Fisher Scientific Sonic Dismembrator Model 100) to produce the first emulsion (W1/O). This first emulsion was then added to 25 mL of 5% PVA in H2O (the continuous phase, CP), and homogenized for 30 sec at 4700 rpm (Silverson L4RT) to produce the second (W1/O/W2) emulsion. In order to increase the extraction of dichloromethane from the microsphere droplets, the W1/O/W2 emulsion was subsequently poured into 50 mL of 1% PVA in H2O, and stirred continuously for at least 2 h at room temperature. The solidified microspheres were then centrifuged, rinsed three times with distilled water (pH 8.0), and freeze-dried.
2.2.3 Characterization of microspheres
2.2.3.1 Analysis of microsphere size
Microsphere size analysis was based on a method described by Xu et al.75 Lyophilized microspheres were suspended into DPBS and placed onto a glass slide. Using an Olympus IX70 microscope, images were obtained at either 20x (Formulations A, E, F, G) or 40x (Formulations B, C, D) magnification. Particle diameter was determined
Table 2.1 Details of microsphere formulationsTable 1. Details of microsphere formulations
Formulation IDa
PLGA End-
group
BSA Excipient
[w/w]
Solvent Vols.
(W1/O) [mL/mL]
Sonication Temp. [°C]
SDF Load [w/w]
Size, Mean ± SD
[mm]
A Acid 5% 66.5 / 0.7 21 0.002% 22.5 ± 8.2 B Acid 5% 125 / 2.0 21 0.002% 10.1 ± 3.2 C Ester 5% 125 / 2.0 21 0.002% 5.0 ± 1.4 D Ester 0% 125 / 2.0 21 0.002% 4.6 ± 1.5 E Acid 0% 66.5 / 0.7 21 0.002% 13.0 ± 5.4 F Acid 0% 66.5 / 0.7 21 0% 14.6 ± 6.8 G Acid 5% 66.5 / 0.7 0 0.002% 16.7 ± 8.9
a All formulations were fabricated with 100 mg of PLGA (Mw 53 kDa, 50:50 D,L-lactide:glycolide), TE-lactose as internal aqueous phase (W1), and dichloromethane as organic solvent (O).

Chapter 2 | Microspheres for stem cell recruitment 14
with ImageJ using the software’s built-in analysis tool. At least 100 microspheres were measured for each formulation.
2.2.3.2 Determination of encapsulation efficiency
Dichloromethane (100 mL) was added to 3 mg of prepared microspheres to dissolve the polymer. The mixture was placed on an end-to-end mixer overnight at 4°C, then 100 mL of DPBS was added and the samples were vigorously vortexed. The samples were centrifuged at 5000 × g for 10 min, and the top layer of DPBS was removed. The centrifugation extraction step was repeated with another 100 mL of DPBS, and the DPBS extraction samples were pooled. SDF-1a content of the extraction samples was determined by ELISA (R&D Systems). Encapsulation efficiency (EE) was calculated as the ratio of actual to theoretical SDF-1a content.
2.2.3.3 Characterization of the release of SDF-1a from microspheres
Microspheres (10 mg) were combined with 0.5 mL DPBS, pH 7.4 (Gibco, Carlsbad, CA). Samples were placed in a 37°C incubator with constant shaking (225 rpm). At each time point, samples were centrifuged (10 min at 450 × g), and the entire volume of supernatant was removed and replaced with fresh DPBS. Samples were obtained once per day for the first week, then once a week thereafter. Release studies continued until microspheres were completely dissolved. The amount of SDF-1a in release samples was determined by ELISA (R&D Systems), and was expressed as the cumulative percent of the theoretical load of SDF-1a.
2.2.4 Stem cell migration assay
Green fluorescent protein (GFP)-expressing porcine mesenchymal stem cells (MSCs) were provided by Dr. Jianyi Zhang (Department of Medicine, University of Minnesota). In brief, bone marrow of Yorkshire swine were aspirated and subjected to gradient density centrifugation, and the mononuclear layer was allowed to attach to fibronectin-coated flasks; cells that were adherent at day 3 after plating were MSCs. Pluripotency of the MSCs was demonstrated by their ability to undergo osteoblast and chondroblast differentiation in vitro.76 The MSCs were genetically modified to express GFP according to a method previously described.77

Chapter 2 | Microspheres for stem cell recruitment 15
To maximize the migration capability of the cells, MSCs were incubated with 1 ng/mL TNFa (R&D Systems) in migration medium (MM; 0.25% BSA in RPMI-1640 medium) for 1 day before the start of the assay, according to Ponte et al..78 Migration assays were performed in 96-well HTS Transwell plates (8.0 mm pore size, polyester membrane; Corning, Lowell, MA); the filters were coated with 0.1% (w/v) porcine gelatin in DPBS for 1 h at 37°C before use. MSCs (7 × 10⁴ cells) were added to each insert, and 235 µL of migration medium containing controls, serial dilutions of SDF-1a, or microsphere release samples were placed in the bottom chambers. Positive and negative controls consisted of 30% FBS in MM and MM alone, respectively. Microsphere release samples from the first phase (termed “early release”; generally, samples collected on day 1 or 2) were not deacidified prior to conducting the migration assay. Microsphere release samples from the second release phase (termed “late release”; generally, samples released between days ~35 and 60) were deacidified prior to subjecting to the migration assay using centrifugal filters (Amicon Ultra, 3000 MWCO; Millipore, Cork, Ireland). When possible, samples were diluted with MM to achieve the equivalent SDF-1a concentration as represented in the fresh SDF-1a dose-response. The SDF mass released from Formulation G microspheres at day 1 was fairly low, and were concentrated using the Amicon Ultra centrifugal filters; the highest concentration we were able to achieve was 22 ng/mL. The Transwell plate was placed overnight in a humidified incubator at 37°C and 5% CO2, and a cotton swab was used to wipe non-migrated MSCs from the upper side of the filter. The cells that had migrated to the bottom side of the filter were imaged using fluorescence microscopy (20x magnification) and enumerated. Representative images (n≥3) were obtained, and extrapolated to represent total number of migrated cells per insert.
2.2.5 Statistical analysis
Data are shown as mean ± S.D. Statistical analyses were performed using the two-sample equal variance Student’s t-test. A probability (p) value of <0.05 was deemed statistically significant.

Chapter 2 | Microspheres for stem cell recruitment 16
2.3 Results
2.3.1 Microsphere fabrication and release studies
We sought to encapsulate SDF-1α into PLGA microspheres by using a double-emulsion solvent extraction/evaporation technique, and investigated the effects of formulation variables of PLGA end-group, solvent volumes, the use of an excipient, and sonication temperature on the subsequent release of SDF-1α.
Seven microsphere formulations were prepared as described in Table 2.1. We chose a low feed mass of SDF-1a in our formulations, partially due to expense of the protein, but also because SDF-1a is a potent chemokine. Concentrations of SDF-1a studied in in vitro chemotaxis assays that can elicit statistically significant cell migration are commonly in the range of 1-200 ng/mL, depending on cell type.78-81
Replicate batches of each formulation were made, and batches were made on different days. The release kinetics of all replicates batches of Formulation A are shown in Figure 2.1A, and there is good consistency among the batches. One representative release profile of each of Formulations B-G is shown in Figure 2.1B; the other replicates of Formulations B-G had similar inter-batch release profiles. As expected, SDF-1a in release samples from empty microspheres (Formulation F) was not detected by ELISA, and is not shown in Figure 2.1 for clarity. The release curves exhibited a triphasic shape characteristic of PLGA:82 a high initial burst (days 1-2), followed by a plateau where little protein was released (~days 5-30), followed by second release period that was due to bulk degradation of the polymer (after ~day 35). Of all formulations made, Formulation A released the highest cumulative percent of SDF-1a (64 – 87%, depending on batch). Formulations B and G released a moderate amount of SDF-1a�(~30% and ~40%, respectively), while Formulations C-E released very little SDF-1a�(less than 2%). As exemplified by the release curves of Formulation A, the low batch-to-batch variability indicates that our microsphere fabrication process is robust and reproducible. SDF-1a was released over a time period of more than 50 days for Formulations A, B, and G.

Chapter 2 | Microspheres for stem cell recruitment 17
2.3.2 Encapsulation efficiency
Encapsulation efficiency (EE) was determined by dichloromethane/DPBS extraction then assessment of the extracts by ELISA. When compared to the release curves shown in Figure 2.1, the measured EE values were much less than the total cumulative amount of SDF-1a released. For example, although EE analysis determined that only 9% of SDF-1a was loaded into the Formulation A microspheres, the release curve shows that almost 90% of the theoretical loading was released by the time the microspheres were completely degraded.
Figure 2.1 Cumulative release of
SDF-1a from PLGA microspheres in
DPBS at 37 °C. Replicate batches
of Formulation A are shown in panel
(A), while one representative release
curve of all other formulations is
shown in (B). The amount of SDF-1a
in release samples was determined
by ELISA, and is expressed as
the cumulative percent of the feed
mass of SDF-1a loaded during
microsphere fabrication. Details of
microsphere formulations are shown
in Table 2.1.

Chapter 2 | Microspheres for stem cell recruitment 18
We attempted to perform complete microsphere digestion by other means, both by a mild acid/surfactant method and by a strong acid method, with subsequent protein determination by the TNBSA assay (Pierce, Rockford, IL) for amino groups. We were not able to detect SDF-1a in the microsphere degradation samples using these polymer dissolution methods because the amount of protein released was below the detection limit of the assay. We note that detection of SDF-1a by ELISA after acid digestion would not be possible due to complete degradation of SDF-1a into individual amino acids.
2.3.3 Microsphere sizing and morphology
We chose to determine microsphere size and morphology using optical microscopy in order to observe the microspheres in their hydrated state. Brightfield optical images of microspheres from the different fabrication processes are shown in Figure 2.2. Formulations A and F yielded microsphere populations that showed heterogeneous opacity, i.e. a mixture of dark microspheres and translucent microspheres. In contrast, Formulations C-E yielded microsphere populations of homogeneous opacity, where the entire population was either dark or translucent. Formulation G produced microspheres that appeared to have a dense “shell” layer at the outer surface and an inner translucent “core.” Formulations B, C, and D appeared noticeably rougher and more porous than the rest of the formulations.
The values of average diameter for all microsphere formulations are listed in Table 2.1. There were wide distributions in particle size within each formulation preparation, as shown visually and graphically in Figure 2.2 and Figure 2.3, respectively. Formulation A yielded the largest microspheres (22.5 ± 8.2 mm); Formulations C and D were the smallest (average of ~5 mm). The rest of the microsphere formulations (Formulations B, E, F, and G) had diameters in the mid-range (~10-17 mm).
2.3.4 Bioactivity of released SDF-1a
The ideal in vitro experiment to test the bioactivity of the chemokine-encapsulating microspheres would be to expose cells to microspheres for the entire time duration of microsphere degradation. However, cells would not be allowed to be in culture undisturbed for the ~70 days that it would take for the microspheres to completely

Chapter 2 | Microspheres for stem cell recruitment 19
Formulation A (RT)
SDF-1alpha-loaded PLGA microspheres
Formulation G (ice)
Formulation B (lg vol)
Formulation E (no BSA)
(large image scale bar = 100 um)(inset scale bar as shown)
Formulation F/H (low vol,
MT)
Formulation C (Ester, BSA/SDF, lg vol)
Formulation D (ester, no BSA,
lg vol)
A
50 mm
B
25 mm
C
10 mm
D
10 mm
E
50 mm
F
50 mm
G
50 mm
Figure 2.2 Representative brightfield optical microscopy images of microspheres. (A) ~ (G): Formulations A
to G. Images were obtained at 20x (A, E-G) or 40x (B-D) magnification; select areas are enlarged in insets.
All scale bars are 100 μm, unless otherwise noted.

Chapter 2 | Microspheres for stem cell recruitment 20
degrade. Therefore, we exposed cells to release samples from different time points, from either early in the degradation process (the initial burst phase, collected at day 1) or late in the degradation process (the second release phase, collected ≥ day 35).
Before testing release samples, we first conducted an investigation of the control conditions to ensure that the stem cells were chemoattractant-responsive. Following a method reported in the literature,78 we used a Transwell migration assay to test the bioactivity of the released SDF-1a released from the microspheres. In this assay, cells were placed in the upper chamber of the plate, and test samples were placed into the bottom chamber of the plate. If bioactive, the SDF-1a should cause chemotaxis of MSCs
Figure 2.3 Histograms of microsphere particle size distribution: (A) ~ (G): Formulations A to G. Mean particle
sizes are listed in Table 2.1.
0
5
10
15
20
25
No.
Mic
rops
here
s A
0
10
20
30
40
50
No.
Mic
rops
here
s B
0
10
20
30
40
50
60
70
No.
Mic
rops
here
s C
0
20
40
60
80
100
No.
Mic
rops
here
s D
0
10
20
30
40
50
60
70
80
No.
Mic
rops
here
s E
0
5
10
15
20
25
30
0 5 10 15 20 25 30 35 40 45
No.
Mic
rops
here
s
Diameter (µm)
F
0
5
10
15
20
25
30
35
40
0 5 10 15 20 25 30 35 40 45
No.
Mic
rops
here
s
Diameter (µm)
G

Chapter 2 | Microspheres for stem cell recruitment 21 Unstimulated
pMSC migration assay to SDF control samples
Positive Control
SDF-1
(scale bar = 100 um)all cells shown after swabbing
all from 10.28.10 expt
Negative Control
TNFa pre-stim
A
FE
B
C D
Figure 2.4 Representative fluorescence microscopy images of the migration of GFP-expressing porcine
MSCs to control samples. Cells remained in growth media (A, C, E; “unstimulated”) or were incubated with
1 ng/mL TNFa (B, D, F; “pre-stim”) overnight prior to testing in the migration assay. Positive and negative
controls were 30% FBS in migration medium (MM) and MM only, respectively; SDF-1a concentration was
62.5 ng/mL. Images were captured after wiping the non-migrated cells from the top surface of the insert with
a cotton swab. Scale bar = 100 μm. Magnification, 20x.

Chapter 2 | Microspheres for stem cell recruitment 22
from the upper chamber to the lower chamber. At the end of the migration period, non-migrated cells were removed from the upper chamber by wiping with a cotton swab.
According to Ponte et al., pre-stimulation with a pro-inflammatory molecule, tumor necrosis factor-alpha (TNFa), will elicit a heightened migratory response in MSCs.78 We tested this concept by exposing the MSCs to test samples, with or without pre-treatment with 1 ng/mL TNFa. Test samples consisted of positive and negative controls (30% FBS in MM or MM only, respectively) and different concentrations of SDF-1a. We found that regardless of whether the MSCs were left unstimulated or subjected to TNFa stimulation, many cells migrated in response to the positive control, appeared healthy, and were spindle-like in shape (Figure 2.4A and B, respectively); furthermore, there was no difference in cell morphology between unstimulated and TNFa-stimulated cells. Few
0
200
400
600
800
1000
12001.3 104
1.35 1041.4 104
1.45 1041.5 104
1.55 1041.6 104
1.65 104
0 ng
/mL
SD
F
31.2
5 ng
/mL
SD
F
62.5
ng/
mL
SD
F
125
ng/m
L S
DF
150
ng/m
L S
DF
250
ng/m
L S
DF
500
ng/m
L S
DF
1000
ng/
mL
SD
F
Pos
Ctl
(30%
FB
S)
TNFalpha pre-stimUnstimulated
No.
Mig
rate
d M
SCs
(96-
wel
l Tra
nsw
ell i
nser
t)
Lower Chamber Contents
Figure 2.5 The effect of
TNFa pre-incubation on
porcine MSC migration in
response to SDF-1a. MSCs
were incubated overnight
either in the presence or
absence of 1 ng/mL TNFa
before exposure to a
various doses of fresh SDF-
1a. Data shown as mean ±
S.D. (n≥3 fields).

Chapter 2 | Microspheres for stem cell recruitment 23
cells migrated to the negative control, regardless of the absence or presence of TNFa (Figure 2.4C and 4D, respectively). Because SDF-1a samples were diluted into migration medium that did not contain serum, the cells subjected to these conditions were round in shape (Figure 2.4E and 4F); however, the cells were alive since they expressed GFP and fluoresced green. Cells migrated to the source of SDF-1a in a dose-dependent manner (Figure 2.5); it can be observed that for each concentration of SDF-1a, MSCs migrated in greater numbers when pre-stimulated with TNFa than when left unstimulated.
Since we observed increased migration of the MSCs after TNFa stimulation, we chose to pre-treat the cells with this molecule for all subsequent studies. Due to inherent differences in biological activity with every experiment, we included the testing of different concentrations of SDF-1a alongside the negative and positive controls for every assay. We chose to focus on testing the release samples from Formulations A, G, and F in order to determine if sonication on ice would show differences in the protection of SDF-1a bioactivity.
MSCs that were exposed to SDF-1a release samples from Formulation A microspheres are shown in Figure 2.6; representative fluorescence images are shown before removing the non-migrated cells from the top of the Transwell insert. “Early release” samples did not appear to cause cell death, as evidenced by bright, green cells shown in Figure 2.6A. However, when MSCs were exposed to samples from the second release phase (“late release”), no green cells were observed, suggesting that the samples were cytotoxic
pMSC migration assay to SDF release samples
Early release
(scale bar = 100 um)at day 1 migration; before cotton swab
from 11.03.10 expt
Late release, not neutralized
Late release, neutralized
A B C
Figure 2.6 Representative fluorescence microscopy images of the migration of GFP-expressing porcine
MSCs to release samples from Formulation A microspheres. Cells are shown at day 1 after adding cells to
the top of the Transwell inserts. Images were captured before wiping the non-migrated cells from the top
surface of the insert with a cotton swab. Microsphere release samples were collected from either the “early
release” phase (A) or the “late release” phase (B and C). Cells were subjected to “late release” samples that
were either not de-acidified (B) or de-acidified (C). Scale bar = 100 μm. Magnification, 20x.

Chapter 2 | Microspheres for stem cell recruitment 24
(Figure 2.6B). When PLGA degrades, it breaks down into its monomeric or oligomeric components of lactic and glycolic acids, so we attempted to deacidify the microsphere release samples prior to exposure to the cells. As can be observed in Figure 2.6C, the MSCs exposed to deacidified “late release” SDF-1a microsphere samples were bright green, showing that the samples were properly neutralized.
The quantitative results of a representative migration experiment are shown in Figure 2.7. The positive control induced the migration of a great number of MSCs, which showed
050
100150200250500600700800900
1000
No
SDF-
115
.625
ng/
mL
SDF-
131
.25
ng/m
L SD
F-1
62.5
ng/
mL
SDF-
112
5 ng
/mL
SDF-
130
% F
BS in
MM
(Pos
Con
trol)
"A" (
30 n
g/m
L SD
F-1)
, d1
"A" (
60 n
g/m
L SD
F-1)
, d1
"A" (
31.2
5 ng
/mL
SDF-
1), d
51"A
" (62
.5 n
g/m
L SD
F-1)
, d51
"G" (
22 n
g/m
L SD
F-1)
, d1
"G" (
31.2
5 ng
/mL
SDF-
1), d
56"F
" (0
ng/m
L SD
F-1)
, d1
"F" (
0 ng
/mL
SDF-
1), d
51
No.
MSC
s M
igra
ted
(96-
wel
l Tra
nsw
ell i
nser
t)
Lower Chamber Contents
n.s.
***
n.s. n.s.
***
***
***
****
**
*
#
#
#
0† †
Figure 2.7 Migration of porcine MSCs in response to microsphere release samples. The cells were pre-
treated overnight with 1 ng/mL TNFa, and then were exposed to microsphere release samples and various
doses of SDF-1a. Late time-point release samples (collected at day 51/56) were de-acidified prior to testing,
as described in the Methods section. Data shown as mean ± S.D. (n≥3 fields), statistical significance was
shown by Student’s t-test: *p<0.05, **p<0.005, ***p<0.001, n.s. = not significant compared to negative
control (no SDF-1a); #p<0.05, compared to day 1 empty microspheres (“F”); †p<0.05, 0not significant,
compared to day 51 empty microspheres (“F”).

Chapter 2 | Microspheres for stem cell recruitment 25
that the cells were responsive to chemoattractant agents. Because of the acidic nature of the “late release” microsphere degradation samples, all samples from that timeframe were deacidified prior to placing into the migration assay.
When compared to the negative control (no SDF-1a), all SDF-containing release samples yielded statistically significant MSC migration (Figure 2.7). Because the PLGA degradation products might affect cell migration, we also compared the migration results to release samples from empty microspheres and showed that, when matched for collection time point (i.e., day 1 release samples compared to each other, and day 51/56 release samples compared to each other), we show that all Formulation A (sonicated at room temperature) release samples caused significant cell migration compared to empty microsphere samples (Formulation F). For the ice-sonicated microspheres (Formulation G), the release sample collected at day 1 yielded a significant increase in MSC migration versus the release sample from empty microspheres, but this significance was not observed when comparing release samples from late time points. As a whole, it appeared that the release samples collected early in the microsphere degradation process (at day 1) were more potent chemoattractants than late time point (day 51/56) release samples.
2.4 Discussion
Biodegradable microspheres are able to deliver bioactive molecules in a sustained-release fashion. SDF-1a is a chemokine that has been shown to recruit endogenous stem cells, and has not yet been encapsulated into microspheres prior to this work. We investigated the use of PLGA to fabricate microspheres and to encapsulate SDF-1a using the double-emulsion solvent extraction/evaporation technique. This method is generally safe for proteins, although the maintenance of protein stability is dependent on the interplay of the processing parameters and the chosen protein.83
Our microspheres (Formulations A, B, G) released SDF-1a for more than 50 days, which was much longer than the release duration previously reported for this molecule. Only one other biomaterial-mediated delivery of SDF-1a has been reported in the literature, which showed that a PEGylated fibrin gel was able to deliver this molecule over a 10-day period.13 It is quite certain that ten days of SDF-1 release will not be long enough to elicit a lasting and beneficial degree of cell migration in a disease such as myocardial infarction, because the infarcted heart itself over-expresses SDF-1a for one week after

Chapter 2 | Microspheres for stem cell recruitment 26
injury.68 The ideal duration of SDF-1a signaling is not known at this point but is likely dependent on the healing process of the injured heart, which will take at least weeks and months in animals and humans. Therefore, our microsphere formulations capable of releasing bioactive SDF-1a for over 50 days may provide clinical benefit to heart attack patients by prolonging the duration of SDF-1a at the site of injection.
Several microsphere fabrication variables were investigated and were observed to have profound effects on the release of SDF-1a. Formulations C and D were made with PLGA that had ester end-groups (“capped”); all other formulations (A-B, E-G) were made with PLGA that had carboxylic acid end-groups (“uncapped”). The capped PLGA is more hydrophobic than the uncapped PLGA and is therefore more resistant to degradation by hydrolysis. It has also been proposed that the carboxylic acid group of uncapped PLGA may interact with proteins, and therefore the protein is better entrapped within the microspheres.84 Lastly, because the upcapped PLGA is more hydrophilic, it is less soluble in organic solvent than capped PLGA and will precipitate more quickly during solvent extraction. As a result, the microspheres made from uncapped PLGA might have solidified more quickly than the capped PLGA, trapping the protein within a less porous polymer shell.27 Because release studies continued until microspheres were completely degraded, the lack of measurable release from Formulations C and D (less than 1% of feed; Figure 2.1B) suggest that SDF-1a was not efficiently encapsulated during microsphere fabrication.
The effect of solvent volume on protein release rate can be seen by comparing Formulations A and B. We dissolved 100 mg of PLGA into either 0.7 or 2.0 mL of dichloromethane, which produced an oil phase (O) of two different polymer concentrations. When highly concentrated, the polymer precipitates quickly upon contact with the water phase (W1), yielding a dense polymer barrier that prevents protein from diffusing out of the microspheres before they are fully formed. This increases the amount of protein retained inside of the microspheres (that is, it should improve encapsulation efficiency). Highly concentrated polymer solutions are also more viscous which also prevents protein diffusion out of the microspheres before they are fully solidified. Lastly, the dispersed phase/continuous phase (DP/CP) ratio of Formulation A (1/36) is lower than that for Formulation B (1/13), which induces fast solidification of the microspheres. All of these aspects have been shown to improve encapsulation efficiency,27 which therefore can translate to more protein available for release.

Chapter 2 | Microspheres for stem cell recruitment 27
Although both Formulations A and E were fabricated with the same feed mass of SDF-1a (2 µg per 100 mg PLGA), Formulation A included BSA as an excipient, and it can be seen in Figure 2.1 that there was dramatically more SDF-1a released from this set of microspheres than that released from Formulation E, which were fabricated without BSA. BSA has frequently been used as a carrier protein to provide stabilization to the payload protein.82 Co-encapsulation with BSA may also prevent exposure of SDF-1a to organic solvent which helps preserve the integrity of the protein.85 A third possible explanation is due to charge-charge interaction between the two proteins: BSA has a net negative charge at physiological pH86 which may interact with the cluster of positive charges in the central b-sheet region of the SDF-1a molecule,87 and may thereby provide protection for SDF-1a. Lastly, the incorporation of BSA increases the concentration of hydrophilic components within the microsphere; when more water can gain access into the microsphere, and more protein can diffuse out.
We investigated the sonication temperature of the first W1/O emulsion on the release of SDF-1a (Formulations A versus G). As can be seen in Figure 2.1, reducing the sonication temperature reduced the total cumulative release of SDF-1a. We were not able to find any extensive investigations of this variable in the literature and, in fact, a recent review plainly states that not much is known about how this parameter would affect the microspheres or the encapsulated proteins.82 One report was found in which a so-called “cryopreparation” method has been described for encapsulating plasmid DNA.88 In the cryopreparation method, the first emulsion (W1/O) was frozen in liquid nitrogen before homogenization with the outer aqueous phase (W2). The freezing step was shown to drastically improve encapsulation efficiency, most likely by preventing the diffusion of the DNA contents from the inner aqueous phase. In our preparation of Formulation G microspheres, the W1/O emulsion was performed on ice; this should also increase viscosity and decrease protein diffusion. However, we did not observe any increase in SDF-1a encapsulation and release.
We found it difficult to obtain an accurate determination of the encapsulation efficiency of SDF-1a into our formulations of microspheres. We used the dichloromethane/DPBS extraction method: the polymer was dissolved in organic solvent, and when mixed with DPBS, the water-soluble protein should partition into the aqueous DPBS phase. Detection of the extracted SDF-1a by ELISA is very sensitive and can detect analyte in concentrations as low as ~150 pg/mL. But despite the high sensitivity of the ELISA,

Chapter 2 | Microspheres for stem cell recruitment 28
we measured very low amounts of encapsulated SDF-1a in the microsphere digest samples. There are several reasons that may explain this discrepancy. First, there may have been incomplete dissolution of the PLGA in the mixed solvent, so the SDF-1a protein was trapped within the polymer and could not be assayed. Uncapped PLGA is more hydrophilic than capped PLGA due to the presence of carboxylic acid groups, and may not have been completely dissolved in the solvent. Second, the protein may have been trapped at the dichloromethane/DPBS interface and was not able to be retrieved. The three-dimensional structure of SDF-1a reveals that the C-terminus is an amphiphilic a-helix,87 and therefore it seems plausible that this molecule could be preferentially found at the hydrophobic/hydrophilic dichloromethane/DPBS interface. Lastly, the SDF-1a protein may have been denatured by the solvent used in the extraction procedure, and therefore was not recognized by the anti-SDF-1a antibody of the ELISA. For these reasons, we believe that the results of the cumulative release study (Figure 2.1) reflect the true encapsulation efficiency more accurately than the assay of the samples from the solvent extraction method.
We observed a wide size distribution of microspheres, which has also been observed by others that have used the double emulsion technique to fabricate PLGA microspheres.89,90 Varying the solvent volume used in the manufacturing process appeared to have caused the largest difference in porosity and size (Figure 2.2 and Figure 2.3). Formulation B, C, and D microspheres were noticeably more porous and smaller than the other microsphere formulations. As already mentioned above, microspheres made with a high DP/CP ratio (such as Formulation B) will solidify slower than those a low DP/CP ratio. Therefore, in addition to lowering encapsulation efficiency, slower solidification typically results in more porous, irregular microsphere structures and smaller particles,27 just as observed with Formulations B, C, and D.
Furthermore, if the variable of solvent volumes was kept constant, we observed that microspheres made with the capped PLGA (Formulations C and D) were much smaller (roughly half the diameter) than microspheres made with uncapped PLGA (Formulation B). The ester end-groups of PLGA are more hydrophobic and the polymer is more soluble in dichloromethane than the uncapped polymer so solvent extraction is slower. As a result, nascent microspheres made of PLGA with ester end-groups have more time to solidify, and will produce smaller particles.27

Chapter 2 | Microspheres for stem cell recruitment 29
Pair-wise comparisons of the fabrication parameters do not easily explain which ones were responsible for the differences in opacity of the microspheres. For example, a comparison of Formulation A (which contain both SDF-1a and BSA) and Formulation E (which contain only SDF-1a) may cause one to draw the conclusion that the encapsulation of both proteins would yield a heterogeneously opaque population of microspheres, whereas the encapsulation of only one protein produces a homogeneous batch of microspheres. However, a further comparison to the heterogeneous population of Formulation F microspheres (which contained neither protein) makes this conclusion invalid. It has been reported that microspheres fabricated with a higher W1/O ratio are uniformly dark, while those fabricated with a low W1/O ratio are uniformly translucent,91 but we did not observe this correlation from our samples. Furthermore, it does not appear that the opacity of the microspheres correlates with the SDF-1a release kinetics, which agrees with findings in the literature.91
When cells were pre-treated with TNFa, an increase in cell migration was measured. Ponte et al.78 state that exposing the cells to chemokine alone may not be sufficient to cause cell migration and that inflammatory cues (such as TNFa) are important in recruiting cells to the area of injury. In fact, these results by us and others support the findings of in vivo studies where stem cell migration was enhanced in models of both heart92 and brain injury.93 It is also possible that low amounts of PLGA degradation products could be beneficial; the acidic conditions may stimulate inflammation which, in turn, may recruit stem cells to the injured site.
The parabolic dose-response shape of the dose-response curve is characteristic of cell responses to chemoattractant.94 Migration of the cells in response to chemokine is dependent on two factors: the absolute concentration of the molecule in the vicinity of the cell, and the gradient of the chemokine across the length of the cell. At low concentrations, a sufficient concentration gradient does not exist along a cell’s length, and the cell will therefore not move in response to the molecule. At high concentrations, however, a cell’s chemokine receptors will be saturated so it will be unable to detect differences in chemokine levels, even if a sufficient gradient exists.95
Our concern that thermal and shear stresses might damage the SDF-1a protein is what had prompted the fabrication of Formulation G microspheres where sonication was performed on ice. In the cryopreparation method described earlier,88 the first emulsion

Chapter 2 | Microspheres for stem cell recruitment 30
(W1/O) was frozen to a solid so shear forces were completely eliminated, and it was found that the structure of the contents (DNA) remained intact after encapsulation into the microspheres. In our case, however, it is not clear if the lower sonication temperature provided protection to the SDF-1a protein: release samples from Formulation G microspheres collected early in the degradation study yielded statistically significant MSC migration compared to empty (Formulation F) microspheres, but this observation did not hold with the release samples collected late in the degradation process. In summary, sonication of the primary emulsion on ice improved the bioactivity of SDF-1α released at early time-points but without much benefit at late time points.
Most importantly, our results show that the SDF-1a released from microsphere Formulations A and G remained bioactive, regardless of when the molecule was released from the microspheres. In myocardial infarction, for example, it is important to recruit stem cells beyond the first week of injury. Therefore, it is crucial that the SDF-1a released later in the degradation timeframe remains bioactive and is able to induce the migration of stem cells to the site of injury.
2.5 Conclusions
We have shown that SDF-1a can be successfully encapsulated into PLGA microspheres. By varying manufacturing parameters, a variety of different formulations have been prepared that release the protein at different rates, including a formulation that can release SDF-1a over a period of at least 50 days. We have identified parameters that are important factors in the encapsulation and release of SDF-1a, namely, the use of PLGA with acid end-groups, low solvent volumes, BSA as an excipient, and sonication at room temperature. Most importantly, we have found that the SDF-1a released from the microspheres can stimulate the migration of stem cells, which shows that the encapsulation method preserves the bioactivity of the protein. Furthermore, the released SDF-1a has intact bioactivity whether it is released at an early or late time point in the microsphere degradation process. With further tuning of the release profile and in vivo evaluation, this approach has the potential of making clinically relevant impact on stem cell-mediated cardiac repair.

31
3.1 Introduction
It is well-known that the adhesion of cells to each other and to their environment is important in biological systems. In normal human development, adhesion is crucial for cell spreading, proliferation, differentiation, migration, survival, and the formation of tissues.29 For anchorage-dependent cells, adherence to a substrate, a matrix, or to other cells is crucial for their survival.17,96 The disruption of normal cell adhesion has serious consequences that can lead to disease and vice versa. For example, tumor cells show decreased adhesive properties, enabling increased mobility of the cells and promoting metastasis.97 In therapeutic applications such as cell transplantation for cardiac infarct repair, a lack of robustly positive clinical results has been attributed to poor adhesion and retention of cells in the tissue after injection.16-19 Learning how to control cell adhesion is important not only for the understanding and modeling of various disease mechanisms, but also for the development of therapeutics to treat such diseases and for improving biocompatibility of implants.
Cell adhesion can be controlled by modifying the substrate to which cells attach.98,99 Differential patterning of cell adhesion ligands, such as the peptide sequence arginine-glycine-aspartic acid (RGD), can determine the number of cells that adhere to the substrate, as well as the cells’ morphology, proliferation, and survival.100 Physical
Chapter 3Layer-by-Layer Polyelectrolyte Assembly onto Cell Surfaces for Controlling Cell Adhesion†
† This work was supported in part by the University of Minnesota’s Institute for Engineering in Medicine (IEM) and a Biotechnology Training Grant, NIH, Grant Number T32 GM008347 (to DC). Special thanks to Kellin Krick for performing cell enumeration. We are also grateful to Dr. Nathan Lockwood for his careful review of this manuscript.

Chapter 3 | Cell Coating to Control Cell Adhesion 32
properties of the substrate, too, are important in cell attachment: for example, the stability of focal adhesions of fibroblasts and epithelial cells increases with increasing elastic modulus (i.e., stiffness) of the substrate.101 An abundance of studies over many years have investigated how various chemical treatments of materials modulate cell attachment for neurological,102 cardiac,103 or orthopedic104 applications.
More recently, it has been realized that controlled cell adhesion can also be achieved by modification of the cell surface. Previously reported methods to modify cell surfaces include metabolic engineering, chemical conjugation, and non-covalent surface coating by lipid-tail insertion.105 In metabolic engineering, cells are fed with a non-natural precursor, which, when processed by the cell, results in the display of new synthetic molecules at the surface of the cell.106 One example is the presentation of non-natural sialic acids on the surface of tumor cells for the targeting and attachment of immunotherapeutic antibodies.107 Covalent PEGylation of the surface of pancreatic islet cells is found to reduce the recognition and adhesion of host immune cells, which therefore can improve the viability of these transplants.108 Sarkar et al. have shown that mesenchymal stem cells can be chemically modified with sialyl Lewis X to promote cell rolling, with the ultimate goal of encouraging cell homing, attachment, and targeting after systemic cell infusion.109,110 Finally, the surface of bone marrow cells can be non-covalently modified by incubation with glycoside-lipophilic polymers that insert themselves into the cell membrane. These modified cells then attach to and fuse with cultured cardiomyocytes in greater numbers than unmodified cells.111
While these methods of cell surface modification are elegant and often effective, they can be quite complicated, laborious, and chemically intensive. Alternatively, the technique of layer-by-layer (LbL) polyelectrolyte assembly may potentially be an excellent approach for modifying cell surface due to its simplicity and versatility. The LbL assembly, first described by Decher et al.,36,112 is a method that is usually used on solid material surfaces, and involves the deposition of cationic and anionic molecules, alternately layered upon each other to produce molecularly thin coatings. LbL-modified solid substrates have been investigated to control cell adhesion. In one typical study glass slides were layered with cationic poly-L-lysine (PLL) and anionic poly-L-glutamic acid (PGA). It was shown that chondrosarcoma cells attached more strongly to PLL films than to PGA films.113

Chapter 3 | Cell Coating to Control Cell Adhesion 33
The LbL assembly technique has only recently been applied to modify mammalian cell surfaces in a handful of studies.37,38,114 When applied to cells, this technique takes advantage of the fact that the outside of a cell has a net negative charge due to its carbohydrate-rich glycocalyx,29 upon which the oppositely charged polyelectrolyte layers can be built to produce conformally encapsulated cells. Wilson et al.38 coated islet cells with poly(L-lysine)-g-poly(ethylene glycol)(biotin) and streptavidin for the purpose of constructing nanoscale immunoisolation barriers. Both Veerabadran et al.37 and Garg et al.114 have shown that mesenchymal stem cells were able to be coated with PLL and the polyanionic hyaluronic acid (HA) using the LbL technique, and that these cells remained viable for up to one week after coating. To our knowledge, however, the LbL technique has not yet been studied to alter cell surfaces for the purpose of controlling cell adhesion.
Here we sought to use the LbL method to assemble layers of PLL and HA onto cell surfaces, then investigate if cell adhesion could be regulated. We chose to use the T98G human glioma cells, which not only have relevance toward the understanding of cell adhesion mechanisms in cancer, but were also easy to obtain in large numbers that were necessary for the cell coating optimization process. Our hypothesis was that it would be possible to control the adhesion of cells to substrates based on electrostatic interaction. Cell surface charge would be dictated by the outermost polyelectrolyte layer, either positively charged (PLL outer coat) or negatively charged (HA outer coat), and cells would show preferential attachment to oppositely charged surfaces. Furthermore, we performed an in-depth characterization of the LbL-coated cells. We directly measured the surface charge of the coated cells, used confocal microscopy to visualize both the PLL and HA coatings, and observed viability of coated cells in culture for one week. We also investigated if the coatings could be stabilized using simple chemical techniques, and used confocal microscopy to observe the persistence of the coatings over time. Our work exemplifies that engineering the surface of cells presents a unique approach to control cell-substrate interactions.

Chapter 3 | Cell Coating to Control Cell Adhesion 34
3.2 Materials and Methods
3.2.1 Materials
T98G human glioma cells were provided by Dr. John Ohlfest (University of Minnesota). PLL (MW 70000-150000) was purchased from Sigma (St. Louis, MO). HA (MW 1.4×10⁶) was obtained from Lifecore (Chaska, MN). Dulbecco’s phosphate-buffered saline (DPBS; pH 7.4) was purchased from Gibco Invitrogen (Carlsbad, CA).
To enable visualization of polymers, PLL and HA were labeled with fluorescent dyes. PLL was labeled with the amine-reactive form of Alexa Fluor 594 (AF594) (Molecular Probes, Eugene, OR) according to the manufacturer’s instructions. After labeling, unreacted AF594 dye was removed from the AF594-labelled PLL by a PD-10 desalting column (GE Healthcare, Piscataway, NH), and labeled PLL fractions were stored at 4 °C until use.
HA was fluorescently labeled in the following manner: First, the carboxyl groups of HA were coupled to 1,6-diaminohexane (Alfa Aesar, Ward Hill, MA) via N-(3-dimethylaminopropyl)-N′-ethylcarbodiimide hydrochloride (EDC)/N-hydroxysuccinimide (NHS) (Sigma Aldrich, St. Louis, MO) according to the method described by Choh et al.115 In brief, HA was dissolved in deionized water at 3 mg/mL, then combined with EDC and NHS as solids at a molar ratio of COOH/EDC/NHS 1:4:4. The reaction was performed at room temperature with constant stirring and pH maintained between 7.0-8.0. The resulting amine-modified HA was dialyzed (MWCO 25,000; Spectrum Laboratories, Inc., Rancho Dominguez, CA), then combined with the amine-reactive form of AlexaFluor 488 (AF488) (Molecular Probes) and placed on a nutating shaker for 2 h at room temperature, then at 4 °C for at least 12 h. Unreacted AF488 dye was removed by dialysis (MWCO 25,000; Spectrum Laboratories, Inc.).
3.2.2 Cell coating
T98G glioma cells were coated with the layer-by-layer (LbL) technique, with modifications to the LbL method first described by Veerabadran et al.37 In brief, the cells were either coated while adhered to tissue-culture polystyrene plates, or in suspension in DPBS after trypsinization (Figure 3.1). The cells were incubated first with PLL (1 mg/

Chapter 3 | Cell Coating to Control Cell Adhesion 35
mL in DPBS), then second with either DPBS for single-coated cells or HA (1 mg/mL in DPBS) for double-coated cells; cells were rinsed with DPBS twice between coatings, and twice after the last coating. Adherent cells were incubated with each polymer solution for 2 min at room temperature. For coatings in suspension, cells in polymer solutions were placed in microcentrifuge tubes on an end-to-end mixer at 4 °C and incubated for different times (5 min to 2 h); cells were rinsed by low centrifugation (200×g) using a benchtop centrifuge (Eppendorf Model 5415D), and used immediately after coating.
3.2.3 Confocal fluorescence microscopy
Coated cells were examined using confocal fluorescence microscopy to assess the presence of the polymer coatings. Immediately prior to imaging, cell nuclei were stained with DAPI (Vectashield mounting medium with DAPI; Vector Laboratories, Burlingame, CA). Cells were imaged using an upright confocal microscope (Olympus FluoView FV1000; lex/lem for AF488 and AF594 were 488 nm/520 nm and 543 nm/618 nm, respectively).
Figure 3.1 Schematic illustration of cell surface coating by the LbL method using poly-L-lysine (PLL) and
hyaluronic acid (HA). Cells were coated when attached to tissue culture polystyrene plates (TCPS; top)
when suspended in buffer (bottom).
T98G Cells
PLL (+) HA (-)
Trypsinize
Suspended
Adherent-
----
--
-
-
-- -
-
---
-
HAPLL-
-- -
-
---
-
HAPLL
-
--
--
--
-
+
++ +
+
+++
+
PLL
PLL
++
++
++
+

Chapter 3 | Cell Coating to Control Cell Adhesion 36
3.2.4 Zeta potential measurements
To determine the net electric charge of cell surfaces, cells were first trypsinized. Suspension-coated and uncoated cells were rinsed twice with DPBS, then 100 μL of each cell suspension was combined with 1.4 mL of distilled water and placed into a cuvette. Zeta potential measurements were immediately obtained with a Brookhaven Instruments 90Plus Particle Size Analyzer.
3.2.5 Cell viability
T98G cells were coated by PLL followed by HA as described above. After rinsing, coated cells were cultured in media for 7 days at 37 °C in 5% CO2. At various time points cell viability was assessed via the LIVE/DEAD assay (Molecular Probes) following the instructions from the vendor. Fluorescence microscopy imaging of stained cells was performed within 2 h of dye application. “Dead” control cells were prepared by incubating cells coated with PLL and HA in 70% methanol for 30 min. Unlabeled PLL and HA were used when performing cell viability assays to prevent confounding red and green fluorescence emissions.
3.2.6 Synthesis of HA pyridyl disulfide (PD) derivative
Following a method developed by Choh et al.,115 carboxyl groups of HA were first coupled to 1,6-diaminohexane (Alfa Aesar) via EDC/NHS, and were subsequently reacted with N-succinimidyl 3-(2-pyridyldithio)-propionate (SPDP; Pierce, Rockford, IL) to produce HA pyridyl disulfide (“HA-PD”). The content of PD group on HA was determined to be 3% using the 2,4,6-trinitrobenzenesulfonic acid (TNBSA) assay (Pierce, Rockford, IL).115
3.2.7 Chemical crosslinking of polymer coatings on cell surface
Glioma cells were trypsinized, and coated with either PLL only (1 mg/mL in DPBS), or with PLL then HA or HA-PD (1 mg/mL each in DPBS). Each polyelectrolyte incubation was 1 h in duration with gentle end-to-end mixing at 4 °C. Chemical crosslinking of the coatings was then performed using one of the following two methods: cells coated
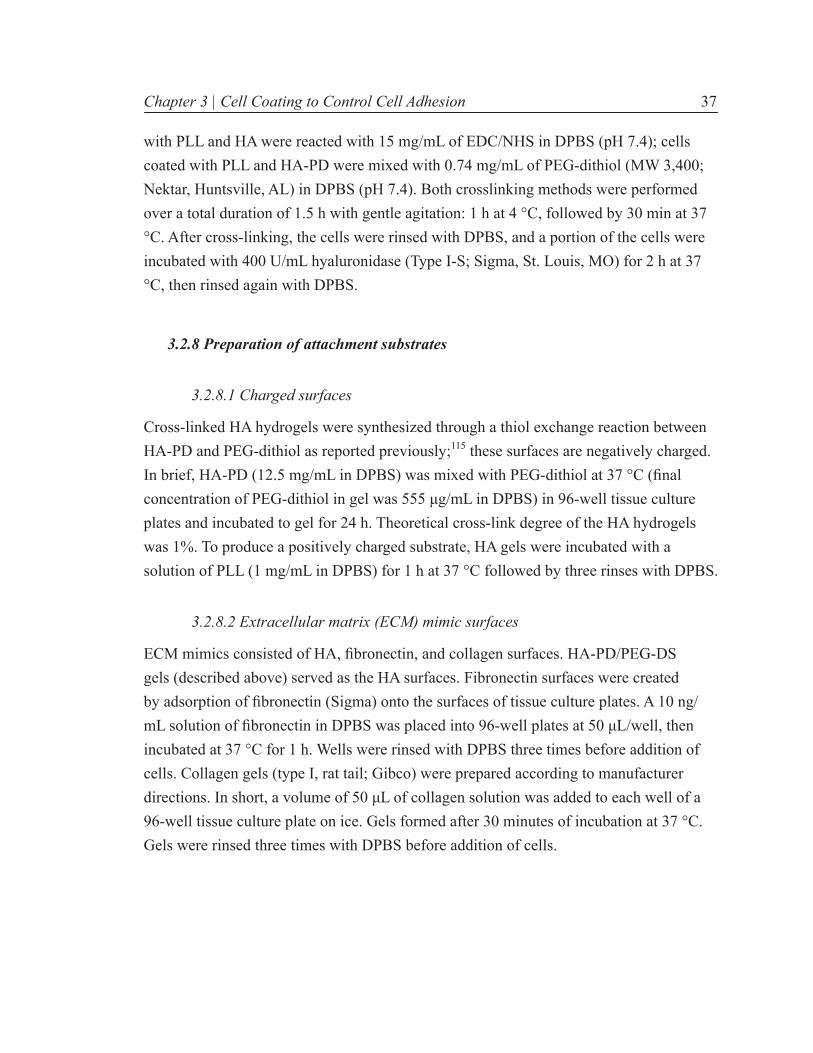
Chapter 3 | Cell Coating to Control Cell Adhesion 37
with PLL and HA were reacted with 15 mg/mL of EDC/NHS in DPBS (pH 7.4); cells coated with PLL and HA-PD were mixed with 0.74 mg/mL of PEG-dithiol (MW 3,400; Nektar, Huntsville, AL) in DPBS (pH 7.4). Both crosslinking methods were performed over a total duration of 1.5 h with gentle agitation: 1 h at 4 °C, followed by 30 min at 37 °C. After cross-linking, the cells were rinsed with DPBS, and a portion of the cells were incubated with 400 U/mL hyaluronidase (Type I-S; Sigma, St. Louis, MO) for 2 h at 37 °C, then rinsed again with DPBS.
3.2.8 Preparation of attachment substrates
3.2.8.1 Charged surfaces
Cross-linked HA hydrogels were synthesized through a thiol exchange reaction between HA-PD and PEG-dithiol as reported previously;115 these surfaces are negatively charged. In brief, HA-PD (12.5 mg/mL in DPBS) was mixed with PEG-dithiol at 37 °C (final concentration of PEG-dithiol in gel was 555 μg/mL in DPBS) in 96-well tissue culture plates and incubated to gel for 24 h. Theoretical cross-link degree of the HA hydrogels was 1%. To produce a positively charged substrate, HA gels were incubated with a solution of PLL (1 mg/mL in DPBS) for 1 h at 37 °C followed by three rinses with DPBS.
3.2.8.2 Extracellular matrix (ECM) mimic surfaces
ECM mimics consisted of HA, fibronectin, and collagen surfaces. HA-PD/PEG-DS gels (described above) served as the HA surfaces. Fibronectin surfaces were created by adsorption of fibronectin (Sigma) onto the surfaces of tissue culture plates. A 10 ng/mL solution of fibronectin in DPBS was placed into 96-well plates at 50 μL/well, then incubated at 37 °C for 1 h. Wells were rinsed with DPBS three times before addition of cells. Collagen gels (type I, rat tail; Gibco) were prepared according to manufacturer directions. In short, a volume of 50 μL of collagen solution was added to each well of a 96-well tissue culture plate on ice. Gels formed after 30 minutes of incubation at 37 °C. Gels were rinsed three times with DPBS before addition of cells.
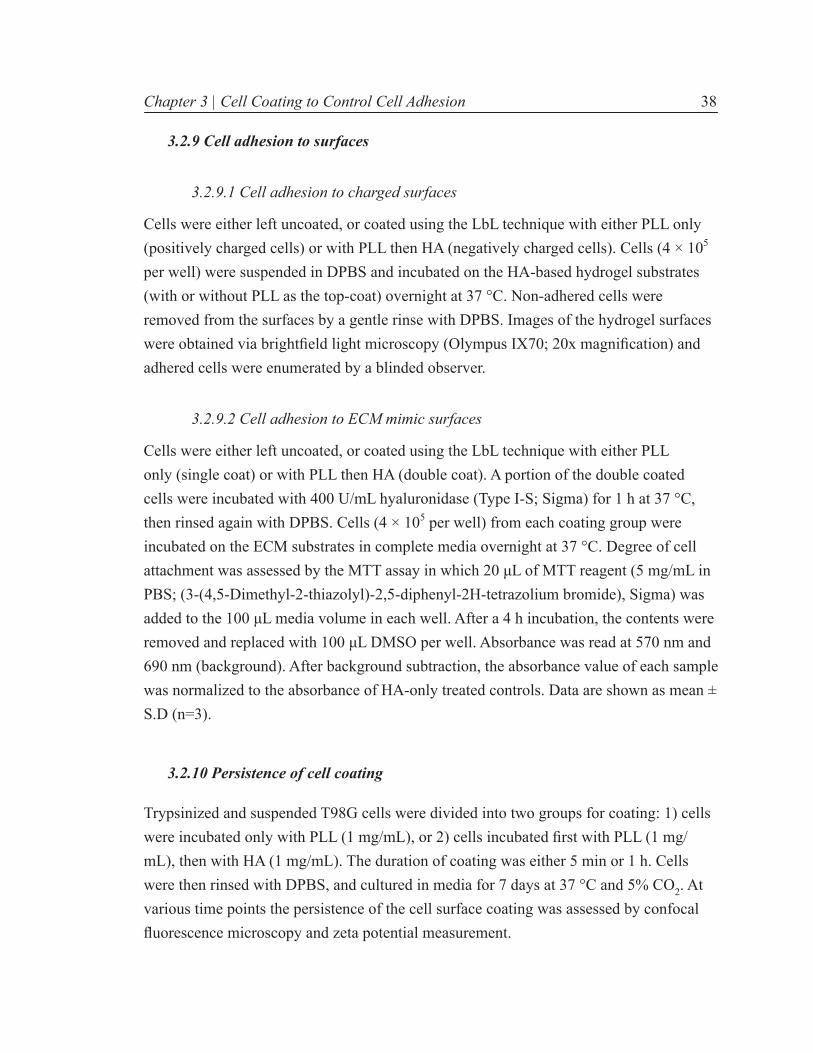
Chapter 3 | Cell Coating to Control Cell Adhesion 38
3.2.9 Cell adhesion to surfaces
3.2.9.1 Cell adhesion to charged surfaces
Cells were either left uncoated, or coated using the LbL technique with either PLL only (positively charged cells) or with PLL then HA (negatively charged cells). Cells (4 × 10⁵ per well) were suspended in DPBS and incubated on the HA-based hydrogel substrates (with or without PLL as the top-coat) overnight at 37 °C. Non-adhered cells were removed from the surfaces by a gentle rinse with DPBS. Images of the hydrogel surfaces were obtained via brightfield light microscopy (Olympus IX70; 20x magnification) and adhered cells were enumerated by a blinded observer.
3.2.9.2 Cell adhesion to ECM mimic surfaces
Cells were either left uncoated, or coated using the LbL technique with either PLL only (single coat) or with PLL then HA (double coat). A portion of the double coated cells were incubated with 400 U/mL hyaluronidase (Type I-S; Sigma) for 1 h at 37 °C, then rinsed again with DPBS. Cells (4 × 10⁵ per well) from each coating group were incubated on the ECM substrates in complete media overnight at 37 °C. Degree of cell attachment was assessed by the MTT assay in which 20 μL of MTT reagent (5 mg/mL in PBS; (3-(4,5-Dimethyl-2-thiazolyl)-2,5-diphenyl-2H-tetrazolium bromide), Sigma) was added to the 100 μL media volume in each well. After a 4 h incubation, the contents were removed and replaced with 100 μL DMSO per well. Absorbance was read at 570 nm and 690 nm (background). After background subtraction, the absorbance value of each sample was normalized to the absorbance of HA-only treated controls. Data are shown as mean ± S.D (n=3).
3.2.10 Persistence of cell coating
Trypsinized and suspended T98G cells were divided into two groups for coating: 1) cells were incubated only with PLL (1 mg/mL), or 2) cells incubated first with PLL (1 mg/mL), then with HA (1 mg/mL). The duration of coating was either 5 min or 1 h. Cells were then rinsed with DPBS, and cultured in media for 7 days at 37 °C and 5% CO2. At various time points the persistence of the cell surface coating was assessed by confocal fluorescence microscopy and zeta potential measurement.

Chapter 3 | Cell Coating to Control Cell Adhesion 39
3.2.11 Statistical analysis
Data are shown as mean ± S.D. Statistical analyses were performed using the two-sample equal variance Student’s t-test. A probability (p) value of <0.05 was deemed statistically significant.
3.3 Results
We sought to demonstrate mediation of cell adhesion by changing the cell surface rather than the substrate. We first modified the surfaces of T98G cells by the LbL technique, either when adhered to a substrate, or when the cells were in suspension. We then confirmed the presence of the coatings, assessed cell viability, and measured the attachment of the coated cells to differently charged substrates. In addition, we characterized the persistence of the cell coatings, and investigated the stability of the cell coatings after chemical crosslinking and enzymatic degradation.
3.3.1 Demonstration of polyelectrolyte coating on cells in 2-D and 3-D
First, we attempted to coat T98G cells with charged polymers. We began by coating cells that were already adhered to a substrate in 2-D since cells would tolerate better the rinsing steps of the LbL coating process. Confocal fluorescent microscopy images of coated cells showed red (corresponding to PLL) and green (corresponding to HA) colors present at the surface of the cells (Figure 3.2). Surface coatings appeared uniform, and there was no detectable fluorescence with either fluorophore in the interior of cells. When cells were coated with AF594-PLL and unlabeled HA, fluorescence was not seen in the green channel (lem,= 520 nm), and likewise, cells coated with unlabeled PLL and AF488-HA did not show fluorescence in the red channel (lem= 618 nm), indicating that fluorescence cross-over did not occur and that both polymers were present in the coating. Cross-sectional views confirmed that polyelectrolyte coatings remained only on the surface of the cells at all focal depths and that the entire surface of the cells exposed to the liquid media was conformally coated with both PLL and HA.
After showing that it was possible to coat adherent cells using the LbL technique, we next sought to investigate coating cells in suspension, in order to obtain cell surfaces that were

Chapter 3 | Cell Coating to Control Cell Adhesion 40
entirely and uniformly coated. After trypsinization, cells were incubated sequentially with DPBS solutions of AF594-PLL and AF488-HA. Again, confocal microscopy images (Figure 3.3) showed that red (PLL) and green fluorescence (HA) were present at the surface of the cells. The coatings were reasonably uniform but not as uniform as those of the adherent cells coated in 2-D. During our LbL coating optimization process, we also noticed red fluorescence inside the cells, which we interpreted as PLL internalization. We came to realize that PLL incubation time greatly affected the degree of internalization: red fluorescence in the interior of the cell was not observed with PLL incubation times up to 15 min, but was observed with PLL incubation times of 1 h or longer (data not shown).
To further optimize the duration of the coating process, we systematically varied the time of incubation with PLL and HA and then characterized the extent of cell coating
Figure 3.2 Confocal fluorescence (A-C) and brightfield (D) images of adherent T98G cells coated stepwise
with fluorescently labeled 1 mg/mL of PLL (red) and HA (green) for 2 min each. Cells were stained with DAPI
(blue) prior to imaging. Individual red and green channels are shown in (A) and (B), respectively; (C) is the
merged image of all channels. Cross-sections of the cells are shown at right and bottom of each panel.
Scale bar = 20 μm. Magnification, 60x.

Chapter 3 | Cell Coating to Control Cell Adhesion 41
by measuring the zeta potential of the cell surface. The uncoated cells were negatively charged with a zeta potential of around -34 mV. When only PLL coating was applied, the zeta potential of coated cells became increasingly positive with longer PLL incubation time and did not change significantly after 1 h, indicating that maximal cell surface coverage by PLL was reached (Figure 3.4A). After coating cells with PLL for 1 h, HA was applied for various durations, causing zeta potential of the cell surface to fall to the negative range (Figure 3.4B). It was found that only a 5-min coating of HA was sufficient
AF594-PLL
AF594-PLLAF488-HA
AF488-HA
DAPI
A
DC
B
Figure 3.3 Confocal fluorescence (A-C) and brightfield (D) images of T98G cells coated stepwise in buffer
suspension with fluorescently labeled 1 mg/mL of PLL (red) and HA (green) for 5 min each. Cells were
stained with DAPI (blue) prior to imaging. Individual red and green channels are shown in (A) and (B),
respectively; (C) is the merged image of all channels. Cross-sections of the cells are shown at right and
bottom of each panel. Scale bar = 10 μm. Magnification, 60x.

Chapter 3 | Cell Coating to Control Cell Adhesion 42
to revert the PLL-coated cell surface to be negatively charged and that prolonged incubation with HA beyond 5 min had no further effect.
3.3.2 Stabilization of cell coatings by chemical crosslinking
Next, we set out to demonstrate that the cell surface coatings of PLL and HA formed by noncovalent ionic interactions on suspension-coated cells could be further stabilized using two different chemical cross-linking methods. In the first method, we used carbodiimide chemistry (EDC/NHS) to cross-link the primary amines of PLL with the carboxylic acids of HA. In the second method, we coated cells with an HA derivative, HA-PD,115 and crosslinked it by PEG-dithiol without affecting the PLL layer. After crosslinking, we subjected the coated cells to treatment by hyaluronidase, an enzyme that randomly cleaves the β-N-acetylhexosamine-[1→4] glycosidic bonds of HA,116 followed by zeta potential measurement, hoping to reveal any changes in coating stability.
-40
-20
0
20
40
0 15 60 120
Zeta
Pot
entia
l (m
V)
*n.s.
n.s.
PLL coating time (min)
A
-40
-20
0
20
40
0 20 40 60 80 100 120
PLL (1 h) + HAUncoated
Zeta
Pot
entia
l (m
V)
*
HA coating time (min)
* * *B
Figure 3.4 Zeta potential measurements of T98G cells that were subjected to polyelectrolyte time course
incubation studies. In the PLL only time course (A), T98G cells were coated with PLL (1 mg/mL) for different
time durations. For the HA coating time course (B), cells were coated with PLL (1 mg/mL) for 1 h, then
incubated for different lengths of time in HA (1 mg/mL). Data shown as mean ± S.D (n ≥ 4); *p < 0.001 by
Student’s t-test, n.s. = not significant.

Chapter 3 | Cell Coating to Control Cell Adhesion 43
Cells that were coated with PLL then HA showed a charge reversal with alternating layers of polyelectrolytes: zeta potential became more positive after incubation with PLL, and more negative after a successive treatment with HA (Figure 3.5). Upon treatment with hyaluronidase, the zeta potential of non-crosslinked PLL/HA double-coated cells became more positive (though not as positive as PLL-only coated cells), suggesting that HA layer was partially removed due to enzymatic digestion. However, if the double-coated cells were crosslinked chemically with either method (EDC/NHS or PEG-dithiol), then treated with hyaluronidase, the zeta potential remained negative and was significantly lower than hyaluronidase-treated non-crosslinked coated cells (Figure 3.5). This finding suggests that the crosslinked PLL/HA bilayer coatings are resistant to hyaluronidase degradation and are more stable.
3.3.3 Effect of coating on cell viability
The LIVE/DEAD assay was used to assess the viability of cells coated in suspension with PLL and HA (Figure 3.6). Live cells that are able to metabolize calcein produce green fluorescence, whereas dead cells are marked by red fluorescence when the hydrophilic ethidium homodimer (EthD-1) is able to permeate a compromised cell membrane. Uncoated cells showed 100% viability with only green fluorescence and no
***
-60
-40
-20
0
20
Zeta
Pot
entia
l (m
V)
PLLHA
HA-PDHyaluronidase
EDC/NHSPEG-Dithiol
------
+-----
++----
++-+--
++-++-
+-++-+
* ***
n.s.n.s.
*** Figure 3.5 The effect on cell
surface coating stability by
chemical crosslinking. T98G
cells were left uncoated, coated
with PLL only, or coated with
both PLL and HA. PLL- and HA-
coated cells were either left non-
crosslinked, or were crosslinked
via EDC/NHS or PEG-dithiol, then
incubated with hyaluronidase.
Data shown as mean ± S.D (n ≥
4); *p < 0.05, **p < 0.005 ; ***p <
0.001 by Student’s t-test, n.s. =
not significant.
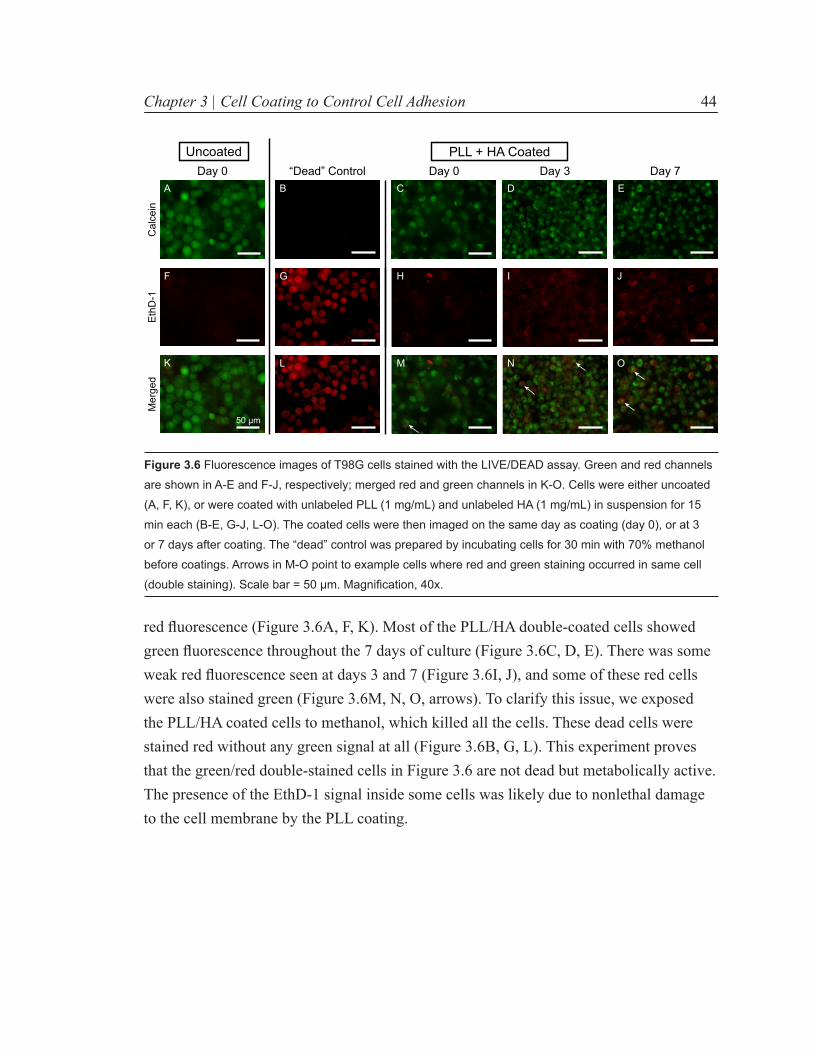
Chapter 3 | Cell Coating to Control Cell Adhesion 44
red fluorescence (Figure 3.6A, F, K). Most of the PLL/HA double-coated cells showed green fluorescence throughout the 7 days of culture (Figure 3.6C, D, E). There was some weak red fluorescence seen at days 3 and 7 (Figure 3.6I, J), and some of these red cells were also stained green (Figure 3.6M, N, O, arrows). To clarify this issue, we exposed the PLL/HA coated cells to methanol, which killed all the cells. These dead cells were stained red without any green signal at all (Figure 3.6B, G, L). This experiment proves that the green/red double-stained cells in Figure 3.6 are not dead but metabolically active. The presence of the EthD-1 signal inside some cells was likely due to nonlethal damage to the cell membrane by the PLL coating.
“Dead” ControlDay 0
50 µm
Cal
cein
Eth
D-1
Mer
ged
Day 7Day 3Day 0PLL + HA CoatedUncoated
A
ONMLK
JIHGF
EDCB
Figure 3.6 Fluorescence images of T98G cells stained with the LIVE/DEAD assay. Green and red channels
are shown in A-E and F-J, respectively; merged red and green channels in K-O. Cells were either uncoated
(A, F, K), or were coated with unlabeled PLL (1 mg/mL) and unlabeled HA (1 mg/mL) in suspension for 15
min each (B-E, G-J, L-O). The coated cells were then imaged on the same day as coating (day 0), or at 3
or 7 days after coating. The “dead” control was prepared by incubating cells for 30 min with 70% methanol
before coatings. Arrows in M-O point to example cells where red and green staining occurred in same cell
(double staining). Scale bar = 50 μm. Magnification, 40x.

Chapter 3 | Cell Coating to Control Cell Adhesion 45
3.3.4 Control of cell adhesion to substrates
Substrates of different surface charge were produced for cell attachment studies, as described in the Methods section: cross-linked HA gels served as negatively charged surfaces, and PLL-covered HA gels served as positively charged surfaces. The adhesion of uncoated, PLL-coated, or PLL/HA double-coated cells to these substrates was examined; cells were coated in suspension after trypsinization. Uncoated cells attached
HA + PLL coated cellsPLL coated cells
HA gel
PLL on HA gel
G
Uncoated cells
FD E
A B C
100 µm
Figure 3.7 Adhesion of single (PLL) and double (PLL/HA) coated T98G cells to charged hydrogel
substrates. Cells were left uncoated (A,D), coated with either PLL only for 1 h (B,E), or with PLL and HA
for 1 h each coat (C,F). The cells were then incubated with negatively and positively charged surfaces
(cross-linked HA gels and PLL-incubated HA gels, respectively). Cells attached to 4x104 μm2 areas were
enumerated as shown in (G). Data shown as mean ± S.D. (n= 6 fields per condition), * p < 0.005, ** p <
0.001 by Student’s t-test. Scale bar = 100 µm. Images 20x.

Chapter 3 | Cell Coating to Control Cell Adhesion 46
in higher numbers to positively charged substrates than to negatively charged substrates (Figure 3.7A, D) and the result was statistically significant (p < 0.005, Figure 3.7G). Similarly, high numbers of coated cells only attached to substrates of the opposite charge (Figure 3.7C, E); very low attachment was observed when the coated cells had the same surface charge as the substrate (Figure 3.7B, F). The differences in the number of coated cells attached to oppositely charged substrates were also statistically significant (p < 0.005, Figure 3.7G).
The adhesion of cells (uncoated, PLL single-coated, PLL/HA double-coated cells, and double-coated/enzyme-treated) to ECM mimics was also examined (Figure 3.8). For all surfaces, uncoated cells attached in the highest numbers to all surfaces. In general, the degree of attachment to the surfaces, from highest to lowest, was: uncoated > single coated > double-coated cells. For attachment to all surfaces, treatment with the enzyme hyaluronidase, increased cell attachment to a higher degree than both single- and double-coated cells. Grouping the data by ECM mimic, the least number of cells attached to HA, an intermediate number to collagen, and the most to FN and TCP.
0
0.5
1
1.5
2
2.5
HA Col FN TCP
UncoatedSingle coatDouble coatDouble coat + Enz
Abs
orba
nce
(570
- 69
0 nm
)
Substrate
* **
* ***
***
* ***
**
Figure 3.8 Adhesion of
uncoated, single coated (PLL),
double coated (PLL/HA), and
double-coated/enzyme-treated
(PLL/HA/HAase) T98G cells to
ECM mimic substrates. After
coating treatments, the cells
were incubated on hyaluronic
acid gels (HA), collagen gels
(Col), fibronectin-coated tissue
culture plates (FN), or tissue
culture plate control (TCP). The
MTT assay was performed one
day after plating. Data shown as
mean ± S.D. (n= 3), * p < 0.05 by
Student’s t-test.

Chapter 3 | Cell Coating to Control Cell Adhesion 47
3.3.5 Persistence of the cell coatings
Zeta potential measurements and confocal imaging were performed to determine the persistence of the coatings on cells coated in suspension. T98G cells were coated with either PLL alone or PLL/HA double layers, cultured for 7 days, and examined at various time points.
PLL-only coated cells maintained positive zeta potential until 3 h post-coat, but significantly decreased to negative values by day 1 after coating, and remained negative
-40
-20
0
20
40
60
0 1 2 3 4 5 6 7
UncoatedPLL single-coat
Zeta
Pot
entia
l (m
V)
**
Time after coating (d)
** *A
-40
-20
0
20
40
60
0 1 2 3 4 5 6 7
PLL/HA double-coat
Zeta
Pot
entia
l (m
V)
Time after coating (d)
B
Figure 3.9 Zeta potential
measurements for assessing
the persistence of single (PLL)
and double (PLL/HA) coatings
on T98G cells during one week
in culture. Cells were coated
with PLL (1 mg/mL) for 1 h (A),
or with PLL (1 mg/mL) and HA
(1 mg/mL) for 1 h each (B), then
rinsed with DPBS. At different
times after coating, zeta potential
measurements were obtained of
the coated cells. Data shown as
mean ± S.D (n ≥ 5); *p < 0.05,
**p < 0.001 by Student’s t-test.

Chapter 3 | Cell Coating to Control Cell Adhesion 48
through day 7 (Figure 3.9A, dotted line). Cells coated with both PLL and HA had negative zeta potential values at every time point of the study (Figure 3.9B).
Visually, red fluorescence can be seen on the surface of cells that were incubated with only AF594-PLL immediately after coating (Figure 3.10A). With time, however, red fluorescence appeared inside of the cells and became localized within or on the surface of the nucleus (Figure 3.10B-D). No green fluorescence was seen for the AF594-PLL incubated cells, which was expected since the cells were not coated with HA (Figure 3.10E-H).
For cells incubated with AF594-PLL then AF488-HA, fluorescent coatings can be seen on the surface of the cells on day 0 (Figure 3.11A, E, respectively). Again, fluorescently
Day 0 Day 1
Mer
ged
with
DA
PI
Cell coating stability, confocal images 60x
1.0 mg/mL PLL (no HA)
Day 3 Day 7
AF5
94-P
LLA
F488
-HA
A DCB
E HGF
I LKJ
Figure 3.10 Confocal fluorescence microscopy for assessing the persistence of single (PLL) coatings
on T98G cells during one week in culture. Cells were coated with AF594-PLL (1 mg/mL) for 5 min, then
rinsed with DPBS. At different times after coating, cells were mixed with DAPI and imaged via confocal
fluorescence microscopy. Green and red channels are shown in A-D and E-H, respectively. Merged red,
green, and blue channels shown in I-L. Scale bar = 10 μm. Magnification, 60x.

Chapter 3 | Cell Coating to Control Cell Adhesion 49
labeled PLL appeared to be internalized into the cells and accumulated around the nucleus (Figure 3.11B-D). The green fluorescence of the HA, though, remained on the surface of the cells but diminished with time (Figure 3.11E-H).
3.4 Discussion
Here we demonstrate that cells can be conformally coated with oppositely charged polyelectrolytes (PLL and HA) using the LbL technique, and the cells remain viable after being coated. Furthermore, we show that we can control cell adhesion to different substrates based on electrostatic interactions between the cell surface coating and the
Day 0 Day 1M
erge
d w
ith D
AP
I
Cell coating stability, confocal images 60x
1.0 mg/mL PLL, then 1.0 mg/mL HA
Day 3 Day 7A
F594
-PLL
AF4
88-H
AA DCB
E HGF
I LKJ
Figure 3.11 Confocal fluorescence microscopy for assessing the persistence of double (PLL/HA) coatings
on T98G cells during one week in culture. Cells were coated with AF594-PLL (1 mg/mL), then AF488-HA (1
mg/mL) for 5 min each, then rinsed with DPBS. At different times after coating, cells were mixed with DAPI
and imaged via confocal fluorescence microscopy. Green and red channels are shown in A-D and E-H,
respectively. Merged red, green, and blue channels shown in I-L. Scale bar = 10 μm. Magnification, 60x.

Chapter 3 | Cell Coating to Control Cell Adhesion 50
substrate, and that the coatings on the cells persist in a time frame consistent to allow such cell attachment to proceed. We have directly visualized the surface coatings of both polyelectrolytes, and have shown that covalent crosslinking of the polymer layers can be used to stabilize the coatings. While two previous studies reported that cells can be coated with PLL and HA using the LbL technique,37,114 we have substantially expanded upon such work by showing that we can use these cell coatings to impart rather dramatic changes to the adhesive behavior of these cells.
Our hypothesis that cell-substrate interactions could be controlled based on electrostatic interactions was shown to be correct. Cell adhesion to extracellular matrices could be controlled to some degree, but the differences were not as drastic. It is likely that the cell coatings masked essential cell surface receptors, and that components in complete media (like serum) decrease the effects of charge-only interactions. Collectively, therefore, our results confirm that cell adhesion is more complex than mere charge-charge interactions. Nonetheless, we have gained insight regarding the use and feasibility of the LbL technique for cell surface modification.
Our data shows that the modified surface charge is maintained for at least 3 h post-coat, which is a sufficient amount of time to direct cell adhesion. The disappearance of the coatings from the surface of the cells may be beneficial for an application such as cardiac cell therapy, since the cells may be able to break free from their polymer shells to proliferate and differentiate. One group of researchers has studied the application of polyelectrolyte patches on cell surfaces instead of conformal coating, in order to allow cells to better maintain innate cellular functions without the potential interference of the surface coating.117 However, lack of coating persistence may be undesirable for other applications where cell coating needs to be maintained to last for extended periods of time. To this end, we have shown that mild chemical crosslinking of conformal coatings on cell surface can stabilize the coatings. Refinement of such chemical crosslinking approaches in the future may allow the stability and degradation of the cell coating to be tailored for specific biomedical applications.
Our study recapitulates scenarios found in biology where important events involving cell adhesion is modulated based on rather simple electrostatic charge-charge interactions. As mentioned earlier, metastasis of cancer occurs when tumor cells detach from their original site and spread to other sites. It has been found that the metastatic cells have

Chapter 3 | Cell Coating to Control Cell Adhesion 51
an increased level of negative surface charge than normal cells,118,119 and this may be due to the increased amounts of HA in the pericellular coat of metastatic cancer cells.120 Removal of HA from the cell surface via hyaluronidase treatment was shown to increase cell attachment to ECM mimics (Figure 3.8). Altering the electrostatic properties of cells, as we have done, may be a potential strategy for use in anticancer therapeutics. In fact, it has been recently shown that cationic anticancer peptides show selectivity for cancer cells over normal cells due to these differences in electrostatic surface potential.121
In another example, proper neural development is dependent on decreasing axon-axon adhesion to promote defasciculation. The expression of highly negatively charged polysialic acid on the axon growth cones causes the axons to repel and spread away from each other. When the polysialic acid is enzymatically removed, the axons fail to separate because of increased axon-axon adhesions.30 Therefore, it can be envisioned that our cell surface coating approach could be used to engineer the spatial pattern of distribution and growth of one or multiple cell types, thereby modulating tissue morphogenesis in the context of regenerative medicine.
In the field of reproductive biology, it has been observed that fertilization causes changes in surface charges of sperm and oocytes. Capacitation is the process in which sperm are able to penetrate the outer layer of an oocyte. It has been suggested that this process is associated with changes in the surface charge of the sperm cell.122 After the sperm cell gains access to the egg, the fertilized oocyte undergoes rapid modifications to prevent polyspermy, including a change to a more negatively charged cell surface.123 It is thus plausible to use polyelectrolyte coating of the cell surface to either promote (by opposite charges) or inhibit (by like charges) cell-cell fusion for therapeutic or regenerative purposes.
Lastly, changes in surface charge of tissues due to inflammation can potentially be targeted for biomaterial-based therapy. For example, Thierry et al. have reported that the surface of injured arteries is more negatively charged than healthy vessels.124 These and other researchers have exploited this difference in surface charge to investigate the use of the LbL approach to coat the luminal side of the vessels with polyelectrolytes to prevent cell attachment that can lead to thrombogenesis125 and restenosis.124
Our results reported here serve as proof-of-concept, and opportunities exists to build upon our work regarding the internalization of the cationic polymer and resulting loss

Chapter 3 | Cell Coating to Control Cell Adhesion 52
of cell viability. Although it has been stated in the literature that PLL can permeabilize membranes, be internalized into cells, and cause cytotoxicity,38,126,127 not all authors have seen this phenomenon.37 Our own results have reflected this difference and have found that PLL incubation time greatly affects the degree of internalization, which may explain the different observations seen by different authors: Strand et al.127 incubated cells with PLL overnight and saw significant cell death, whereas Veerabadran et al.37 incubated cells in PLL for only 15 min and observed minimal cytotoxicity.
In this work, PLL-induced permeabilization of the cell membranes may explain the co-localization of red and green fluorescence observed for coated cells in the viability assay (Figure 3.6). Green fluorescence can only occur in actively metabolizing cells when the lipophillic calcein AM dye crosses the cell membrane and is converted to the polyanionic and membrane-impermeant calcein fluorophore. The ethidium bromide homodimer molecule, on the other hand, is a hydrophilic molecule that can only cross permeabilized cell membranes. Therefore, red fluorescence can occur when cell membranes are compromised, even though the cells are not metabolically dead. As a result, our use of a “dead” control was very important to distinguish truly dead cells from compromised—but living—cells. Nonetheless, our concept for using the LbL approach to control cell adhesion is not limited to PLL and could be pursued with a different cationic polymer, such as a PLL-g-PEG copolymer described by Wilson et al.38 for LbL coatings to immunoisolate pancreatic islet cells; these coatings show minimal polymer internalization and improved cell viability. Finally, it is likely that cell attachment based solely on electrostatic interactions may not be enough to confer specificity, and it may be warranted to combine polymer coatings with specific ligands for improved and/or targeted adhesion.
The work presented here shows that one can control cell adhesion by changing the surface of cells using the LbL polyelectrolyte coating technique. However, more work will need to be done to add specificity into the coatings in order to better control cell adhesion in serum-containing environments. It is envisioned that molecules such as antibodies may be incorporated into the coatings (as has been performed with LbL coatings on inorganic surfaces128) and that ligand-specific attachment can work synergistically with electrostatic-based interaction to control adhesion of coated cells to substrates.

Chapter 3 | Cell Coating to Control Cell Adhesion 53
In the broad scheme, it is noteworthy to point out that these efforts to control cell adhesion by changing the surface of cells is a significant shift in paradigm. The bulk of research devoted to understanding cell adhesion has focused on altering the non-living substrate to which cells attach. Keeping in mind that it is the cells that are the actual therapy, this work is novel in that it applies the knowledge gained from studies of material surface modification to modification of the cell surface. The ability to control cell adhesion by the modification of the cell surface may lead to improvements in the clinical outcome of patients who receive cell-based therapies or cancer treatments.
3.5 Conclusions
In this study, we investigated the use of the polycation PLL and the polyanion HA to modify cell surfaces via the LbL technique, and have optimized the method for minimal loss of cell viability. Taken together, our results suggest that we can coat cell surfaces with polyelectrolytes using the LbL approach and tailor the surfaces to promote or inhibit cell-substrate adhesion, with minimal cytotoxicity. We also show that the cells coatings are transient, but that if desired for a certain application, the surfaces of the coated cells can be stabilized using simple chemical crosslinking techniques. We consider these proof-of-concept results as promising steps towards future specific physiological applications, such as targeted treatments for cancer or improved retention in cell-based therapies.

54
4.1 Introduction
Hyaluronic acid (HA) is a naturally occurring glycosaminoglycan found in mammalian extracellular matrix.53 Due to HA’s role in tissue development, embryogenesis, and wound healing,53 hydrogels made from HA have been of popular interest in the biomedical field.54 However, chemical modifications must be performed to HA to impart mechanical strength and integrity. Several crosslinked HA-based gels have been synthesized for drug and cell delivery, which involve the use of exogenously added components to initiate gelation (e.g., chemical crosslinkers or UV-light).55,56
Our laboratory has developed a method to fabricate novel disulfide-cross-linked HA hydrogels.115 In brief, HA is first conjugated with pyridyl disulfide groups, which is then combined with a PEG-disulfide crosslinker to yield the formation of a hydrogel within minutes of mixing. The HA-PD/PEG-DS hydrogels can crosslink in situ, and cells can be encapsulated into the gels and remain viable.
As a follow-up to our initial report,115 we sought to investigate the in vivo biocompatibility of the disulfide-crosslinked hydrogels, as well explore the effect of HA’s molecular weight on HA-PD/PEG-DS gel formation. During our investigations,
Chapter 4In situ Gelation of Hyaluronic Acid with Exogenous and Endogenous Thiols†
† This work is supported in part by the University of Minnesota’s Institute for Engineering in Medicine (IEM), a NIH Biotechnology Training Grant (Grant Number T32 GM008347) award (to DC), and a University of Minnesota Doctoral Dissertation Fellowship (to DC). Special thanks to Prof. T. Andrew Taton (Department of Chemistry, University of Minnesota) for kindly providing the use of the Instron testing equipment, and to Wenqing Han for performing the in vivo injections and histological staining.

Chapter 4 | Gelation of Hyaluronic Acid with Thiols 55
we observed an interesting phenomenon: A mid molecular weight HA-PD by itself was able to form hydrogels in vivo without the use of the PEG-DS crosslinker. This particular molecular weight of HA-PD, however, did not form hydrogels in vitro. Our unexpected findings led us to hypothesize that a component within the natural in vivo milieu was able to initiate a disulfide-exchange crosslinking reaction, which produced hydrogels from solutions that only contained HA-PD. For this report, we performed in vitro and in vivo gelation experiments to investigate the effect of different variables on HA-PD-only gel formation and breakdown, as well as mechanical characterization of the explanted gels. Environmentally responsive in situ hydrogel formation based on in vivo physiology may prove to be an interesting mechanism for a class of clinically practical biomedical materials.
4.2 Materials and Methods
4.2.1 Chemicals
Hyaluronic acid (HA) sodium salt of different molecular weights (1.7×10⁴, “low”; 8.88×10⁵, “mid”; and 1.4×10⁶ Da, “high”) were obtained from Lifecore Biomedical (Chaska, MN). 1,6-Diaminohexane was purchased from Alfa Aesar (Ward Hill, MA). N-(3-Dimethylaminopropyl)-N’-ethylcarbodiimide hydrochloride (EDC-HCl) and N-hydroxysuccinimide (NHS) were purchased from Sigma (St. Louis, MO). Dulbecco’s phosphate-buffered saline (PBS) was purchased from Gibco (Invitrogen, Carlsbad, CA). N-Succinimidyl 3-(2-pyridyldithio) propionate (SPDP) and 2,4,6-trinitrobenzenesulfonic acid (TNBSA) were from Pierce (Rockford, IL). Poly(ethylene glycol)-dithiol (PEG-dithiol, PEG-DS, MW 3400) was from Nektar (Huntsville, AL).
4.2.2 Synthesis of HA pyridyl dithiol (PD) derivative
We followed a method developed by Choh et al.,115 to modify HA. In brief, carboxyl groups of HA were first coupled to 1,6-diaminohexane (Alfa Aesar) via EDC/NHS to make an amine-modified HA, “HA-NH2.” HA-NH2 was subsequently reacted with N-succinimidyl 3-(2-pyridyldithio)-propionate (SPDP; Pierce, Rockford, IL) to produce HA pyridyl disulfide (“HA-PD”). Amine content of HA-NH2 and HA-PD were

Chapter 4 | Gelation of Hyaluronic Acid with Thiols 56
determined by the TNBSA assay following manufacturer’s protocol. 1,6-Diaminohexane at concentrations of 0-50 μg/mL was used as the standard curve. The degree of substitution (DS%) of HA-PD was defined to be the content of the pyridyl disulfide (PD) group, and was found by subtracting the amount of amine left in HA-PD from the amount of amine in HA-NH2. The final HA-PD molecule consists of different numbers of repeating units of unmodified disaccharide units (x), amine-modified units (y), and pyridyl-disulfide (PD) modified units (z); these values were converting DS% of amine- and PD- groups from the total number of repeating units (n) for each molecular weight of HA (n = 42 for low MW, n = 2200 for mid MW, n = 3500 for high MW).
4.2.3 In vitro gelation studies
HA-PD was dissolved in PBS (pH 7.4) to make a 1.25% solution (12.5 mg/mL). The PEG-DS cross-linker was also dissolved in PBS (pH 7.4) to 4.625 mg/mL. Mixtures of 1% HA final concentration were made by adding HA-PD (10 uL) to 2.5 uL of either PBS or PEG-DS. The solutions were mixed quickly with a positive displacement pipettor, cast into 1.5 mL microcentrifuge tubes, then incubated at 37 °C for at least 1 h. After incubation, tubes were inverted and positive gel formation was defined as resistance to flow under gravity.
4.2.4 In vivo gelation and tissue response studies
Seventeen-week-old C57BL/6 male mice were purchased from Jackson labs (Bar Harbor, ME) and housed and used in accordance with guidelines from the University of Minnesota Institutional Animal Care and Use Committee.
For investigations of different HA-PD molecular weights, a volume of 40 μL of HA-PD (12.5 mg/mL in PBS) was combined with 10 μL of either PBS or PEG-DS (4.625 mg/mL in PBS). Because HA-PD+PEG-DS mixtures gel very quickly (within 5 min), HA-PD was injected first into the subcutaneous space with a 25-gauge needle (Tyco Healthcare Group, Mansfield, MA), then chased with PEG-DS into the center of the material bulge made by the first injection. For HA-PD+PBS sites, the two material solutions were mixed well before a one-step injection with a 25-gauge needle. Control injections consisted of

Chapter 4 | Gelation of Hyaluronic Acid with Thiols 57
40 μL of unmodified HA plus 10 μL of PBS, also well-mixed before injecting in one step. Injections were performed either into the backs of mice or into the hind limbs.
For gelation investigations of different chemical forms of mid molecular weight HA, the three materials (unmodified HA, HA-NH2, or HA-PD) were dissolved in PBS to 12.5 mg/mL. Then, 40 μL of each HA solution was combined with 10 μL of PBS in separate microcentrifuge tubes. Using 25 gauge needles, mixtures were injected subcutaneously into the hind limb of the mice.
Gel retrievals occurred on either Day 1 (for gel dissolution experiments) or Day 3 (for compression testing). Animals were termed, the skin was pulled back, an incision was made in the subcutaneous tissue pocket. Gels were removed with a curved forceps by pinching at the base of the tissue pocket made by the injection, and gently squeezing out the material. Gelled materials were removed as intact masses of material, whereas ungelled material flowed out of the tissue pockets and could not be retrieved for further characterizations.
For tissue response assessments, animals were termed at 3 days post-injection. Tissues were removed, embedded in OCT compound, flash frozen in liquid nitrogen and sectioned (10 μm thick). Tissue sections were stained with H&E using standard methods.
4.2.5 Gel dissolution experiments
Dithiothreitol (DTT; Sigma) was dissolved into PBS to 100 mM. Explanted HA-PD+PBS gels were placed into 4 mL of the DTT solution and incubated on an orbital shaker for 30 min at room temperature. HA-PD+PBS gels placed into 4 mL of PBS served as the control.
4.2.6 Glutathione gelation experiments
Mid molecular weight HA-PD was dissolved to 12.5 mg/mL in PBS. Reduced glutathione (GSH; Sigma) or oxidized glutathione (GSSG; Sigma) were dissolved into PBS to 50 mM. HA-PD (10 uL) was combined with 2.5 uL of either GSH or GSSG to make final concentrations of 10 mM glutathione (based on Hisano et al.129) and 1% HA. After mixing quickly with a positive displacement pipettor, the components were cast into 1.5

Chapter 4 | Gelation of Hyaluronic Acid with Thiols 58
mL microcentrifuge tubes, then incubated at room temperature for different lengths of time (1 min and 4.5 h). After incubation, tubes were inverted and positive gel formation was defined as resistance to flow under gravity.
4.2.7 Unconfined compression test
The explanted hydrogel samples and non-injected HA-PD solutions were loaded between the platens of an Instron mechanical testing system (Instron Model 2200-110, Park Ridge, IL) fitted with a 500 N load cell. The samples were subjected to testing as-is: The initial width (a) and length (b) of the materials were measured using a vernier caliper, and area of each sample was calculated assuming an oval shape (area = pi × 0.5a × 0.5b). Samples were compressed at a rate of 0.010 mm/sec, and was programmed to halt data acquisition when a force of 2 N was registered. Load and displacement data were recorded at 50 Hz with the Instron Series IX software, and were later converted to stress–strain values based on the original specimen dimensions; displacement at which F = 0.05 N was defined as the initial dimension of the gel samples for strain calculations. Non-injected HA-PD did not register a force until the platens touched; for these samples, the top platen was lowered until it made contact with the liquid sample and this was defined as the height of the sample for strain calculations.
4.3 Results & Discussion
Previously, our laboratory has developed a method to produce novel disulfide-cross-linked HA hydrogels.115 In this method, unmodified HA was first conjugated with an amine molecule to make HA-NH2. The HA-NH2 was then subjected to a carbodiimde reaction to incorporate pyridyl disulfide (PD), producing the final compound of HA-PD. When HA-PD is combined with PEG-dithiol (PEG-DS), hydrogels are formed in vitro. In our initial work, the hydrogels were synthesized using a high molecular weight HA (1.4 × 10⁶ Da). After that article was published, we went forward to investigate formation of HA-PD/PEG-DS hydrogels produced from different starting molecular weights of HA, as well as an in vivo compatibility assessment of all formulations.
Three molecular weights of HA were used to synthesize HA-PD according the aforementioned published method.115 Each molecule of HA-PD consists of a mixture

Chapter 4 | Gelation of Hyaluronic Acid with Thiols 59
of different repeating units, as shown in Figure 4.1. Table 4.1 shows the degrees of substitution of the pyridyl disulfide groups that were achieved, as well as the conversion to modification content x, y, and z. Degree of substitution of the PD group was found to be inversely related to HA molecular weight, which is likely due to steric hindrance presented by the longer HA chains during the chemical reactions.
Our first investigation was to compare the in vitro gelation ability of the three HA-PD materials with PEG-DS. PEG-DS mixed with high and mid MW HA-PD yielded gels in vitro, whereas low MW HA-PD did not (Table 4.2); all mixtures had a final HA-PD concentration of 1%. The control materials were a combination of PBS plus HA-PD, to yield a mixture that was also of a final HA-PD concentration of 1%; none of the control mixtures formed gels in vitro.
O
H N
O H
O H O
O
N H
S
O
S
N
O O H
OH O HO O O
H N
O H O HO O
N H 2
O O
OH
N H
HO
O x
O O
OH
N H
HO
O y
O O
OH
N H
HO
O z
Figure 1. Chemical structure of pyridyl-‐disulfide modified HA (HA-‐PD). Each molecule consists of a mixture of chemical modifica/ons to the chain of disaccharide repeat units (x = unmodified HA disaccharide unit, y = amine-‐modified unit, z = pyridyl disulfide-‐modified unit).
Figure 4.1 Chemical structure of pyridyl-disulfide modified HA (HA-PD). Each molecule consists of a mixture
of chemical modifications to the chain of disaccharide repeat units (x = unmodified HA disaccharide unit, y =
amine-modified unit, z = pyridyl disulfide-modified unit).
Table I. Results of HA Modifica/on by TNBSA MW DS%a x y z Low 15.3 ± 0.9% 35 1 7
Mid 13.7 ± 0.3% 1864 34 302
High 11.5 ± 0.8% 3050 49 401 a DS%: degree of substitution, referring to the content of pyridyl disulfide (PD) for HA-PD; x = unmodified HA disaccharide unit, y = amine-modified unit, z = pyridyl disulfide-modified unit
Table 4.1 Results of HA Modification by TNBSA

Chapter 4 | Gelation of Hyaluronic Acid with Thiols 60
We next tested gelation of our mixtures in vivo. Materials were injected with a 25-gauge needle into the subcutaneous space of the hind limbs or backs of mice. The animals were termed at one day post-injection, materials were removed (if possible), and gelation was assessed by visual and tactile examination. As shown in Table 4.2, high MW HA-PD combined with PEG-DS produced gels in vivo, while the control condition (HA-PD plus PBS) did not form gels; this was consistent with the results of the in vitro experiments. Low MW HA-PD did not gel in vivo with either PEG-DS or PBS, as expected from the in vitro experiments.
Mid molecular weight HA-PD gelled in vivo when combined with PEG-DS (Table 4.2 and Figure 4.2). Interestingly, however, gelation also occurred in vivo when mid MW HA-PD was when combined with PBS. This result was quite surprising because we predicted that combination of HA-PD with PBS would not gel, regardless of molecular weight. It is possible that the polymer chains of high MW HA-PD form intramolecular crosslinks that do not enable to gel formation, and that those of low MW HA-PD are too short to form an effective gel network. Mid MW HA-PD may have an intermediate balance: the chains of the backbone are short enough to favor intermolecular crosslinks, while long enough to form a three-dimensional hydrogel network.
To narrow down the mechanism responsible for gelation, we injected different chemical forms of mid MW HA into mice. The synthesis of HA-PD requires the production of an amine-modified HA intermediate compound, HA-NH2. As shown in Table 4.1, the conversion of HA-NH2 to HA-PD is incomplete, and we wanted to determine which form of HA gels in vivo. Of the three forms of HA injected into the mice (unmodified HA, HA-NH2, and HA-PD), HA-PD was the only material that gelled in vivo.
Table II. Physical state of HA-‐PD mixtures
In Vitro In Vivo
+ PEG-DS + PBS + PEG-DS + PBS
Low MW HA-PD S S S S
Mid MW HA-PD G S G G
High MW HA-PD G S G S
Key: S = Solution, G = Gel
Table 4.2 Physical state of HA-PD mixtures

Chapter 4 | Gelation of Hyaluronic Acid with Thiols 61
Because we could exclude the amine-modified disaccharide units in a chemical reaction, we hypothesized that the HA-PD + PBS mixture was crosslinked in vivo by a disulfide exchange reaction via the PD-modified disaccharide units. The explanted mid MW HA-PD+PBS gels were placed into solutions of PBS or DTT. Gels incubated in PBS did not dissolve, even after incubation for 1 week. However, after 30 minutes of incubation in DTT, the gels fully dissolved, and the resulting solution was clear and colorless, and confirmed that the mid MW HA-PD was crosslinked via disulfide bonds. This mid molecular weight HA-PD seemingly did not require the PEG-DS crosslinker for gelation in vivo.
Another laboratory has observed gelation of a pyridyl-disulfide modified polymer without an exogenous crosslinker. Zhang et al.130 synthesized a poly(ethylene glycol) poly(propylene sulfide) (PEG-PPS) branched copolymer that was end-capped with PD groups. The authors co-injected PEG-PPS with stem cells into mouse brains and saw gel formation. Unlike our results, however, they also observed that PEG-PPS can gel in vitro in buffer (PBS, pH 7.4; and NaHCO3, pH 9.3), stating that the disulfide exchange reaction proceeded quickly because the pH of the buffer solutions were higher than the pKa = 6.5 of 2-pyridine dithiol. Based on this explanation, it appears that Zhang et al.’s130 polymer
A B
C D
Figure 4.2 Explanted
material one day after
injections of mid MW
HA-PD. HA-PD was
injected subcutaneously
into the backs of mice, in
combination with either
PEG-DS (A, B) or PBS
(C, D). Unmodified HA did
not gel, and was unable
to be retrieved. Arrows
point to the edges of
the in situ-formed gels.
Ruler dimension is in
centimeters.

Chapter 4 | Gelation of Hyaluronic Acid with Thiols 62
may be crosslinking with itself, whereas our HA-PD needs the presence of an exogenous free thiol to form a gel.
It is plausible that gels may be able to form in physiological conditions due to natural agents present in the body. Glutathione and cysteine are molecules found in blood plasma, and are present in both reduced and oxidized forms.131 It has recently been shown that oxidized glutathione, GSSG, can undergo a thiol-exchange reaction with poly(acrylamide-co-N-acrylcysteamine) (P-SH), a thiol-containing polymer, to cause the gelation of P-SH solutions.129 We proceeded to combine mid MW HA-PD with solutions of glutathione. HA-PD formed gels when combined with reduced gluathoine (GSH) (Table 4.3). When the oxidized form of glutathione, GSSG, was mixed with HA-PD, gels were not formed. Our previous work has already shown that an exogenously added free thiol, PEG-DS, crosslinks HA-PD into hydrogels (“HA-SS-PEG-SS-HA”). Consequently, it may be possible that an endogenous free thiol, such as GSH, can react with HA-PD, to form a different crosslinked HA-PD hydrogel (“HA-SS-HA”) as we propose in Figure 4.3.
For confirmation of gel formation, we performed mechanical testing of the explanted gels. The volume of our samples were too small (~50 uL volume) to perform rheological testing, so we performed mechanical compression testing. Under unconfined compression, both the explanted HA-PD+PEG-DS and HA-PD+PBS hydrogels showed a non-linear stress-strain response (Figure 4.4, red and blue lines, respectively). In comparison, we also subjected non-injected HA-PD to unconfined compression testing and observed zero stress until the two platens came into contact (Figure 4.4, black line); this is expected of an non-gelled solution. As can be seen, there is a clear difference between the gelled and non-gelled materials
It should be noted, however, that differences between the stress values of the HA-PD/PEG-DS and HA-PD/PBS hydrogels cannot be taken as quantitative at this point. We attempted to punch disc samples from each gel for compression testing, but the small size and irregular shapes of the explanted gels made it impossible to obtain a large enough standardized sample size that registered a measureable force on the instrument. Later studies will be designed to provide a more quantitative analysis of the magnitude of gelation differences between the two hydrogels (HA-SS-PEG-SS-HA and HA-SS-
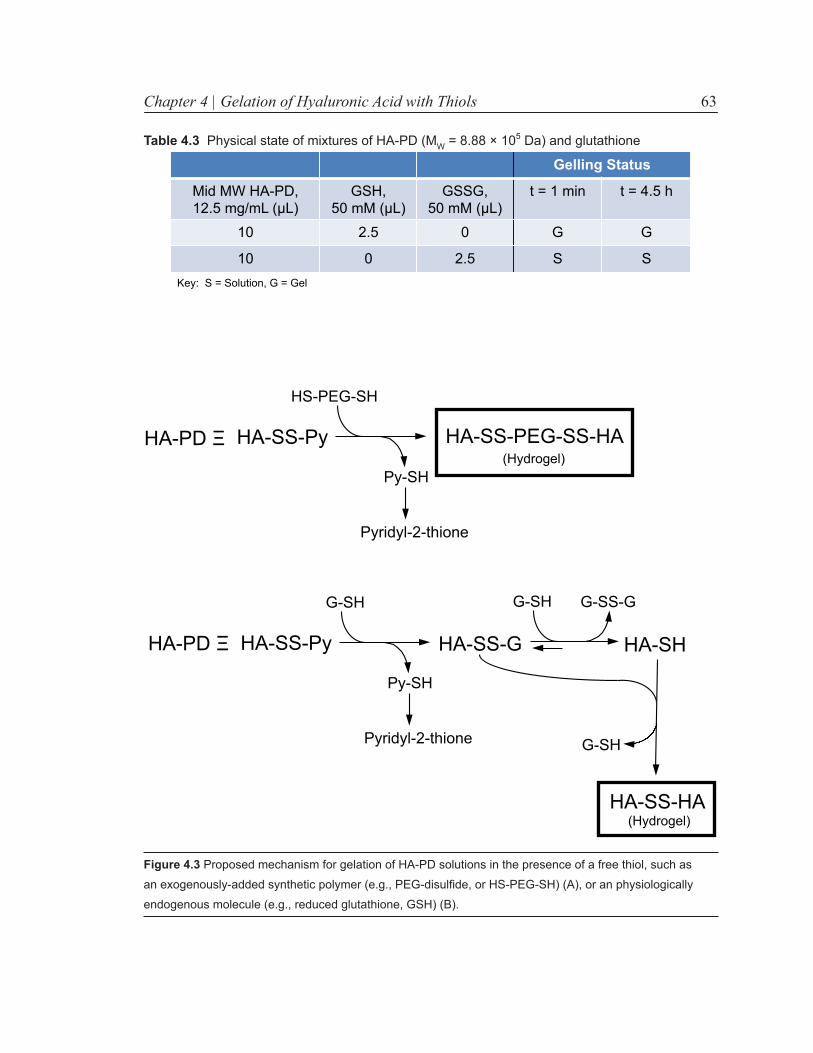
Chapter 4 | Gelation of Hyaluronic Acid with Thiols 63
HA-PD Ξ
HA-SS-Py HA-SS-G
Py-SH
Pyridyl-2-thione
HA-SH
HA-SS-HA
G-SH G-SS-G
G-SH
G-SH
HA-SS-Py HA-SS-PEG-SS-HA
Py-SH
Pyridyl-2-thione
HS-PEG-SH
HA-PD Ξ
(Hydrogel)
(Hydrogel)
Figure 3. Proposed mechanism for gela/on of HA-‐PD solu/ons in the presence of a free thiol, such as an exogenously-‐added synthe/c polymer (e.g., PEG-‐disulfide, or HS-‐PEG-‐SH) (A), or an physiologically endogenous molecule (e.g., reduced glutathione, GSH) (B).
Figure 4.3 Proposed mechanism for gelation of HA-PD solutions in the presence of a free thiol, such as
an exogenously-added synthetic polymer (e.g., PEG-disulfide, or HS-PEG-SH) (A), or an physiologically
endogenous molecule (e.g., reduced glutathione, GSH) (B).
Gelling Status
Mid MW HA-PD, 12.5 mg/mL (µL)
GSH, 50 mM (µL)
GSSG, 50 mM (µL)
t = 1 min t = 4.5 h
10 2.5 0 G G
10 0 2.5 S S
Table III. Physical state of mixtures of HA-‐PD (MW = 8.88 × 10⁵ Da) and glutathione
Key: S = Solution, G = Gel
Table 4.3 Physical state of mixtures of HA-PD (MW = 8.88 × 10⁵ Da) and glutathione

Chapter 4 | Gelation of Hyaluronic Acid with Thiols 64
HA), perhaps by using a larger animal model so that more material can be injected and explanted for testing.
Tissue slices stained with H&E are shown in Figure 4.5. None of the injected HA-PD materials (Figure 4.5A-D) showed significant cell infiltration compared to unmodified HA control (Figure 4.5E). Confirming our other observations, fragments of gel were seen for high MW HA-PD+PEG-DS, mid MW HA-PD+PEG-DS, and mid MW HA-PD+PBS (Figure 4.5A, B, and D, respectively). No gel was observed for high MW HA-PD + PBS (Figure 4.5C). Some residual unmodified HA was seen in the injection pocket (high MW in Figure 4.5E; mid MW in Figure 4.5F), but it did not show the same network structure of the gels.
In chemically crosslinked systems that rely on exogenously added crosslinkers, once the chemical reaction has been initiated, injectability decreases with time. In contrast, a crosslinking system that is triggered by the environment at the site of injection may be a more desirable mechanism of gel formation since there is no limitation of injection ability over time. Similar examples of environmentally triggered gelation can be based on temperature,132 pH,133 physiological salt concentrations,134 or local calcium concentrations in myocardial infarct tissue.135 Although more in-depth research is needed to fully
0
5000
1 104
1.5 104
2 104
2.5 104
3 104
3.5 104
4 104
0 0.2 0.4 0.6 0.8 1
HA-PD + PEG-DSHA-PD + DPBSNon-injected HA-PD
Str
ess
(Pa)
Strain
Figure 4.4 Unconfined
compression of explanted
material from mid MW HA-PD
injections. HA-PD was injected
subcutaneously into the hind
limb of mice, in combination
with PEG-DS (red) or DPBS
(blue). Materials were explanted
one day after injections.
Compression testing was also
performed on HA-PD that was
not injected in vivo (black line).
One representative curve of
each sample is shown.

Chapter 4 | Gelation of Hyaluronic Acid with Thiols 65
10x; scale bar = 200 um
High MW HA-PD (A,C) Mid MW HA-PD (B,D)+
DPB
S+
PEG
-DS
High MW HA (E) Mid MW HA (F)
A
E
DC
B+
DPB
S
* *
*
*
*
*
*
*
F
Figure 4.5 Representative tissue sections showing H&E staining of explanted tissue at Day 3 post-injection.
Materials were injected subcutaneously into the hind limbs of mice (50 μL total volume per injection). HA-
PD was combined with either PEG-DS (A, B) or DPBS (C, D). Mixtures were made with either high (A,
C) or mid (B, D) molecular weight HA-PD. High and mid MW HA (each 1% in DPBS) served as controls
(E and F, respectively). Images were taken at 10x; scale bar represents 200 μm. The asterisks (*) denote
representative areas of gel.

Chapter 4 | Gelation of Hyaluronic Acid with Thiols 66
understand its mechanism of gelation, the mid molecular weight HA-PD that we have developed may prove to be useful for injectable biomedical applications.
4.4 Conclusions
We have described here a system in which a modified form of hyaluronic acid, HA-PD, can undergo in situ crosslinking to form a hydrogel when injected into subcutaneous tissue. Gels made of HA-PD and a PEG disulfide crosslinker are biocompatible. Interestingly, the material can gel in vivo without the aid of exogenously added crosslinkers, but only if a certain molecular weight of HA-PD is used. Although the exact mechanism of crosslinking of this material needs to be confirmed, a material that crosslinks based on in vivo physiology can prove to be a valuable and clinically useful environmentally responsive biomaterial.

67
5.1 Introduction
Polyelectrolyte hydrogels are three-dimensional polymeric networks formed by amphiphilic polyelectrolyte association or pure ionic interaction.45 A notable example of the former was performed by Nowak et al.,136 in which solutions of diblock copolymers, synthesized from charged and neutral amino acids, form robust hydrogels by collapse of the hydrophobic segments. Purely ionic hydrogels can be made from synthetic triblock copolymers,137 or from natural polymers.
In many ways, physically crosslinked polyelectrolyte hydrogels are uniquely suited for biomedical applications, compared to covalently crosslinked (chemical) hydrogels. Physical gels often do not contain residual monomers or initiators, as chemical gels do.138 Physically crosslinked gels can be easier to degrade in physiological conditions,139 and have been shown to be more conductive to cell survival and proliferation than chemically crosslinked analogues,47,48 making them attractive materials for drug and cell delivery. Crosslinks of physical gels are transient and can break and re-form, enabling recovery of their original mechanical properties after shear, and are able to conform seamlessly into the space in vivo that they are injected; these properties are quite useful for minimally
Chapter 5Injectable Hybrid Hydrogels of Hyaluronic Acid Crosslinked by Well-Defined Synthetic Polycations: Preparation and Characterization In Vitro and In Vivo†
† This work is supported in part by the University of Minnesota’s Institute for Engineering in Medicine (IEM), an NSF CAREER grant, a NIH Biotechnology Training Grant (Grant Number T32 GM008347) award (to DC), and a University of Minnesota Doctoral Dissertation Fellowship (to DC). Special thanks to Dr. Robert T. Tranquillo (Department of Biomedical Engineering, University of Minnesota) for kindly providing human MSCs and Cell Tracker, and to David Giles (University of Minnesota Polymer Characterization Facility) for advice regarding rheological characterizations.

Chapter 5 | Characterization of Hyaluronic Acid-Polycation Gels 68
invasive medical procedures. It is also possible to adjust the mechanical properties of physical gels to cover the range from being rather soft to highly stiff (in excess of 103 Pa).140
Polysaccharides, in particular, have been attractive candidates as natural building blocks of physical hydrogels for biomedical applications due to their inherent charged chemical structures, as well as their biocompatibility.141 Alginate is a commonly used anionic polysaccharide that, when combined with the cationic polymer poly-L-lysine, can form ionically crosslinked gels,45 and has been studied for the immunoprotective encapsulation of pancreatic islet cells,142 as well as drug delivery.143 PLGA nanoparticles can be surface modified with either anionic alginate or cationic chitosan; these oppositely charged particles have been combined to make a cytocompatible polyelectrolyte colloidal hydrogel.144
Hydrogels based on natural extracellular (ECM) components may be the most amenable for biocompatible and efficacious biomedical therapies. Hyaluronic acid (HA) is one such molecule that is particularly attractive due to its role in tissue development, embryogenesis, and wound healing.53,54 HA is a linear, anionic polymer consisting repeating disaccharides of β-1,4-linked glucuronic acid and β-1,3-linked N-acetyl-D-glucosamine. Although many chemically crosslinked HA-based gels have been synthesized for drug and cell delivery,55,56 only a handful of physically crosslinked HA-based systems have been developed. Mixtures of HA and methyl cellulose (HAMC) form physical gels through a combination of hydrophobic association and a salting-out effect, and have been studied by the Shoichet group for drug and cell delivery applications.57-59 The HAMC gels are injectable, biocompatible, and exhibit temperature-sensitive reversible gelation. Taking advantage of the fact that HA is negatively-charged, polyelectrolyte gels have been fabricated by mixing HA with positively-charged amine-grafted polymer microspheres;60 when implanted, the authors found that HA-based polyelectrolyte hydrogel elicited lower inflammation than both controls (umodified HA and collagen). A commercially available physically crosslinked HA gel has also shown good biocompatibility but the composition of these gels is unknown.61 Wu et al.62 studied water-soluble polyelectrolyte complexes comprised of mixtures of HA and PEG-grafted chitosan. In addition to characterizing the conditions in which gels formed, they found that the complexes were not cytotoxic.

Chapter 5 | Characterization of Hyaluronic Acid-Polycation Gels 69
In this work, we cross-linked HA into physical hydrogels using cationic block copolymers with well-defined chemical structures. We synthesized the copolymers using living polymerization, and characterized the physical state of polymer and HA mixtures. Rheological characterization of the hydrogels was performed, as well as in vitro and in vivo compatibility studies. With further improvement, these hydrogels may find use in a range of biomedical applications.
5.2 Experimental Section
5.2.1 Chemicals
Hyaluronic acid (HA) sodium salt of different molecular weights (1.7×10⁴, “low”; 8.88×10⁵, “mid”; and 1.4×10⁶ Da, “high”) were obtained from Lifecore Biomedical (Chaska, MN). UltraPure distilled water was purchased from Gibco Invitrogen (Carlsbad, CA). Four-arm PEG-OH (average Mn of 20K) was purchased from Creative PEGWorks (Winston Salem, NC) and was used as received. Toluene (Sigma-Aldrich, St. Louis, MO) was dried by refluxing over sodium and distilled. The monomer (N-(tert-butoxycarbonyl)aminoethyl methacrylate) (tBAM), was synthesized as described before.145 The 4-arm PEG macro-initiator for ATRP was synthesized following literature.146 Copper (I) bromide (CuBr), copper (I) chloride (CuCl), and 2, 2-dipyridyl (bPy) were purchased from Sigma. Other chemicals and solvents were purchased from Sigma and used without further purification.
5.2.2 Polymer Synthesis
Polymers were synthesized courtesy of Weihang Ji and Dr. Xiaoze Jiang, a current graduate student and former post-doctoral associate in our laboratory, respectively. Four polymers were synthesized (detailed below): a linear homopolymer, PAEM45; a diblock copolymer, PEG113-b-PAEM14; and two 4-arm star polymers, [PEG113-b-PAEM12]4 (“4PEG12”) and [PEG113-b-PAEM37] 4 (“4PEG37”).
The ATRP of 4-arm polyethylene glycol-block-poly(2-aminoethyl methacrylate) [PEG-b-PtBAM]4 followed the procedures modified from Tang et al.147 0.8 g of 4-arm PEG macro-initiator, 534 mg of tBAM, along with 22.2 mg of CuBr and 48.6 mg of bPy were

Chapter 5 | Characterization of Hyaluronic Acid-Polycation Gels 70
added to a glass two-neck flask. And the system was degassed three cycles. A volume of 2mL of dried degassed toluene was added, and the mixture was heated at 90 °C for 6 h. The reaction was terminated by exposing the system to air. The diluted reaction solution by dichloromethane (DCM) was passed through a basic aluminum oxide column to eliminate the copper complex. The resulting product was precipitated in hexane twice and dried in vacuum at room temperature for 2 days. The Boc groups were removed by dissolving 0.5 g of [PEG-b-PtBAM]4 in 3 mL of trifluoroacetic acid (TFA) and stirred for 2 h at room temperature. TFA was then removed by evaporation, and the oil residue was rinsed three times with diethyl ether. The resultant precipitate was collected by filtration, washed twice by diethyl ether, and dried overnight in vacuum. Afterwards, the polymer was washed carefully with NaOH solution at pH 9.0,148 and instantly put into dialysis tubing (MWCO=3.5K) and dialyzed against distilled water for 3 days. The final [PEG-b-PAEM]4 polymer was obtained by lyophilization. [PEG-b-PAEM]4 polymers bearing different lengths of PAEM block were also synthesized similarly by varying the ratio of monomer to macro-initiator. Poly(2-aminoethyl methacrylate) (PAEM) homopolymer was synthesized according to the methods used by Ji et al.148 Polyethylene glycol-block-poly(2-aminoethyl methacrylate) diblock copolymer (PEG-b-PAEM) was synthesized according to the methods used by Tang et al.147
5.2.3 Assessment of physical state of HA and cation mixtures, and gel fraction determination
Each component (HA or cation) was dissolved separately into each of three solvents: water, PBS (Dulbecco’s phosphate-buffered saline, Gibco), or isotonic glucose (5% glucose in water). HA was dissolved to a concentration of 12.5 mg/mL. Polycations were dissolved to concentrations of maximum solubility (100, 200, 100, and 40 mg/mL for PAEM45, PEG113-b-PAEM14, 4PEG12, and 4PEG37, respectively).
For each cation, we studied mixtures of different “N:C” charge ratios (from 1:8 to 4:1), where N stands for nitrogen (amine, or positive charge) and C for carboxyl (negative charge). In our initial qualitative survey of gelation ability, we tested only high molecular weight HA (1.4 × 10⁶ Da), and PBS and water as solvents. Dissolved HA was added to the cation solution by pipetting with a positive placement pipettor, and mixed. Final concentration of HA in all mixtures was 1% (10 mg/mL). Final concentration of cation was tuned to the desired N:C ratio. Physical state (solution, precipitate, or gel) was

Chapter 5 | Characterization of Hyaluronic Acid-Polycation Gels 71
assessed visually, and positive gel formation was defined as resistance to flow under gravity. For the mixtures that produced gels, qualitative scores were given to each mixture to describe the degree of gel formation in terms of the amount of gel produced based on visual estimation (<25%, 25-75%, or >75% gel fraction). Based on the qualitative observations, the formulation that yielded the most extensive and stiffest gel was selected for subsequent quantitative evaluations (rheology, erosion, sol/gel fraction determination, cytotoxicity, and in vivo assessments).
5.2.4 Rheological characterization
Rheological examinations were performed on an AR-G2 rheometer (TA Instruments, New Castle, DE) outfitted with a Peltier temperature-controlled stage. Oscillatory shear measurements were obtained at 20 °C using 40 mm diameter stainless steel parallel plate geometry. Solutions of HA and cation were mixed quickly in a conical tube, pipetted onto the bottom plate, and the top tool was lowered to sandwich the sample between the plates. Water was placed into the trough of the upper tool and the sample was covered with a solvent trap to minimize evaporation from the sample.
A strain sweep (1 - 100%) was first performed at 1 rad/s to determine the linear viscoelastic region. Based on the results, frequency sweeps were performed at 10% strain to obtain storage (G’) and loss (G’’) moduli. To assess shear reversibility, gels were subjected to high amplitude oscillatory shear (1000% at 1 rad/s for 5 min), then recovery was monitored (5% strain at 1 rad/s for 45 min). G’ was then normalized to the initial storage modulus, G’0, to assess rate of gel recovery.
5.2.5 Gel stability and gel fraction determination
Both HA and 4PEG12 were dissolved into water. The HA was then mixed with 4PEG12 (N:C 1:1) to make a 12.5 μL gel. The droplet of gel was placed onto the bottom of a 60-mm plastic petri dish, covered with an excess (2.0 mL) of either water or PBS. The integrity of the gel was observed by naked eye observation immediately after addition of solvent, and up to 8 days after solvent addition. The dishes were placed into a humidified 37°C, 5% CO2 incubator between observation time points.

Chapter 5 | Characterization of Hyaluronic Acid-Polycation Gels 72
After mixing the HA and cation, the extent of gelation was determined by using a pipettor to measure the volume of solution remaining in the tube after removal of the gel. This non-gelled solution volume was then subtracted from the total volume of the original mixture to obtain a semi-quantitative value of the gel fraction.
5.2.6 In vitro cell encapsulation and cytotoxicity
Human mesenchymal stem cells (hMSCs), originally obtained from Lonza (Walkersville, MD), were kindly provided by the lab of Dr. Robert Tranquillo (Department of Biomedical Engineering, University of Minnesota). Cells were used between passages 5-10 for all experiments.
For encapsulation studies, hMSCs were trypsinized and labeled in suspension with 2.5 μM CellTracker Green CMFDA (5-chloromethyl fluorescein diacetate; Invitrogen) according to manufacturer’s directions. After labeling, 10,000 cells were combined with 10 μL of HA (12.5 mg/mL) and 4PEG12 to make a 12.5 μL volume gel of N:C 1:1 in isotonic glucose. The gel-encapsulated cells were placed into a 12-well tissue culture plate then imaged with an Olympus IX70 microscope at 10x, immediately before addition of 1 mL of media and one day after media addition. Cells were placed in a humidified, 37 °C, 5% CO2 incubator between timepoints. Non-encapsulated cells were cultured on tissue culture plates as the control.
For cytotoxicity studies, the hMSCs were plated into tissue culture treated plates at a seeding density of 10,000 cells/cm2. Serial dilutions of HA and 4PEG12 were made separately in PBS. After the cells reached >95% confluency, HA and 4PEG12 were added to the growth medium in the wells (MSCGM; purchased from Lonza); a range of total polymer concentrations were tested, with N:C ratio maintained at 1:1. Dose responses of each polymer alone were also performed. One day after adding materials to the wells, cell viability was assessed by the MTT assay in which 20 μL of MTT reagent (5 mg/mL in PBS; (3-(4,5-Dimethyl-2-thiazolyl)-2,5-diphenyl-2H-tetrazolium bromide), Sigma) was added to the 100 μL of volume in each well. After a 4 h incubation, the contents were removed and replaced with 100 μL DMSO per well. Absorbance was read at 570 nm and 690 nm (background). After background subtraction, the absorbance value of each sample was normalized to the absorbance of TCP control (cells cultured on TCP not exposed to either HA or 4PEG12). Data are shown as mean ± S.D (n=3).

Chapter 5 | Characterization of Hyaluronic Acid-Polycation Gels 73
5.2.7 In vivo assessments and histological analyses
Eight- to thirteen-week-old C57BL/6 male mice were purchased from Jackson labs (Bar Harbor, ME) and housed and used in accordance with guidelines from the University of Minnesota Institutional Animal Care and Use Committee.
HA and 4PEG12, dissolved in isotonic glucose at 1:1 N:C, were mixed in a conical tube to form a gel. The control consisted of high MW HA dissolved in isotonic glucose. Both test and control injections had a final HA concentration of 1%. Using a positive displacement pipettor, the material was then back-filled into a 1 mL syringe (25G × 5/8” needle; Tyco Healthcare Group, Mansfield, MA) by removal of the plunger and addition of the gel into the lumen of the syringe barrel. All materials were dissolved and handled under aseptic conditions.
For distribution studies, 6.0 μm diameter blue-dyed polystyrene microspheres (Polysciences, Inc., Warrington, PA) were sterilized by incubation in ethanol for 30 min then washed four times with sterile DI water. Beads (2.8 × 10⁶) were incorporated into the HA+4PEG12 gel to make a total volume of 100 μL. The bead plus gel mixture was subcutaneously injected into the backs of the mice between the scapulae. The animals were terminated one day after injections.
For tissue response assessments, 30 μL of material was injected into the subcutaneous space of each leg; animals were termed at 3 and 14 days post-injection. Tissues were removed, embedded in OCT compound, flash frozen in liquid nitrogen and sectioned (10 μm thick).
Tissue sections were stained with either H&E using standard methods, or for CD68/ED-1, which is a marker of activated macrophages.149 Slides were washed with PBS-T (0.05% Tween 20 in PBS), blocked at room temperature first with 5% bovine serum albumin (Sigma) in PBS for 30 min then with 5% goat serum (Jackson ImmunoResearch Laboratories, Inc., West Grove, PA) in PBS for 30 min. The sections were then incubated for 3 h at room temperature with rat anti-mouse CD68/ED-1 antibody (1:100 dilution; AbD Serotec, Raleigh, NC), washed with PBS-T, and then incubated with the secondary antibody (Rhodamine Red goat anti-rat IgG, 1:200 – 1:500 dilution; Jackson) for 1 h at room temperature in the dark. The slides were washed again with PBS-T, counterstained with Hoechst 33342 (Gibco Invitrogen), and then mounted with Vectashield fluorescent

Chapter 5 | Characterization of Hyaluronic Acid-Polycation Gels 74
mounting medium (Vector Laboratories, Burlingame, CA). Images were captured with an Olympus IX70 microscope at 10x. Percent of total image area of ED-1 fluorescence was determined with ImageJ using the software’s built-in analysis tools; data are shown as mean percentage ± S.D (n = 3 animals per timepoint/material; ≥3 slices per timepoint/material, 1 field per slice). Statistical analyses were performed using the two-sample equal variance Student’s t-test. A probability (p) value of <0.05 was deemed statistically significant.
5.3 Results and Discussion
5.3.1 Qualitative assessment of physical states: HA and cation mixtures
Several types of polycationic molecules were synthesized (Figure 5.1A): a linear homopolymer, PAEM45; a diblock copolymer, PEG113-b-PAEM14; and two 4-arm star polymers, [PEG113-b-PAEM12]4 (“4PEG12”) and [PEG113-b-PAEM37] 4 (“4PEG37”). Our purpose was to investigate how the different structures of positively charged polymers would interact with negatively charged HA, and hypothesized that a star structure would produce a gel while a linear structure would not (Figure 5.1B). We first performed qualitative investigations of different mixtures of HA and cationic molecules to determine which mixtures would produce a physically crosslinked gel, then we subjected the most robust gel to quantitative characterizations. Of all of the combinations tested, the water-dissolved mixture of HA and the short cationic four-arm star PEG, 4PEG12, at the N:C ratio of 1:1 was our most promising candidate because it yielded the largest gel fraction and the strongest gel. Below we describe the various parameters that were investigated to conclude that this was our best candidate from the mixtures tested.
5.3.1.1 Qualitative scoring of mixtures
For our initial investigations to screen combinations, we dissolved high molecular weight HA and each cationic molecule separately, mixed the solutions at room temperature, and assessed the mixtures. Some, but not all, mixtures of HA yielded observable gels or precipitates (Table 5.1). Due to solubility limits, not all cations could be dissolved at sufficient concentrations to prepare the full range of N:C ratios.

Chapter 5 | Characterization of Hyaluronic Acid-Polycation Gels 75
HA
- - -
+ +
+
+
+
+
- - -
- - -
- - +
+ + +
+ +
+ - - - - + +
+
+ + + +
- -
- - - - - -
-
-
-
+ +
- -
PAEM PEG
(Hydrogel)
(Precipitate)
(Precipitate) A B
Figure 5.1 Chemical structure of polymers that were synthesized (A) and a schematic illustration of hydrogel
assembly (B).
Table 1. Physical state of mixtures of HA (MW = 1.4 × 10⁶ Da) and ca(onic polymers
3
Key: = precipitate; + = <25% gel frac(on; ++ = 25-‐50% gel frac(on; +++ = >75% gel frac(on; -‐ = solu(on; n.d. = not determined.
KEY: Precipitate = "Gel, <25% volume = + Gel, 25 -50% volume = ++ Gel, >75% volume = +++ Solution = - Not determined= n.d.
"4PEG12" "4PEG37"
PAEM45 PEG113-b-PAEM14 (PEG113-b-PAEM12)4 (PEG113-b-PAEM37)4
N:C H2O PBS H2O PBS H2O PBS H2O PBS
1:8 " " - - + - + "
1:4 " " - - + - + "
1:2 " " " - ++ - + "
1:1 " " " - +++ - + "
2:1 " " " " n.d. n.d. n.d. n.d.
4:1 " " n.d. n.d. n.d. n.d. n.d. n.d.
Table 5.1 Physical state of mixtures of HA (MW = 1.4 × 10⁶ Da) and cationic polymers

Chapter 5 | Characterization of Hyaluronic Acid-Polycation Gels 76
Mixtures that formed gels did so within two to three aspirations of the mixture (~10 seconds). After the gel had formed, it became difficult to aspirate again. For combinations in which gels formed, the resulting mixture was not homogeneous, but separated into a standalone mass of gel suspended within a non-gelled solution; depending on the cationic component, different fractions of gels were produced (Table 5.1). As shown in Figure 5.2A, the gel portion ejected out of the pipet as a single coherent mass, and was microscopically heterogeneous—the bulk of the gel was transparent and colorless, but was interspersed with areas of white precipitate. In addition, the gel possessed a stickiness that made it adhere to the pipet tip and required the use of a second tip to detach it from the original mixing tip. In contrast, HA alone was quite viscous, was optically clear, and could be expelled cleanly as discrete droplets from the pipettor (Figure 5.2B). Further evidence of the different state of the materials can be revealed when the plates were slowly separated after rheological testing (Figure 5.2C and D; details of rheological characterization to be discussed below).
A B
C D
Figure 5.2 HA and 4PEG12
were dissolved separately in
distilled water, mixed together
(N:C 1:1, final HA concentration
= 1%), and ejected out
of a pipettor (A); HA only,
1% final concentration (B).
After rheological testing, the
materials showed very different
structures: HA+4PEG12 gel
(C), HA only (D).

Chapter 5 | Characterization of Hyaluronic Acid-Polycation Gels 77
5.3.1.2 Effect of solvent
The components were dissolved into aqueous solutions of comparatively low or high ionic strength (water or PBS, respectively). For all polymers, gels only formed in water (Table 5.1). The polymers were designed to be cationic in order to ionically interact with the negatively charged carboxyl groups of HA. The observation that solutions of higher ionic strength prevented gel formation support the idea of an electrostatically assembled gel. This phenomenon is substantiated by other studies in which salts interfere with PEC formation, such as HA and PEG-grafted chitosan.62
The water-dissolved mixture of HA and 4PEG12 at the N:C ratio of 1:1 yielded the largest gel fraction as qualitatively assessed by eye. After volumetric measurements were performed, we determined the gel fraction of this mixture to be 88% of the total volume. To determine the stability of this gel after formation, a small volume of gel was placed in an excess of either water or PBS. The gel quickly disintegrated (within 15 min) after the addition of PBS, but remained stable for at least 8 days when water was added. Furthermore, gels prepared in water are able to be stored at 4 °C for at least 14 days. When removed from storage, the gels and had assumed the shape of the conical tube in which they were stored, but were able to be ejected from a small diameter 25G needle. By qualitative observation, the gels had also become more optically homogeneous with time, and had a slight, but uniform, white opacity.
5.3.1.3 Effect of polymer architecture
We hypothesized that a star-shaped polymer would be more effective than a linear polymer to form a gel. The homopolymer PAEM45 precipitated when combined with HA, in both solvents and at all N:C ratios tested. The diblock copolymer PEG113-b-PAEM14 was miscible with HA at low N:C ratios, but formed precipitates at higher N:C ratios. The presence of precipitation suggested that an interaction had occurred between HA and these linear cationic molecules. At low N:C ratios, the hydrophilic PEG portion of the diblock copolymer may have prevented complex precipitation that occurred when the amounts of amine groups were increased.
In contrast, gels formed when HA was combined with four-arm PEG-b-PAEM molecules. The “star” shape of the four-arm molecules may provide steric hindrance—and therefore spacing—to foster a three-dimensional gel structure upon interaction with the long chains

Chapter 5 | Characterization of Hyaluronic Acid-Polycation Gels 78
of HA. This result is consistent with studies of poly(ethylene glycol)-poly(propylene sulfide) (PEG-PPS) multiblock copolymers, which have shown that structure influences intramolecular interactions. Di- and triblock PEG-PPS copolymers (akin to “one-arm” and “two-arm” PEG-PPS, respectively) aggregate and make micelles in water,150,151 whereas a solution of four-arm PEG-PPS star copolymer yields a physical hydrogel.130
5.3.1.4 Effect of cationic arm length
Overall, gel formation was better when HA was combined with the shorter version of the star polymer (4PEG12) than the long-arm version (4PEG37). In water, gels were formed with both 4PEG12 and 4PEG37, but the use of the shorter cationic arm resulted in larger gel fractions. There are a couple of reasons that can be offered to explain this difference in gel formation. One, a longer cationic arm may interact more with HA’s anionic carboxyl groups. The greater interaction may induce a partial collapse of the complex, so that the HA/4PEG37 gel cannot hydrate as efficiently, thus yielding smaller gels. Two, at a given N:C ratio, the stoichiometry of PEG:HA is not equal; namely, there are approximately one-third less 4PEG37 molecules than 4PEG12 molecules. If mixtures were made based on mole ratio of PEG:HA, then a comparison of gel size could be made. Unfortunately, due to the solubility limit of 4PEG37, this was not able to be tested (i.e., this would be equivalent to an N:C ratio of 3:1).
In PBS, the HA and 4PEG12 mixture remained a solution, whereas HA and 4PEG37 mixture made a precipitate. Again, it is possible that the longer cationic length of 4PEG37 interacts more with HA than 4PEG12, causing precipitation of HA/4PEG37 mixtures. However, it is surprising that we would observe any precipitates at all, since it would be assumed the salts from PBS would compete for ionic interaction, and therefore solvate each individual molecule to prevent precipitation from occurring. Ikegami et al.152 has shown that polyelectrolytes can precipitate in the presence of salts, but the salt concentration in their system was much higher than ours. Therefore, a detailed study of polycation chain-length and its effect on physical gel formation in combination with HA may therefore be an area of further investigation.
In summary, we tested the effect of solvent, polymer architecture, and polymer backbone structure, in our qualitative assessment of gel formation. We identified that the mixture of HA and 4PEG12 at an N:C ratio of 1:1 yielded the stiffest gel and the greatest gel fraction, and subsequently characterized this gel with quantitative measures.

Chapter 5 | Characterization of Hyaluronic Acid-Polycation Gels 79
5.3.2 Quantitative characterization of HA + 4PEG12 gels
5.3.2.1 Dynamic moduli measurements
Rheological measurements showed that the storage modulus (G’) of the HA+4PEG12 mixture was larger than its loss modulus (G’’) across all frequencies (Figure 5.3A, circles), which demonstrated that a gel was formed. At low frequencies, the storage and loss moduli of HA+4PEG12 exhibited frequency-independence, which further confirmed gel formation.153 A solution of 1% HA in water, which served as control, exhibited storage and loss moduli that were frequency dependent over the entire range of frequencies tested (Figure 5.3A, triangles); the crossover of G’ and G’’ are typical of a high concentration linear polymer in solution.153 Taking into account the slightly different experimental conditions (temperature and MW of HA), the moduli values shown in the literature (G’,G’’ ≈ 10 Pa for 1% HA solution, MW = 1.7 × 10⁶ Da at 5 °C and ω = 1 rad/s)154 agree well with what we obtained for HA-only solutions (G’ = 2.3 Pa, G’’ =5.3 Pa for 1% HA solution, MW = 1.4 × 10⁶ Da at 20 °C and ω = 1 rad/s).
When HA and 4PEG12 were dissolved in PBS, however, G’ and G’’ were frequency dependent (Figure 5.3B, circles). Additionally, the moduli of HA alone in PBS (Figure 5.3B, triangles), which is a liquid, looked very similar to the HA+4PEG12 mixture. This is quantitative confirmation that salts in the PBS interfered with ionic coacervation of HA and 4PEG12, and prevented gel formation.
It was envisioned that these materials would be used for in vivo delivery of biologics, such as cells. Because gels were not formed in the physiologically isotonic PBS buffer, we attempted to make the HA+4PEG12 gels in physiologically isotonic glucose (5% glucose in water) as an alternate material for entrapping cells without lysis. Again, HA+4PEG12 showed frequency independent moduli at low frequencies, while 1% HA alone in isotonic glucose was frequency dependent (Figure 5.3C). Gels were formed in isotonic glucose, which does not contain salts, whereas gels are prevented from formation when the components were dissolved in an isotonic salt solution. This data yields further evidence that HA+4PEG12 mixtures gel based on an electrostatic mechanism.
Interestingly, glucose appears to provide extra stabilization of the HA+4PEG12 gel. At low frequencies, the plateau values of G’ and G’’ are larger in the glucose solution (7.6 Pa and 3.9 Pa, respectively, Figure 5.3C) than when water is used as the solvent (3.7 Pa

Chapter 5 | Characterization of Hyaluronic Acid-Polycation Gels 80
0.01
0.1
1
10
100
0.01
0.1
1
10
100
G',
G''
(Pa)
0.01
0.1
1
10
100
0.01 0.1 1 10 100
Angular Frequency (rad/s)
A
B
C
Figure 5.3 Storage (G’, filled symbols) and
loss modulus (G’’, open symbols) of materials
dissolved into different solvents: Distilled
water (A), PBS (B), or 5% glucose in distilled
water (C). Mixtures of HA + 4PEG12 (N:C 1:1;
circles) were compared to HA alone control
(triangles). Final HA concentration of each
mixture was 1% using 1.4 × 10⁶ Da HA.

Chapter 5 | Characterization of Hyaluronic Acid-Polycation Gels 81
and 2.1 Pa, respectively, Figure 5.3A). The moduli values of HA alone are also higher in glucose solution than in water. It is has been reported that increased storage and loss moduli are of HA-only solutions can be attributed to hydrogen bonding of the glucose molecules with the polysaccharides of hyaluronan backbone.154 It is likely that glucose may also stabilize the HA+4PEG12 gel, thereby increasing the stiffness over the same gels made in water.
10-4
10-3
10-2
10-1
100
101
102
10-5
10-4
10-3
10-2
10-1
100
101
0.01 0.1 1 10 100
Angular Frequency (rad/s)
A
BG',
G''
(Pa)
Figure 5.4 Storage (G’, filled symbols)
and loss modulus (G’’, open symbols)
of different molecular weights of HA:
8.88 × 10⁵ Da HA (A), or 1.7 × 10⁴
Da HA (B). Mixtures of HA + 4PEG12
(N:C 1:1; circles) were compared to
HA alone control (triangles). Final HA
concentration of each mixture was
1%; the solvent for both components
was water.

Chapter 5 | Characterization of Hyaluronic Acid-Polycation Gels 82
For comparison, we also explored the effect of fabricating HA+4PEG12 gels at N:C of 1:1 using hyaluronan of different molecular weights. Figure 4 shows the storage and loss moduli that were obtained as a function of angular frequency of two additional lower molecular weights of HA. Both mid and low MW HA failed to make a gel when combined with 4PEG12 (circles in Figure 4A and 4B, respectively), as evidenced by the larger loss moduli than storage moduli at low angular frequencies, and the moduli crossover at higher frequencies.
5.3.2.2 Determination of shear reversible gelling behavior
We subjected the HA+4PEG12 gel to high amplitude oscillatory shear to breakdown the gel then monitored its modulus over time to determine if—and how quickly—the gel could recover its original strength. In Figure 5.5, the gel’s storage modulus (G’) is plotted as a fraction of its original modulus (G’0) over time. Within 30 sec of initiating the large amplitude shear protocol, modulus of the gel dropped to 4% of its original value; it then remained constant for the remainder of the high-amplitude test. After halting high shear and probing the properties of the gel with low-amplitude shear, the gel recovered
0
0.2
0.4
0.6
0.8
1
0 500 1000 1500 2000 2500 3000
G'/G
' 0
Time (s)
0
0.2
0.4
0.6
0.8
1
200 250 300 350 400 450 500
G'/G
' 0
Time (s)
Figure 5.5 Gels composed of high molecular weight HA (1.4 × 10⁶ Da) and 4PEG12 (N:C 1:1 in water, 1%
final HA concentration) were subjected to high-amplitude oscillatory shear (0 – 300 sec), followed by linear
recovery measurements at low-amplitude shear. The gel’s storage modulus, G’, is normalized its original gel
strength G’0 over time. The inset shows a close-up of the recovery period.

Chapter 5 | Characterization of Hyaluronic Acid-Polycation Gels 83
to 49% of its original strength within 14 sec (which was the minimum sampling time of the instrument); and more slowly returned to 90% of its original stiffness over the next 45 minutes. This result suggests that the HA + PEG gel is held together by non-covalent, transient bonds.
Shear recovery may be useful to enable convenient injection followed by in situ gelation and has been observed in other hydrogel materials.136,155-159 The gel recoveries can happen quite quickly. For example, hydrogels made of β-hairpin peptides can recover ~50% of their stiffness within 5 seconds,155 a crosslinked alginate hydrogel was able to recover ~67% of its viscosity within 6 seconds,159 and recently, the Burdick group has been reported that their peptide-based physical hydrogel system can recover its full stiffness within 6 seconds.158
5.3.3 Biological assessments
The intended application of this material is for a cell delivery vehicle, so we used a clinically relevant cell type, human mesenchymal stem cells (hMSCs), in our biological assessments.
5.3.3.1 Cell encapsulation
Physiologically isotonic glucose was used as the solvent for cell encapsulation because gels do not form in PBS. Before addition of medium, green fluorescing cells were homogeneously suspended within the gels (Figure 5.6A); the polymer network of the gels could be clearly seen using standard phase contrast microscopy (Figure 5.6B). After addition of media, the gel quickly dissolved within 15 min (observations not shown). By one day post-encapsulation, cells remained green and had spread evenly throughout well; however, most cells were round and not attached to the culture plate (Figure 5.6C). In comparison, control cells plated onto tissue culture plates were spread and adhered (Figure 5.6D). Because the gel components likely dissociate in salt-containing medium, it is possible that the cationic polymer was then allowed to interact with the cells. Cation-grafted PEG copolymers have been shown to form nanometer-thick coatings around cells; the positively charged portion electrostatically adsorbs onto a cell’s negatively charged membrane while the PEG moieties assemble at the outermost layer.38 PEG has been long studied for its anti-adhesive properties.160 Our cationic PEG block copolymer, 4PEG12,

Chapter 5 | Characterization of Hyaluronic Acid-Polycation Gels 84
may have adsorbed onto cell membrane and prevented the cells from attaching to the tissue culture plate.
5.3.3.2 Cytotoxicity
Viability assays could not be performed on cells while encapsulated in the HA/4PEG12 hydrogels because the salt-containing buffers used in these methods dissociated the gels. Instead, cells were allowed to adhere to tissue culture plates before exposure to the polymers. After adding a combined HA+4PEG12 polymer concentration of 63 μg/mL, the cells were 89.5 ± 8.1% viable (Figure 5.7). Viability decreased as concentration increased, and dropped to 37.8 ± 2.6% at a high combined polymer concentration of 2 mg/mL.
AhMSCs in HA/4PEG12 gel, 10K/well; Before media (t=”-1”) 10xbrightfieldcell tracker
B
C D
Figure 5.6 Cell Tracker Green-labeled hMSCs encapsulated into HA+4PEG12 gels in isotonic glucose
solvent, before addition of cell culture media (green fluorescence, A; brightfield, B). Cells were imaged again
at one-day post encapsulation (C). Control cells cultured for one day on tissue culture plate are shown in
(D). Images taken with 10x objective; scale bar represents 200 μm.

Chapter 5 | Characterization of Hyaluronic Acid-Polycation Gels 85
In order to determine if one component was primarily responsible for the observed decrease in viability, we also exposed hMSCs to serial dilutions of 4PEG12 alone at the equivalent concentrations that would be used in the HA+4PEG12 gel (e.g., a 2 mg/mL combined polymer mixture is composed of 1.15 mg/mL 4PEG12 and 0.85 mg/mL HA). It can be seen that the cytotoxicity dose-response profile matches closely with 4PEG12, and not HA.
The cytotoxicity of our materials compare favorably to other cationic polymers. Branched PEI, a multi-arm amine-terminated, cationic polymer, has been reported to be quite cytotoxic to a variety of different cells lines (e.g., dendritic cells147 and rat fibroblasts161), with less than 5% cells viable at a concentration of 0.1 mg/mL. Rat mesenchymal stem cells treated with 24.5 μg/mL of a polyethylene glycol-grafted polyethylenimine (PEG-PEI) polymer had less than 5% viability at 24 h.162 Human MSCs were 86% viable at 24 h after exposure to a chemical conjugate of branched polyethylenimine (bPEI) and hyaluronic acid (HA) (bPEI-HA) at a concentration of 0.5 mg/mL.163
0
20
40
60
80
100%
of T
CP
Con
trol
Polymer Concentration (mg/mL)
0.0630
0.0360
0.027
0.1250
0.0720
0.053
0.250
0.140
0.11
0.500
0.290
0.21
1.000
0.580
0.43
2.000
1.150
0.85
HA + 4PEG120
4PEG12 only0
HA only
Figure 5.7 Cytotoxicity
assessment of high MW
HA (1.4 × 10⁶ Da) and
4PEG12 mixtures at N:C
1:1 (squares), 4PEG12
only (circles), or HA only
(triangles) in hMSCs using
the MTT assay at 1 day
after addition of polymers.
Cells plated on tissue
culture polystyrene (TCP)
served as control. Data
are shown as mean ± S.D.
(n>3).

Chapter 5 | Characterization of Hyaluronic Acid-Polycation Gels 86
5.3.3.3 Microsphere retention
To assess the potential ability of the HA+4PEG12 gel to facilitate retention of biologics at the site of delivery, we injected 6.0 μm diameter polystyrene beads encapsulated within gel subcutaneously into the backs of mice. One day after injection, the beads remained in one localized area at the injection site when delivered within the HA+4PEG12 gel (Figure 5.8A), but distributed into separate “pockets” when the beads were delivered within HA alone (Figure 5.8B). As described above, the gel is expelled as a single coherent mass, which explains why entrapped beads may remain in one area. Although high molecular weight HA is an “entanglement” network due to its long polysaccharide chains, HA alone is a liquid and therefore cannot prevent the dispersion of the beads from the initial site of injection.
As the rheological data has shown, the HA+4PEG12 gel exhibits shear reversible gelling behavior and the rapid “set up” of the gel after injection may be the characteristic responsible for the retention of the microspheres. It has been suggested that leakage and washout of cells after injection presents the largest obstacle of cell transplantation trials.18,19 The combined attributes of injectability and shear reversibility gel may
A B
* *
Figure 5.8 In vivo distribution of blue polystyrene microbeads one day after subcutaneous injection into the
backs of mice (100 μL total volume). The beads were combined with either HA+4PEG12 gel (A), or HA only
(B). The asterisk (*) denotes the site of injection. Scale bar represents 0.5 cm.

Chapter 5 | Characterization of Hyaluronic Acid-Polycation Gels 87
beneficial in such minimally invasive therapies, and injectable hydrogels than can quickly recover their strength have been offered as a solution to improve “cell payload.”157
5.3.3.4 In vivo assessment
The biocompatibility of HA+4PEG12 gels was assessed at days 3 and 14 after subcutaneous hind limb injections by routine histological staining (H&E), as well as immunohistological staining for ED-1 (CD68), a marker of activated macrophages.58,149
Three days after injection, H&E staining of explanted tissue sections show much more cell infiltration to the HA+4PEG12 gel than to HA only (Figure 5.9). By day 14, the HA+4PEG12 hydrogel was largely gone, though a large number of recruited cells
10x; scale bar = 200 um
Day 3 Day 14
HA
HA
+4P
EG
12
A
DC
B
Figure 5.9 Representative tissue sections showing H&E staining of explanted tissues. Materials were
injected subcutaneously into the hind limbs of mice (30 μL per injection). HA+4PEG12 gel is shown in (A, B);
HA only in (C, D). Animals were assessed at day 3 (A, C) and day 14 (B, D) post-injection. Images taken at
10x; scale bar represents 200 μm.
A
C
B
D
HA
+ 4P
EG12
HA

Chapter 5 | Characterization of Hyaluronic Acid-Polycation Gels 88
Figure 5.10 Representative tissue sections showing positive ED-1 staining indicative of the inflammatory
response. Materials were injected subcutaneously into the hind limbs of mice (30 μL per injection).
HA+4PEG12 gel is shown in (A, B); HA only in (C, D). Animals were assessed at day 3 (A, C) and day 14 (B,
D) post-injection. Images taken at 10x; scale bar represents 200 μm. The percent of ED-1 staining of total
area for HA only (black bars) or HA+4PEG12 (grey bars) (E); data shown as mean ± S.D. (n≥3). Statistical
significance was shown by Student’s t-test where *p<0.01; n.s. denotes non-significance.
0
5
10
15
20
Day 3 Day 14
% E
D-1
Sta
inin
g
*
n.s.
E
10x; scale bar = 200 um
Day 3 Day 14H
AH
A +4
PE
G12
ED-1Hoechst
A
DC
BH
A +
4PEG
12H
A

Chapter 5 | Characterization of Hyaluronic Acid-Polycation Gels 89
remained. For the control HA injection site at day 14, few infiltrated cells were present and no material remained.
Tissue sections were also stained for ED-1 to further explore the inflammatory response to the materials (Figure 5.10). At day 3, the percent of tissue area that was positively stained for ED-1 was significantly greater for the HA+4PEG12 gel than for the HA control. By day 14, however, the percent of ED-1 staining was equal for both materials. Although H&E showed a fair number of cells remained in the area of the gel by the second timepoint, ED-1 staining shows that the inflammatory response had subsided.
We observed that the HA+4PEG12 gel was largely intact at Day 3, and a small amount was still seen at Day 14. Although in vitro observations showed that physiological salt concentrations in liquid medium can dissolve the gel very quickly (in less than 15 minutes), the erosion of the gel was much slower in vivo. It appears that the local amount of salt in the tissue were not high enough to erode the gel quickly. Depending on the kinetics of erosion in the vasculature, this may be an advantageous safety mechanism for an injectable biomaterial: If the material is accidentally injected into the bloodstream, it may quickly dissolve and not cause a life-threatening obstruction.
5.3.4 Hyaluronic-Based Physical Hydrogels for Biomedical Applications
Recently, it has been recognized that efficient retention of therapeutics will be important for successful outcomes of biomedical therapies.157 Physical hydrogels are beginning to gain ground for these applications due to their ability to shear thin and recover quickly after injection.155,157-159 However, only a few physical hydrogels have been developed that are based on HA.57-61 Incorporation of a natural component has become increasingly more important, given the environmental niches required for biomedical therapeutics like stem cells.41
The work presented here is a novel demonstration of a physically crosslinked polyelectrolyte gel that incorporates HA. We used a hybrid, semi-synthetic approach that was meant to be practical and relevant: HA, a natural ECM component was chosen to provide biological cues, while the use of a synthetic crosslinker enabled versatility. We found that two different cationic copolymer structures were able to form hydrogels with HA, and future work can be performed to expand the library of crosslinker chemistries.

Chapter 5 | Characterization of Hyaluronic Acid-Polycation Gels 90
Because mechanical properties of a material can affect cell function,164-167 it may be important that a range of material characteristics of the same base material be available for different applications. We did synthesize diblock copolymers with different moieties (2-hydroxyethyl methacrylate (HEMA) and guanidine) to alter binding affinity to HA, but attempts to make hydrogels were not able to be performed due to the copolymers’ low solubility in water; these issues will need to be further explored. Future work will also address if specific sequences, such as those found in hyaladherins,168 can alter gel strength. This being said, lower stiffness may not necessarily be a disadvantage for a cell delivery vehicle. It is now known that cells follow durotactic cues and migrate from a substrate of low elasticity to one of greater elasticity.17 Therefore, a soft hydrogel may actually be advantageous to drive cell migration towards the comparatively stiffer host tissue.
Given our material’s injectability and favorable in vitro and in vivo compatibility, the HA+4PEG12 gels would be a natural fit for drug, protein, or cell delivery vehicle. Other potential applications of our physical HA gels may include its use as a naturally eroding occlusion device, or as a tissue adhesive. Taken together, our results show that hybrid, semi-synthetic physical hydrogels thus shows promise for biomedical therapies.
5.4 Conclusions
We have developed a physical hydrogel system composed a naturally-derived ECM component, HA, combined with a chemically defined, cationic four-arm star poly(ethylene glycol) (PEG). We explored different molecular weights of HA, and also varied the chemical structure of the PEG molecule. In aqueous conditions, the negatively charged carboxyl groups on HA electrostatically interact with the positively charged amine groups on the star PEG molecule to make a robust hydrogel. The resulting material is injectable through small diameter needles and exhibits shear reversible gelling behavior. It is shelf-stable in water, yet will erode with time in physiological conditions. Lastly, this hydrogel shows low cytotoxicity with human mesenchymal stem cells, and does not cause significant inflammation in vivo. This material may show promise for use as a minimally-invasive biotherapeutic delivery vehicle.

91
In this thesis, four different approaches were explored for the use of biomaterials in cell-based therapies that may be used to address the problems of poor recruitment, attachment, retention of transplanted cells.
6.1 Biomaterial microspheres for sustained release delivery of biologics
In the first approach (Chapter 2), biodegradable PLGA polymer microspheres were used to encapsulate and release stromal-derived factor-1 alpha (SDF-1α), a stem cell chemoattractant. SDF-1α is a widely researched molecule because of its potency to induce the migration of stem cells. Previous to our work, only one other group had encapsulated this molecule within a biomaterial to prolong its release and effectiveness,13 and this was from a patch-like material. In our work, we wanted to use microspheres as our delivery vehicle. While both the patch-like material and microspheres are able to be injected with a needle in minimally-invasive surgery, the patch material must be injected before it sets up as a gel. There is no time constraint on microsphere delivery, which allows flexibility for the physician.
In short, we were able to successfully encapsulate the SDF-1α protein into microspheres and, by varying manufacturing parameters, the protein was released at different rates. Most importantly, it was shown that the SDF-1α released from the microspheres can stimulate the migration of stem cells, which shows that the encapsulation method preserves the biological activity of the protein.
Chapter 6 Conclusions and Future Directions

Chapter 6 | Conclusions and Future Directions 92
Because this was the first time SDF-1α was encapsulated into microspheres, though, there are improvements that can be made. The release profile of the protein from our microspheres occurs in two phases, but ideally, a linear zero-order release profile would be desirable. Unfortunately, this multi-phase release profile is an inherent characteristic of the erosion of PLGA.82 Further improvements for the microencapsulation of SDF-1α, then, may require an investigation of other polymers169 and/or microparticle geometries.170
That said, the achievement of zero-order release is the goal of virtually all researchers working on controlled release technologies, and is a tall challenge. Therefore, it would be interesting to test the in vivo effectiveness of the existing SDF-1α-loaded microspheres that we have developed. In the study performed by Zhang et al.,13 SDF-1α-loaded fibrin patches were placed onto infarcted mouse hearts, and the migration of c-kit+ cells into the area of infarct was monitored over time. We would propose a similar model to test the effectiveness of our microspheres.
6.2 Biomaterials for cell surface engineering
My second approach (Chapter 3) investigated modifying the surfaces of cells with biomaterials to control attachment to different substrates, either charged surfaces or extracellular matrix mimics. In this work, polyelectrolytes (poly-L-lysine and hyaluronic acid) were used in a layer-by-layer approach to individually coat cells with minimal toxicity. We carried out a systematic investigation to understand surface coating of cells beyond what other research groups have reported. 37 Instead of merely coating the cells and observing them visually, we have performed detailed and in-depth characterizations of the coated cells. The coated cells were found to attach preferentially to oppositely charged substrates. While the polyelectrolyte cell coatings appeared to have a statistically significant, effect on attachment to extracellular matrix mimic substrates, the effect was minimal and can be improved.
These results point to the obvious fact that cell adhesion is more complicated than non-specific electrostatic interactions, it is noteworthy to point out that these efforts to control cell adhesion by changing the surface of cells is a significant shift in paradigm. This work is the first to show that one can control cell adhesion by changing the surface of cells using the LbL coating technique. The bulk of research devoted to understanding

Chapter 6 | Conclusions and Future Directions 93
cell adhesion has focused on altering the non-living substrate to control cell attachment. It should be emphasized that the cells are the therapy, so the surface of the cells should be modified, not the substrate to which they attach. My work is novel in that it applies the knowledge gained from studies of cell attachment on substrates to the actual cells that will be delivered. The ability to increase cell adhesion by the modification of the cell surface may lead to improvements in the clinical outcome of patients who receive cell therapies.
Improvements to using the cell coating technology for the control of cell adhesion would likely involve adding specificity to the coatings. The work presented in this thesis laid the groundwork: We studied the feasibility of using biomaterials for cell surface engineering and control of cell adhesion. The next steps of this work should be study the efficacy of such surface-engineered cells. Namely, this will involve the identification of a specific physiological application, development of the cell coating methodology with the appropriate ligand for that application, and then a study of the adhesion of the ligand-coated cells in that context. The use of an application-applicable cell type would also be warranted (e.g., cancer cell for cancer-targeting treatments, or stem cells for cell-based therapies for MI).
6.3 Hydrogel biomaterials as cell delivery vehicles and retention depots
The last two approaches investigated different types of hydrogels that could be used for cell delivery: chemically crosslinked versus physically crosslinked.
A chemically crosslinked hydrogel system based on HA (“HA-PD”) had previously been developed in our laboratory, and extensive in vitro characterizations have been reported.115 The work presented here in this current thesis (Chapter 4) described further modifications to the previous “HA-PD” hydrogel system, and involved an in vivo investigation of these materials for their gelation performance and compatibility. All materials were found to be biocompatible. Additionally, though, we found that the different molecular weights of the HA polymer imparted different – and unexpected – gelation behavior when injected in vivo. Specifically, a mid molecular weight version of the modified HA gelled without the use of an exogenous crosslinking reagent, simply by contact with the in vivo environment.
Chapter 6 | Conclusions and Future Directions 94
Future work of the different molecular weights of the chemical HA hydrogels should involve the study of their in vivo efficacy cell retention and survival. Chemically crosslinked hydrogels have been criticized for their restriction of cell migration and proliferation;171 however, many of these studies involve synthetic polymers. Our chemical hydrogels are composed of a natural polysaccharide, HA, and mammalian bodies generate hyaluronidase, the enzyme that degrades HA. Therefore, the in vivo environment would degrade synthetic and natural hydrogels very differently. Upon injection into the in vivo environment, our chemically crosslinked HA-based hydrogels may not restrict cell movement and proliferation in the same way as synthetic covalent hydrogels do. In vivo study is definitely warranted.
Because of the potential cell constriction issues that have been raised with chemical gels, however, a new approach to fabricate physically crosslinked hydrogels was also investigated (Chapter 5). Semi-synthetic hydrogels were made of a HA as the natural component and chemically-defined 4-arm PEG molecules as the synthetic component. The hybrid nature may be advantageous: HA is able to provide biomimetic ECM cues, while the PEG can be synthesized and tailored to meet mechanical needs. We found a combination of HA and star PEG that produced an injectable, shear-reversible, biocompatible hydrogel. We investigated the retention of microbeads as a surrogate of cell retention and found that the hydrogels localized the beads at the site of injection. Next steps may investigate the use of this gel as in vivo depots of biologics such as drugs, proteins, or cells. Gel strength is also an area of improvement, and this might be accomplished by incorporating specific interactions between the HA and the star PEG polymer, such as hyaladherin binding moieties.168
While there are many in situ covalently gelling hydrogels that are so-called “injectable,” after the chemical reaction has been initiated, injectability decreases with time and cannot be reversed. In contrast, gels that are formed upon exposure to the in vivo environment (e.g., the mid molecular weight HA-PD) or can re-gel after injection because of transient, physical crosslinks (e.g., the HA + star PEG gels) are not just clinically useful, but are clinically practical. Hydrogels with these mechanisms have the capability to be pre-mixed and “at-the-ready” in a delivery device, and be injectable after an indefinite amount of time.

Chapter 6 | Conclusions and Future Directions 95
6.4 Combination approaches
Beyond next-generation improvements to each of these projects individually, it would be interesting to explore combinations of the four approaches that have been described in this dissertation. Encapsulating SDF-1α microspheres within a hydrogel may help to not only retain microspheres at the site of injection, but may also prolong the release of this bioactive protein. In addition, a microsphere plus hydrogel combination can be stronger than the hydrogel alone due to a composite effect.58 Combinations of cells coated with ligands that improve attachment to the hydrogel itself may be a strategy to retain cells at the site of injection. Future hydrogels could be made with a mixture of chemical and physical crosslinking mechanisms, such as a combination of HA-PD with the cationic 4-arm PEG; a similar approach has been tried with an all-synthetic chemically-stabilized physical hydrogel for neural stem cell delivery.130

96
1. Lindvall O, Kokaia Z, Martinez-Serrano A. Stem cell therapy for human neurodegenerative disorders-how to make it work. Nat Med. 2004;10 Suppl:S42-50.
2. Kim SU, de Vellis J. Stem cell-based cell therapy in neurological diseases: a review. J Neurosci Res. 2009;87:2183-2200.
3. Russ HA, Efrat S. Development of human insulin-producing cells for cell therapy of diabetes. Pediatric Endocrinology Reviews : PER. 2011;9:590-597.
4. Branski LK, Gauglitz GG, Herndon DN, Jeschke MG. A review of gene and stem cell therapy in cutaneous wound healing. Burns. 2009;35:171-180.
5. Siniscalco D, Sullo N, Maione S, Rossi F, D’Agostino B. Stem cell therapy: the great promise in lung disease. Ther Adv Respir Dis. 2008;2:173-177.
6. Segers VF, Lee RT. Stem-cell therapy for cardiac disease. Nature. 2008;451:937-942.
7. Dai W, Hale SL, Martin BJ et al. Allogeneic mesenchymal stem cell transplantation in postinfarcted rat myocardium: short- and long-term effects. Circulation. 2005;112:214-223.
8. Laflamme MA, Zbinden S, Epstein SE, Murry CE. Cell-Based Therapy for Myocardial Ischemia and Infarction: Pathophysiological Mechanisms. Annu Rev Pathol. 2007;2:307-339.
9. Carvalho KA, Guarita-Souza LC, Hansen P et al. Cell transplantation after the coculture of skeletal myoblasts and mesenchymal stem cells in the regeneration of the myocardium scar: an experimental study in rats. Transplant Proc. 2006;38:1596-1602.
10. Cui Y, Madeddu P. The role of chemokines, cytokines and adhesion molecules in stem cell trafficking and homing. Curr Pharm Des. 2011;17:3271-3279.
11. Bernstein HS, Srivastava D. Stem cell therapy for cardiac disease. Pediatric Research. 2012;71:491-499.
12. Samper E, Diez-Juan A, Montero JA, Sepúlveda P. Cardiac Cell Therapy: Boosting Mesenchymal Stem Cells Effects. Stem Cell Rev and Rep. 2012;DOI 10.1007/s12015-012-9353-z
13. Zhang G, Nakamura Y, Wang X, Hu Q, Suggs LJ, Zhang J. Controlled release of stromal cell-derived factor-1 alpha in situ increases c-kit+ cell homing to the infarcted heart. Tissue Eng. 2007;13:2063-2071.
References

References 97
14. Segers VF, Tokunou T, Higgins LJ, MacGillivray C, Gannon J, Lee RT. Local delivery of protease-resistant stromal cell derived factor-1 for stem cell recruitment after myocardial infarction. Circulation. 2007;116:1683-1692.
15. Laflamme MA, Chen KY, Naumova AV et al. Cardiomyocytes derived from human embryonic stem cells in pro-survival factors enhance function of infarcted rat hearts. Nat Biotechnol. 2007;25:1015-1024.
16. Dubois G, Segers VF, Bellamy V et al. Self-assembling peptide nanofibers and skeletal myoblast transplantation in infarcted myocardium. J Biomed Mater Res B Appl Biomater. 2008;87:222-228.
17. Discher DE, Mooney DJ, Zandstra PW. Growth factors, matrices, and forces combine and control stem cells. Science. 2009;324:1673-1677.
18. Teng CJ, Luo J, Chiu RC, Shum-Tim D. Massive mechanical loss of microspheres with direct intramyocardial injection in the beating heart: implications for cellular cardiomyoplasty. J Thorac Cardiovasc Surg. 2006;132:628-632.
19. Dow J, Simkhovich BZ, Kedes L, Kloner RA. Washout of transplanted cells from the heart: a potential new hurdle for cell transplantation therapy. Cardiovasc Res. 2005;67:301-307.
20. Vandervelde S, van Luyn MJ, Tio RA, Harmsen MC. Signaling factors in stem cell-mediated repair of infarcted myocardium. J Mol Cell Cardiol. 2005;39:363-376.
21. Freitas S, Merkle HP, Gander B. Microencapsulation by solvent extraction/evaporation: reviewing the state of the art of microsphere preparation process technology. J Control Release. 2005;102:313-332.
22. Kohn J, Abramson S, Langer R: Bioresorbable and Bioerodable Materials. In: Ratner BD, Hoffman AS, Schoen FJ, Lemons JE, eds. Biomaterials Science. San Diego, CA: Elsevier Academic Press; 2004:115-127.
23. Caplan MR, Shah MM. Translating Biomaterial Properties to Intracellular Signaling. Cell Biochem Biophys. 2009
24. Muro S, Dziubla T, Qiu W et al. Endothelial targeting of high-affinity multivalent polymer nanocarriers directed to intercellular adhesion molecule 1. J Pharmacol Exp Ther. 2006;317:1161-1169.
25. Cleland JL, Duenas ET, Park A et al. Development of poly-(D,L-lactide--coglycolide) microsphere formulations containing recombinant human vascular endothelial growth factor to promote local angiogenesis. J Control Release. 2001;72:13-24.
26. O’Donnell PB, McGinity JW. Preparation of microspheres by the solvent evaporation technique. Adv Drug Deliv Rev. 1997;28:25-42.
27. Yeo Y, Park K. Control of encapsulation efficiency and initial burst in polymeric microparticle systems. Arch Pharm Res. 2004;27:1-12.
28. Hanes J, Fu J, Fiegel J. Biodegradable polymer compositions, compositions and uses related thereto. US Patent No. 7163697, 2007.
29. Saltzman WM. Tissue Engineering: Principles for the Design of Replacement Organs and Tissues. Oxford: Oxford University Press, 2004.
30. Acheson A, Sunshine JL, Rutishauser U. NCAM polysialic acid can regulate both cell-cell and cell-substrate interactions. J Cell Biol. 1991;114:143-153.
31. Lysaght MJ, Rein D: Immunoisolation. In: Ratner BD, Hoffman AS, Schoen FJ, Lemons JE, eds. Biomaterials Science. San Diego, CA: Elsevier Academic Press; 2004:728-734.

References 98
32. Murua A, Portero A, Orive G, Hernandez RM, de Castro M, Pedraz JL. Cell microencapsulation technology: towards clinical application. J Control Release. 2008;132:76-83.
33. Schmidt JJ, Rowley J, Kong HJ. Hydrogels used for cell-based drug delivery. J Biomed Mater Res A. 2008;87:1113-1122.
34. Wilson JT, Chaikof EL. Challenges and emerging technologies in the immunoisolation of cells and tissues. Adv Drug Deliv Rev. 2008;60:124-145.
35. Stephan MT, Irvine DJ. Enhancing cell therapies from the outside in: Cell surface engineering using synthetic nanomaterials. Nano Today. 2011;6:309-325.
36. Decher G. Fuzzy nanoassemblies: Toward layered polymeric multicomposites. Science. 1997;277:1232.
37. Veerabadran NG, Goli PL, Stewart-Clark SS, Lvov YM, Mills DK. Nanoencapsulation of stem cells within polyelectrolyte multilayer shells. Macromol Biosci. 2007;7:877-882.
38. Wilson JT, Cui W, Chaikof EL. Layer-by-layer assembly of a conformal nanothin PEG coating for intraportal islet transplantation. Nano Lett. 2008;8:1940-1948.
39. Jewell CM, Lynn DM. Multilayered polyelectrolyte assemblies as platforms for the delivery of DNA and other nucleic acid-based therapeutics. Adv Drug Deliv Rev. 2008;60:979-999.
40. Baroli B. Hydrogels for tissue engineering and delivery of tissue-inducing substances. J Pharm Sci-us. 2007;96:2197-2223.
41. Seliktar D. Designing Cell-Compatible Hydrogels for Biomedical Applications. Science. 2012;336:1124-1128.
42. Hoffman AS. Hydrogels for biomedical applications. Adv Drug Deliv Rev. 2002;43:3-12.
43. Peppas NA: Hydrogels. In: Ratner BD, Hoffman AS, Schoen FJ, Lemons JE, eds. Biomaterials Science. San Diego, CA: Elsevier Academic Press; 2004:100-107.
44. Kopecek J, Yang JY. Review - Hydrogels as smart biomaterials. Polym Int. 2007;56:1078-1098.
45. Hennink WE, van Nostrum CF. Novel crosslinking methods to design hydrogels. Adv Drug Deliver Rev. 2002;54:13-36.
46. Zhao X, Zhang S. Molecular designer self-assembling peptides. Chem Soc Rev. 2006;35:1105-1110.
47. Liu B, Lewis AK, Shen W. Physical Hydrogels Photo-Cross-Linked from Self-Assembled Macromers for Potential Use in Tissue Engineering. Biomacromolecules. 2009;10:3182-3187.
48. Liu Y, Liu B, Riesberg JJ, Shen W. In Situ Forming Physical Hydrogels for Three-dimensional Tissue Morphogenesis. Macromol Biosci. 2011;11:1325-1330.
49. Kretlow JD, Klouda L, Mikos AG. Injectable matrices and scaffolds for drug delivery in tissue engineering. Adv Drug Deliv Rev. 2007;59:263-273.
50. Hou Q, Bank PAD, Shakesheff KM. Injectable scaffolds for tissue regeneration. Journal of Materials Chemistry. 2004;14:1915-1923.
51. Hunt NC, Grover LM. Cell encapsulation using biopolymer gels for regenerative medicine. Biotechnol Lett. 2010;32:733-742.
52. Hasnain MS, Nayak AK, Ahmad F, Singh RK. Emerging Trends of Natural-Based Polymeric Systems for Drug Delivery in Tissue Engineering Applications. Sci J UBU. 2010;1:1-13.
53. Toole BP. Hyaluronan: from extracellular glue to pericellular cue. Nat Rev Cancer. 2004;4:528-539.

References 99
54. Gaffney J, Matou-Nasri S, Grau-Olivares M, Slevin M. Therapeutic applications of hyaluronan. Mol BioSyst. 2010;6:437-443.
55. Prestwich GD, Kuo JW. Chemically-modified HA for therapy and regenerative medicine. Curr Pharm Biotechnol. 2008;9:242-245.
56. Schanté CE, Zuber G, Herlin C, Vandamme TF. Chemical modifications of hyaluronic acid for the synthesis of derivatives for a broad range of biomedical applications. Carbohydrate Polymers. 2011;85:469-489.
57. Baumann MD, Kang CE, Stanwick JC et al. An injectable drug delivery platform for sustained combination therapy. J Control Release. 2009;138:205-213.
58. Baumann MD, Kang CE, Tator CH, Shoichet MS. Intrathecal delivery of a polymeric nanocomposite hydrogel after spinal cord injury. Biomaterials. 2010;31:7631-7639.
59. Hsieh A, Zahir T, Lapitsky Y, Amsden B, Wan WK, Shoichet MS. Hydrogel/electrospun fiber composites influence neural stem/progenitor cell fate. Soft Matter. 2010;6:2227-2237.
60. Arimura H, Ouchi T, Kishida A, Ohya Y. Preparation of a hyaluronic acid hydrogel through polyion complex formation using cationic polylactide-based microspheres as a biodegradable cross-linking agent. J Biomater Sci Polym Ed. 2005;16:1347-1358.
61. Rhodes NP. Inflammatory signals in the development of tissue-engineered soft tissue. Biomaterials. 2007;28:5131-5136.
62. Wu J, Wang XF, Keum JK et al. Water soluble complexes of chitosan-g-MPEG and hyaluronic acid. J Biomed Mater Res A. 2007;80A:800-812.
63. Lindvall O, Kokaia Z. Stem cells for the treatment of neurological disorders. Nature. 2006;441:1094-1096.
64. Chavakis E, Urbich C, Dimmeler S. Homing and engraftment of progenitor cells: a prerequisite for cell therapy. J Mol Cell Cardiol. 2008;45:514-522.
65. Ghadge SK, Muhlstedt S, Ozcelik C, Bader M. SDF-1alpha as a therapeutic stem cell homing factor in myocardial infarction. Pharmacol Ther. 2011;129:97-108.
66. Imitola J, Raddassi K, Park KI et al. Directed migration of neural stem cells to sites of CNS injury by the stromal cell-derived factor 1alpha/CXC chemokine receptor 4 pathway. Proc Natl Acad Sci U S A. 2004;101:18117-18122.
67. Wang F, Yasuhara T, Shingo T et al. Intravenous administration of mesenchymal stem cells exerts therapeutic effects on parkinsonian model of rats: focusing on neuroprotective effects of stromal cell-derived factor-1alpha. BMC Neurosci. 2010;11:52.
68. Askari AT, Unzek S, Popovic ZB et al. Effect of stromal-cell-derived factor 1 on stem-cell homing and tissue regeneration in ischaemic cardiomyopathy. Lancet. 2003;362:697-703.
69. Wei YJ, Tang Y, Li J et al. Cloning and expression pattern of dog SDF-1 and the implications of altered expression of SDF-1 in ischemic myocardium. Cytokine. 2007;40:52-59.
70. Elmadbouh I, Haider HK, Jiang S, Idris NM, Lu G, Ashraf M. Ex vivo delivered stromal cell-derived factor-1alpha promotes stem cell homing and induces angiomyogenesis in the infarcted myocardium. J Mol Cell Cardiol. 2007;42:792-803.
71. Zhang M, Mal N, Kiedrowski M et al. SDF-1 expression by mesenchymal stem cells results in trophic support of cardiac myocytes after myocardial infarction. FASEB J. 2007;21:3197-3207.

References 100
72. Zaruba MM, Theiss HD, Vallaster M et al. Synergy between CD26/DPP-IV inhibition and G-CSF improves cardiac function after acute myocardial infarction. Cell Stem Cell. 2009;4:313-323.
73. Cleland JL. Protein delivery from biodegradable microspheres. Pharm Biotechnol. 1997;10:1-43.
74. Shive MS, Anderson JM. Biodegradation and biocompatibility of PLA and PLGA microspheres. Adv Drug Deliv Rev. 1997;28:5-24.
75. Xu X, Yu H, Gao S, Ma HQ, Leong KW, Wang S. Polyphosphoester microspheres for sustained release of biologically active nerve growth factor. Biomaterials. 2002;23:3765-3772.
76. Nakamura Y, Wang X, Xu C et al. Xenotransplantation of long-term-cultured swine bone marrow-derived mesenchymal stem cells. Stem Cells. 2007;25:612-620.
77. Wilber A, Linehan JL, Tian X et al. Efficient and stable transgene expression in human embryonic stem cells using transposon-mediated gene transfer. Stem Cells. 2007;25:2919-2927.
78. Ponte AL, Marais E, Gallay N et al. The in vitro migration capacity of human bone marrow mesenchymal stem cells: comparison of chemokine and growth factor chemotactic activities. Stem Cells. 2007;25:1737-1745.
79. Hamada T, Mohle R, Hesselgesser J et al. Transendothelial migration of megakaryocytes in response to stromal cell-derived factor 1 (SDF-1) enhances platelet formation. J Exp Med. 1998;188:539-548.
80. Yamaguchi J, Kusano KF, Masuo O et al. Stromal cell-derived factor-1 effects on ex vivo expanded endothelial progenitor cell recruitment for ischemic neovascularization. Circulation. 2003;107:1322-1328.
81. Kitaori T, Ito H, Schwarz EM et al. Stromal cell-derived factor 1/CXCR4 signaling is critical for the recruitment of mesenchymal stem cells to the fracture site during skeletal repair in a mouse model. Arthritis Rheum. 2009;60:813-823.
82. Mundargi RC, Babu VR, Rangaswamy V, Patel P, Aminabhavi TM. Nano/micro technologies for delivering macromolecular therapeutics using poly(D,L-lactide-co-glycolide) and its derivatives. J Control Release. 2008;125:193-209.
83. Bilati U, Allemann E, Doelker E. Strategic approaches for overcoming peptide and protein instability within biodegradable nano- and microparticles. Eur J Pharm Biopharm. 2005;59:375-388.
84. Jaklenec A, Hinckfuss A, Bilgen B, Ciombor DM, Aaron R, Mathiowitz E. Sequential release of bioactive IGF-I and TGF-beta 1 from PLGA microsphere-based scaffolds. Biomaterials. 2008;29:1518-1525.
85. Zhu XH, Wang CH, Tong YW. In vitro characterization of hepatocyte growth factor release from PHBV/PLGA microsphere scaffold. J Biomed Mater Res A. 2009;89:411-423.
86. Böhme U, Scheler U. Effective charge of bovine serum albumin determined by electrophoresis NMR. Chemical Physics Letters. 2007;435:342-345.
87. Luo J, Luo Z, Zhou N, Hall JW, Huang Z. Attachment of C-terminus of SDF-1 enhances the biological activity of its N-terminal peptide. Biochem Biophys Res Commun. 1999;264:42-47.
88. Ando S, Putnam D, Pack DW, Langer R. PLGA microspheres containing plasmid DNA: preservation of supercoiled DNA via cryopreparation and carbohydrate stabilization. J Pharm Sci. 1999;88:126-130.
89. Crotts G, Park TG. Preparation of porous and nonporous biodegradable polymeric hollow microspheres. Journal of Controlled Release. 1995;35:91-105.

References 101
90. Chung TW, Tsai YL, Hsieh JH, Tsai WJ. Different ratios of lactide and glycolide in PLGA affect the surface property and protein delivery characteristics of the PLGA microspheres with hydrophobic additives. J Microencapsul. 2006;23:15-27.
91. Chen XQ, Yang YY, Wang L, Chung TS. Effects of inner water volume on the peculiar surface morphology of microspheres fabricated by double emulsion technique. J Microencapsul. 2001;18:637-649.
92. Abbott JD, Huang Y, Liu D, Hickey R, Krause DS, Giordano FJ. Stromal cell-derived factor-1alpha plays a critical role in stem cell recruitment to the heart after myocardial infarction but is not sufficient to induce homing in the absence of injury. Circulation. 2004;110:3300-3305.
93. Ji JF, He BP, Dheen ST, Tay SS. Interactions of chemokines and chemokine receptors mediate the migration of mesenchymal stem cells to the impaired site in the brain after hypoglossal nerve injury. Stem Cells. 2004;22:415-427.
94. Starr AE, Overall CM. Methods in Enzymology: Chemokines, Part B. San Diego: Academic Press, 2009.
95. Zhao X, Jain S, Larman HB, Gonzalez S, Irvine DJ. Directed cell migration via chemoattractants released from degradable microspheres. Biomaterials. 2005;26:5048-5063.
96. Frisch SM, Screaton RA. Anoikis mechanisms. Curr Opin Cell Biol. 2001;13:555-562.
97. Zigler M, Dobroff AS, Bar-Eli M. Cell adhesion: implication in tumor progression. Minerva Med. 2010;101:149-162.
98. Mitragotri S, Lahann J. Physical approaches to biomaterial design. Nature Mater. 2009;8:15-23.
99. Schmidt RC, Healy KE. Controlling biological interfaces on the nanometer length scale. J Biomed Mater Res A. 2009;90:1252-1261.
100. Hersel U, Dahmen C, Kessler H. RGD modified polymers: Biomaterials for stimulated cell adhesion and beyond. Biomaterials. 2003;24:4385-4415.
101. Pelham RJJ, Wang Y. Cell locomotion and focal adhesions are regulated by substrate flexibility. Proc Natl Acad Sci U S A. 1997;94:13661-13665.
102. Khan S, Newaz G. A comprehensive review of surface modification for neural cell adhesion and patterning. J Biomed Mater Res A. 2010;93:1209-1224.
103. Murtuza B, Nichol JW, Khademhosseini A. Micro- and nanoscale control of the cardiac stem cell niche for tissue fabrication. Tissue Eng Part B Rev. 2009
104. Hidalgo-Bastida LA, Cartmell SH. Mesenchymal stem cells, osteoblasts and extracellular matrix proteins: Enhancing cell adhesion and differentiation for bone tissue engineering. Tissue Eng Part B Rev. 2010;16:405-412.
105. Kellam B, De Bank PA, Shakesheff KM. Chemical modification of mammalian cell surfaces. Chem Soc Rev. 2003;32:327-337.
106. Kayser H, Zeitler R, Kannicht C, Grunow D, Nuck R, Reutter W. Biosynthesis of a nonphysiological sialic acid in different rat organs, using N-propanoyl-D-hexosamines as precursors. J Biol Chem. 1992;267:16934-16938.
107. Liu T, Guo Z, Yang Q, Sad S, Jennings HJ. Biochemical engineering of surface alpha 2-8 polysialic acid for immunotargeting tumor cells. J Biol Chem. 2000;275:32832-32836.
108. Panza JL, Wagner WR, Rilo HL, Rao RH, Beckman EJ, Russell AJ. Treatment of rat pancreatic islets with reactive PEG. Biomaterials. 2000;21:1155-1164.

References 102
109. Sarkar D, Vemula PK, Teo GS et al. Chemical engineering of mesenchymal stem cells to induce a cell rolling response. Bioconjug Chem. 2008;19:2105-2109.
110. Sarkar D, Vemula PK, Zhao W, Gupta A, Karnik R, Karp JM. Engineered mesenchymal stem cells with self-assembled vesicles for systemic cell targeting. Biomaterials. 2010;31:5266-5274.
111. Kobayashi S, Ise H, Takahashi M, Goto M, Akaike T, Ikeda U. Surface coating of bone marrow cells with N-acetylglucosamine for bone marrow implantation therapy. Biomaterials. 2009;30:574-582.
112. Decher G, Hong JD, Schmitt J. Buildup of ultrathin multilayer films by a self-assembly process: III. Consecutively alternating adsorption of anionic and cationic polyelectrolytes on charged surfaces. Thin Solid Films. 1992;210-211:831-835.
113. Richert L, Lavalle P, Vautier D et al. Cell interactions with polyelectrolyte multilayer films. Biomacromolecules. 2002;3:1170-1178.
114. Garg P, Debnath T, Chelluri LK, Neha Hebalkar. Feasibility of Polymer Based Cell Encapsulation Using Electrostatic Layer by Layer Assembly. J Biomat Tiss Eng. 2012;2:215-219.
115. Choh S-Y, Cross D, Wang C. Facile Synthesis and Characterization of Disulfide-Cross-Linked Hyaluronic Acid Hydrogels for Protein Delivery and Cell Encapsulation. Biomacromolecules. 2011
116. Menzel EJ, Farr C. Hyaluronidase and its substrate hyaluronan: biochemistry, biological activities and therapeutic uses. Cancer Lett. 1998;131:3-11.
117. Swiston AJ, Cheng C, Um SH, Irvine DJ, Cohen RE, Rubner MF. Surface functionalization of living cells with multilayer patches. Nano Lett. 2008;8:4446-4453.
118. Ambrose EJ, James AM, Lowick JHB. Differences between the electrical charge carried by normal and homologous tumour cells. Nature. 1956;177:576-577.
119. Abercrombie M, Ambrose EJ. The surface properties of cancer cells: a review. Cancer Res. 1962;22:525-548.
120. Evanko SP, Tammi MI, Tammi RH, Wight TN. Hyaluronan-dependent pericellular matrix. Adv Drug Deliv Rev. 2007;59:1351-1365.
121. Dennison SR, Whittaker M, Harris F, Phoenix DA. Anticancer alpha-helical peptides and structure/function relationships underpinning their interactions with tumour cell membranes. Curr Protein Pept Sci. 2006;7:487-499.
122. Cross NL, Overstreet JW. Glycoconjugates of the Human Sperm Surface: Distribution and Alterations That Accompany Capacitation In Vitro. Gamete Research. 1987;16:23-35.
123. Cooper GW, Bedford JM. Charge density change in the vitelline surface following fertilization of the rabbit egg. J Reprod Fertil. 1971;25:431-436.
124. Thierry B, Winnik FM, Merhi Y, Tabrizian M. Nanocoatings onto arteries via layer-by-layer deposition: Toward the in vivo repair of damaged blood vessels. J Am Chem Soc. 2003;125:7494-7495.
125. Kerdjoudj H, Boura C, Marchal L et al. Decellularized umbilical artery treated with thin polyelectrolyte multilayer films: potential use in vascular engineering. Biomed Mater Eng. 2006;16:S123-9.
126. Wilson JT, Krishnamurthy VR, Cui W, Qu Z, Chaikof EL. Noncovalent cell surface engineering with cationic graft copolymers. J Am Chem Soc. 2009;131:18228-18229.
127. Strand BL, Ryan TL, In’t Veld P et al. Poly-L-Lysine induces fibrosis on alginate microcapsules via the induction of cytokines. Cell Transplant. 2001;10:263-275.

References 103
128. Caruso F, Niikura K, Furlong DN, Okahata Y. 2. Assembly of alternating polyelectrolyte and protein multilayer films for immunosensing. Langmuir. 1997;13:3427-3433.
129. Hisano N, Iwata H, Teramura Y, Chen H, Ikada Y. Kinetic Analyses of Disulfide Formation Between Thiol Groups Attached to Linear Poly(acrylamide). J Polym Sci Pol Chem. 2011;49:671-679.
130. Zhang JJ, Tokatlian T, Zhong J et al. Physically Associated Synthetic Hydrogels with Long-Term Covalent Stabilization for Cell Culture and Stem Cell Transplantation. Adv Mater. 2011;23:5098-5103.
131. Lash LH, Jones DP. Distribution of oxidized and reduced forms of glutathione and cysteine in rat plasma. Arch Biochem Biophys. 1985;240:583-592.
132. Hou QP, Chau DYS, Pratoomsoot C et al. In situ gelling hydrogels incorporating microparticles as drug delivery carriers for regenerative medicine. J Pharm Sci-us. 2008;97:3972-3980.
133. Hartgerink JD, Beniash E, Stupp SI. Self-Assembly and Mineralization of Peptide-Amphiphile Nanofibers. Science. 2001;294:1684-1688.
134. Zhang S. Fabrication of novel biomaterials through molecular self-assembly. Nat Biotechnol. 2003;21:1171-1178.
135. Ruvinov E, Harel-Adar T, Cohen S. Bioengineering the Infarcted Heart by Applying Bio-inspired Materials. J Cardiovasc Transl. 2011;4:559-574.
136. Nowak AP, Breedveld V, Pakstis L et al. Rapidly recovering hydrogel scaffolds from self-assembling diblock copolypeptide amphiphiles. Nature. 2002;417:424-428.
137. Henderson KJ, Zhou TC, Otim KJ, Shull KR. Ionically Cross-Linked Triblock Copolymer Hydrogels with High Strength. Macromolecules. 2010;43:6193-6201.
138. Yu L, Ding JD. Injectable hydrogels as unique biomedical materials. Chem Soc Rev. 2008;37:1473-1481.
139. Andrianov AK, Payne LG, Visscher KB, Allcock HR, Langer R. Hydrolytic degradation of ionically cross-linked polyphosphazene microspheres. Journal of Applied Polymer Science. 1994;53:1573-1578.
140. Hunt JN, Feldman KE, Lynd NA et al. Tunable, High Modulus Hydrogels Driven by Ionic Coacervation. Adv Mater. 2011;23:2327-2331.
141. Yannas IV: Natural Materials. In: Ratner BD, Hoffman AS, Schoen FJ, Lemons JE, eds. Biomaterials Science. San Diego, CA: Elsevier Academic Press; 2004:728-734.
142. Goosen MFA, O’Shea GM, Gharapetian HM, Chou S, Sun AM. Optimization of microencapsulation parameters: semipermeable microcapsules as a bioartificial pancreas. Biotechnol Bioeng 27. 1985;27:146-150.
143. Gombotz WR, Wee SF. Protein release from alginate matrices. Adv Drug Deliv Rev. 1998;31:267-285.
144. Wang Q, Jamal S, Detamore MS, Berkland C. PLGA-chitosan/PLGA-alginate nanoparticle blends as biodegradable colloidal gels for seeding human umbilical cord mesenchymal stem cells. J Biomed Mater Res A. 2011;96:520-527.
145. Kuroda K, DeGrado WF. Amphiphilic polymethacrylate derivatives as antimicrobial agents. J Am Chem Soc. 2005;127:4128-4129.
146. Jankova K, Chen XY, Kops J, Batsberg W. Synthesis of amphiphilic PS-b-PEG-b-PS by atom transfer radical polymerization. Macromolecules. 1998;31:538-541.

References 104
147. Tang RP, Palumbo RN, Nagarajan L, Krogstad E, Wang C. Well-defined block copolymers for gene delivery to dendritic cells: Probing the effect of polycation chain-length. J Control Release. 2010;142:229-237.
148. Ji WH, Panus D, Palumbo RN, Tang RP, Wang C. Poly(2-aminoethyl methacrylate) with Well-Defined Chain Length for DNA Vaccine Delivery to Dendritic Cells. Biomacromolecules. 2011;12:4373-4385.
149. Kim JI, Kim DY, Kwon DY et al. An injectable biodegradable temperature-responsive gel with an adjustable persistence window. Biomaterials. 2012;33:2823-2834.
150. Cerritelli S, Fontana A, Velluto D et al. Thermodynamic and kinetic effects in the aggregation behavior of a poly(ethylene glycol-b-propylene sulfide-b-ethylene glycol) ABA triblock copolymer. Macromolecules. 2005;38:7845-7851.
151. Segura T, Hubbell JA. Synthesis and in vitro characterization of an ABC triblock copolymer for siRNA delivery. Bioconjugate Chem. 2007;18:736-745.
152. Ikegami A, Imai N. Precipitation of Polyelectrolytes by Salts. J Polym Sci. 1962;56:133–152.
153. Clark AH, Ross-Murphy SB. Structural and mechanical properties of biopolymer gels. Advances in Polymer Science. 1987;83:57-192.
154. Kobayashi Y, Okamoto A, Nishinari K. Viscoeleasticity of hyaluronic acid with different molecular weights. Biorheology. 1994;31:235-244.
155. Haines-Butterick L, Rajagopal K, Branco M et al. Controlling hydrogelation kinetics by peptide design for three-dimensional encapsulation and injectable delivery of cells. PNAS. 2007;104:7791–7796.
156. Liu KL, Zhang Z, Li J. Supramolecular hydrogels based on cyclodextrin–polymer polypseudorotaxanes: materials design and hydrogel properties. Soft Matter. 2011;7:11290-11297.
157. Yan C, Mackay ME, Czymmek K, Nagarkar RP, Schneider JP, Pochan DJ. Injectable Solid Peptide Hydrogel as a Cell Carrier: Effects of Shear Flow on Hydrogels and Cell Payload. Langmuir. 2012;28:6076-6087.
158. Lu HD, Charati MB, Kim IL, Burdick JA. Injectable shear-thinning hydrogels engineered with a self-assembling Dock-and-Lock mechanism. Biomaterials. 2012;33:2145-2153.
159. Aguado BA, Mulyasasmita W, Su J, Lampe KJ, Heilshorn SC. Improving Viability of Stem Cells During Syringe Needle Flow Through the Design of Hydrogel Cell Carriers. Tissue Engineering: Part A. 2012;18:806-815.
160. Amiji M, Park K. Prevention of proteinadsorption and plateletadhesion on surfaces by PEO/PPO/PEOtriblockcopolymers. Biomaterials. 1992;13:682-692.
161. Chew SA, Kretlow JD, Spicer PP et al. Delivery of Plasmid DNA Encoding Bone Morphogenetic Protein-2 with a Biodegradable Branched Polycationic Polymer in a Critical-Size Rat Cranial Defect Model. Tissue Eng Pt A. 2011;17:751-763.
162. Chen X-A, Zhang L-J, He Z-J et al. Plasmid-encapsulated polyethylene glycol-grafted polyethylenimine nanoparticles for gene delivery into rat mesenchymal stem cells. International Journal of Nanomedicine. 2011;6:843–853.
163. Saraf A, Hacker MC, Sitharaman B, Grande-Allen KJ, Barry MA, Mikos AG. Synthesis and Conformational Evaluation of a Novel Gene Delivery Vector for Human Mesenchymal Stem Cells. Biomacromolecules. 2008;9:818-827.

References 105
164. Lo C-M, Wang H-B, Dembo M, Wang Y-. Cell Movement Is Guided by the Rigidity of the Substrate. Biophys J. 2000;79:144-152.
165. Janmey PA, Winer JP, Murray ME, Wen Q. The Hard Life of Soft Cell. Cell Motil Cytoskeleton. 2009;66:597-605.
166. Engler AJ, Griffin MA, Sen S, Bonnemann CG, Sweeney HL, Discher DE. Myotubes differentiate optimally on substrates with tissue-like stiffness: pathological implications for soft or stiff microenvironments. J Cell Biol. 2004;166:877-887.
167. Engler AJ, Sen S, Sweeney HL, Discher DE. Matrix elasticity directs stem cell lineage specification. Cell. 2006;126:677-689.
168. Ziebell MR, Prestwich GD. Interactions of peptide mimics of hyaluronic acid with the receptor for hyaluronan mediated motility (RHAMM). Journal of Computer-Aided Molecular Design. 2004;18:597-614.
169. Benson JR, Li N-H, Landgraf W. Polymer Microcarriers Exhibiting Zero-Order Release. Drug Development and Delivery. 2003;3
170. Hsieh DS, Rhine WD, Langer R. Zero-order controlled-release polymer matrices for micro- and macromolecules. J Pharm Sci. 1983;72:17-22.
171. Lutolf MP, Lauer-Fields JL, Schmoekel HG et al. Synthetic matrix metalloproteinase-sensitive hydrogels for the conduction of tissue regeneration: Engineering cell-invasion characteristics. P Natl Acad Sci Usa. 2003;100:5413-5418.