biomarkers of response to therapy in ankylosing spondylitis - spiral
TRANSCRIPT
1
Biomarkers of response to therapy in
Ankylosing Spondylitis
Ejaz Mohammed Ishaq Pathan
A thesis submitted for the degree of Doctor of Philosophy
To
Imperial College, London
2013
Kennedy Institute of Rheumatology
Imperial College Faculty of Medicine
2
Acknowledgements
I am indebted to my supervisors Prof Peter C Taylor, Dr Sonya Abraham and
Dr Adrian Lim for their patience, guidance and support throughout my period
of research. I am also grateful to Mr Peter J Charles for his invaluable input
with interpretation of laboratory data and to Dr Andrew Keat for his expert
opinion that helped shape this work. Thank you all for being my mentors.
I would also like to thank Ms Erin Paterson and Ms Muslima Chowdhury for
teaching me laboratory skills and interpretation of laboratory data, Ms Amy
McGuinness for help with developing the MRI scanning protocol and Dr
Keshthra Satchithananda for help with scoring of MRI scans. I am also grateful
to Dr Olga Kubassova and her team at Image Analysis for helping develop the
software for quantitative MRI image analysis. I am also indebted to my
colleague, Dr Dobrina Hull, who allowed me to use data from patients recruited
to her study. Lastly, I am grateful to Dr Neil Scott, from the Medical Statistics
team at the University of Aberdeen, for his advice on statistics. This work would
not have been possible without the support of all the staff at the former Kennedy
Institute Clinical Trials Unit at Charing Cross Hospital.

3
Declaration of Originality
This thesis is primarily the result of my own work and observations except where
indicated in the text. The work was undertaken at the Clinical Trials Unit,
Kennedy Institute of Rheumatology, London. Funding for this project was
through a Clinical Research Fellowship through an unrestricted grant from
Celgene Corporation.

4
Copyright Declaration
The copyright of this thesis rests with the author and is made available under a
Creative Commons Attribution Non-Commercial No Derivatives licence.
Researchers are free to copy, distribute or transmit the thesis on the condition
that they attribute it, that they do not use it for commercial purposes and that
they do not alter, transform or build upon it. For any reuse or redistribution,
researchers must make clear to others the licence terms of this work.
5
Abstract
Ankylosing Spondylitis (AS) is a chronic inflammatory disorder of the spine which
leads to progressive spinal fusion and deformity. With improvements in MRI, this
condition is now being recognized earlier. The treatment of this condition so far is
limited to physiotherapy, NSAIDs and anti-TNF therapy. The assessment of response
to therapy is largely subjective using clinical outcome measures such as the Bath
Ankylosing Spondylitis disease activity index (BASDAI). This thesis describes the
search for an objective measure of response to therapy in AS. It does so by studying
two separate patient cohorts- one receiving anti-TNF therapy and the other receiving a
novel oral phosphodiesterase-4 inhibitor, apremilast, in a clinical trial setting. In
addition to various clinical outcome measures and laboratory biomarkers, it also
explores novel volumetric analysis of bone oedema lesions on MRI and its correlation
to clinical indices. The results of this study indicate that apremilast improves clinical
indices of response in AS and also modulates bone biomarkers. However, it may do
so differently to anti-TNF agents with plasma sclerostin and RANKL: OPG possibly
playing important roles in its mechanism of action. This study highlights the fact that
different laboratory biomarkers may be modulated differently by different drugs. The
novel volumetric analysis developed using Dynamika software showed promise with
good correlation to established methods of scoring scans such as Berlin scoring. In
particular, a novel biomarker, the product of the volume of the lesion and its intensity
correlated well with changes in BASDAI in the anti-TNF cohort. However, there are a
number of issues, notably inter-observer variability as well as time required to carry
out the analysis, that need to be resolved. This could be done by developing
automated regions of interest using this software on the basis of intensity of the
lesions, hence providing an objective measure of response to therapy in AS.
6
Table of Contents
Acknowledgements ........................................................................................................ 2
Declaration of Originality .............................................................................................. 3
Copyright Declaration .................................................................................................... 4
Abstract .......................................................................................................................... 5
Table of Contents ........................................................................................................... 6
List of tables ................................................................................................................... 8
List of figures ............................................................................................................... 10
List of Abbreviations ................................................................................................... 13
Chapter1: Introduction ................................................................................................. 16
1.1 Ankylosing Spondylitis: Clinical features and diagnosis .............................. 17
1.2 Pathogenesis of Ankylosing Spondylitis ....................................................... 18
1.3 Treatment of Ankylosing Spondylitis and the role of anti-TNF agents ......... 21
1.4 Apremilast- a novel oral anti-inflammatory agent in the treatment of AS .... 22
1.5 Biomarkers of Response to therapy in Ankylosing Spondylitis .................... 24
1.6 Aim ................................................................................................................ 50
1.7 Study Layout .................................................................................................. 50
Chapter 2: Clinical Outcome measures as biomarkers of response to therapy ............ 51
2.1 Introduction: ................................................................................................... 52
2.2 Methods: ........................................................................................................ 52
2.3 Results ............................................................................................................ 56
2.4 Discussion ...................................................................................................... 68
Chapter 3: Semi-quantitative scoring of lesions on MRI as a biomarker of response to
therapy in AS ............................................................................................................... 69
3.1 Introduction .................................................................................................... 70
3.2 Methods .......................................................................................................... 71
3.3 Results ............................................................................................................ 76
3.4 Discussion ...................................................................................................... 83
Chapter 4: Laboratory biomarkers of response to therapy in Ankylosing Spondylitis 85
4.1 Introduction .................................................................................................... 86
4.2 Methods .......................................................................................................... 86
4.3 Results ............................................................................................................ 99
4.4 Correlation between clinical, imaging and laboratory biomarkers .............. 115
4.5 Discussion .................................................................................................... 123
4.6 Limitations and future work...……………………………………………..128
Chapter 5: Volumetric analysis of lesions on MRI using Dynamika software as a
biomarker of response to therapy ............................................................................... 129
5.0 Abstract: ....................................................................................................... 130
5.1 Introduction .................................................................................................. 132
5.2 Methods ........................................................................................................ 132
5.3 Results .......................................................................................................... 137
5.4 Discussion .................................................................................................... 155
5.5 Limitations and Further studies ................................................................... 160
5.6 Conclusion: .................................................................................................. 160
Chapter 6: Volumetric analysis of MRI bone oedema lesions in the clinical trial
setting ........................................................................................................................ 161
6.1 Introduction: ................................................................................................. 162
7
6.2: Methods ...................................................................................................... 162
6.3 Results .......................................................................................................... 164
6.4 Discussion .................................................................................................... 179
6.5 Future work: ................................................................................................. 181
6.6 Conclusion: .................................................................................................. 181
Chapter 7: Concluding Discussion ............................................................................. 182
7.1 Discussion .................................................................................................... 183
7.2 Conclusions: ................................................................................................. 188
7.3 Future directions: ......................................................................................... 188
References ................................................................... Error! Bookmark not defined.
Appendices ......................................................................................................................
Appendix 1 Bath Ankylosing Spondylitis Disease Activity Index (BASDAI) 202
Appendix 2 Bath Ankylosing Spondylitis Functional Index (BASFI) 203
Appendix 3 Bath Ankylosing Spondylitis Patient Global Score (BAS-G) 205
Appendix 4 Bath Ankylosing Spondylitis Metrology Index (BASMI2) 206
Appendix 5 Bath Ankylosing Spondylitis Metrology Index Linear (BASMIlin) .....
....................................................................................................... 207
Appendix 6 FACIT-F ...................................................................................... 208
Appendix 7: Correlations between individual bone biomarkers at baseline ...... 213
Appendix 8: Correlations between percentage change in individual bone
biomarkers with treatment in the three patient groups ....................................... 215
Appendix 9: Methodology for bone biomarker ELISAs…..…………………..217
Appendix 10: Publications…………………………………………………….225
8
List of tables
Page
2.1: Baseline characteristics in patient groups 57
2.2: Change in BASDAI at various time points with treatment 58
2.3: Change in BASFI at various time points with treatment 60
2.4: Change in BASMI at various time points with treatment 61
2.5: Change in BAS-G at various time points with treatment 63
2.6: Change in FACIT-F at various time points with treatment 64
2.7: Change in BASDAI, BASFI and BASMI with anti-TNF therapy 67
3.1: Change in Total Spine scores from baseline 76
3.2: Change in Total SIJ scores from baseline 77
3.3: Change in Total MRI scores from baseline 77
3.4: Change in Berlin scores with anti-TNF therapy 78
4.1: Summary of various commercial ELISA assays used to
measure bone biomarkers 90-91
4.2: Sensitivity, Normal Ranges and Coefficient of variation for
the various bone biomarker assays 92
4.3: Bead positions of the various analytes measured using CBA 97
4.4: Percentage change from baseline in levels of CRP, ESR and
IgA levels in the two treatment arms of the START study 101
4.5: Change in bone biomarkers with anti-TNF therapy 103
4.6: Change in bone biomarkers with Apremilast 105
4.7: Change in bone biomarkers with Placebo (n=19) 105
4.8: Mean percentage change from baseline in bone biomarkers 106
4.9: Summary of trends in percentage change from baseline
in bone biomarkers in each treatment group 108
4.10: Sensitivity and normal ranges of the analytes studied in CBA 109
4.11: Change in analytes measured in anti-TNF cohort 110
4.12: Change in analytes measured in placebo group 112
4.13: Change in analytes measured in Apremilast group 113
4.14: Percentage change from baseline in analytes: Apremilast
vs. Placebo 114
4.15: Correlations between BASDAI and bone biomarkers at baseline 115

9
4.16: Percentage change from baseline: BASDAI vs. bone biomarkers 116
4.17: Correlation between MRI scores & bone biomarkers at baseline 117
4.18: Correlation between percentage changes in concentration of bone
biomarkers versus percentage change in MRI Berlin score 118
4.19: Correlation between BASDAI scores vs. Cytokines, chemokines
and growth factors at baseline 119
4.20: Percentage changes in BASDAI versus percentage change
in cytokines, chemokines and growth factors 120
4.21: Correlation between MRI Berlin Scores vs. cytokines,
chemokines and growth factors at baseline 121
4.22: Correlation between percentage changes from baseline
in MRI Berlin scores versus percentage change in cytokines,
chemokines and growth factors 122
5.1: Spearman Rank correlation of Volume in mm3 and
mean intensity at baseline and follow up compared to
BASDAI scores for the two scorers. 140
5.2: p-values for change from baseline in BASDAI, Berlin MRI scores,
volume of lesion in mm3, average mean intensity and the product
of volume and intensity for the two scorers as well as
Auto ROI scores 151
5.3 Correlation coefficients (r) and p-values between percentage
change from baseline in BASDAI versus percentage change from
baseline in MRI Berlin Scores, total volume in mm3, mean intensity
and the product of volume and intensity 152
5.4: Spearman Rank Correlation between percentage changes in volume
as well as the product of volume and mean intensity versus
percentage change from baseline in bone biomarker levels 154
6.1: Change in volume and product of volume and mean intensity
with treatment in the two treatment groups 172
6.2: Percentage change from baseline in volume as well as the
product of volume and intensity 172
6.3: Correlation of percentage change in volume as well as the
product of volume and intensity with percentage change
in bone biomarkers in the apremilast cohort 178
10
List of figures
Page
1.1: The different HLA-B27 structures and hypotheses 20
1.2: Chemical structure of apremilast 22
1.3: Mechanism of action of apremilast 23
1.4(A): MRI STIR sequence of lumbar spine showing spondylodiscitis 34
1.4(B): MRI STIR sequence of the thoracic spine showing corner
lesions 34
2.1: Change in BASDAI from baseline in the two treatment groups 59
2.2: Change in BASFI with treatment 60
2.3: Change in BASMI with treatment 62
2.4: Change in BAS-G with treatment 63
2.5: Change in FACIT-F with treatment 65
2.6: Change in ASDAS from baseline to Day 85 of treatment 66
3.1: Change in Berlin Total (Spine + SIJ) score in responders
on anti-TNF therapy 78
3.2: Change in Berlin total score in non-responders
to anti-TNF therapy 79
3.3: Correlation between baseline BASDAI and total MRI Berlin
score in the anti-TNF cohort 80
3.4: Correlation between follow up BASDAI and total MRI Berlin
Score in anti-TNF cohort 80
3.5: Percentage change in total MRI score versus percentage change
in total BASDAI score 81
3.6: Correlation between baseline BASDAI and Berlin total MRI
scores at baseline in the START study cohort 81
3.7: Correlation between BASDAI and Total MRI Berlin scores
at follow up in START study cohort 82
3.8: Correlation between percentage changes in BASDAI vs. percentage
change in MRI total Berlin score in the START cohort 82
4.1: Principle of CBA 94
4.2: The position of the analytes measured using the 2 plex sets 98

11
4.3: Change in CRP, ESR and IgA levels with anti-TNF therapy 100
4.4: Change in levels of CRP, ESR and IgA levels in the Apremilast
and Placebo groups in the START cohort 102
4.5 Change in OPG levels with anti-TNF therapy 104
4.6: Change in plasma sclerostin levels with treatment in the
START cohort 106
4.7: Change in levels of TNF Receptor I and E-Selectin in the
anti-TNF cohort 111
5.1: The figures show how ROI drawn using Auto ROI function
can be modified using free hand tool on Dynamika 136
5.2: Bland-Altman plots of area of lesions in mm2 as drawn on
individual MRI slices compared between the 2 scorers 138
5.3: Bland Altman Plots of volume of lesions in mm3 of lesions
compared between the 2 scorers 139
5.4: Bland-Altman plots of mean intensity of lesions on individual
slices (A&B) and whole lesions (C&D) for the two scorers 141
5.5: Bland-Altman plots of maximum intensity of lesions on each
slice (A&B) and of whole lesions (C&D) 143
5.6: Spearman Rank Correlation between total volumes of lesions
compared with the total MRI Berlin Score at baseline 144
5.7: Spearman Rank Correlation of total MRI Berlin score
compared with total volume of lesions in mm3 at follow up 145
5.8: Bland-Altman Plot of area in mm2 (A), volume in mm
3 (B),
maximum (C&D) and mean intensity (E&F) of lesions on
individual slices and lesions as a whole. 148
5.9: Correlation between volume of lesions and MRI Berlin scores
at baseline (A&B) and at follow up (C&D) 150
5.10: Auto ROI function as applied to a large lesion which was
homogeneously intense 157
5.11: Difficulties with Auto ROI function when the lesion
is heterogeneous in intensity 158
6.1: Inter-observer variability for total volume at baseline 165
6.2: Inter-observer variability for volume in mm3
166
6.3: Inter-observer variability at baseline for the product of
12
volume and intensity 167
6.4: Inter-observer variability for the product of volume and
intensity scores at follow- up 168
6.5: Correlation between baseline MRI Berlin scores and
Volume in mm3 as scored by scorer 1 (a) and scorer 2 (b). 169
6.6: Correlation between MRI Berlin score and Volume in mm3
at follow up as scored by scorer 1 (a) and scorer 2 (b) 170
6.7: Cumulative distribution plot of percentage change from
baseline of volume in mm3 in placebo (A) and
apremilast (B) recorded for scorer 1. 173
6.8: Cumulative distribution plots for percentage change from
baseline for volume in mm3 for whole spine and sacroiliac
joints for scorer 2 174
6.9: Cumulative distribution plots for percentage change from
baseline in the product of volume and intensity for
placebo (A) and apremilast (B) for scorer 1 175
6.10: Cumulative distribution plots for percentage change
from baseline in the product of volume and intensity for
placebo (A) and apremilast (B) as recorded for scorer 2. 176
13
List of Abbreviations
ALT Alanine transaminase
AST Aspartate transaminase
AS Ankylosing Spondylitis
ASAS Assessment of Spondyloarthropathy international society
ASspiMRI-a Ankylosing Spondylitis spinal MRI activity score
BASDAI Bath Ankylosing Spondylitis Disease Activity Index
BASFI Bath Ankylosing Spondylitis Functional Index
BASMI Bath Ankylosing Spondylitis Metrology Index
BASMI-Lin Bath Ankylosing Spondylitis Metrology Index-Linear
BAS-G Bath Ankylosing Spondylitis Global Score
BASRI Bath Ankylosing Spondylitis Radiology Index
BAP Bone alkaline Phosphatase
BMP Bone morphogenic protein
cAMP cyclic Adenosine Monophosphate
CDUS Colour Doppler ultrasound
CRP C reactive protein
CTX I Telopeptide of type I collagen
CTX II C - telopeptide fragments of type II collagen
DKK-1 Dikkopf- related protein 1
EDV End Diastolic Velocity
EDASMI Edmonton Ankylosing Spondylitis Mobility Index
ESR Erthrocyte Sedimentation Rate
ESSG European Spondyloarthropathy Study Group
ERAP Endoplasmic reticulum aminopeptidase
FACIT -F Functional Assessment of Chronic Illness Therapy
FRL Fatty Romanus Lesion
GUESS Glasgow Ultrasound enthesitis Scoring System
hsCRP Highly sensitive C reactive protein
IL Interleukin
14
IL-1R Interleukin-1 Receptor
IL-23R Interleukin -23 Receptor
KIR Killer cell immunoglobulin like receptor
MFI Multi-dimensional Fatigue Inventory
MASEI Madrid Sonographic Enthesitis Index
MMP3 Matrix metalloproteinase-3
mRNA messenger Ribonucleic Acid
mSASSS modified Stoke Ankylosing Spondylitis Spine Score
NSAID Non-steroidal anti-inflammatory drug
NIH National Institutes of Health
OCP Osteocyte Precursor Cells
OPG Osteoprotegrin
PBMC Peripheral blood mononuclear cell
PDE4 Phosphodiesterase 4
PGI Patient Generated Index
PRF Pulse Repetition Frequency
PSV Peak Systolic Velocity
QoL Quality of Life
RI Resistive Index
ROI Region of interest
SF-36 Short Form survey-36
SF-12 Short Form Survey 12
SIJ Sacroiliac Joint
SASSS Stoke Ankylosing Spondylitis Spine Score
SEI Spanish Enthesitis Index
STIR Short Tau Inversion Recovery
SAA Serum Amyloid A
SPIR Spectral Pre-saturation by inversion recovery
SENSE Sensitivity Encoding
SPARCC Spondyloarthritis Research Consortium of Canada
sRANKL Serum Receptor Activator of NF-κB Ligand
T1w T 1 weighted sequence
TCR T-cell receptor
TGFβ Transforming Growth Factor Beta

15
TNFα Tumour necrosis factor alpha
TRAP Tartrate Resistant Acid Phosphatase
TB Tuberculosis
TR Repetition Times
TI Inversion Times
UPR Unfolded protein response
Vol Volume of lesion in mm3
Vol x Int Product of volume in mm3
and intensity of lesion
Wnt Wingless family of glycoprotein
WBC White Blood Count
WF Wall filter

16
Chapter1: Introduction
17
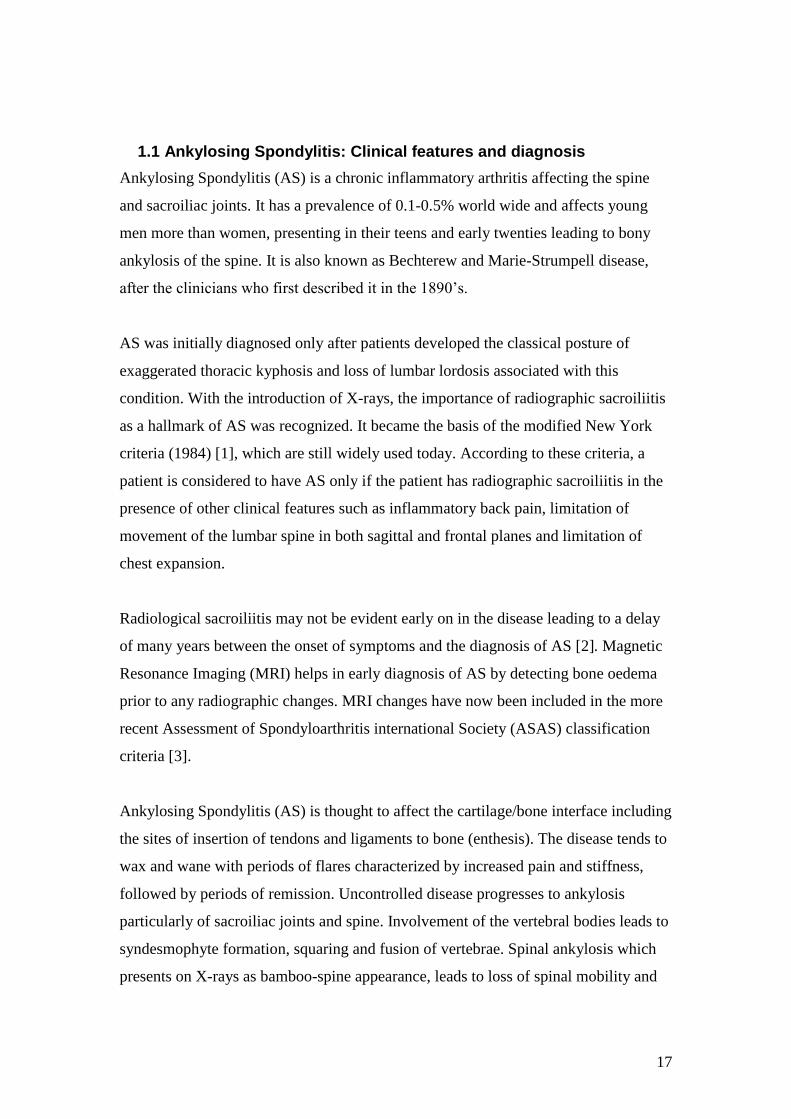
1.1 Ankylosing Spondylitis: Clinical features and diagnosis
Ankylosing Spondylitis (AS) is a chronic inflammatory arthritis affecting the spine
and sacroiliac joints. It has a prevalence of 0.1-0.5% world wide and affects young
men more than women, presenting in their teens and early twenties leading to bony
ankylosis of the spine. It is also known as Bechterew and Marie-Strumpell disease,
after the clinicians who first described it in the 1890’s.
AS was initially diagnosed only after patients developed the classical posture of
exaggerated thoracic kyphosis and loss of lumbar lordosis associated with this
condition. With the introduction of X-rays, the importance of radiographic sacroiliitis
as a hallmark of AS was recognized. It became the basis of the modified New York
criteria (1984) [1], which are still widely used today. According to these criteria, a
patient is considered to have AS only if the patient has radiographic sacroiliitis in the
presence of other clinical features such as inflammatory back pain, limitation of
movement of the lumbar spine in both sagittal and frontal planes and limitation of
chest expansion.
Radiological sacroiliitis may not be evident early on in the disease leading to a delay
of many years between the onset of symptoms and the diagnosis of AS [2]. Magnetic
Resonance Imaging (MRI) helps in early diagnosis of AS by detecting bone oedema
prior to any radiographic changes. MRI changes have now been included in the more
recent Assessment of Spondyloarthritis international Society (ASAS) classification
criteria [3].
Ankylosing Spondylitis (AS) is thought to affect the cartilage/bone interface including
the sites of insertion of tendons and ligaments to bone (enthesis). The disease tends to
wax and wane with periods of flares characterized by increased pain and stiffness,
followed by periods of remission. Uncontrolled disease progresses to ankylosis
particularly of sacroiliac joints and spine. Involvement of the vertebral bodies leads to
syndesmophyte formation, squaring and fusion of vertebrae. Spinal ankylosis which
presents on X-rays as bamboo-spine appearance, leads to loss of spinal mobility and

18
progressive thoracic kyphosis. Involvement of the costovertebral joints leads initially
to chest pain and later to restriction of chest expansion.
Peripheral arthritis and enthesitis is seen in 40-60% of AS patients. Commonly
involved sites include the Achilles insertion, plantar fascia insertion and insertion of
the patellar tendon. AS is associated with other HLA B27 related conditions. These
include Psoriasis, Crohn’s disease, Ulcerative Colitis and uveitis. Amyloidosis may be
a rare systemic complication in long standing disease.
1.2 Pathogenesis of Ankylosing Spondylitis
Genetic factors play a major role in susceptibility to AS [4]. HLA-B27, an allele of
the HLA-B locus in the class I region of human major histocompatability complex
(MHC), is thought to play a central role in disease pathogenesis. Although the exact
pathogenesis is still not clear, a number of theories exist (Fig 1).
The HLA-B27 complex has 3 components. The HLA heavy chain is associated with a
light chain (β2 microglobulin) and a short peptide called the antigenic peptide. These
antigenic peptides are generated in the cytosol but are trimmed further by amino
peptidases in the endoplasmic reticulum. One such peptidase is encoded by
endoplasmic reticulum aminopeptidase 1 (ERAP1), the gene for which has been
found to be associated with AS [5-7]. A defective ERAP1 may cause a slower rate of
folding of the HLA molecules. This may trigger an intracellular signalling response
known as the unfolded protein response (UPR) [8]. UPR in macrophages may lead to
generation of IL-23 which in turn can activate Th17 lymphocytes that produce the
pro-inflammatory cytokine, IL-17 [9]. This theory is known as the UPR hypothesis.
An older theory is the molecular mimicry hypothesis. HLA class I complexes engage
the T-cell receptors (TCRs) of CD8+ T lymphocytes. This interaction is required to
develop immunity to viruses by developing TCRs specific for viral peptides carried
on HLA molecules. Normally, tolerance to self-peptides exists. This may however, be
lost if an infectious pathogen activates the immune system through a peptide that
mimics the self-peptide.
19
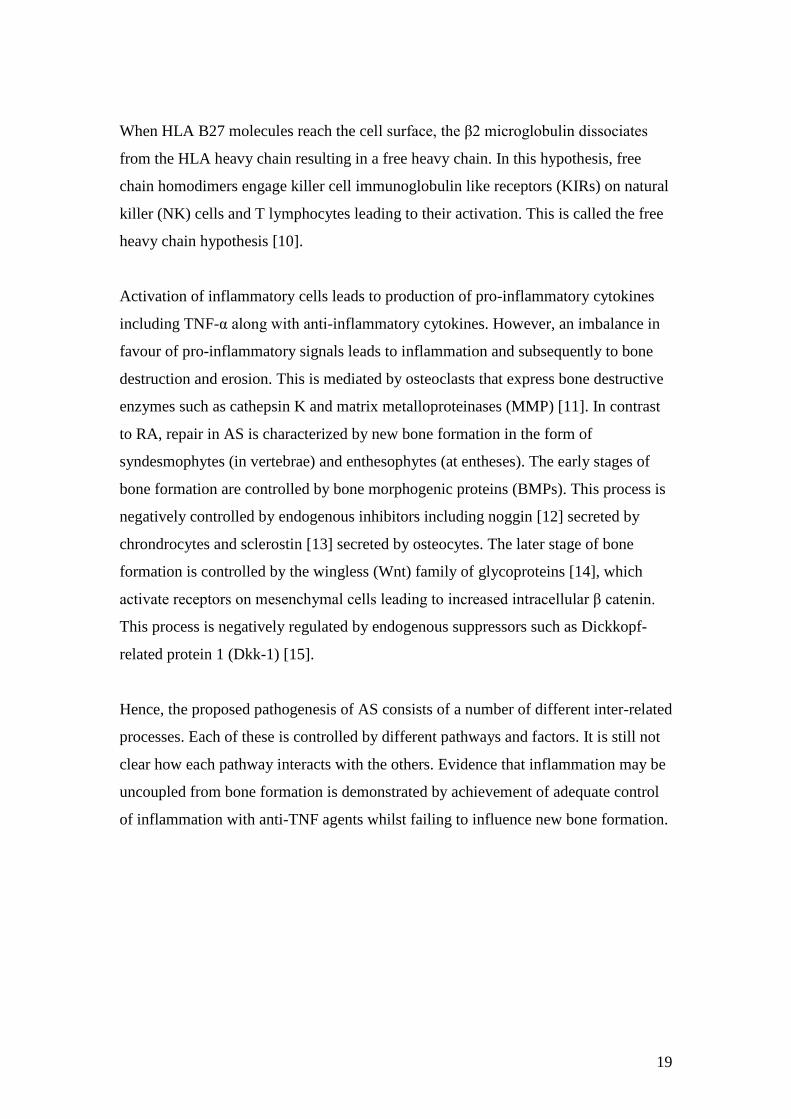
When HLA B27 molecules reach the cell surface, the β2 microglobulin dissociates
from the HLA heavy chain resulting in a free heavy chain. In this hypothesis, free
chain homodimers engage killer cell immunoglobulin like receptors (KIRs) on natural
killer (NK) cells and T lymphocytes leading to their activation. This is called the free
heavy chain hypothesis [10].
Activation of inflammatory cells leads to production of pro-inflammatory cytokines
including TNF-α along with anti-inflammatory cytokines. However, an imbalance in
favour of pro-inflammatory signals leads to inflammation and subsequently to bone
destruction and erosion. This is mediated by osteoclasts that express bone destructive
enzymes such as cathepsin K and matrix metalloproteinases (MMP) [11]. In contrast
to RA, repair in AS is characterized by new bone formation in the form of
syndesmophytes (in vertebrae) and enthesophytes (at entheses). The early stages of
bone formation are controlled by bone morphogenic proteins (BMPs). This process is
negatively controlled by endogenous inhibitors including noggin [12] secreted by
chrondrocytes and sclerostin [13] secreted by osteocytes. The later stage of bone
formation is controlled by the wingless (Wnt) family of glycoproteins [14], which
activate receptors on mesenchymal cells leading to increased intracellular β catenin.
This process is negatively regulated by endogenous suppressors such as Dickkopf-
related protein 1 (Dkk-1) [15].
Hence, the proposed pathogenesis of AS consists of a number of different inter-related
processes. Each of these is controlled by different pathways and factors. It is still not
clear how each pathway interacts with the others. Evidence that inflammation may be
uncoupled from bone formation is demonstrated by achievement of adequate control
of inflammation with anti-TNF agents whilst failing to influence new bone formation.
20
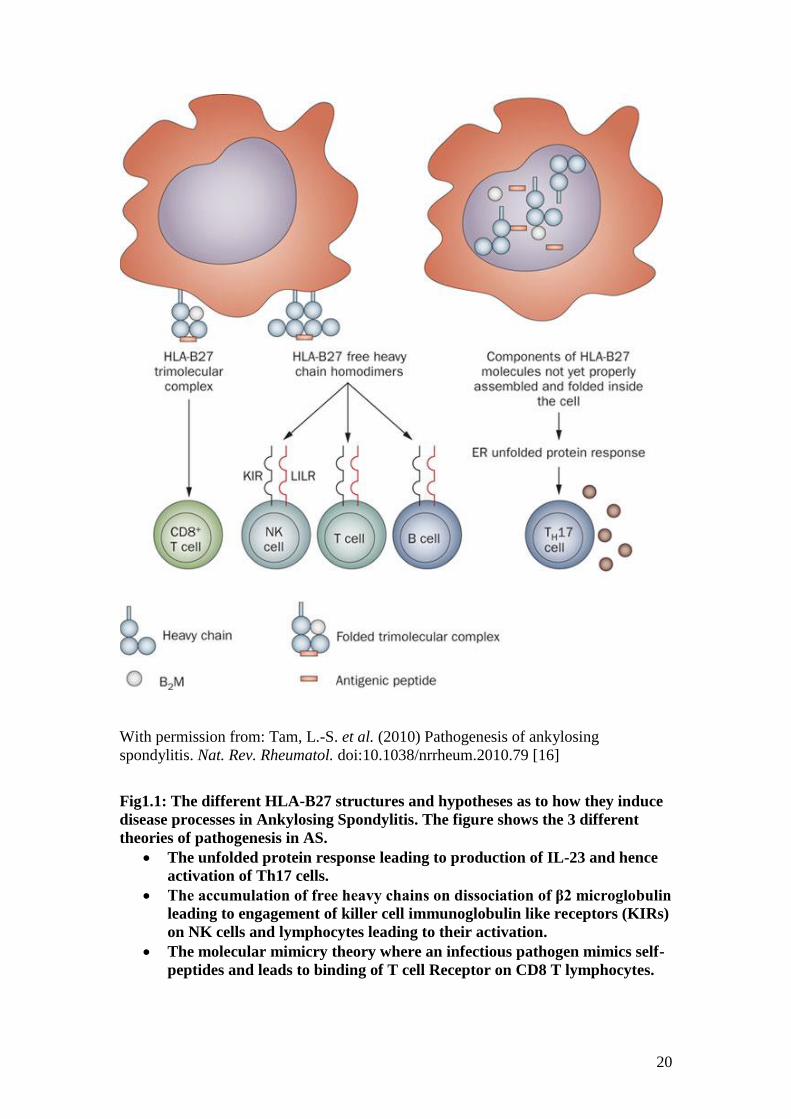
With permission from: Tam, L.-S. et al. (2010) Pathogenesis of ankylosing
spondylitis. Nat. Rev. Rheumatol. doi:10.1038/nrrheum.2010.79 [16]
Fig1.1: The different HLA-B27 structures and hypotheses as to how they induce
disease processes in Ankylosing Spondylitis. The figure shows the 3 different
theories of pathogenesis in AS.
The unfolded protein response leading to production of IL-23 and hence
activation of Th17 cells.
The accumulation of free heavy chains on dissociation of β2 microglobulin
leading to engagement of killer cell immunoglobulin like receptors (KIRs)
on NK cells and lymphocytes leading to their activation.
The molecular mimicry theory where an infectious pathogen mimics self-
peptides and leads to binding of T cell Receptor on CD8 T lymphocytes.
21
1.3 Treatment of Ankylosing Spondylitis and the role of anti-TNF agents
Treatment for AS in the early 20th
century involved the use of gold and thorium X.
Spinal irradiation was made popular by Gilbert Scott and Hernaman-Johnson in the
UK in the 1930s, but led to aplastic anaemia and leukemias in later life[17]. With the
introduction of non-steroidal anti-inflammatory drugs (NSAIDs) in the 1950s, these
drugs became the mainstay of treatment in AS along with physiotherapy. Sustained
consistent use of NSAIDs as against intermittent use has been shown to retard
radiographic progression [18]. Similarly, a recent study comparing high intake of
NSAIDs (NSAID index>50) was associated with a lower likelihood of radiographic
progression over 2 years [19]. However, it is still unclear as to whether this should be
recommended to all patients. Disease modifying anti-rheumatic drugs (DMARDs)
such as methotrexate and sulfasalazine are ineffective in spinal disease but may be
effective in patients with peripheral arthritis [20, 21].
With the advent of anti-TNF therapy, treatment in AS was revolutionized. Etanercept,
infliximab, adalimumab and more recently golimumab have been licensed for use in
patients with AS who have failed at least 2 NSAIDs and continue to have symptoms
suggestive of active disease. Clinical trials have shown that 50-70% of AS patients
treated with anti-TNF agents show a 50% improvement in disease activity scores [22-
24]. Also failure or intolerance of one agent resulting in switching to another has also
been shown to be effective [25]. However, anti-TNF therapy has so far failed to show
inhibition of radiographic ankylosis [26-28]. This has led to a search for further novel
agents that could modify outcome in AS. Neither rituximab [29], an anti-CD20
antibody nor tocilizumab [30], an anti-IL 6 receptor antibody, have shown any
significant clinical improvement. However, data from a recently conducted study
using a humanized IL-17 antibody, secukinumab [31], has shown a significant
response to treatment both clinically and on MRI.
22
1.4 Apremilast- a novel oral anti-inflammatory agent in the treatment of AS
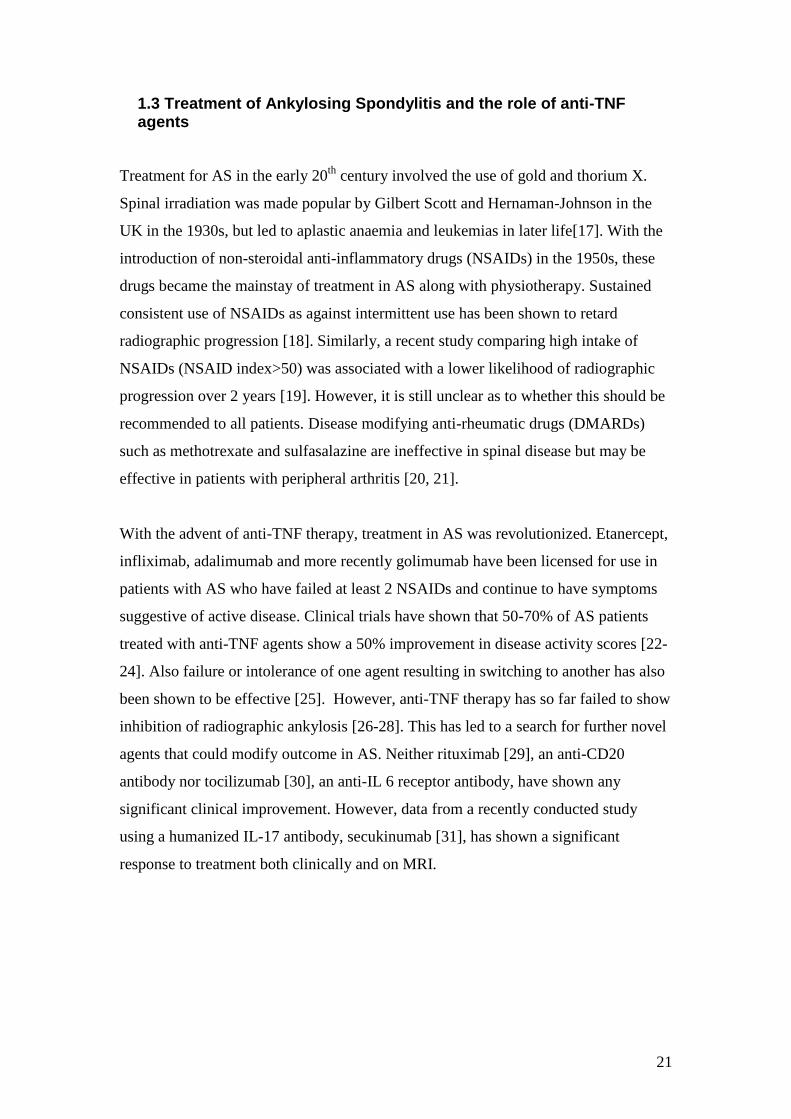
Apremilast (Fig 2) is an oral phosphpodiesterase (PDE) 4 inhibitor. PDE4 is one of
the major phosphodiesterases expressed in leukocytes, endothelial cells, smooth
muscle cells and keratinocytes. Inhibitors of PDE4 cause accumulation of
intracellular cyclic adenosine monophosphate (cAMP), which in turn activates protein
kinase A and other downstream effectors, resulting in inhibition of pro-inflammatory
cytokine transcription and other pro-inflammatory cellular responses such as
neutrophil degranulation, chemotaxis, and adhesion to endothelial cells. In addition to
inhibition of pro-inflammatory mediators via the NFκB pathway, PDE4 inhibition up
regulates anti-inflammatory mediators such as IL-10 and TGFβ through the cAMP
response element-binding (CREB) transcription factor (Fig 3) [32-34].
Fig 1.2: Chemical structure of apremilast, (S)-N-(2-[1-(3-ethoxy-4-
methoxyphenyl)-2-methanesulphonylethyl]-1, 3-dioxo-2, 3-dihydro-1H-isoindol-
4-yl) acetamide
23
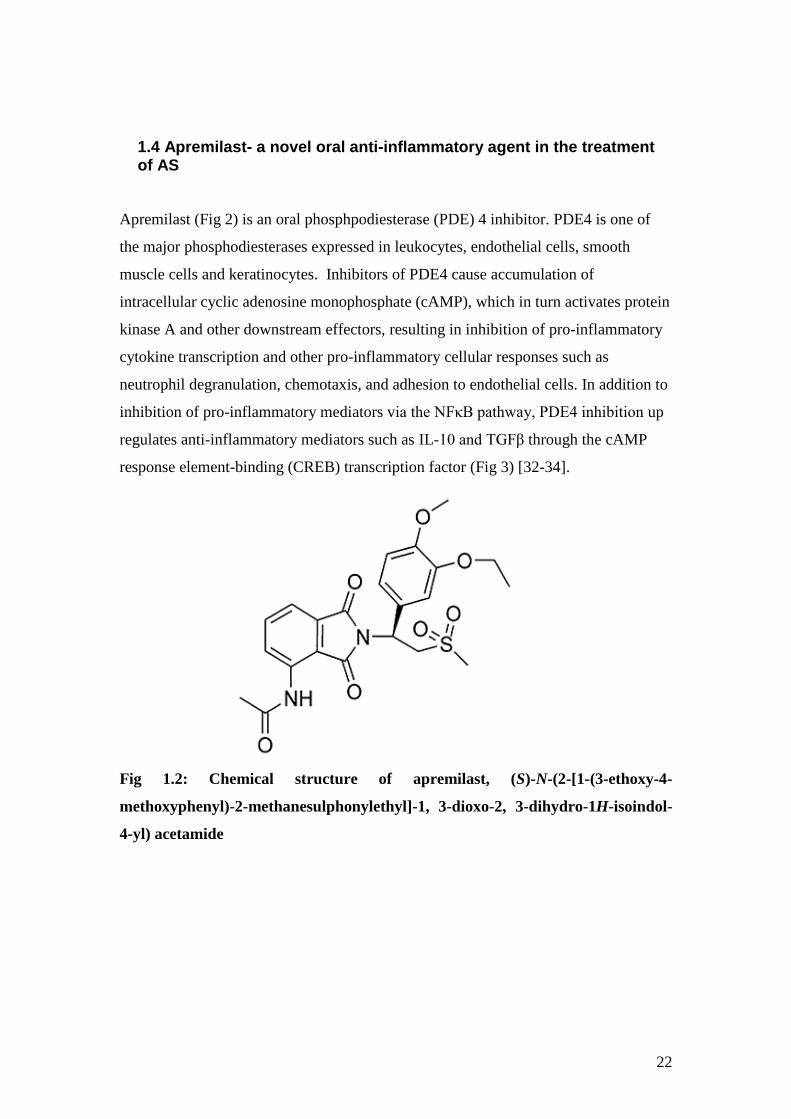
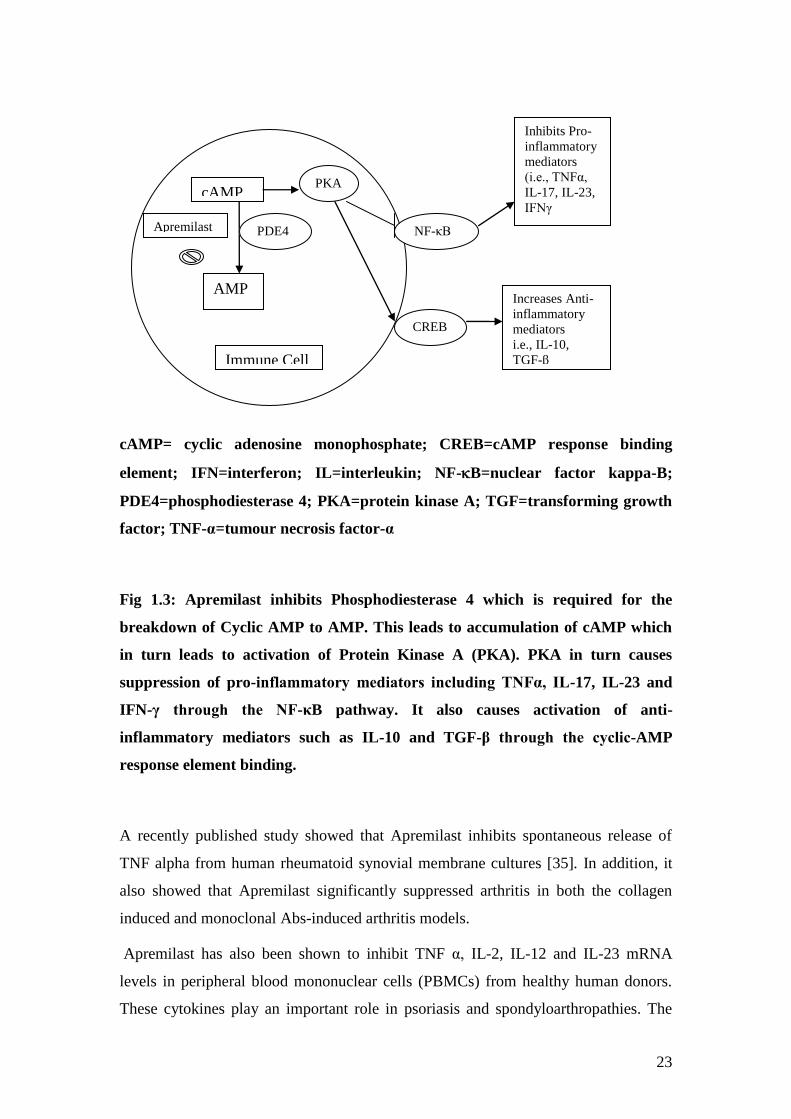
cAMP= cyclic adenosine monophosphate; CREB=cAMP response binding
element; IFN=interferon; IL=interleukin; NF-B=nuclear factor kappa-B;
PDE4=phosphodiesterase 4; PKA=protein kinase A; TGF=transforming growth
factor; TNF-α=tumour necrosis factor-α
Fig 1.3: Apremilast inhibits Phosphodiesterase 4 which is required for the
breakdown of Cyclic AMP to AMP. This leads to accumulation of cAMP which
in turn leads to activation of Protein Kinase A (PKA). PKA in turn causes
suppression of pro-inflammatory mediators including TNFα, IL-17, IL-23 and
IFN-γ through the NF-κB pathway. It also causes activation of anti-
inflammatory mediators such as IL-10 and TGF-β through the cyclic-AMP
response element binding.
A recently published study showed that Apremilast inhibits spontaneous release of
TNF alpha from human rheumatoid synovial membrane cultures [35]. In addition, it
also showed that Apremilast significantly suppressed arthritis in both the collagen
induced and monoclonal Abs-induced arthritis models.
Apremilast has also been shown to inhibit TNF α, IL-2, IL-12 and IL-23 mRNA
levels in peripheral blood mononuclear cells (PBMCs) from healthy human donors.
These cytokines play an important role in psoriasis and spondyloarthropathies. The
cAMP
AMP
PDE4 Apremilast
Immune Cell
NF-κB
CREB
PKA
Inhibits Pro-
inflammatory
mediators
(i.e., TNFα,
IL-17, IL-23,
IFNγ
Increases Anti-
inflammatory
mediators
i.e., IL-10,
TGF-β
24
same study showed a significant reduction in epidermal thickness and proliferation in
the mouse model of psoriasis [36]. Apremilast has recently been shown to be effective
in the treatment of psoriasis [37] as well as psoriatic arthritis [38] in phase II studies.
Phase III studies for these conditions are now ongoing. Prior to the work described in
this thesis, now published, there have been no clinical trials with the use of PDE4
inhibitors in AS.
1.5 Biomarkers of Response to therapy in Ankylosing Spondylitis
An National Institutes of Health study group defines a biomarker as: "a characteristic
that is objectively measured and evaluated as an indicator of normal biologic
processes, pathogenic processes, or pharmacologic responses to a therapeutic
intervention."[39].
Assessing outcome using biomarkers in AS is particularly challenging as symptoms
reflect not just the underlying inflammatory processes but also mechanical factors
such as spinal fusion. Acute phase reactants such as ESR and CRP are not reliable
markers of inflammation in AS. Also the slow nature of ankylosis in AS, makes it
difficult to assess disease modifying potential of any new therapies [40]. At present,
clinical assessment of disease activity is mainly through patient reported
questionnaires which are subjective. The only objective assessment of disease is
through measurement of spinal movements. Imaging biomarkers such as MRI play an
important role in diagnosis but are not used for routine patient monitoring. There are
still no established laboratory biomarkers of disease activity or response to treatment.
1.5.1 Clinical Outcome measures in AS
Clinical outcomes can be divided into those that assess disease activity, patient
function, mobility and health related quality of life. There are a number of different
indices described for each. Some of the commonly used ones are discussed below.
25
1.5.1.1 Disease Activity
The Bath Ankylosing Spondylitis Disease Activity Index (BASDAI) [Appendix 1]
was devised in 1994 by a multidisciplinary team in Bath with patient input [41]. The
index consists of 6 visual analogue scales that measure fatigue, spinal and peripheral
joint pain, localized tenderness and morning stiffness. A total score is obtained and
divided by 5 to obtain the final BASDAI score. A score of ≥ 4 on 2 separate occasions
3 months apart along with a spinal pain visual analogue score of >4, would merit anti-
TNF therapy as recommended by the National Institute of Clinical Excellence
(NICE). A response to treatment requires a drop in the BASDAI to at least 50% of
pretreatment value or a fall by 2 units [42]. However, a study investigating the
minimal change in BASDAI that was clinically relevant, quotes this as 10mm (=1) or
a change of BASDAI by 22.5% [43].
The BASDAI has been shown to be both valid [44] and reproducible [45]. However,
studies have shown that BASDAI scores in mechanical back pain patients are similar
to those with inflammatory pathology [46, 47], suggesting that the BASDAI also
measures mechanical symptoms and stiffness due to spinal fusion [40].
1.5.1.2 Patient Function
The Bath Ankylosing Spondylitis Functional Index (BASFI)
[Appendix 2] [48] is a questionnaire that consists of 8 questions regarding patient
function and 2 that assess the patient’s ability to cope with AS. Each question is
answered on a horizontal visual analogue scale of 0-10 cms. The results are then
totaled and divided by 10 to obtain a final score. The BASFI has been shown to co-
relate well with other functional indices such as the Dougados Functional Index (DFI)
as well as with disease activity and radiological damage [49]. Both have also been
shown to have a good test- re-test reliability [50]. Other indices to assess function
include the Health assessment questionnaire- Spondyloarthropathy (HAQ-S) [51] and
the Revised Leeds Disability Questionnaire (RLDQ) [52].
26
1.5.1.3 Bath Ankylosing Spondylitis- Global scale (BAS-G)
The BAS-G [Appendix 3] was developed in 1996 as a measure of effect of AS on the
patient’s well being [53]. This was measured on a horizontal visual analogue scale
from 0-10cms with the patient marking how he/she felt over the last week and also
over the last 6 months. This was shown to correlate best with BASDAI (r=0.73)
followed by BASFI (r=0.54). However, this has been found to be less reliably
reproducible than BASDAI or BASFI [45].
1.5.1.4 Mobility
Mobility in AS reflects a combination of disease activity as well as structural damage.
The Bath Ankylosing Spondylitis Metrology Index (BASMI)
[Appendix 4] is a combination of 5 measurements of spinal mobility that reflect axial
disease [54]. These include cervical rotation, tragus to wall distance, lateral lumbar
flexion, modified Schoeber’s and intermalleolar distance. All 5 measurements were
then scored as 0, 1 and 2 using defined cut-offs. Each score is then added to give a
total score of 0-10. However, this was found to be less sensitive to change and was
later modified to allow a score range of 0-10 for each measure [55]. A further
modification to this converts the actual measurements into a linear scale of 0-10 called
the BASMI-Linear [Appendix 5]. A comparison of all three scales showed the
BASMI-Linear demonstrated the best sensitivity to change [56].
A recent small study of 30 Danish patients assessing reproducibility of BASMI [0-10]
by comparing results between a trained physiotherapist and an untrained nurse who
underwent a one hour training session with the physiotherapist, found good intra-
observer as well as inter-observer agreement [57].
The other instrument to measure spinal mobility is the Edmonton AS mobility index
(EDASMI) [58]. This comprises of four measures- cervical rotation, chest expansion,
lateral lumbar flexion and internal rotation of the hip. This has been shown to have
similar validity and reliability to the BASMI.
27
Studies examining response of different mobility measures to physiotherapy have
shown improvements in cervical rotation, finger to floor distance, cervical forward
flexion, chest expansion and thoraco-lumbar rotation. However, only cervical rotation
and lateral lumbar flexion have consistently been shown to be different between
treatment groups in phase II placebo controlled trials with anti-TNF agents [59].
1.5.1.5 Health related Quality of Life (QoL) in AS
Studies have confirmed that fatigue is a major symptom in AS particularly in those
with more severe disease [60, 61]. This can be measured by question no.1 on the
BASDAI which pertains to fatigue. A study of 812 patients comparing the single item
fatigue question on BASDAI to the Multi-dimensional Fatigue Inventory (MFI)
showed that either could be used effectively to measure fatigue in AS. Fatigue was
associated with level of disease activity, functional ability, global well-being and
mental health status [62]. Fatigue has a negative impact on different aspects of quality
of life.
There are a number of instruments measuring quality of life including the Short Form-
36 (SF-36) Health Survey [63] or Short-Form-12 (SF-12) [64] and the Functional
Assessment of Chronic Illness Therapy (FACIT) questionnaires. There are also a
number of AS specific tools such as the AS-QoL [65], EuroQoL, Patient Generated
Index ( PGI) [66] and EASi-QoL [67].
FACIT [Appendix 6] was developed from the existing questionnaire- Functional
Assessment of Cancer Therapy- General (FACT-G) used to assess quality of life in
cancer patients [68]. The questions are divided into four quality of life domains-
physical, social, emotional and functional well being. It is self-administered either on
paper or directly on the computer and has been validated as a tool in a number of
different conditions including rheumatoid arthritis. Scores are calculated as a
summation of the four individual components. Higher scores on FACIT-F indicate an
improvement in quality of life.
28
1.5.1.6 Criteria for improvement in AS
The Assessment of Spondyloarthritis international Society (ASAS) first described
criteria for improvement in AS in 2001. These covered 4 domains-
Patient global as assessed by BAS-G
Pain as assessed by a visual analogue scale measuring spinal pain
Function as assessed by BASFI
Inflammation as assessed by the mean of BASDAI questions 5 and 6
The ASAS 20 improvement criteria [69] were defined as an improvement of ≥20%
and ≥1 unit in at least 3 domains on a scale of 10 without any worsening of ≥ 20% and
≥1 unit in the remaining domain. The ASAS partial remission criterion is based on the
same 4 domains and was defined as a value not above 2 units in each of the domains
on a scale of 10.
In 2004, ASAS described the ASAS 40 improvement criteria [70] which used the
same 4 domains but was defined as an improvement of ≥40% and ≥2 units in at least 3
domains on a scale of 10 without any worsening in the remaining domain. They also
described the ASAS 5/6 criteria which took into account 2 additional domains- CRP
and spinal mobility as measured by lateral spinal flexion. An improvement of ≥20%
was required in at least 5 domains to meet these criteria.
More recently, ASAS developed a new AS disease activity score [ASDAS] [71]
similar to the disease activity score (DAS) described for rheumatoid arthritis. Two
versions have been introduced, so that the ASDAS can be calculated using either CRP
or ESR. These are as follows:
ASDAS calculated using CRP: 0.121x back pain + 0.058x duration of morning
stiffness+ 0.110 x patient’s global assessment + 0.073x peripheral
pain/swelling+0.579x Log (CRP+1) [Preferred]
(When CRP is lower than minimum value, then half of minimum value used for
calculation purposes. Highly sensitive CRP to be used where available)
29
ASDAS calculated using ESR : 0.113 x patient global +0.293x square root of
ESR+0.086 x peripheral pain/swelling+ 0.069x duration of morning stiffness + 0.079x
total back pain [alternative]
The ASDAS demonstrates construct validity and high responsiveness when patients
are treated with anti-TNF agents. Changes in ASDAS correlated with a change in
BASDAI, CRP and MRI inflammation scores [72]. A recent study to determine
clinically relevant cut-offs for disease activity and improvement scores using ASDAS
[73], concluded that a score of <1.3 could be classified as inactive disease, 1.3-2.1 as
moderate disease activity, 2.1-3.5 as high disease activity and >3.5 as very high
disease activity. A clinically important improvement in ASDAS was found to be ≥1.1,
while an improvement of ≥2.0 on ASDAS was considered a major improvement.
These cut offs need to be validated in further studies. One important criticism of
ASDAS is the fact that it relies on acute phase reactants which are only elevated in
40% of patients with AS. It also takes into account peripheral pain or swelling which
is again seen only in a section of AS patients. Hence, the ASDAS is unlikely to
represent true response in the absence of an elevated ESR/CRP or peripheral
involvement.
1.5.2 Imaging Biomarkers in AS
In RA synovitis of joints is usually apparent on clinical examination. However, spinal
inflammation in early stages of AS is only detectable on imaging. Hence imaging
plays an important role in the diagnosis of AS and potentially in the assessment of
response to therapy. MRI is the best modality to assess acute inflammation which
presents as bone oedema or osteitis. Plain radiographs however, are more helpful in
assessing damage in the form of new bone formation (syndesmophytes and ankylosis)
in AS. The role of ultrasound (US) is largely restricted to assessment of peripheral
joints and entheses. However, there have been a few reports examining the use of US
in imaging sacroiliac and spinal blood flow. Scintigraphy and CT scans are less useful
in AS.

30
1.5.2.1 Conventional Radiography
The sacroiliac joints are usually the first to be affected in AS and hence radiographic
sacroiliitis is considered the hallmark of AS. Early studies showed that almost 60% of
patients with suspected AS but with normal radiographs went on to develop
sacroiliitis after 10 years [74]. Subsequent studies have shown that men tend to have a
more severe spinal disease than women and those with hip involvement, had a more
severe form of spinal disease [75].
A recent study of 769 patients showed that the lumbar spine was the segment
predominantly involved in the first 20 years of the disease, but that with longer
duration of disease the cervical and lumbar spine were involved with equal frequency.
Complete fusion of the spine was seen in 27.9% of patients with disease duration over
30 years and in 42.6% patients with disease duration over 40 years [76].
The modified New York Criteria describe grading of sacroiliitis from 0-4. A diagnosis
of AS requires the presence of sacroiliitis grade ≥ 2 bilaterally or grade 3-4
unilaterally. The grading is as follows:
Grade 0: normal
Grade 1: suspicious changes
Grade 2: minimal abnormality—small localised areas with erosion or sclerosis,
without alteration in the joint width.
Grade 3: unequivocal abnormality—moderate or advanced sacroiliitis with one or
more erosions, evidence of sclerosis, widening, narrowing, or partial ankylosis.
Grade 4: severe abnormality—total ankylosis
There are 3 methods of scoring spine radiographs in AS. The earliest described
method is called the Stoke Ankylosing Spondylitis Spine Score (SASSS) [77]. This
method scored the anterior and posterior site of vertebrae from the lower border of
T12 to the upper border of S1 on a score of 0-3 on lateral spinal films (Fig). The
modified SASSS (mSASSS) altered this to look at only the anterior site of the same
vertebrae and included the cervical spine from the lower border of C2 to the upper
border of T1 [78]. The Bath Ankylosing Spondylitis Radiology Index (BASRI) [75]

31
was developed later and encompasses the BASRI-spine and BASRI-hip scoring
systems using a scale of 0-4. When added together, the BASRI total score is obtained.
None of the scoring systems take into account the thoracic spine as this is difficult to
visualize on plain X rays. The BASRI is the only method that allows assessment of
the posterior elements as it requires antero-posterior in addition to lateral views.
A study comparing the three radiographic scoring systems on radiographs of 133
patients at baseline, 1 year, 2 years and 4 years, found the mSASSS to be the most
appropriate method of scoring to assess disease progression and demonstrated better
inter-observer reliability. [79]. However, the mSASSS does not include posterior
elements and the thoracic spine, where changes are commonly seen in AS. The
mSASSS failed to show any slowing of radiographic progression even after 2 years of
treatment with infliximab [26], adalimumab [28] or etanercept [27]. Another study
that compared X-rays at baseline to 4 years post- infliximab therapy showed that
patients that did not show damage on mSASS score at baseline did not go on to
develop any further damage at 4 years post-infliximab therapy but those that showed
damage at baseline showed significant progression of changes at 4 year follow up
[80]. The authors concluded from this small study of 33 patients that Infliximab may
retard radiographic progression but does not inhibit this.
Given that X-rays only show chronic changes in the form of new bone formation and
not inflammatory lesions, conventional radiography is not useful in assessing response
to treatment over short periods. However, X-rays are more likely to pick up
syndesmophytes than MRI scans [81] and hence conventional radiography remains
quite important in assessing disease modification in the long term.
1.5.2.2 Magnetic Resonance Imaging (MRI)
MRI is a form of medical imaging that uses the property of nuclear magnetic
resonance. The strong magnetic field created by the scanner aligns the magnetization
of nuclei within the body and radiofrequency magnetic fields are applied to alter this
alignment, producing images of the scanned area. It is especially useful in visualizing
different soft tissues.
32
The introduction of MRI has revolutionized both the diagnosis and management of
AS. Not only are patients being diagnosed much earlier and consequently started on
treatment earlier, but also there is now a way to objectively measure response to
treatment in these patients on MRI scans. The biggest advantage of MRI scans is the
lack of radiation involved, although the high cost, long imaging times and patient
factors such as claustrophobia or contraindications such as pacemakers or recent metal
implants are disadvantages that may limit its use.
Although MRI allows for early diagnosis in AS, there may be disparities between the
patient’s symptoms and imaging results. For example, some patients with few clinical
symptoms may show extensive lesions on MRI, whilst others who are much more
symptomatic may show very little by way of lesions on MRI scans.
1.5.2.2.1 Different MRI sequences and what they show
There are 2 main sequences used in imaging in AS- the T1 weighted (T1w) sequence
and the Short Tau Inversion Recovery (STIR) sequence. T1 sequences show fat as a
bright or hyper-intense signal and water as a dark (hypo intense) signal. STIR
sequences show water as a bright signal and fat tissue as a hypo-intense signal. Hence,
bone oedema representing acute inflammatory lesions appears as bright lesions on
STIR while as hypo-intense lesions on T1w sequences. On the other hand chronic
fatty change suggestive of previous inflammation appears bright on T1w sequence
and hypo-intense on STIR sequences. The T1w sequences also show chronic changes
in the form of erosions, syndesmophytes and bony ankylosis.
T1w post-contrast sequence, which also shows bone oedema, has the additional
advantage of showing increased vascularity and synovitis in the SI joints. However,
studies have shown that results of STIR and post-contrast T1w sequences are
comparable. Since STIR sequences avoid using expensive contrast media and the
associated low risk of renal impairment, only STIR sequences are now recommended
for imaging in AS [82].

33
1.5.2.2.2 Acute and chronic changes seen on MRI in AS and their significance
The acute inflammatory lesions in AS commonly occur at the anterior corners of
vertebral bodies. These give a shiny corner appearance on radiographs, also called
Romanus lesions. These can also be present at the posterior corners of the vertebral
body. Studies have shown that these can be present in patients with degenerative
arthritis and healthy volunteers as well. However, when 3 or more Romanus lesions
are present in a patient, it is highly diagnostic of spondyloarthropathy [83].
Chronic lesions may appear as fatty changes at corners of bodies of vertebrae. These
are referred to as fatty Romanus lesions (FRLs). A recent study showed that the
presence of 5 or more FRLs increased the likelihood ratio of the diagnosis of
spondyloarthropathy to 12.6 (a highly significant level) [84]..
In some patients, there is bone edema on either side of a vertebral end plate with
involvement of the intervertebral disc. This is called spondylodiscitis or Anderson
lesion. This can sometimes be associated with vertebral fractures and collapse.
Similarly, chronic lesions can involve the entire breadth of the vertebral body leading
to calcification of inter-vertebral disc and pseudo-arthrosis of adjacent vertebrae.
Other sites of inflammation include the posterior elements- the pedicle, facet and
costo-vertebral joints and spinous processes. Studies have shown that these are most
commonly seen in the thoracic spine [85] and often involved in patients with shorter
disease duration [86]. Another study showed that conventional MRI scanning
protocols that do not scan beyond the body of the vertebra may miss up to 20% of
lesions in lateral aspects of the thoracic vertebrae [87]. Hence MRI protocols need to
be modified in order to look for lesions in the posterior elements.
Active sacroiliitis on MRI scanning are identified on the basis of presence of
subchondral bone marrow oedema/osteitis on STIR sequences [88]. If there is a single
lesion, this is required to be present in at least 2 slices. If there are two lesions, a
single slice is enough to make the diagnosis. Studies have shown that patients with
shorter disease duration and those who were HLA-B27 positive showed more
extensive sacroiliac inflammation [89].
34
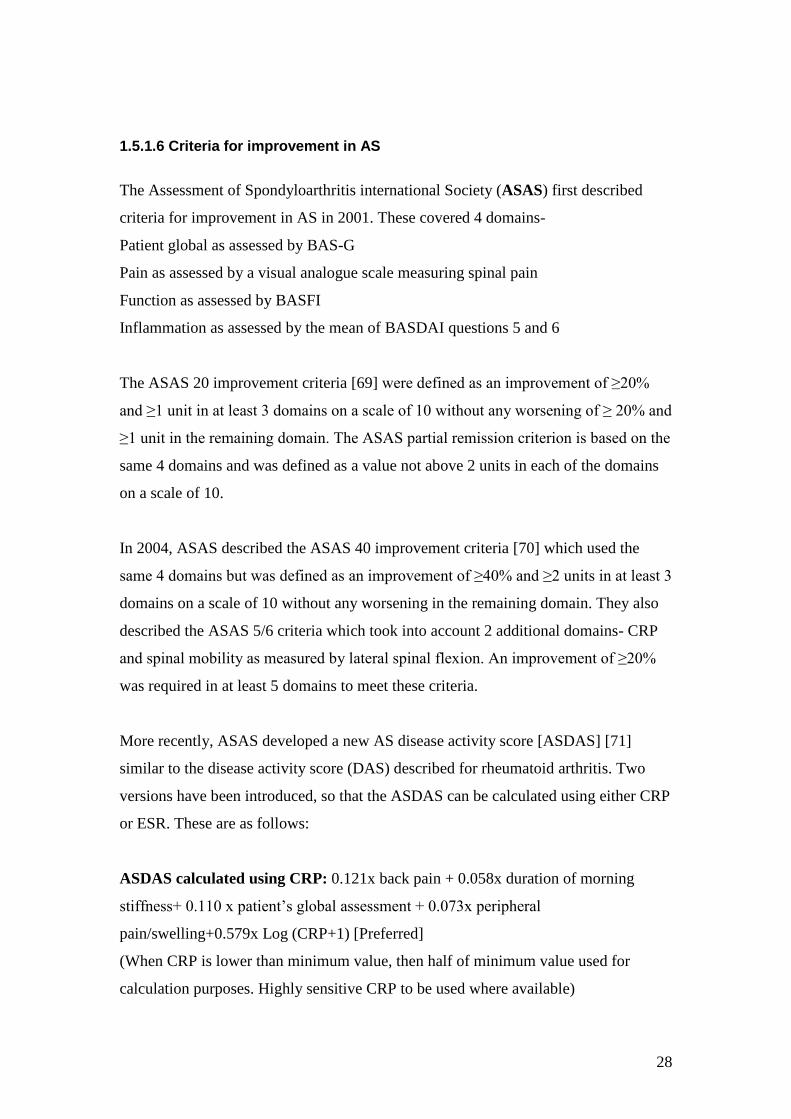
Fig 1.4(A): MRI STIR sequence of lumbar spine showing hyper-intense signal at L3-
4 intervertebral disc space suggestive of spondylodiscitis.
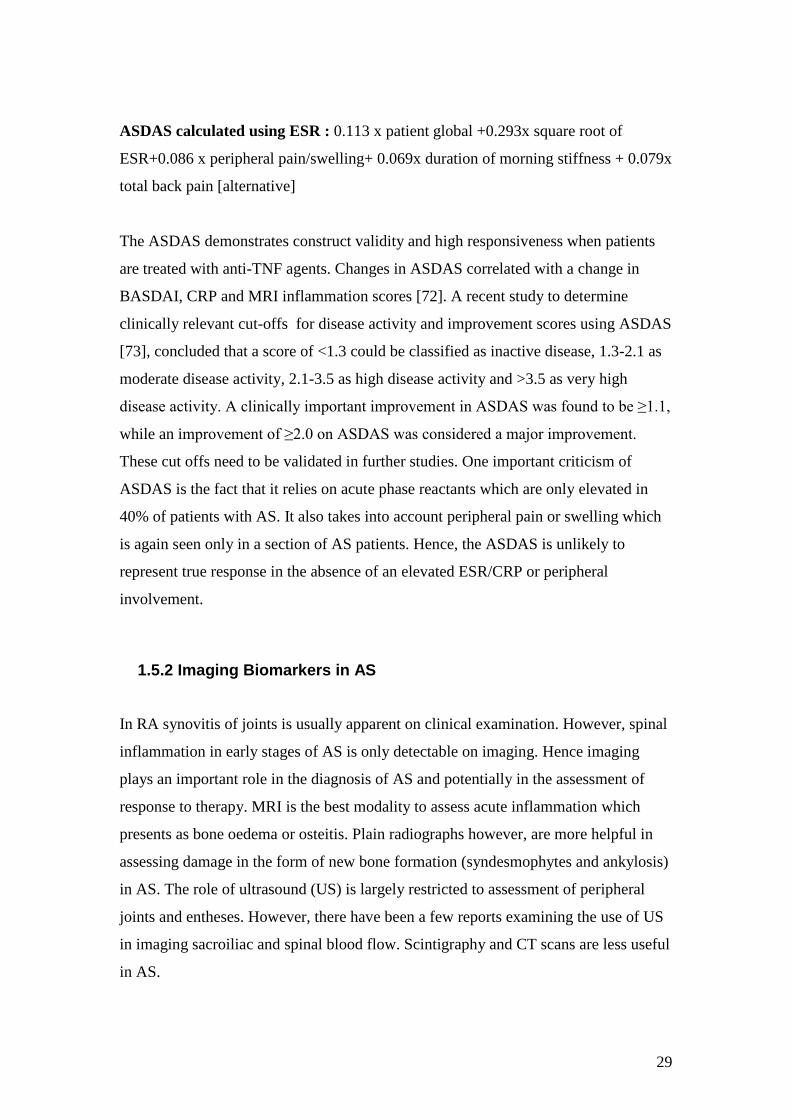
Fig 1.4(B): MRI STIR sequence of the thoracic spine showing anterior and posterior
corner inflammatory lesions as well as lesion involving the posterior elements.
Anterior corner lesion
Posterior corner lesion
Involvement
of pedicle of
thoracic
vertebra
Anderson’s
lesion at L3-4

35
Chronic change in the sacroiliac joints is also indicated by periarticular fat deposition,
subchondral sclerosis, erosions and ankylosis of the sacroiliac joints.
1.5.2.2.3 MRI scoring systems for the spine and SI joints in AS
Various scoring systems have been devised to help assess the degree of disease
activity on MRI and to study the effect of treatment on lesions present at baseline.
There are a number of scoring systems currently available to assess disease activity
and chronicity in AS. All scoring systems obtain sagittal T1w and STIR sequences of
the spine and semi-coronal views of the sacro-iliac joints. Most systems score both the
spine and sacro-iliac joints, although some systems have been devised only to score
either the spine [90] or the sacro-iliac joints [91]. Most scoring systems score both
active lesions and chronic changes on MRI, although some only address active lesions
[92, 93].
Scoring systems for the spine divide the spine into disco-vertebral units by drawing an
imaginary horizontal line through the centre of each vertebral body. A disco-vertebral
unit is hence composed of the lower half of the upper vertebra, the inter-vertebral disc
and the upper half of the lower vertebra. This hence divides the spine into 23 disco-
vertebral units extending from the lower border of C2 to the upper border of S1. In
most scoring systems, all of these vertebral units are scored and the total score
obtained. However, the Spondyloarthritis Research Consortium of Canada (SPARCC)
method only takes into account the 6 most affected disco-vertebral units and divides
each unit into 4 quadrants [94].
In some scoring systems, active inflammatory lesions are scored as 1 or 0 indicating
that they are either present or absent respectively (SPARCC method, Canada-
Denmark system). Others add points if the depth of the lesion is ≥ 1cm and another
point for high intensity of the lesion (SPARCC). In the Leeds system, comparison is
made between MRI scans pre and post treatment and scores reflect a difference in
lesions in between scans.
Other commonly used scoring methods score each disco-vertebral unit between 0-3
depending on the extent of the lesion and express this out of a total score of 69 [93].
36
In the Aarhus-Madsen scoring system, an extra 1 point is awarded for the involvement
of cost-vertebral joints at the thoracic level bringing the total to 81 [95]. Similarly the
SPARCC system has been modified to allow a dichotomous score for the posterior
elements through out the whole spine [85].
Just as for the spine, a number of different systems exist for scoring active lesions in
the sacro-iliac joints. In some, the entire joint is scored on a scale of 0-3 giving a total
score of 0-6 [91]. Others divide each joint into halves [93] or further into quadrants
[96]. The SPARCC system takes into account 6 consecutive semi-coronal slices
giving points per quadrant and additional points for depth ≥ 1cm and intensity. The
Leeds system also score each quadrant but then take into account the change in
between scans to reach the final score.
A study comparing the ASspiMRI-a method to the Berlin score and the SPARCC
system found that all three systems performed equally well for scoring the spine [97].
Similarly, a study examining 5 different scoring systems for the sacro-iliac joints,
found that they performed similarly but sensitivity to change was better in the
SPARCC scoring system [91].
1.5.2.2.4 MRI as a biomarker of response to therapy
Initial studies examining the efficacy of anti-TNF agents showed that improvement in
BASDAI scores correlated with improvement in MRI spine scores[90] [98]. However,
no correlation with status scores was performed. Sieper et al studied the sustained
effect of Infliximab on MRI lesions in AS over a 2 year period. The study found no
correlation between MRI scores and BASDAI, BASMI, BASFI, ESR or CRP using
the ASspiMRI-a score. However, there was a significant correlation between change
in BASDAI and BASFI at 12 weeks and MRI score on STIR lesions. This correlation
was not seen when MRI was repeated at 2 years [99].
Rudwaleit et al [100] studied MRI scans from AS patients participating in randomized
controlled trials of anti-TNF therapy to correlate MRI findings with clinical and
laboratory findings. They found that MRI scans of the spine or SI joints did not co-
37
relate with BASDAI, BAS-G, ESR, CRP or morning stiffness. However, they found
that patients with a shorter disease duration of <10 years who had an MRI spine score
of ≥ 11 using the Berlin method and a CRP of ≥40 mg/l were more likely to achieve a
50% improvement in BASDAI on treatment with anti-TNF agents.
A more recent study co-relating ASDAS with MRI scores, showed only a weak co-
relation between MRI SIJ and total inflammation scores and ASDAS [72]. However,
in this study MRI spine scans did not include the cervical and thoracic spine.
Although there are a number of different scoring methods on MRI, they are all
subjective and depend on the expertise of the clinician. The scoring systems have
been developed using MRI scans of patients before and after anti-TNF therapy where
there is a 40-50% improvement in bone oedema on scans. They are not sensitive to
smaller changes as there is still no way of quantifying these lesions in order to be able
to appreciate the difference before and after therapy. Further work needs to be done to
study the role of MRI as a biomarker in AS.
1.5.2.2.5 MRI as a biomarker of disease progression
Recent studies have suggested that syndesmophytes are more likely to develop from a
prior inflammatory lesion suggesting that inflammation may lead to ankylosis [101,
102]. However, these same studies have also shown that new syndesmophytes
developed more commonly in corners without prior Romanus lesions suggesting
dissociation between inflammation and ankylosis. A recent publication by van der
Heidje et al confirms this finding in a cohort of patients treated with Infliximab over a
24 week period [103]. Others have shown that syndesmophytes appear at sites of
previous fatty Romanus lesions [104]. It is also thought that lesions on MRI that
resolve show an increased tendency to develop syndesmophytes compared to those
that show persistent activity [105]. A similar trend was noticed in a recently published
study by van der Heidje [103]. However, the numbers involved in the latter study
were small and hence no concrete conclusions could be drawn.
38
1.5.2.3 Ultrasonography
Ultrasound is a medical imaging technique that uses cyclic sound waves with a
frequency above that audible to the human ear. Different tissues reflect sound waves
differently which are captured to produce images. This technique is useful to visualize
not only superficial structures like muscles and tendons but also internal organs.
The use of ultrasound in AS has predominantly been for assessment of peripheral
arthritis and enthesitis in AS. However, there have been a few studies looking at the
role of ultrasound in visualizing inflammation within the sacroiliac joints using power
Doppler ultrasound. There has also been some interest in studying spinal blood flow
in AS and how it changes with treatment.
1.5.2.3.1 Ultrasound in the assessment of enthesitis
Enthesitis is the primary lesion in spondyloarthropathies. Grey-scale ultrasound was
first used to show changes of enthesitis in the lower limbs by Lehtinen et al in
1994[106]. The study described findings in 31 patients with spondyloarthropathies
and found that ultrasound picked up abnormalities even when patients were clinically
asymptomatic. Balint et al [107] also confirmed this in a study of 35 patients and
devised a scoring system for abnormalities seen on grey scale imaging. This was
called the Glasgow Ultrasound Enthesitis Scoring System (GUESS).
Lesions seen on grey scale in enthesitis include loss of normal fibrillar pattern of
tendon insertion which may or may not be associated with increased thickness of the
tendon. Focal changes such as calcification, fibrosis and periosteal changes in the
form of erosions or new bone formation in the form of enthesophytes are also seen.
Additionally, there may be an associated bursitis adjacent to the enthesis.
Power Doppler was first shown to be useful for imaging enthesitis by D’Agostino et
al [108]. They compared enthesitis in patients with spondyloarthropathy versus
patients with RA and mechanical back pain. Although enthesitis was seen in all 3
patient groups, vascularity at the site of insertion of enthesis was only observed in
39
patients with spondyloarthropathies. However, studies have warned against the
presence of Doppler artefacts at the site of enthesis due to the highly reflective
cortical bone surface [109].
Apart from GUESS, there are now 3 other scoring systems for enthesitis. These
include the D’Agostino scoring system [108], the Spanish Enthesitis Index (SEI)
[110] and the Madrid Sonographic enthesitis index (MASEI) [111]. The first and last
combine both the grey scale and Colour Doppler findings on US. There is still no
consensus on which system is best and none have proved to be sensitive enough to
detect changes following treatment.
Recent studies have developed a 3 grade semi-quantitative scoring systems for the
Achilles tendon using the Outcome measures in Rheumatoid Arthritis Clinical Trials
(OMERACT) definition [112]. This has been used in a small study of patients
receiving anti-TNF therapy [113]. Although there was an improvement in the grey
scale and total scores, the power Doppler scores failed to show any correlation with
clinical improvement.
1.5.2.3.2 Contrast enhanced Colour Doppler Ultrasound in visualization of vascularity at SI joints
As ultrasound waves do not penetrate bone, only the posterior surface of the sacroiliac
joints can be visualized. Hence, it has not been considered a useful modality in
imaging this structure. However, recent reports have shown the use of micro-bubble
contrast-enhanced colour Doppler ultrasound (CDUS) to demonstrate sacroiliitis. A
study comparing this technique to MRI scans found that contrast enhanced colour
Doppler ultrasound was sensitive and showed a high negative predictive value for
detection of active sacroiliitis against MRI scanning [114]. This study also found that
while unenhanced colour Doppler ultrasound only detected sacroiliitis in 16 % of
affected joints, contrast-enhanced CDUS was able to detect this in 94% of joints.
A subsequent study using second generation micro bubble contrast media, showed
that contrast enhanced ultrasound was able to differentiate between active sacroiliitis

40
and inactive SI joints [115]. While the dorsal SI joint cleft showed an enhancement
depth of 18.5mm (range 16-22.1), the depth in those with inactive joints was 3.6mm
(range 0-12) and 3.1mm (range 0-7.8) in healthy controls. The sensitivity and
specificity of this technique in their hands was 100%.
1.5.2.3.3 Colour Doppler ultrasound in visualization of the spinal blood flow- the application of Resistive Index
Inflammation is usually associated with neo-vascularisation. These blood vessels are
easy to visualise in rheumatoid arthritis where joints are easily accessible to
ultrasound. By comparison, the spine and sacroiliac joints are deep seated and hence
not easy to visualise. Conventionally, power Doppler is used for imaging neo-
vascularisation as this detects slow blood flow (which is common in neo-
vascularisation) and is independent of direction of flow. Colour Doppler on the other
hand, is dependent of direction of blood flow and measures the amount of blood
flowing through the vessel. One method of studying blood flow is by calculating the
resistive index.
The resistive index (RI) is calculated as (peak systolic velocity- end diastolic velocity)
/ peak systolic velocity. End diastolic velocity in arteries supplying the muscular
structures in the back is usually zero and hence RI is 1. In most vascular organ beds,
RI is between 0.7-0.8. In the presence of inflammation, the peak systolic velocity is
low and end diastolic velocity may be higher and hence RI falls. Therefore, resolution
of inflammation is associated with a rise in RI.
To date, there are only 2 studies that have attempted to assess changes in RI in arteries
supplying the spine and sacroiliac joints. The first paper was published by Arslan et al
[116] in 1999. This study visualized blood vessels in and around the sacroiliac joints
in 21 patients with active sacroiliitis of varied aetiology. They compared the RI at
baseline to a control group of 6 patients with osteoarthritis and 8 healthy volunteers.
They found that the RI in patients with active sacroiliitis was significantly lower than
in the control group. They went on to repeat the scans after treatment and showed that
RI increased significantly.

41
A subsequent study by Unlu et al [117] studied RI in blood vessels in SI joints,
lumbar spine and thoracic spine in a more homogenous group of 39 AS patients
compared with 14 healthy controls. They then treated the AS patients, 11 of whom
received anti-TNF therapy and repeated the scans at 12 weeks. They found that RI
values for the SI joints, thoracic and lumbar spine were lower in AS patients when
compared to controls. Patients were stratified according to disease activity. Those
with active disease had a lower RI of the thoracic and lumbar spine, than those with
inactive disease. Treatment with anti-TNF therapy in this group resulted in a
significant increase in RI in the SI joints and lumbar spine but not in the thoracic
spine. The authors proposed that this could be used as a biomarker of response to
therapy. However, no comparison was made with MRI findings.
Recently, a Spanish study [118]assessed the validity of spectral Doppler in sacroiliitis
as defined by presence of Doppler signal within the sacroiliac joint with a resistive
index below 0.75. They studied 106 patients of which 53 had spondyloarthritis (SpA)
with symptoms suggestive of sacroiliitis, 26 SpA patients without symptoms and a
third group of 27 which consisted of healthy volunteers and patients with mechanical
back pain. US scans picked up Doppler signal in 37 patients of which 33 were
symptomatic SpA patients. This technique had a positive predictive value of 70.5%
and a negative predictive value of 84.5%. It showed a sensitivity of 68.6% and a
specificity of 85.7%). They did not however, study changes in resistive index with
treatment.
42
1.5.3 Laboratory biomarkers of response to therapy in AS
In contrast to rheumatoid arthritis, where ESR and CRP correlate well with disease
activity, laboratory biomarkers that correlate with disease activity in AS has proved to
be elusive. Prospective laboratory biomarkers in AS can be classified into acute phase
reactants, immunological cellular subsets that circulate and infiltrate into inflamed
tissue, genetic markers, inflammatory mediators such as cytokines and chemokines
and finally cartilage and bone biomarkers which may reflect the active process within
the bone. While genetic markers such as HLA B27 are reliable markers of disease
susceptibility and may aid in diagnosis, they do not change with treatment. However,
genetic polymorphisms may predict response to a particular form of drug therapy. In
order to obtain any meaningful data from genetic studies, large numbers are required.
This makes it difficult to use genetic markers in predicting response to therapy.
1.5.3.1 Acute Phase Reactants
Initial studies assessing the role of ESR and CRP in AS, suggested that they
correlated poorly with disease activity [49]. Serum amyloid A (SAA) is an Apo-
lipoprotein synthesized by activated monocytes and macrophages in the liver. A
recent study showed that SAA levels were high in AS patients and that SAA levels
correlated with BASDAI (r = 0.43, p=0.007) as well as with ESR (r = 0.52, p =0.001 )
and CRP (r =0.65, p <0.001) [119].
A subsequent Dutch study [120]comparing ESR, CRP and SAA in 155 AS patients
before and after anti-TNF therapy, found significant decrease in all 3 acute phase
reactants with treatment and showed a correlation to disease activity measured by
BASDAI. Elevated baseline CRP and SAA values were most predictive of a response
to anti-TNF therapy. Similarly, in a study of 851 AS patients recruited to trials
evaluating Coxibs and NSAIDs, a correlation was found between CRP and BASDAI
as well as BASFI. They showed a difference in CRP in patients receiving NSAIDs/
Coxibs versus placebo and the treatment effect was greater when patients had high
CRP values at baseline [121].
43
Only 40-60% of patients with AS demonstrate CRP values above the lowest
reportable value for the CRP assay (usually 5-10mg/L). With the introduction of
highly sensitive CRP (hsCRP) assays, this level has now been lowered to 0.1mg/L,
allowing detection of CRP levels in a larger cohort of patients. A study comparing
conventional CRP to hsCRP in a group of 153 AS patients, found a good correlation
between the 2 assays but a better correlation between hsCRP and clinical parameters
compared to the conventional CRP assay. In the subgroup of patients with
undetectable CRP using conventional assay, there was a clear trend for fatigue,
stiffness and functional disability and higher values of hsCRP [122]. Highly sensitive
CRP values have now been recommended for calculation of ASDAS scores.
Hence ESR, CRP and SAA have been shown to change with therapy and this change
is more noticeable when baseline levels are high. There is still no clear surrogate
marker of improvement in disease activity when baseline levels of these biomarkers
are within normal range which is the case in a significant number of AS patients.
1.5.3.2 Immunological cell subsets in AS
There have been a number of studies investigating the cellular subsets thought to be
involved in the pathogenesis of AS. However, very little data is currently available on
the relationship of these cell populations to disease activity or response to therapy.
Evidence of immunological cells being involved in the pathogenesis of AS is
primarily derived from biopsies obtained from sacroiliac joints, the spine as well as
hip joints. While the latter is easy to obtain from patients undergoing hip replacement,
the former two are difficult to obtain unless patients require spinal surgery. As
patients only undergo surgery later in the disease process, it is difficult to obtain tissue
material in early disease.
In a small study of 5 patients with active AS, needle biopsies from sacroiliac joints
showed dense infiltrates containing T cells and macrophages. CD3+, CD4+, CD8+
and CD 14+ cells were found diffusely within the tissues [123]. Another small study
of histological samples of facet joints from eight AS patients undergoing spinal

44
surgery, found infiltrates of aggregates of CD4+, CD8+ and CD20+ lymphocytes
[124]. These were present even in cases of AS with long-standing disease and
significant ankylosis, suggesting that active inflammatory foci may be present even in
late stages of AS.
Higher levels of circulating CD8+ CD28- T cells were found in patients with AS than
in the healthy population. Also levels of CD8+ CD 28- T cells have been reported to
correlate with metrology scores [125]. HLA-B27 is known to present specific peptides
to CD8+ T lymphocytes (cytotoxic T lymphocytes). Recent studies have shown that
B27 may also be recognised by CD4+ T cells [126]. These cells lack the CD28 co-
stimulatory molecule but carry the natural killer (NK) receptor present on NK cells
that allows them to recognize MHC I molecules such as HLA B27. Levels of
circulating CD4+ CD28- T cells have also been shown to correlate with disease status
(metrology scores) in AS patients [127].
On comparing T cell subsets in patients with SpA, RA and polymyalgia rheumatica
versus healthy volunteers [128], the levels of CD3+CD4+CD28- memory/effector T
cells were found to be higher in synovial fluid and to a lesser extent peripheral blood
of SpA patients compared to other groups. Also naïve T cells
(CD28+CD45RA+CD4+ /CD8+) were reduced and memory T cells
(CD28+CD45RO+CD4+/CD8+) , activated T cells (CD8+CD25+) and T-Regs
(CD4+CD25hi
) were also increased in synovial fluid compared to peripheral blood.
Another group of CD4+ T cells thought to be important in pathogenesis of AS is the
Th17 subset. Jandus et al [129] showed increased numbers of circulating Th17 cells in
patients with spondyloarthropathy as compared to RA or vitiligo by multi-parameter
flow cytometry and immuno-histochemistry. Th17 cells from these AS patients
showed advanced differentiation and were polyfunctional in terms of T cell receptor-
driven cytokine production (IL-17, IL-2 and TNF α).
45
1.5.3.3 Cytokines, chemokines and growth factors
Cytokines in AS have been measured either directly in serum, by intracellular staining
of peripheral blood mononuclear cells (PBMCs) or by measuring cytokine gene
expression through mRNA microarrays. Serum levels of both pro-inflammatory
cytokines like TNF α and IL-6 as well as anti-inflammatory cytokines like IL-10 and
TGF β have been found to be elevated in AS [130]. Significant reductions in IL-6
have been reported after treatment with infliximab [131]. High levels of baseline IL-6
and CRP were found to be associated with a response to anti-TNF therapy. Early
reductions in IL-6 were associated with improvements in disease activity and spinal
inflammation on MRI. A similar study [132] assessing 22 different cytokines found an
association between serum IL-1α and response to infliximab therapy.
Drouart et al [133] studied the potential use of VEGF as a biomarker of disease by
measuring levels in 105 SpA patients versus 50 RA and 64 healthy volunteers. They
found serum VEGF levels were significantly higher in AS and RA patients. VEGF
levels correlated with BASDAI, ESR and CRP but were not associated with
syndesmophytes or grade of sacroiliitis. Significant reduction in VEGF has been
reported after treatment with infliximab [131]
Levels of cytokines vary at different locations throughout the body and fluctuate as
cytokines have short half lives [130]. Hence, serum levels may not accurately reflect
cytokine levels in synovial inflammation or enthesitis. A number of studies have used
flow cytometry to obtain specific information regarding intracellular cytokine
expression in peripheral blood mononuclear cells. Baeten et al [134] evaluated IL-2,
IL-4, IL-10 and IFN γ expression in CD3+ T cells and CD3+/CD56+ NK T cells in 21
patients with spondyloarthropathy and compared this to 20 patients with RA and 15
healthy controls. The cytokine profile was also repeated in the SpA patients after
treatment with Infliximab. They found a low percentage of IFN γ and IL-2 positive
cells and a higher percentage of IL-10 positive cells in the SpA group as compared to
patients with RA or healthy controls, suggestive of an impaired Th1 cytokine profile.
Treatment with infliximab induced an increase in percentage of cells positive for IFN
γ and IL-2 suggesting a restoration of Th1 cytokine profile.
46
However, a subsequent German study [135] examined intracellular IFN γ, TNFα, IL-4
and IL-10 expression in CD4 and CD8 T cells from AS patients. They reported a
decrease in TNFα and IFN γ secreted by T cells after 12 weeks of infliximab therapy.
They also reported an increase in IFN γ and TNF α positive CD4+ and CD8+ T cells
in AS patients treated with etanercept [136]. The authors argue that interaction of
infliximab with TNF α down regulates Th1 cytokines while the binding of TNF
molecules to etanercept up regulates Th1 response secondary to low circulating TNF
levels [137].
Apart from Th1 and Th2 type cytokines, there is a growing interest in the Th17-
related cytokines in AS. Shen et al [138] studied cytokine expression in AS patients
and compared it to RA patients as well as normal controls. Using eight-colour flow
cytometry, they analyzed surface phenotype, chemokine receptor and intracellular
cytokine expression of IL-17, IL-22, IFN γ and IL-10 in PBMCs. They found
significantly higher percentages of IL-17 and IL-22 positive CD4+ T cells in patients
of AS and RA as compared to healthy controls. They also reported a correlation
between IL-17 positive CD4+ T cells in PBMCs and the amount of IL-17 in PBMC
culture supernatants. These IL-17 producing cells also produced IL-22 and IFN γ but
not IL-10.
IL-23 is the main inducer of Th-17 polarization of naïve T cells. Although Th-17
related cytokines are present in synovial fluid from both SpA and RA patients, levels
of IL-23 correlate with disease activity in RA but not SpA [139]. IL-23 is composed
of a p40 subunit shared with IL-12 and a p19 subunit specific to IL-23. A study that
assessed serum and synovial levels of p40 subunit of IL-12/23, found no significant
change in levels after anti-TNF therapy [140].
Chemokines are molecules responsible for attracting T cells into inflamed tissues. Th1
cells show surface expression of chemokine receptors CCR5 and CXCR3. These
receptors bind ligands like CCL5 (RANTES), CCL3 (MIP-1α), CXCL9 (MIG) and
CXCL10 (IP-10). On the other hand, Th2 cells express CCR3, CCR4 and CCR8 and
bind to chemokines like CCL-17 (TARC). Th17 cells express CCR6 and CCR4. CCL-
20, the ligand for CCR6, has been found to be increased in inflamed joints.
47
A study that examined lymphocytic expression of chemokine receptors and
intracellular cytokine production [141] in AS patients versus controls, found a type 1
immune reaction on CD 28- T cells from AS patients. The chemokine CXCL-9 (MIG)
was increased in sera of active AS patients and treatment with anti-TNF agents
resulted in a reduction in CCL-5 (RANTES), CXCL-10 (IP-10) (type I chemokines)
but also CCL-17 (type II chemokine).
1.5.3.4 Bone and cartilage biomarkers
Cartilage and bone markers may potentially serve as important biomarkers in
Ankylosing Spondylitis as they reflect the end result of inflammation or bone
metabolism. Cytokines such as TNFα increase osteoclast precursor cells in the
circulation. In addition to TNFα, other pro-inflammatory cytokines such as IL-1, IL-6
and IL-17 induce the expression of RANKL which encourages osteoclast
differentiation leading to bone loss.
Gengenbacher et al [142] studied the effects of infliximab on bone resorption by
osteoclast precursor cells (OCPs) in AS and RA patients. This study found that
blocking of TNF α resulted in a strong reduction of bone resorption by OCPs which
was much faster in RA as compared to AS. This inhibition was associated with
reduced disease activity and osteocalcin levels.
In contrast to RA, where RANKL is over-expressed and OPG is under-expressed in
active synovitis leading to bone loss and erosions [143], the level of OPG is not
reduced in AS [144] . A study by Kim et al [145] found that both sRANKL and
sRANKL /OPG ratios were up-regulated in AS patients and correlated with reduced
bone mineral density (BMD) and radiological changes. Hence, an imbalance between
RANKL and OPG may play a role in bone resorption.
A new marker for bone metabolism is isoform 5b of tartrate resistant acid phosphatase
(TRAP5b) which is a specific osteoclast enzyme. It has been found to be elevated in
bone diseases such as osteoporosis or skeletal metastasis. A study by Toussirot et al
[146] found TRAP5b to be a more sensitive marker than CTX-I for evaluating the
48
level of bone resorption in AS. This was postulated to be due to the fact that TRAP5
evaluates bone resorption by enzymatic activity where as CTX-I assesses collagen
breakdown.
MMP3 has been shown to be an independent predictor of radiographic progression in
patients with AS [147]. A more recent study found that MMP3 is raised in AS and a
significant drop in MMP-3 levels was seen with anti-TNF therapy [148].
Articular cartilage is composed of type II collagen and a proteoglycan called
aggrecan. When type II collagen breaks down, it generates neoepitopes- C2C and C1-
2C and causes chondrocytes to up regulate biosynthesis of C-propeptide of type II
collagen (CPII). Breakdown of aggrecan leads to increase of the 846 epitope. A recent
study found that elevated CPII, 846 epitope and CPII: C2C ratio in AS patients
compared to controls. Only the CPII:CPC ratio correlated with CRP suggesting it may
be useful as a marker of disease activity [149].
A study of markers of bone resorption (CTX I) and cartilage degradation (CTX II),
found that both were increased in patients with AS [150]. The levels of these analytes
correlated with each suggesting on-going simultaneous processes. However, only
CTX-II was associated with radiological damage and progression in AS, suggesting
that bone proliferation and degradation may be uncoupled processes in AS. An earlier
Korean study had reported a correlation between CTX-I and disease activity [151].
Apart from bone loss, AS is also characterized by new bone formation which occurs
through activation of osteoblasts which are derived from mesenchymal stem cells.
The differentiation of osteoblasts is controlled by the bone morphogenic protein
(BMP) family (which includes TGF-β) as well as the Wnt protein family. Cytokines
such as TNF α induce both Dickkopf- 1 (DKK-1) as well as Sclerostin, both of which
are strong inhibitors of the Wnt pathway hence inhibiting bone formation. The Wnt
pathway in turn controls the expression of OPG which inhibits RANKL/RANK
interaction. At a molecular level, TNF α stimulates expression of Dickkopf (DKK)-1.
Ossification depends on bone morphogenetic proteins (BMPs). Treatment with anti-
TNF α agents results in resolution of inflammation, allowing signalling through Wnt
and growth factors such as BMP-2 to induce new bone formation [15].

49
Another bone biomarker that is thought to be important in AS is Sclerostin, an
inhibitor of bone formation that is expressed by osteocytes. A recent study that
observed Sclerostin expression by osteocytes in joints derived from patients with RA,
OA, AS and healthy controls, reported that sclerostin was expressed in a majority of
osteocytes in RA and healthy controls but it was lower in OA and nearly absent in AS
patients. The same study also looked at serum levels of sclerostin, which were found
to be lower in AS patients than in healthy controls. Moreover, low sclerostin levels
correlated with formation of new syndesmophytes [152].
Appel et al [153] looked at the correlation between inflammation and new bone
formation in patients of AS over 2 years. They found that rising levels of bone
alkaline phosphatase (BAP) were negatively correlated with MMP3 in patients with
spondyloarthropathies treated with adalimumab. They hence postulated that new bone
formation in AS occurs if inflammation is successfully treated and hence may be part
of a healing process. Serum levels of BAP and osteocalcin in AS do not differ from
normal but have been shown to significantly increase after 12 weeks of treatment with
etanercept [154].
Visvanathan et al [131]evaluated the relationship between bone mineral density
(BMD), biomarkers of bone turnover (Bone alkaline phosphatase [BAP], osteocalcin
and CTX I) and inflammation (IL-6, vascular endothelial growth factor [VEGF] and
transforming growth factor [TGF] β) in patients with AS treated with infliximab. This
study reported a significant correlation between baseline levels of IL-6, VEGF,
osteocalcin, BAP and CTX and increases in spinal BMD at weeks 24 and 102 after
infliximab therapy. Multiple regression analysis showed that high baseline osteocalcin
levels and an early increase in BAP at week 2 were significantly associated with
increases in BMD scores of the spine and hip after infliximab therapy.
Although a number of bone and cartilage markers have been studied so far, none has
come into routine clinical use as a marker of disease status evaluation or of response
to therapy. One of the problems with evaluating bone biomarkers is that they need to
be correlated to radiographic change which we know takes a few years to develop.
There have been no studies correlating bone biomarkers with acute inflammatory
50
changes on MRI scans. More work is needed in this area before any definite
biomarkers of response are established.
1.6 Aims
To study how clinical, imaging and laboratory biomarkers change with
therapy in patients with AS treated with gold standard anti-TNF agents
as well as a novel PDE 4 inhibitor, apremilast, in a clinical trial setting.
To explore volumetric analysis of lesions on MRI and study its
correlation to existing semi-quantitative methods.
To correlate changes in clinical, imaging and laboratory biomarkers in
order to identify an objective biomarker of response to therapy.
1.7 Study Layout
I set out to achieve these by studying the following biomarkers:
Clinical outcome measures including the Bath Indices and ASDAS
MRI changes through semi-quantitative scoring using the Berlin score
Laboratory biomarkers including inflammatory markers, bone biomarkers as
well as cytokines, chemokines and growth factors.
Exploratory volumetric analysis of lesions on MRI
As there were differences in patient groups and methodology in each of these, they are
reported separately in different chapters that follow.

51
Chapter 2: Clinical Outcome Measures as biomarkers of response to therapy
52
2.1 Introduction:
Response to therapy in AS can be measured in many different ways- clinical response
through patient questionnaires, improvement of bone oedema on MRI scans,
improvement in inflammatory markers such as ESR or CRP and in the long term, the
development of syndesmophytes on plain X-rays. Of all these measures, patient
reported subjective questionnaires remain the favoured approach in routine clinical
practice. This is largely because they are easy to administer, show changes with short
term intervention and have been validated as effective tools to measure response to
therapy. Other measures such as MRI do not correlate well to clinical outcome
measures and hence this limits their utility as biomarkers of response to therapy.
Changes on X-rays are very slow and can take up to many years to develop.
Inflammatory markers are useful when raised at baseline but this is only in a small
minority of patients.
In this chapter, we study the various clinical outcome measures in both a clinical trial
setting as well as routine clinical practice.
2.2 Methods:
2.2.1 Patient populations
Biomarkers were studied in 2 patient cohorts. The first was a clinical trial setting
where AS patients were randomised to receive apremilast, an oral phosphodiesterase
inhibitor, or placebo (1:1). This is henceforth referred to as the START cohort
(Spondylitis Trial of Apremilast for better Rheumatic Therapy). The second cohort
consisted of AS patients treated with anti-TNF therapy having failed to respond to
conventional medication. This is referred to as the anti-TNF cohort and served as a
gold standard comparator to the START cohort.
53
2.2.1.1 START cohort
2.2.1.1.1 Study design
This was a single-centre, randomized, double-blind, placebo-controlled, Phase II,
investigator-led pilot study carried out at the Kennedy Clinical Trials Unit
(Clinicaltrials.gov number NCT00944658). It was conducted in accordance with good
clinical practice and received ethics approval from the Hammersmith Research ethics
committee. Each patient provided written informed consent.
The study involved a 12-week, double-blind, placebo-controlled period followed by a
4-week follow-up for safety and clinical assessments. Patients were randomized 1:1 to
receive apremilast 30 mg BID or placebo in a double-blind fashion. An un-blinded
pharmacist allocated patients to receive either placebo or active drug according to a
randomization code generated by Celgene, the company that manufactures apremilast.
All other study personnel remained blinded to treatment until the end of the double-
blind period. Patients were started on apremilast 10 mg BID or placebo and the dose
was titrated by 20 mg every 2 days until the maximum dose of 30 mg BID was
achieved on day 5. Apremilast or placebo was then given daily until day 85 (week
12). Patients were allowed to continue stable doses of NSAIDs but were not allowed
DMARDs within 8 weeks of randomization or corticosteroids in oral/ parenteral form
within 4 weeks of randomization.
1..1.1 2.2.1.1.2 Patients
Key inclusion criteria included patients satisfying the modified New York criteria for
AS with disease duration of at least 2 years. Patients were required to have symptoms
of back pain and stiffness confirmed with a score of ≥1 on questions 2 and 5 of the
Bath Ankylosing Spondylitis Disease Activity Index (BASDAI); which pertain to
spinal pain and stiffness. They also required the presence of active bone oedema
either in the spine or sacroiliac joints confirmed by magnetic resonance imaging
(MRI). Patients with prior treatment with TNF inhibitors were permitted to enrol
allowing for a washout period.
54
Patients were excluded if there were abnormalities on routine blood tests other than a
raised erythrocyte sedimentation rate (ESR) or C-reactive protein (CRP), any
contraindications to MRI scanning, or positive tuberculosis testing (Mantoux and TB
Elispot).
2.2.1.1.3 Clinical Outcome measures
Bath Indices (BASDAI, BASFI, BASMI and BAS-G) were recorded at all time points
(Day 0, 8, 15, 27, 56, 85 and 113). In addition, patient also had tender and swollen
joint counts recorded as well as FACIT-F scores. ASDAS scores were then calculated
in this patient population.
2.2.1.1.4 Statistics
Analysis of Co-variance (ANCOVA) was used to compare improvements in Bath
Indices and FACIT-F scores at each time point using baseline values as covariate.
This analysis was carried out by BrighTech International, statisticians appointed by
Celgene Corporation that funded the clinical trial, using the SAS package. A p-value
of 0.05 was considered to be statistically significant. A post-hoc analysis of
improvement in ASDAS between the two arms of the study was done by applying
Mann-Whitney U-test using GraphPad Prism software.
2.2.1.2 Anti-TNF cohort
This was a prospective study which recruited patients with a confirmed diagnosis of
AS primarily from Imperial College Healthcare NHS Trust outpatient clinics but also
from other referring NHS hospital trusts that were about to start anti-TNF therapy
having failed at least two previous NSAIDs.
2.2.1.2.1 Patients
Some of the patients were already part of an ongoing study entitled, ‘The impact of
TNF blockade on effector T cell populations in patients with Rheumatoid arthritis,
Psoriatic Arthritis and Ankylosing Spondylitis treated with anti-TNF therapy’
[EudraCT No: 2009-012424-87]. Others were recruited on the study entitled
“Molecular mechanisms and pathways in chronic inflammatory and degenerative
disease”. Both studies received ethical approval from Hammersmith Research Ethics
55
Committee. All patients satisfied the modified New York Criteria for AS had a BASDAI
of ≥ 4 with a spinal VAS of ≥ 4 at two time points at least one month apart. They were
all screened for tuberculosis by a chest X-ray, Mantoux test and a TB Elispot prior to
commencing anti-TNF therapy as per local guidelines.
2.2.1.2.2 Study Design
All patients were treated with either etanercept 50mg subcutaneous weekly or
adalimumab 40mg subcutaneous fortnightly. Patients were seen at baseline prior to their
first injection and then at the end of 3 months of therapy. Patients were allowed to
continue with NSAIDs and DMARDs provided the doses were stable for 4 weeks prior
to starting anti-TNF therapy. Patients were not allowed parenteral or oral steroids for 4
weeks prior to staring anti-TNF therapy.
2.2.1.2.3 Clinical outcome measures
Patients had BASDAI, BASFI and BASMI recorded at baseline and 12 weeks after
commencing therapy. They also had HAQ, SF-36 and FACIT-F scores recorded..
ASDAS could not be calculated in this patient cohort as BAS-G which is one of the
parameters required to do so was not recorded in this patient cohort.
2.2.1.2.4 Statistics
Paired t-test and Wilcoxon matched pairs test were used to measure response in Bath
indices between baseline and 12 weeks using GraphPad Prism software. Again, a p-
value of 0.05 was considered to be statistically significant.
56
2.3 Results
2.3.1 START cohort
56 patients were screened of which 38 patients were recruited to the START study.
The reasons for screen failure were as follows:
Positive TB screen: 2
Presence of metal in situ (contraindication to MRI scanning): 2
Absence of bone oedema on MRI: 6
Withdrawal of consent after screening: 2
Did not score high enough on BASDAI to qualify: 2
Duration since diagnosis less than 2 years: 1
No clinical evidence of AS: 2
Abnormal liver function tests: 1
2 patients dropped out of the study due to adverse events within a week of starting
treatment, both of whom were on apremilast. Of the remaining 36, 19 patients received
placebo and 17 received apremilast.
2.3.1.1 Baseline characteristics and Patient Demographics:
Of the 36 patients that completed the study, 32 were male and 4 were females. Ethnic
distribution was as follows: 32 Caucasian, 3 Asian and 1 patient of African origin.
The baseline characteristics in the two groups are listed in table 2.1. These show that
patients receiving apremilast were older with longer disease duration but these
differences were not statistically significant. Although BASDAI and BASFI were
similar in the two groups, given the longer disease duration in the group receiving
apremilast, the BASMI was higher in this cohort of patients.

57
Table 2.1: Patient characteristics seen in the two groups at baseline. Patients in the
apremilast arm were older with longer disease duration and had higher BASMI scores
than patients in the placebo group.
Placebo
Mean (SD)
Apremilast
Mean (SD)
p-value
Age (Yrs) 39.21 (13.3) 44.88 (11.1) 0.17
Disease duration (Yrs) 18.39 (10.17) 20.88 (12.32) 0.51
BASDAI 4.36 ( 1.757) 4.79 (2.161) 0.52
BASFI 3.49 (2.208) 4.55 (2.429) 0.178
BASMI 3.16 (1.598) 4.48 (1.963) 0.032 *
BASG 4.13 (2.329) 4.33 (2.850) 0.816
Night pain 4.03 (2.524) 4.25 (2.940) 0.814
FACIT-F
110.04
(26.147)
107.75 (25.716) 0.793
2.3.1.2 BASDAI as a biomarker of response:
Table 2.2 and Figure 2.1 show changes in BASDAI with treatment over time. Although
both groups show an improvement in BASDAI, the drop in BASDAI in the active arm
is higher in the group treated with apremilast. This however, does not achieve a drop by
2 BASDAI units and the differences between the two groups are not statistically
significant. Of note, there is a trend to continuous improvement in BASDAI even at day
85 when treatment is stopped suggesting that if treatment were continued for longer,
this may have resulted in further benefit which may have been statistically significant.
Cessation of therapy in both groups swiftly resulted in return of BASDAI back to
baseline 4 weeks later.
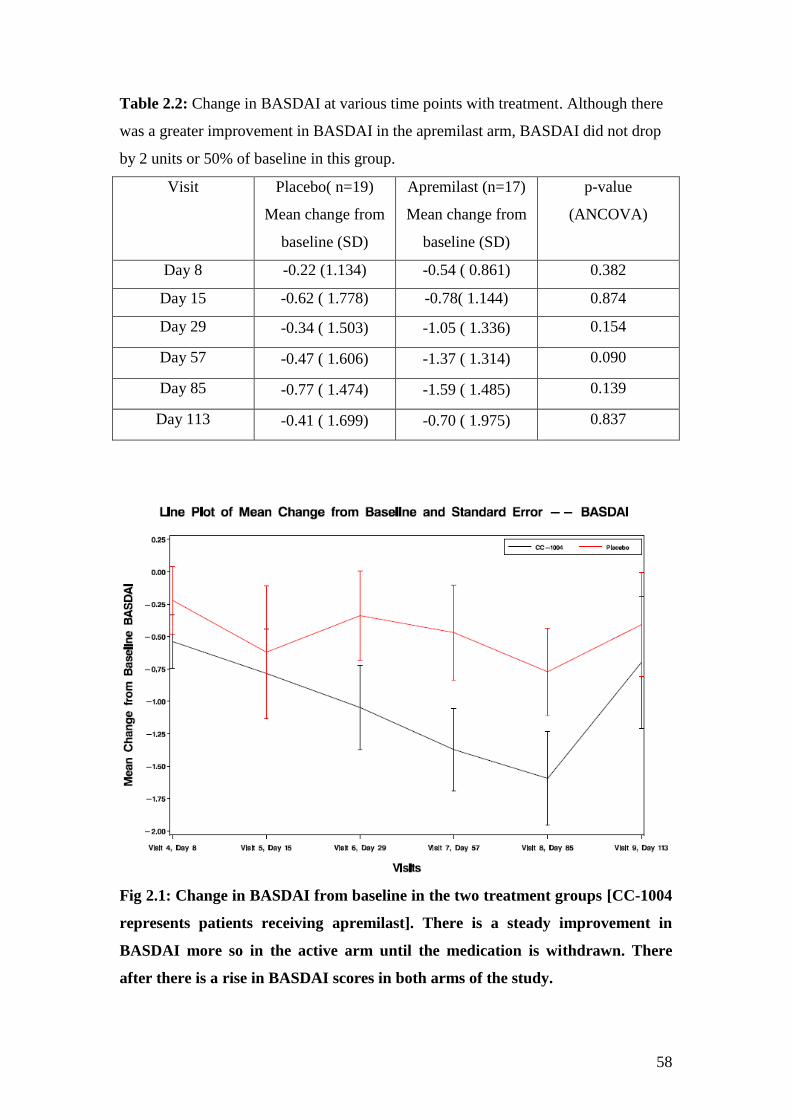
58
Table 2.2: Change in BASDAI at various time points with treatment. Although there
was a greater improvement in BASDAI in the apremilast arm, BASDAI did not drop
by 2 units or 50% of baseline in this group.
Visit Placebo( n=19)
Mean change from
baseline (SD)
Apremilast (n=17)
Mean change from
baseline (SD)
p-value
(ANCOVA)
Day 8 -0.22 (1.134) -0.54 ( 0.861) 0.382
Day 15 -0.62 ( 1.778) -0.78( 1.144) 0.874
Day 29 -0.34 ( 1.503) -1.05 ( 1.336) 0.154
Day 57 -0.47 ( 1.606) -1.37 ( 1.314) 0.090
Day 85 -0.77 ( 1.474) -1.59 ( 1.485) 0.139
Day 113 -0.41 ( 1.699) -0.70 ( 1.975) 0.837
Fig 2.1: Change in BASDAI from baseline in the two treatment groups [CC-1004
represents patients receiving apremilast]. There is a steady improvement in
BASDAI more so in the active arm until the medication is withdrawn. There
after there is a rise in BASDAI scores in both arms of the study.
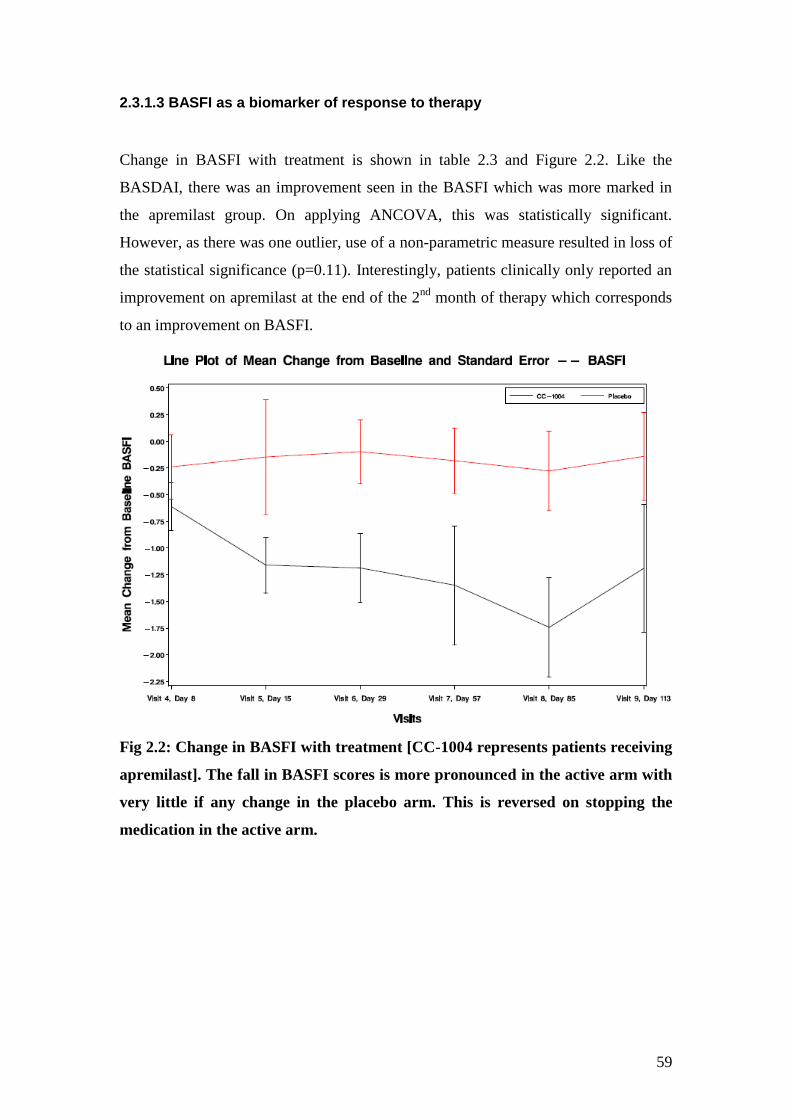
59
2.3.1.3 BASFI as a biomarker of response to therapy
Change in BASFI with treatment is shown in table 2.3 and Figure 2.2. Like the
BASDAI, there was an improvement seen in the BASFI which was more marked in
the apremilast group. On applying ANCOVA, this was statistically significant.
However, as there was one outlier, use of a non-parametric measure resulted in loss of
the statistical significance (p=0.11). Interestingly, patients clinically only reported an
improvement on apremilast at the end of the 2nd
month of therapy which corresponds
to an improvement on BASFI.
Fig 2.2: Change in BASFI with treatment [CC-1004 represents patients receiving
apremilast]. The fall in BASFI scores is more pronounced in the active arm with
very little if any change in the placebo arm. This is reversed on stopping the
medication in the active arm.
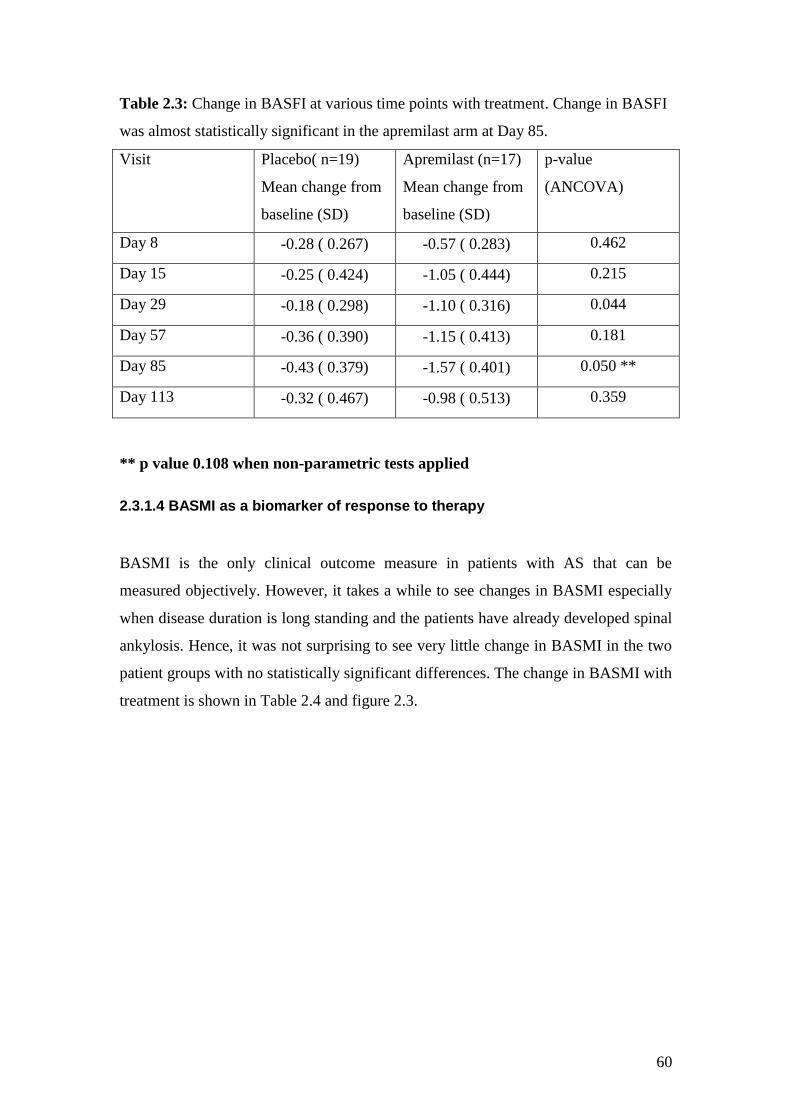
60
Table 2.3: Change in BASFI at various time points with treatment. Change in BASFI
was almost statistically significant in the apremilast arm at Day 85.
Visit Placebo( n=19)
Mean change from
baseline (SD)
Apremilast (n=17)
Mean change from
baseline (SD)
p-value
(ANCOVA)
Day 8 -0.28 ( 0.267) -0.57 ( 0.283) 0.462
Day 15 -0.25 ( 0.424) -1.05 ( 0.444) 0.215
Day 29 -0.18 ( 0.298) -1.10 ( 0.316) 0.044
Day 57 -0.36 ( 0.390) -1.15 ( 0.413) 0.181
Day 85 -0.43 ( 0.379) -1.57 ( 0.401) 0.050 **
Day 113 -0.32 ( 0.467) -0.98 ( 0.513) 0.359
** p value 0.108 when non-parametric tests applied
2.3.1.4 BASMI as a biomarker of response to therapy
BASMI is the only clinical outcome measure in patients with AS that can be
measured objectively. However, it takes a while to see changes in BASMI especially
when disease duration is long standing and the patients have already developed spinal
ankylosis. Hence, it was not surprising to see very little change in BASMI in the two
patient groups with no statistically significant differences. The change in BASMI with
treatment is shown in Table 2.4 and figure 2.3.
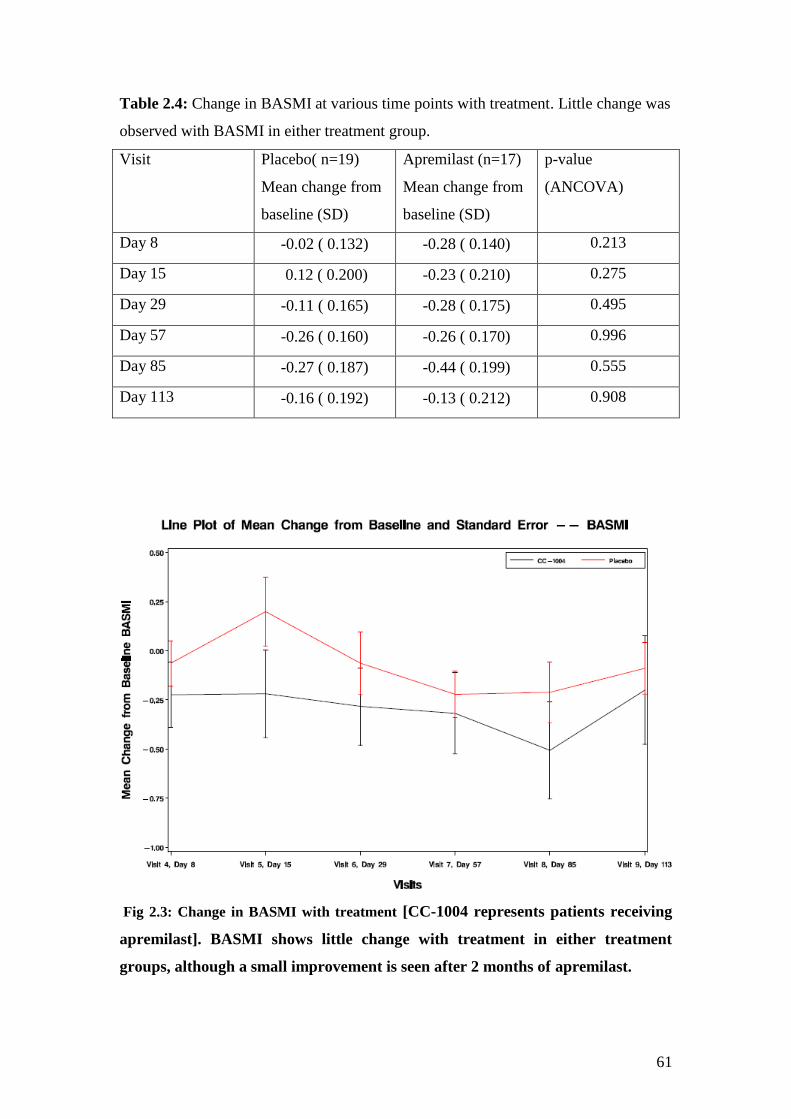
61
Table 2.4: Change in BASMI at various time points with treatment. Little change was
observed with BASMI in either treatment group.
Visit Placebo( n=19)
Mean change from
baseline (SD)
Apremilast (n=17)
Mean change from
baseline (SD)
p-value
(ANCOVA)
Day 8 -0.02 ( 0.132) -0.28 ( 0.140) 0.213
Day 15 0.12 ( 0.200) -0.23 ( 0.210) 0.275
Day 29 -0.11 ( 0.165) -0.28 ( 0.175) 0.495
Day 57 -0.26 ( 0.160) -0.26 ( 0.170) 0.996
Day 85 -0.27 ( 0.187) -0.44 ( 0.199) 0.555
Day 113 -0.16 ( 0.192) -0.13 ( 0.212) 0.908
Fig 2.3: Change in BASMI with treatment [CC-1004 represents patients receiving
apremilast]. BASMI shows little change with treatment in either treatment
groups, although a small improvement is seen after 2 months of apremilast.
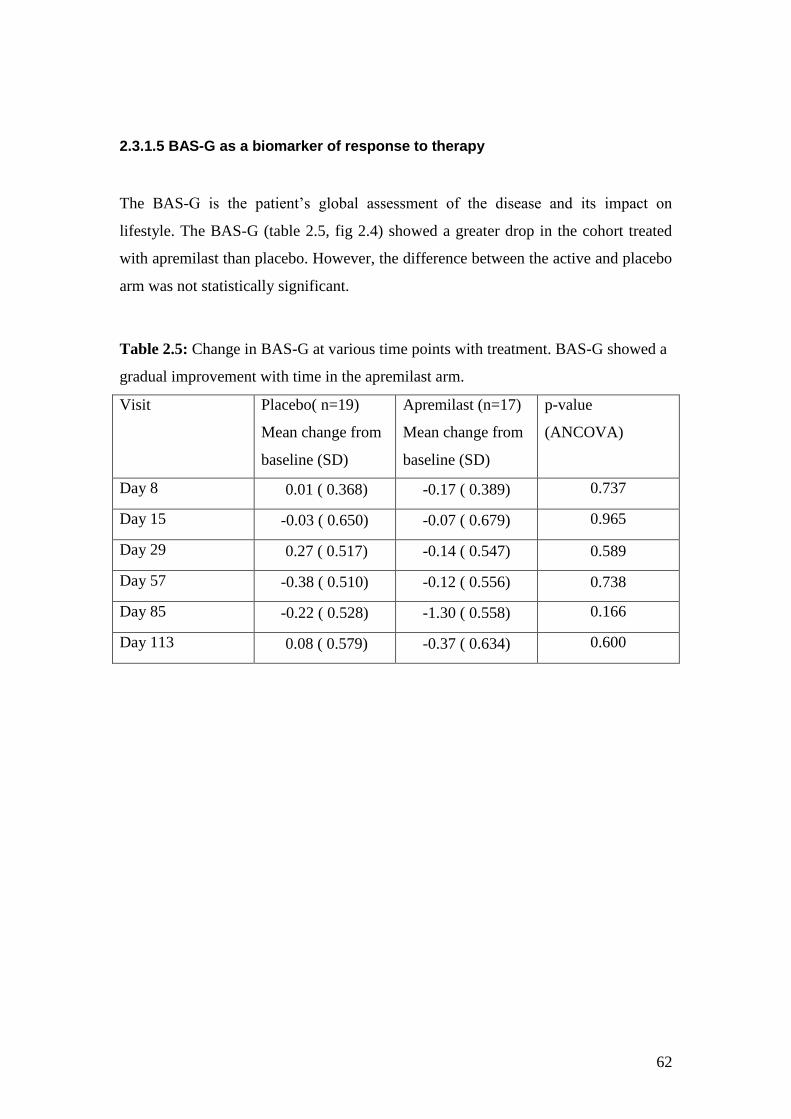
62
2.3.1.5 BAS-G as a biomarker of response to therapy
The BAS-G is the patient’s global assessment of the disease and its impact on
lifestyle. The BAS-G (table 2.5, fig 2.4) showed a greater drop in the cohort treated
with apremilast than placebo. However, the difference between the active and placebo
arm was not statistically significant.
Table 2.5: Change in BAS-G at various time points with treatment. BAS-G showed a
gradual improvement with time in the apremilast arm.
Visit Placebo( n=19)
Mean change from
baseline (SD)
Apremilast (n=17)
Mean change from
baseline (SD)
p-value
(ANCOVA)
Day 8 0.01 ( 0.368) -0.17 ( 0.389) 0.737
Day 15 -0.03 ( 0.650) -0.07 ( 0.679) 0.965
Day 29 0.27 ( 0.517) -0.14 ( 0.547) 0.589
Day 57 -0.38 ( 0.510) -0.12 ( 0.556) 0.738
Day 85 -0.22 ( 0.528) -1.30 ( 0.558) 0.166
Day 113 0.08 ( 0.579) -0.37 ( 0.634) 0.600
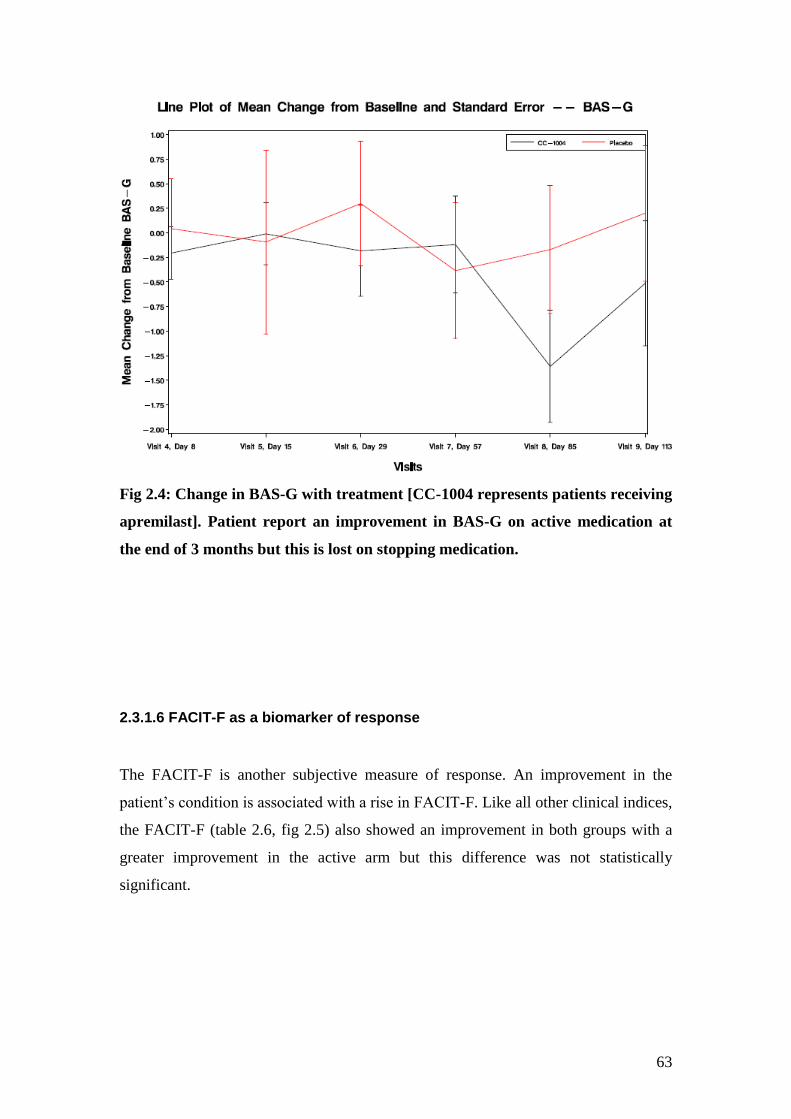
63
Fig 2.4: Change in BAS-G with treatment [CC-1004 represents patients receiving
apremilast]. Patient report an improvement in BAS-G on active medication at
the end of 3 months but this is lost on stopping medication.
2.3.1.6 FACIT-F as a biomarker of response
The FACIT-F is another subjective measure of response. An improvement in the
patient’s condition is associated with a rise in FACIT-F. Like all other clinical indices,
the FACIT-F (table 2.6, fig 2.5) also showed an improvement in both groups with a
greater improvement in the active arm but this difference was not statistically
significant.
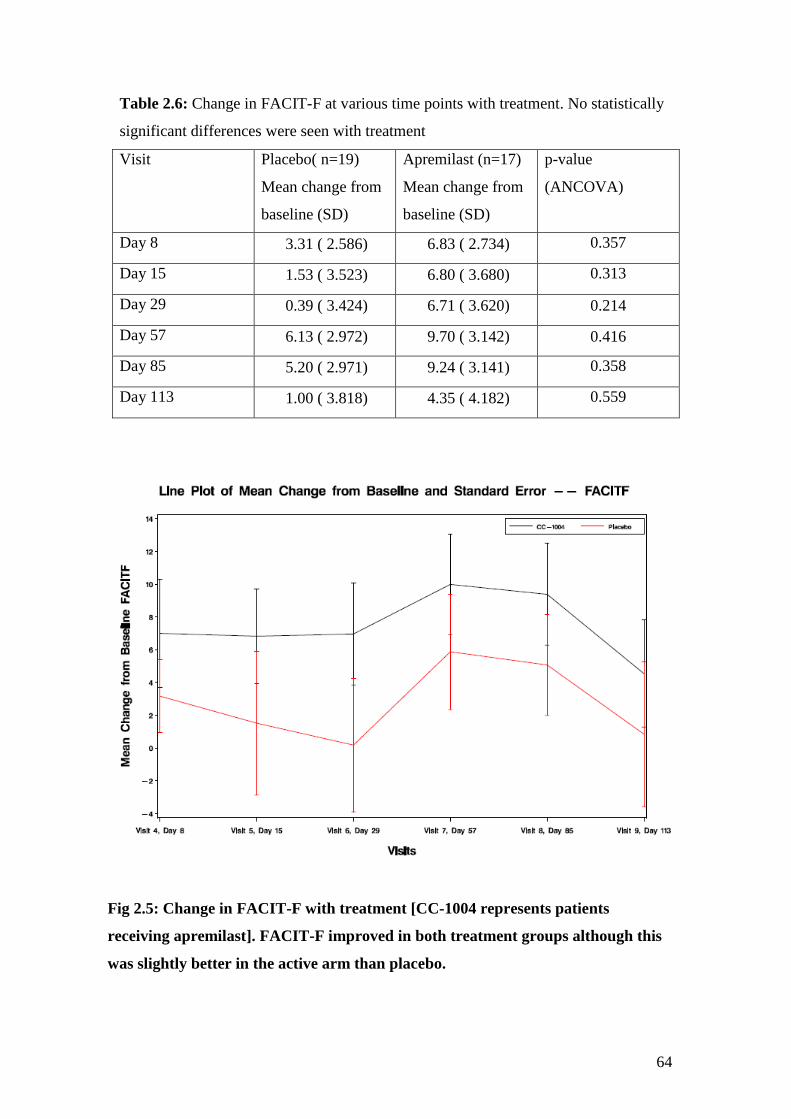
64
Table 2.6: Change in FACIT-F at various time points with treatment. No statistically
significant differences were seen with treatment
Visit Placebo( n=19)
Mean change from
baseline (SD)
Apremilast (n=17)
Mean change from
baseline (SD)
p-value
(ANCOVA)
Day 8 3.31 ( 2.586) 6.83 ( 2.734) 0.357
Day 15 1.53 ( 3.523) 6.80 ( 3.680) 0.313
Day 29 0.39 ( 3.424) 6.71 ( 3.620) 0.214
Day 57 6.13 ( 2.972) 9.70 ( 3.142) 0.416
Day 85 5.20 ( 2.971) 9.24 ( 3.141) 0.358
Day 113 1.00 ( 3.818) 4.35 ( 4.182) 0.559
Fig 2.5: Change in FACIT-F with treatment [CC-1004 represents patients
receiving apremilast]. FACIT-F improved in both treatment groups although this
was slightly better in the active arm than placebo.
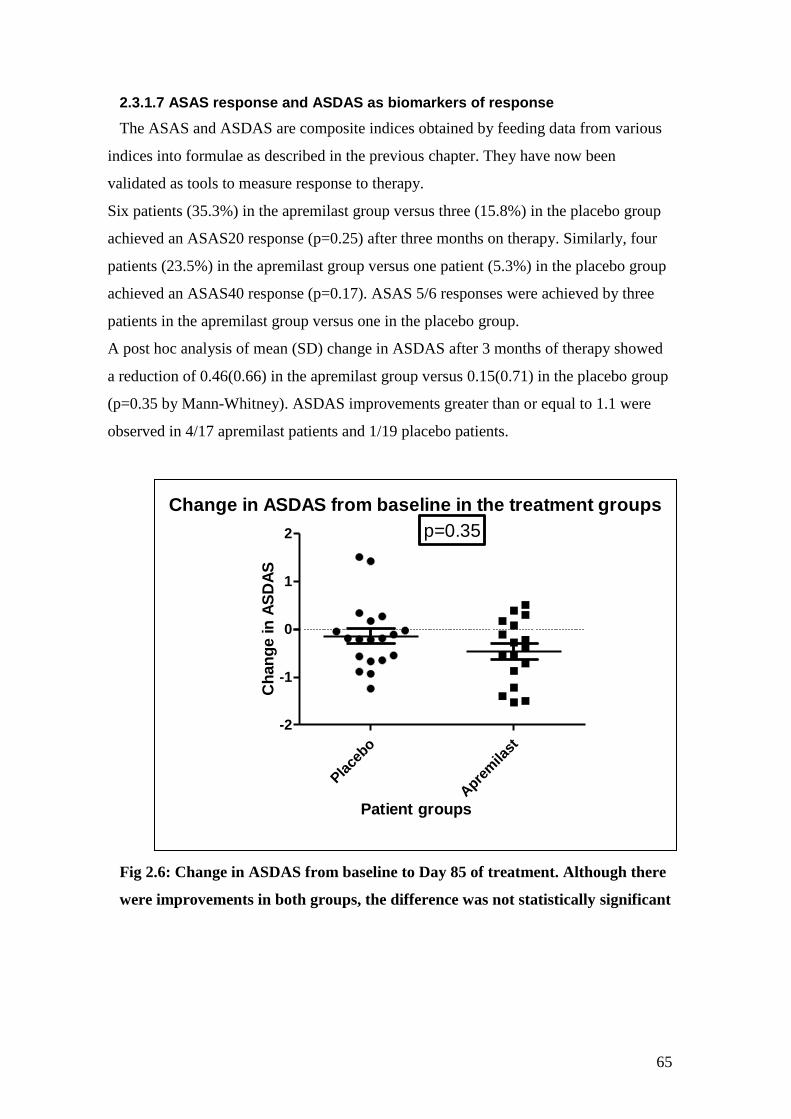
65
2.3.1.7 ASAS response and ASDAS as biomarkers of response
The ASAS and ASDAS are composite indices obtained by feeding data from various
indices into formulae as described in the previous chapter. They have now been
validated as tools to measure response to therapy.
Six patients (35.3%) in the apremilast group versus three (15.8%) in the placebo group
achieved an ASAS20 response (p=0.25) after three months on therapy. Similarly, four
patients (23.5%) in the apremilast group versus one patient (5.3%) in the placebo group
achieved an ASAS40 response (p=0.17). ASAS 5/6 responses were achieved by three
patients in the apremilast group versus one in the placebo group.
A post hoc analysis of mean (SD) change in ASDAS after 3 months of therapy showed
a reduction of 0.46(0.66) in the apremilast group versus 0.15(0.71) in the placebo group
(p=0.35 by Mann-Whitney). ASDAS improvements greater than or equal to 1.1 were
observed in 4/17 apremilast patients and 1/19 placebo patients.
Fig 2.6: Change in ASDAS from baseline to Day 85 of treatment. Although there
were improvements in both groups, the difference was not statistically significant
Change in ASDAS from baseline in the treatment groups
Pla
cebo
Apre
mila
st
-2
-1
0
1
2 p=0.35
Patient groups
Ch
an
ge in
AS
DA
S

66
2.3.2 Anti-TNF cohort
16 patients that were about to start anti-TNF therapy were recruited on ‘The impact of
TNF blockade on effector T cell populations in patients with Rheumatoid arthritis,
Psoriatic Arthritis and Ankylosing Spondylitis treated with anti-TNF therapy’ study.
One patient did not go on to start anti-TNF therapy and hence dropped out of the
study. A further 6 patients were recruited on the “Molecular mechanisms and pathways
in chronic inflammatory and degenerative disease” study. Hence a total of 21 patients
that received anti-TNF therapy were studied over a 3 month period.
2.3.2.1 Baseline characteristics and Patient Demographics:
The cohort consisted of 17 males and 4 female patients. The mean (SD) age of the
patients was 38.2 (9.4) years with a disease duration of 10.9 (9.8) years. Most of the
21 patients were Caucasians but there were 4 Asian and 1 Afro-Caribbean patient. 5
patients had previously participated in the START study before starting anti-TNF
agents. Only 4 out of the 21 patients were treated with etanercept, the soluble TNFα
receptor, with the rest receiving adalimumab, the fully humanized Antibody to TNFα.
2 patients were also receiving concomitant methotrexate and 3 were receiving
sulfasalazine.
The baseline BASDAI in this cohort of patients was 5.6 (2.06) units. The mean
BASFI at baseline was 4.53 (2.07) [n=18] and baseline BASMI was 3.41 (1.62) units.
BAS-G was not recorded in this group of patients; hence ASAS and ASDAS response
could not be calculated in this cohort.
2.3.2.2 Response to anti-TNF therapy using clinical indices
Data was available only at baseline and at the end of 3 months of therapy, hence
paired t-test or Wilcoxon Matched pairs test was applied. All three Bath indices
showed a statistically significant improvement with treatment with anti-TNF therapy.
The detailed results are as shown in table 2.7.

67
Table 2.7: Change in BASDAI, BASFI and BASMI with anti-TNF therapy
Outcome measure Baseline
Mean (SD)
Week 12
Mean (SD)
p-value
BASDAI 5.8 (2.2) 2.6 (2.4) 0.0003
BASFI 4.8 (2.3) 2.7 (2.2) 0.006
BASMI 3.5 (1.7) 2.7 (1.1) 0.001
68
2.4 Discussion
The results from the anti-TNF cohort show that the Bath indices effectively show
change with therapy and are still reliable measures of disease activity in routine
clinical practice. However, this was not the case with apremilast, where the changes
were smaller and failed to achieve statistical significance. It is important to note that
most of the clinical indices show a placebo effect. Of all the indices, the BASFI
showed the smallest improvement with placebo, yet showed an almost statistically
significant improvement in the apremilast group. BASFI may hence be a more
specific marker of response to therapy. The ASAS 20, 40 and 5/6 responses take the
BASFI into account and may hence may also be effective tools to measure response to
therapy. The ASDAS lays more stress on the patient global score which is similar to
the BAS-G. It also takes into account raised CRP levels as well as peripheral disease
which is seen in a small proportion of patients with AS.
The results of the START study show that apremilast may have a role in the
management of AS patients. As this was a pilot study, a 3 month period of
observation was used to assess response assuming that if there was a response, it
would be similar to anti-TNF therapy. However, the data clearly shows that the
response to apremilast is slower and patients do not actually notice an improvement
till 2 months after commencing therapy. If the treatment duration were longer, it may
have been possible to see a further drop in Bath Indices and hence see a statistically
significant response. This short study does however make the case for apremilast to be
studied in further clinical trials as disease modifying therapy in patients with AS. A
recently published phase II study of apremilast in psoriatic arthritis shows that the
drug is also effective in controlling peripheral disease with 43.5% of 165 patients
receiving apremilast 20mg BD and 38.5% of patients receiving apemilast 40mg OD
versus 11.8% of those receiving placebo showed a ACR 20 response [155].
In order to assess the efficacy of this drug in AS further, long term studies are
required which would allow for assessing effect not just on clinical and biochemical
parameters but also on imaging. A further phase III study is now underway using
apremilast in Ankylosing Spondylitis.

69
Chapter 3: Semi-quantitative scoring of lesions on MRI as a biomarker of response to therapy in AS
70
3.1 Introduction
Over the last decade, MRI has played an important part in understanding of disease
pathogenesis. It has also helped with early diagnosis of the condition by showing
areas of bone oedema which would appear normal on plain X-rays. This has led to
MRI taking centre stage in this condition with changes to classification criteria and
the development of a new disease entity called early or non-radiographic
spondyloarthritis [156].
There is a disparity between clinical scores (BASDAI) and MRI findings. This
remains unexplained. More recent reports have shown a correlation between CRP and
ASDAS scores and MRI findings [157]. There is also the issue of scoring changes on
MRI scans with at least 6 different scoring systems being used in different parts of the
world which have been detailed in chapter 1. All of these scoring systems remain
semi-quantitative. They all take into account the area of lesion, giving it a numerical
score depending on the extent of the lesion. More recent modifications have used
change in intensity and involvement of lateral elements as well, giving these systems
more credibility. Although most of these scoring systems have been validated in a
number of studies as reflecting change with therapy, they only estimate changes seen
by semi-quantitative scores. This chapter discusses the utility of Berlin Score as a
biomarker of response to therapy and the problems with semi-quantitative scoring.
Most clinical MRI scans for the spine tend to be restricted to the area of suspected
pathology which in most cases is the sacroiliac joints. However, recent reports have
shown that bone oedema lesions can be seen in other spinal regions as well especially
in the thoracic spine, which is difficult to visualize using X-rays due to overlapping
structures. Hence, imaging of the whole spine along with sacroiliac joints is required
to obtain the clearest picture at a given time point. Most clinical scans use 1.5 Tesla
MRI scanners and subject patients to T1 weighted sequences which helps detect
chronic changes and fatty lesions at areas of previous inflammation as well as STIR
sequences that detects active bone oedema representing inflammation.
71
3.2 Methods
This section describes the development of a scanning protocol for the whole spine and
sacroiliac joints that was used to scan all patients in this study.
3.2.1 Sequence development at 3T
The initial sequence optimization was carried out as part of on an ongoing study of
MRI sequence development by the team at the Robert Steiner Unit, Hammersmith
Hospital. This already had previous ethics approval (08/H0711/82) from the local
ethics committee. This work was done by radiographers Ms Amy McGuinness and
Ms Emer Hughes with guidance from Dr Anshul Rastogi and Dr Adrian Lim. Prof Jo
Hajnal provided the technical advice on this project. I took over from Dr Rastogi,
recruiting patients for image optimization and coordinating between the radiographers
and radiologists. A 3T scanner was used because the same scanner had previously
been used for optimization for imaging the wrist in Rheumatoid arthritis in work
undertaken by Dr Rastogi in the department. Images obtained previously on the 1.5T
scanner were not of optimum quality and hence this scanner was not used.
The MRI protocol for whole spine and sacroiliac joints was devised by scanning 9
healthy volunteers and 5 patients on a 3 Tesla (3T) MRI Philips Achieva system using
an 8 channel spine coil at the Robert Steiner Unit. Standard Phillips moving table
protocols were implemented consisting of T1 weighted STIR, Spectral fat suppression
sequence (SPIR) and PROSET (fat or water selective excitation) sequences.
Optimization for the 3T system was performed exploring a range of different
repetition times (TR) for the T1 weighted sequence (200-500ms) and a range of
differing inversion times (TI) for the STIR sequence (60-300ms).
The standard Philips PROSET sequence was applied with comparative optimisation
being performed from the previous WRIST RA parameters. This included using
different TRs and flip angles (FA). SPIR was found to be relatively unreliable using
the 3T system for large field of view spine protocols and therefore omitted from the
final protocol.
72
Further optimization of all sequences was performed in order to minimize the effect
from image artefacts and subject motions (voluntary-swallowing and involuntary –
vascular flow, respiration and peristaltic bowel movements). This included exploring
different shim settings (pencil beam/ volume shim) and the application of saturation
bands over the areas of motion.
Different resolution and signal to noise ratio (SNR) qualitative assessments were done
to look at improving resolution of the spine images with various voxel sizes (0.9 mm
to 1.5mm) and different Sensitivity Encoding (SENSE) settings.
The efficiency of whole spine scanning was also explored. The protocol required 3
sequences at 4 contiguous vertebral locations to be obtained. Table movement
between spinal segments takes time, therefore to improve patient comfort and
decrease table movements the scanning order was modified from acquiring all T1W
sequences, then all STIR sequences followed by all PROSET sequences, to scanning
all 3 weightings at each of the 4 spinal levels. This decreased the number of table
movements from 9 to 3, decreasing the overall scan time. Individual region scanning
was followed by fusion using the Philips post processing tool mobiview.
The protocol was further modified by Ms Amy McGuinness in conjunction with Dr
Adrian Lim, Consultant Musculoskeletal Radiologist, to increase the signal to noise
ratio and optimize the window width and level of the final images to ensure a
successful transfer of images to the PACS system.
The voxel size was increased to 1.25mm from 1.1mm. The field of view was also
increased from 264x264mm to 320x300mm. SENSE was turned off and saturation
bands turned on, improving the quality of images. A further 5 AS patients were
scanned on the modified protocol before and after anti-TNF therapy. The scans were
then scored by 2 musculoskeletal radiologists who felt there was a significant change
in signal using this protocol as against the previous protocol.
The protocol was then applied to scan study patients to obtain images of the whole
spine and sacroiliac joints at screening and on completion of 12 weeks of therapy. T1
weighted and STIR sequences were obtained of the whole spine and sacroiliac joints.

73
Additional Proset sequences were obtained for the sacroiliac joints. Scans were
reported by Dr Adrian Lim to confirm that patient had evidence of active bone
oedema at screening.
3.2.2 Scanning protocol
The following standard operating procedure was followed by the radiographers while
scanning patients using the Philips scanner.
1. Find protocol (spine START study)
2. Centre mid cervical spine ~ C5 i.e. midway between sternal notch (T2) and
angle of mandible (C3).
3. Run moving table sagittal survey – fuse 3 regions into whole sagittal spine
image in advanced viewing.
4. Position coronal off fused saggital whole spine image.
5. Fuse 3 coronal regions into whole spine coronal image in advanced viewing.
6. Open ‘3 region planning’ sequence. (30mm overlapping). NB. DO NOT RUN.
This sequence is for setting up only.
7. Position on fused saggital and coronal whole spine images along the midline
of the spine to include whole spine from Left (L) to Right (R), Foot Head
(FH).
8. In Offsets/ angulations (off/ang) note offsets for all 3 stacks (A, B and C) in
FH, antero-posterior (AP) and right to left (RL) directions.
9. Reference Scans - Copy offset FH positions for stack A, B and C
10. Set up C-spine – enter offsets/ang for stack C
11. Set up T-spine – enter offsets/ang for stack B
12. Set up L-spine – enter offsets/ang for stack A
This will automatically change the offsets for all sequences with the same
geometry. The software tool, Scan Align, was used to position the cervical,
thoracic and lumbar sagittal stacks contiguously.
13. Set up axial survey through sacrum.
14. Position coronal SIJ field of view (FOV) and run sequences.
Confirm coverage of
vertebral bodies from L-R
74
15. SIJ - Proset shim test – a quick low resolution scan to accurately position our
pencil beam (pb) volume shim voxel. This determines correct excitation of the
water signal in an inhomogeneous B0.
-position pb volume shim voxel to cover the whole of the spine. i.e. from the
front of the vertebral bodies to the spinous process, R to L and the FOV
superiorly to inferiorly.
- run shim test and view image noting quality of saturation of fat. Note that
this needs to be homogenous along the whole FOV. If not then
reposition/change FOV of pb volume shim voxel and rerun test and fat
excitation review.
16. If no signal from fat is present – run coronal proset sequence. Check coverage.
17. Fusing 3 regions into whole spine:
- Advanced viewing
- Select C, T and L spine of the same sequence. i.e. T1, STIR.
- Right mouse click – mobiview
- Scroll through images, changing window width (WW) and window level
(WL) as appropriate
- Click smooth fusing icon
- Store fused images
18. If there are neural anomalies or disc prolapses identified run T2W fast field
echo (FFE) axial scans through region of interest. (Parallel to the intervertebral
disc space, including the exit foramina superiorly for disc or whole lesion in HF
direction).
19. Send all images to mridb, DVD queue # 4 and burn a DVD labelled with
patient number and time point. Fused mobiview images and SIJ Proset sequence
should be sent to PACS for reporting.
3.2.3 Patient cohorts
All patients that consented to the START study, who did not have any contra-
indications to MRI scanning, were subjected to a scan at screening and all 36 who
completed the study had a further scan at 12 weeks after treatment with either
Apremilast or placebo. With the anti-TNF cohort, all patients consented to the study
entitled ‘The impact of TNF blockade on effector T cell populations in patients with
75
Rheumatoid arthritis, Psoriatic Arthritis and Ankylosing Spondylitis treated with anti-
TNF therapy’, were offered MRI scans before and after treatment but this was not
essential to their participation in the study. Patients recruited on the study entitled
“Molecular mechanisms and pathways in chronic inflammatory and degenerative
disease” were also subjected to MRI scanning at baseline and 3 months after anti-TNF
therapy.
3.2.4 Anonymization of scans
All scans were anonymized for patient identity. Pre and post treatment scans were
randomly annotated as scan A or B. The radiologists that scored the scans were
unaware of what treatment the patient had received. This allowed for blinding of the
individuals scoring the scans.
3.2.5 Scoring using Berlin method
All scans were scored using the Berlin Score by Dr Adrian Lim and Dr Keshthra
Satchithananda, Consultant musculoskeletal radiologists, with both radiologists
conferring with each other before scoring the scans together. The Berlin score was
chosen by the radiologists as they felt this was easy to use and a quicker method of
scoring than other scoring systems. This has been detailed previously in chapter 1.
Briefly, each spinal segment was scored between 0-3 and the total spinal score out of
69 was calculated. Similarly, each side of the sacroiliac joint was scored between 0-3
and a total score was calculated out of 12. All scores were added to calculate total
spinal and SIJ scores. These in turn were added to give the total MRI score. Pre and
post treatment scores were compared using paired t-test or Wilcoxon matched pairs
test in the anti-TNF cohort and by ANCOVA for the START study.
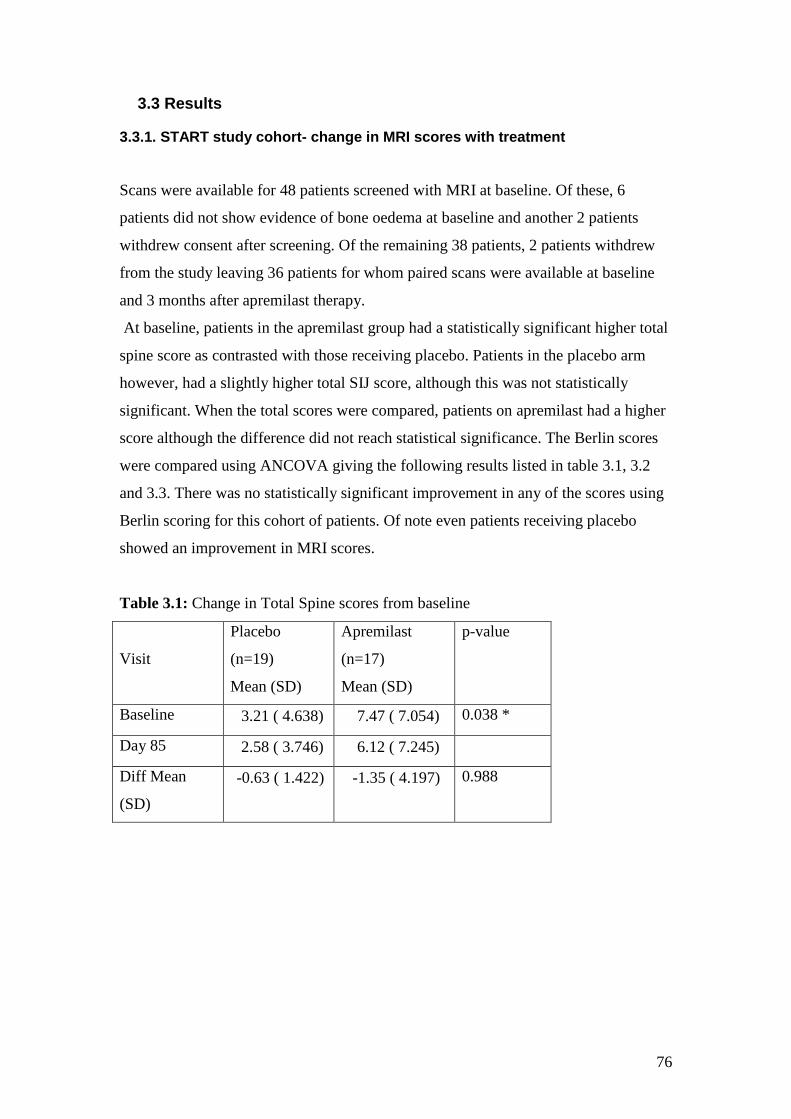
76
3.3 Results
3.3.1. START study cohort- change in MRI scores with treatment
Scans were available for 48 patients screened with MRI at baseline. Of these, 6
patients did not show evidence of bone oedema at baseline and another 2 patients
withdrew consent after screening. Of the remaining 38 patients, 2 patients withdrew
from the study leaving 36 patients for whom paired scans were available at baseline
and 3 months after apremilast therapy.
At baseline, patients in the apremilast group had a statistically significant higher total
spine score as contrasted with those receiving placebo. Patients in the placebo arm
however, had a slightly higher total SIJ score, although this was not statistically
significant. When the total scores were compared, patients on apremilast had a higher
score although the difference did not reach statistical significance. The Berlin scores
were compared using ANCOVA giving the following results listed in table 3.1, 3.2
and 3.3. There was no statistically significant improvement in any of the scores using
Berlin scoring for this cohort of patients. Of note even patients receiving placebo
showed an improvement in MRI scores.
Table 3.1: Change in Total Spine scores from baseline
Visit
Placebo
(n=19)
Mean (SD)
Apremilast
(n=17)
Mean (SD)
p-value
Baseline 3.21 ( 4.638) 7.47 ( 7.054) 0.038 *
Day 85 2.58 ( 3.746) 6.12 ( 7.245)
Diff Mean
(SD)
-0.63 ( 1.422) -1.35 ( 4.197) 0.988
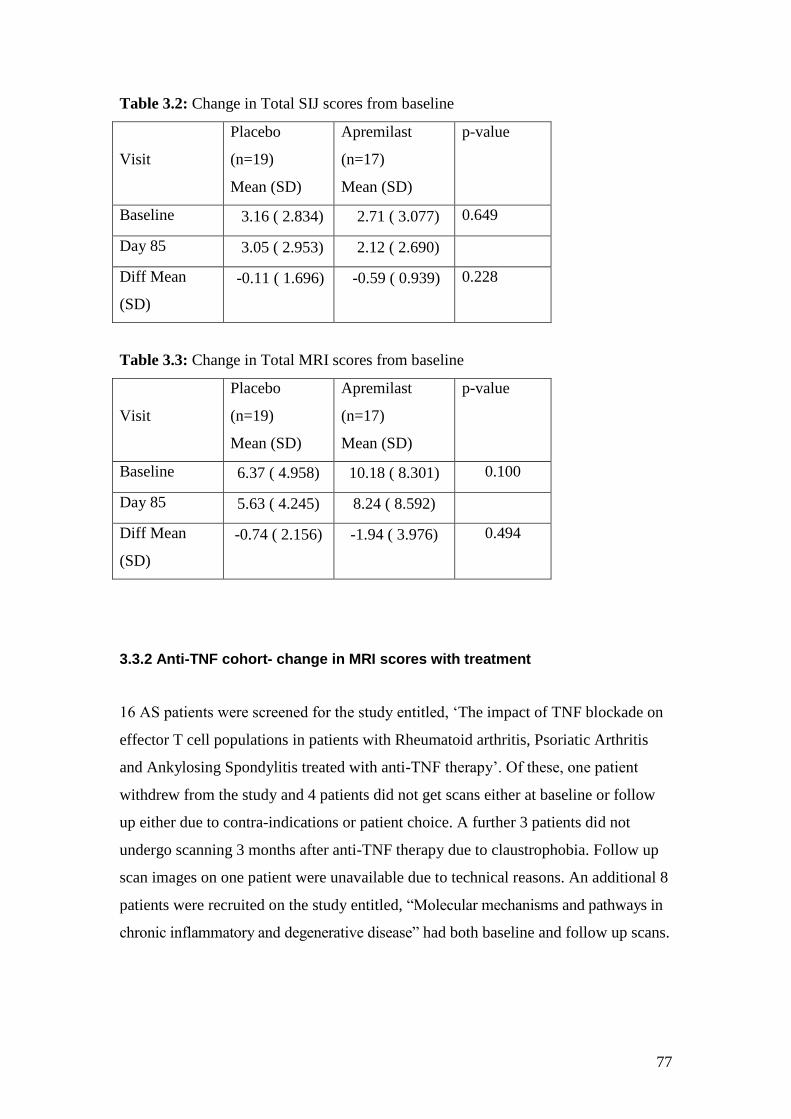
77
Table 3.2: Change in Total SIJ scores from baseline
Visit
Placebo
(n=19)
Mean (SD)
Apremilast
(n=17)
Mean (SD)
p-value
Baseline 3.16 ( 2.834) 2.71 ( 3.077) 0.649
Day 85 3.05 ( 2.953) 2.12 ( 2.690)
Diff Mean
(SD)
-0.11 ( 1.696) -0.59 ( 0.939) 0.228
Table 3.3: Change in Total MRI scores from baseline
Visit
Placebo
(n=19)
Mean (SD)
Apremilast
(n=17)
Mean (SD)
p-value
Baseline 6.37 ( 4.958) 10.18 ( 8.301) 0.100
Day 85 5.63 ( 4.245) 8.24 ( 8.592)
Diff Mean
(SD)
-0.74 ( 2.156) -1.94 ( 3.976) 0.494
3.3.2 Anti-TNF cohort- change in MRI scores with treatment
16 AS patients were screened for the study entitled, ‘The impact of TNF blockade on
effector T cell populations in patients with Rheumatoid arthritis, Psoriatic Arthritis
and Ankylosing Spondylitis treated with anti-TNF therapy’. Of these, one patient
withdrew from the study and 4 patients did not get scans either at baseline or follow
up either due to contra-indications or patient choice. A further 3 patients did not
undergo scanning 3 months after anti-TNF therapy due to claustrophobia. Follow up
scan images on one patient were unavailable due to technical reasons. An additional 8
patients were recruited on the study entitled, “Molecular mechanisms and pathways in
chronic inflammatory and degenerative disease” had both baseline and follow up scans.
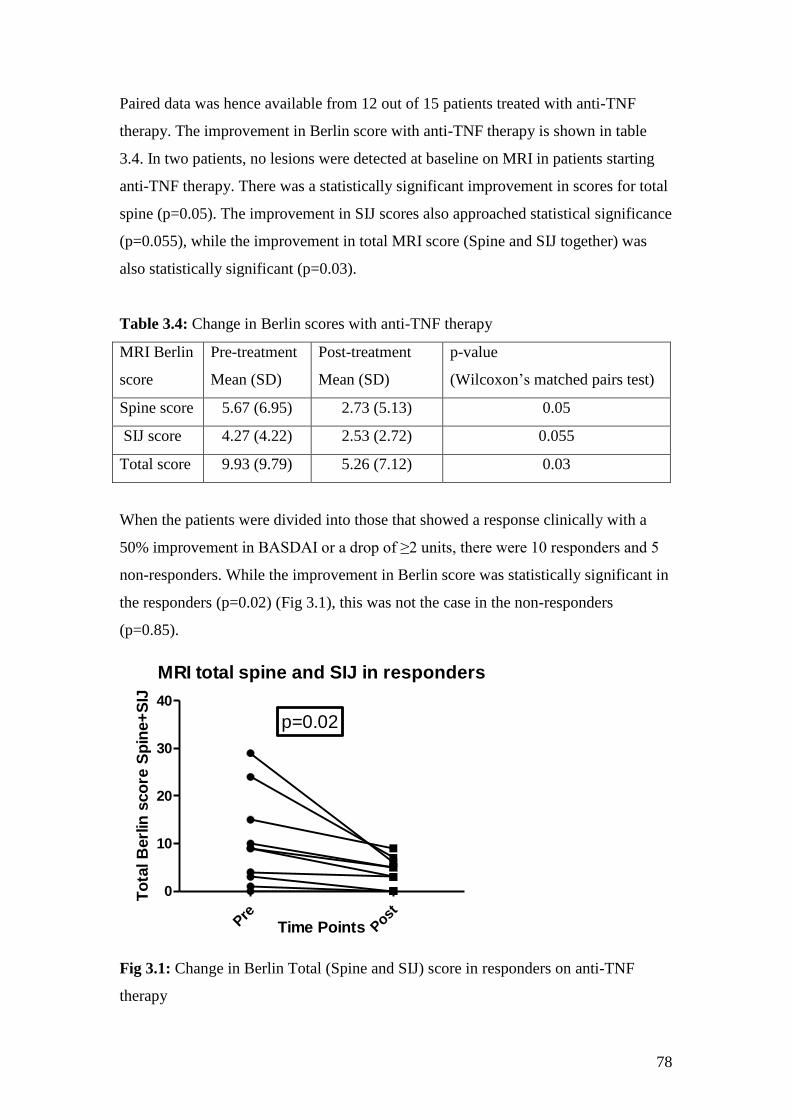
78
Paired data was hence available from 12 out of 15 patients treated with anti-TNF
therapy. The improvement in Berlin score with anti-TNF therapy is shown in table
3.4. In two patients, no lesions were detected at baseline on MRI in patients starting
anti-TNF therapy. There was a statistically significant improvement in scores for total
spine (p=0.05). The improvement in SIJ scores also approached statistical significance
(p=0.055), while the improvement in total MRI score (Spine and SIJ together) was
also statistically significant (p=0.03).
Table 3.4: Change in Berlin scores with anti-TNF therapy
MRI Berlin
score
Pre-treatment
Mean (SD)
Post-treatment
Mean (SD)
p-value
(Wilcoxon’s matched pairs test)
Spine score 5.67 (6.95) 2.73 (5.13) 0.05
SIJ score 4.27 (4.22) 2.53 (2.72) 0.055
Total score 9.93 (9.79) 5.26 (7.12) 0.03
When the patients were divided into those that showed a response clinically with a
50% improvement in BASDAI or a drop of ≥2 units, there were 10 responders and 5
non-responders. While the improvement in Berlin score was statistically significant in
the responders (p=0.02) (Fig 3.1), this was not the case in the non-responders
(p=0.85).
MRI total spine and SIJ in responders
Pre
Post
0
10
20
30
40
p=0.02
Time Points
To
tal B
erl
in s
co
re S
pin
e+
SIJ
Fig 3.1: Change in Berlin Total (Spine and SIJ) score in responders on anti-TNF
therapy
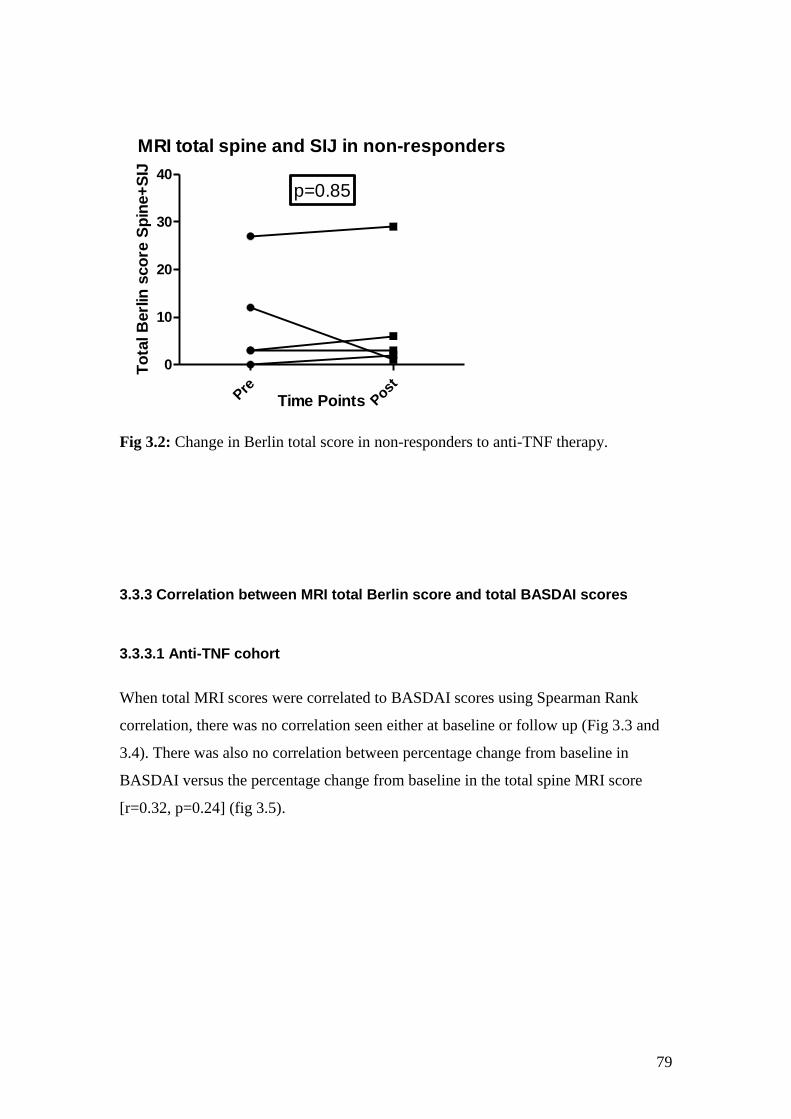
79
MRI total spine and SIJ in non-responders
Pre
Post
0
10
20
30
40
p=0.85
Time Points
To
tal B
erl
in s
co
re S
pin
e+
SIJ
Fig 3.2: Change in Berlin total score in non-responders to anti-TNF therapy.
3.3.3 Correlation between MRI total Berlin score and total BASDAI scores
3.3.3.1 Anti-TNF cohort
When total MRI scores were correlated to BASDAI scores using Spearman Rank
correlation, there was no correlation seen either at baseline or follow up (Fig 3.3 and
3.4). There was also no correlation between percentage change from baseline in
BASDAI versus the percentage change from baseline in the total spine MRI score
[r=0.32, p=0.24] (fig 3.5).
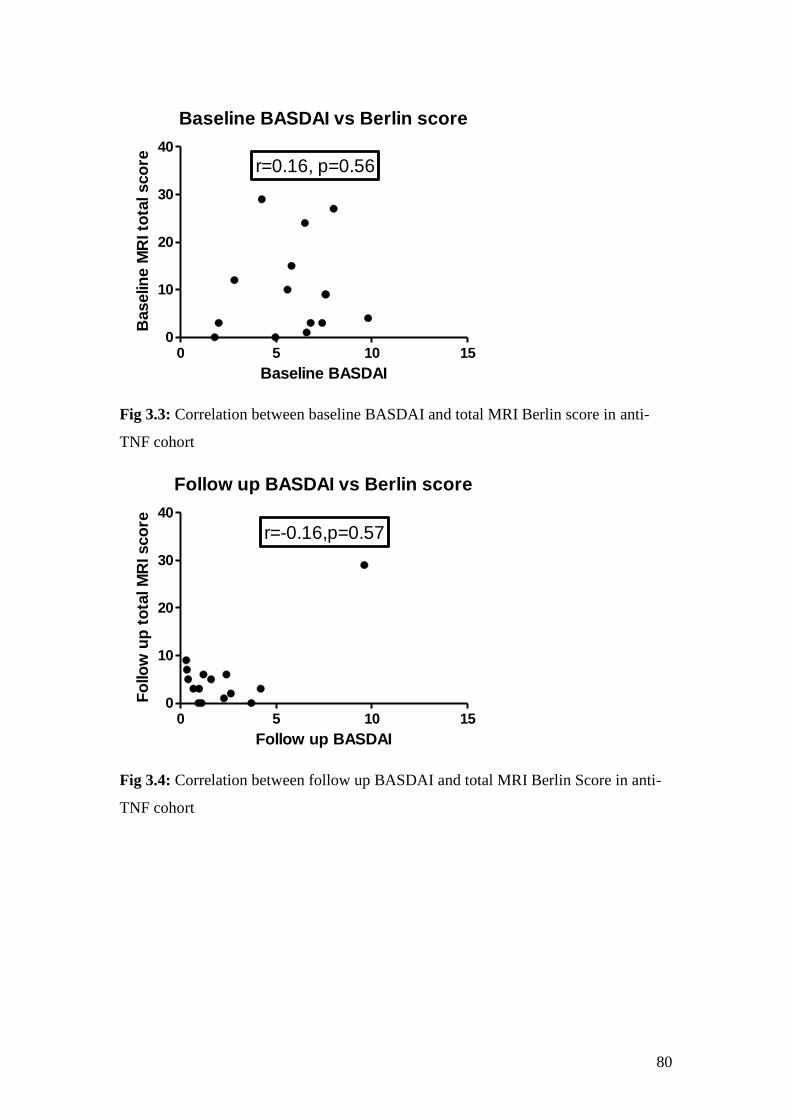
80
Baseline BASDAI vs Berlin score
0 5 10 150
10
20
30
40
r=0.16, p=0.56
Baseline BASDAI
Baselin
e M
RI to
tal sco
re
Fig 3.3: Correlation between baseline BASDAI and total MRI Berlin score in anti-
TNF cohort
Follow up BASDAI vs Berlin score
0 5 10 150
10
20
30
40
r=-0.16,p=0.57
Follow up BASDAI
Fo
llo
w u
p t
ota
l M
RI sco
re
Fig 3.4: Correlation between follow up BASDAI and total MRI Berlin Score in anti-
TNF cohort
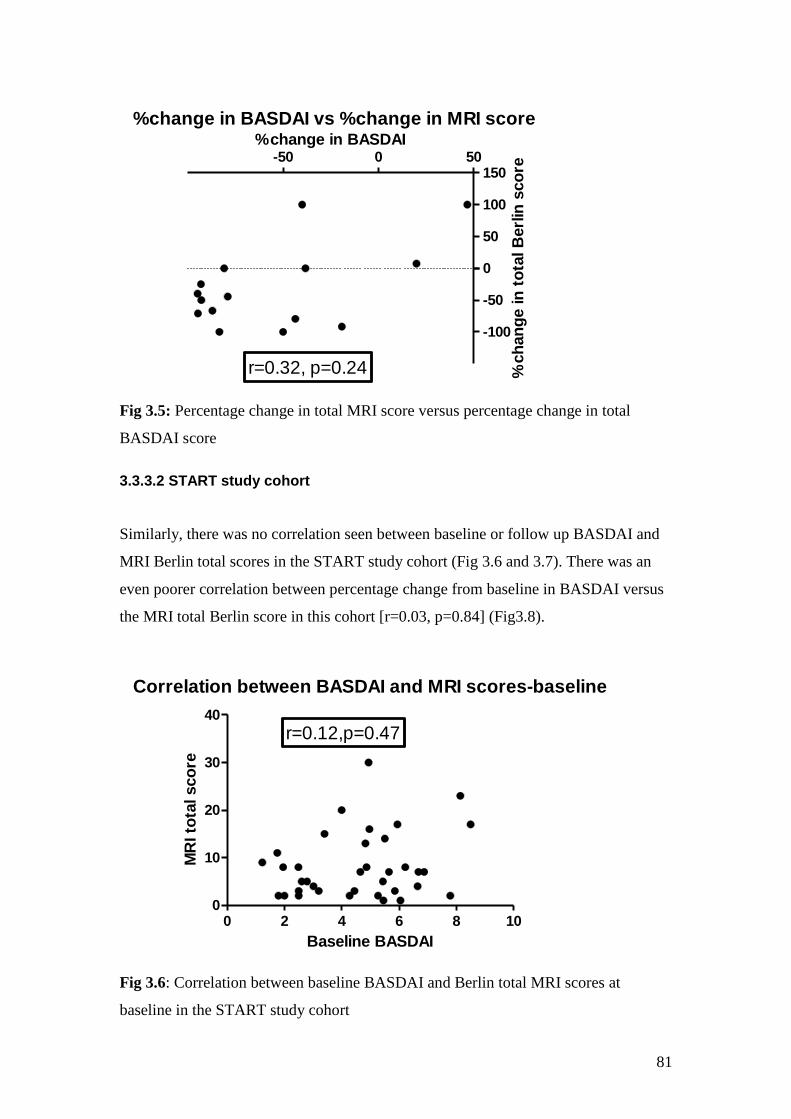
81
%change in BASDAI vs %change in MRI score
-50 0 50
-100
-50
0
50
100
150
r=0.32, p=0.24
%change in BASDAI
%ch
an
ge in
to
tal B
erl
in s
co
re
Fig 3.5: Percentage change in total MRI score versus percentage change in total
BASDAI score
3.3.3.2 START study cohort
Similarly, there was no correlation seen between baseline or follow up BASDAI and
MRI Berlin total scores in the START study cohort (Fig 3.6 and 3.7). There was an
even poorer correlation between percentage change from baseline in BASDAI versus
the MRI total Berlin score in this cohort [r=0.03, p=0.84] (Fig3.8).
Correlation between BASDAI and MRI scores-baseline
0 2 4 6 8 100
10
20
30
40
r=0.12,p=0.47
Baseline BASDAI
MR
I to
tal sco
re
Fig 3.6: Correlation between baseline BASDAI and Berlin total MRI scores at
baseline in the START study cohort
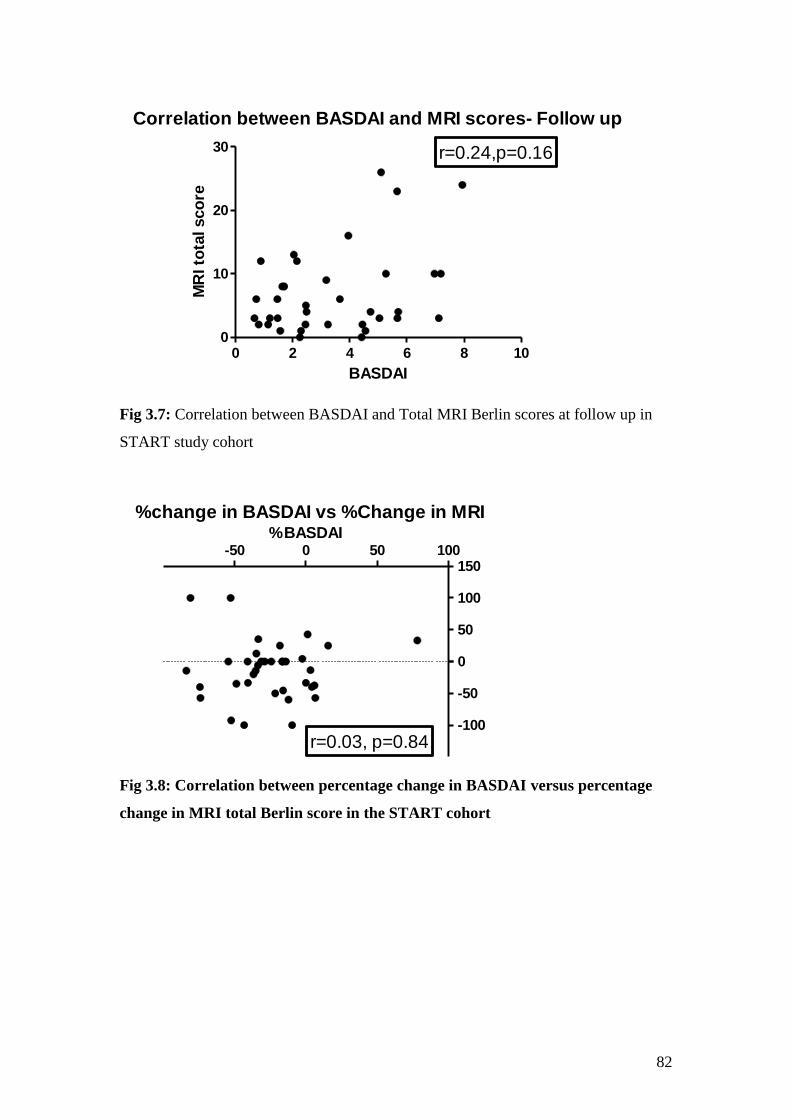
82
Correlation between BASDAI and MRI scores- Follow up
0 2 4 6 8 100
10
20
30 r=0.24,p=0.16
BASDAI
MR
I to
tal sco
re
Fig 3.7: Correlation between BASDAI and Total MRI Berlin scores at follow up in
START study cohort
%change in BASDAI vs %Change in MRI
-50 0 50 100
-100
-50
0
50
100
150
r=0.03, p=0.84
%BASDAI
Fig 3.8: Correlation between percentage change in BASDAI versus percentage
change in MRI total Berlin score in the START cohort
83
3.4 Discussion
The Berlin MRI scoring system was selected for this study as it is relatively easy to
use. The patients were being followed up over a period of 3 months where chronic
changes were unlikely to develop and hence the original ASspiMRI scoring system
described by Braun et al which provided a score between 1-6 for both activity and
chronicity would not be applicable. As we developed our own scanning protocol, we
did not follow the recommended protocol for SPARCC scoring and hence were
unable to apply this method for scoring scans. This system has the advantage of
scoring only 6 areas which are taken as representative of the entire scan. Also the
protocol did not allow for complete visualization of the transverse processes and
hence other systems such as SPARCC or the Aarhus-Madsen system could not be
applied.
One of the important aspects that this study highlights is the absence of active bone
oedema lesions on MRI at baseline in patients starting anti-TNF therapy. These are
patients with BASDAI scores of above 4 which clearly show the disparity between
clinical and imaging biomarkers. Similarly, 6 patients screened for the START study
also showed no active bone oedema lesions in spite of qualifying for the study on
clinical scores. This may be due to the fact that the protocol did not allow for
visualization of the posterior and transverse elements hence missing lesions in these
areas. However, it is also possible that MRI is just not as sensitive a biomarker as we
would like and does not always show evidence of active disease in AS patients. This
has already been shown in other histopathological studies where there was evidence
of active inflammation even though the MRI did not show bone oedema. Perhaps, the
sequences used for scanning need further development to better identify areas of
inflammation on MRI scans.
This also leads on to the lack of correlation between improvement in clinical and MRI
scores in both patient cohorts. It is not clear whether there is a lag in improvement in
the MRI lesions or just a disparity between what the patient scores on clinical
questionnaires and what is seen on the MRI. A long term study of repeated MRI scans
in patients on effective therapy may be able to answer this question. An important

84
factor to consider is the fact that Berlin scoring only takes into account the relative
improvement in area of the lesion with scores only changing when there is >25%
relative improvement in the area of the lesion. It does not take into account the more
subtle improvement both in area or intensity of the lesion which may correlate to an
improvement in clinical scores. There is hence a case for developing a more robust
quantitative volumetric analysis which would allow us to study exact improvements in
area or volume as well as intensity of lesions. These can then be correlated to the
clinical scores which remain gold standards for assessing response to therapy. The
difficulty with such a volumetric analysis remains the fact that most MRI scanning
protocols usually scan patients taking images in the form of slices with gaps between
the two slices. This is because scanning without gaps takes much longer especially if
large sections of the body are to be scanned. Scanning with gaps would hence not
allow for a true volumetric analysis to be carried out unless there was a way to take
these gaps into account and calculate volumes. Chapter 5 and 6 detail my attempts at
carrying out volumetric analysis on our 2 patient cohorts using the current protocol.
85
Chapter 4: Laboratory biomarkers of response to therapy in Ankylosing Spondylitis
86
4.1 Introduction
Unlike clinical and imaging biomarkers which have been found to be useful in
monitoring response to treatment in routine clinical management of AS, laboratory
biomarkers largely remain research tools and are not routinely measured in day to day
practice. The classical acute phase response markers such as ESR and CRP may be
elevated in a minority of AS patients but this is not so for the majority and therefore at
the cohort level, as well as in the case of most individuals, they represent poor
markers of response. IgA has been shown to be elevated in this group of patients but
is again not routinely measured as a marker of response to therapy.
In this chapter, I discuss the different classes of laboratory biomarkers in addition to
traditional markers such as ESR, CRP and IgA. The first class of biomarkers relates to
bone biology which is important as bone formation is central to this condition. The
second class relates to cytokines and growth factors. These are detailed further in
relevant sections below.
4.2 Methods
4.2.1 Patient cohorts
Similar to the clinical and imaging data, laboratory biomarkers were studied in 2
separate cohorts. These include the START study cohort and the anti-TNF cohort
detailed in chapter 2.
4.2.1.1 START study cohort
As detailed previously, this included 36 patients that were randomised to receive
either apremilast (n=17) or placebo (n=19). The laboratory biomarkers were studied
only at baseline and at 12 weeks on study medication i.e. just before withdrawal of the
study drug. Although samples were collected at all other time points during the study,
they were not analyzed due to cost and time constraints.
87
4.2.1.2 Anti-TNF cohort
This included 15 AS patients recruited to the study, ‘The impact of TNF blockade on
effector T cell populations in patients with Rheumatoid arthritis, Psoriatic Arthritis
and Ankylosing Spondylitis treated with anti-TNF therapy’ [EudraCT No: 2009-
012424-87]. In addition, 4 others were recruited on the study entitled “Molecular
mechanisms and pathways in chronic inflammatory and degenerative disease”. The
patient characteristics of this cohort are described in section 2.3.2. Samples were
analyzed at baseline and 12 weeks after anti-TNF therapy.
4.2.2 ESR, CRP and IgA levels
Routine biochemistry including CRP and haematology including ESR were performed
at all patient visits by the laboratory at Charing Cross Hospital, Imperial College
Healthcare NHS Trust. Additionally, serum IgA levels were also processed at baseline
and 12 weeks after starting therapy. The normal range for CRP was considered up to
5mg/L at the start of the study. However, the biochemistry laboratory changed its
assay within a few months of start of the study to the highly sensitive CRP assay
allowing detection of levels as low as 0.5mg/L.
4.2.3 Bone biomarkers
These were measured by me using enzyme-linked immunosorbent assays (ELISAs) at
the Kennedy Institute in the laboratory of Mr Peter Charles assisted by his
technicians, Ms Erin Paterson and Ms Muslima Chowdhury. Blood samples were
centrifuged at 1300g for 15 minutes within 2 hours of sampling with serum and
plasma samples stored at -80oC. The following commercially available ELISA assays
were used: Osteocalcin, Tartarate resistant acid phosphatase (TRAP5b),
Osteoprotegrin (OPG) and Bone alkaline phosphatase (BAP) [MicroVue Bone Health,
Quidel Corporation, CA, USA], Matrix metalloproteinase 3 (MMP-3) [Quantikine ,
88
R&D systems, Abingdon, UK] and Human serum Receptor Activator of NF-κB
Ligand (sRANKL)[ Peprotech Inc, NJ, USA] . Commercially available DuoSet
ELISA development system [R&D systems] was used to measure DKK-1 levels in
serum. A sandwich ELISA protocol was developed using R& D Systems
Recombinant Human Sclerostin, Biotinylated Anti-human Sclerostin antibody (1:500
dilution) and monoclonal anti-human Sclerostin antibody (2μg/ml) to measure
sclerostin levels in plasma and serum. Further details of individual assays are shown
in table 4.1.
5 of the 8 analytes were tested using a sandwich ELISA. While the assays for OPG
and MMP3 used pre-coated plates, assays for RANKL, Dkk-1 and sclerostin involved
coating plates with a capture antibody overnight at 4oC. Any unbound antibody was
then washed away and a blocking reagent was added. This was then washed off and
the samples, standards and controls, if provided, were added for a short incubation
period to capture the analyte. The unbound analyte was then washed away and a
conjugated detection antibody, which is directed to a different epitope on the analyte,
was added. .Following incubation, unbound antibody was washed away and an
amplification agent (e.g. Streptavidin Horseradish peroxidase) was added which
bound to the conjugated antibody. Following a further wash, addition of the assay
recommended substrate, (e.g. hydrogen peroxide and tetramethylbenzidine) causes a
change in colour. In order to stop the reaction, the assay recommended stop solution
(e.g. 2N sulphuric acid) was added which caused a further change in colour. The
absorbance was measured using Spectrophotometry at appropriate wavelength
(450nm for TMB) using microtiter plate reader software Mikrowin 2000.
TRAP5b and BAP were measured by direct immunocapture assays. Here the antibody
binding to the analyte was coated on to the micro plate well. When the sample was
added to the well, the analyte present in serum bound the antibody directly. The
enzyme activity of the analyte in the sample was then detected using the substrate, in
this case p-Nitrophenyl phosphate, which resulted in a colour change. 0.5N NaOH
was used as stop solution. Optical density was measured at 405nm.
89
The osteocalcin assay was a competitive assay. Here the microplate wells were coated
already with osteocalcin which competed with the osteocalcin present in the sample to
bind to the anti-osteocalcin antibody. Goat anti-mouse IgG antibody conjugated to
alkaline phosphatase was then added which bound to the already bound anti-
osteocalcin antibody. P-Nitrophenyl phosphate was used as the substrate for this assay
with 0.5N NaOH as the stop solution. Optical density was measured as before at
405nm.
Samples were run at 3 different time points through the study period in batches prior
to unblinding in the case of the START study cohort. Pre and post-treatment samples
for each patient were run together on the same ELISA plate to reduce variance. Each
sample was run in duplicate. Concentration values of analytes were calculated by non-
linear regression (curve fit) with variable slope using GraphPad Prism software. The
average concentration was then calculated for each sample and this value was used for
further analysis.
Levels of sclerostin were initially measured in the plasma in the START cohort. This
was because when levels of sclerostin were measured in normal volunteers comparing
plasma and serum samples, levels were found to be higher in plasma and within
quantifiable range in most samples. However, as there were no plasma samples
available in most of the anti-TNF cohort, levels of sclerostin were measured in serum
as well in the START cohort in order to make direct comparisons between the 2
cohorts.
The normal ranges, sensitivity and coefficient of variation for the commercially
available assays are shown in table 4.2.
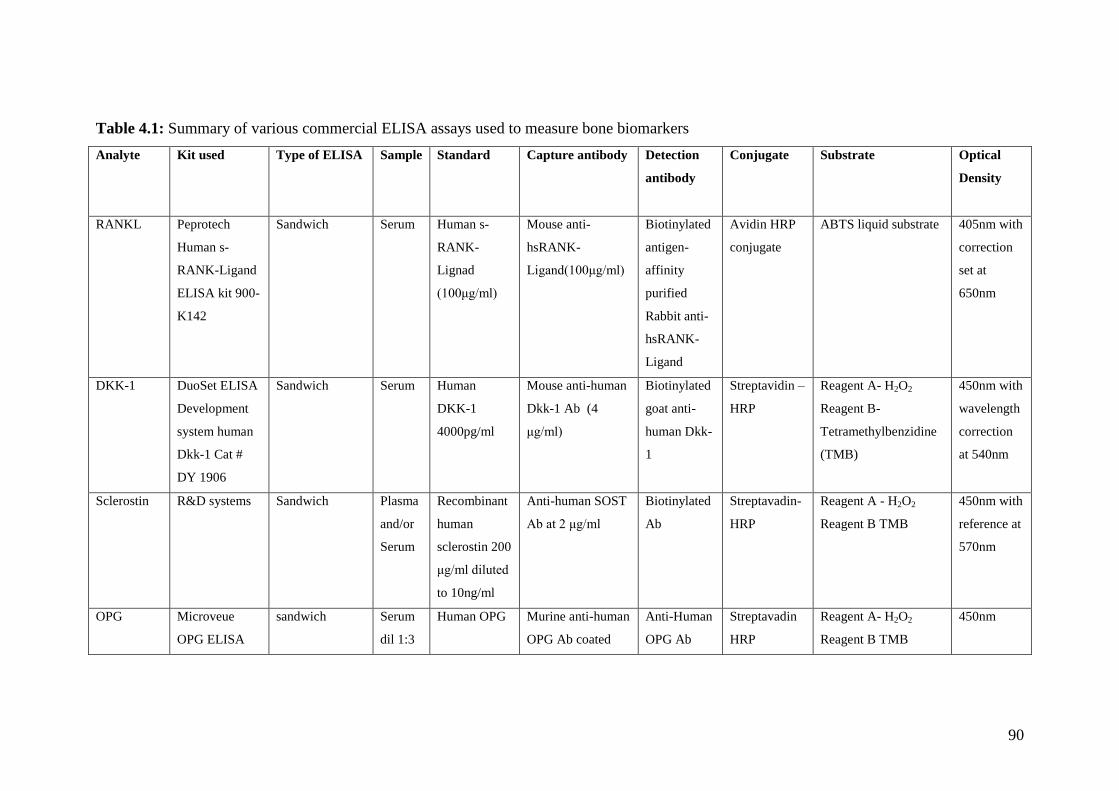
90
Table 4.1: Summary of various commercial ELISA assays used to measure bone biomarkers
Analyte
Kit used
Type of ELISA
Sample
Standard Capture antibody
Detection
antibody
Conjugate Substrate
Optical
Density
RANKL Peprotech
Human s-
RANK-Ligand
ELISA kit 900-
K142
Sandwich Serum Human s-
RANK-
Lignad
(100μg/ml)
Mouse anti-
hsRANK-
Ligand(100μg/ml)
Biotinylated
antigen-
affinity
purified
Rabbit anti-
hsRANK-
Ligand
Avidin HRP
conjugate
ABTS liquid substrate 405nm with
correction
set at
650nm
DKK-1 DuoSet ELISA
Development
system human
Dkk-1 Cat #
DY 1906
Sandwich Serum Human
DKK-1
4000pg/ml
Mouse anti-human
Dkk-1 Ab (4
μg/ml)
Biotinylated
goat anti-
human Dkk-
1
Streptavidin –
HRP
Reagent A- H2O2
Reagent B-
Tetramethylbenzidine
(TMB)
450nm with
wavelength
correction
at 540nm
Sclerostin R&D systems Sandwich Plasma
and/or
Serum
Recombinant
human
sclerostin 200
μg/ml diluted
to 10ng/ml
Anti-human SOST
Ab at 2 μg/ml
Biotinylated
Ab
Streptavadin-
HRP
Reagent A - H2O2
Reagent B TMB
450nm with
reference at
570nm
OPG Microveue
OPG ELISA
sandwich Serum
dil 1:3
Human OPG Murine anti-human
OPG Ab coated
Anti-Human
OPG Ab
Streptavadin
HRP
Reagent A- H2O2
Reagent B TMB
450nm
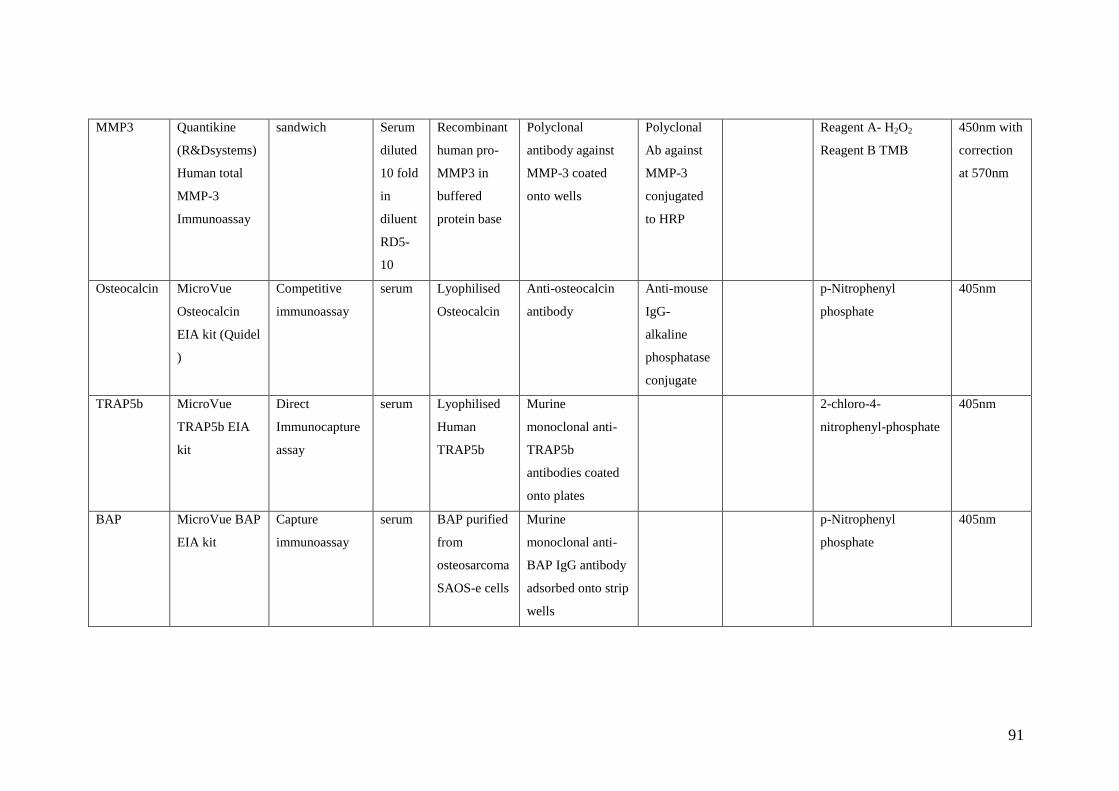
91
MMP3 Quantikine
(R&Dsystems)
Human total
MMP-3
Immunoassay
sandwich Serum
diluted
10 fold
in
diluent
RD5-
10
Recombinant
human pro-
MMP3 in
buffered
protein base
Polyclonal
antibody against
MMP-3 coated
onto wells
Polyclonal
Ab against
MMP-3
conjugated
to HRP
Reagent A- H2O2
Reagent B TMB
450nm with
correction
at 570nm
Osteocalcin MicroVue
Osteocalcin
EIA kit (Quidel
)
Competitive
immunoassay
serum Lyophilised
Osteocalcin
Anti-osteocalcin
antibody
Anti-mouse
IgG-
alkaline
phosphatase
conjugate
p-Nitrophenyl
phosphate
405nm
TRAP5b MicroVue
TRAP5b EIA
kit
Direct
Immunocapture
assay
serum Lyophilised
Human
TRAP5b
Murine
monoclonal anti-
TRAP5b
antibodies coated
onto plates
2-chloro-4-
nitrophenyl-phosphate
405nm
BAP MicroVue BAP
EIA kit
Capture
immunoassay
serum BAP purified
from
osteosarcoma
SAOS-e cells
Murine
monoclonal anti-
BAP IgG antibody
adsorbed onto strip
wells
p-Nitrophenyl
phosphate
405nm

92
Table 4.2: Sensitivity, Normal Ranges and Coefficient of variation for the various
bone biomarker assays
Analyte Sensitivity Normal Range Coefficient of
variation (%)
RANKL* >1.5 pmol/L 0.48-9.28 pmol/L 6.7-7.1 (Intra)
OPG‡ >0.4 pmol/L 5.28- 6.12pmol/L 2.1-3.5 (Intra)
4.2-6.1 (Inter)
Osteocalcin‡ >0.45ng/ml 3.7-10 ng/ml 4.8-10 (Intra)
4.8-9.8 (Inter)
TRAP5b‡ >0.2 U/L Men: 4.0±1.4 U/L
Women:2.9±1.4 U/L
(Premenopausal)
Women: 4.3±1.5 U/L
(Postmenopausal)
1.9-2.2 (Intra)
2.0-3.0 (Inter)
BAP‡ >0.7 U/L Men: 15.0-41.3U/L
Women:11.6-29.6 U/L
(Premenopausal)
Women: 14.2-42.7 U/L
(Postmenopausal)
3.9-5.8 (Intra)
5.0 -7.6 (Inter)
MMP3‡ 0.002-0.045ng/mL 2.1- 64.4 ng/ml 5.7-6.4 (Intra)
7.0-8.6 (Inter)
Dkk-1* > 62.5 pg/ml 2.18-3.55 ng/ml 5.2-7.6 (Intra)
7.2-10.6 (Inter)
Serum sclerostin*
Plasma sclerostin*
> 156 pg/mL
>78 pg/ml
366.3-1781pg/ml
706.7-1696pg/ml
1.5-4.1 (Intra)
2.2-2.5 (Intra)
5.8-8.7 (Inter)
‡ Normal ranges and CVs quoted as reported by manufacturer
* Normal ranges quoted as determined by results of assays run on volunteers. Intra-
assay CVs based on 20 samples run in duplicate on a microplate. Inter-assay CVs
based on results from 2 controls run on 3 plates.
93
4.2.4 Cytokines, Chemokines and Growth factors
As there were a large number of analytes to be studied, the BD (Beckton Dickenson)
cytometric bead array (CBA) system was used. This system combines the sensitivity
of amplified fluorescence detected by flow cytometry to measure soluble analytes
with a particle based immunoassay. This system allows testing for up to 30 analytes
simultaneously using a very small serum sample.
4.2.4.1 Principle of CBA
The CBA system utilizes bead particles with fluorescence intensities in two different
fluorescent parameters to simultaneously detect and quantify multiple analytes in the
same sample. Each BD CBA Human Soluble Protein Flex set capture bead represents
a single bead population which has a distinct fluorescence. Beads are coated with a
capture antibody specific to a single soluble protein. Each bead is designated an
alphanumeric position which indicates where the population is resolved in relation to
other bead populations. Hence, beads with different positions are combined in the
same assay to produce a multiplex assay.
In a CBA Flex Set assay, standards and samples are incubated with a mixture of
capture beads. After a short incubation period, a mixture of phycoerythrin (PE) -
conjugated detection agent is added for a second incubation (Fig 4.1). The sandwich
complexes formed are then acquired using BD FACSArray or other compatible
analyzer. The files are then exported and filtered using FCS filter program before
being imported into and analyzed using FCAPArray software program.
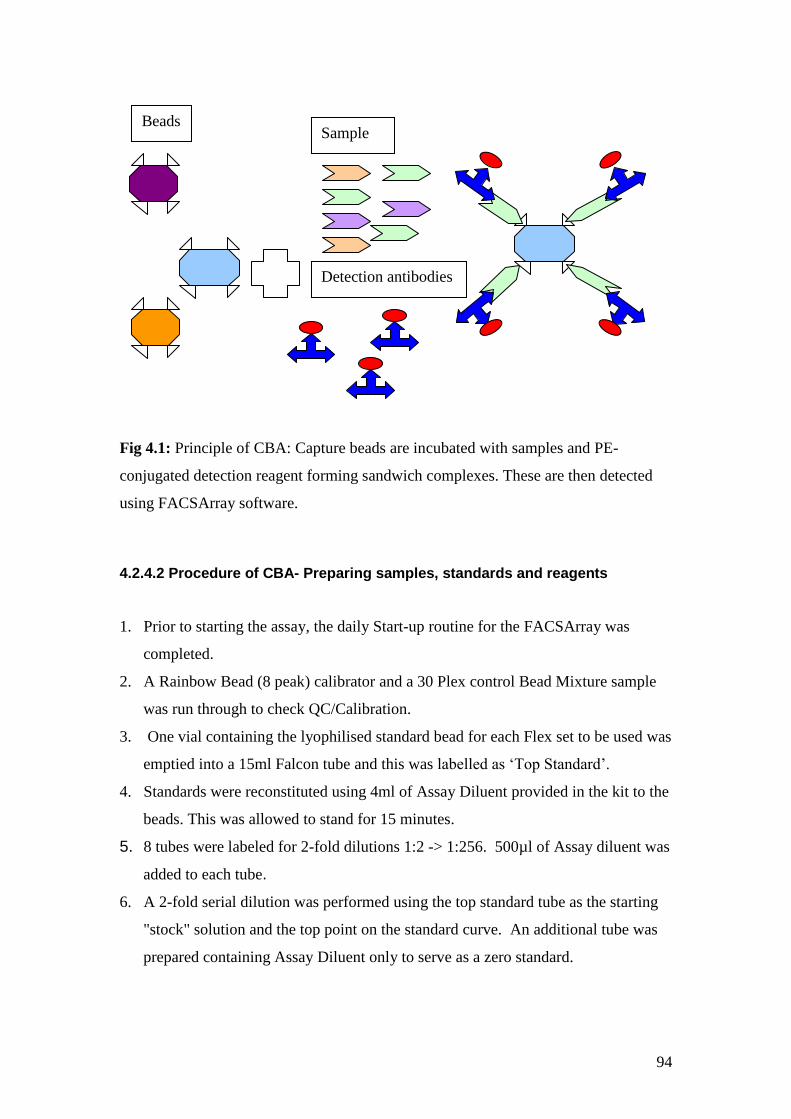
94
Fig 4.1: Principle of CBA: Capture beads are incubated with samples and PE-
conjugated detection reagent forming sandwich complexes. These are then detected
using FACSArray software.
4.2.4.2 Procedure of CBA- Preparing samples, standards and reagents
1. Prior to starting the assay, the daily Start-up routine for the FACSArray was
completed.
2. A Rainbow Bead (8 peak) calibrator and a 30 Plex control Bead Mixture sample
was run through to check QC/Calibration.
3. One vial containing the lyophilised standard bead for each Flex set to be used was
emptied into a 15ml Falcon tube and this was labelled as ‘Top Standard’.
4. Standards were reconstituted using 4ml of Assay Diluent provided in the kit to the
beads. This was allowed to stand for 15 minutes.
5. 8 tubes were labeled for 2-fold dilutions 1:2 -> 1:256. 500µl of Assay diluent was
added to each tube.
6. A 2-fold serial dilution was performed using the top standard tube as the starting
"stock" solution and the top point on the standard curve. An additional tube was
prepared containing Assay Diluent only to serve as a zero standard.
Beads Sample
Detection antibodies

95
7. Another 15ml Falcon tube was labelled Mixed Capture Beads. The number of
standards or samples to be tested was calculated, and then an additional 2-4
"samples" were added to that number to allow for a dead volume.
8. After vortexing the individual vials of Capture Beads for 15 seconds, 1ul of
Capture Beads per standard/sample (as calculated in step 7) was added for each
Flex set to be used. 500µl of Wash Buffer was added. This was then centrifuged
at 2000g for 5 minutes. The resulting supernatant was then discarded without
dislodging the bead pellet.
9. The Capture Beads were then re-suspended in Capture Bead Diluent provided in
the kit for serum/plasma allowing 50µl per standard/sample to be tested. This was
then stored away from direct light.
10. A third 15ml Falcon tube was labeled Mixed PE Detection Reagent. The number
of standards/samples to be tested was calculated and several additional tests were
added to ensure there was enough reagent prepared. For each Flex Set, 1µl of PE
Detection reagent per standard/sample to be tested was added to the Mixed PE
Detection Reagent tube.
11. Allowing a final volume of 50µl per standard/sample to be tested, the PE
Detection Reagent was diluted using Detection Reagent Diluent.
12. This was stored at 4ºC away from sunlight.
13. Finally tubes were labeled with individual sample ID’s and then serum samples
were diluted1:4 with Assay diluent (15µl of sample to 45µl of Assay diluent).
4.2.4.3 Assay procedure
1. 100µl of Wash Buffer was dispensed into each well of the filter plate to be
assayed taking care not to perforate the filter membrane at the base of the well.
2. The Wash Buffer was then removed using vacuum manifold with pressure not
exceeding 10” Hg. Wells were aspirated until drained (2-10 seconds). To
ensure the filter was no longer porous following the aspiration, the plate was
tapped to remove excess moisture from the bottom of the filter plate on to
absorbent tissue.

96
3. The “Mixed Capture Beads” tube was then vortexed and 50µl of Mixed
Capture Beads was dispensed into each well.
4. 50µl of standard or sample was added to the designated wells on the filter
plate. The “zero” standard was dispensed into one additional well at the end of
the plate to allow for a cluster test prior to the full analysis of the plate.
5. The plate was covered and placed on an orbital plate shaker at 500rpm for 5
minutes. It was then removed from the shaker and incubated for 1 hour away
from direct light.
6. 50µl of “Mixed PE Detection Reagent” was added to each well.
7. The plate was again covered and placed on the orbital plate shaker at 500rpm
for 5 minutes. The plate was then removed from shaker and incubated for 2
hours away from direct light.
8. Reagents were then aspirated using vacuum manifold as in step 2.
9. The beads were re-suspended in Wash Buffer. A minimum of 150µl was
allowed to ensure there was enough Wash Buffer for two acquisition cycles
through the FACSArray plus 50µl excess as dead volume. The plate was
covered and placed on the orbital plate shaker at 500rpm for 5 minutes.
10. All samples were acquired using the FACSArray on the day of the experiment.
4.2.4.4 Routine Acquisition & Analysis of Experiments
Sample data was acquired using the FACSArray and the FACSArray software. An
initial single acquisition from the additional "zero" well was analyzed to ensure the
correct number and positioning of the bead clusters before proceeding to acquire the
data for the remainder of the standards/samples on the plate. Data files were then run
through the FCS Filter program to and gated to select for the population of interest
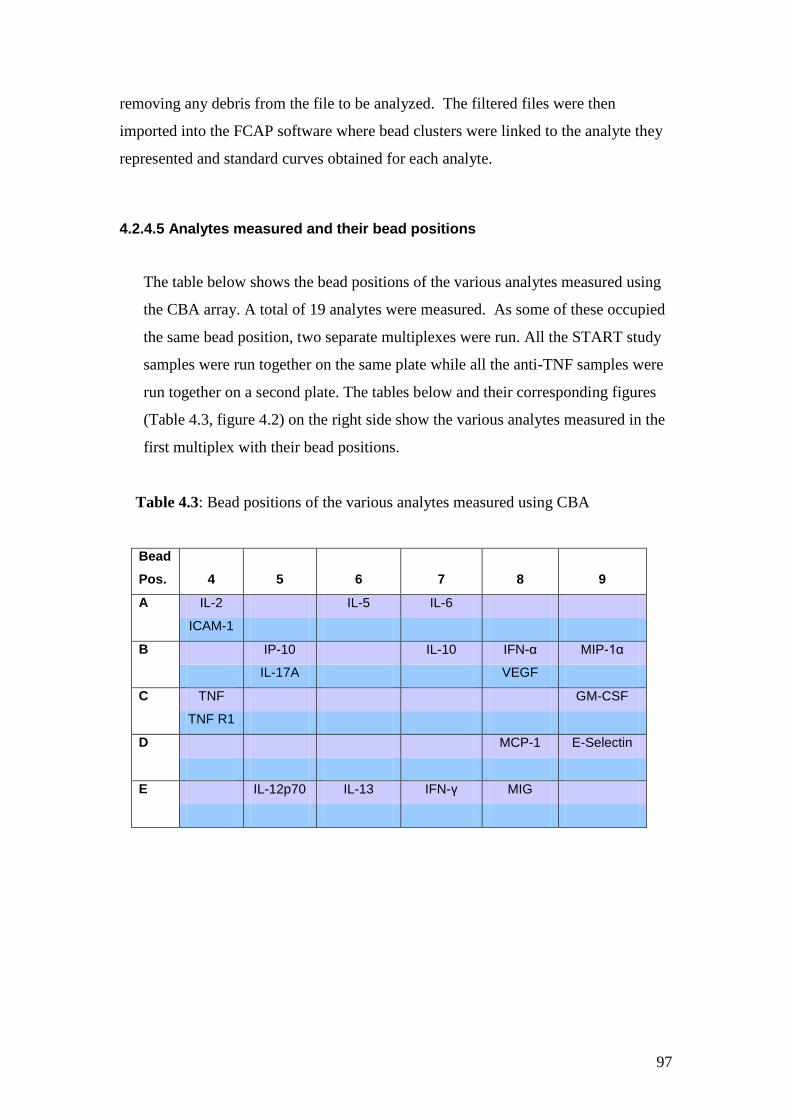
97
removing any debris from the file to be analyzed. The filtered files were then
imported into the FCAP software where bead clusters were linked to the analyte they
represented and standard curves obtained for each analyte.
4.2.4.5 Analytes measured and their bead positions
The table below shows the bead positions of the various analytes measured using
the CBA array. A total of 19 analytes were measured. As some of these occupied
the same bead position, two separate multiplexes were run. All the START study
samples were run together on the same plate while all the anti-TNF samples were
run together on a second plate. The tables below and their corresponding figures
(Table 4.3, figure 4.2) on the right side show the various analytes measured in the
first multiplex with their bead positions.
Table 4.3: Bead positions of the various analytes measured using CBA
Bead
Pos. 4 5 6 7 8 9
A IL-2 IL-5 IL-6
ICAM-1
B IP-10 IL-10 IFN-α MIP-1α
IL-17A VEGF
C TNF GM-CSF
TNF R1
D MCP-1 E-Selectin
E IL-12p70 IL-13 IFN-γ MIG
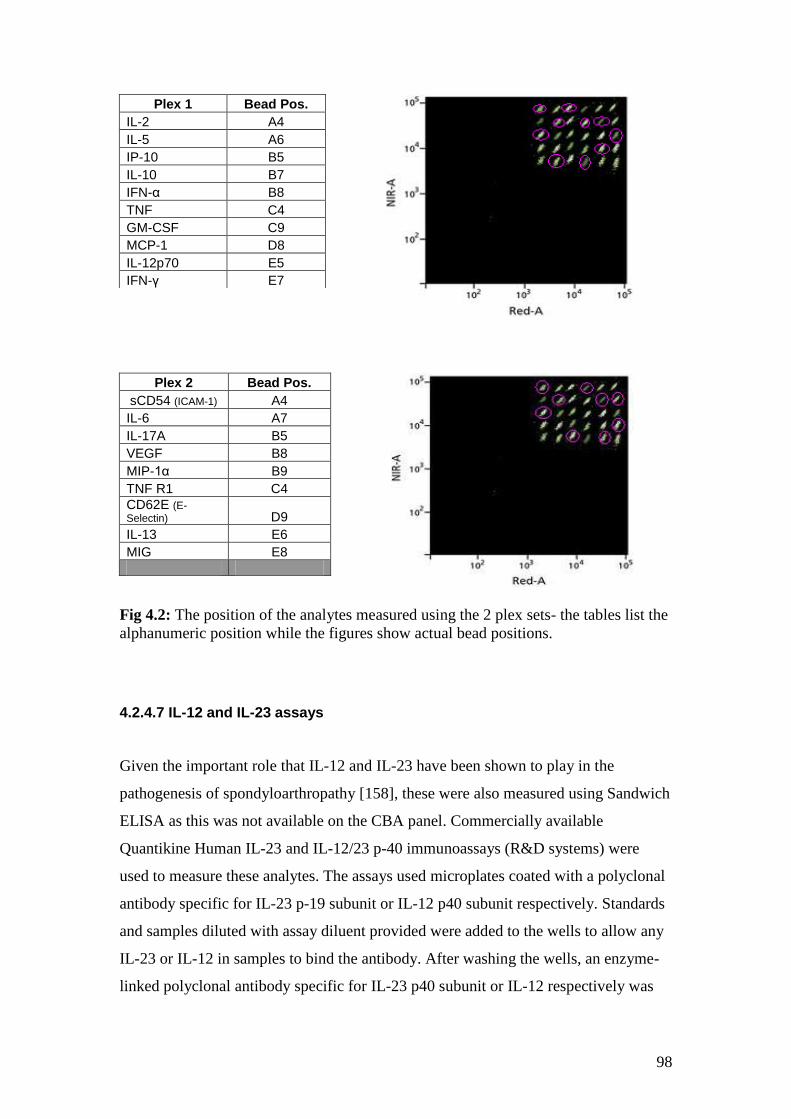
98
Fig 4.2: The position of the analytes measured using the 2 plex sets- the tables list the
alphanumeric position while the figures show actual bead positions.
4.2.4.7 IL-12 and IL-23 assays
Given the important role that IL-12 and IL-23 have been shown to play in the
pathogenesis of spondyloarthropathy [158], these were also measured using Sandwich
ELISA as this was not available on the CBA panel. Commercially available
Quantikine Human IL-23 and IL-12/23 p-40 immunoassays (R&D systems) were
used to measure these analytes. The assays used microplates coated with a polyclonal
antibody specific for IL-23 p-19 subunit or IL-12 p40 subunit respectively. Standards
and samples diluted with assay diluent provided were added to the wells to allow any
IL-23 or IL-12 in samples to bind the antibody. After washing the wells, an enzyme-
linked polyclonal antibody specific for IL-23 p40 subunit or IL-12 respectively was
Plex 1 Bead Pos.
IL-2 A4
IL-5 A6
IP-10 B5
IL-10 B7
IFN-α B8
TNF C4
GM-CSF C9
MCP-1 D8
IL-12p70 E5
IFN-γ E7
Plex 2 Bead Pos.
sCD54 (ICAM-1) A4
IL-6 A7
IL-17A B5
VEGF B8
MIP-1α B9
TNF R1 C4
CD62E (E-
Selectin) D9
IL-13 E6
MIG E8

99
added. Any unbound antibody-enzyme reagent was washed away and the substrate
(mixture of hydrogen peroxide and TMB) was added to produce a colour change. The
reaction was stopped by adding 0.5N sulphuric acid and the optical density measured
at 450nm with correction at 540nm. Concentration values of analytes were calculated
by non-linear regression (curve fit) with variable slope using GraphPad Prism
software. The average concentration was then calculated for each sample and this
value was used for further analysis.
4.2.5 Statistics
Levels of analytes pre and post treatment were compared using paired t-test or
Wilcoxon matched pairs test in both the anti-TNF and START cohorts. Where levels
of analytes were below the sensitivity range for the assay, the lowest accurately
detectable value for that assay was recorded and used for further analysis. Although
not all data was normally distributed, Mean (SE) was quoted in all results in order to
uniformly report results. The percentage change from baseline in the different
analytes was compared between apremilast and placebo arms using Mann-Whitney U-
test or unpaired t-test as appropriate (p<0.05 considered as significant) in GraphPad
Prism. In order to establish whether laboratory biomarkers reflect change in disease
activity, exploratory analysis was carried out using Spearman Rank Correlation.
Correlations between the various laboratory biomarkers and BASDAI as well as with
MRI Berlin scores were studied. Because of small patient numbers in each group, it
was not possible to do a cluster analysis. As the study was not powered to detect
statistical significance, only trends towards correlation were looked for. However,
where p-values were <0.05, this was reported as being statistically significant.
4.3 Results
Laboratory biomarkers were studied in 17 patients receiving apremilast and 19
receiving placebo in the START cohort. Both plasma and serum were available for
this cohort of patients. In the anti-TNF cohort, laboratory biomarkers were studied in
18 patients as insufficient serum was available to test for bone biomarkers in one
patient. However, cytokines and growth factors studied using CBA were available in
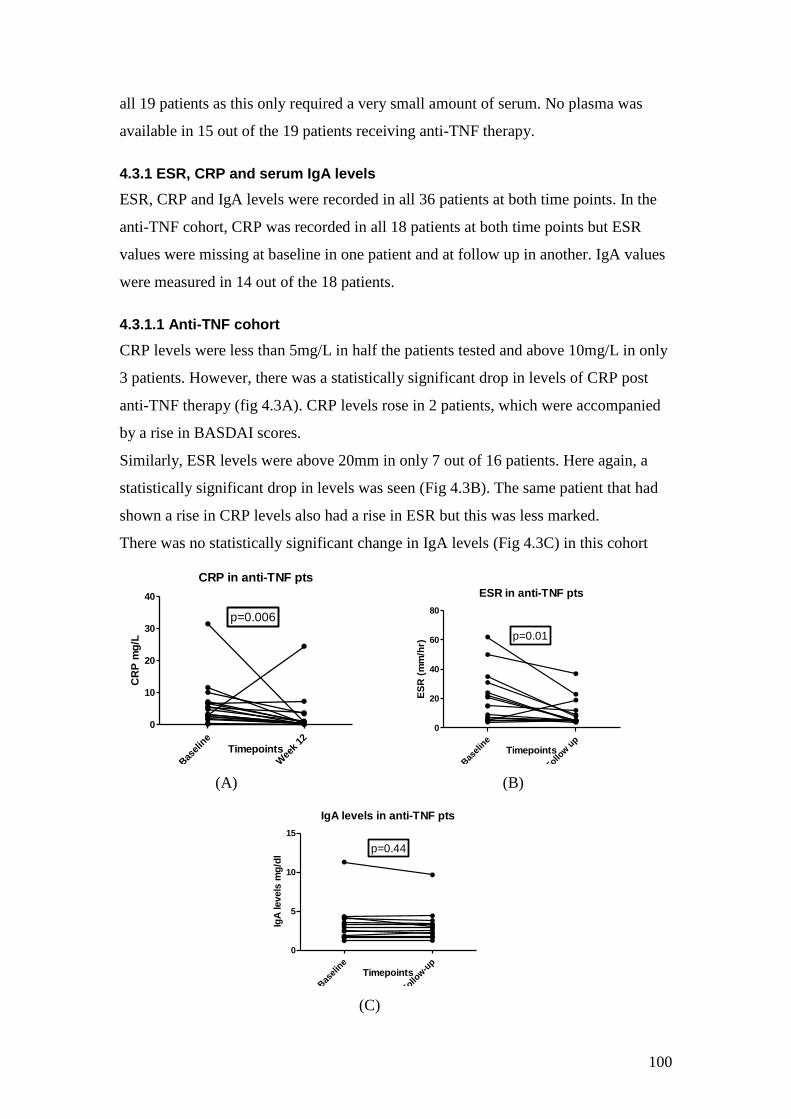
100
all 19 patients as this only required a very small amount of serum. No plasma was
available in 15 out of the 19 patients receiving anti-TNF therapy.
4.3.1 ESR, CRP and serum IgA levels
ESR, CRP and IgA levels were recorded in all 36 patients at both time points. In the
anti-TNF cohort, CRP was recorded in all 18 patients at both time points but ESR
values were missing at baseline in one patient and at follow up in another. IgA values
were measured in 14 out of the 18 patients.
4.3.1.1 Anti-TNF cohort
CRP levels were less than 5mg/L in half the patients tested and above 10mg/L in only
3 patients. However, there was a statistically significant drop in levels of CRP post
anti-TNF therapy (fig 4.3A). CRP levels rose in 2 patients, which were accompanied
by a rise in BASDAI scores.
Similarly, ESR levels were above 20mm in only 7 out of 16 patients. Here again, a
statistically significant drop in levels was seen (Fig 4.3B). The same patient that had
shown a rise in CRP levels also had a rise in ESR but this was less marked.
There was no statistically significant change in IgA levels (Fig 4.3C) in this cohort
CRP in anti-TNF pts
Bas
elin
e
Wee
k 12
0
10
20
30
40
p=0.006
Timepoints
CR
P m
g/L
ESR in anti-TNF pts
Bas
elin
e
Follow u
p
0
20
40
60
80
p=0.01
Timepoints
ES
R (
mm
/hr)
(A) (B)
IgA levels in anti-TNF pts
Bas
elin
e
Follow-u
p
0
5
10
15
p=0.44
Timepoints
IgA
levels
mg
/dl
(C)
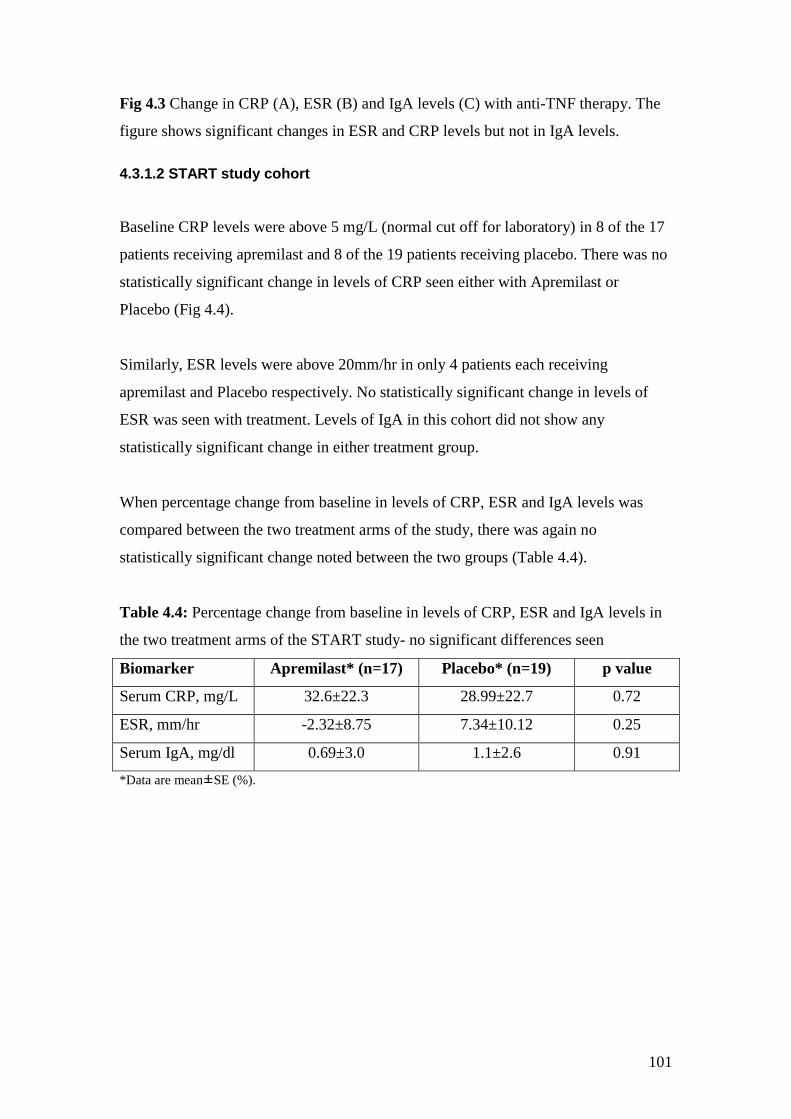
101
Fig 4.3 Change in CRP (A), ESR (B) and IgA levels (C) with anti-TNF therapy. The
figure shows significant changes in ESR and CRP levels but not in IgA levels.
4.3.1.2 START study cohort
Baseline CRP levels were above 5 mg/L (normal cut off for laboratory) in 8 of the 17
patients receiving apremilast and 8 of the 19 patients receiving placebo. There was no
statistically significant change in levels of CRP seen either with Apremilast or
Placebo (Fig 4.4).
Similarly, ESR levels were above 20mm/hr in only 4 patients each receiving
apremilast and Placebo respectively. No statistically significant change in levels of
ESR was seen with treatment. Levels of IgA in this cohort did not show any
statistically significant change in either treatment group.
When percentage change from baseline in levels of CRP, ESR and IgA levels was
compared between the two treatment arms of the study, there was again no
statistically significant change noted between the two groups (Table 4.4).
Table 4.4: Percentage change from baseline in levels of CRP, ESR and IgA levels in
the two treatment arms of the START study- no significant differences seen
Biomarker Apremilast* (n=17) Placebo* (n=19) p value
Serum CRP, mg/L 32.6±22.3 28.99±22.7 0.72
ESR, mm/hr -2.32±8.75 7.34±10.12 0.25
Serum IgA, mg/dl 0.69±3.0 1.1±2.6 0.91
*Data are mean±SE (%).

102
Change in CRP in Apremilast group
Bas
elin
e
Follow u
p
0
20
40
60p=0.93
Timepoints
CR
P m
g/L
Change in CRP in Placebo group
Bas
elin
e
Follow u
p
0
10
20
30
40 p=0.74
Timepoints
CR
P m
g/L
Change in ESR in Apremilast group
Bas
elin
e
Follow u
p
0
20
40
60p=0.14
Timepoints
ES
R (
mm
/hr)
Change in ESR in Placebo group
Bas
elin
e
Follow u
p
0
20
40
60
80
p=0.42
Change in IgA in Apremilast group
Bas
elin
e
Follow u
p
0
2
4
6
8 p=0.8
Timepoints
IgA
levels
mg
/dl
Change in IgA in Placebo group
Bas
elin
e
Floow
up
0
2
4
6
8p=0.82
Timepoints
IgA
levels
mg
/dl
Fig 4.4: Change in levels of CRP, ESR and IgA levels in the apremilast and placebo
groups in the START cohort. No statistically significant changes were seen in levels
in either group with treatment.
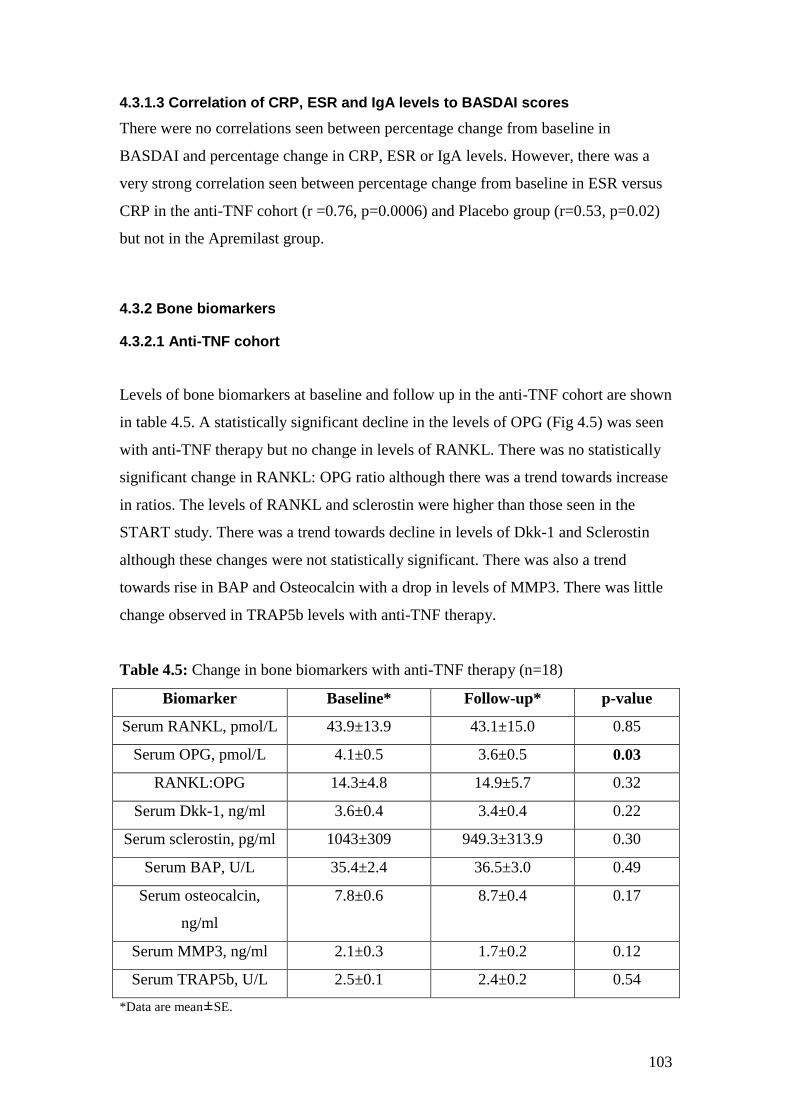
103
4.3.1.3 Correlation of CRP, ESR and IgA levels to BASDAI scores
There were no correlations seen between percentage change from baseline in
BASDAI and percentage change in CRP, ESR or IgA levels. However, there was a
very strong correlation seen between percentage change from baseline in ESR versus
CRP in the anti-TNF cohort (r =0.76, p=0.0006) and Placebo group (r=0.53, p=0.02)
but not in the Apremilast group.
4.3.2 Bone biomarkers
4.3.2.1 Anti-TNF cohort
Levels of bone biomarkers at baseline and follow up in the anti-TNF cohort are shown
in table 4.5. A statistically significant decline in the levels of OPG (Fig 4.5) was seen
with anti-TNF therapy but no change in levels of RANKL. There was no statistically
significant change in RANKL: OPG ratio although there was a trend towards increase
in ratios. The levels of RANKL and sclerostin were higher than those seen in the
START study. There was a trend towards decline in levels of Dkk-1 and Sclerostin
although these changes were not statistically significant. There was also a trend
towards rise in BAP and Osteocalcin with a drop in levels of MMP3. There was little
change observed in TRAP5b levels with anti-TNF therapy.
Table 4.5: Change in bone biomarkers with anti-TNF therapy (n=18)
Biomarker Baseline* Follow-up* p-value
Serum RANKL, pmol/L 43.9±13.9 43.1±15.0 0.85
Serum OPG, pmol/L 4.1±0.5 3.6±0.5 0.03
RANKL:OPG 14.3±4.8 14.9±5.7 0.32
Serum Dkk-1, ng/ml 3.6±0.4 3.4±0.4 0.22
Serum sclerostin, pg/ml 1043±309 949.3±313.9 0.30
Serum BAP, U/L 35.4±2.4 36.5±3.0 0.49
Serum osteocalcin,
ng/ml
7.8±0.6 8.7±0.4 0.17
Serum MMP3, ng/ml 2.1±0.3 1.7±0.2 0.12
Serum TRAP5b, U/L 2.5±0.1 2.4±0.2 0.54
*Data are mean±SE.
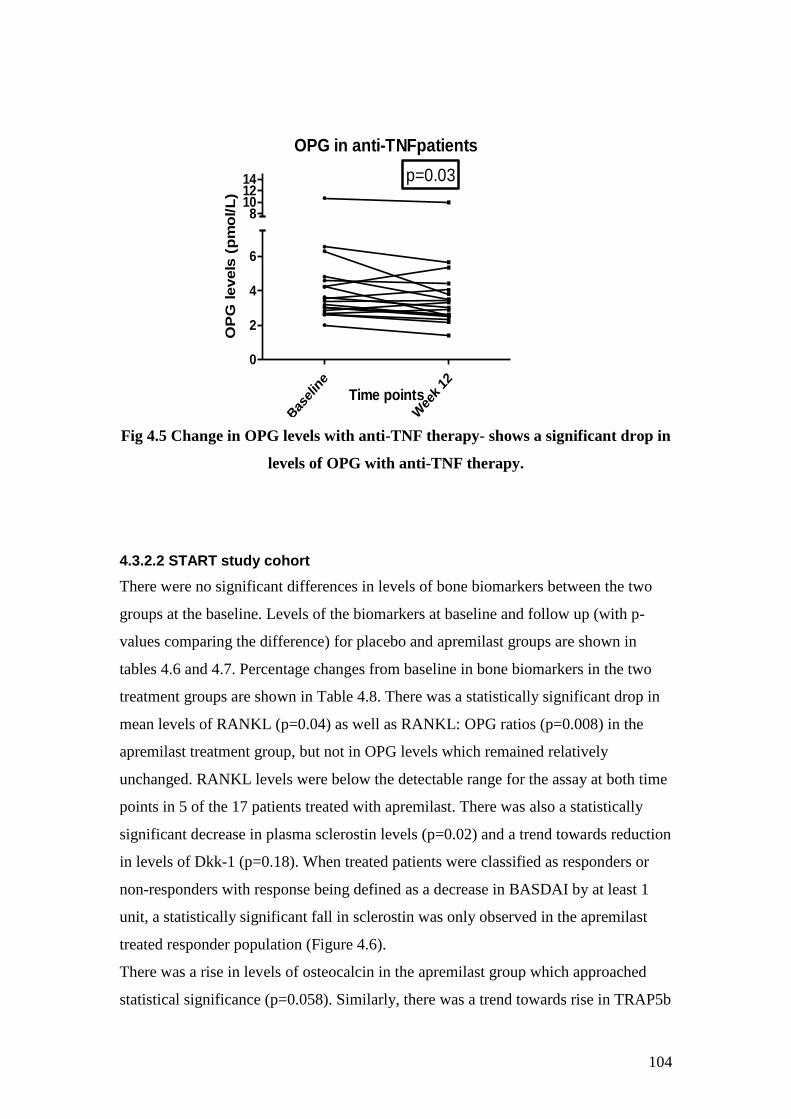
104
OPG in anti-TNFpatients
Bas
elin
e
Wee
k 12
0
2
4
6
8101214 p=0.03
Time points
OP
G levels
(p
mo
l/L
)
Fig 4.5 Change in OPG levels with anti-TNF therapy- shows a significant drop in
levels of OPG with anti-TNF therapy.
4.3.2.2 START study cohort
There were no significant differences in levels of bone biomarkers between the two
groups at the baseline. Levels of the biomarkers at baseline and follow up (with p-
values comparing the difference) for placebo and apremilast groups are shown in
tables 4.6 and 4.7. Percentage changes from baseline in bone biomarkers in the two
treatment groups are shown in Table 4.8. There was a statistically significant drop in
mean levels of RANKL (p=0.04) as well as RANKL: OPG ratios (p=0.008) in the
apremilast treatment group, but not in OPG levels which remained relatively
unchanged. RANKL levels were below the detectable range for the assay at both time
points in 5 of the 17 patients treated with apremilast. There was also a statistically
significant decrease in plasma sclerostin levels (p=0.02) and a trend towards reduction
in levels of Dkk-1 (p=0.18). When treated patients were classified as responders or
non-responders with response being defined as a decrease in BASDAI by at least 1
unit, a statistically significant fall in sclerostin was only observed in the apremilast
treated responder population (Figure 4.6).
There was a rise in levels of osteocalcin in the apremilast group which approached
statistical significance (p=0.058). Similarly, there was a trend towards rise in TRAP5b
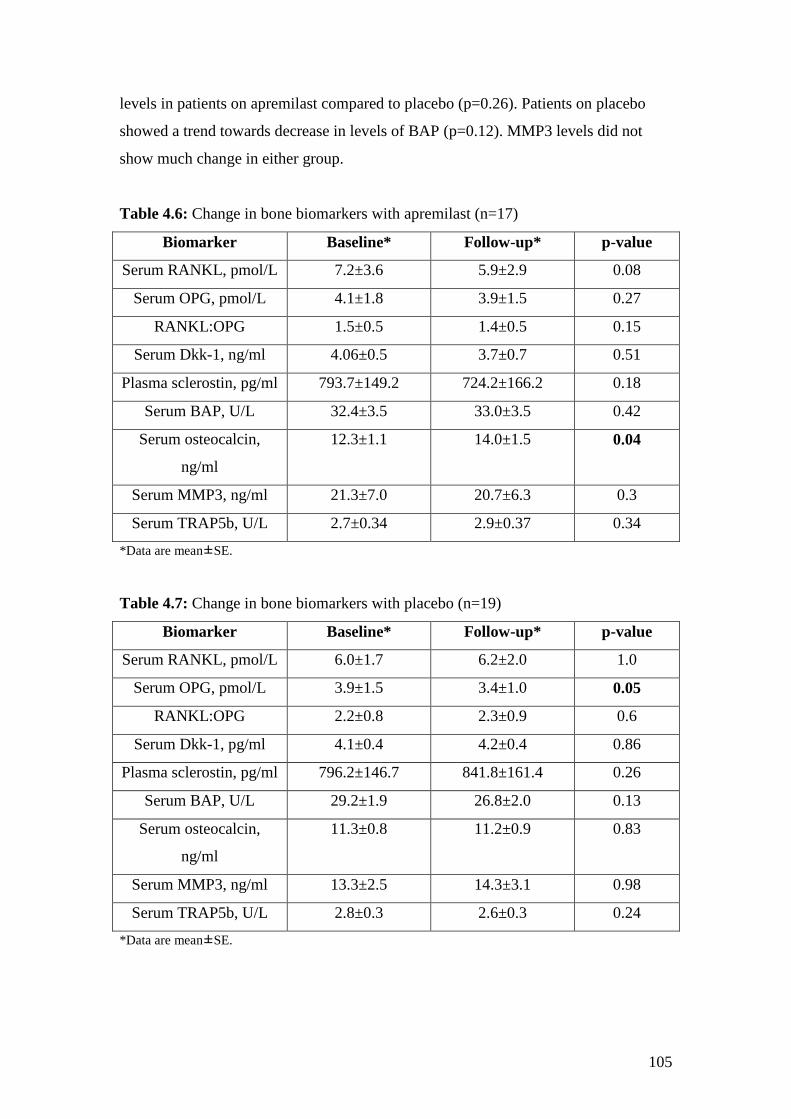
105
levels in patients on apremilast compared to placebo (p=0.26). Patients on placebo
showed a trend towards decrease in levels of BAP (p=0.12). MMP3 levels did not
show much change in either group.
Table 4.6: Change in bone biomarkers with apremilast (n=17)
Biomarker Baseline* Follow-up* p-value
Serum RANKL, pmol/L 7.2±3.6 5.9±2.9 0.08
Serum OPG, pmol/L 4.1±1.8 3.9±1.5 0.27
RANKL:OPG 1.5±0.5 1.4±0.5 0.15
Serum Dkk-1, ng/ml 4.06±0.5 3.7±0.7 0.51
Plasma sclerostin, pg/ml 793.7±149.2 724.2±166.2 0.18
Serum BAP, U/L 32.4±3.5 33.0±3.5 0.42
Serum osteocalcin,
ng/ml
12.3±1.1 14.0±1.5 0.04
Serum MMP3, ng/ml 21.3±7.0 20.7±6.3 0.3
Serum TRAP5b, U/L 2.7±0.34 2.9±0.37 0.34
*Data are mean±SE.
Table 4.7: Change in bone biomarkers with placebo (n=19)
Biomarker Baseline* Follow-up* p-value
Serum RANKL, pmol/L 6.0±1.7 6.2±2.0 1.0
Serum OPG, pmol/L 3.9±1.5 3.4±1.0 0.05
RANKL:OPG 2.2±0.8 2.3±0.9 0.6
Serum Dkk-1, pg/ml 4.1±0.4 4.2±0.4 0.86
Plasma sclerostin, pg/ml 796.2±146.7 841.8±161.4 0.26
Serum BAP, U/L 29.2±1.9 26.8±2.0 0.13
Serum osteocalcin,
ng/ml
11.3±0.8 11.2±0.9 0.83
Serum MMP3, ng/ml 13.3±2.5 14.3±3.1 0.98
Serum TRAP5b, U/L 2.8±0.3 2.6±0.3 0.24
*Data are mean±SE.
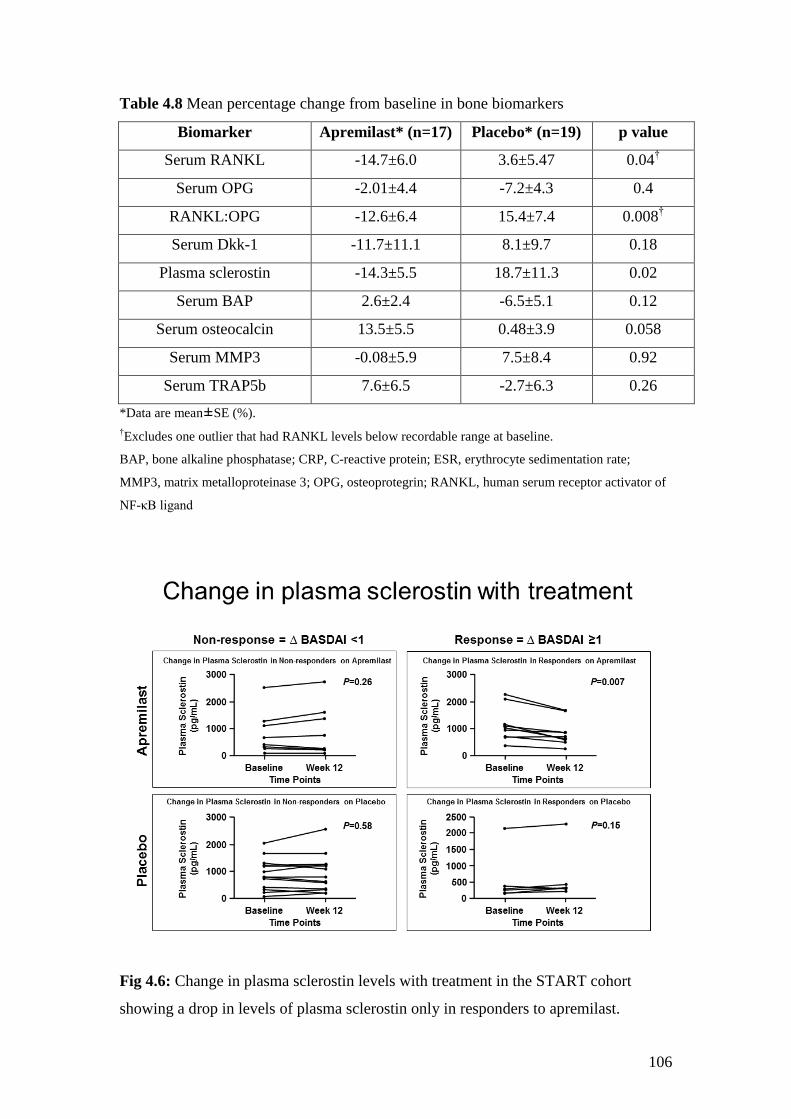
106
Table 4.8 Mean percentage change from baseline in bone biomarkers
Biomarker Apremilast* (n=17) Placebo* (n=19) p value
Serum RANKL -14.7±6.0 3.6±5.47 0.04†
Serum OPG -2.01±4.4 -7.2±4.3 0.4
RANKL:OPG -12.6±6.4 15.4±7.4 0.008†
Serum Dkk-1 -11.7±11.1 8.1±9.7 0.18
Plasma sclerostin -14.3±5.5 18.7±11.3 0.02
Serum BAP 2.6±2.4 -6.5±5.1 0.12
Serum osteocalcin 13.5±5.5 0.48±3.9 0.058
Serum MMP3 -0.08±5.9 7.5±8.4 0.92
Serum TRAP5b 7.6±6.5 -2.7±6.3 0.26
*Data are mean±SE (%).
†Excludes one outlier that had RANKL levels below recordable range at baseline.
BAP, bone alkaline phosphatase; CRP, C-reactive protein; ESR, erythrocyte sedimentation rate;
MMP3, matrix metalloproteinase 3; OPG, osteoprotegrin; RANKL, human serum receptor activator of
NF-κB ligand
Fig 4.6: Change in plasma sclerostin levels with treatment in the START cohort
showing a drop in levels of plasma sclerostin only in responders to apremilast.
107
4.3.2.3 Trends in bone biomarkers in various subgroups of patients
The table 4.9 below summarizes the trends in the various bone biomarkers in patient
sub-groups as per response to therapy. Except for plasma sclerostin levels in patients
on apremilast, there were no statistically significant differences between responders
and non-responders in any of the groups.
While response to treatment with apremilast is associated with a fall in RANKL and
RANKL: OPG ratio, response to anti-TNF therapy is associated with a rise in
RANKL: OPG ratio. This is largely because response to anti-TNF is associated with a
drop in OPG levels. Also, levels of RANKL and hence RANKL:OPG ratios were
much higher in the anti-TNF cohort as against the START cohort. It is not clear
whether this was related to increased disease activity in the anti-TNF group or a
difference in the standard curve when levels were measured for this group. This in
turn would make it difficult to interpret the difference in trends seen in the two patient
cohorts.
Although response in both groups is associated with a decline in sclerostin levels, in
the Apremilast group, there is an associated decline in Dkk-1 while with anti-TNF
therapy this is seen to rise. This is also the case with patients on placebo who are on
concurrent NSAID therapy. There was a drop in TRAP5b levels after anti-TNF
therapy which was not seen with apremilast.
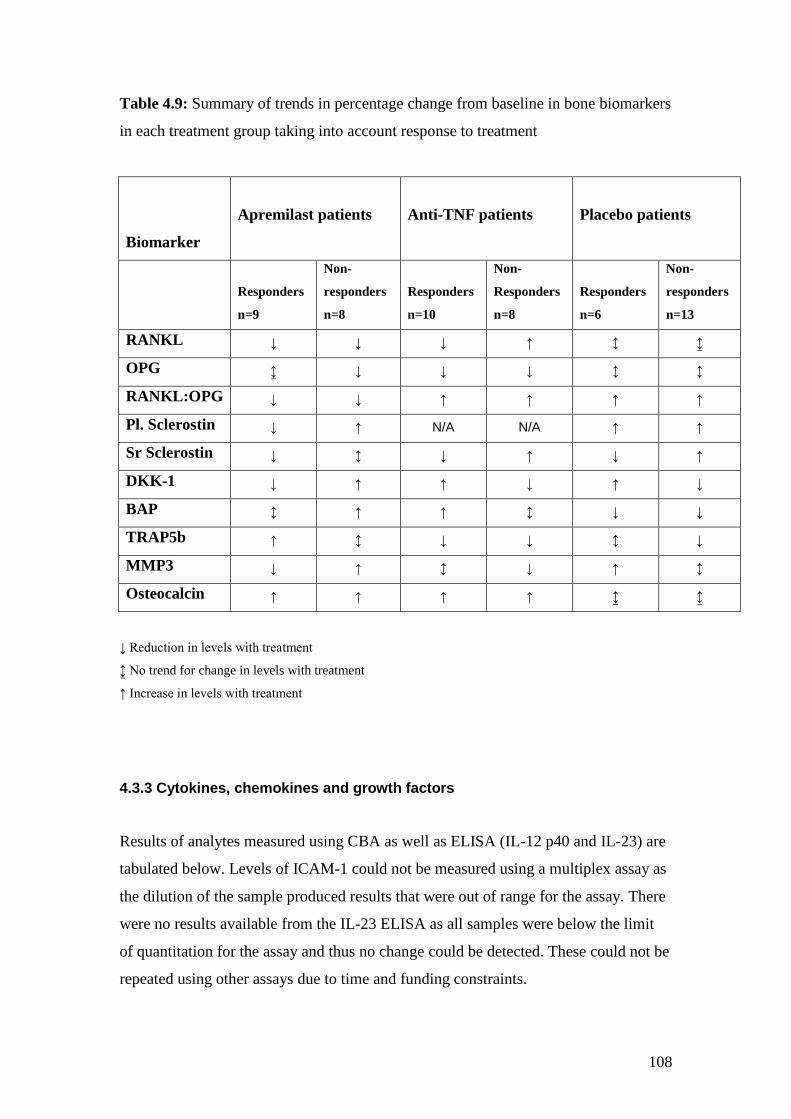
108
Table 4.9: Summary of trends in percentage change from baseline in bone biomarkers
in each treatment group taking into account response to treatment
Biomarker
Apremilast patients
Anti-TNF patients
Placebo patients
Responders
n=9
Non-
responders
n=8
Responders
n=10
Non-
Responders
n=8
Responders
n=6
Non-
responders
n=13
RANKL ↓ ↓ ↓ ↑ ↕ ↨
OPG ↨ ↓ ↓ ↓ ↕ ↕
RANKL:OPG ↓ ↓ ↑ ↑ ↑ ↑
Pl. Sclerostin ↓ ↑ N/A N/A ↑ ↑
Sr Sclerostin ↓ ↕ ↓ ↑ ↓ ↑
DKK-1 ↓ ↑ ↑ ↓ ↑ ↓
BAP ↕ ↑ ↑ ↕ ↓ ↓
TRAP5b ↑ ↕ ↓ ↓ ↕ ↓
MMP3 ↓ ↑ ↕ ↓ ↑ ↕
Osteocalcin ↑ ↑ ↑ ↑ ↨ ↨
↓ Reduction in levels with treatment
↨ No trend for change in levels with treatment
↑ Increase in levels with treatment
4.3.3 Cytokines, chemokines and growth factors
Results of analytes measured using CBA as well as ELISA (IL-12 p40 and IL-23) are
tabulated below. Levels of ICAM-1 could not be measured using a multiplex assay as
the dilution of the sample produced results that were out of range for the assay. There
were no results available from the IL-23 ELISA as all samples were below the limit
of quantitation for the assay and thus no change could be detected. These could not be
repeated using other assays due to time and funding constraints.
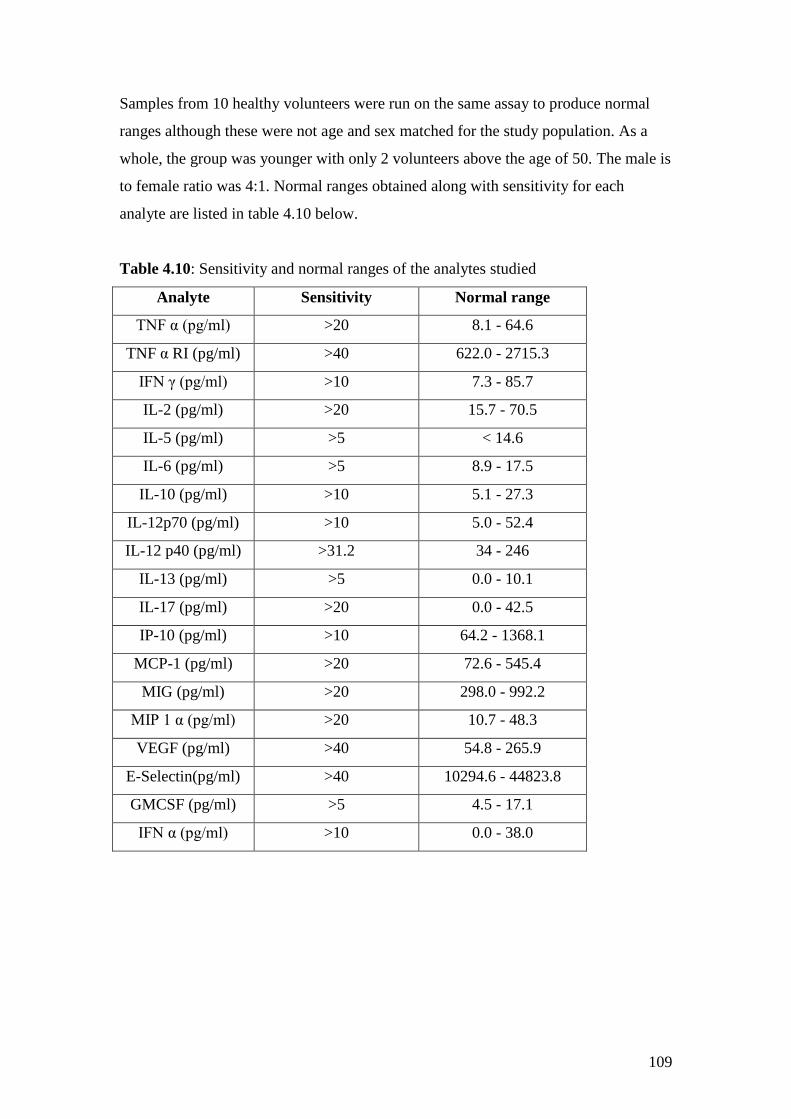
109
Samples from 10 healthy volunteers were run on the same assay to produce normal
ranges although these were not age and sex matched for the study population. As a
whole, the group was younger with only 2 volunteers above the age of 50. The male is
to female ratio was 4:1. Normal ranges obtained along with sensitivity for each
analyte are listed in table 4.10 below.
Table 4.10: Sensitivity and normal ranges of the analytes studied
Analyte Sensitivity Normal range
TNF α (pg/ml) >20 8.1 - 64.6
TNF α RI (pg/ml) >40 622.0 - 2715.3
IFN γ (pg/ml) >10 7.3 - 85.7
IL-2 (pg/ml) >20 15.7 - 70.5
IL-5 (pg/ml) >5 < 14.6
IL-6 (pg/ml) >5 8.9 - 17.5
IL-10 (pg/ml) >10 5.1 - 27.3
IL-12p70 (pg/ml) >10 5.0 - 52.4
IL-12 p40 (pg/ml) >31.2 34 - 246
IL-13 (pg/ml) >5 0.0 - 10.1
IL-17 (pg/ml) >20 0.0 - 42.5
IP-10 (pg/ml) >10 64.2 - 1368.1
MCP-1 (pg/ml) >20 72.6 - 545.4
MIG (pg/ml) >20 298.0 - 992.2
MIP 1 α (pg/ml) >20 10.7 - 48.3
VEGF (pg/ml) >40 54.8 - 265.9
E-Selectin(pg/ml) >40 10294.6 - 44823.8
GMCSF (pg/ml) >5 4.5 - 17.1
IFN α (pg/ml) >10 0.0 - 38.0
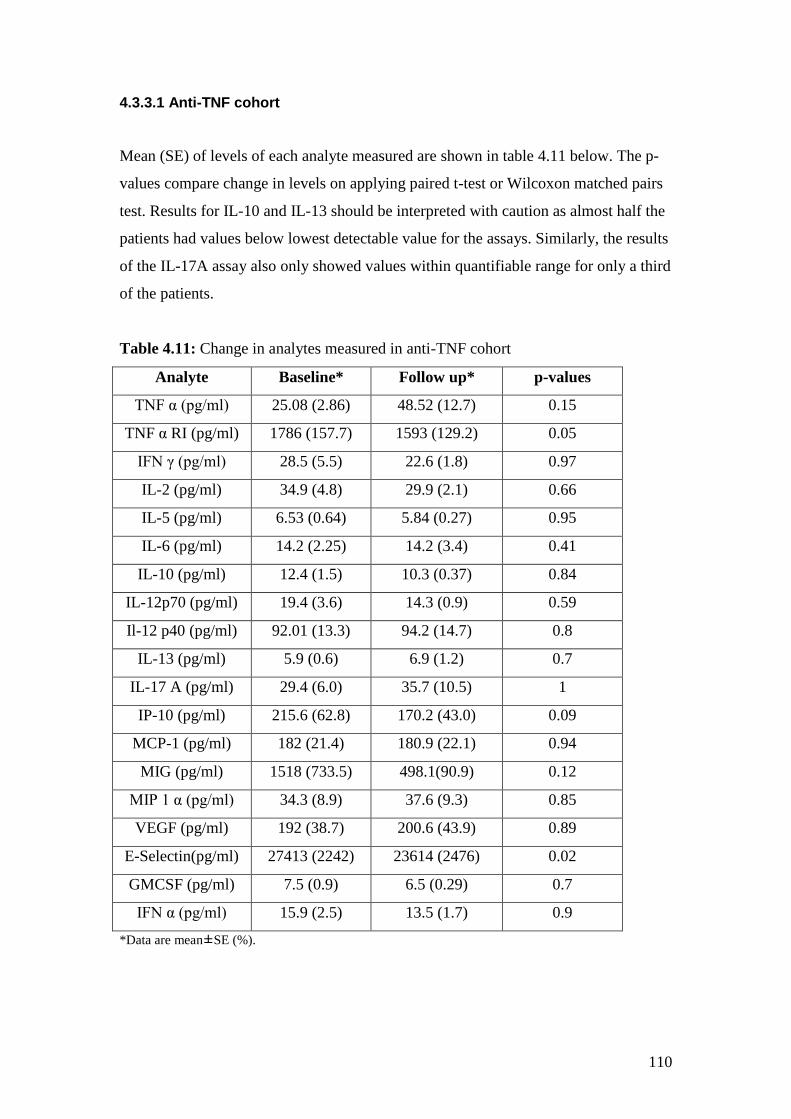
110
4.3.3.1 Anti-TNF cohort
Mean (SE) of levels of each analyte measured are shown in table 4.11 below. The p-
values compare change in levels on applying paired t-test or Wilcoxon matched pairs
test. Results for IL-10 and IL-13 should be interpreted with caution as almost half the
patients had values below lowest detectable value for the assays. Similarly, the results
of the IL-17A assay also only showed values within quantifiable range for only a third
of the patients.
Table 4.11: Change in analytes measured in anti-TNF cohort
Analyte Baseline* Follow up* p-values
TNF α (pg/ml) 25.08 (2.86) 48.52 (12.7) 0.15
TNF α RI (pg/ml) 1786 (157.7) 1593 (129.2) 0.05
IFN γ (pg/ml) 28.5 (5.5) 22.6 (1.8) 0.97
IL-2 (pg/ml) 34.9 (4.8) 29.9 (2.1) 0.66
IL-5 (pg/ml) 6.53 (0.64) 5.84 (0.27) 0.95
IL-6 (pg/ml) 14.2 (2.25) 14.2 (3.4) 0.41
IL-10 (pg/ml) 12.4 (1.5) 10.3 (0.37) 0.84
IL-12p70 (pg/ml) 19.4 (3.6) 14.3 (0.9) 0.59
Il-12 p40 (pg/ml) 92.01 (13.3) 94.2 (14.7) 0.8
IL-13 (pg/ml) 5.9 (0.6) 6.9 (1.2) 0.7
IL-17 A (pg/ml) 29.4 (6.0) 35.7 (10.5) 1
IP-10 (pg/ml) 215.6 (62.8) 170.2 (43.0) 0.09
MCP-1 (pg/ml) 182 (21.4) 180.9 (22.1) 0.94
MIG (pg/ml) 1518 (733.5) 498.1(90.9) 0.12
MIP 1 α (pg/ml) 34.3 (8.9) 37.6 (9.3) 0.85
VEGF (pg/ml) 192 (38.7) 200.6 (43.9) 0.89
E-Selectin(pg/ml) 27413 (2242) 23614 (2476) 0.02
GMCSF (pg/ml) 7.5 (0.9) 6.5 (0.29) 0.7
IFN α (pg/ml) 15.9 (2.5) 13.5 (1.7) 0.9
*Data are mean±SE (%).
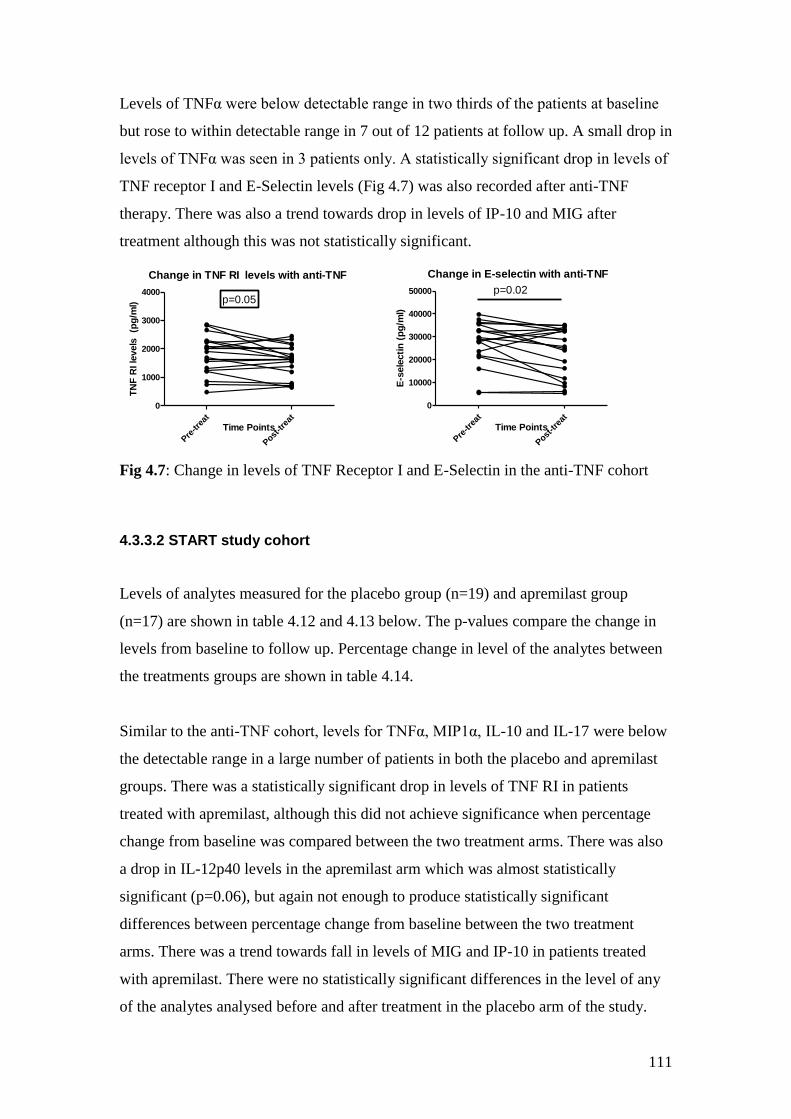
111
Levels of TNFα were below detectable range in two thirds of the patients at baseline
but rose to within detectable range in 7 out of 12 patients at follow up. A small drop in
levels of TNFα was seen in 3 patients only. A statistically significant drop in levels of
TNF receptor I and E-Selectin levels (Fig 4.7) was also recorded after anti-TNF
therapy. There was also a trend towards drop in levels of IP-10 and MIG after
treatment although this was not statistically significant.
Change in TNF RI levels with anti-TNF
Pre
-trea
t
Post
-tre
at
0
1000
2000
3000
4000p=0.05
Time Points
TN
F R
I le
vels
(p
g/m
l)
Change in E-selectin with anti-TNF
Pre
-trea
t
Post
-tre
at
0
10000
20000
30000
40000
50000 p=0.02
Time Points
E-s
ele
cti
n (
pg
/ml)
Fig 4.7: Change in levels of TNF Receptor I and E-Selectin in the anti-TNF cohort
4.3.3.2 START study cohort
Levels of analytes measured for the placebo group (n=19) and apremilast group
(n=17) are shown in table 4.12 and 4.13 below. The p-values compare the change in
levels from baseline to follow up. Percentage change in level of the analytes between
the treatments groups are shown in table 4.14.
Similar to the anti-TNF cohort, levels for TNFα, MIP1α, IL-10 and IL-17 were below
the detectable range in a large number of patients in both the placebo and apremilast
groups. There was a statistically significant drop in levels of TNF RI in patients
treated with apremilast, although this did not achieve significance when percentage
change from baseline was compared between the two treatment arms. There was also
a drop in IL-12p40 levels in the apremilast arm which was almost statistically
significant (p=0.06), but again not enough to produce statistically significant
differences between percentage change from baseline between the two treatment
arms. There was a trend towards fall in levels of MIG and IP-10 in patients treated
with apremilast. There were no statistically significant differences in the level of any
of the analytes analysed before and after treatment in the placebo arm of the study.
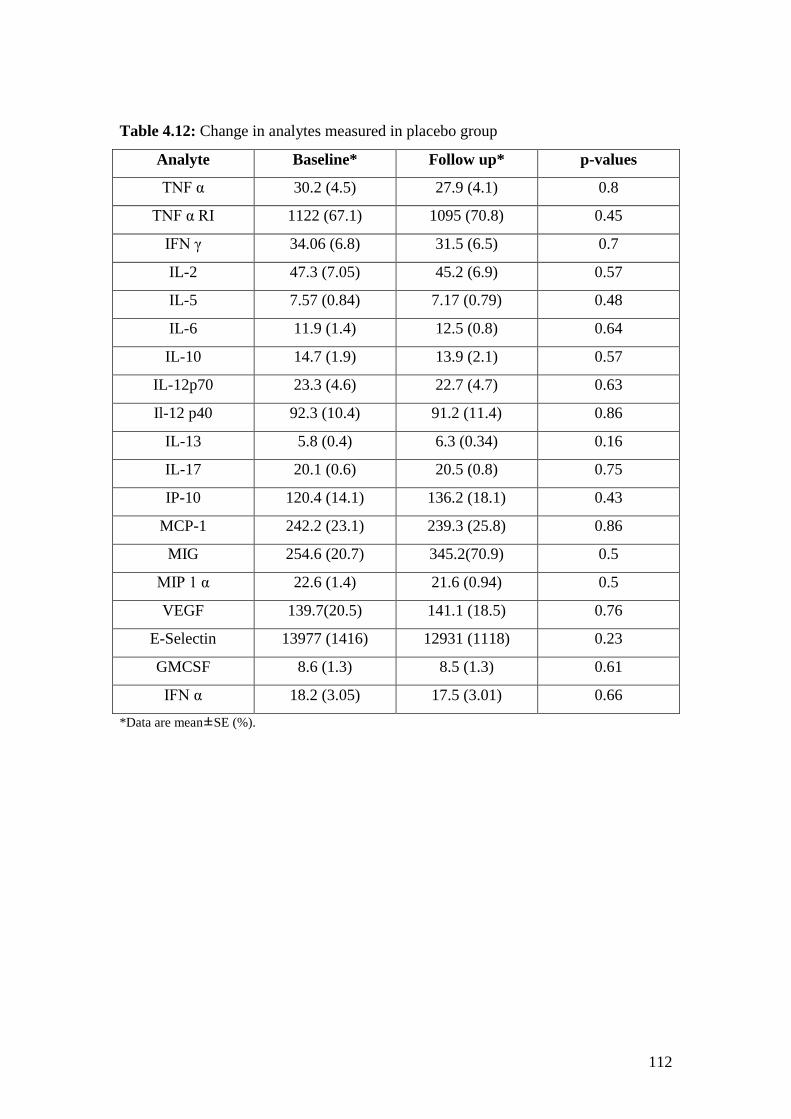
112
Table 4.12: Change in analytes measured in placebo group
Analyte Baseline* Follow up* p-values
TNF α 30.2 (4.5) 27.9 (4.1) 0.8
TNF α RI 1122 (67.1) 1095 (70.8) 0.45
IFN γ 34.06 (6.8) 31.5 (6.5) 0.7
IL-2 47.3 (7.05) 45.2 (6.9) 0.57
IL-5 7.57 (0.84) 7.17 (0.79) 0.48
IL-6 11.9 (1.4) 12.5 (0.8) 0.64
IL-10 14.7 (1.9) 13.9 (2.1) 0.57
IL-12p70 23.3 (4.6) 22.7 (4.7) 0.63
Il-12 p40 92.3 (10.4) 91.2 (11.4) 0.86
IL-13 5.8 (0.4) 6.3 (0.34) 0.16
IL-17 20.1 (0.6) 20.5 (0.8) 0.75
IP-10 120.4 (14.1) 136.2 (18.1) 0.43
MCP-1 242.2 (23.1) 239.3 (25.8) 0.86
MIG 254.6 (20.7) 345.2(70.9) 0.5
MIP 1 α 22.6 (1.4) 21.6 (0.94) 0.5
VEGF 139.7(20.5) 141.1 (18.5) 0.76
E-Selectin 13977 (1416) 12931 (1118) 0.23
GMCSF 8.6 (1.3) 8.5 (1.3) 0.61
IFN α 18.2 (3.05) 17.5 (3.01) 0.66
*Data are mean±SE (%).
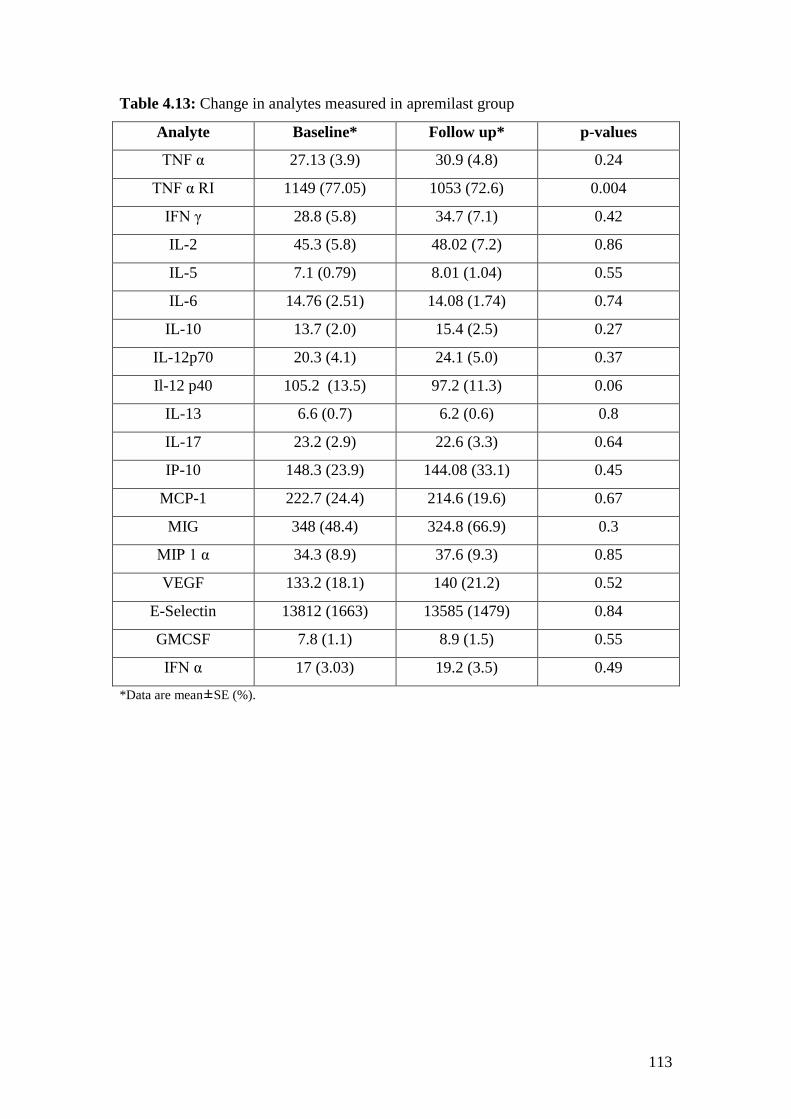
113
Table 4.13: Change in analytes measured in apremilast group
Analyte Baseline* Follow up* p-values
TNF α 27.13 (3.9) 30.9 (4.8) 0.24
TNF α RI 1149 (77.05) 1053 (72.6) 0.004
IFN γ 28.8 (5.8) 34.7 (7.1) 0.42
IL-2 45.3 (5.8) 48.02 (7.2) 0.86
IL-5 7.1 (0.79) 8.01 (1.04) 0.55
IL-6 14.76 (2.51) 14.08 (1.74) 0.74
IL-10 13.7 (2.0) 15.4 (2.5) 0.27
IL-12p70 20.3 (4.1) 24.1 (5.0) 0.37
Il-12 p40 105.2 (13.5) 97.2 (11.3) 0.06
IL-13 6.6 (0.7) 6.2 (0.6) 0.8
IL-17 23.2 (2.9) 22.6 (3.3) 0.64
IP-10 148.3 (23.9) 144.08 (33.1) 0.45
MCP-1 222.7 (24.4) 214.6 (19.6) 0.67
MIG 348 (48.4) 324.8 (66.9) 0.3
MIP 1 α 34.3 (8.9) 37.6 (9.3) 0.85
VEGF 133.2 (18.1) 140 (21.2) 0.52
E-Selectin 13812 (1663) 13585 (1479) 0.84
GMCSF 7.8 (1.1) 8.9 (1.5) 0.55
IFN α 17 (3.03) 19.2 (3.5) 0.49
*Data are mean±SE (%).
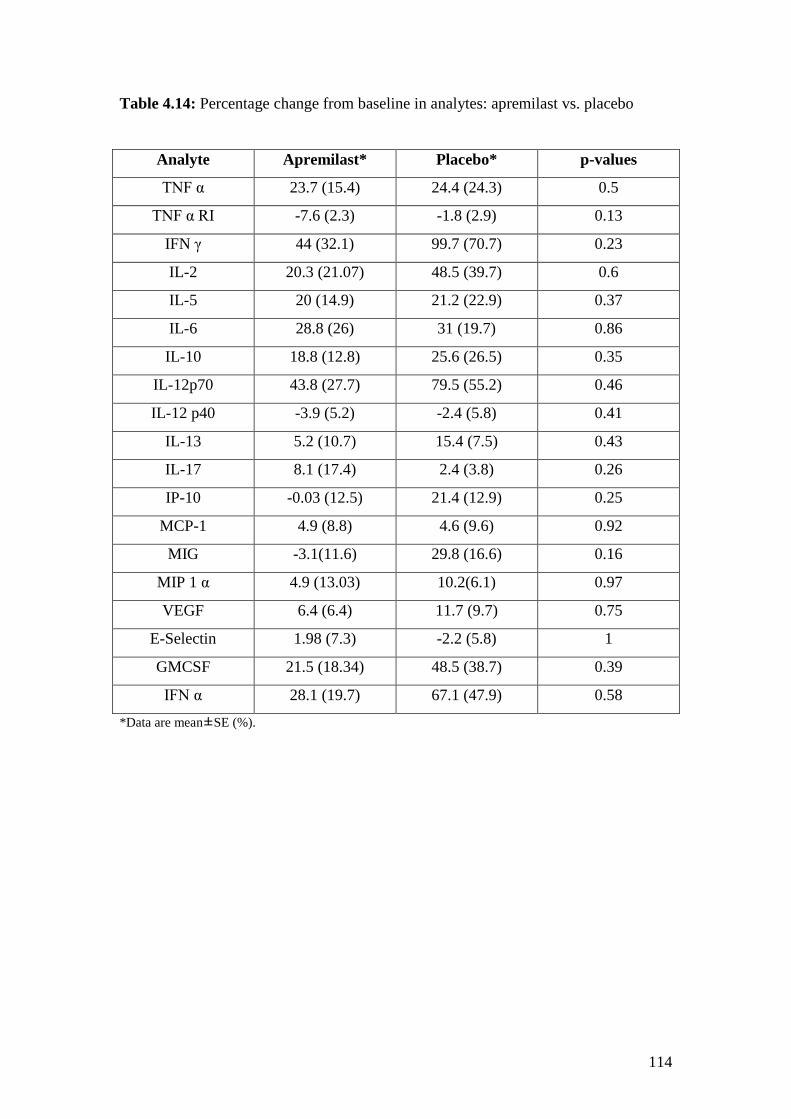
114
Table 4.14: Percentage change from baseline in analytes: apremilast vs. placebo
Analyte Apremilast* Placebo* p-values
TNF α 23.7 (15.4) 24.4 (24.3) 0.5
TNF α RI -7.6 (2.3) -1.8 (2.9) 0.13
IFN γ 44 (32.1) 99.7 (70.7) 0.23
IL-2 20.3 (21.07) 48.5 (39.7) 0.6
IL-5 20 (14.9) 21.2 (22.9) 0.37
IL-6 28.8 (26) 31 (19.7) 0.86
IL-10 18.8 (12.8) 25.6 (26.5) 0.35
IL-12p70 43.8 (27.7) 79.5 (55.2) 0.46
IL-12 p40 -3.9 (5.2) -2.4 (5.8) 0.41
IL-13 5.2 (10.7) 15.4 (7.5) 0.43
IL-17 8.1 (17.4) 2.4 (3.8) 0.26
IP-10 -0.03 (12.5) 21.4 (12.9) 0.25
MCP-1 4.9 (8.8) 4.6 (9.6) 0.92
MIG -3.1(11.6) 29.8 (16.6) 0.16
MIP 1 α 4.9 (13.03) 10.2(6.1) 0.97
VEGF 6.4 (6.4) 11.7 (9.7) 0.75
E-Selectin 1.98 (7.3) -2.2 (5.8) 1
GMCSF 21.5 (18.34) 48.5 (38.7) 0.39
IFN α 28.1 (19.7) 67.1 (47.9) 0.58
*Data are mean±SE (%).
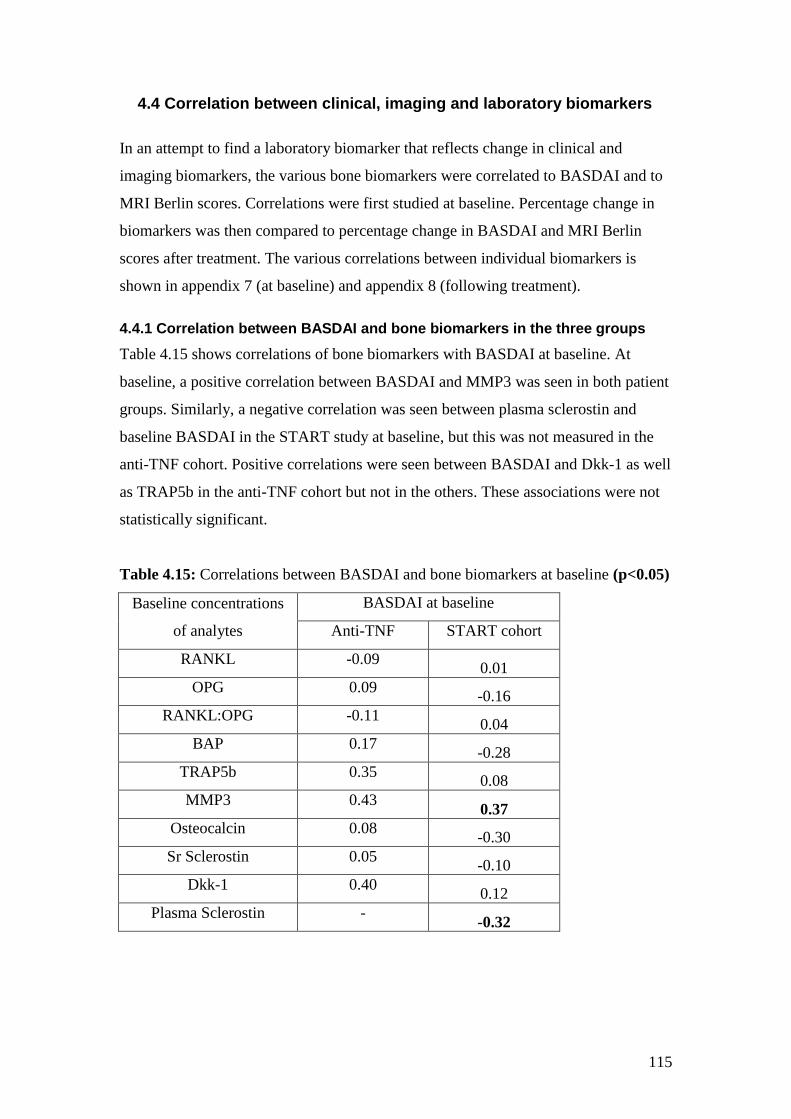
115
4.4 Correlation between clinical, imaging and laboratory biomarkers
In an attempt to find a laboratory biomarker that reflects change in clinical and
imaging biomarkers, the various bone biomarkers were correlated to BASDAI and to
MRI Berlin scores. Correlations were first studied at baseline. Percentage change in
biomarkers was then compared to percentage change in BASDAI and MRI Berlin
scores after treatment. The various correlations between individual biomarkers is
shown in appendix 7 (at baseline) and appendix 8 (following treatment).
4.4.1 Correlation between BASDAI and bone biomarkers in the three groups
Table 4.15 shows correlations of bone biomarkers with BASDAI at baseline. At
baseline, a positive correlation between BASDAI and MMP3 was seen in both patient
groups. Similarly, a negative correlation was seen between plasma sclerostin and
baseline BASDAI in the START study at baseline, but this was not measured in the
anti-TNF cohort. Positive correlations were seen between BASDAI and Dkk-1 as well
as TRAP5b in the anti-TNF cohort but not in the others. These associations were not
statistically significant.
Table 4.15: Correlations between BASDAI and bone biomarkers at baseline (p<0.05)
Baseline concentrations
of analytes
BASDAI at baseline
Anti-TNF START cohort
RANKL -0.09 0.01
OPG 0.09 -0.16
RANKL:OPG -0.11 0.04
BAP 0.17 -0.28
TRAP5b 0.35 0.08
MMP3 0.43 0.37
Osteocalcin 0.08 -0.30
Sr Sclerostin 0.05 -0.10
Dkk-1 0.40 0.12
Plasma Sclerostin - -0.32
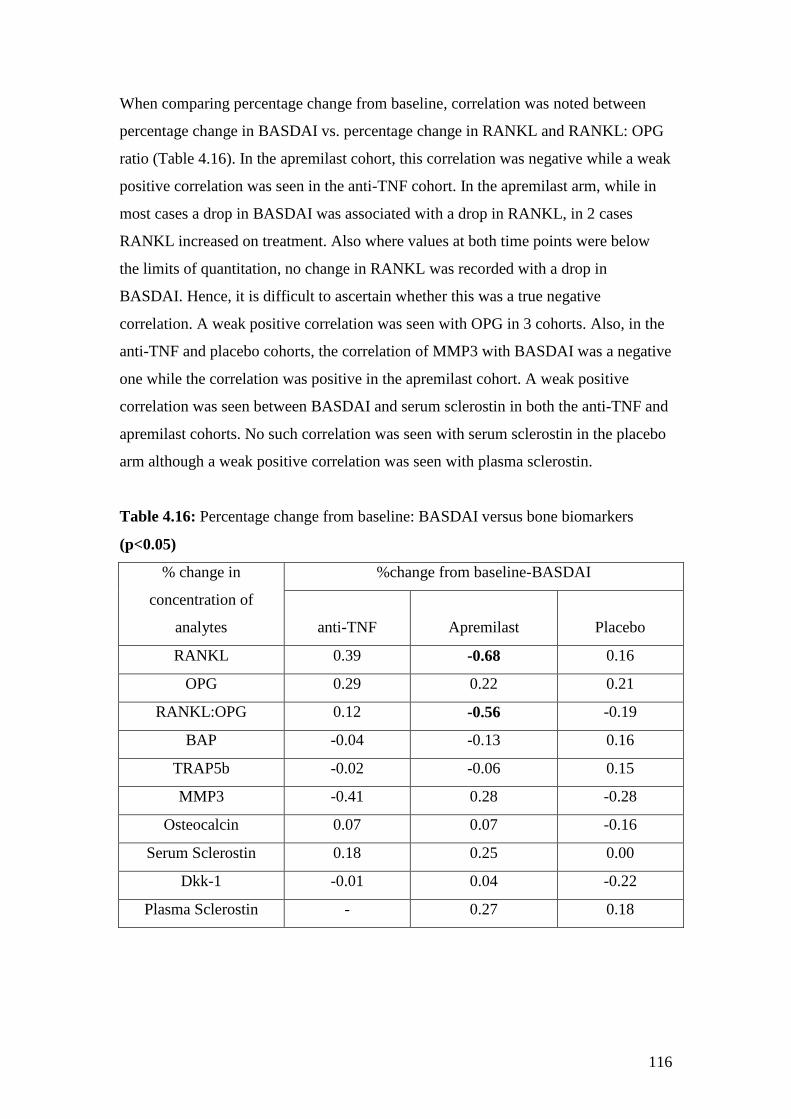
116
When comparing percentage change from baseline, correlation was noted between
percentage change in BASDAI vs. percentage change in RANKL and RANKL: OPG
ratio (Table 4.16). In the apremilast cohort, this correlation was negative while a weak
positive correlation was seen in the anti-TNF cohort. In the apremilast arm, while in
most cases a drop in BASDAI was associated with a drop in RANKL, in 2 cases
RANKL increased on treatment. Also where values at both time points were below
the limits of quantitation, no change in RANKL was recorded with a drop in
BASDAI. Hence, it is difficult to ascertain whether this was a true negative
correlation. A weak positive correlation was seen with OPG in 3 cohorts. Also, in the
anti-TNF and placebo cohorts, the correlation of MMP3 with BASDAI was a negative
one while the correlation was positive in the apremilast cohort. A weak positive
correlation was seen between BASDAI and serum sclerostin in both the anti-TNF and
apremilast cohorts. No such correlation was seen with serum sclerostin in the placebo
arm although a weak positive correlation was seen with plasma sclerostin.
Table 4.16: Percentage change from baseline: BASDAI versus bone biomarkers
(p<0.05)
% change in
concentration of
analytes
%change from baseline-BASDAI
anti-TNF Apremilast Placebo
RANKL 0.39 -0.68 0.16
OPG 0.29 0.22 0.21
RANKL:OPG 0.12 -0.56 -0.19
BAP -0.04 -0.13 0.16
TRAP5b -0.02 -0.06 0.15
MMP3 -0.41 0.28 -0.28
Osteocalcin 0.07 0.07 -0.16
Serum Sclerostin 0.18 0.25 0.00
Dkk-1 -0.01 0.04 -0.22
Plasma Sclerostin - 0.27 0.18
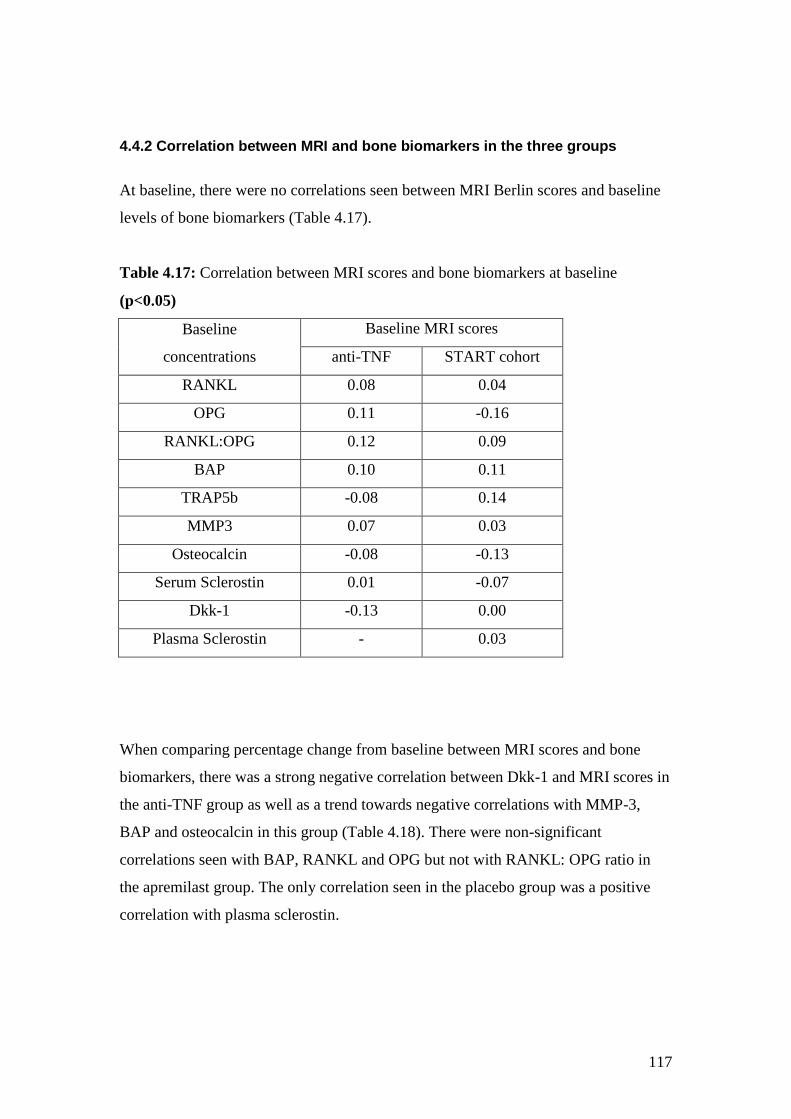
117
4.4.2 Correlation between MRI and bone biomarkers in the three groups
At baseline, there were no correlations seen between MRI Berlin scores and baseline
levels of bone biomarkers (Table 4.17).
Table 4.17: Correlation between MRI scores and bone biomarkers at baseline
(p<0.05)
Baseline
concentrations
Baseline MRI scores
anti-TNF START cohort
RANKL 0.08 0.04
OPG 0.11 -0.16
RANKL:OPG 0.12 0.09
BAP 0.10 0.11
TRAP5b -0.08 0.14
MMP3 0.07 0.03
Osteocalcin -0.08 -0.13
Serum Sclerostin 0.01 -0.07
Dkk-1 -0.13 0.00
Plasma Sclerostin - 0.03
When comparing percentage change from baseline between MRI scores and bone
biomarkers, there was a strong negative correlation between Dkk-1 and MRI scores in
the anti-TNF group as well as a trend towards negative correlations with MMP-3,
BAP and osteocalcin in this group (Table 4.18). There were non-significant
correlations seen with BAP, RANKL and OPG but not with RANKL: OPG ratio in
the apremilast group. The only correlation seen in the placebo group was a positive
correlation with plasma sclerostin.
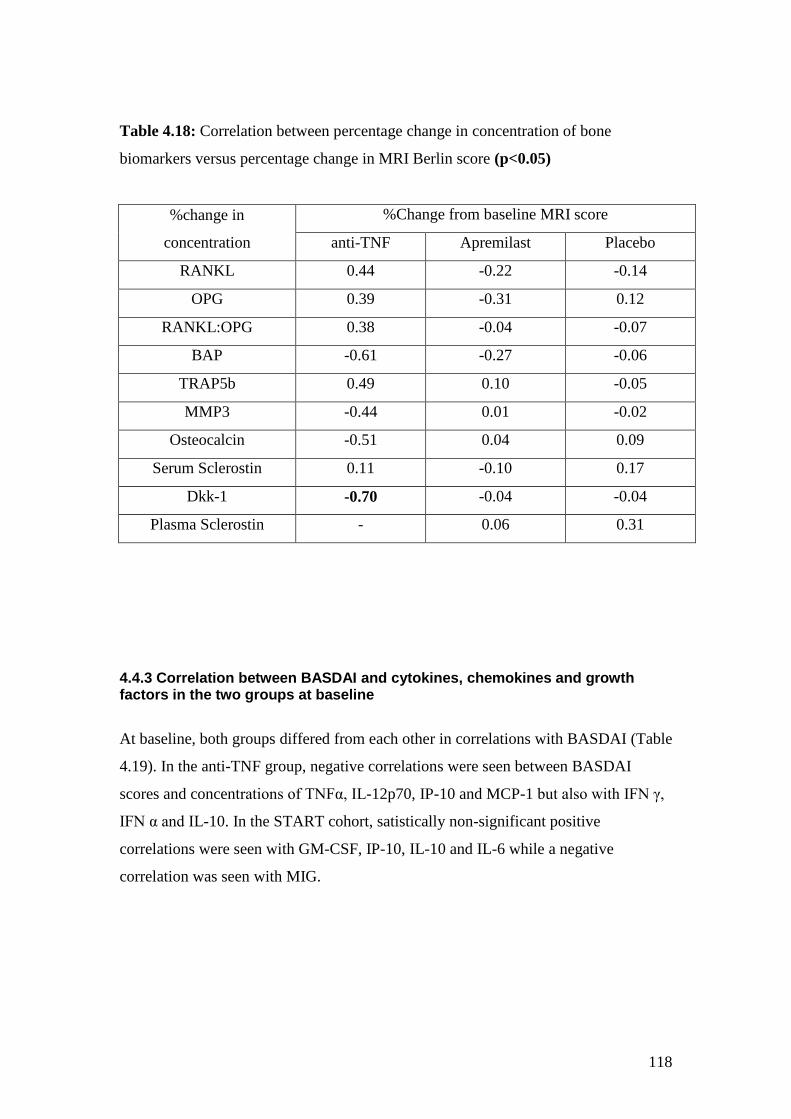
118
Table 4.18: Correlation between percentage change in concentration of bone
biomarkers versus percentage change in MRI Berlin score (p<0.05)
%change in
concentration
%Change from baseline MRI score
anti-TNF Apremilast Placebo
RANKL 0.44 -0.22 -0.14
OPG 0.39 -0.31 0.12
RANKL:OPG 0.38 -0.04 -0.07
BAP -0.61 -0.27 -0.06
TRAP5b 0.49 0.10 -0.05
MMP3 -0.44 0.01 -0.02
Osteocalcin -0.51 0.04 0.09
Serum Sclerostin 0.11 -0.10 0.17
Dkk-1 -0.70 -0.04 -0.04
Plasma Sclerostin - 0.06 0.31
4.4.3 Correlation between BASDAI and cytokines, chemokines and growth factors in the two groups at baseline
At baseline, both groups differed from each other in correlations with BASDAI (Table
4.19). In the anti-TNF group, negative correlations were seen between BASDAI
scores and concentrations of TNFα, IL-12p70, IP-10 and MCP-1 but also with IFN γ,
IFN α and IL-10. In the START cohort, satistically non-significant positive
correlations were seen with GM-CSF, IP-10, IL-10 and IL-6 while a negative
correlation was seen with MIG.
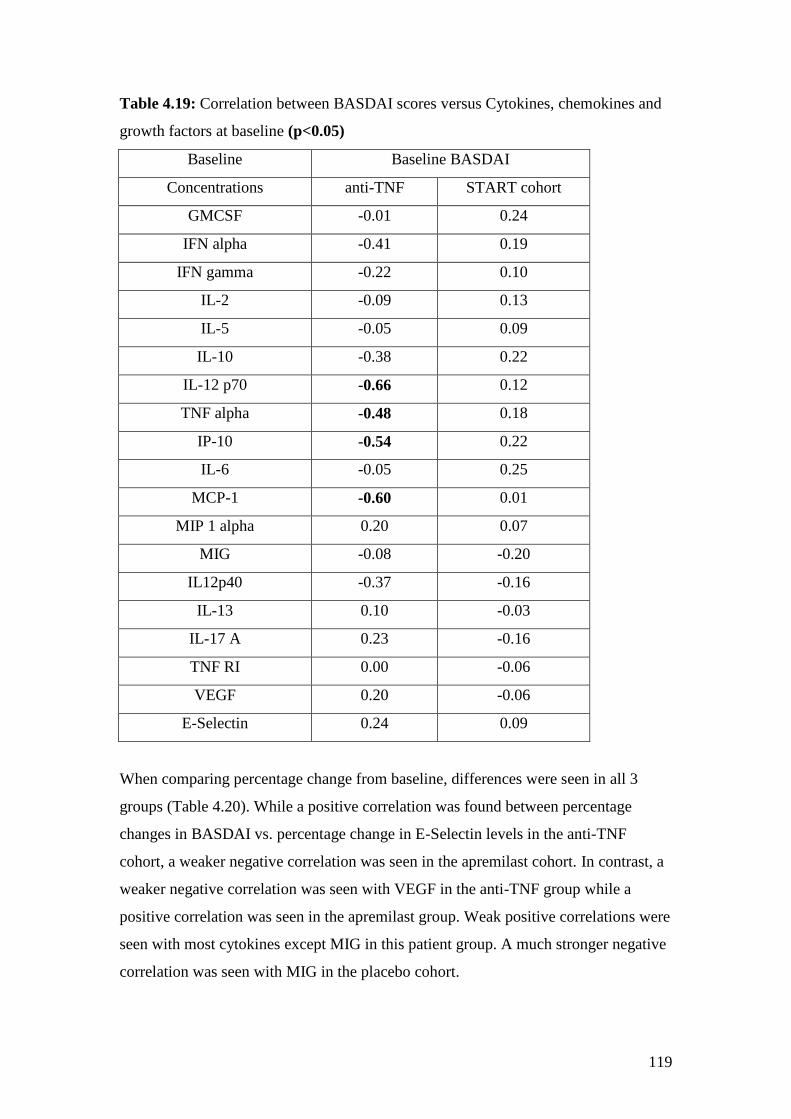
119
Table 4.19: Correlation between BASDAI scores versus Cytokines, chemokines and
growth factors at baseline (p<0.05)
Baseline Baseline BASDAI
Concentrations anti-TNF START cohort
GMCSF -0.01 0.24
IFN alpha -0.41 0.19
IFN gamma -0.22 0.10
IL-2 -0.09 0.13
IL-5 -0.05 0.09
IL-10 -0.38 0.22
IL-12 p70 -0.66 0.12
TNF alpha -0.48 0.18
IP-10 -0.54 0.22
IL-6 -0.05 0.25
MCP-1 -0.60 0.01
MIP 1 alpha 0.20 0.07
MIG -0.08 -0.20
IL12p40 -0.37 -0.16
IL-13 0.10 -0.03
IL-17 A 0.23 -0.16
TNF RI 0.00 -0.06
VEGF 0.20 -0.06
E-Selectin 0.24 0.09
When comparing percentage change from baseline, differences were seen in all 3
groups (Table 4.20). While a positive correlation was found between percentage
changes in BASDAI vs. percentage change in E-Selectin levels in the anti-TNF
cohort, a weaker negative correlation was seen in the apremilast cohort. In contrast, a
weaker negative correlation was seen with VEGF in the anti-TNF group while a
positive correlation was seen in the apremilast group. Weak positive correlations were
seen with most cytokines except MIG in this patient group. A much stronger negative
correlation was seen with MIG in the placebo cohort.
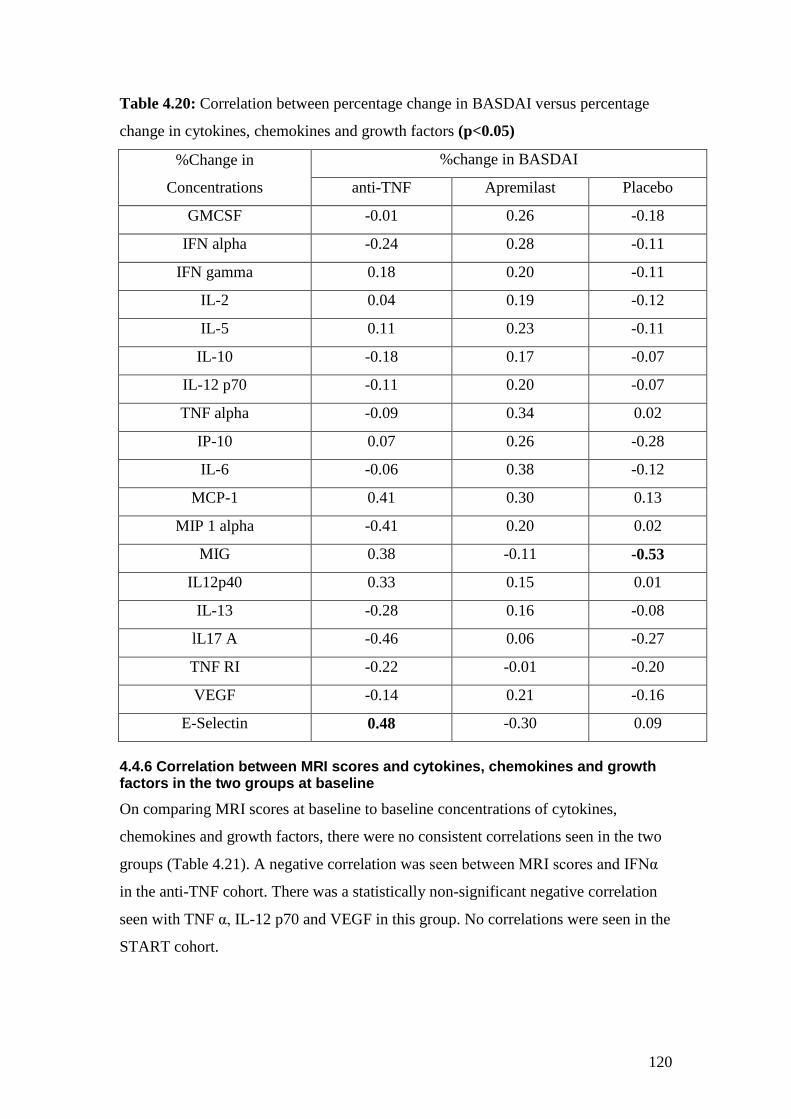
120
Table 4.20: Correlation between percentage change in BASDAI versus percentage
change in cytokines, chemokines and growth factors (p<0.05)
%Change in
Concentrations
%change in BASDAI
anti-TNF Apremilast Placebo
GMCSF -0.01 0.26 -0.18
IFN alpha -0.24 0.28 -0.11
IFN gamma 0.18 0.20 -0.11
IL-2 0.04 0.19 -0.12
IL-5 0.11 0.23 -0.11
IL-10 -0.18 0.17 -0.07
IL-12 p70 -0.11 0.20 -0.07
TNF alpha -0.09 0.34 0.02
IP-10 0.07 0.26 -0.28
IL-6 -0.06 0.38 -0.12
MCP-1 0.41 0.30 0.13
MIP 1 alpha -0.41 0.20 0.02
MIG 0.38 -0.11 -0.53
IL12p40 0.33 0.15 0.01
IL-13 -0.28 0.16 -0.08
lL17 A -0.46 0.06 -0.27
TNF RI -0.22 -0.01 -0.20
VEGF -0.14 0.21 -0.16
E-Selectin 0.48 -0.30 0.09
4.4.6 Correlation between MRI scores and cytokines, chemokines and growth factors in the two groups at baseline
On comparing MRI scores at baseline to baseline concentrations of cytokines,
chemokines and growth factors, there were no consistent correlations seen in the two
groups (Table 4.21). A negative correlation was seen between MRI scores and IFNα
in the anti-TNF cohort. There was a statistically non-significant negative correlation
seen with TNF α, IL-12 p70 and VEGF in this group. No correlations were seen in the
START cohort.
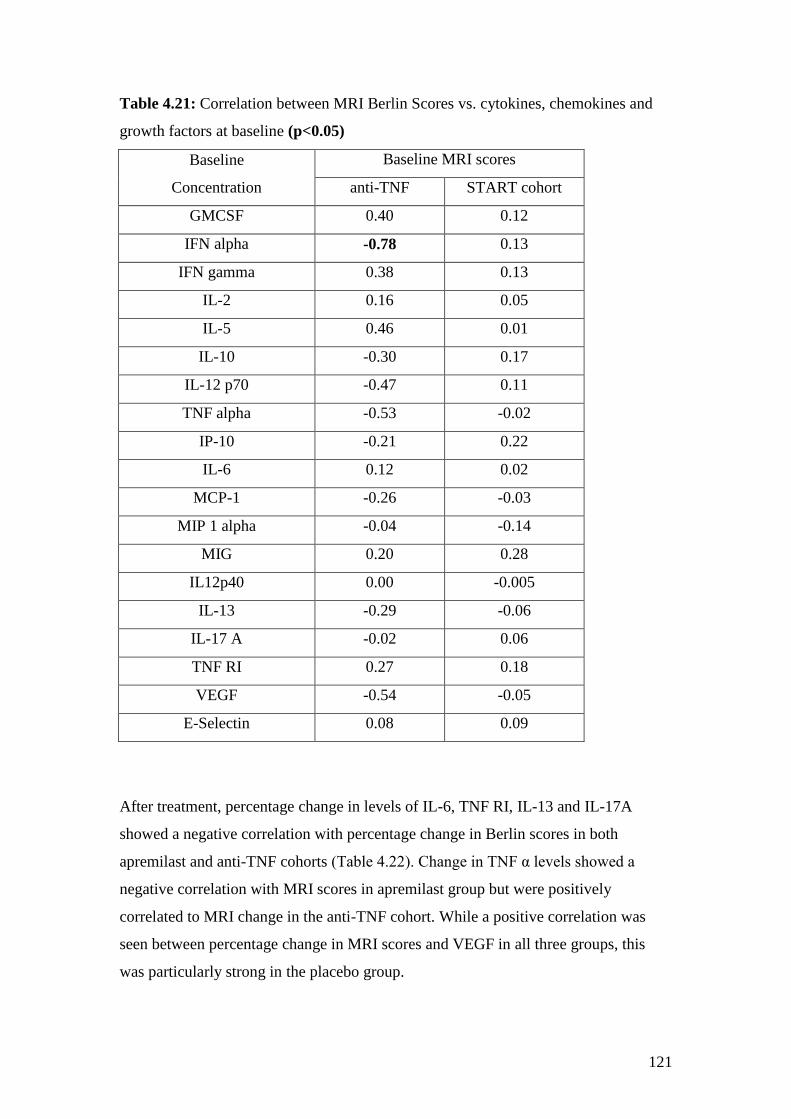
121
Table 4.21: Correlation between MRI Berlin Scores vs. cytokines, chemokines and
growth factors at baseline (p<0.05)
Baseline
Concentration
Baseline MRI scores
anti-TNF START cohort
GMCSF 0.40 0.12
IFN alpha -0.78 0.13
IFN gamma 0.38 0.13
IL-2 0.16 0.05
IL-5 0.46 0.01
IL-10 -0.30 0.17
IL-12 p70 -0.47 0.11
TNF alpha -0.53 -0.02
IP-10 -0.21 0.22
IL-6 0.12 0.02
MCP-1 -0.26 -0.03
MIP 1 alpha -0.04 -0.14
MIG 0.20 0.28
IL12p40 0.00 -0.005
IL-13 -0.29 -0.06
IL-17 A -0.02 0.06
TNF RI 0.27 0.18
VEGF -0.54 -0.05
E-Selectin 0.08 0.09
After treatment, percentage change in levels of IL-6, TNF RI, IL-13 and IL-17A
showed a negative correlation with percentage change in Berlin scores in both
apremilast and anti-TNF cohorts (Table 4.22). Change in TNF α levels showed a
negative correlation with MRI scores in apremilast group but were positively
correlated to MRI change in the anti-TNF cohort. While a positive correlation was
seen between percentage change in MRI scores and VEGF in all three groups, this
was particularly strong in the placebo group.
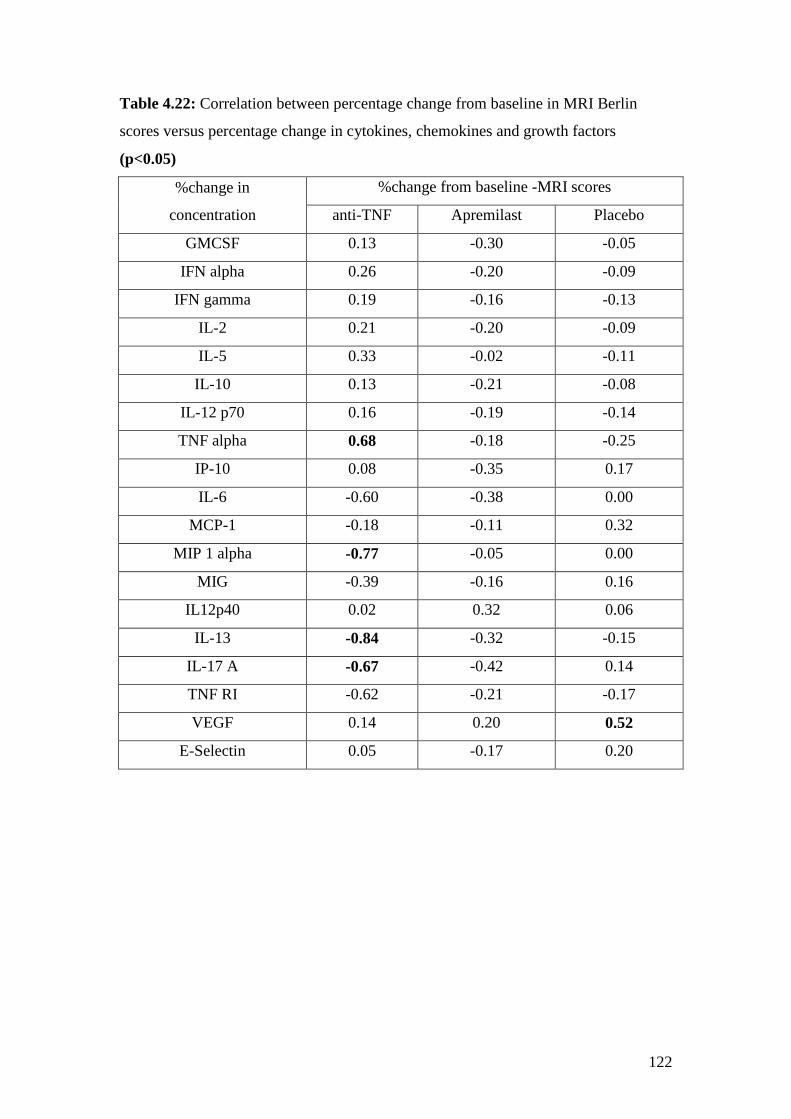
122
Table 4.22: Correlation between percentage change from baseline in MRI Berlin
scores versus percentage change in cytokines, chemokines and growth factors
(p<0.05)
%change in
concentration
%change from baseline -MRI scores
anti-TNF Apremilast Placebo
GMCSF 0.13 -0.30 -0.05
IFN alpha 0.26 -0.20 -0.09
IFN gamma 0.19 -0.16 -0.13
IL-2 0.21 -0.20 -0.09
IL-5 0.33 -0.02 -0.11
IL-10 0.13 -0.21 -0.08
IL-12 p70 0.16 -0.19 -0.14
TNF alpha 0.68 -0.18 -0.25
IP-10 0.08 -0.35 0.17
IL-6 -0.60 -0.38 0.00
MCP-1 -0.18 -0.11 0.32
MIP 1 alpha -0.77 -0.05 0.00
MIG -0.39 -0.16 0.16
IL12p40 0.02 0.32 0.06
IL-13 -0.84 -0.32 -0.15
IL-17 A -0.67 -0.42 0.14
TNF RI -0.62 -0.21 -0.17
VEGF 0.14 0.20 0.52
E-Selectin 0.05 -0.17 0.20
123
4.5 Discussion
In this chapter, I have described the changes to different laboratory biomarkers in the
three patient cohorts. Inflammatory markers such as ESR or CRP did show an
improvement with treatment in the anti-TNF cohort but there was no correlation seen
between percentage change in BASDAI and change in ESR or CRP. Also, the
inflammatory markers did not show much change in the apremilast or placebo
cohorts. The change in IgA was insignificant in all 3 cohorts suggesting that this may
not be a reliable biomarker when monitoring change over short periods of treatment.
One would expect that correlations between laboratory biomarkers and clinical
indices as well as imaging markers would be the same in both patient groups at
baseline, but differences were seen both in the bone biomarkers as well as cytokines at
baseline between the two groups. It is difficult to know whether this was related to
differences in disease activity between the anti-TNF and START cohorts.
Furthermore, one would expect to see similar changes in the laboratory biomarkers
after treatment with either anti-TNF or apremilast, given that both show improvement
in clinical and imaging scores. This again proved not to be the case.
The bone biomarkers were probably the most informative subset of biomarkers
studied showing change with treatment that differed between the different therapeutic
agents. The most apparent difference between the anti-TNF and apremilast groups
was in the RANKL: OPG ratio. There was a negative correlation between change in
this ratio and change in BASDAI seen in patients treated with apremilast, whilst a
positive correlation was seen in patients treated with anti-TNF therapy. It is not clear
whether this was due to the statistically significant drop in OPG levels or a rise in
RANKL or possibly both in the anti-TNF group. This may suggest a different
mechanism of action between the two drugs. A correlation was seen with percentage
change in BASDAI versus percentage change in the RANKL:OPG ratio in the
apremilast group suggesting that at least in the apremilast cohort, there may be a link
between disease activity and the RANKL:OPG ratio. Previous studies have proposed
that CREB, which is activated by phosphodiesterase inhibition, may inhibit activation
of NF-κB by competing for CREB co-activators [159]. However, there are no other
124
published reports on the effect of apremilast on RANKL in other patient cohorts to
compare our results with.
A rise in osteocalcin was common to both apremilast and anti-TNF therapy. A
marginal rise in BAP with a fall in MMP3 was also seen in both the anti-TNF and
apremilast with opposite effects seen in the placebo group. Osteocalcin and BAP are
markers of bone formation. The fact that the level of BAP increased in both anti-TNF
and apremilast cohorts suggests that this may represent a reparative process after
inflammation has settled or an improvement in bone density in these AS patients.
There were no bone density scans performed to prove the latter but percentage change
from baseline in MRI scores in the anti-TNF cohort showed a trend towards negative
correlation with percentage change in levels of BAP consistent with the hypothesis
that resolution of osteitis is accompanied by rising bone anabolism. However, given
the variable volumes of osteitis involvement in the spines of the anti-TNF treated
cohort, it is perhaps not surprising that statistically significant relationships between
MRI changes and BAP were not observed. MMP3 is required for both the breakdown
and production of extra-cellular matrix. A reduction in levels was seen in both cohorts
but a trend towards a negative correlation between percentage change in MMP3 and
both percentage change in BASDAI as well as MRI scores was only seen in the anti-
TNF cohort.
TRAP5b is a marker of osteoclastic activity. Levels of TRAP5b did rise in the
apremilast group but dropped marginally in the anti-TNF cohort as well as in the
placebo arm. There was a trend towards a positive correlation between percentage
change in TRAP5b and percentage change in MRI score in the anti-TNF cohort.
Given the greater reduction in MRI scores in this group, the corresponding trend in
TRAP5b may reflect a decreasing osteoclastogenesis that accompanies resolution of
bone oedema lesions. The opposite effect in the apremilast cohort is difficult to
explain but may represent concurrent processes of osteoclastogenesis and
osteoblastogenesis with bone remodelling. In fact, when percentage change in
TRAP5b was correlated to percentage change in RANKL: OPG, there was a strong
negative correlation seen between these two biomarkers in the apremilast cohort
(Appendix 8).
125
Sclerostin and Dkk-1 are inhibitors of the Wnt pathway and hence inhibit bone
formation. A drop in levels of these biomarkers would therefore indicate a release of
this inhibition leading to new bone formation. At baseline, there was a strong positive
correlation between RANKL and sclerostin in all three patient cohorts suggesting that
sclerostin levels play an important role in the pathophysiology of AS (Appendix 7).
There was a correlation seen between Dkk-1 and sclerostin at baseline but only in the
anti-TNF cohort. It is not clear whether this was due to the fact that patients in the
anti-TNF cohort had higher disease activity with higher MRI Berlin scores or this was
just a statistical coincidence.
A significant drop in plasma sclerostin levels was seen in the apremilast group but
levels of sclerostin in plasma could not be measured in the anti-TNF cohort as plasma
samples were unavailable for testing. There was a similar trend with a drop in serum
sclerostin in this group although this association was weak. A fall in levels of
sclerostin was mirrored by a fall in Dkk-1 levels in the apremilast group. This was
less clear, however, in the anti-TNF group possibly suggesting a change in the
relationship between these biomarkers after treatment. Dkk-1 levels also strongly
correlated to changes in Berlin scores in the anti-TNF cohort but not to change in
BASDAI. There was also a positive correlation between percentage change in levels
of Dkk-1 and percentage change in osteocalcin, which is a marker of bone formation,
in the anti-TNF cohort.
It is also interesting to note that there were different biomarkers showed correlation to
clinical and imaging biomarkers. Changes in BASDAI correlated better with change
in RANKL: OPG and sclerostin levels. However, changes in osteocalcin, BAP,
TRAP5b and Dkk-1 (in the anti-TNF cohort) correlated better with MRI changes.
MMP3 was the only bone biomarker which correlated with both clinical as well as
imaging scores. This would suggest that different biomarkers are indicative of
different processes within disease pathogenesis.
Cytokines, chemokines and growth factors showed little change with therapy in the
apremilast and placebo groups. Like the bone biomarkers, there were different
correlations seen between BASDAI as well as baseline MRI scores and this group of
biomarkers in the different patient groups which are difficult to explain. In particular,
126
a positive correlation between baseline MRI score and TNF receptor I levels was seen
in the anti-TNF and apremilast cohort but a negative correlation was seen in the
placebo cohort. Similarly, a trend towards a positive correlation was seen between
baseline MRI scores and VEGF in the apremilast and placebo groups but there was a
trend towards a negative correlation in the anti-TNF cohort.
In the anti-TNF cohort, there was a drop in the level of TNF RI and a rise in the
circulating TNF levels. The rise in circulating levels of TNFα after anti-TNF is a well
recognised phenomenon and has been previously described in the early studies with
anti-TNF agents in rheumatoid arthritis [160]. This does not however represent a true
rise in the circulating levels of bioactive analyte. Similar results have been shown by
others in patients with AS receiving etanercept therapy [136]. When percentage
change from baseline in TNF α and TNF RI was compared with percentage change in
BASDAI, no correlation was seen. However, on comparing these with percentage
change in MRI scores in this cohort, a direct correlation was seen between these
parameters and MRI scores. The drop in TNF RI, but not the rise in TNF, were also
seen in the apremilast group but did not correlate to either BASDAI or MRI scores in
this group.
Percentage change in E-selectin levels correlated with change in BASDAI in the anti-
TNF cohort. No other significant correlations were seen with BASDAI in the
apremilast group, but a negative correlation was seen with change in MIG levels in
the placebo group.
On comparing percentage change in cytokines, chemokines and growth factors with
percentage change in Berlin MRI scores, correlations were seen in IL-13, IL-17A,
MIP1α and TNF α in the anti-TNF cohort. These correlations may not be true as there
were a lot of patients that had levels below the limits of quantitation for these assays.
A trend towards a negative correlation was also seen between percentage change in
MRI scores and percentage change in concentrations of IL-6 as well as TNF RI levels
in the anti-TNF cohort. No significant changes were seen in IL-6 with apremilast.
This would be in keeping with findings in pre-clinical studies on human synovium
where there was a reduction in IL-6 but this reduction was quite modest [35]. This
may also explain why CRP levels did not fall in this group of patients. In the placebo
127
cohort a positive correlation was observed between percentage change in VEGF and
percentage change in MRI Berlin scores suggesting increased vascularity in areas of
bone oedema in this patient cohort.
When reviewing distinctions in biomarker responses observed between anti-TNF
treated patients and those participating in the apremilast trial, it is important to note
that the clinical effect size is of greater magnitude with anti-TNF than was observed
with apremilast. Furthermore, and importantly, apremilast modulates a number of pro-
inflammatory cytokines but also augments some anti-inflammatory cytokine activity.
This might in part explain differential responses of biomarkers, such as RANKL:
OPG. However, the clinical significance and implications of these observations, if
any, with respect to progression of syndesmophyte formation and long term ankylosis
will require further research.
To summarize, a universal laboratory biomarker that reflects changes in the patient’s
clinical picture remains elusive in AS. Laboratory biomarkers are probably more
helpful in understanding the mechanism of disease processes and the mode of action
of drugs than in assessing response to therapy. While the RANKL: OPG ratio seems
to play an important role in disease pathogenesis, it is affected differently by different
drugs, and this diversity of action may be something which would benefit from further
investigation. Similarly the interaction between sclerostin and Dkk-1 appears to differ
with different treatment agents. Markers of bone formation such as BAP and
osteocalcin may be helpful but the changes seen are small over the short time period
of this study and may require studies with long time frames to examine their true
usefulness. Markers of bone loss such as MMP3 and TRAP5b did not show adequate
change to reflect the clinical picture. Changes in cytokines, chemokines and growth
factors tend to be more uniform between different treatment groups with TNF RI and
E-selectin being potential biomarkers of response but these seem to be less sensitive
to change and require large improvements in clinical scores before significant
differences in their circulating levels can be observed.
128
4.6 Limitations and Future Work:
A large number of correlations were calculated between various biomarkers without
applying Bonferroni’s correction and hence this is likely to lead to some associations
that would occur by coincidence. The numbers in each patient cohort were not
calculated with a view to assess change in laboratory biomarkers but to assess clinical
response. Hence, the analysis was purely exploratory rather than to answer a direct
question. Due to small numbers, patients treated with etanercept and adalimumab in
the anti-TNF were not studied separately. There were also a lot of results that were
below the detectable range of assays where minimum detectable values for individual
assays were used for calculations that may have resulted in correlations that do not
truly exist.
Further work needs to be done to understand the complex relationships between bone
biomarkers, cytokines, chemokines and growth factors. It is also important to
understand what happens to these biomarkers in the early stage of AS and to study
them progressively over a patient’s lifetime to understand changes that occur with
disease flares and with new bone formation.

129
Chapter 5: Volumetric analysis of lesions on MRI using Dynamika software as a biomarker of response to therapy
130
5.0 Abstract:
Introduction: There are a number of different scoring systems available to score
active bone oedema lesions on STIR sequences of MRI scans in AS patients. All of
these methods provide a semi-quantitative scoring and correlate poorly to clinical
scores.
Aim: To quantify the extent of inflammatory disease in the spine and changes therein
with treatment which reflect changes in clinical state to a greater extent than existing
measures by developing a volumetric MRI-based technique.
Methods: AS patients about to start anti-TNF therapy were consented to have an MRI
scan prior to and 12 weeks after commencing anti-TNF therapy. All patients were
scanned using the same scanner and the same protocol at both time points. Scans were
anonymized for patient identity and time points. They were previously scored using
Berlin score by 2 musculoskeletal radiologists concurrently. They were subjected to
volumetric analysis using Dynamika software by 2 scorers independently. Area in
mm2 and intensity of lesions on individual slices were compared using Bland-Altman
plots. Volumes of entire lesions were calculated in mm3. Volumes and intensity of
lesions were also compared using Bland-Altman plots. Volumes of all lesions on each
scan were added together to calculate total volume as well as mean intensity of all
lesions. The volume of lesions was then compared to total Berlin scores as well as
BASDAI scores using Spearman Rank correlation. Percentage changes in volume,
intensity and the product of volume and intensity were also compared to percentage
change in BASDAI scores. Correlations were also made with bone biomarkers. The
software was further modified to allow for automated volume generation and the
process of scoring repeated by one of the scorers to allow for intra-observer
variability.
Results: 11 pairs of scans were available for scoring at the 2 time points. Bland-
Altman plots for area in mm2, volume in mm
3, mean and maximum intensity showed
good inter-observer variability. A good correlation was seen between total volume
scores using volumetric analysis and total Berlin scores, more so at baseline (r=0.7)
than at follow-up (r=0.4). No correlation was seen with BASDAI scores. However,
when percentage change from baseline in BASDAI was compared to percentage
131
change from baseline in Berlin score, volume of lesions, intensity as well as the
product of volume and intensity, a good correlation was seen between BASDAI and
volume in mm3 (0.8 for scorer 1 and 0.6 for scorer 2) as well as the product of volume
and intensity (0.7 for both scorers). A poor correlation was seen between Berlin scores
and BASDAI (r=0.2). Intra-observer variability could only be tested for scans at
baseline as the number of lesions amenable to automated volumetric analysis was
insufficient to allow comparison of scans at follow up.
When manual scores were compared before and after treatment, there was a
statistically significant improvement in BASDAI, MRI Berlin scores for all patients
but also a statistically significant improvement in the product of volume and intensity
for those that responded to treatment (n=8). A positive correlation was seen with
RANKL: OPG ratio and a negative correlation was seen with MMP3.
Conclusion: Volumetric analysis of active bone oedema lesions on STIR MRI
sequences compares well to semi-quantitative scoring using the Berlin method. Unlike
semi-quantitative scoring, volumetric analysis also shows a good correlation to
change in BASDAI scores hence linking clinical and imaging biomarkers.
132
5.1 Introduction
In the last 3 chapters, I have discussed the utility of various clinical, laboratory and
imaging biomarkers. Although semi-quantitative scoring showed significant change
with treatment where there was a large change from baseline, a poor correlation was
seen between clinical scores and semi-quantitative scores. This chapter describes a
novel methodology to carry out volumetric analysis of lesions. The hypothesis was
that if one could quantify the volume of bone oedema on MRI scans this would be a
more sensitive measure of change with treatment than existing semi-quantitative
scoring. At the same time, combining the volume with intensity may improve the
correlation with clinical scores as in some cases only intensity of lesions changes with
treatment.
Although, the concept of quantification is not new to MRI and software such as
ImageJ allows this to be carried out, it does so on individual slices of MRI scans. We
initially devised a scanning protocol which allowed for slices of 1mm x 1mm x 1mm,
without any gaps between slices hence allowing for true volume to be calculated.
However, this technique did not yield good quality pictures and the protocol had to be
modified to allow for gaps between slices in order to improve image quality. Hence, it
became necessary to develop software that would take these gaps into account
between slices. Image Analysis, a commercial organization based in Leeds, modified
an existing software program, Dynamika, for this purpose.
5.2 Methods
5.2.1 Patients and scans
The anti-TNF cohort was used for this proof of concept study. Scans from this cohort
were anonymized and numbered 1 to 15 by one of the radiographers. Scans carried
out at the two time points on the same patient were randomly annotated as A and B.
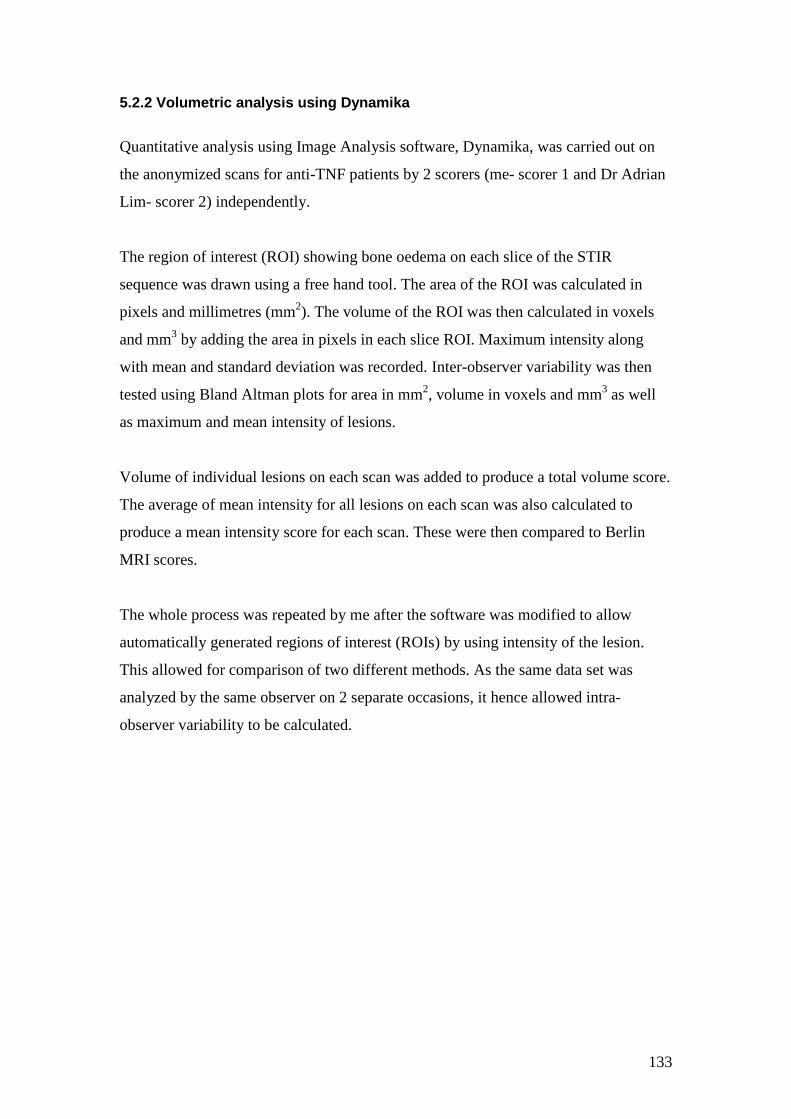
133
5.2.2 Volumetric analysis using Dynamika
Quantitative analysis using Image Analysis software, Dynamika, was carried out on
the anonymized scans for anti-TNF patients by 2 scorers (me- scorer 1 and Dr Adrian
Lim- scorer 2) independently.
The region of interest (ROI) showing bone oedema on each slice of the STIR
sequence was drawn using a free hand tool. The area of the ROI was calculated in
pixels and millimetres (mm2). The volume of the ROI was then calculated in voxels
and mm3 by adding the area in pixels in each slice ROI. Maximum intensity along
with mean and standard deviation was recorded. Inter-observer variability was then
tested using Bland Altman plots for area in mm2, volume in voxels and mm
3 as well
as maximum and mean intensity of lesions.
Volume of individual lesions on each scan was added to produce a total volume score.
The average of mean intensity for all lesions on each scan was also calculated to
produce a mean intensity score for each scan. These were then compared to Berlin
MRI scores.
The whole process was repeated by me after the software was modified to allow
automatically generated regions of interest (ROIs) by using intensity of the lesion.
This allowed for comparison of two different methods. As the same data set was
analyzed by the same observer on 2 separate occasions, it hence allowed intra-
observer variability to be calculated.
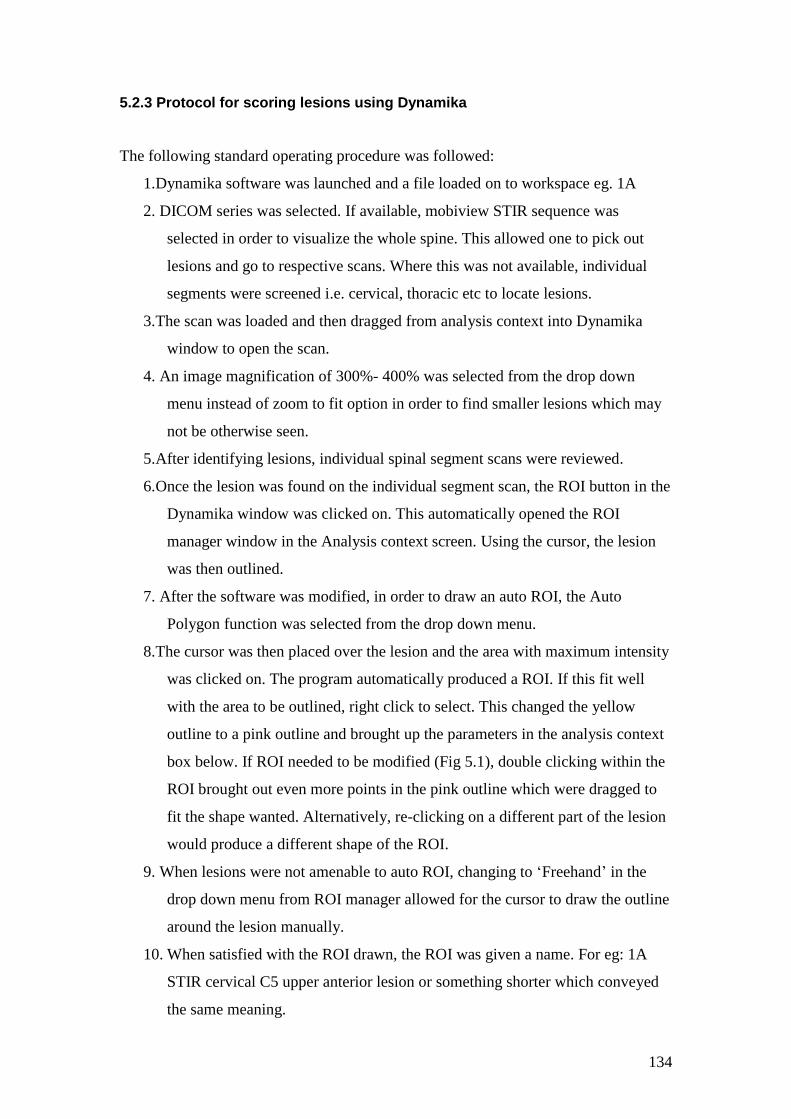
134
5.2.3 Protocol for scoring lesions using Dynamika
The following standard operating procedure was followed:
1. Dynamika software was launched and a file loaded on to workspace eg. 1A
2. DICOM series was selected. If available, mobiview STIR sequence was
selected in order to visualize the whole spine. This allowed one to pick out
lesions and go to respective scans. Where this was not available, individual
segments were screened i.e. cervical, thoracic etc to locate lesions.
3. The scan was loaded and then dragged from analysis context into Dynamika
window to open the scan.
4. An image magnification of 300%- 400% was selected from the drop down
menu instead of zoom to fit option in order to find smaller lesions which may
not be otherwise seen.
5. After identifying lesions, individual spinal segment scans were reviewed.
6. Once the lesion was found on the individual segment scan, the ROI button in the
Dynamika window was clicked on. This automatically opened the ROI
manager window in the Analysis context screen. Using the cursor, the lesion
was then outlined.
7. After the software was modified, in order to draw an auto ROI, the Auto
Polygon function was selected from the drop down menu.
8. The cursor was then placed over the lesion and the area with maximum intensity
was clicked on. The program automatically produced a ROI. If this fit well
with the area to be outlined, right click to select. This changed the yellow
outline to a pink outline and brought up the parameters in the analysis context
box below. If ROI needed to be modified (Fig 5.1), double clicking within the
ROI brought out even more points in the pink outline which were dragged to
fit the shape wanted. Alternatively, re-clicking on a different part of the lesion
would produce a different shape of the ROI.
9. When lesions were not amenable to auto ROI, changing to ‘Freehand’ in the
drop down menu from ROI manager allowed for the cursor to draw the outline
around the lesion manually.
10. When satisfied with the ROI drawn, the ROI was given a name. For eg: 1A
STIR cervical C5 upper anterior lesion or something shorter which conveyed
the same meaning.
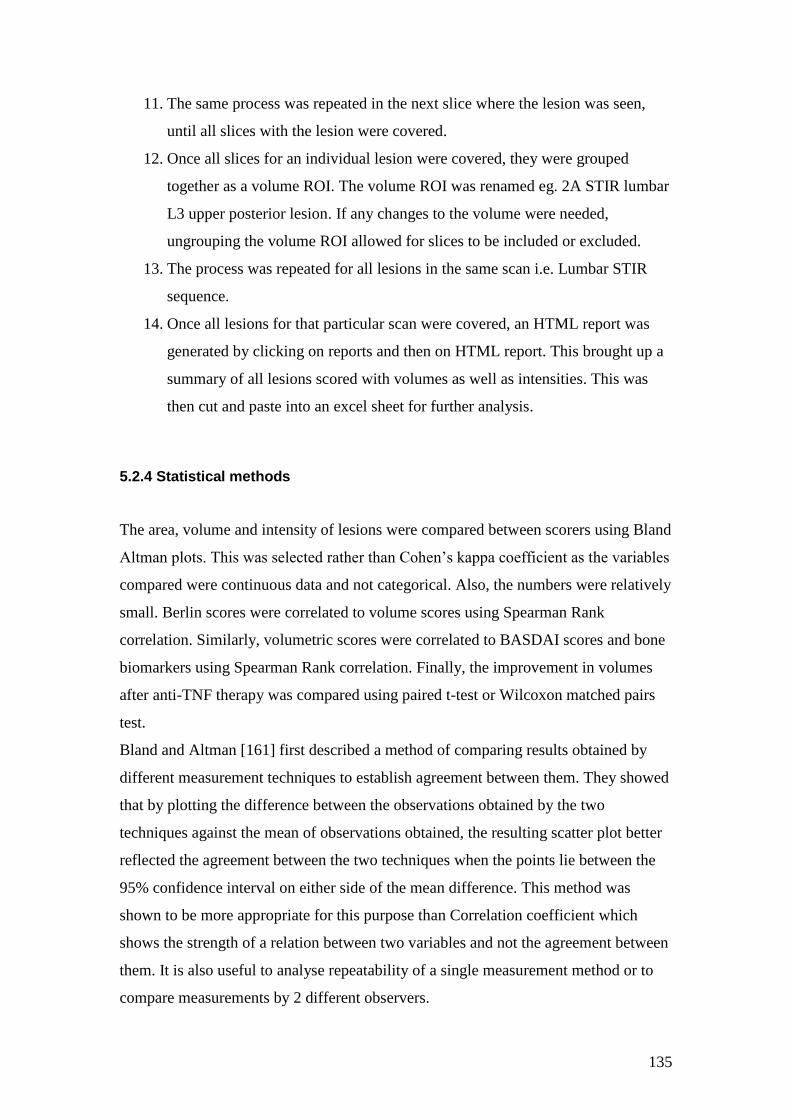
135
11. The same process was repeated in the next slice where the lesion was seen,
until all slices with the lesion were covered.
12. Once all slices for an individual lesion were covered, they were grouped
together as a volume ROI. The volume ROI was renamed eg. 2A STIR lumbar
L3 upper posterior lesion. If any changes to the volume were needed,
ungrouping the volume ROI allowed for slices to be included or excluded.
13. The process was repeated for all lesions in the same scan i.e. Lumbar STIR
sequence.
14. Once all lesions for that particular scan were covered, an HTML report was
generated by clicking on reports and then on HTML report. This brought up a
summary of all lesions scored with volumes as well as intensities. This was
then cut and paste into an excel sheet for further analysis.
5.2.4 Statistical methods
The area, volume and intensity of lesions were compared between scorers using Bland
Altman plots. This was selected rather than Cohen’s kappa coefficient as the variables
compared were continuous data and not categorical. Also, the numbers were relatively
small. Berlin scores were correlated to volume scores using Spearman Rank
correlation. Similarly, volumetric scores were correlated to BASDAI scores and bone
biomarkers using Spearman Rank correlation. Finally, the improvement in volumes
after anti-TNF therapy was compared using paired t-test or Wilcoxon matched pairs
test.
Bland and Altman [161] first described a method of comparing results obtained by
different measurement techniques to establish agreement between them. They showed
that by plotting the difference between the observations obtained by the two
techniques against the mean of observations obtained, the resulting scatter plot better
reflected the agreement between the two techniques when the points lie between the
95% confidence interval on either side of the mean difference. This method was
shown to be more appropriate for this purpose than Correlation coefficient which
shows the strength of a relation between two variables and not the agreement between
them. It is also useful to analyse repeatability of a single measurement method or to
compare measurements by 2 different observers.
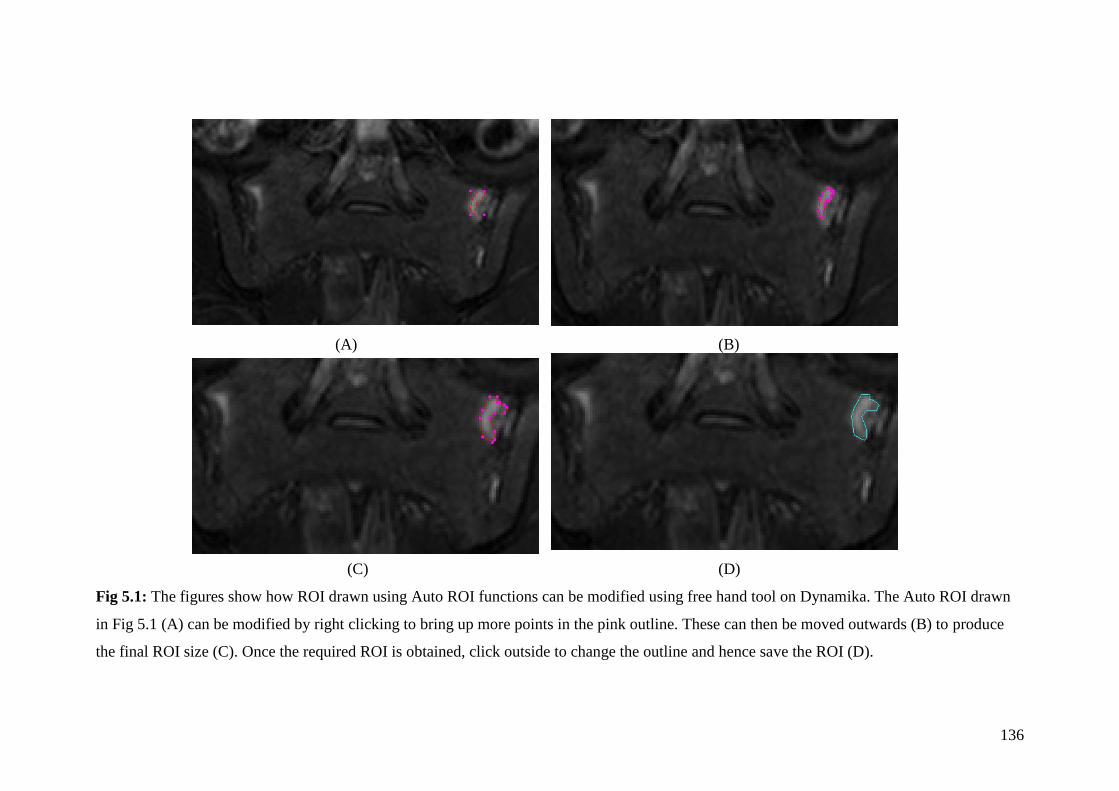
136
(A) (B)
(C) (D)
Fig 5.1: The figures show how ROI drawn using Auto ROI functions can be modified using free hand tool on Dynamika. The Auto ROI drawn
in Fig 5.1 (A) can be modified by right clicking to bring up more points in the pink outline. These can then be moved outwards (B) to produce
the final ROI size (C). Once the required ROI is obtained, click outside to change the outline and hence save the ROI (D).
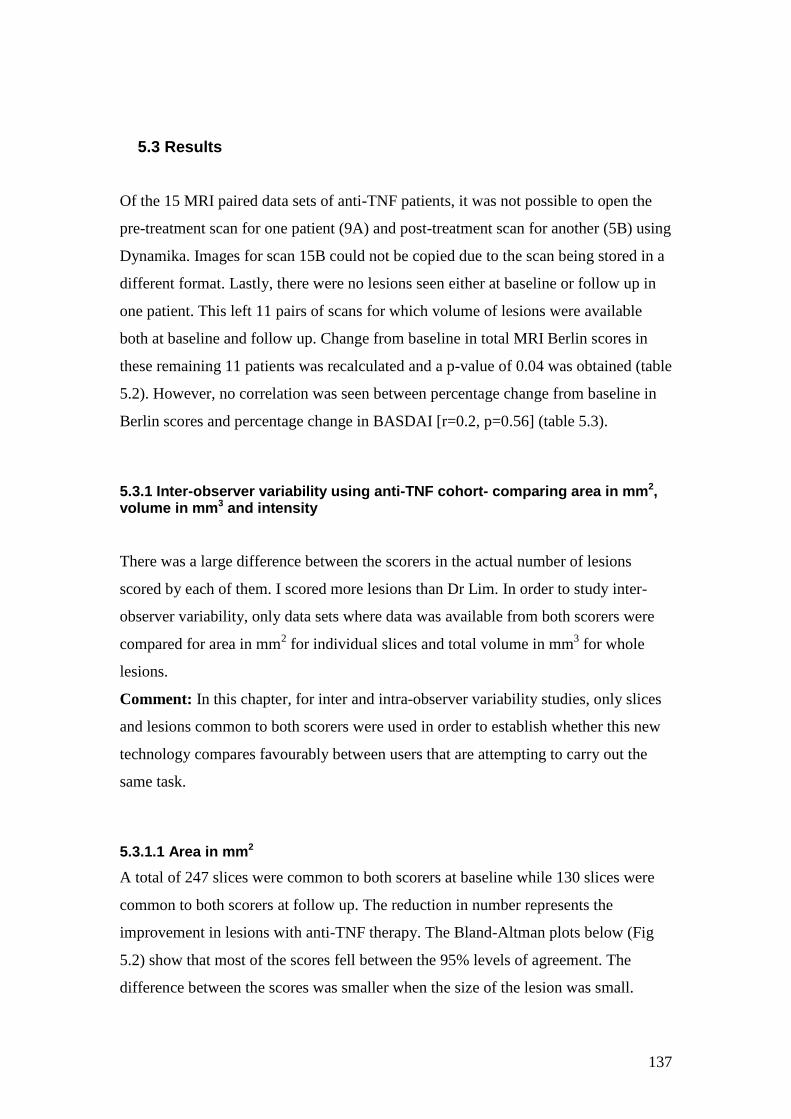
137
5.3 Results
Of the 15 MRI paired data sets of anti-TNF patients, it was not possible to open the
pre-treatment scan for one patient (9A) and post-treatment scan for another (5B) using
Dynamika. Images for scan 15B could not be copied due to the scan being stored in a
different format. Lastly, there were no lesions seen either at baseline or follow up in
one patient. This left 11 pairs of scans for which volume of lesions were available
both at baseline and follow up. Change from baseline in total MRI Berlin scores in
these remaining 11 patients was recalculated and a p-value of 0.04 was obtained (table
5.2). However, no correlation was seen between percentage change from baseline in
Berlin scores and percentage change in BASDAI [r=0.2, p=0.56] (table 5.3).
5.3.1 Inter-observer variability using anti-TNF cohort- comparing area in mm2, volume in mm3 and intensity
There was a large difference between the scorers in the actual number of lesions
scored by each of them. I scored more lesions than Dr Lim. In order to study inter-
observer variability, only data sets where data was available from both scorers were
compared for area in mm2 for individual slices and total volume in mm
3 for whole
lesions.
Comment: In this chapter, for inter and intra-observer variability studies, only slices
and lesions common to both scorers were used in order to establish whether this new
technology compares favourably between users that are attempting to carry out the
same task.
5.3.1.1 Area in mm2
A total of 247 slices were common to both scorers at baseline while 130 slices were
common to both scorers at follow up. The reduction in number represents the
improvement in lesions with anti-TNF therapy. The Bland-Altman plots below (Fig
5.2) show that most of the scores fell between the 95% levels of agreement. The
difference between the scores was smaller when the size of the lesion was small.
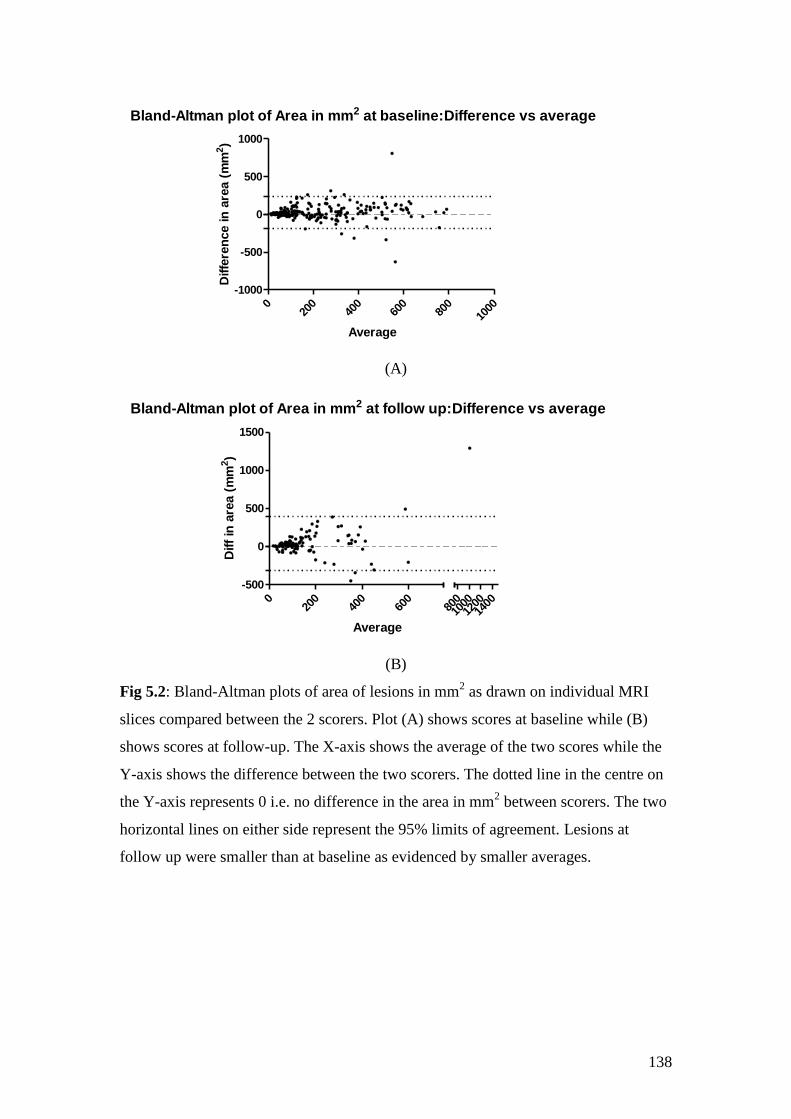
138
Bland-Altman plot of Area in mm2 at baseline:Difference vs average
020
040
060
080
010
00
-1000
-500
0
500
1000
Average
Diffe
ren
ce in
are
a (
mm
2)
(A)
Bland-Altman plot of Area in mm2 at follow up:Difference vs average
020
040
060
0
-500
0
500
1000
1500
80010
0012
0014
00
Average
Diff
in a
rea (
mm
2)
(B)
Fig 5.2: Bland-Altman plots of area of lesions in mm2 as drawn on individual MRI
slices compared between the 2 scorers. Plot (A) shows scores at baseline while (B)
shows scores at follow-up. The X-axis shows the average of the two scores while the
Y-axis shows the difference between the two scorers. The dotted line in the centre on
the Y-axis represents 0 i.e. no difference in the area in mm2 between scorers. The two
horizontal lines on either side represent the 95% limits of agreement. Lesions at
follow up were smaller than at baseline as evidenced by smaller averages.
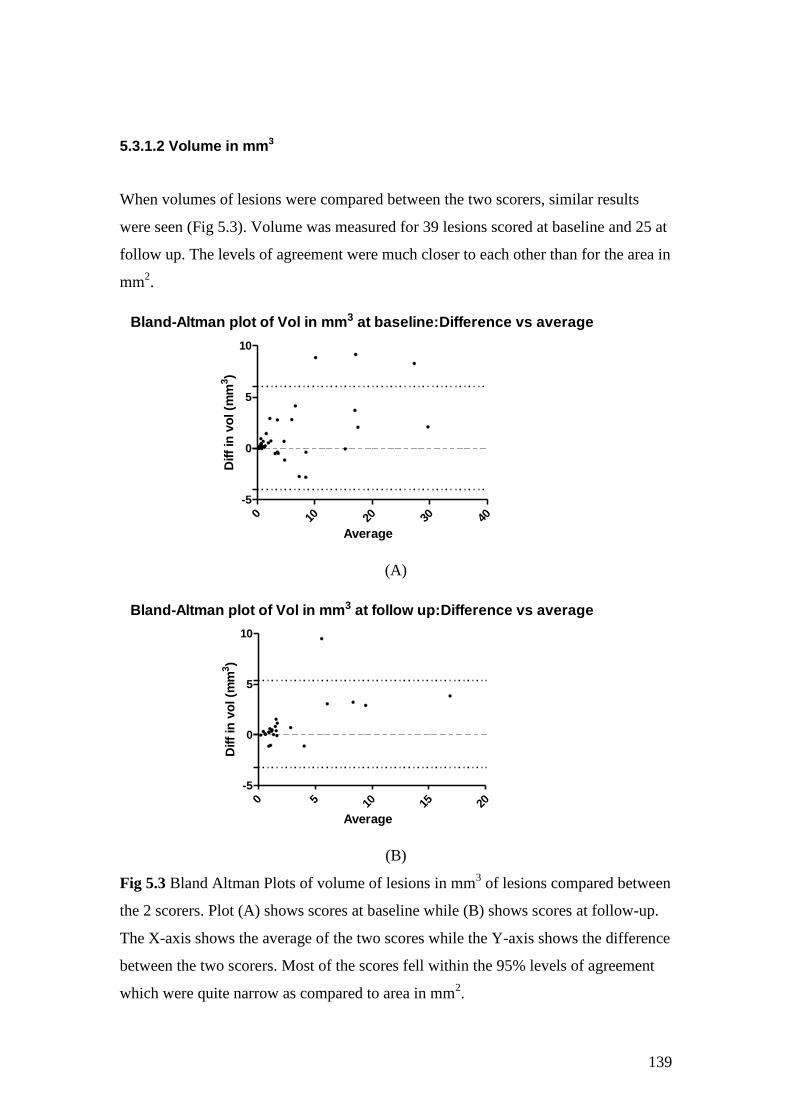
139
5.3.1.2 Volume in mm3
When volumes of lesions were compared between the two scorers, similar results
were seen (Fig 5.3). Volume was measured for 39 lesions scored at baseline and 25 at
follow up. The levels of agreement were much closer to each other than for the area in
mm2.
Bland-Altman plot of Vol in mm3 at baseline:Difference vs average
0 10 20 30 40
-5
0
5
10
Average
Diff
in v
ol (m
m3)
(A)
Bland-Altman plot of Vol in mm3 at follow up:Difference vs average
0 5 10 15 20
-5
0
5
10
Average
Diff
in v
ol (m
m3)
(B)
Fig 5.3 Bland Altman Plots of volume of lesions in mm3 of lesions compared between
the 2 scorers. Plot (A) shows scores at baseline while (B) shows scores at follow-up.
The X-axis shows the average of the two scores while the Y-axis shows the difference
between the two scorers. Most of the scores fell within the 95% levels of agreement
which were quite narrow as compared to area in mm2.

140
5.3.1.3 Mean intensity of lesions
Apart from area in mm2 and volume in mm
3, Dynamika records the maximum as well
as mean intensity of lesions on each slice as well as that of the whole lesion (once
volume of the lesion is calculated). Fig 5.4 (A&B) show the results of Bland-Altman
plots for mean intensity for individual slices while Fig 5.4 (C&D) for the lesions as a
whole. The results were similar for both slices as well as whole lesions. The
agreement was stronger for mean intensity of lesions rather than individual slices with
very few points falling outside the 95% levels of agreement.
141
Bland-Altman plot of Mean intensity at baseline for slices:Difference vs average
050
010
0015
0020
00
-1000
-500
0
500
Average
Diff
in m
ean
in
ten
sit
y
Bland-Altman plot of Mean intensity at follow up for slices:Difference vs average
050
010
0015
00
-800
-600
-400
-200
0
200
400
Average
Diff
in m
ean
in
ten
sit
y
(A) (B)
Bland-Altman plot of Mean intensity at baseline for lesions:Difference vsaverage
050
010
0015
0020
00
-800
-600
-400
-200
0
200
400
Average
Diff
in m
ean
in
ten
sit
y
Bland-Altman plot of Mean intensity at follow up for lesions:Difference vsaverage
050
010
0015
00
-800
-600
-400
-200
0
200
400
Average
Diff
in m
ean
in
ten
sit
y
(C) (D)
Fig 5.4: Bland-Altman plots of mean intensity of lesions on individual slices (A&B) and whole lesions (C&D) for the two scorers. The plots
show there was a good level of agreement between scorers with regards to mean intensity both at the level of individual slices as well as the
whole lesion.

142
5.3.1.3 Maximum intensity of lesions
While the mean intensity depends on the extent of the lesion, the maximum intensity
represents the brightest area on each slice or of each lesion. This was strikingly
similar and in fact identical in a number of cases. The plots (Fig 5.5) show a large
number of points where the difference between the two scorers was zero irrespective
of the average of maximum intensity. The results were comparable for maximum
intensity of whole lesion as well as individual slices with very few points falling
outside the 95% levels of agreement.

143
Bland-Altman plot of Max intensity at baseline for slices:Difference vs average
010
0020
0030
0040
00
-1000
-500
0
500
1000
Average
Diff
in M
ax in
ten
sit
y
Bland-Altman plot of Max intensity at follow up for slices:Difference vs average
010
0020
0030
00
-1000
-500
0
500
1000
Average
Diff
in m
ax in
ten
sit
y
(A) (B)
Bland-Altman plot of Max intensity at baseline for lesions:Difference vs average
010
0020
0030
0040
00
-1000
-500
0
500
1000
Average
Diff
in m
ax in
ten
sit
y
Bland-Altman plot of Max intensity at follow up for lesions:Difference vs average
010
0020
0030
00
-1500
-1000
-500
0
500
1000
Average
Diff
in m
ax in
ten
sit
y
(C) (D)
Fig 5.5: Bland-Altman plots of maximum intensity of lesions on each slice (A&B) and of whole lesions (C&D). The plots show a large number
of points where the scores for maximum intensity was identical between the two scorers.
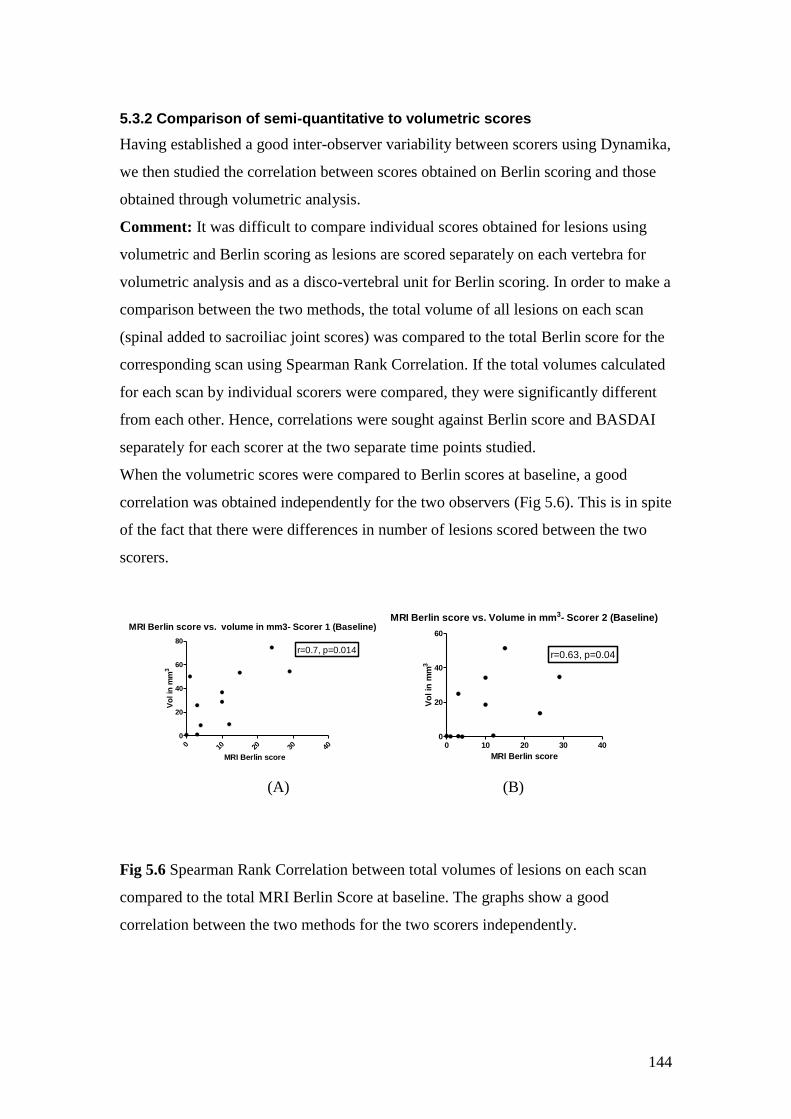
144
5.3.2 Comparison of semi-quantitative to volumetric scores
Having established a good inter-observer variability between scorers using Dynamika,
we then studied the correlation between scores obtained on Berlin scoring and those
obtained through volumetric analysis.
Comment: It was difficult to compare individual scores obtained for lesions using
volumetric and Berlin scoring as lesions are scored separately on each vertebra for
volumetric analysis and as a disco-vertebral unit for Berlin scoring. In order to make a
comparison between the two methods, the total volume of all lesions on each scan
(spinal added to sacroiliac joint scores) was compared to the total Berlin score for the
corresponding scan using Spearman Rank Correlation. If the total volumes calculated
for each scan by individual scorers were compared, they were significantly different
from each other. Hence, correlations were sought against Berlin score and BASDAI
separately for each scorer at the two separate time points studied.
When the volumetric scores were compared to Berlin scores at baseline, a good
correlation was obtained independently for the two observers (Fig 5.6). This is in spite
of the fact that there were differences in number of lesions scored between the two
scorers.
MRI Berlin score vs. volume in mm3- Scorer 1 (Baseline)
0 10 20 30 40
0
20
40
60
80
r=0.7, p=0.014
MRI Berlin score
Vo
l in
mm
3
MRI Berlin score vs. Volume in mm3- Scorer 2 (Baseline)
0 10 20 30 400
20
40
60
r=0.63, p=0.04
MRI Berlin score
Vo
l in
mm
3
(A) (B)
Fig 5.6 Spearman Rank Correlation between total volumes of lesions on each scan
compared to the total MRI Berlin Score at baseline. The graphs show a good
correlation between the two methods for the two scorers independently.
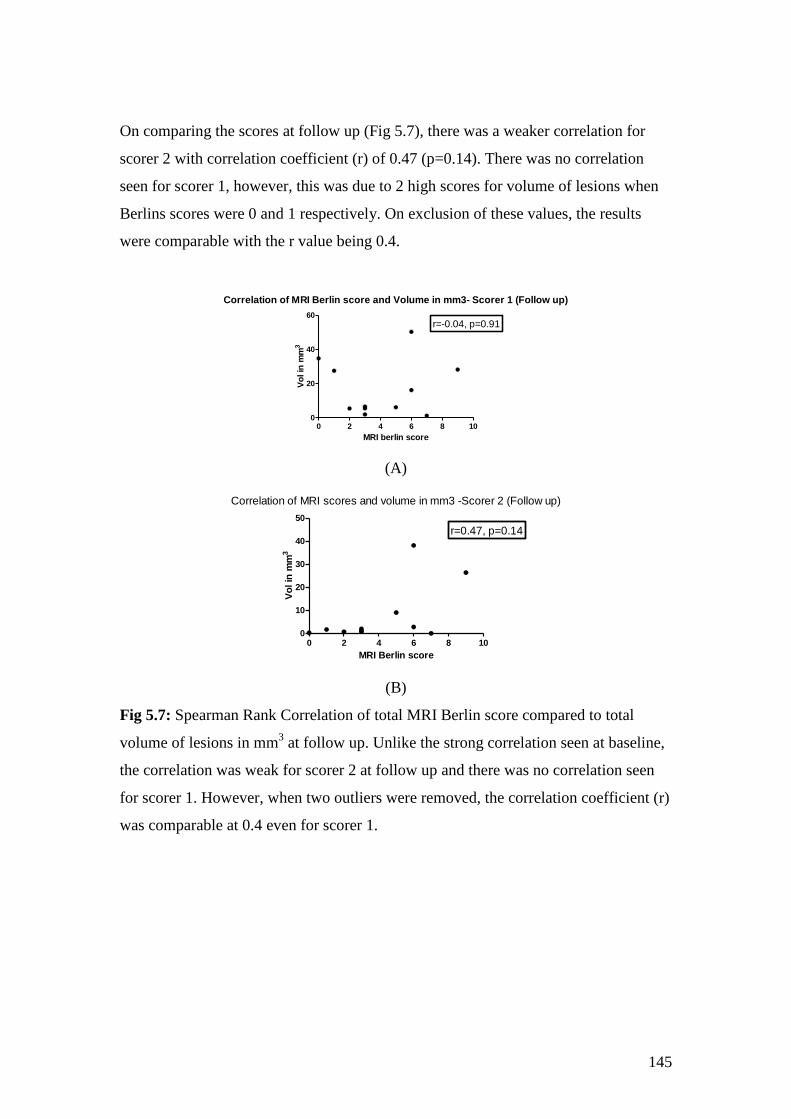
145
On comparing the scores at follow up (Fig 5.7), there was a weaker correlation for
scorer 2 with correlation coefficient (r) of 0.47 (p=0.14). There was no correlation
seen for scorer 1, however, this was due to 2 high scores for volume of lesions when
Berlins scores were 0 and 1 respectively. On exclusion of these values, the results
were comparable with the r value being 0.4.
Correlation of MRI Berlin score and Volume in mm3- Scorer 1 (Follow up)
0 2 4 6 8 100
20
40
60
r=-0.04, p=0.91
MRI berlin score
Vo
l in
mm
3
(A)
Correlation of MRI scores and volume in mm3 -Scorer 2 (Follow up)
0 2 4 6 8 100
10
20
30
40
50
r=0.47, p=0.14
MRI Berlin score
Vo
l in
mm
3
(B)
Fig 5.7: Spearman Rank Correlation of total MRI Berlin score compared to total
volume of lesions in mm3 at follow up. Unlike the strong correlation seen at baseline,
the correlation was weak for scorer 2 at follow up and there was no correlation seen
for scorer 1. However, when two outliers were removed, the correlation coefficient (r)
was comparable at 0.4 even for scorer 1.
146
5.3.3 Comparison of volume and intensity to BASDAI
Given the lack of correlation between Berlin scores and BASDAI, we studied the
correlation between volumetric scores as well as intensity of lesions using Dynamika
to BASDAI scores. Table 5.1 shows the correlation coefficients for the comparisons.
There were no significant correlations seen between the volume of lesions in mm3 and
the mean intensity of lesions with BASDAI scores either at baseline or at follow up.
Table 5.1: Spearman Rank correlation (r-values) of Volume in mm3 and mean
intensity at baseline and follow up compared to BASDAI scores for the two scorers.
None of the p-values for the correlation were statistically significant.
Baseline Scorer 1 Scorer 2
Volume in mm3 0.07 -0.4
Mean intensity -0.38 -0.006
Follow up
Volume in mm3 -0.2 -0.01
Mean intensity 0.09 0.15
5.3.4 Development of Auto ROI function and Intra-observer variability
The Auto ROI (Region of Interest) function was developed using the Dynamika
software to improve the accuracy in delineating the borders of the lesions. It utilizes
the intensity of the lesion to automatically draw a region of interest when one clicks
on an area of high intensity. In addition to accuracy, this also helps improve the speed
at which the analysis is carried out. In order to study the effect of the auto ROI
function on outcome, I repeated the scoring of the scans using the auto-ROI function
prior to un-blinding to obtain a further set of results. This was then compared to my
earlier score to obtain intra-observer variability, although it truly represents the
difference in scores by the same observer when using manual and Auto ROI functions
for scoring.
147
5.3.4.1 Comparison of scores for area in mm2, volume in mm3 and intensity using manual and Auto ROIs.
In the first round of analysis, there was a disparity between the numbers of lesions
scored by the two scorers. Hence, with this analysis, the two scorers came to an
agreement as to which lesions should be subjected to analysis and which lesions
scored previously should be removed from further analysis.
In all cases, an attempt was first made to use the auto ROI function to quantify the
lesion. However, this was only possible in about a third of the total lesions which
were either of larger size or where there was a clear delineation of the lesion based on
intensity. Most of these were lesions present at baseline and very few were those
present at follow up after anti-TNF therapy (n=2). The following figures [Fig 5.8 (A
to F) show the intra-observer agreement for area in mm2, volume in mm
3 as well as
mean and maximum intensity at baseline using manual and auto ROI. A general trend
for an increase in disparity with increase in size of the lesion was seen. There was also
an increase in disparity for intensity scores with higher averages for mean and
maximum intensity.
Comment: In general, the size of lesions using Auto ROI tended to be smaller and
this in turn caused the mean intensity of lesions using Auto ROI to be higher than
using manual ROI function. This could be interpreted as the auto ROI function being
able to better delineate lesions and hence improve the utility of quantitative analysis
as a biomarker.
As the number of lesions amenable to auto ROI function at follow up was so small, no
meaningful results could be obtained at follow up from this data set. Hence, no plots
are shown.
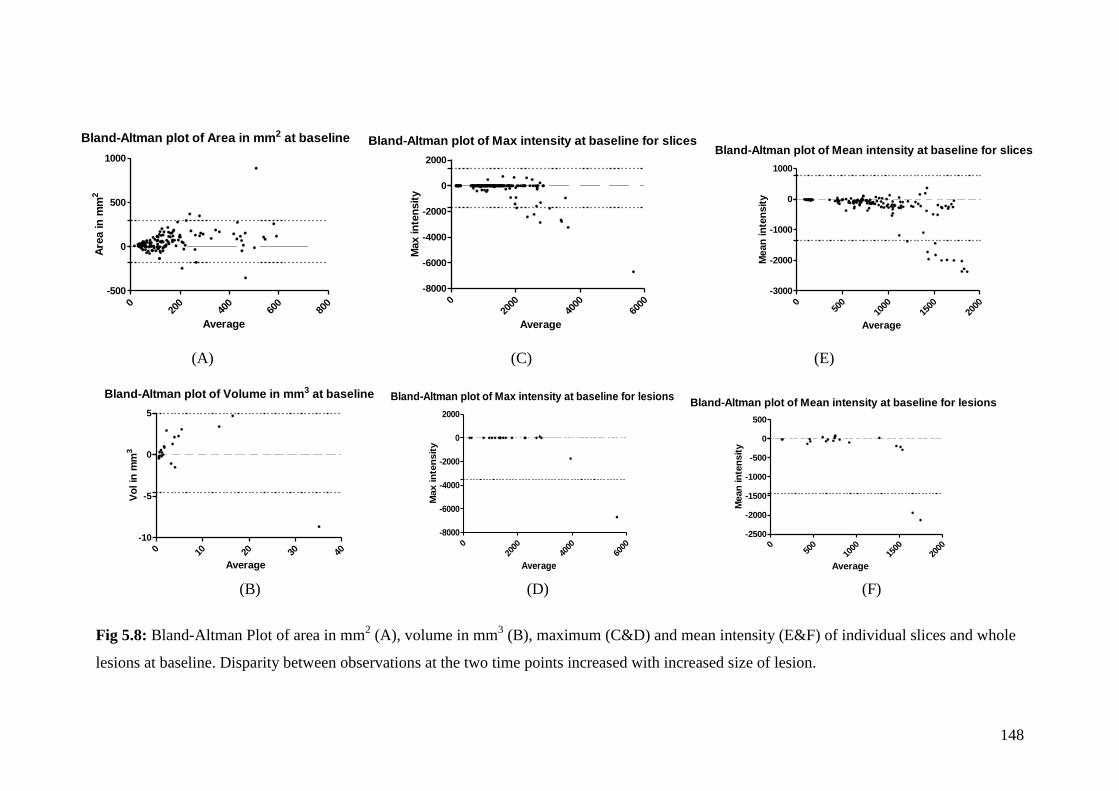
148
Bland-Altman plot of Area in mm2 at baseline
020
040
060
080
0
-500
0
500
1000
Average
Are
a in
mm
2
Bland-Altman plot of Max intensity at baseline for slices
020
0040
0060
00
-8000
-6000
-4000
-2000
0
2000
Average
Max in
ten
sit
y
Bland-Altman plot of Mean intensity at baseline for slices
050
010
0015
0020
00
-3000
-2000
-1000
0
1000
Average
Mean
in
ten
sit
y
(A) (C) (E)
Bland-Altman plot of Volume in mm3 at baseline
0 10 20 30 40
-10
-5
0
5
Average
Vo
l in
mm
3
Bland-Altman plot of Max intensity at baseline for lesions
020
0040
0060
00
-8000
-6000
-4000
-2000
0
2000
Average
Max in
ten
sit
y
Bland-Altman plot of Mean intensity at baseline for lesions
050
010
0015
0020
00
-2500
-2000
-1500
-1000
-500
0
500
Average
Mean
in
ten
sit
y
(B) (D) (F)
Fig 5.8: Bland-Altman Plot of area in mm2 (A), volume in mm
3 (B), maximum (C&D) and mean intensity (E&F) of individual slices and whole
lesions at baseline. Disparity between observations at the two time points increased with increased size of lesion.

149
5.3.4.2 Correlation of Auto ROI to MRI Berlin scores as well as BASDAI
In order to compare the utility of the Auto ROI function, the volume of lesions at
baseline and follow up was correlated to MRI Berlin scores and BASDAI. The
correlation between volume of lesions at baseline to MRI Berlin scores was similar
for both manual and Auto ROI (r=0.7). However, the correlation coefficient for
volume of lesions at follow-up versus MRI Berlin scores improved from -0.04 to 0.4.
The p value for the correlation was still not significant. This may indicate that the auto
ROI function helped improve the correlation, although this may also be due to the fact
that some lesions previously scored were excluded. However, given that only a third
of lesions were actually subject to Auto ROI analysis, it is not surprising that this
difference was not statistically significant. Also the Auto ROI function did not
improve the correlation between BASDAI and volume of lesions or intensity either at
baseline or follow up.
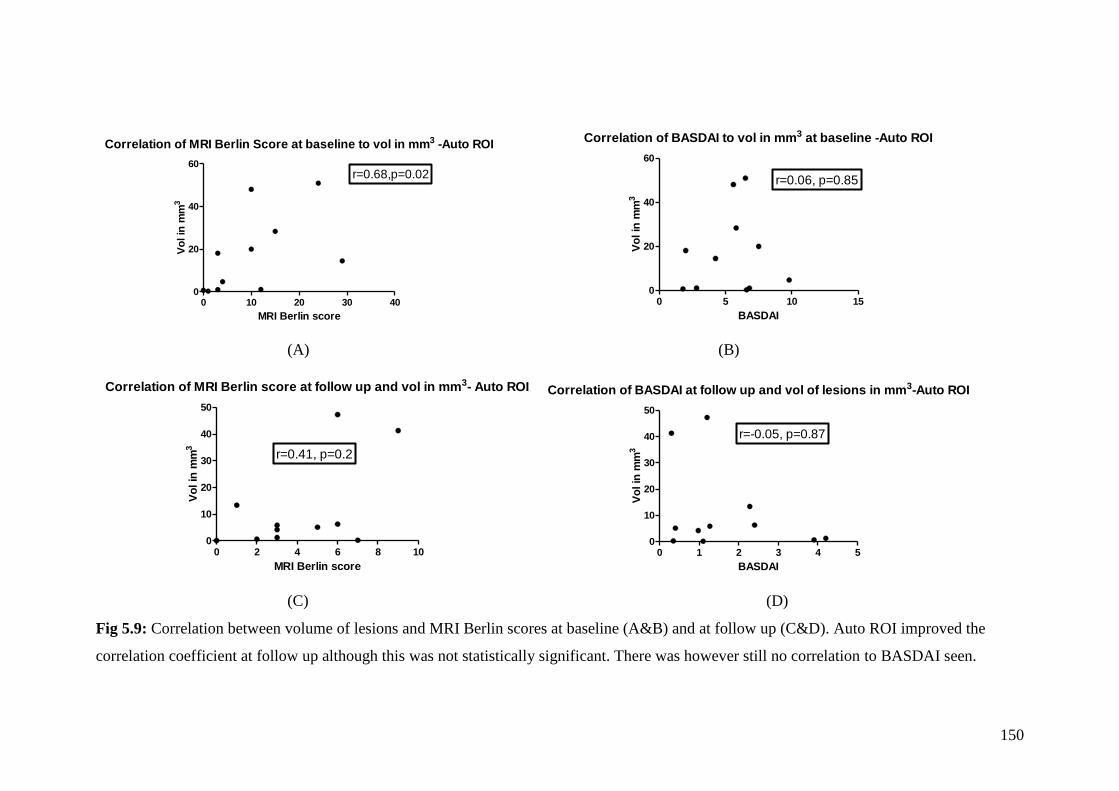
150
Correlation of MRI Berlin Score at baseline to vol in mm3 -Auto ROI
0 10 20 30 400
20
40
60r=0.68,p=0.02
MRI Berlin score
Vo
l in
mm
3
Correlation of BASDAI to vol in mm3 at baseline -Auto ROI
0 5 10 150
20
40
60
r=0.06, p=0.85
BASDAI
Vo
l in
mm
3
(A) (B)
Correlation of MRI Berlin score at follow up and vol in mm3- Auto ROI
0 2 4 6 8 100
10
20
30
40
50
r=0.41, p=0.2
MRI Berlin score
Vo
l in
mm
3
Correlation of BASDAI at follow up and vol of lesions in mm3-Auto ROI
0 1 2 3 4 50
10
20
30
40
50
r=-0.05, p=0.87
BASDAI
Vo
l in
mm
3
(C) (D)
Fig 5.9: Correlation between volume of lesions and MRI Berlin scores at baseline (A&B) and at follow up (C&D). Auto ROI improved the
correlation coefficient at follow up although this was not statistically significant. There was however still no correlation to BASDAI seen.
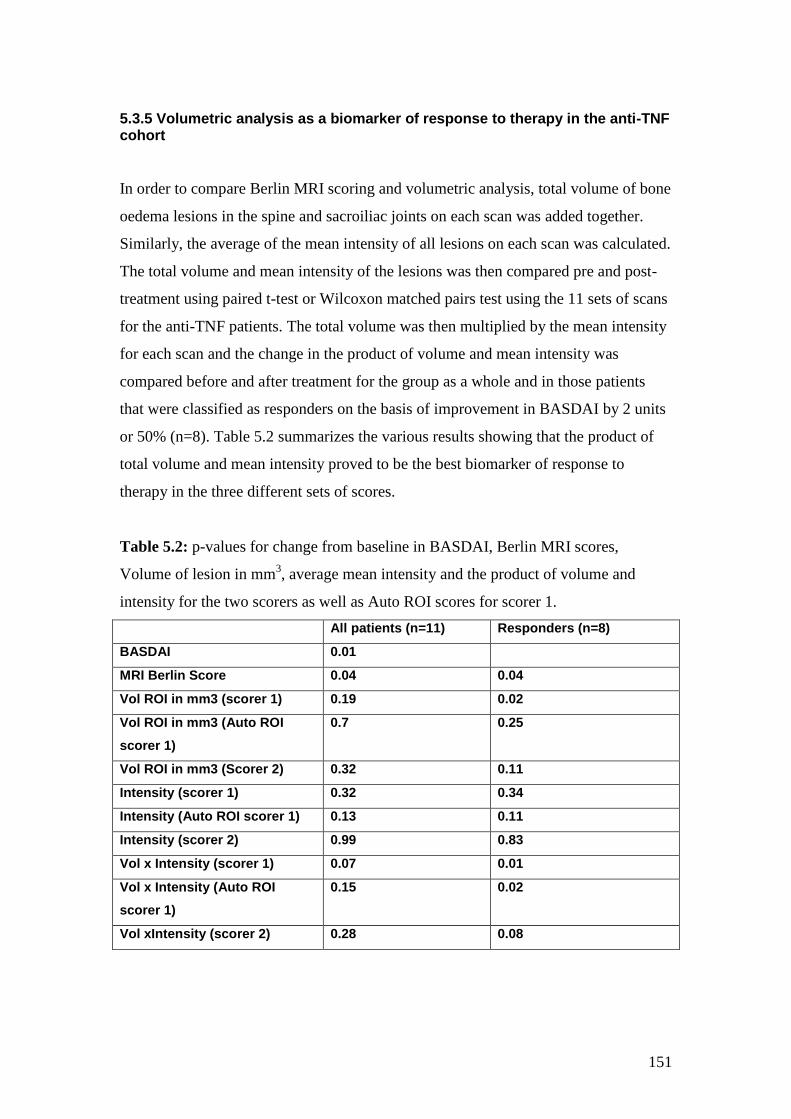
151
5.3.5 Volumetric analysis as a biomarker of response to therapy in the anti-TNF cohort
In order to compare Berlin MRI scoring and volumetric analysis, total volume of bone
oedema lesions in the spine and sacroiliac joints on each scan was added together.
Similarly, the average of the mean intensity of all lesions on each scan was calculated.
The total volume and mean intensity of the lesions was then compared pre and post-
treatment using paired t-test or Wilcoxon matched pairs test using the 11 sets of scans
for the anti-TNF patients. The total volume was then multiplied by the mean intensity
for each scan and the change in the product of volume and mean intensity was
compared before and after treatment for the group as a whole and in those patients
that were classified as responders on the basis of improvement in BASDAI by 2 units
or 50% (n=8). Table 5.2 summarizes the various results showing that the product of
total volume and mean intensity proved to be the best biomarker of response to
therapy in the three different sets of scores.
Table 5.2: p-values for change from baseline in BASDAI, Berlin MRI scores,
Volume of lesion in mm3, average mean intensity and the product of volume and
intensity for the two scorers as well as Auto ROI scores for scorer 1.
All patients (n=11) Responders (n=8)
BASDAI 0.01
MRI Berlin Score 0.04 0.04
Vol ROI in mm3 (scorer 1) 0.19 0.02
Vol ROI in mm3 (Auto ROI
scorer 1)
0.7 0.25
Vol ROI in mm3 (Scorer 2) 0.32 0.11
Intensity (scorer 1) 0.32 0.34
Intensity (Auto ROI scorer 1) 0.13 0.11
Intensity (scorer 2) 0.99 0.83
Vol x Intensity (scorer 1) 0.07 0.01
Vol x Intensity (Auto ROI
scorer 1)
0.15 0.02
Vol xIntensity (scorer 2) 0.28 0.08
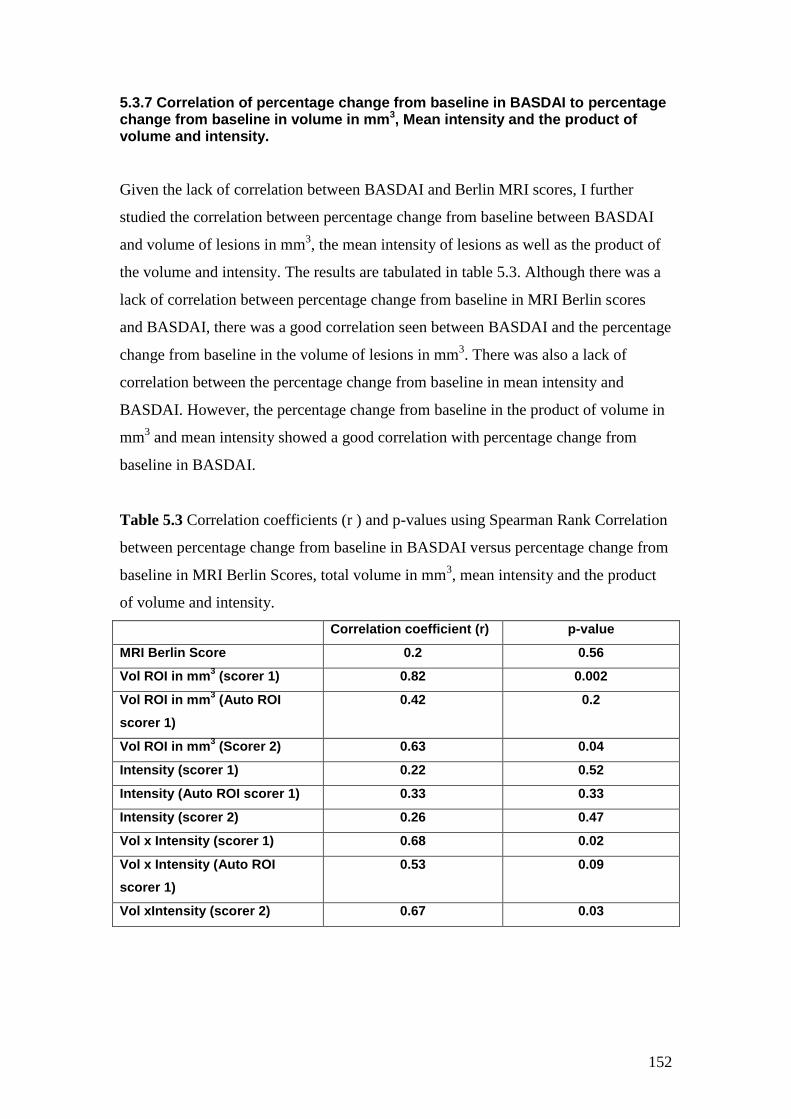
152
5.3.7 Correlation of percentage change from baseline in BASDAI to percentage change from baseline in volume in mm3, Mean intensity and the product of volume and intensity.
Given the lack of correlation between BASDAI and Berlin MRI scores, I further
studied the correlation between percentage change from baseline between BASDAI
and volume of lesions in mm3, the mean intensity of lesions as well as the product of
the volume and intensity. The results are tabulated in table 5.3. Although there was a
lack of correlation between percentage change from baseline in MRI Berlin scores
and BASDAI, there was a good correlation seen between BASDAI and the percentage
change from baseline in the volume of lesions in mm3. There was also a lack of
correlation between the percentage change from baseline in mean intensity and
BASDAI. However, the percentage change from baseline in the product of volume in
mm3 and mean intensity showed a good correlation with percentage change from
baseline in BASDAI.
Table 5.3 Correlation coefficients (r ) and p-values using Spearman Rank Correlation
between percentage change from baseline in BASDAI versus percentage change from
baseline in MRI Berlin Scores, total volume in mm3, mean intensity and the product
of volume and intensity.
Correlation coefficient (r) p-value
MRI Berlin Score 0.2 0.56
Vol ROI in mm3 (scorer 1) 0.82 0.002
Vol ROI in mm3 (Auto ROI
scorer 1)
0.42 0.2
Vol ROI in mm3 (Scorer 2) 0.63 0.04
Intensity (scorer 1) 0.22 0.52
Intensity (Auto ROI scorer 1) 0.33 0.33
Intensity (scorer 2) 0.26 0.47
Vol x Intensity (scorer 1) 0.68 0.02
Vol x Intensity (Auto ROI
scorer 1)
0.53 0.09
Vol xIntensity (scorer 2) 0.67 0.03
153
5.3.8 Correlation of percentage change from baseline in volume in mm3 and the product of volume and intensity versus change from baseline in bone biomarkers.
In the last chapter, I found that percentage change in MRI Berlin score showed a trend
towards correlation with percentage change in a number of bone biomarkers. I hence
compared the scores obtained through volumetric analysis to bone biomarkers to see
if these relationships were maintained.
When percentage change from baseline in bone biomarkers was compared to
percentage change from baseline in both the total volume of lesions in mm3 and the
product of volume and mean intensity, a positive correlation was seen with RANKL:
OPG ratio. On the other hand, there was a negative correlation seen with MMP3
levels. No other correlations were seen. The Auto ROI function did not increase
correlations to change in biomarkers except with RANKL: OPG ratio where the
correlation was stronger than in all other groups.

154
Table 5.4: Spearman Rank Correlation between percentage Change in volume as well as the product of volume and mean intensity versus
percentage change from baseline in bone biomarker levels (p<0.05). The table shows a positive correlation between RANKL: OPG which
attained statistical significance when compared to percentage change in volume calculated using Auto ROI function. It also shows a negative
correlation with MMP3 which was statistically significant in all cases except in case of volume calculated using Auto ROI function.
RANKL OPG RANKL:OPG BAP TRAP5b MMP3 Osteocalcin Sr sclerostin Dkk-1
Vol ROI in mm3
(Scorer 1) 0.28 -0.13 0.62 0.18 -0.02 -0.86 -0.17 0.18 0.23
Vol ROI in mm3
(Auto ROI Scorer 1) 0.30 -0.10 0.86 -0.01 -0.07 -0.60 -0.50 -0.23 -0.11
Vol ROI in mm3
(Scorer 2) 0.35 -0.05 0.55 0.51 0.10 -0.74 -0.05 0.23 0.42
Vol x Intensity (Scorer 1) 0.11 -0.33 0.43 0.35 -0.12 -0.96 0.12 0.30 0.44
Vol x Intensity (Auto ROI Scorer 1) 0.30 -0.24 0.65 0.25 -0.14 -0.81 -0.14 0.20 0.25
Vol xIntensity (Scorer 2) 0.35 -0.05 0.55 0.51 0.10 -0.74 -0.05 0.23 0.42
155
5.4 Discussion
In this chapter I have described a new method of quantifying lesions using Dynamika
software. This method allows us to measure the change in volume as well as intensity
of lesions seen on STIR sequences of MRI scans from AS patients undergoing
therapy.
I have shown a good inter-observer variability between the two scorers for the area of
lesions on individual slices in mm2 as well as for volume of lesions in mm
3 for the
whole lesion. The differences between scorers was lower for volume of lesions than
for area on individual slices suggesting that although there may have been differences
in the area of lesions on individual slices, these differences were reduced when
volume of lesions were calculated. In addition, there was good inter-observer
variability between scorers for the maximum and mean intensity of lesions seen on
individual slices as well as of the whole lesion.
There are a number of reasons for the differences seen between observers. Firstly, as
the spine was scanned in 3 separate sections, some lesions were seen on more than
one spinal segment. Hence, if one scorer scored the lesion on the cervical scan and the
other on the thoracic scan, this led to significant differences in intensity of the lesion
which varies markedly between individual scans even on the same patient at the same
time point scanned using the same machine. It may have also led to differences in the
number of lesions scored if the same lesion was scored twice. Secondly, there were
differences between scorers estimating the extent of the lesion i.e. the number of
slices through which the lesion extended. This largely depended on being able to
distinguish the intensity of the lesion from surrounding tissue and was often difficult.
As the intensity of the lesion was generally lower at the periphery of the lesion, this
was difficult. Thirdly, there were differences in whether a lesion was scored or
considered an artefact. This was especially the case in the thoracic spine where
pulsations from the heart, aorta and respiratory movements often produce movement
artefact making it difficult to assess the anterior border of thoracic vertebrae. Also
when lesions are small and extend only on 2-3 slices, it is not always easy to

156
distinguish these from artefacts. Another important cause though was the fact that one
reader was a trained musculoskeletal radiologist and the second, a rheumatologist
without specialist training to do the scoring. Hence, while Dr Lim was confident is
calling a lesion an artefact, I was not. This would explain why I scored more lesions
than him.
Other causes for discrepancies between scorers included differences in labelling of
lesions with difficulty in counting the levels of vertebrae in the thoracic scans, where
there was no reference point. There were also sometimes more than one lesion on
individual slices which were scored as separate lesions by one scorer and together as
one lesion by the second scorer. These differences did not matter when the total
volume and mean intensity were compared for each scan at the two time points.
In this chapter, I have also shown good correlation between the MRI Berlin scores
and the volume of lesions in mm3 suggesting that the volumetric analysis compares
well to an already accepted and validated scoring method. The correlation was poorer
at follow up than at baseline as the lesions were likely to be smaller and fewer at
follow up. Hence, although the volume of a lesion may change at follow up, it may
not be significant enough to merit a change in its Berlin score. For example, if the
lesion initially covered 50% of area or volume of a vertebra at baseline it would score
a 2 on Berlin score. If this then improved to affect just 5% of the area or volume of a
vertebra, the Berlin score would change to 1. Hence, the change in score would be
50%. However the change in area or volume would be 90%. The data would therefore
suggest an improved sensitivity of this volumetric method to assess change when
compared with the Berlin score.
We were encouraged to develop the auto ROI function largely because of the marked
similarity in the maximum intensity of the lesions scored by the two different scorers
which in the majority of cases were identical. We felt that the automated ROI
technique might reduce inter-observer variability and also allow lesions to be outlined
quicker. Unfortunately, this could only be applied to larger lesions or to those where
the intensity of the lesion was homogenous (Fig 5.10) and markedly different from
surrounding tissue. An important cause for this was the fact that when lesions are
heterogeneous in intensity, the resultant ROI drawn is very different when one clicks
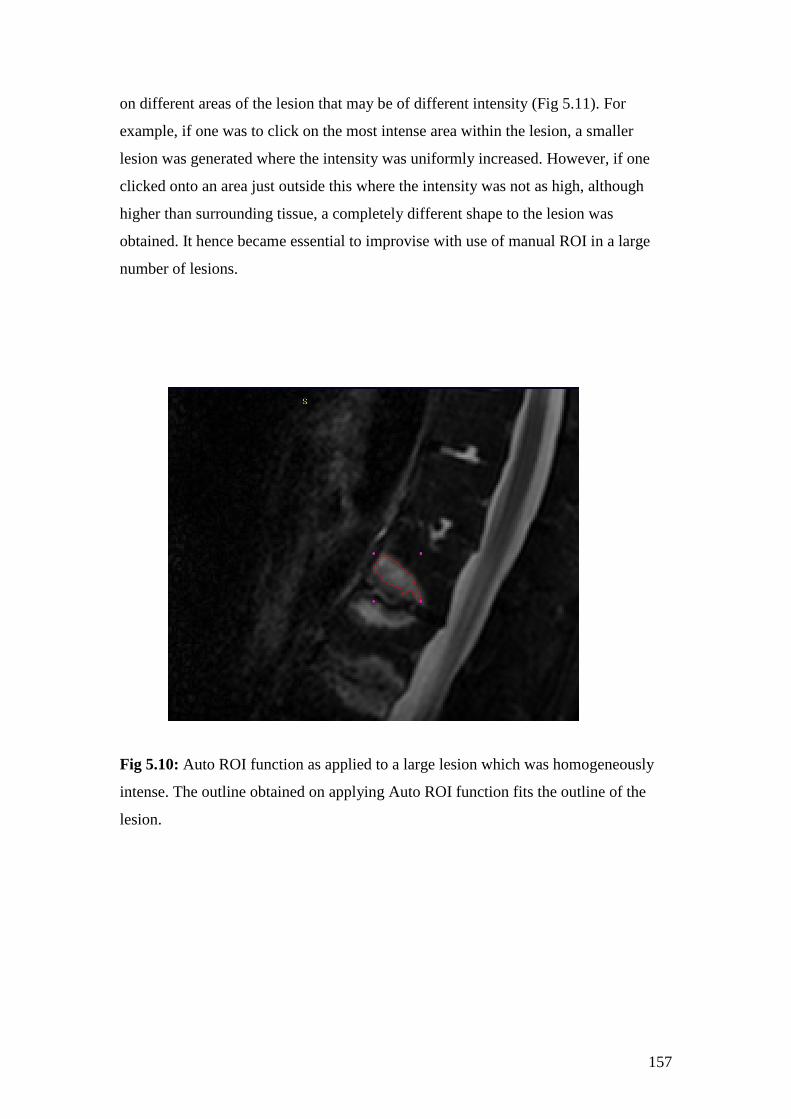
157
on different areas of the lesion that may be of different intensity (Fig 5.11). For
example, if one was to click on the most intense area within the lesion, a smaller
lesion was generated where the intensity was uniformly increased. However, if one
clicked onto an area just outside this where the intensity was not as high, although
higher than surrounding tissue, a completely different shape to the lesion was
obtained. It hence became essential to improvise with use of manual ROI in a large
number of lesions.
Fig 5.10: Auto ROI function as applied to a large lesion which was homogeneously
intense. The outline obtained on applying Auto ROI function fits the outline of the
lesion.
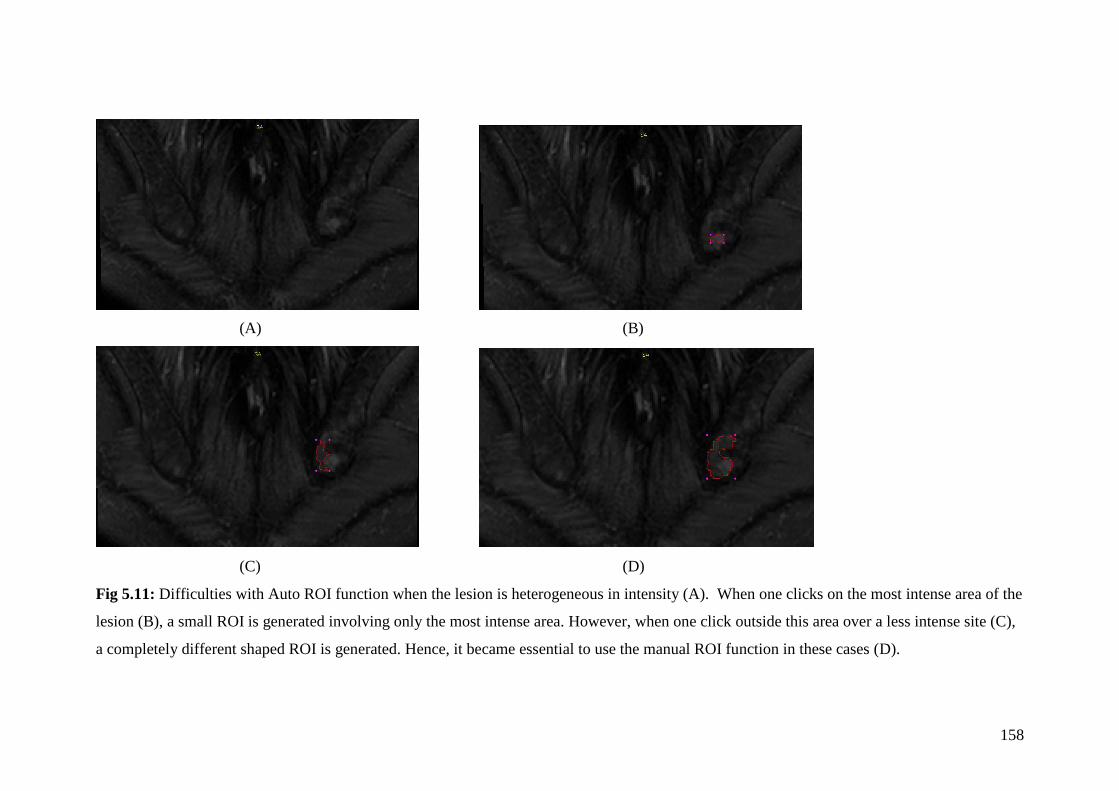
158
(A) (B)
(C) (D)
Fig 5.11: Difficulties with Auto ROI function when the lesion is heterogeneous in intensity (A). When one clicks on the most intense area of the
lesion (B), a small ROI is generated involving only the most intense area. However, when one click outside this area over a less intense site (C),
a completely different shaped ROI is generated. Hence, it became essential to use the manual ROI function in these cases (D).
159
When the various biomarkers- BASDAI, MRI Berlin Score and Volumetric scores
were compared pre and post anti-TNF therapy, both BASDAI and MRI Berlin Score
showed statistically significant improvements with therapy, while volume and
intensity of lesions and their product did not. However, when results were compared
for the 8 patients that satisfied criterion of response on BASDAI, there was a
statistically significant improvement in the percentage change from baseline in the
product of the volume and intensity of the lesion using both manual and Auto ROI
function. Moreover, when this percentage change from baseline in volume in mm3,
mean intensity and their product was correlated to percentage change from baseline in
BASDAI, a good correlation was observed both for total volume in mm3 as well as for
the product of volume and intensity but not for MRI Berlin scores. This would
suggest this to reflect changes in clinical state to a greater extent than the Berlin score.
The p-values were not significant for the Auto ROI scores. This may have been due to
the fact that while individual scorers may have scored the same lesion at the two time
points, with the Auto ROI, some of the lesions may have been dropped either at
baseline or at follow up if they were considered to be artefacts by Dr Lim.
The concept of studying the intensity of lesions is not a new one. Both the SPAARC
scoring system and the Aarhus Madsen system monitor a change in intensity.
However, this is the first time that intensity of the lesion has been quantified and
actual change from baseline has been recorded. The product of volume in mm3 and
the intensity may hence represent a new biomarker of response to therapy and one that
seems to show a good correlation to clinical biomarker such as BASDAI.
Lastly, it was interesting to note the correlation between percentage change from
baseline in both the volume as well as the product of volume and intensity versus
change in MMP3. This was also seen with Berlin scoring but the correlation here was
stronger (p<0.05). There was also a correlation seen with RANKL: OPG which was
not seen with Berlin scores or with change in BASDAI. However, from chapter 4, this
ratio seems to play an important part in disease pathogenesis. Further studies would
be needed to validate this concept.
160
5.5 Limitations and further studies
Although volumetric analysis using Dynamika seems promising, it is very time
consuming to carry out the analysis and it cannot be applied to routine clinical cases
or even in research studies in its current form. The software needs to be improved to
allow for the auto ROI analysis to be applicable not just to all lesions but also to allow
calculation of total volume automatically for the whole lesion rather than having to
calculate individual ROIs on each MRI slice showing the lesion. Without this, its
applicability remains limited.
With the product of volume in mm3 and intensity being a new biomarker, it is
essential that factors affecting intensity are regulated while scoring. Differences in
baseline noise, window width and level between scans done at different time points on
the same patient which can affect the intensity of lesions could not be controlled for
using current version of Dynamika. Also, as the current MRI protocol for scanning
allows for gaps between slices, the software estimates volume of the lesions by
comparing the area of ROI between adjacent slices and factors in the slice gaps. This
is hence not the true volume of the lesion but a good estimate.
Lastly, we have shown that this method shows promising results when applied to a
small cohort of patients on anti-TNF therapy. The changes seen in MRI following
anti-TNF therapy are large and hence it is easy to pick up change with therapy. It
would be important to apply this to larger cohorts such as the START study cohort
where the difference before and after treatment are subtle to show that this is actually
a more sensitive method to pick up change.
5.6 Conclusion:
Volumetric analysis of active bone oedema lesions on STIR MRI sequences compares
well to semi-quantitative scoring using the Berlin method. Unlike semi-quantitative
scoring, volumetric analysis also shows a good correlation to change in BASDAI
scores hence linking clinical and imaging biomarkers. However, further work is
needed to establish its utility as a biomarker of response to therapy in AS.

161
Chapter 6: Volumetric analysis of MRI bone oedema lesions in the clinical trial setting
162
6.1 Introduction:
In the last chapter, I demonstrated the utility of a novel tool, Dynamika, in calculating
the volume and intensities of bone oedema lesions in patients with AS. This was
shown in patients undergoing anti-TNF therapy where patients tend to have active
disease with likely high Berlin Scores on MRI at the start and large improvements in
these scores after anti-TNF therapy. In this chapter, I discuss the role of volumetric
analysis in the clinical trial setting in the START study cohort where changes in MRI
scores post-treatment were modest.
6.2: Methods
6.2.1 Patients, scans and scoring
Patients were recruited on to the START study (section 2.2.1.1) and went on to have
MRI scans prior to randomization as well as 3 months after receiving either placebo
or apremilast. All scans were randomized for patient identity, treatment received as
well as time point so that each patient was assigned a number while each of the paired
scans was randomly assigned as either A or B by one of the radiographers. Scans were
read independently by two observers- myself (Scorer 1) and Dr Mikael Boesen
(Scorer 2), Consultant Musculoskeletal Radiologist at the Parker Institute,
Copenhagen, Denmark. Both observers followed the standard operating procedure for
scoring lesions described in chapter 5 (section 5.2.3) but used only manual ROI
function to draw ROIs. Due to the fact that the scorers were based in different
countries, no training sessions could be held between the two observers prior to
scoring of the scans, although attempts were made to further standardize scoring
between the two using Skype and email.
163
6.2.2 Statistical methods
Unlike the previous chapter, individual results for areas, volumes and intensities were
not compared between the scorers as Mikael’s individual scores for lesions were not
available to me. The volume of all lesions scored by each observer was added together
to produce a total volume score for each scan. Total volumes calculated by the two
observers were then compared using paired t-test or Wilcoxon matched pairs test as
well as Bland Altman plots. The total volume of each lesion was multiplied by the
mean intensity of that lesion to produce a volume x intensity score for that lesion. The
scores for all lesions on each scan were again added up to produce a single score.
Corresponding scores between observers were compared again using the above
statistical tests. Total volume as well as the product of volume and intensity was then
compared to Berlin scores using Spearman Rank Correlation. Improvement in total
volumes as well as the product of volume and mean intensity was also calculated
using paired t-test or Wilcoxon matched pairs test to assess response to therapy in
each treatment arm of the START study. The percentage change in volume and
product of volume and mean intensity between the Apremilast and Placebo group was
compared using Mann-Whitney U test. Statistical significance was achieved if p value
was <0.05. Cumulative distribution plots were produced for the two treatment arms by
the team at Image Analysis to help show the spread of the data. Finally results were
compared to BASDAI scores, bone biomarkers and cytokines to look for correlations
between clinical, imaging and laboratory biomarkers.
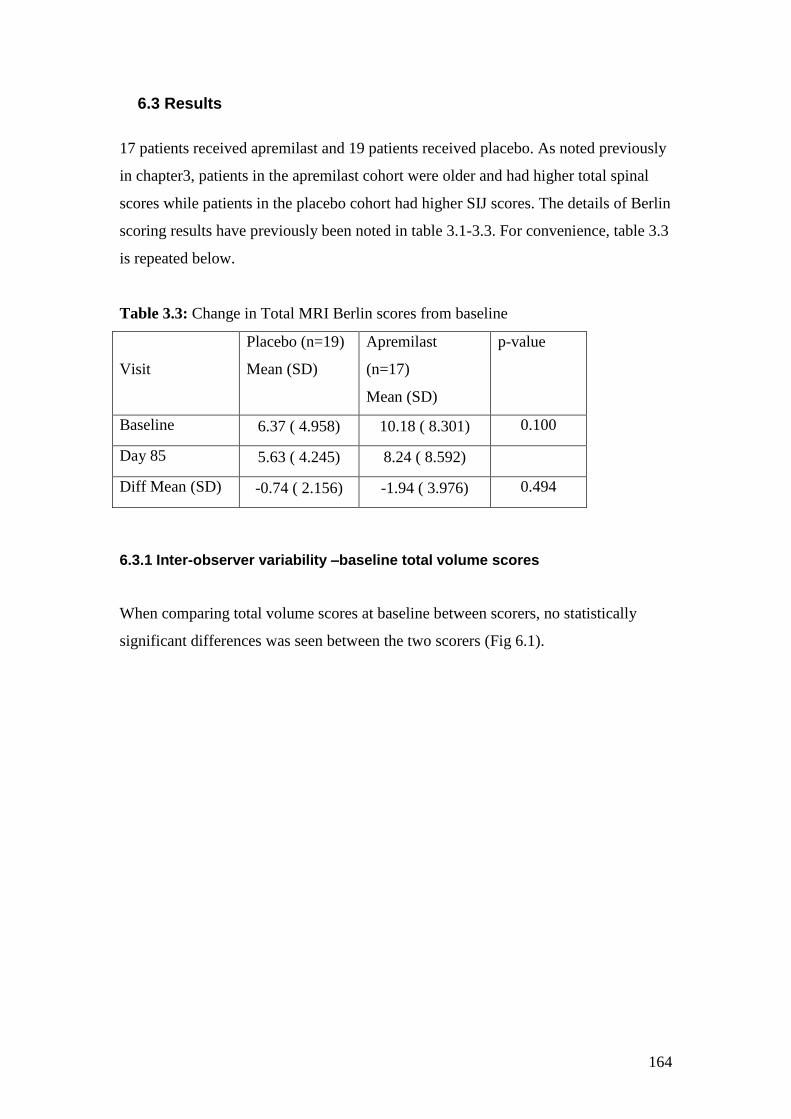
164
6.3 Results
17 patients received apremilast and 19 patients received placebo. As noted previously
in chapter3, patients in the apremilast cohort were older and had higher total spinal
scores while patients in the placebo cohort had higher SIJ scores. The details of Berlin
scoring results have previously been noted in table 3.1-3.3. For convenience, table 3.3
is repeated below.
Table 3.3: Change in Total MRI Berlin scores from baseline
Visit
Placebo (n=19)
Mean (SD)
Apremilast
(n=17)
Mean (SD)
p-value
Baseline 6.37 ( 4.958) 10.18 ( 8.301) 0.100
Day 85 5.63 ( 4.245) 8.24 ( 8.592)
Diff Mean (SD) -0.74 ( 2.156) -1.94 ( 3.976) 0.494
6.3.1 Inter-observer variability –baseline total volume scores
When comparing total volume scores at baseline between scorers, no statistically
significant differences was seen between the two scorers (Fig 6.1).
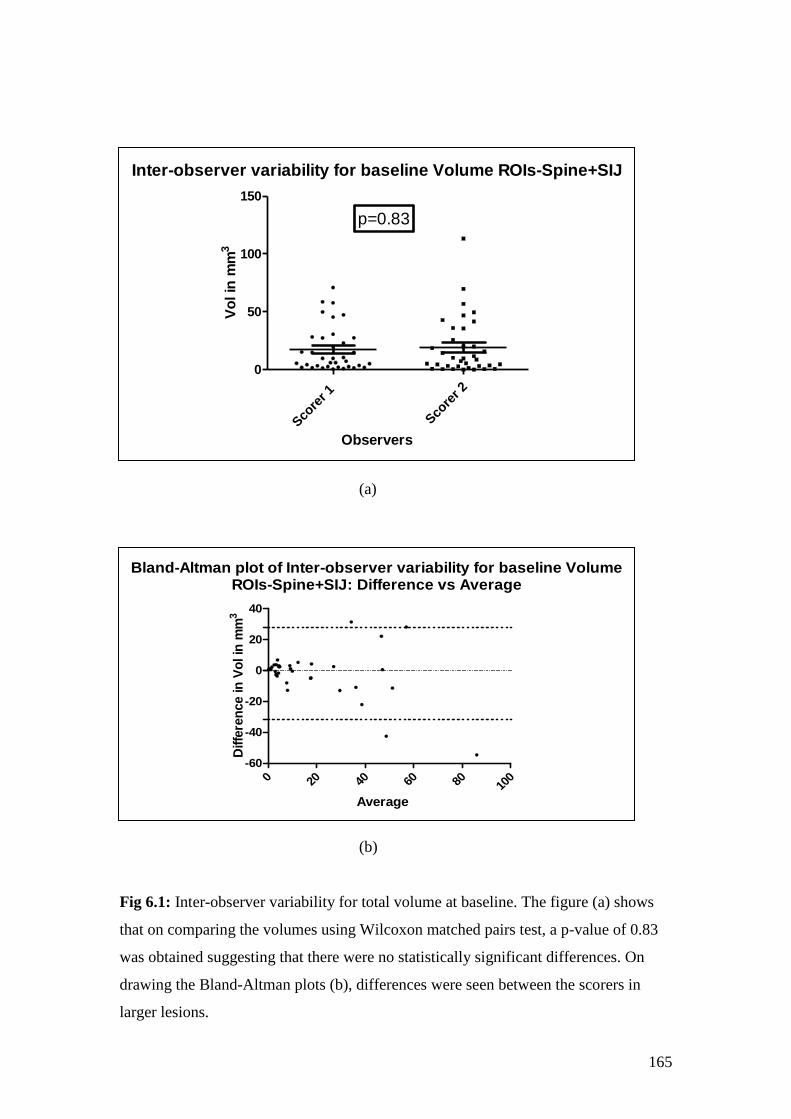
165
(a)
(b)
Fig 6.1: Inter-observer variability for total volume at baseline. The figure (a) shows
that on comparing the volumes using Wilcoxon matched pairs test, a p-value of 0.83
was obtained suggesting that there were no statistically significant differences. On
drawing the Bland-Altman plots (b), differences were seen between the scorers in
larger lesions.
Inter-observer variability for baseline Volume ROIs-Spine+SIJ
Sco
rer 1
Sco
rer 2
0
50
100
150
p=0.83
Observers
Vo
l in
mm
3
Bland-Altman plot of Inter-observer variability for baseline VolumeROIs-Spine+SIJ: Difference vs Average
0 20 40 60 80 100
-60
-40
-20
0
20
40
Average
Diffe
ren
ce in
Vo
l in
mm
3
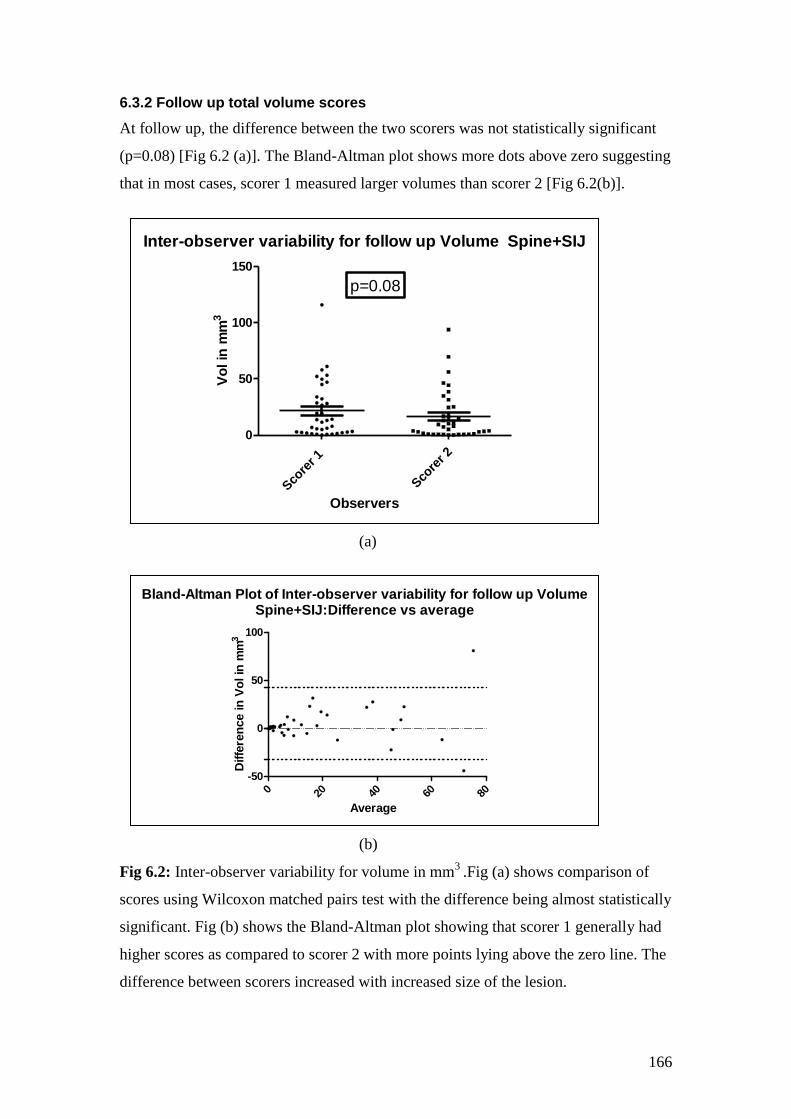
166
6.3.2 Follow up total volume scores
At follow up, the difference between the two scorers was not statistically significant
(p=0.08) [Fig 6.2 (a)]. The Bland-Altman plot shows more dots above zero suggesting
that in most cases, scorer 1 measured larger volumes than scorer 2 [Fig 6.2(b)].
(a)
(b)
Fig 6.2: Inter-observer variability for volume in mm3
.Fig (a) shows comparison of
scores using Wilcoxon matched pairs test with the difference being almost statistically
significant. Fig (b) shows the Bland-Altman plot showing that scorer 1 generally had
higher scores as compared to scorer 2 with more points lying above the zero line. The
difference between scorers increased with increased size of the lesion.
Inter-observer variability for follow up Volume Spine+SIJ
Sco
rer 1
Sco
rer 2
0
50
100
150
p=0.08
Observers
Vo
l in
mm
3
Bland-Altman Plot of Inter-observer variability for follow up VolumeSpine+SIJ:Difference vs average
0 20 40 60 80
-50
0
50
100
Average
Diffe
ren
ce in
Vo
l in
mm
3
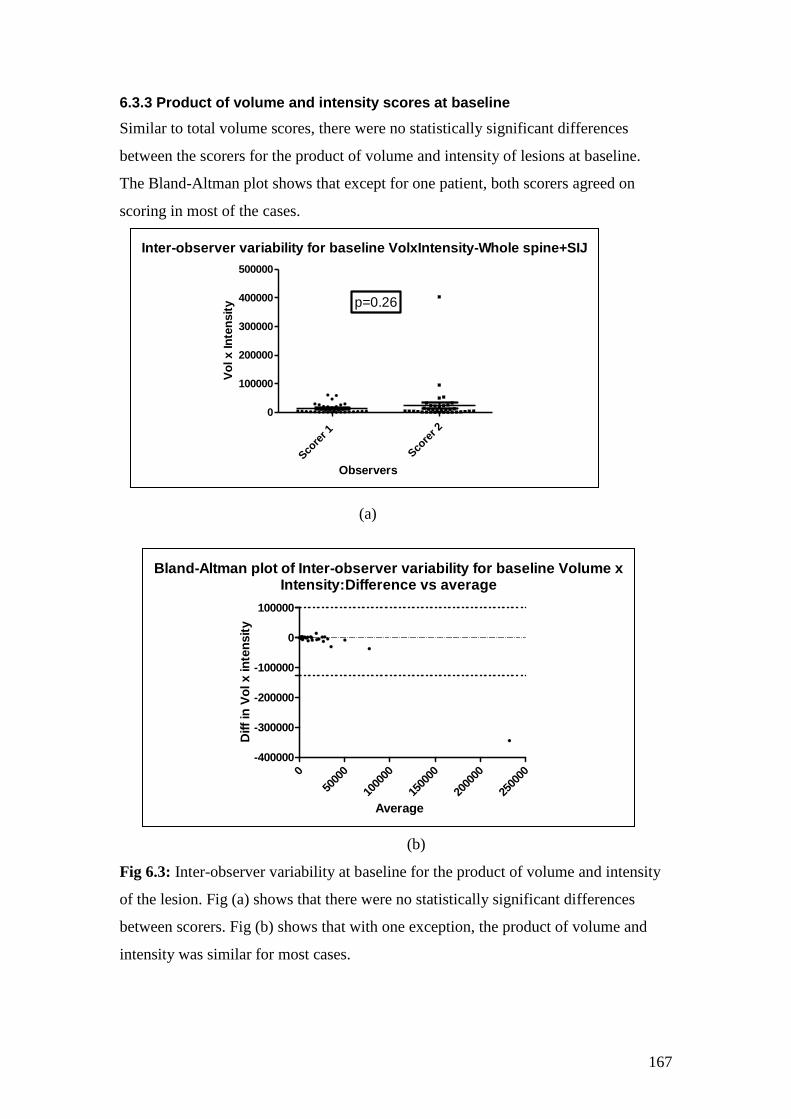
167
6.3.3 Product of volume and intensity scores at baseline
Similar to total volume scores, there were no statistically significant differences
between the scorers for the product of volume and intensity of lesions at baseline.
The Bland-Altman plot shows that except for one patient, both scorers agreed on
scoring in most of the cases.
(a)
(b)
Fig 6.3: Inter-observer variability at baseline for the product of volume and intensity
of the lesion. Fig (a) shows that there were no statistically significant differences
between scorers. Fig (b) shows that with one exception, the product of volume and
intensity was similar for most cases.
Inter-observer variability for baseline VolxIntensity-Whole spine+SIJ
Sco
rer 1
Sco
rer 2
0
100000
200000
300000
400000
500000
p=0.26
Observers
Vo
l x In
ten
sit
y
Bland-Altman plot of Inter-observer variability for baseline Volume xIntensity:Difference vs average
0
5000
0
1000
00
1500
00
2000
00
2500
00
-400000
-300000
-200000
-100000
0
100000
Average
Diff
in V
ol x in
ten
sit
y
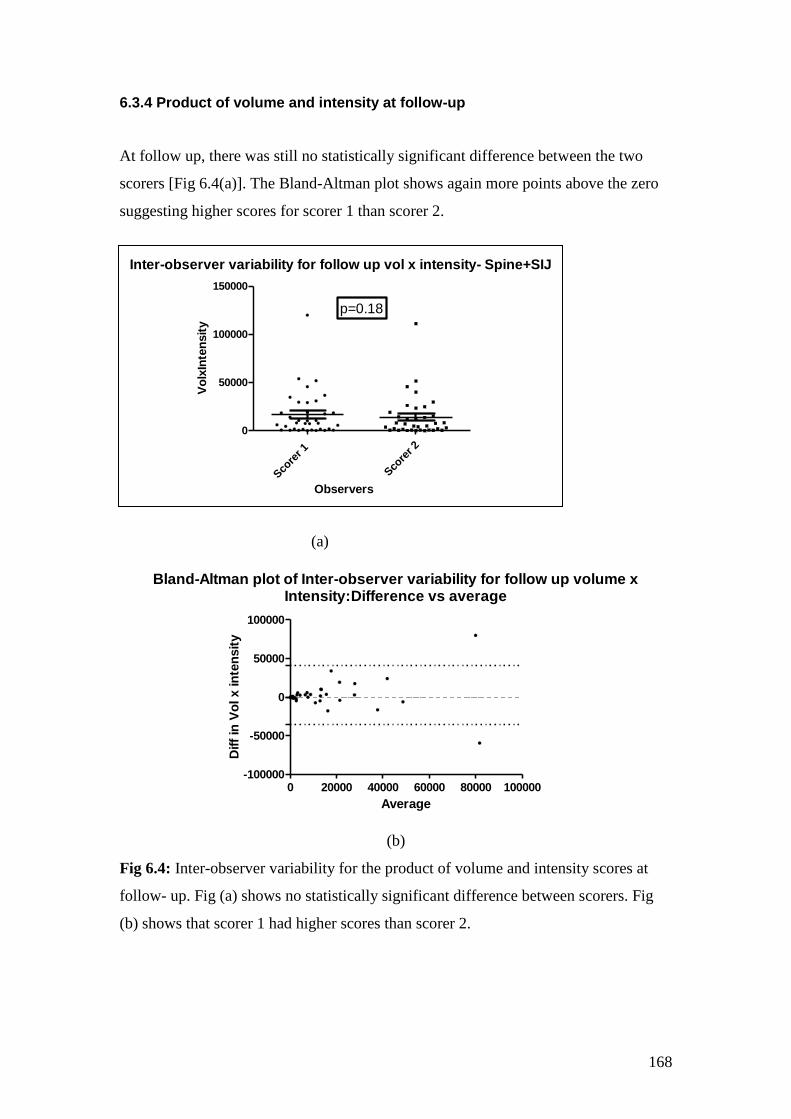
168
6.3.4 Product of volume and intensity at follow-up
At follow up, there was still no statistically significant difference between the two
scorers [Fig 6.4(a)]. The Bland-Altman plot shows again more points above the zero
suggesting higher scores for scorer 1 than scorer 2.
(a)
Bland-Altman plot of Inter-observer variability for follow up volume xIntensity:Difference vs average
0 20000 40000 60000 80000 100000-100000
-50000
0
50000
100000
Average
Diff
in V
ol x in
ten
sit
y
(b)
Fig 6.4: Inter-observer variability for the product of volume and intensity scores at
follow- up. Fig (a) shows no statistically significant difference between scorers. Fig
(b) shows that scorer 1 had higher scores than scorer 2.
Inter-observer variability for follow up vol x intensity- Spine+SIJ
Sco
rer 1
Sco
rer 2
0
50000
100000
150000
p=0.18
Observers
Vo
lxIn
ten
sit
y
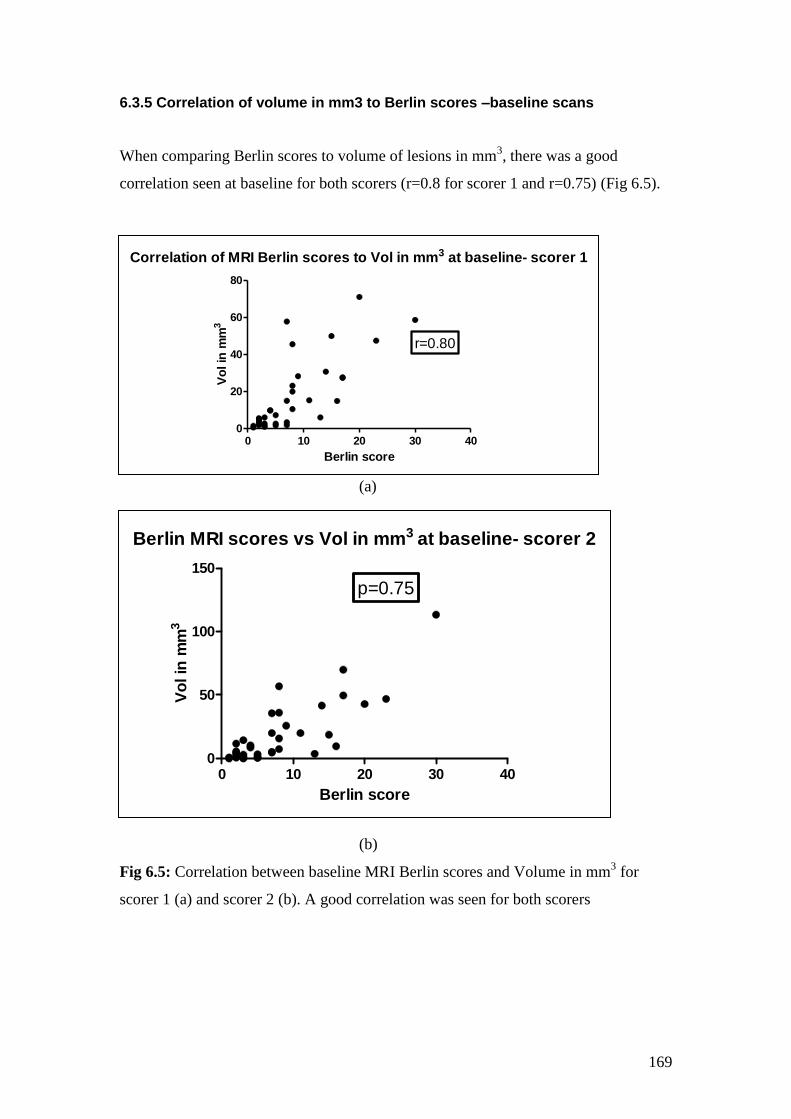
169
6.3.5 Correlation of volume in mm3 to Berlin scores –baseline scans
When comparing Berlin scores to volume of lesions in mm3, there was a good
correlation seen at baseline for both scorers (r=0.8 for scorer 1 and r=0.75) (Fig 6.5).
(a)
(b)
Fig 6.5: Correlation between baseline MRI Berlin scores and Volume in mm3 for
scorer 1 (a) and scorer 2 (b). A good correlation was seen for both scorers
Correlation of MRI Berlin scores to Vol in mm3 at baseline- scorer 1
0 10 20 30 400
20
40
60
80
r=0.80
Berlin score
Vo
l in
mm
3
Berlin MRI scores vs Vol in mm3 at baseline- scorer 2
0 10 20 30 400
50
100
150
p=0.75
Berlin score
Vo
l in
mm
3
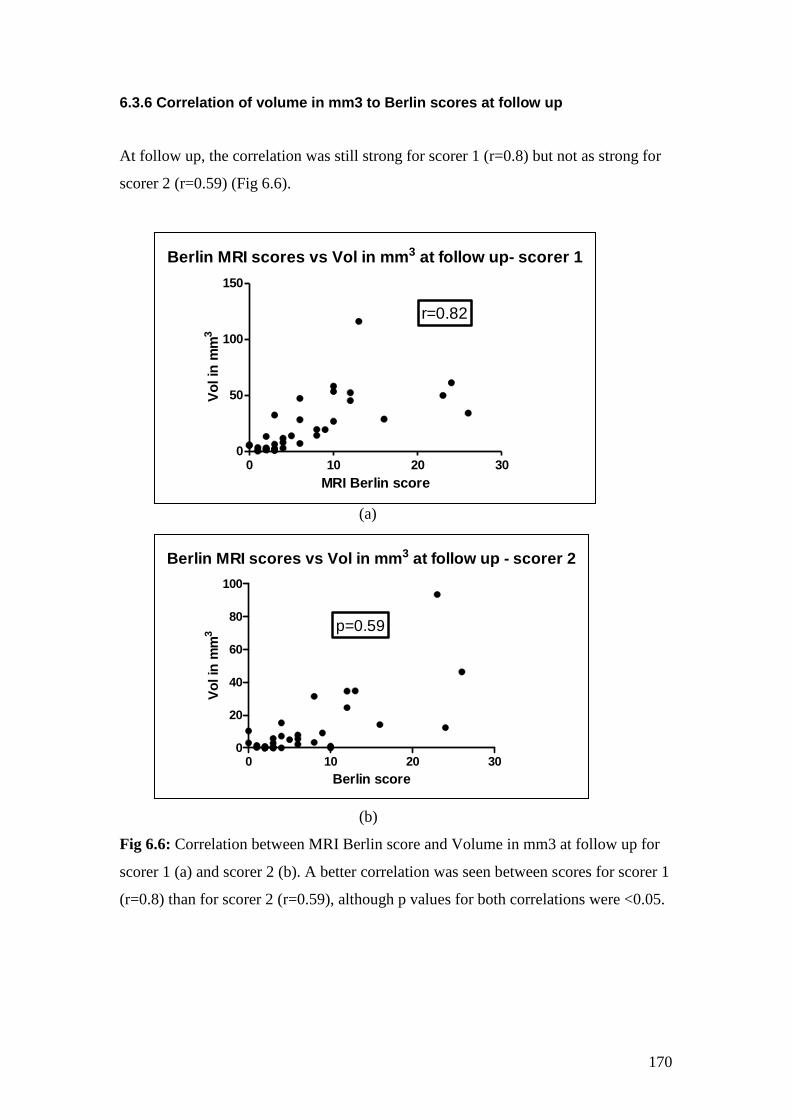
170
6.3.6 Correlation of volume in mm3 to Berlin scores at follow up
At follow up, the correlation was still strong for scorer 1 (r=0.8) but not as strong for
scorer 2 (r=0.59) (Fig 6.6).
(a)
(b)
Fig 6.6: Correlation between MRI Berlin score and Volume in mm3 at follow up for
scorer 1 (a) and scorer 2 (b). A better correlation was seen between scores for scorer 1
(r=0.8) than for scorer 2 (r=0.59), although p values for both correlations were <0.05.
Berlin MRI scores vs Vol in mm3 at follow up- scorer 1
0 10 20 300
50
100
150
r=0.82
MRI Berlin score
Vo
l in
mm
3
Berlin MRI scores vs Vol in mm3 at follow up - scorer 2
0 10 20 300
20
40
60
80
100
p=0.59
Berlin score
Vo
l in
mm
3
171
6.3.7 Improvement in volumes and the product of volume in mm3 and mean
intensity after treatment
When pre and post-treatment volume scores were compared for each scorer, there
were differences seen between the scorers. While the scores for scorer 1 showed an
increase in both volume and the product of volume and intensity in both arms of the
study, the scores for scorer 2 showed a decrease in both these parameters. None of the
p-values for change were statistically significant (Table 6.1).
When percentage change from baseline was compared for the scorers, the percentage
change in the volume from baseline was similar in the two groups for scorer 1, with
both showing an increase. However, percentage change in volume decreased in both
groups for scorer 2 with a greater decrease in the Apremilast versus Placebo group
(table 6.2).
Similarly, when percentage change from baseline in the product of volume and
intensity was compared, an increase was seen in both groups for scorer 1, with the
increase being higher in the placebo than apremilast arm. On the other hand, scores
for scorer 2 showed an increase in percentage change from baseline for placebo and a
decline in percentage change in the apremilast group. None of the p-values for change
from baseline were statistically significant.
Cumulative distribution plots for percentage change from baseline for volume (total
spine and SIJ) are shown for scorer 1 in 6.7 (A&B) and for scorer 2 in fig 6.8 (A&B).
Cumulative distribution plots for percentage from baseline for the product of volume
and mean intensity for scorer 1 are shown in fig 6.9 A&B and for scorer 2 in fig 6.10
(A&B).

172
Table 6.1: Change in volume and product of volume and mean intensity with
treatment
Volume in mm3
Scorer Baseline Follow up p-value
Placebo Scorer 1 (EP) 14.95 (18.23) 17.83 (20.16) 0.09
Scorer 2 (MB) 13.84 (17.07) 11.9 (18.07) 0.88
Apremilast Scorer 1 (EP) 19.9 (21.1) 25.5 (30.1) 0.3
Scorer 2 (MB) 25.34 (30.48) 21.9 (25.7) 0.37
Volume in mm3 x Mean Intensity
Scorer Baseline Follow up p-value
Placebo Scorer 1(EP) 10160 (12542) 11647 (13648) 0.5
Scorer 2 (MB) 10148 (14053) 8580 (12327) 0.6
Apremilast Scorer 1(EP) 15950 (18733) 22785 (30507) 0.24
Scorer 2 (MB) 41079 (96524) 19770 (27689) 0.39
Table 6.2: Percentage change from baseline in volume as well as the product of
volume and intensity
Parameter Scorer Apremilast Placebo p-value
%Change in
Vol (mm3)
Scorer 1 (EP) 24.34 (97.48) 25.43 (78.46) 0.7
Scorer 2 (MB) -14.14 (40.85) -2.06 (62.06) 0.5
%Change in
Vol x Intensity
Scorer 1 (EP) 49.13 (155) 141.1 (469.5) 0.9
Scorer 2(MB) -12.41 (62.39) 11.08 (76.83) 0.3
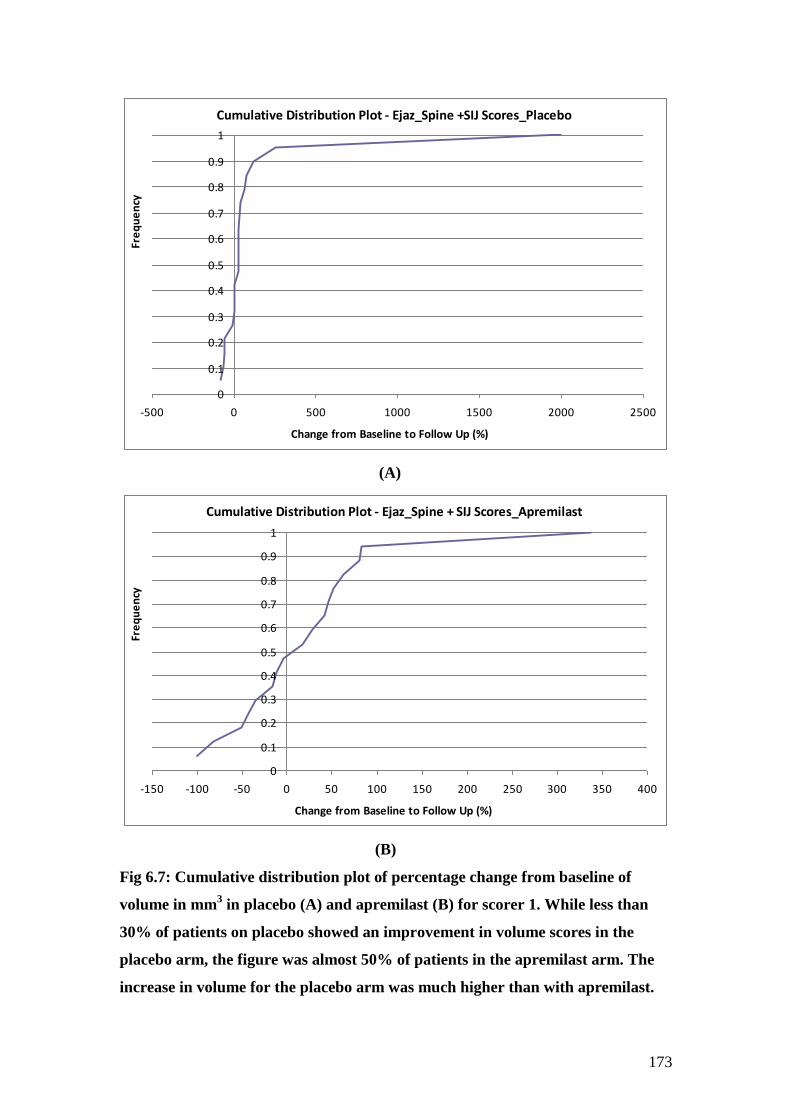
173
Cumulative Distribution Plot - Ejaz_Spine +SIJ Scores_Placebo
0
0.1
0.2
0.3
0.4
0.5
0.6
0.7
0.8
0.9
1
-500 0 500 1000 1500 2000 2500
Change from Baseline to Follow Up (%)
Fre
qu
en
cy
(A)
Cumulative Distribution Plot - Ejaz_Spine + SIJ Scores_Apremilast
0
0.1
0.2
0.3
0.4
0.5
0.6
0.7
0.8
0.9
1
-150 -100 -50 0 50 100 150 200 250 300 350 400
Change from Baseline to Follow Up (%)
Fre
qu
en
cy
(B)
Fig 6.7: Cumulative distribution plot of percentage change from baseline of
volume in mm3 in placebo (A) and apremilast (B) for scorer 1. While less than
30% of patients on placebo showed an improvement in volume scores in the
placebo arm, the figure was almost 50% of patients in the apremilast arm. The
increase in volume for the placebo arm was much higher than with apremilast.
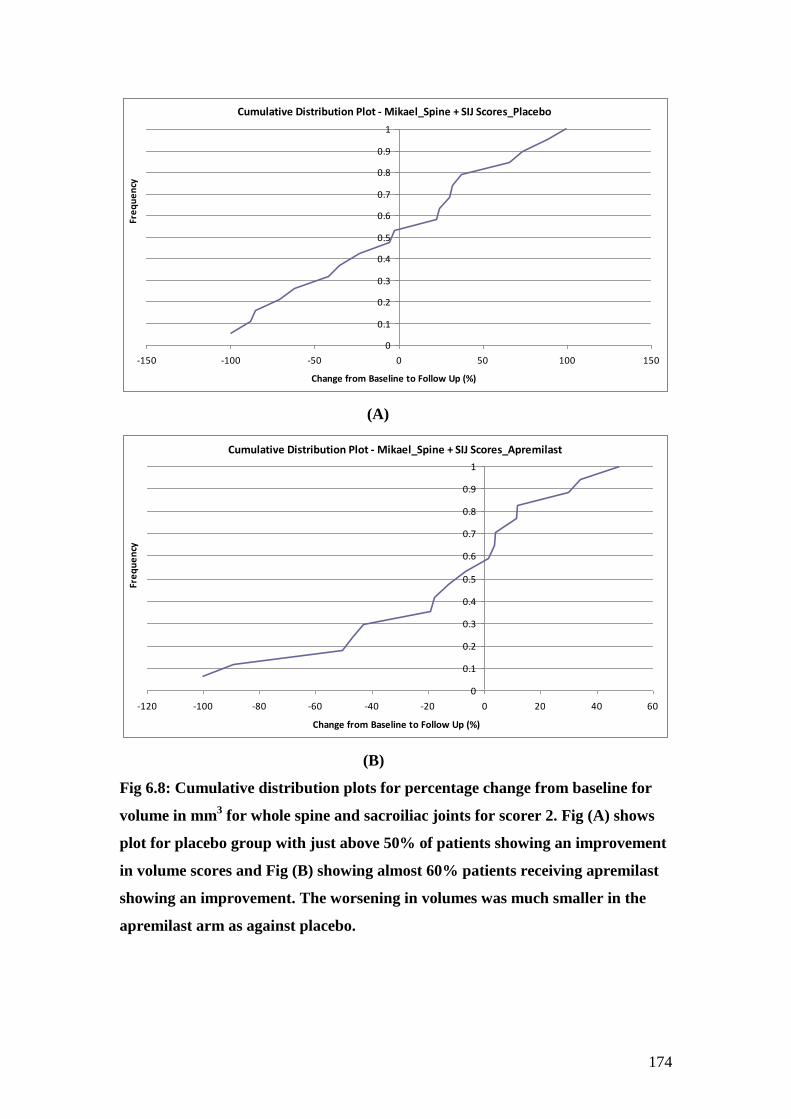
174
Cumulative Distribution Plot - Mikael_Spine + SIJ Scores_Placebo
0
0.1
0.2
0.3
0.4
0.5
0.6
0.7
0.8
0.9
1
-150 -100 -50 0 50 100 150
Change from Baseline to Follow Up (%)
Fre
qu
en
cy
(A)
Cumulative Distribution Plot - Mikael_Spine + SIJ Scores_Apremilast
0
0.1
0.2
0.3
0.4
0.5
0.6
0.7
0.8
0.9
1
-120 -100 -80 -60 -40 -20 0 20 40 60
Change from Baseline to Follow Up (%)
Fre
qu
en
cy
(B)
Fig 6.8: Cumulative distribution plots for percentage change from baseline for
volume in mm3 for whole spine and sacroiliac joints for scorer 2. Fig (A) shows
plot for placebo group with just above 50% of patients showing an improvement
in volume scores and Fig (B) showing almost 60% patients receiving apremilast
showing an improvement. The worsening in volumes was much smaller in the
apremilast arm as against placebo.
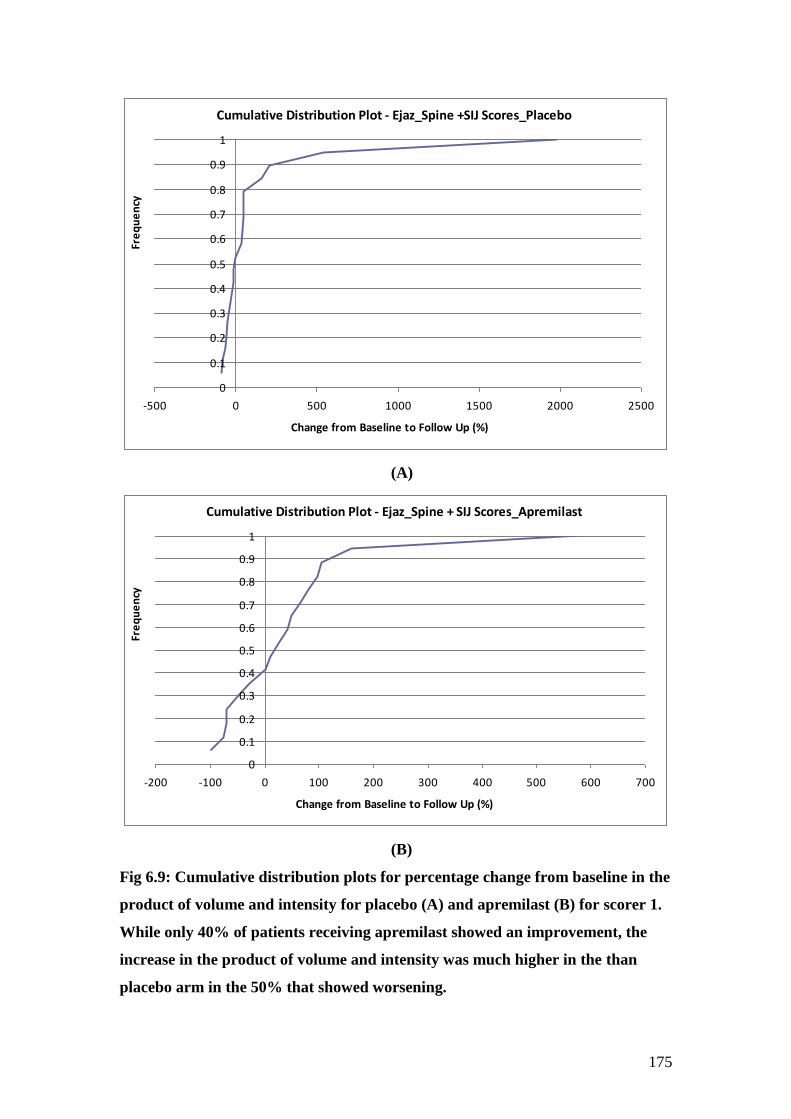
175
Cumulative Distribution Plot - Ejaz_Spine +SIJ Scores_Placebo
0
0.1
0.2
0.3
0.4
0.5
0.6
0.7
0.8
0.9
1
-500 0 500 1000 1500 2000 2500
Change from Baseline to Follow Up (%)
Fre
qu
en
cy
(A)
Cumulative Distribution Plot - Ejaz_Spine + SIJ Scores_Apremilast
0
0.1
0.2
0.3
0.4
0.5
0.6
0.7
0.8
0.9
1
-200 -100 0 100 200 300 400 500 600 700
Change from Baseline to Follow Up (%)
Fre
qu
en
cy
(B)
Fig 6.9: Cumulative distribution plots for percentage change from baseline in the
product of volume and intensity for placebo (A) and apremilast (B) for scorer 1.
While only 40% of patients receiving apremilast showed an improvement, the
increase in the product of volume and intensity was much higher in the than
placebo arm in the 50% that showed worsening.
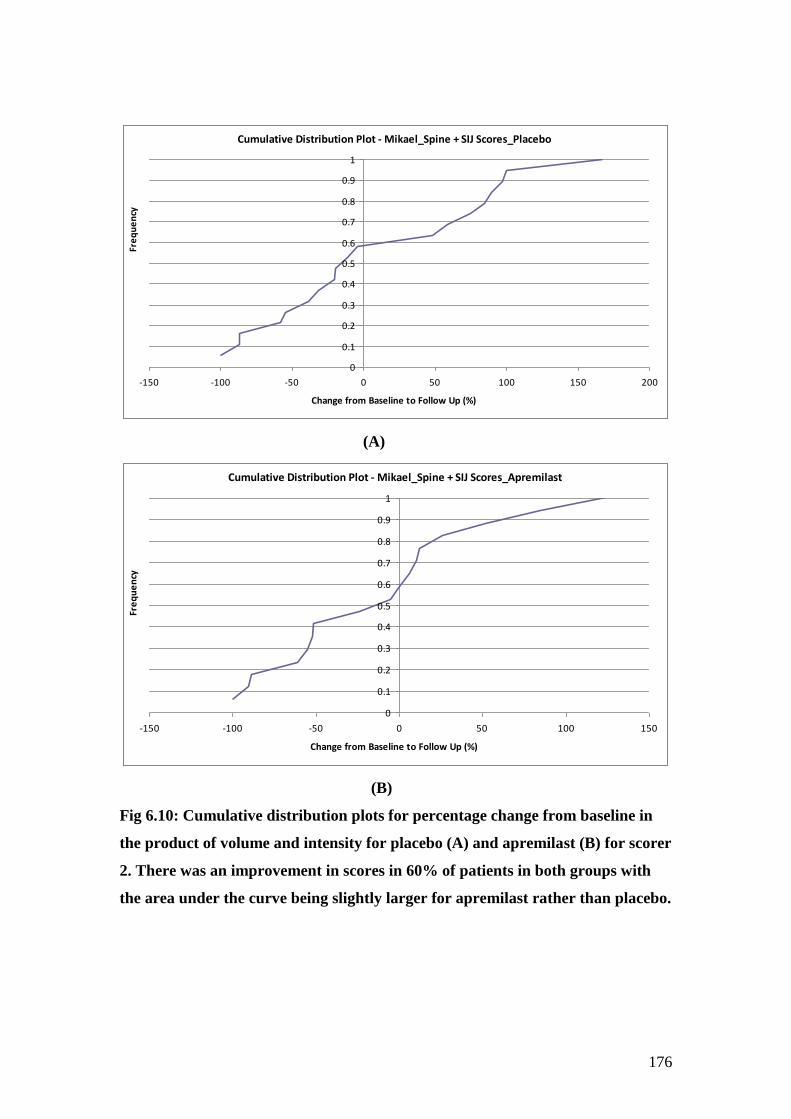
176
Cumulative Distribution Plot - Mikael_Spine + SIJ Scores_Placebo
0
0.1
0.2
0.3
0.4
0.5
0.6
0.7
0.8
0.9
1
-150 -100 -50 0 50 100 150 200
Change from Baseline to Follow Up (%)
Fre
qu
en
cy
(A)
Cumulative Distribution Plot - Mikael_Spine + SIJ Scores_Apremilast
0
0.1
0.2
0.3
0.4
0.5
0.6
0.7
0.8
0.9
1
-150 -100 -50 0 50 100 150
Change from Baseline to Follow Up (%)
Fre
qu
en
cy
(B)
Fig 6.10: Cumulative distribution plots for percentage change from baseline in
the product of volume and intensity for placebo (A) and apremilast (B) for scorer
2. There was an improvement in scores in 60% of patients in both groups with
the area under the curve being slightly larger for apremilast rather than placebo.

177
6.3.7 Correlation between percentage change in BASDAI versus percentage change in volume as well as the product of volume and intensity
When studied as a group, in the START cohort, there were no correlations seen
between percentage change from baseline in BASDAI versus percentage change in
volume or percentage change in the product of volume and intensity for either scorer.
It is however, important to note that the product of volume and intensity in this cohort
was calculated for individual lesions and then added together. This was in contrast to
the anti-TNF cohort, where the total volume of all lesions was multiplied by the mean
intensity of all lesions. When the same procedure was repeated for my scores in the
START cohort, a similar correlation was seen between percentage change in the
product versus percentage change in BASDAI (r=0.34, p=0.04 for scorer 1).
When the difference between pre and post-treatment scores for volume as well as the
product of volume and intensity were compared to the difference in BASDAI scores,
in the apremilast cohort, a negative correlation was found with change in volume (r =
-0.5, p=0.02) and change in the product of volume and intensity (r = -0.3, p=0.25)
only for scorer 2 scores. No correlations were seen in the placebo group.
6.3.8 Correlation between percentage change in MRI Berlin score versus percentage change in volume as well as the product of volume and intensity
When percentage change in MRI Berlin scores was compared to percentage change in
volume as well as the product of volume and intensity, a good correlation was found
with scores from scorer 2 (r = 0.5, p<0.01 for both parameters). However, the
correlations were weaker for scores from scorer 1 (r=0.24 for volume and 0.27 for
volume x intensity, p>0.05).
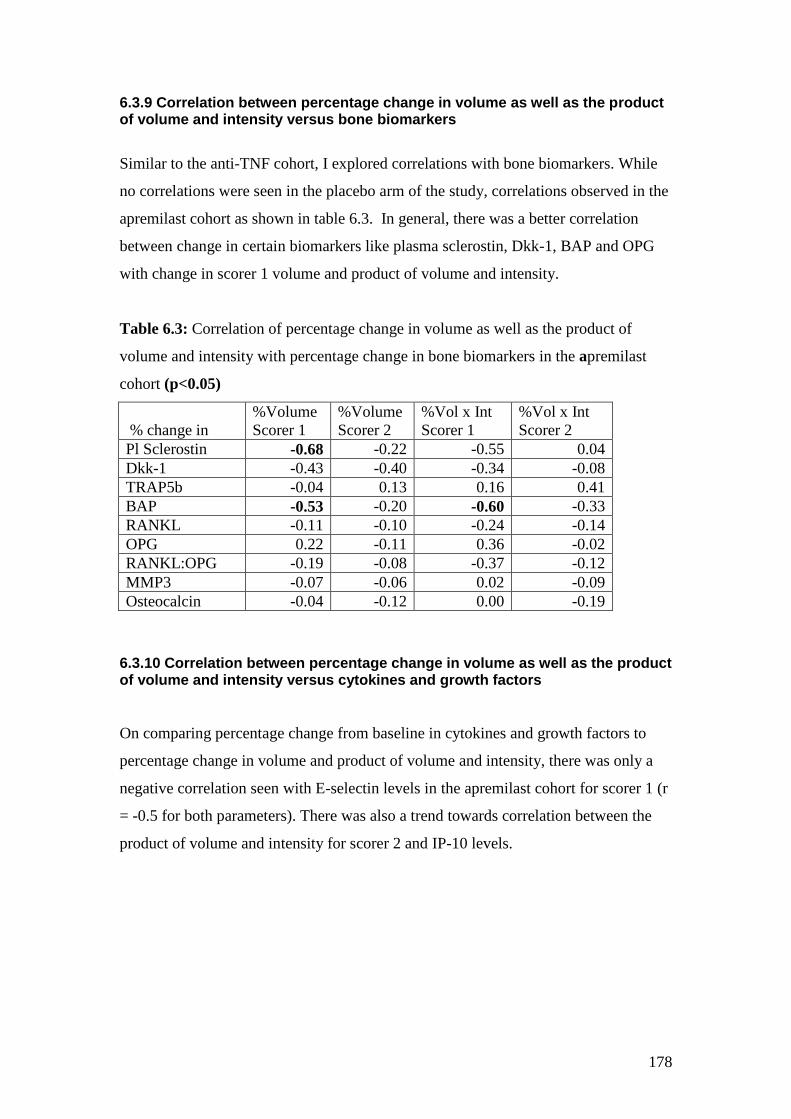
178
6.3.9 Correlation between percentage change in volume as well as the product of volume and intensity versus bone biomarkers
Similar to the anti-TNF cohort, I explored correlations with bone biomarkers. While
no correlations were seen in the placebo arm of the study, correlations observed in the
apremilast cohort as shown in table 6.3. In general, there was a better correlation
between change in certain biomarkers like plasma sclerostin, Dkk-1, BAP and OPG
with change in scorer 1 volume and product of volume and intensity.
Table 6.3: Correlation of percentage change in volume as well as the product of
volume and intensity with percentage change in bone biomarkers in the apremilast
cohort (p<0.05)
% change in
%Volume
Scorer 1
%Volume
Scorer 2
%Vol x Int
Scorer 1
%Vol x Int
Scorer 2
Pl Sclerostin -0.68 -0.22 -0.55 0.04
Dkk-1 -0.43 -0.40 -0.34 -0.08
TRAP5b -0.04 0.13 0.16 0.41
BAP -0.53 -0.20 -0.60 -0.33
RANKL -0.11 -0.10 -0.24 -0.14
OPG 0.22 -0.11 0.36 -0.02
RANKL:OPG -0.19 -0.08 -0.37 -0.12
MMP3 -0.07 -0.06 0.02 -0.09
Osteocalcin -0.04 -0.12 0.00 -0.19
6.3.10 Correlation between percentage change in volume as well as the product of volume and intensity versus cytokines and growth factors
On comparing percentage change from baseline in cytokines and growth factors to
percentage change in volume and product of volume and intensity, there was only a
negative correlation seen with E-selectin levels in the apremilast cohort for scorer 1 (r
= -0.5 for both parameters). There was also a trend towards correlation between the
product of volume and intensity for scorer 2 and IP-10 levels.
179
6.4 Discussion
This chapter shows how the volumetric analysis can be applied in the clinical trial
setting. It highlights the fact that there was a good correlation between Berlin scoring
and volumetric analysis, hence further validating this against an established scoring
system. I have shown that two observers independently scoring scans obtained
acceptable level of agreement for scores at baseline. There were differences between
the scorers at follow up which are important but can be overcome in order to make
this method more robust.
Firstly, the two scorers did not have a training session together to agree on how scans
should be scored. I wrote a standard operating procedure to score the scans and
calculate results. However, Mikael who had previously used the same software
modified his approach to the analysis. While I scored multiple lesions on the same
vertebra separately, he produced a single volume for all lesions on the same vertebra.
Secondly, as in chapter 5, there were also differences in which scan was used for
scoring lesions that were common to cervical and thoracic or thoracic and lumbar
spine scans. The intensities of the lesions on the different scans were very different,
hence leading to differences between scorers.
Thirdly, as with the anti-TNF data, there were differences between scorers as to the
number of lesions scored and also the number of slices scored for each lesion. Mikael
scored a number of lesions in the lateral elements (paravertebral), while I scored only
lesions in the vertebral body. This was obviously because he was well experienced in
MRI imaging and was able to detect these lesions.
Similar to anti-TNF data, I scored larger volumes at follow up for both patient groups.
This probably again reflects the fact that I was less experienced and was not sure of
whether a lesion was a true lesion or an artefact. It is noteworthy that Mikael’s scores
were in agreement with MRI Berlin scores produced by 2 other independent
musculoskeletal radiologists. As with the MRI Berlin score, there was an
improvement in scores at follow up for both apremilast and placebo arms of the study

180
but a greater improvement in the apremilast arm rather than placebo. The difference,
as with MRI Berlin scoring, was not statistically significant. It was also important to
note that when the difference between baseline and follow up scores were compared,
there was a correlation between difference in BASDAI scores and difference in
volumetric scores obtained by Mikael. It is not clear why this association was stronger
for volume of lesions as against the product of volume and intensity, which showed a
better correlation with the anti-TNF data described in chapter 5. This may be related
to the way the product of volume and intensity was calculated. In the previous chapter
by multiplying the total volume by the mean intensity of all lesions, the intensity of
lesion weighed higher than the volume of the lesion as a factor for this score. This
would need to be investigated further in larger patient cohorts.
It is not clear why my scores showed a worsening in both patient groups as against
Mikael’s that showed an improvement. Clearly as he is the more experienced observer
and as his results mirror those of 2 other musculoskeletal radiologists, they are likely
to represent true results. One could argue that my scores correlated well with MRI
Berlin scores although when percentage change from baseline was compared between
the two scoring system, the correlation was poor. There may have been an element of
bias here as I was present when the Berlin scoring was carried out by the scorers.
Even though my scores did not correlate to clinical scores, in the apremilast arm,
there was a correlation seen with plasma sclerostin, BAP and E-selectin. All of these
biomarkers showed important change with treatment with apremilast showing
correlations either with BASDAI or MRI Berlin scores. This may indicate that my
scores also reflected change in disease activity.
There are three ways of resolving these differences between scorers. The first could
be to only take into account lesions scored by both scorers. However, given that I am
not a trained musculoskeletal radiologist, this may exclude some true lesions that I
have not scored. The second option would be to develop an automated ROI tool and
apply this to lesions scored by both scorers to minimise differences. This may or may
not reduce discrepancy depending on whether the discrepancy lies in the size of lesion
scored or the actual number of lesions. Lastly, a third blinded scorer who is
181
musculoskeletal radiologist, could rescore scans. Clearly, more work is needed before
volumetric analysis can be used as a tool in clinical research.
6.5 Future work:
Further work needs to be done to standardize scoring using Dynamika. The analysis
of images for the START study required more than 120 hours to complete as against 6
hours needed for scoring using Berlin scoring. It would hence need to become more
user friendly before it can be applied to clinical research. This can be done by
improving the automatic ROI function which should allow the user to create the ROI
by drawing a single line through the area of interest with varying intensities on one
slice. This in turn should draw ROIs on adjacent slices automatically, reducing the
inter-observer variability between observers who normally differ in the number of
slices scored. It would also help for the two observers to look at scans together and
agree before hand as to which lesions need scoring and which ones are artefacts.
6.6 Conclusion:
Although this chapter highlights a number of problems with volumetric analysis, the
correlation of volumetric scores with Berlin scores establishes this as a novel method
of assessing response to therapy. The correlation to both clinical and laboratory
biomarkers brings us a step closer to finding an objective biomarker of response to
therapy in ankylosing spondylitis.

182
Chapter 7: Concluding Discussion
183
7.1 Discussion
Ankylosing Spondylitis (AS) is probably more prevalent than previously realised. It is
often recognised late but the use of MRI now allows diagnosis early on in the disease.
The treatment options for the management of AS have largely remained the same,
exercise, NSAIDs and anti-TNF agents. Although there is emerging interest in some
therapies such as IL-17 inhibitors [31], newer agents such as IL-6 inhibitors[30] and
anti-B cell therapy[29] do not work in AS like they do for rheumatoid arthritis. There
is thus a need for other therapies that are cost effective. Given the lack of effective
DMARDs in AS, new drugs that maybe positioned between NSAIDs and anti-TNF
agents would hence be seen as a major advance in the management of this condition.
This thesis has explored PDE4 inhibition for AS and demonstrated this to be of
potential clinical benefit. Apremilast has also been shown by others to be effective in
the management of psoriatic arthritis in clinical trials [155].
This thesis also highlights the contemporary challenges of clinical trial development
in AS. The need to demonstrate clinical improvements and also to provide robust
objective evidence of benefit on imaging in a feasible sized population is a challenge.
Various semi quantitative scoring methods have been developed to assess MRI and
these have been discussed. I have also presented exploratory data for alternative
approaches to MR image assessment in AS. Although semi-quantitative methods do
take into account both change in volume and intensity of lesions, volumetric analysis
using Dynamika, is able to objectively quantify this change for the first time. This
holds promise for further advance in sensitivity to change but some methodological
issues remain to be resolved.
In this thesis, I have also demonstrated the correlations between clinical, imaging and
laboratory biomarkers in three AS patient cohorts in an attempt to highlight the role of
these biomarkers both in routine clinical practice and in the clinical trial setting. In the
absence of an existing biomarker that provides a clear reproducible measure of
response, clinical indices of disease activity still dictate what treatment a patient
should receive.
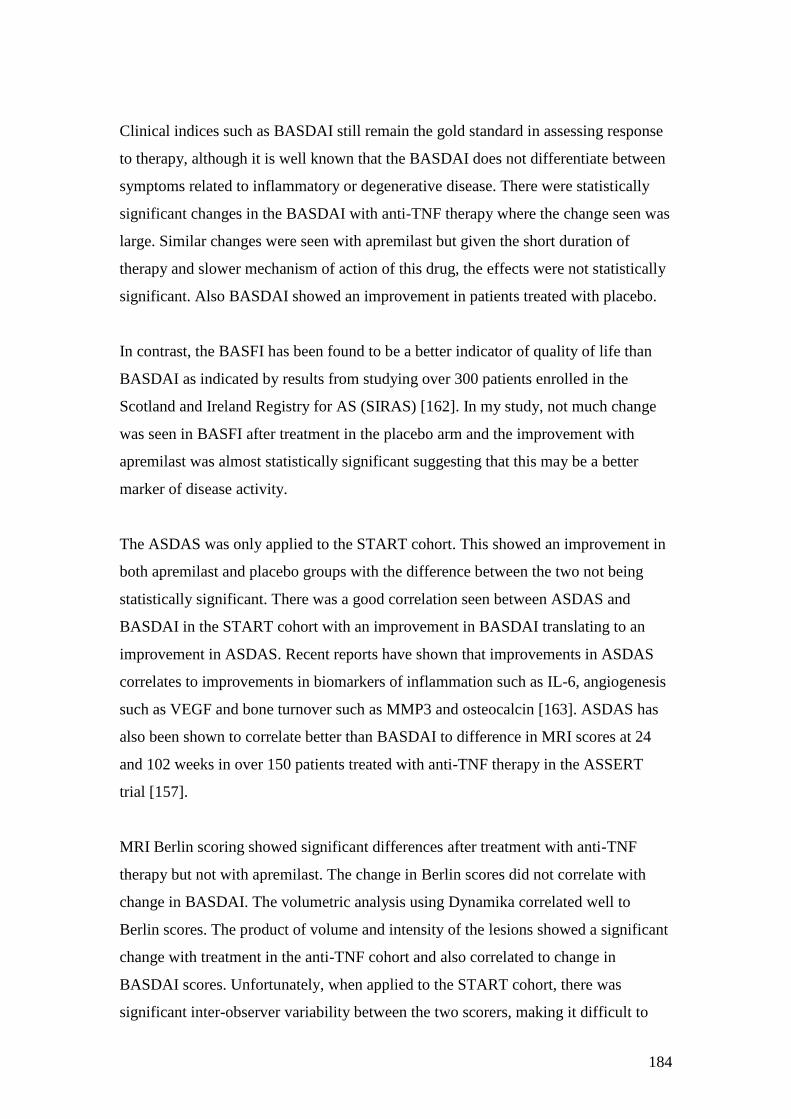
184
Clinical indices such as BASDAI still remain the gold standard in assessing response
to therapy, although it is well known that the BASDAI does not differentiate between
symptoms related to inflammatory or degenerative disease. There were statistically
significant changes in the BASDAI with anti-TNF therapy where the change seen was
large. Similar changes were seen with apremilast but given the short duration of
therapy and slower mechanism of action of this drug, the effects were not statistically
significant. Also BASDAI showed an improvement in patients treated with placebo.
In contrast, the BASFI has been found to be a better indicator of quality of life than
BASDAI as indicated by results from studying over 300 patients enrolled in the
Scotland and Ireland Registry for AS (SIRAS) [162]. In my study, not much change
was seen in BASFI after treatment in the placebo arm and the improvement with
apremilast was almost statistically significant suggesting that this may be a better
marker of disease activity.
The ASDAS was only applied to the START cohort. This showed an improvement in
both apremilast and placebo groups with the difference between the two not being
statistically significant. There was a good correlation seen between ASDAS and
BASDAI in the START cohort with an improvement in BASDAI translating to an
improvement in ASDAS. Recent reports have shown that improvements in ASDAS
correlates to improvements in biomarkers of inflammation such as IL-6, angiogenesis
such as VEGF and bone turnover such as MMP3 and osteocalcin [163]. ASDAS has
also been shown to correlate better than BASDAI to difference in MRI scores at 24
and 102 weeks in over 150 patients treated with anti-TNF therapy in the ASSERT
trial [157].
MRI Berlin scoring showed significant differences after treatment with anti-TNF
therapy but not with apremilast. The change in Berlin scores did not correlate with
change in BASDAI. The volumetric analysis using Dynamika correlated well to
Berlin scores. The product of volume and intensity of the lesions showed a significant
change with treatment in the anti-TNF cohort and also correlated to change in
BASDAI scores. Unfortunately, when applied to the START cohort, there was
significant inter-observer variability between the two scorers, making it difficult to
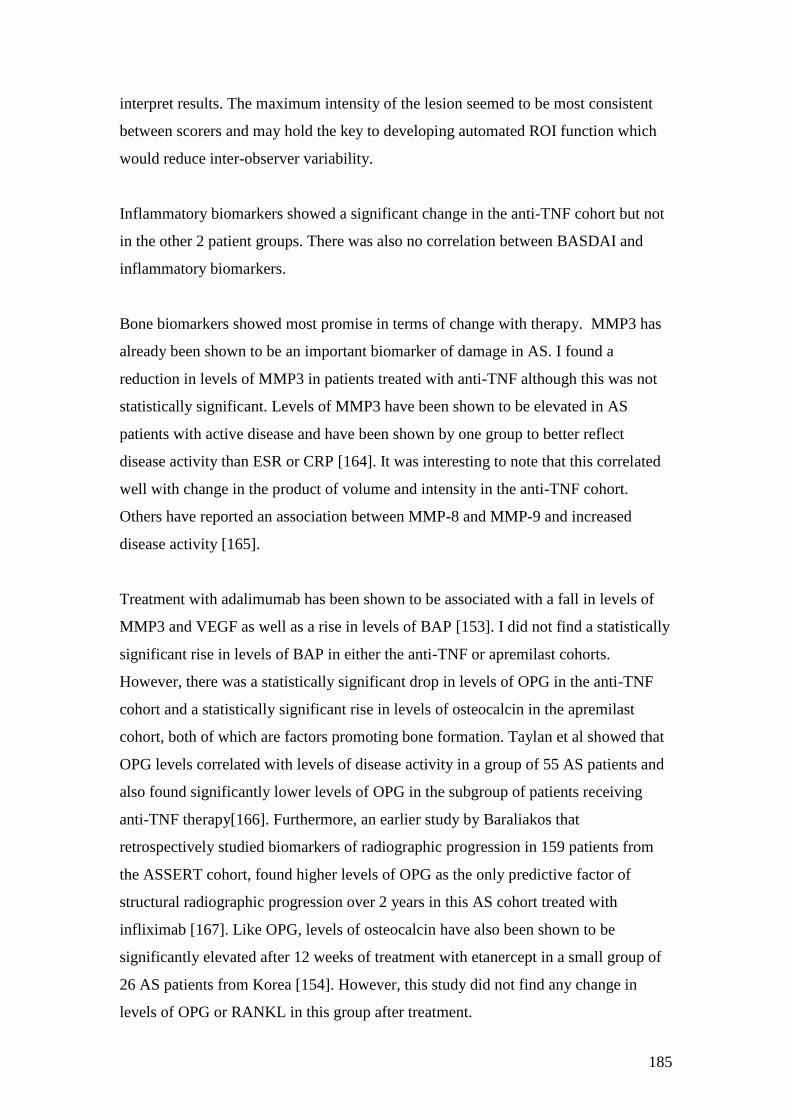
185
interpret results. The maximum intensity of the lesion seemed to be most consistent
between scorers and may hold the key to developing automated ROI function which
would reduce inter-observer variability.
Inflammatory biomarkers showed a significant change in the anti-TNF cohort but not
in the other 2 patient groups. There was also no correlation between BASDAI and
inflammatory biomarkers.
Bone biomarkers showed most promise in terms of change with therapy. MMP3 has
already been shown to be an important biomarker of damage in AS. I found a
reduction in levels of MMP3 in patients treated with anti-TNF although this was not
statistically significant. Levels of MMP3 have been shown to be elevated in AS
patients with active disease and have been shown by one group to better reflect
disease activity than ESR or CRP [164]. It was interesting to note that this correlated
well with change in the product of volume and intensity in the anti-TNF cohort.
Others have reported an association between MMP-8 and MMP-9 and increased
disease activity [165].
Treatment with adalimumab has been shown to be associated with a fall in levels of
MMP3 and VEGF as well as a rise in levels of BAP [153]. I did not find a statistically
significant rise in levels of BAP in either the anti-TNF or apremilast cohorts.
However, there was a statistically significant drop in levels of OPG in the anti-TNF
cohort and a statistically significant rise in levels of osteocalcin in the apremilast
cohort, both of which are factors promoting bone formation. Taylan et al showed that
OPG levels correlated with levels of disease activity in a group of 55 AS patients and
also found significantly lower levels of OPG in the subgroup of patients receiving
anti-TNF therapy[166]. Furthermore, an earlier study by Baraliakos that
retrospectively studied biomarkers of radiographic progression in 159 patients from
the ASSERT cohort, found higher levels of OPG as the only predictive factor of
structural radiographic progression over 2 years in this AS cohort treated with
infliximab [167]. Like OPG, levels of osteocalcin have also been shown to be
significantly elevated after 12 weeks of treatment with etanercept in a small group of
26 AS patients from Korea [154]. However, this study did not find any change in
levels of OPG or RANKL in this group after treatment.
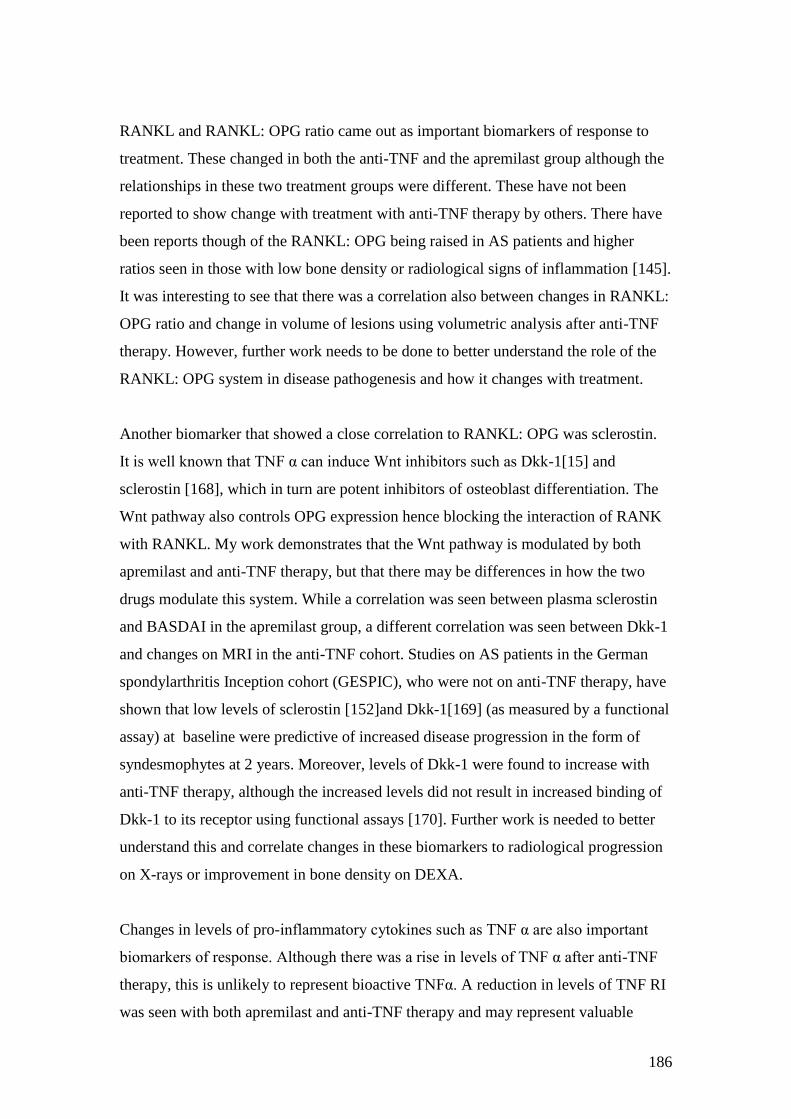
186
RANKL and RANKL: OPG ratio came out as important biomarkers of response to
treatment. These changed in both the anti-TNF and the apremilast group although the
relationships in these two treatment groups were different. These have not been
reported to show change with treatment with anti-TNF therapy by others. There have
been reports though of the RANKL: OPG being raised in AS patients and higher
ratios seen in those with low bone density or radiological signs of inflammation [145].
It was interesting to see that there was a correlation also between changes in RANKL:
OPG ratio and change in volume of lesions using volumetric analysis after anti-TNF
therapy. However, further work needs to be done to better understand the role of the
RANKL: OPG system in disease pathogenesis and how it changes with treatment.
Another biomarker that showed a close correlation to RANKL: OPG was sclerostin.
It is well known that TNF α can induce Wnt inhibitors such as Dkk-1[15] and
sclerostin [168], which in turn are potent inhibitors of osteoblast differentiation. The
Wnt pathway also controls OPG expression hence blocking the interaction of RANK
with RANKL. My work demonstrates that the Wnt pathway is modulated by both
apremilast and anti-TNF therapy, but that there may be differences in how the two
drugs modulate this system. While a correlation was seen between plasma sclerostin
and BASDAI in the apremilast group, a different correlation was seen between Dkk-1
and changes on MRI in the anti-TNF cohort. Studies on AS patients in the German
spondylarthritis Inception cohort (GESPIC), who were not on anti-TNF therapy, have
shown that low levels of sclerostin [152]and Dkk-1[169] (as measured by a functional
assay) at baseline were predictive of increased disease progression in the form of
syndesmophytes at 2 years. Moreover, levels of Dkk-1 were found to increase with
anti-TNF therapy, although the increased levels did not result in increased binding of
Dkk-1 to its receptor using functional assays [170]. Further work is needed to better
understand this and correlate changes in these biomarkers to radiological progression
on X-rays or improvement in bone density on DEXA.
Changes in levels of pro-inflammatory cytokines such as TNF α are also important
biomarkers of response. Although there was a rise in levels of TNF α after anti-TNF
therapy, this is unlikely to represent bioactive TNFα. A reduction in levels of TNF RI
was seen with both apremilast and anti-TNF therapy and may represent valuable

187
marker of response to therapy. A recent study of AS patients undergoing treatment
with golimumab that evaluated 92 different biomarkers, found a significant change in
levels of TNF receptor II, along with 15 other biomarkers, after 4 weeks of treatment
with golimumab [171]. E-selectin was the only other biomarker that correlated with
change in BASDAI scores, a drop in BASDAI correlating to a drop in E-selectin
levels. This again has not been reported to change by others [172]. Levels of IL-6 and
VEGF have traditionally been reported by many previous studies to show change with
treatment [131, 163, 171]. My results showed that levels of IL-6 only showed a trend
toward correlation with change in MRI scores but not with BASDAI. Levels of VEGF
did not show a significant change with treatment, but correlated to change in MRI
scores in the placebo arm. Levels of VEGF have been shown to correlate to disease
activity in AS [133].
Levels of IL-13, IL-17 and IL-23 proved difficult to interpret in this study as levels
were below the recordable range for a large number of samples. It was hence difficult
to draw any conclusions from our data although associations were seen in the anti-
TNF cohort suggesting a possible mechanism of action. Levels of IL-12/23 p40 unit
were reliably measured but only showed a weak association with change in BASDAI
scores. Similar lack of correlation to disease activity has been described by Wendling
et al [173] that studied this biomarker in 27 AS patients, 14 of whom were treated
with anti-TNF therapy. No change was seen in levels of IL-12p40 after treatment and
no correlations were observed between IL-12p40 and BASDAI, ESR or CRP.
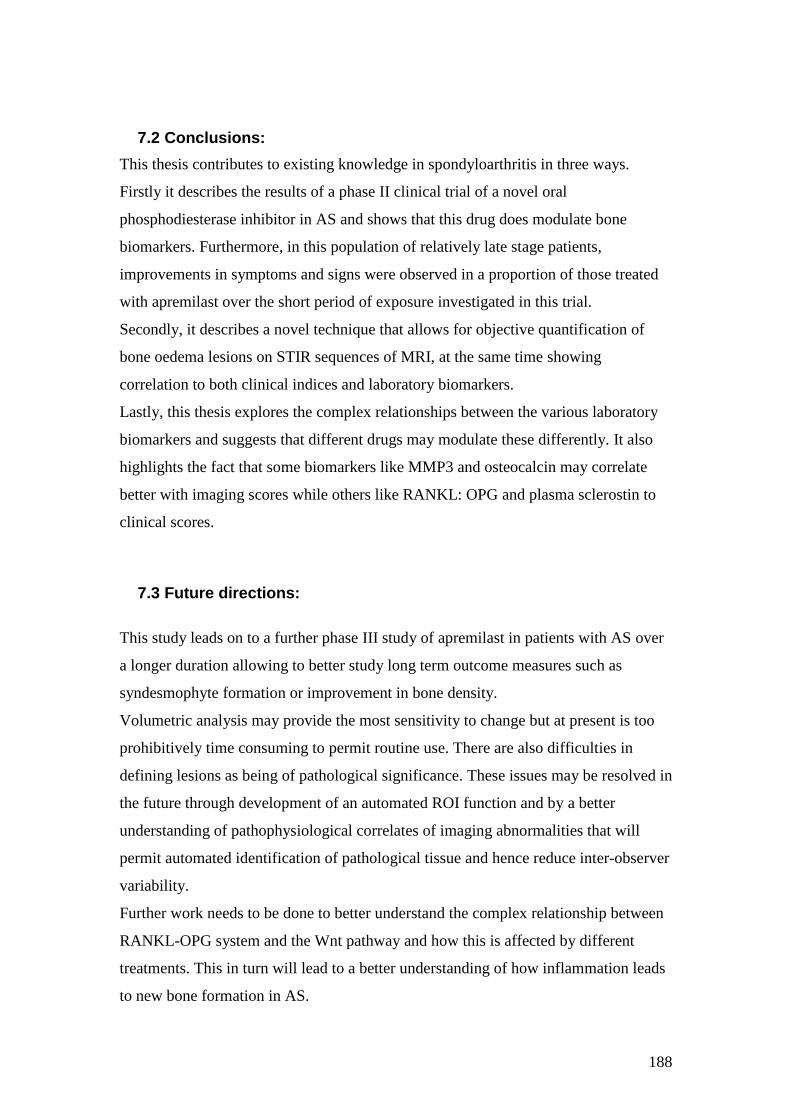
188
7.2 Conclusions:
This thesis contributes to existing knowledge in spondyloarthritis in three ways.
Firstly it describes the results of a phase II clinical trial of a novel oral
phosphodiesterase inhibitor in AS and shows that this drug does modulate bone
biomarkers. Furthermore, in this population of relatively late stage patients,
improvements in symptoms and signs were observed in a proportion of those treated
with apremilast over the short period of exposure investigated in this trial.
Secondly, it describes a novel technique that allows for objective quantification of
bone oedema lesions on STIR sequences of MRI, at the same time showing
correlation to both clinical indices and laboratory biomarkers.
Lastly, this thesis explores the complex relationships between the various laboratory
biomarkers and suggests that different drugs may modulate these differently. It also
highlights the fact that some biomarkers like MMP3 and osteocalcin may correlate
better with imaging scores while others like RANKL: OPG and plasma sclerostin to
clinical scores.
7.3 Future directions:
This study leads on to a further phase III study of apremilast in patients with AS over
a longer duration allowing to better study long term outcome measures such as
syndesmophyte formation or improvement in bone density.
Volumetric analysis may provide the most sensitivity to change but at present is too
prohibitively time consuming to permit routine use. There are also difficulties in
defining lesions as being of pathological significance. These issues may be resolved in
the future through development of an automated ROI function and by a better
understanding of pathophysiological correlates of imaging abnormalities that will
permit automated identification of pathological tissue and hence reduce inter-observer
variability.
Further work needs to be done to better understand the complex relationship between
RANKL-OPG system and the Wnt pathway and how this is affected by different
treatments. This in turn will lead to a better understanding of how inflammation leads
to new bone formation in AS.

189
8. References
190
References
1. van der Linden, S., H.A. Valkenburg, and A. Cats, Evaluation of diagnostic
criteria for ankylosing spondylitis. A proposal for modification of the New
York criteria. Arthritis Rheum, 1984. 27(4): p. 361-8.
2. Feldtkeller, E., et al., Age at disease onset and diagnosis delay in HLA-B27
negative vs. positive patients with ankylosing spondylitis. Rheumatol Int,
2003. 23(2): p. 61-6.
3. Rudwaleit, M., et al., The development of Assessment of SpondyloArthritis
international Society classification criteria for axial spondyloarthritis (part
II): validation and final selection. Ann Rheum Dis, 2009. 68(6): p. 777-83.
4. Brown, M.A., et al., Susceptibility to ankylosing spondylitis in twins: the role
of genes, HLA, and the environment. Arthritis Rheum, 1997. 40(10): p. 1823-
8.
5. Burton, P.R., et al., Association scan of 14,500 nonsynonymous SNPs in four
diseases identifies autoimmunity variants. Nat Genet, 2007. 39(11): p. 1329-
37.
6. Tsui, F.W., et al., Association of an ERAP1 ERAP2 haplotype with familial
ankylosing spondylitis. Ann Rheum Dis, 2010. 69(4): p. 733-6.
7. Maksymowych, W.P., et al., Association of a specific ERAP1/ARTS1
haplotype with disease susceptibility in ankylosing spondylitis. Arthritis
Rheum, 2009. 60(5): p. 1317-23.
8. Turner, M.J., et al., HLA-B27 up-regulation causes accumulation of misfolded
heavy chains and correlates with the magnitude of the unfolded protein
response in transgenic rats: Implications for the pathogenesis of
spondylarthritis-like disease. Arthritis Rheum, 2007. 56(1): p. 215-23.
9. Layh-Schmitt, G. and R.A. Colbert, The interleukin-23/interleukin-17 axis in
spondyloarthritis. Curr Opin Rheumatol, 2008. 20(4): p. 392-7.
10. Kollnberger, S., et al., Cell-surface expression and immune receptor
recognition of HLA-B27 homodimers. Arthritis Rheum, 2002. 46(11): p. 2972-
82.
11. Neidhart, M., et al., Expression of cathepsin K and matrix metalloproteinase 1
indicate persistent osteodestructive activity in long-standing ankylosing
spondylitis. Ann Rheum Dis, 2009. 68(8): p. 1334-9.
12. Winkler, D.G., et al., Noggin and sclerostin bone morphogenetic protein
antagonists form a mutually inhibitory complex. J Biol Chem, 2004. 279(35):
p. 36293-8.
13. van Bezooijen, R.L., et al., Sclerostin is an osteocyte-expressed negative
regulator of bone formation, but not a classical BMP antagonist. J Exp Med,
2004. 199(6): p. 805-14.
14. Schett, G., J. Zwerina, and J.P. David, The role of Wnt proteins in arthritis.
Nat Clin Pract Rheumatol, 2008. 4(9): p. 473-80.
15. Diarra, D., et al., Dickkopf-1 is a master regulator of joint remodeling. Nat
Med, 2007. 13(2): p. 156-63.
16. Tam, L.S., J. Gu, and D. Yu, Pathogenesis of ankylosing spondylitis. Nat Rev
Rheumatol. 6(7): p. 399-405.
17. Khan, M.A., Ankylosing spondylitis--the history of medical therapies. Clin
Exp Rheumatol, 2002. 20(6 Suppl 28): p. S3-5.
191
18. Wanders, A., et al., Nonsteroidal antiinflammatory drugs reduce radiographic
progression in patients with ankylosing spondylitis: a randomized clinical
trial. Arthritis Rheum, 2005. 52(6): p. 1756-65.
19. Poddubnyy, D., et al., Effect of non-steroidal anti-inflammatory drugs on
radiographic spinal progression in patients with axial spondyloarthritis:
results from the German Spondyloarthritis Inception Cohort. Ann Rheum Dis,
2012. 71(10): p. 1616-22.
20. Braun, J., et al., Efficacy of sulfasalazine in patients with inflammatory back
pain due to undifferentiated spondyloarthritis and early ankylosing
spondylitis: a multicentre randomised controlled trial. Ann Rheum Dis, 2006.
65(9): p. 1147-53.
21. Haibel, H., et al., No efficacy of subcutaneous methotrexate in active
ankylosing spondylitis: a 16-week open-label trial. Ann Rheum Dis, 2007.
66(3): p. 419-21.
22. Brandt, J., et al., Successful treatment of active ankylosing spondylitis with the
anti-tumor necrosis factor alpha monoclonal antibody infliximab. Arthritis
Rheum, 2000. 43(6): p. 1346-52.
23. Brandt, J., et al., Infliximab treatment of severe ankylosing spondylitis: one-
year followup. Arthritis Rheum, 2001. 44(12): p. 2936-7.
24. Brandt, J., et al., Six-month results of a double-blind, placebo-controlled trial
of etanercept treatment in patients with active ankylosing spondylitis. Arthritis
Rheum, 2003. 48(6): p. 1667-75.
25. Lie, E., et al., Effectiveness of switching between TNF inhibitors in ankylosing
spondylitis: data from the NOR-DMARD register. Ann Rheum Dis. 70(1): p.
157-63.
26. van der Heijde, D., et al., Radiographic findings following two years of
infliximab therapy in patients with ankylosing spondylitis. Arthritis Rheum,
2008. 58(10): p. 3063-70.
27. van der Heijde, D., et al., Radiographic progression of ankylosing spondylitis
after up to two years of treatment with etanercept. Arthritis Rheum, 2008.
58(5): p. 1324-31.
28. van der Heijde, D., et al., Assessment of radiographic progression in the
spines of patients with ankylosing spondylitis treated with adalimumab for up
to 2 years. Arthritis Res Ther, 2009. 11(4): p. R127.
29. Wendling, D., et al., Rituximab treatment for spondyloarthritis. A nationwide
series: data from the AIR registry of the French Society of Rheumatology. J
Rheumatol, 2012. 39(12): p. 2327-31.
30. Schoels, M.M., et al., Blocking the effects of interleukin-6 in rheumatoid
arthritis and other inflammatory rheumatic diseases: systematic literature
review and meta-analysis informing a consensus statement. Ann Rheum Dis,
2013. 72(4): p. 583-9.
31. Patel, D.D., et al., Effect of IL-17A blockade with secukinumab in autoimmune
diseases. Ann Rheum Dis, 2012.
32. Seldon, P.M., P.J. Barnes, and M.A. Giembycz, Interleukin-10 does not
mediate the inhibitory effect of PDE-4 inhibitors and other cAMP-elevating
drugs on lipopolysaccharide-induced tumors necrosis factor-alpha generation
from human peripheral blood monocytes. Cell Biochem Biophys, 1998. 29(1-
2): p. 179-201.
33. Liu, J., M. Chen, and X. Wang, Calcitonin gene-related peptide inhibits
lipopolysaccharide-induced interleukin-12 release from mouse peritoneal
192
macrophages, mediated by the cAMP pathway. Immunology, 2000. 101(1): p.
61-7.
34. Persson, E., et al., Increased expression of interleukin-6 by vasoactive
intestinal peptide is associated with regulation of CREB, AP-1 and C/EBP, but
not NF-kappaB, in mouse calvarial osteoblasts. Bone, 2005. 37(4): p. 513-29.
35. McCann, F.E., et al., Apremilast, a novel PDE4 inhibitor, inhibits spontaneous
production of tumour necrosis factor-alpha from human rheumatoid synovial
cells and ameliorates experimental arthritis. Arthritis Res Ther. 12(3): p.
R107.
36. Schafer, P.H., et al., Apremilast, a cAMP phosphodiesterase-4 inhibitor,
demonstrates anti-inflammatory activity in vitro and in a model of psoriasis.
Br J Pharmacol. 159(4): p. 842-55.
37. Gottlieb, A.B., et al., An open-label, single-arm pilot study in patients with
severe plaque-type psoriasis treated with an oral anti-inflammatory agent,
apremilast. Curr Med Res Opin, 2008. 24(5): p. 1529-38.
38. Schett G, W.J., Papp K, Joos R, De Vlam K, Rodrigues JF, Vessey A, Hu A,
Zhu W, Sloan VS., Apremilast is active in the treatment of Psoriatic Arthritis.
Arthritis Rheum, 2009.
39. Biomarkers and surrogate endpoints: preferred definitions and conceptual
framework. Clin Pharmacol Ther, 2001. 69(3): p. 89-95.
40. Ward, M.M., Outcomes in ankylosing spondylitis: what makes the assessment
of treatment effects in ankylosing spondylitis different? Ann Rheum Dis, 2006.
65 Suppl 3: p. iii25-8.
41. Garrett, S., et al., A new approach to defining disease status in ankylosing
spondylitis: the Bath Ankylosing Spondylitis Disease Activity Index. J
Rheumatol, 1994. 21(12): p. 2286-91.
42. Keat, A., et al., BSR guidelines for prescribing TNF-alpha blockers in adults
with ankylosing spondylitis. Report of a working party of the British Society
for Rheumatology. Rheumatology (Oxford), 2005. 44(7): p. 939-47.
43. Pavy, S., S. Brophy, and A. Calin, Establishment of the minimum clinically
important difference for the bath ankylosing spondylitis indices: a prospective
study. J Rheumatol, 2005. 32(1): p. 80-5.
44. Calin, A., et al., Defining disease activity in ankylosing spondylitis: is a
combination of variables (Bath Ankylosing Spondylitis Disease Activity Index)
an appropriate instrument? Rheumatology (Oxford), 1999. 38(9): p. 878-82.
45. Madsen, O.R., et al., Reproducibility of the Bath Ankylosing Spondylitis
Indices of disease activity (BASDAI), functional status (BASFI) and overall
well-being (BAS-G) in anti-tumour necrosis factor-treated
spondyloarthropathy patients. Clin Rheumatol. 29(8): p. 849-54.
46. Maksymowych WP, J.E., Spady B, Russell AS., The Bath Ankylosing
Spondylitis Disease Activity Index: Lack of discriminant ability between AS
and mechanical low back pain. (Abstract). European League Against
Rheumatism Scientific Meeting , 12-15 June, Lisbon, Portugal, 2003.
47. de Vlam K, B.A., BASDAI is unable to discriminate between inflammatory
low back pain and mechanical low back pain [Abstract]. Ann Rheum Dis,
2005. 64 (suppl III): p. 335.
48. Calin, A., et al., A new approach to defining functional ability in ankylosing
spondylitis: the development of the Bath Ankylosing Spondylitis Functional
Index. J Rheumatol, 1994. 21(12): p. 2281-5.
193
49. Spoorenberg, A., et al., Relative value of erythrocyte sedimentation rate and
C-reactive protein in assessment of disease activity in ankylosing spondylitis. J
Rheumatol, 1999. 26(4): p. 980-4.
50. Ward, M.M. and S. Kuzis, Validity and sensitivity to change of spondylitis-
specific measures of functional disability. J Rheumatol, 1999. 26(1): p. 121-7.
51. Daltroy, L.H., et al., A modification of the Health Assessment Questionnaire
for the spondyloarthropathies. J Rheumatol, 1990. 17(7): p. 946-50.
52. Abbott, C.A., P.S. Helliwell, and M.A. Chamberlain, Functional assessment in
ankylosing spondylitis: evaluation of a new self-administered questionnaire
and correlation with anthropometric variables. Br J Rheumatol, 1994. 33(11):
p. 1060-6.
53. Jones, S.D., et al., The Bath Ankylosing Spondylitis Patient Global Score
(BAS-G). Br J Rheumatol, 1996. 35(1): p. 66-71.
54. Jenkinson, T.R., et al., Defining spinal mobility in ankylosing spondylitis (AS).
The Bath AS Metrology Index. J Rheumatol, 1994. 21(9): p. 1694-8.
55. Jones, S.D., et al., A new scoring system for the Bath Ankylosing Spondylitis
Metrology Index (BASMI). J Rheumatol, 1995. 22(8): p. 1609.
56. van der Heijde, D., R. Landewe, and E. Feldtkeller, Proposal of a linear
definition of the Bath Ankylosing Spondylitis Metrology Index (BASMI) and
comparison with the 2-step and 10-step definitions. Ann Rheum Dis, 2008.
67(4): p. 489-93.
57. Madsen, O.R., et al., The Bath metrology index as assessed by a trained and
an untrained rater in patients with spondylarthropathy: a study of intra- and
inter-rater agreements. Clin Rheumatol, 2009. 28(1): p. 35-40.
58. Maksymowych, W.P., et al., Development and validation of the Edmonton
Ankylosing Spondylitis Metrology Index. Arthritis Rheum, 2006. 55(4): p. 575-
82.
59. Boonen, A. and W.P. Maksymowych, Measurement: function and mobility
(focussing on the ICF framework). Best Pract Res Clin Rheumatol. 24(5): p.
605-24.
60. Jones, S.D., et al., Fatigue in ankylosing spondylitis: its prevalence and
relationship to disease activity, sleep, and other factors. J Rheumatol, 1996.
23(3): p. 487-90.
61. Ward, M.M., Health-related quality of life in ankylosing spondylitis: a survey
of 175 patients. Arthritis Care Res, 1999. 12(4): p. 247-55.
62. van Tubergen, A., et al., Assessment of fatigue in patients with ankylosing
spondylitis: a psychometric analysis. Arthritis Rheum, 2002. 47(1): p. 8-16.
63. Davis, J.C., et al., Reductions in health-related quality of life in patients with
ankylosing spondylitis and improvements with etanercept therapy. Arthritis
Rheum, 2005. 53(4): p. 494-501.
64. Haibel, H., et al., [Measurement of quality of life in patients with active
ankylosing spondylitis being treated with infliximab-a comparison of SF-36
and SF-12]. Z Rheumatol, 2004. 63(5): p. 393-401.
65. Doward, L.C., et al., Development of the ASQoL: a quality of life instrument
specific to ankylosing spondylitis. Ann Rheum Dis, 2003. 62(1): p. 20-6.
66. Haywood, K.L., et al., Patient centered assessment of ankylosing spondylitis-
specific health related quality of life: evaluation of the Patient Generated
Index. J Rheumatol, 2003. 30(4): p. 764-73.

194
67. Haywood, K.L., et al., Evaluation of ankylosing spondylitis quality of life
(EASi-QoL): reliability and validity of a new patient-reported outcome
measure. J Rheumatol. 37(10): p. 2100-9.
68. Webster, K., D. Cella, and K. Yost, The Functional Assessment of Chronic
Illness Therapy (FACIT) Measurement System: properties, applications, and
interpretation. Health Qual Life Outcomes, 2003. 1: p. 79.
69. Anderson, J.J., et al., Ankylosing spondylitis assessment group preliminary
definition of short-term improvement in ankylosing spondylitis. Arthritis
Rheum, 2001. 44(8): p. 1876-86.
70. Brandt, J., et al., Development and preselection of criteria for short term
improvement after anti-TNF alpha treatment in ankylosing spondylitis. Ann
Rheum Dis, 2004. 63(11): p. 1438-44.
71. Lukas, C., et al., Development of an ASAS-endorsed disease activity score
(ASDAS) in patients with ankylosing spondylitis. Ann Rheum Dis, 2009.
68(1): p. 18-24.
72. Pedersen, S.J., et al., Responsiveness of the Ankylosing Spondylitis Disease
Activity Score (ASDAS) and clinical and MRI measures of disease activity in a
1-year follow-up study of patients with axial spondyloarthritis treated with
tumour necrosis factor alpha inhibitors. Ann Rheum Dis. 69(6): p. 1065-71.
73. Machado, P., et al., Ankylosing Spondylitis Disease Activity Score (ASDAS):
defining cut-off values for disease activity states and improvement scores. Ann
Rheum Dis. 70(1): p. 47-53.
74. Mau, W., et al., Clinical features and prognosis of patients with possible
ankylosing spondylitis. Results of a 10-year followup. J Rheumatol, 1988.
15(7): p. 1109-14.
75. MacKay, K., et al., The Bath Ankylosing Spondylitis Radiology Index (BASRI):
a new, validated approach to disease assessment. Arthritis Rheum, 1998.
41(12): p. 2263-70.
76. Jang, J.H., et al., Ankylosing spondylitis: patterns of radiographic
involvement--a re-examination of accepted principles in a cohort of 769
patients. Radiology. 258(1): p. 192-8.
77. Averns, H.L., et al., Radiological outcome in ankylosing spondylitis: use of the
Stoke Ankylosing Spondylitis Spine Score (SASSS). Br J Rheumatol, 1996.
35(4): p. 373-6.
78. Creemers, M.C., et al., Assessment of outcome in ankylosing spondylitis: an
extended radiographic scoring system. Ann Rheum Dis, 2005. 64(1): p. 127-9.
79. Wanders, A.J., et al., What is the most appropriate radiologic scoring method
for ankylosing spondylitis? A comparison of the available methods based on
the Outcome Measures in Rheumatology Clinical Trials filter. Arthritis
Rheum, 2004. 50(8): p. 2622-32.
80. Baraliakos, X., et al., Radiographic progression in patients with ankylosing
spondylitis after 4 yrs of treatment with the anti-TNF-alpha antibody
infliximab. Rheumatology (Oxford), 2007. 46(9): p. 1450-3.
81. Braun, J., et al., Analysing chronic spinal changes in ankylosing spondylitis: a
systematic comparison of conventional x rays with magnetic resonance
imaging using established and new scoring systems. Ann Rheum Dis, 2004.
63(9): p. 1046-55.
82. Hermann, K.G., et al., Magnetic resonance imaging of inflammatory lesions in
the spine in ankylosing spondylitis clinical trials: is paramagnetic contrast
medium necessary? J Rheumatol, 2005. 32(10): p. 2056-60.
195
83. Bennett, A.N., et al., Evaluation of the diagnostic utility of spinal magnetic
resonance imaging in axial spondylarthritis. Arthritis Rheum, 2009. 60(5): p.
1331-41.
84. Bennett, A.N., et al., The fatty Romanus lesion: a non-inflammatory spinal
MRI lesion specific for axial spondyloarthropathy. Ann Rheum Dis. 69(5): p.
891-4.
85. Maksymowych, W.P., et al., Systematic assessment of inflammation by
magnetic resonance imaging in the posterior elements of the spine in
ankylosing spondylitis. Arthritis Care Res (Hoboken). 62(1): p. 4-10.
86. Bochkova, A.G., et al., Spinal inflammation lesions as detected by magnetic
resonance imaging in patients with early ankylosing spondylitis are more
often observed in posterior structures of the spine. Rheumatology (Oxford).
49(4): p. 749-55.
87. Rennie, W.J., et al., Magnetic resonance imaging assessment of spinal
inflammation in ankylosing spondylitis: standard clinical protocols may omit
inflammatory lesions in thoracic vertebrae. Arthritis Rheum, 2009. 61(9): p.
1187-93.
88. Rudwaleit, M., et al., Defining active sacroiliitis on magnetic resonance
imaging (MRI) for classification of axial spondyloarthritis: a consensual
approach by the ASAS/OMERACT MRI group. Ann Rheum Dis, 2009. 68(10):
p. 1520-7.
89. Puhakka, K.B., et al., Magnetic resonance imaging of sacroiliitis in early
seronegative spondylarthropathy. Abnormalities correlated to clinical and
laboratory findings. Rheumatology (Oxford), 2004. 43(2): p. 234-7.
90. Braun, J., et al., Magnetic resonance imaging examinations of the spine in
patients with ankylosing spondylitis, before and after successful therapy with
infliximab: evaluation of a new scoring system. Arthritis Rheum, 2003. 48(4):
p. 1126-36.
91. Landewe, R.B., et al., Scoring sacroiliac joints by magnetic resonance
imaging. A multiple-reader reliability experiment. J Rheumatol, 2005. 32(10):
p. 2050-5.
92. Marzo-Ortega, H., et al., Efficacy of etanercept in the treatment of the
entheseal pathology in resistant spondylarthropathy: a clinical and magnetic
resonance imaging study. Arthritis Rheum, 2001. 44(9): p. 2112-7.
93. Haibel, H., et al., Adalimumab reduces spinal symptoms in active ankylosing
spondylitis: clinical and magnetic resonance imaging results of a fifty-two-
week open-label trial. Arthritis Rheum, 2006. 54(2): p. 678-81.
94. Maksymowych, W.P., et al., Spondyloarthritis Research Consortium of
Canada magnetic resonance imaging index for assessment of spinal
inflammation in ankylosing spondylitis. Arthritis Rheum, 2005. 53(4): p. 502-
9.
95. Madsen, K.B. and A.G. Jurik, MRI grading method for active and chronic
spinal changes in spondyloarthritis. Clin Radiol. 65(1): p. 6-14.
96. Hermann, K.G., et al., [Magnetic resonance tomography of sacroiliitis:
anatomy, histological pathology, MR-morphology, and grading]. Radiologe,
2004. 44(3): p. 217-28.
97. Lukas, C., et al., Scoring inflammatory activity of the spine by magnetic
resonance imaging in ankylosing spondylitis: a multireader experiment. J
Rheumatol, 2007. 34(4): p. 862-70.
196
98. Braun, J., et al., Major reduction in spinal inflammation in patients with
ankylosing spondylitis after treatment with infliximab: results of a multicenter,
randomized, double-blind, placebo-controlled magnetic resonance imaging
study. Arthritis Rheum, 2006. 54(5): p. 1646-52.
99. Sieper, J., et al., Persistent reduction of spinal inflammation as assessed by
magnetic resonance imaging in patients with ankylosing spondylitis after 2 yrs
of treatment with the anti-tumour necrosis factor agent infliximab.
Rheumatology (Oxford), 2005. 44(12): p. 1525-30.
100. Rudwaleit, M., et al., MRI in predicting a major clinical response to anti-
tumour necrosis factor treatment in ankylosing spondylitis. Ann Rheum Dis,
2008. 67(9): p. 1276-81.
101. Baraliakos, X., et al., The relationship between inflammation and new bone
formation in patients with ankylosing spondylitis. Arthritis Res Ther, 2008.
10(5): p. R104.
102. Maksymowych, W.P., et al., Inflammatory lesions of the spine on magnetic
resonance imaging predict the development of new syndesmophytes in
ankylosing spondylitis: evidence of a relationship between inflammation and
new bone formation. Arthritis Rheum, 2009. 60(1): p. 93-102.
103. van der Heijde, D., et al., MRI inflammation at the vertebral unit only
marginally predicts new syndesmophyte formation: a multilevel analysis in
patients with ankylosing spondylitis. Ann Rheum Dis, 2012. 71(3): p. 369-73.
104. Chiowchanwisawakit, P., et al., Focal fat lesions at vertebral corners on
magnetic resonance imaging predict the development of new syndesmophytes
in ankylosing spondylitis. Arthritis Rheum, 2011. 63(8): p. 2215-25.
105. Pedersen, S.J., et al., Resolution of inflammation following treatment of
ankylosing spondylitis is associated with new bone formation. J Rheumatol,
2011. 38(7): p. 1349-54.
106. Lehtinen, A., M. Taavitsainen, and M. Leirisalo-Repo, Sonographic analysis
of enthesopathy in the lower extremities of patients with spondylarthropathy.
Clin Exp Rheumatol, 1994. 12(2): p. 143-8.
107. Balint, P.V., et al., Ultrasonography of entheseal insertions in the lower limb
in spondyloarthropathy. Ann Rheum Dis, 2002. 61(10): p. 905-10.
108. D'Agostino, M.A., et al., Assessment of peripheral enthesitis in the
spondylarthropathies by ultrasonography combined with power Doppler: a
cross-sectional study. Arthritis Rheum, 2003. 48(2): p. 523-33.
109. Balint, P.V., P. Mandl, and D. Kane, "All that glistens is not gold"--separating
artefacts from true Doppler signals in rheumatological ultrasound. Ann
Rheum Dis, 2008. 67(2): p. 141-2.
110. Alcalde, M., et al., A sonographic enthesitic index of lower limbs is a valuable
tool in the assessment of ankylosing spondylitis. Ann Rheum Dis, 2007. 66(8):
p. 1015-9.
111. de Miguel, E., et al., Validity of enthesis ultrasound assessment in
spondyloarthropathy. Ann Rheum Dis, 2009. 68(2): p. 169-74.
112. Filippucci, E., et al., Reliability of high-resolution ultrasonography in the
assessment of Achilles tendon enthesopathy in seronegative
spondyloarthropathies. Ann Rheum Dis, 2009. 68(12): p. 1850-5.
113. Aydin, S.Z., et al., Monitoring Achilles enthesitis in ankylosing spondylitis
during TNF-alpha antagonist therapy: an ultrasound study. Rheumatology
(Oxford). 49(3): p. 578-82.
197
114. Klauser, A., et al., Inflammatory low back pain: high negative predictive value
of contrast-enhanced color Doppler ultrasound in the detection of inflamed
sacroiliac joints. Arthritis Rheum, 2005. 53(3): p. 440-4.
115. Klauser, A.S., et al., Feasibility of second-generation ultrasound contrast
media in the detection of active sacroiliitis. Arthritis Rheum, 2009. 61(7): p.
909-16.
116. Arslan, H., et al., Duplex and color Doppler sonographic findings in active
sacroiliitis. AJR Am J Roentgenol, 1999. 173(3): p. 677-80.
117. Unlu, E., O.N. Pamuk, and N. Cakir, Color and duplex Doppler sonography to
detect sacroiliitis and spinal inflammation in ankylosing spondylitis. Can this
method reveal response to anti-tumor necrosis factor therapy? J Rheumatol,
2007. 34(1): p. 110-6.
118. Castillo-Gallego C, d.M.M.E., Garcia-Arias M et al, Validity of Colour
Doppler and Spectral Doppler ultrasound of sacroiliac joints against physical
examination as gold standard. Rheumatology (Oxford), 2011. 50(Suppl 3): p.
iii137- iii145.
119. Jung, S.Y., et al., Serum amyloid a as a useful indicator of disease activity in
patients with ankylosing spondylitis. Yonsei Med J, 2007. 48(2): p. 218-24.
120. de Vries, M.K., et al., Erythrocyte sedimentation rate, C-reactive protein level,
and serum amyloid a protein for patient selection and monitoring of anti-
tumor necrosis factor treatment in ankylosing spondylitis. Arthritis Rheum,
2009. 61(11): p. 1484-90.
121. Benhamou, M., L. Gossec, and M. Dougados, Clinical relevance of C-reactive
protein in ankylosing spondylitis and evaluation of the NSAIDs/coxibs'
treatment effect on C-reactive protein. Rheumatology (Oxford). 49(3): p. 536-
41.
122. Poddubnyy, D.A., et al., Comparison of a high sensitivity and standard C
reactive protein measurement in patients with ankylosing spondylitis and non-
radiographic axial spondyloarthritis. Ann Rheum Dis. 69(7): p. 1338-41.
123. Bollow, M., et al., Quantitative analyses of sacroiliac biopsies in
spondyloarthropathies: T cells and macrophages predominate in early and
active sacroiliitis- cellularity correlates with the degree of enhancement
detected by magnetic resonance imaging. Ann Rheum Dis, 2000. 59(2): p.
135-40.
124. Appel, H., et al., Immunohistochemical analysis of hip arthritis in ankylosing
spondylitis: evaluation of the bone-cartilage interface and subchondral bone
marrow. Arthritis Rheum, 2006. 54(6): p. 1805-13.
125. Schirmer, M., et al., Circulating cytotoxic CD8(+) CD28(-) T cells in
ankylosing spondylitis. Arthritis Res, 2002. 4(1): p. 71-6.
126. Boyle, L.H., et al., The recognition of HLA-B27 by human CD4(+) T
lymphocytes. J Immunol, 2001. 167(5): p. 2619-24.
127. Duftner, C., et al., Prevalence, clinical relevance and characterization of
circulating cytotoxic CD4+CD28- T cells in ankylosing spondylitis. Arthritis
Res Ther, 2003. 5(5): p. R292-300.
128. Dejaco, C., et al., Altered T-cell subtypes in spondyloarthritis, rheumatoid
arthritis and polymyalgia rheumatica. Rheumatol Int. 30(3): p. 297-303.
129. Jandus, C., et al., Increased numbers of circulating polyfunctional Th17
memory cells in patients with seronegative spondylarthritides. Arthritis
Rheum, 2008. 58(8): p. 2307-17.

198
130. Keller, C., A. Webb, and J. Davis, Cytokines in the seronegative
spondyloarthropathies and their modification by TNF blockade: a brief report
and literature review. Ann Rheum Dis, 2003. 62(12): p. 1128-32.
131. Visvanathan, S., et al., Effects of infliximab on markers of inflammation and
bone turnover and associations with bone mineral density in patients with
ankylosing spondylitis. Ann Rheum Dis, 2009. 68(2): p. 175-82.
132. Romero-Sanchez, C., et al., Identification of acute phase reactants and
cytokines useful for monitoring infliximab therapy in ankylosing spondylitis.
Clin Rheumatol, 2008. 27(11): p. 1429-35.
133. Drouart, M., et al., High serum vascular endothelial growth factor correlates
with disease activity of spondylarthropathies. Clin Exp Immunol, 2003.
132(1): p. 158-62.
134. Baeten, D., et al., Impaired Th1 cytokine production in spondyloarthropathy is
restored by anti-TNFalpha. Ann Rheum Dis, 2001. 60(8): p. 750-5.
135. Zou, J., et al., Down-regulation of the nonspecific and antigen-specific T cell
cytokine response in ankylosing spondylitis during treatment with infliximab.
Arthritis Rheum, 2003. 48(3): p. 780-90.
136. Zou, J., et al., Up regulation of the production of tumour necrosis factor alpha
and interferon gamma by T cells in ankylosing spondylitis during treatment
with etanercept. Ann Rheum Dis, 2003. 62(6): p. 561-4.
137. Zou, J.X., J. Braun, and J. Sieper, Immunological basis for the use of
TNFalpha-blocking agents in ankylosing spondylitis and immunological
changes during treatment. Clin Exp Rheumatol, 2002. 20(6 Suppl 28): p. S34-
7.
138. Shen, H., J.C. Goodall, and J.S. Hill Gaston, Frequency and phenotype of
peripheral blood Th17 cells in ankylosing spondylitis and rheumatoid
arthritis. Arthritis Rheum, 2009. 60(6): p. 1647-56.
139. Melis, L., et al., Systemic levels of IL-23 are strongly associated with disease
activity in rheumatoid arthritis but not spondyloarthritis. Ann Rheum Dis,
2010. 69(3): p. 618-23.
140. Wendling, D., IL-23 and IL-17 in ankylosing spondylitis. Rheumatol Int.
30(11): p. 1547.
141. Duftner, C., et al., Preferential type 1 chemokine receptors and cytokine
production of CD28- T cells in ankylosing spondylitis. Ann Rheum Dis, 2006.
65(5): p. 647-53.
142. Gengenbacher, M., et al., Infliximab inhibits bone resorption by circulating
osteoclast precursor cells in patients with rheumatoid arthritis and ankylosing
spondylitis. Ann Rheum Dis, 2008. 67(5): p. 620-4.
143. Crotti, T.N., et al., Receptor activator NF-kappaB ligand (RANKL) expression
in synovial tissue from patients with rheumatoid arthritis,
spondyloarthropathy, osteoarthritis, and from normal patients:
semiquantitative and quantitative analysis. Ann Rheum Dis, 2002. 61(12): p.
1047-54.
144. Haynes, D.R., et al., Osteoprotegerin expression in synovial tissue from
patients with rheumatoid arthritis, spondyloarthropathies and osteoarthritis
and normal controls. Rheumatology (Oxford), 2003. 42(1): p. 123-34.
145. Kim, H.R., S.H. Lee, and H.Y. Kim, Elevated serum levels of soluble receptor
activator of nuclear factors-kappaB ligand (sRANKL) and reduced bone
mineral density in patients with ankylosing spondylitis (AS). Rheumatology
(Oxford), 2006. 45(10): p. 1197-200.
199
146. Toussirot, E., et al., Increased tartrate-resistant acid phosphatase serum levels
in ankylosing spondylitis and relationship with the inflammatory process. Ann
Rheum Dis, 2008. 67(3): p. 430-1.
147. Maksymowych, W.P., et al., Serum matrix metalloproteinase 3 is an
independent predictor of structural damage progression in patients with
ankylosing spondylitis. Arthritis Rheum, 2007. 56(6): p. 1846-53.
148. Wendling, D., J.P. Cedoz, and E. Racadot, Serum levels of MMP-3 and
cathepsin K in patients with ankylosing spondylitis: effect of TNFalpha
antagonist therapy. Joint Bone Spine, 2008. 75(5): p. 559-62.
149. Kim, T.H., et al., Cartilage biomarkers in ankylosing spondylitis: relationship
to clinical variables and treatment response. Arthritis Rheum, 2005. 52(3): p.
885-91.
150. Vosse, D., et al., Association of markers of bone- and cartilage-degradation
with radiological changes at baseline and after 2 years follow-up in patients
with ankylosing spondylitis. Rheumatology (Oxford), 2008. 47(8): p. 1219-22.
151. Park, M.C., et al., Bone and cartilage turnover markers, bone mineral density,
and radiographic damage in men with ankylosing spondylitis. Yonsei Med J,
2008. 49(2): p. 288-94.
152. Appel, H., et al., Altered skeletal expression of sclerostin and its link to
radiographic progression in ankylosing spondylitis. Arthritis Rheum, 2009.
60(11): p. 3257-62.
153. Appel, H., et al., Serum levels of biomarkers of bone and cartilage destruction
and new bone formation in different cohorts of patients with axial
spondyloarthritis with and without tumor necrosis factor-alpha blocker
treatment. Arthritis Res Ther, 2008. 10(5): p. R125.
154. Woo, J.H., et al., Changes of clinical response and bone biochemical markers
in patients with ankylosing spondylitis taking etanercept. J Rheumatol, 2007.
34(8): p. 1753-9.
155. Schett, G., et al., Oral apremilast in the treatment of active psoriatic arthritis:
Results of a multicenter, randomized, double-blind, placebo-controlled study.
Arthritis Rheum, 2012.
156. Kiltz, U., et al., Do patients with non-radiographic axial spondylarthritis
differ from patients with ankylosing spondylitis? Arthritis Care Res
(Hoboken), 2012. 64(9): p. 1415-22.
157. Machado, P., et al., MRI inflammation and its relation with measures of
clinical disease activity and different treatment responses in patients with
ankylosing spondylitis treated with a tumour necrosis factor inhibitor. Ann
Rheum Dis, 2012. 71(12): p. 2002-5.
158. Sherlock, J.P., et al., IL-23 induces spondyloarthropathy by acting on ROR-
gammat+ CD3+CD4-CD8- entheseal resident T cells. Nat Med, 2012. 18(7):
p. 1069-76.
159. Parry, G.C. and N. Mackman, Role of cyclic AMP response element-binding
protein in cyclic AMP inhibition of NF-kappaB-mediated transcription. J
Immunol, 1997. 159(11): p. 5450-6.
160. Charles, P., et al., Regulation of cytokines, cytokine inhibitors, and acute-
phase proteins following anti-TNF-alpha therapy in rheumatoid arthritis. J
Immunol, 1999. 163(3): p. 1521-8.
161. Bland, J.M. and D.G. Altman, Statistical methods for assessing agreement
between two methods of clinical measurement. Lancet, 1986. 1(8476): p. 307-
10.

200
162. Jones, G.T., Morton L.E, Macfarlane, G.J., Bath Ankylosing Spondylitis
Functional Index (BASFI) is a better indicator of a poor quality of life than
Bath Ankylosing Spondylitis Disease Activity Index (BASDAI) in Ankylosing
Spondylitis: Results from SIRAS- the Scotland and Ireland registry for
Ankylosing Spondylitis. Arthritis & Rheumatism, 2012. 64(10 (Supplement)):
p. S261.
163. Pedersen, S.J., et al., ASDAS, BASDAI and different treatment responses and
their relation to biomarkers of inflammation, cartilage and bone turnover in
patients with axial spondyloarthritis treated with TNFalpha inhibitors. Ann
Rheum Dis, 2011. 70(8): p. 1375-81.
164. Chen, C.H., et al., Serum matrix metalloproteinases and tissue inhibitors of
metalloproteinases in ankylosing spondylitis: MMP-3 is a reproducibly
sensitive and specific biomarker of disease activity. Rheumatology (Oxford),
2006. 45(4): p. 414-20.
165. Mattey, D.L., et al., Association of cytokine and matrix metalloproteinase
profiles with disease activity and function in ankylosing spondylitis. Arthritis
Res Ther, 2012. 14(3): p. R127.
166. Taylan, A., et al., Biomarkers and cytokines of bone turnover: extensive
evaluation in a cohort of patients with ankylosing spondylitis. BMC
Musculoskelet Disord, 2012. 13: p. 191.
167. Baraliakos X, L.R., van der Heijde et al., The relationship of biomarkers and
radiographic progression in patients with ankylosing spondylitis treated with
infliximab. European Musculoskeletal review 2011. 6(2): p. 94-95.
168. Vincent, C., et al., Pro-inflammatory cytokines TNF-related weak inducer of
apoptosis (TWEAK) and TNFalpha induce the mitogen-activated protein
kinase (MAPK)-dependent expression of sclerostin in human osteoblasts. J
Bone Miner Res, 2009. 24(8): p. 1434-49.
169. Heiland, G.R., et al., High level of functional dickkopf-1 predicts protection
from syndesmophyte formation in patients with ankylosing spondylitis. Ann
Rheum Dis, 2012. 71(4): p. 572-4.
170. Daoussis, D., et al., Evidence that Dkk-1 is dysfunctional in ankylosing
spondylitis. Arthritis Rheum, 2010. 62(1): p. 150-8.
171. Wagner, C., et al., Serum markers associated with clinical improvement in
patients with ankylosing spondylitis treated with golimumab. Ann Rheum Dis,
2012. 71(5): p. 674-80.
172. Sari, I., et al., Assessment of soluble cell adhesion molecules and soluble
CD40 ligand levels in ankylosing spondylitis. Joint Bone Spine, 2010. 77(1):
p. 85-7.
173. Wendling, D., J.P. Cedoz, and E. Racadot, Serum and synovial fluid levels of
p40 IL12/23 in spondyloarthropathy patients. Clin Rheumatol, 2009. 28(2): p.
187-90.

201
9. Appendices

202
Appendix 1 Bath Ankylosing Spondylitis Disease Activity Index (BASDAI)
Please place a mark on each line below to indicate your answer to each question, relating to the
past week.
1. How would you describe the overall level of fatigue/tiredness you have experienced?
NONE VERY SEVERE
0 10
2. How would you describe the overall level of AS neck, back or hip pain you have had?
NONE VERY SEVERE
0 10
3. How would you describe the overall level of pain/swelling in joints other than neck,
back or hips you have had?
NONE VERY SEVERE
0 10
4. How would you describe the overall level of discomfort you have had from any areas
tender to touch or pressure?
NONE VERY SEVERE
0 10
5. How would you describe the overall level of morning stiffness you have had from the
time you wake up?
NONE VERY SEVERE
0 10
6. How long does your morning stiffness last from the time you wake up?
0hrs ½ hr 1hr 1 ½ hr 2 or more hours
Source: Calin A, Nakache JP, Gueguen A, Zeidler H, Mielants H, Dougados M. Defining disease activity in ankylosing
spondylitis: is a combination of variables (Bath Ankylosing Spondylitis Disease Activity Index) an appropriate
instrument? Rheumatology; 1999; 38:878-882.

203
Appendix 2 Bath Ankylosing Spondylitis Functional Index (BASFI)
Please draw a mark on each line below to indicate your level of ability with each of the following
activities, during the last week.
Note: An aid is apiece of equipment which helps you to perform an action or movement.
1. Putting on your socks or tights without help or aids (eg sock aids)
EASY IMPOSSIBLE
0 10
2. Bending forward from the waist to pick up a pen from the floor without an aid
EASY IMPOSSIBLE
0 10
3. Reaching up to a high shelf without help or aids (eg helping hand)
EASY IMPOSSIBLE
0 10
4. Getting up out of an armless dining room chair without using your hands or any other
help
EASY IMPOSSIBLE
0 10
5. Getting up off the floor without help from lying on your back
EASY IMPOSSIBLE

204
0 10
6. Standing unsupported for 10 minutes without discomfort
EASY IMPOSSIBLE
0 10
7. Climbing 12-1 5 steps without using a handrail or walking aid (one foot each step)
EASY IMPOSSIBLE
0 10
8. Looking over your shoulder without turning your body
EASY IMPOSSIBLE
0 10
9. Doing physically demanding activities (eg, physiotherapy exercises, gardening, or sports)
EASY IMPOSSIBLE
0 10
10. Doing a full days activities whether it be at home or at work
EASY IMPOSSIBLE
0 10
Source: Calin A, Garrett S, Whitelock H, Kennedy LG, O'Hea J, Mallorie P, Jenkinson T. A New Approach to Defining
Functional Ability on Ankylosing Spondylitis: The Development of the Bath Ankylosing Spondylitis Functional Index. J
Rheumatol. 1994; 21:2281-2285.

205
Appendix 3 Bath Ankylosing Spondylitis Patient Global Score (BAS-G)
1. Please place a vertical mark on the scale below to indicate the effect your disease has had
on your well-being over the last week.
NONE VERY SEVERE
0 10
1
Source: Jones SD, Steiner A, Garrett SL, Calin A. The Bath Ankylosing Spondylitis Patient Global Score (BAS-G). Br J
Rheumatol. 1996; 35:66-71.

206
Appendix 4: Bath Ankylosing Spondylitis Metrology Index (BASMI2)
Score
0 1 2
Tragus to wall < 15 cm 15-30 cm > 30 cm
Lumbar flexion > 4 cm 2-4 cm < 2 cm
Cervical rotation > 70º 20-70º < 20º
Lumbar side flexion > 10 cm 5-10 cm < 5 cm
Intermalleolar distance > 100 cm 70-100 cm < 70 cm
0 = mild disease improvement
1 = moderate disease improvement
2 = severe disease improvement
Results for cervical rotation and lumbar side flexion are the means of the left and right
measurements.
Score range 0-10.
Source: Jenkinson TR, Mallorie PA, Whitelock HC, Kennedy LG, Garrett SL, Calin A. Defining
Spinal Mobility in Ankylosing Spondylitis (AS): The Bath AS Metrology Index. J Rheumatol
1994; 2 1:1694-1698.
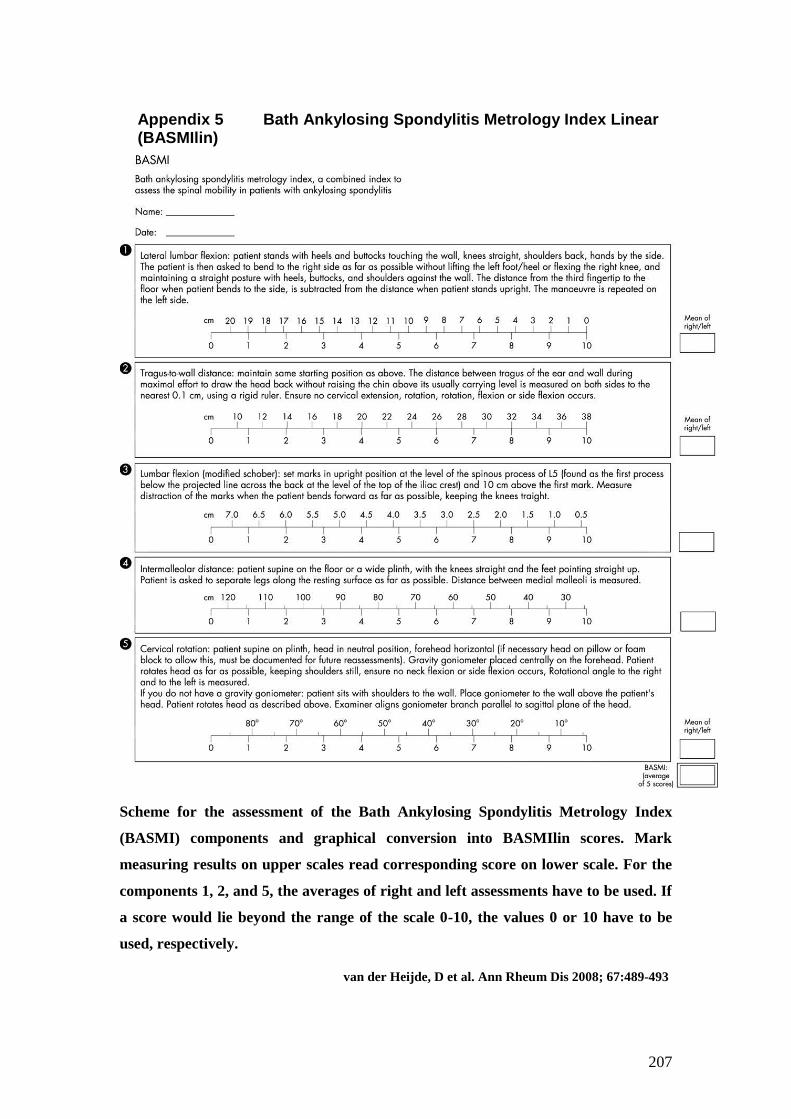
207
Appendix 5 Bath Ankylosing Spondylitis Metrology Index Linear (BASMIlin)
Scheme for the assessment of the Bath Ankylosing Spondylitis Metrology Index
(BASMI) components and graphical conversion into BASMIlin scores. Mark
measuring results on upper scales read corresponding score on lower scale. For the
components 1, 2, and 5, the averages of right and left assessments have to be used. If
a score would lie beyond the range of the scale 0-10, the values 0 or 10 have to be
used, respectively.
van der Heijde, D et al. Ann Rheum Dis 2008; 67:489-493

208
Appendix 6 FACIT-F
By circling one (1) number per line, please indicate how true each statement has
been for you during the past 7 days.
ADDITIONAL CONCERNS
Not
at all
A
little
bit
Some-
what
Quite
a bit
Very
much
I feel fatigued
……………………………….
0 1 2 3 4
I feel weak all over
…………………………
0 1 2 3 4
I feel listless (“washed out”)
………………..
0 1 2 3 4
I feel tired
…………………………………...
0 1 2 3 4
I have trouble starting things because I am
tired ….
0 1 2 3 4
I have trouble finishing things because I am
tired ...
0 1 2 3 4
I have energy ………………………………
0 1 2 3 4
I am able to do my usual activities
…………
0 1 2 3 4
I need to sleep during the day
………………
0 1 2 3 4

209
I am too tired to eat
……………………………
0 1 2 3 4
I need help doing my usual activities
………
0 1 2 3 4
I am frustrated by being too tired to do the
things I want to do
………………………….
0
1
2
3
4
I have to limit my social activity because I
am tired
0 1 2 3 4
EMOTIONAL WELL-BEING
Not
at all
A
little
bit
Some-
what
Quite
a bit
Very
much
I feel sad
…………………………………………
0 1 2 3 4
I am satisfied with how I am coping with my
illness
……………………………………………
0
1
2
3
4
I am losing hope in the fight against my
illness …..
0 1 2 3 4
I feel nervous
……………………………………
0 1 2 3 4
I worry about dying
……………………………
0 1 2 3 4
I worry that my condition will get worse 0 1 2 3 4

210
……
FUNCTIONAL WELL-BEING
Not
at all
A little
bit
Some-
what
Quite
a bit
Very
much
I am able to work (including work at
home)…
0 1 2 3 4
My work (including work at home) is
fulfilling
0 1 2 3 4
I am able to enjoy life
…………………………
0 1 2 3 4
I have accepted my illness
……………………
0 1 2 3 4
I am sleeping well
……………………………
0 1 2 3 4
I am enjoying the things I usually do for
fun
0 1 2 3 4
I am content with the quality of my life
right now...
0 1 2 3 4
PHYSICAL WELL-BEING Not
at all
A
little
bit
Some-
what
Quite
a bit
Very
much
I have a lack of energy
………………………
0 1 2 3 4

211
I have nausea
…………………………………
0 1 2 3 4
Because of my physical condition, I have
trouble meeting the needs of my family ……
0
1
2
3
4
I have pain
………………………………………
0 1 2 3 4
I am bothered by side effects of treatment …
0 1 2 3 4
I feel ill
…………………………………………
0 1 2 3 4
I am forced to spend time in bed
……………
0 1 2 3 4
SOCIAL/FAMILY WELL-BEING Not
at all
A little
bit
Some-
what
Quite
a bit
Very
much
I feel close to my friends
………………………
0 1 2 3 4
I get emotional support from my family
………
0 1 2 3 4
I get support from my friends
…………………
0 1 2 3 4
My family has accepted my illness
…………
0 1 2 3 4
I am satisfied with family communication 0 1 2 3 4

212
about my illness
………………………………
I feel close to my partner (or the person
who is my main support)
……………………………
0 1 2 3 4
Regardless of your current level of sexual activity,
please answer the following question. If you prefer
not to answer it, please check this box and go to
the next section
I am satisfied with my sex life
………………
0 1 2 3 4
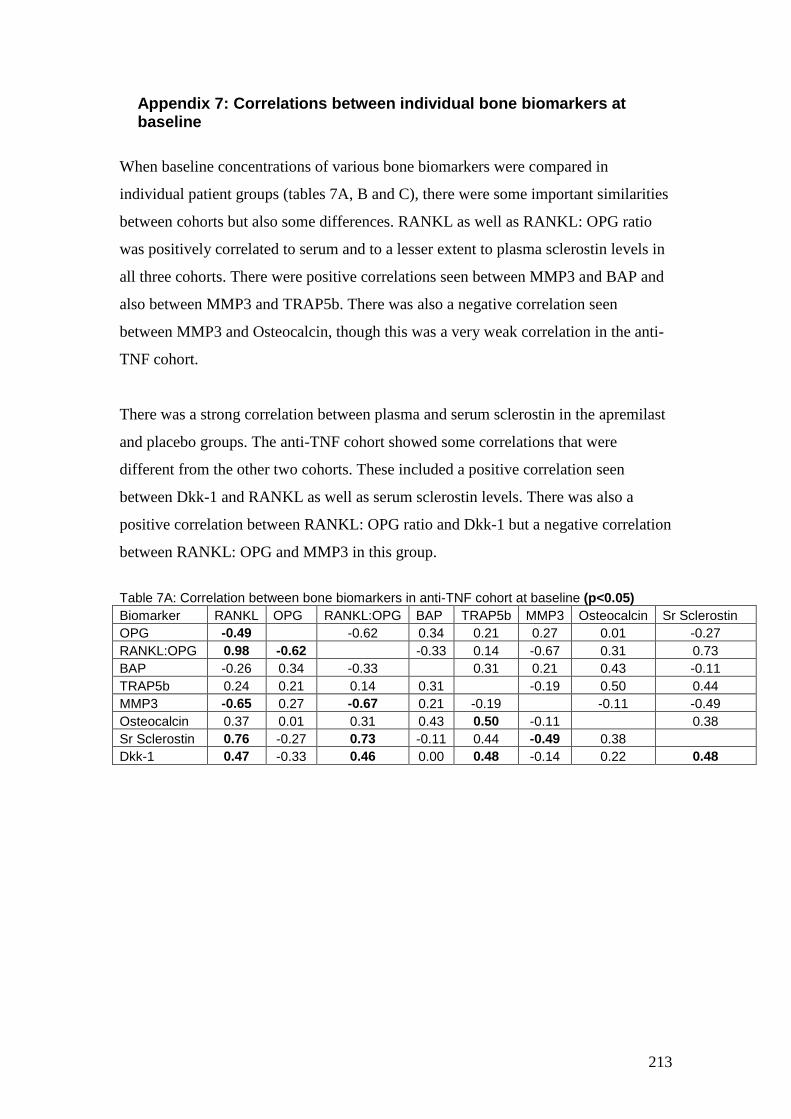
213
Appendix 7: Correlations between individual bone biomarkers at baseline
When baseline concentrations of various bone biomarkers were compared in
individual patient groups (tables 7A, B and C), there were some important similarities
between cohorts but also some differences. RANKL as well as RANKL: OPG ratio
was positively correlated to serum and to a lesser extent to plasma sclerostin levels in
all three cohorts. There were positive correlations seen between MMP3 and BAP and
also between MMP3 and TRAP5b. There was also a negative correlation seen
between MMP3 and Osteocalcin, though this was a very weak correlation in the anti-
TNF cohort.
There was a strong correlation between plasma and serum sclerostin in the apremilast
and placebo groups. The anti-TNF cohort showed some correlations that were
different from the other two cohorts. These included a positive correlation seen
between Dkk-1 and RANKL as well as serum sclerostin levels. There was also a
positive correlation between RANKL: OPG ratio and Dkk-1 but a negative correlation
between RANKL: OPG and MMP3 in this group.
Table 7A: Correlation between bone biomarkers in anti-TNF cohort at baseline (p<0.05)
Biomarker RANKL OPG RANKL:OPG BAP TRAP5b MMP3 Osteocalcin Sr Sclerostin
OPG -0.49 -0.62 0.34 0.21 0.27 0.01 -0.27
RANKL:OPG 0.98 -0.62 -0.33 0.14 -0.67 0.31 0.73
BAP -0.26 0.34 -0.33 0.31 0.21 0.43 -0.11
TRAP5b 0.24 0.21 0.14 0.31 -0.19 0.50 0.44
MMP3 -0.65 0.27 -0.67 0.21 -0.19 -0.11 -0.49
Osteocalcin 0.37 0.01 0.31 0.43 0.50 -0.11 0.38
Sr Sclerostin 0.76 -0.27 0.73 -0.11 0.44 -0.49 0.38
Dkk-1 0.47 -0.33 0.46 0.00 0.48 -0.14 0.22 0.48
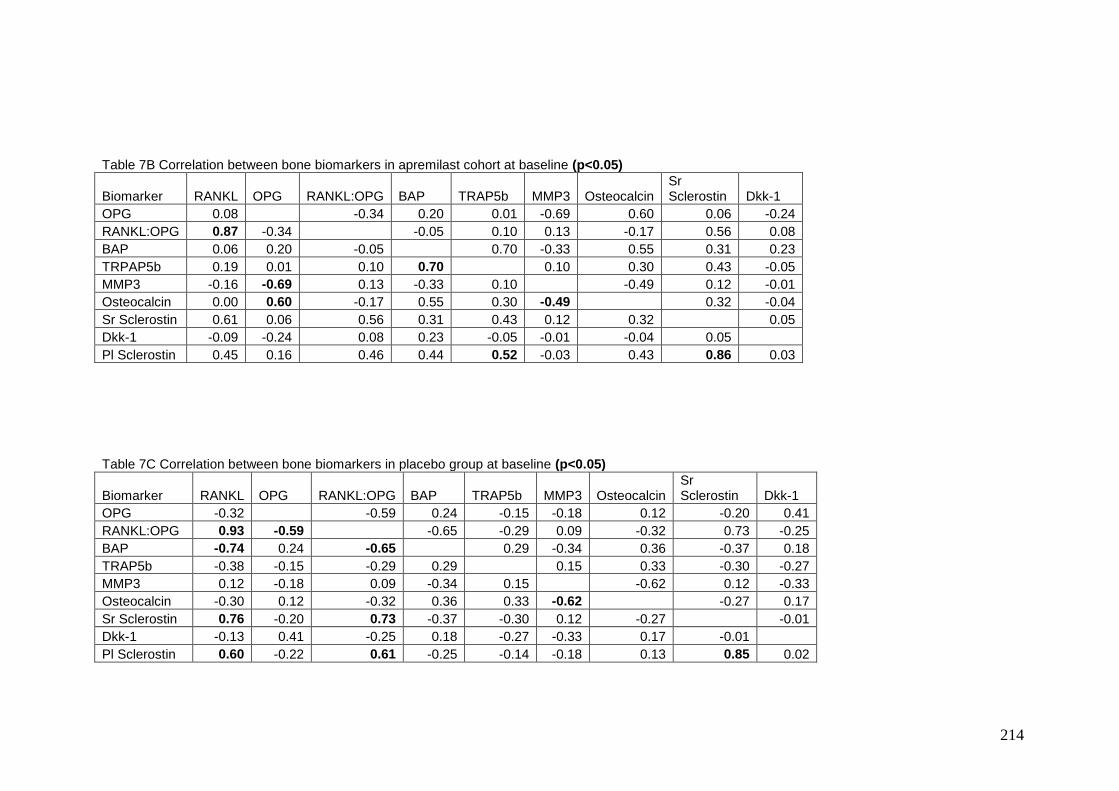
214
Table 7B Correlation between bone biomarkers in apremilast cohort at baseline (p<0.05)
Biomarker RANKL OPG RANKL:OPG BAP TRAP5b MMP3 Osteocalcin Sr Sclerostin Dkk-1
OPG 0.08 -0.34 0.20 0.01 -0.69 0.60 0.06 -0.24
RANKL:OPG 0.87 -0.34 -0.05 0.10 0.13 -0.17 0.56 0.08
BAP 0.06 0.20 -0.05 0.70 -0.33 0.55 0.31 0.23
TRPAP5b 0.19 0.01 0.10 0.70 0.10 0.30 0.43 -0.05
MMP3 -0.16 -0.69 0.13 -0.33 0.10 -0.49 0.12 -0.01
Osteocalcin 0.00 0.60 -0.17 0.55 0.30 -0.49 0.32 -0.04
Sr Sclerostin 0.61 0.06 0.56 0.31 0.43 0.12 0.32 0.05
Dkk-1 -0.09 -0.24 0.08 0.23 -0.05 -0.01 -0.04 0.05
Pl Sclerostin 0.45 0.16 0.46 0.44 0.52 -0.03 0.43 0.86 0.03
Table 7C Correlation between bone biomarkers in placebo group at baseline (p<0.05)
Biomarker RANKL OPG RANKL:OPG BAP TRAP5b MMP3 Osteocalcin Sr Sclerostin Dkk-1
OPG -0.32 -0.59 0.24 -0.15 -0.18 0.12 -0.20 0.41
RANKL:OPG 0.93 -0.59 -0.65 -0.29 0.09 -0.32 0.73 -0.25
BAP -0.74 0.24 -0.65 0.29 -0.34 0.36 -0.37 0.18
TRAP5b -0.38 -0.15 -0.29 0.29 0.15 0.33 -0.30 -0.27
MMP3 0.12 -0.18 0.09 -0.34 0.15 -0.62 0.12 -0.33
Osteocalcin -0.30 0.12 -0.32 0.36 0.33 -0.62 -0.27 0.17
Sr Sclerostin 0.76 -0.20 0.73 -0.37 -0.30 0.12 -0.27 -0.01
Dkk-1 -0.13 0.41 -0.25 0.18 -0.27 -0.33 0.17 -0.01
Pl Sclerostin 0.60 -0.22 0.61 -0.25 -0.14 -0.18 0.13 0.85 0.02
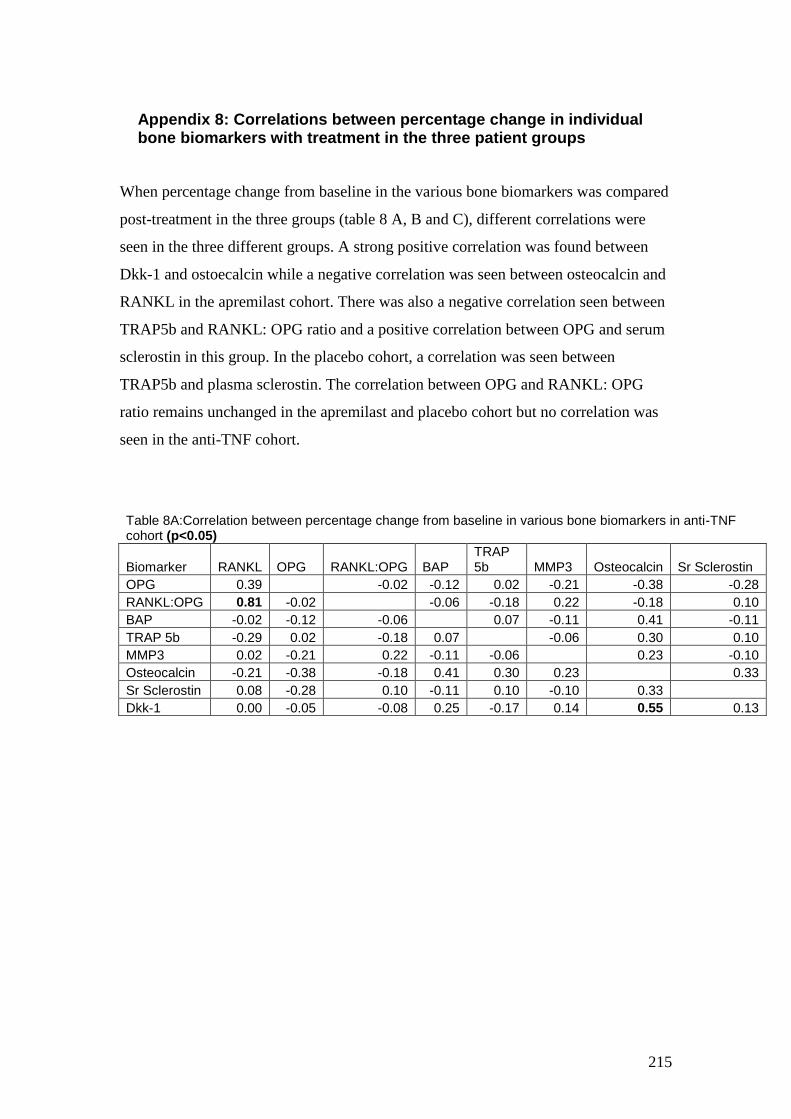
215
Appendix 8: Correlations between percentage change in individual bone biomarkers with treatment in the three patient groups
When percentage change from baseline in the various bone biomarkers was compared
post-treatment in the three groups (table 8 A, B and C), different correlations were
seen in the three different groups. A strong positive correlation was found between
Dkk-1 and ostoecalcin while a negative correlation was seen between osteocalcin and
RANKL in the apremilast cohort. There was also a negative correlation seen between
TRAP5b and RANKL: OPG ratio and a positive correlation between OPG and serum
sclerostin in this group. In the placebo cohort, a correlation was seen between
TRAP5b and plasma sclerostin. The correlation between OPG and RANKL: OPG
ratio remains unchanged in the apremilast and placebo cohort but no correlation was
seen in the anti-TNF cohort.
Table 8A:Correlation between percentage change from baseline in various bone biomarkers in anti-TNF cohort (p<0.05)
Biomarker RANKL OPG RANKL:OPG BAP TRAP 5b MMP3 Osteocalcin Sr Sclerostin
OPG 0.39 -0.02 -0.12 0.02 -0.21 -0.38 -0.28
RANKL:OPG 0.81 -0.02 -0.06 -0.18 0.22 -0.18 0.10
BAP -0.02 -0.12 -0.06 0.07 -0.11 0.41 -0.11
TRAP 5b -0.29 0.02 -0.18 0.07 -0.06 0.30 0.10
MMP3 0.02 -0.21 0.22 -0.11 -0.06 0.23 -0.10
Osteocalcin -0.21 -0.38 -0.18 0.41 0.30 0.23 0.33
Sr Sclerostin 0.08 -0.28 0.10 -0.11 0.10 -0.10 0.33
Dkk-1 0.00 -0.05 -0.08 0.25 -0.17 0.14 0.55 0.13
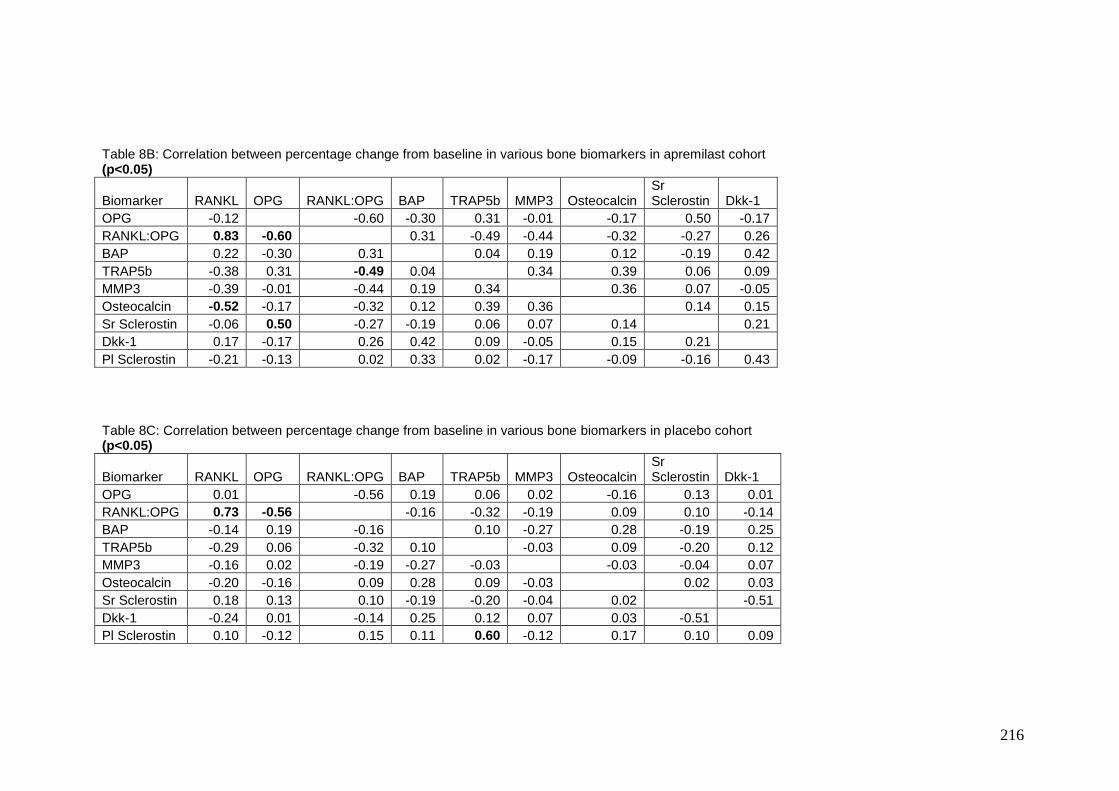
216
Table 8B: Correlation between percentage change from baseline in various bone biomarkers in apremilast cohort (p<0.05)
Biomarker RANKL OPG RANKL:OPG BAP TRAP5b MMP3 Osteocalcin Sr Sclerostin Dkk-1
OPG -0.12 -0.60 -0.30 0.31 -0.01 -0.17 0.50 -0.17
RANKL:OPG 0.83 -0.60 0.31 -0.49 -0.44 -0.32 -0.27 0.26
BAP 0.22 -0.30 0.31 0.04 0.19 0.12 -0.19 0.42
TRAP5b -0.38 0.31 -0.49 0.04 0.34 0.39 0.06 0.09
MMP3 -0.39 -0.01 -0.44 0.19 0.34 0.36 0.07 -0.05
Osteocalcin -0.52 -0.17 -0.32 0.12 0.39 0.36 0.14 0.15
Sr Sclerostin -0.06 0.50 -0.27 -0.19 0.06 0.07 0.14 0.21
Dkk-1 0.17 -0.17 0.26 0.42 0.09 -0.05 0.15 0.21
Pl Sclerostin -0.21 -0.13 0.02 0.33 0.02 -0.17 -0.09 -0.16 0.43
Table 8C: Correlation between percentage change from baseline in various bone biomarkers in placebo cohort (p<0.05)
Biomarker RANKL OPG RANKL:OPG BAP TRAP5b MMP3 Osteocalcin Sr Sclerostin Dkk-1
OPG 0.01 -0.56 0.19 0.06 0.02 -0.16 0.13 0.01
RANKL:OPG 0.73 -0.56 -0.16 -0.32 -0.19 0.09 0.10 -0.14
BAP -0.14 0.19 -0.16 0.10 -0.27 0.28 -0.19 0.25
TRAP5b -0.29 0.06 -0.32 0.10 -0.03 0.09 -0.20 0.12
MMP3 -0.16 0.02 -0.19 -0.27 -0.03 -0.03 -0.04 0.07
Osteocalcin -0.20 -0.16 0.09 0.28 0.09 -0.03 0.02 0.03
Sr Sclerostin 0.18 0.13 0.10 -0.19 -0.20 -0.04 0.02 -0.51
Dkk-1 -0.24 0.01 -0.14 0.25 0.12 0.07 0.03 -0.51
Pl Sclerostin 0.10 -0.12 0.15 0.11 0.60 -0.12 0.17 0.10 0.09
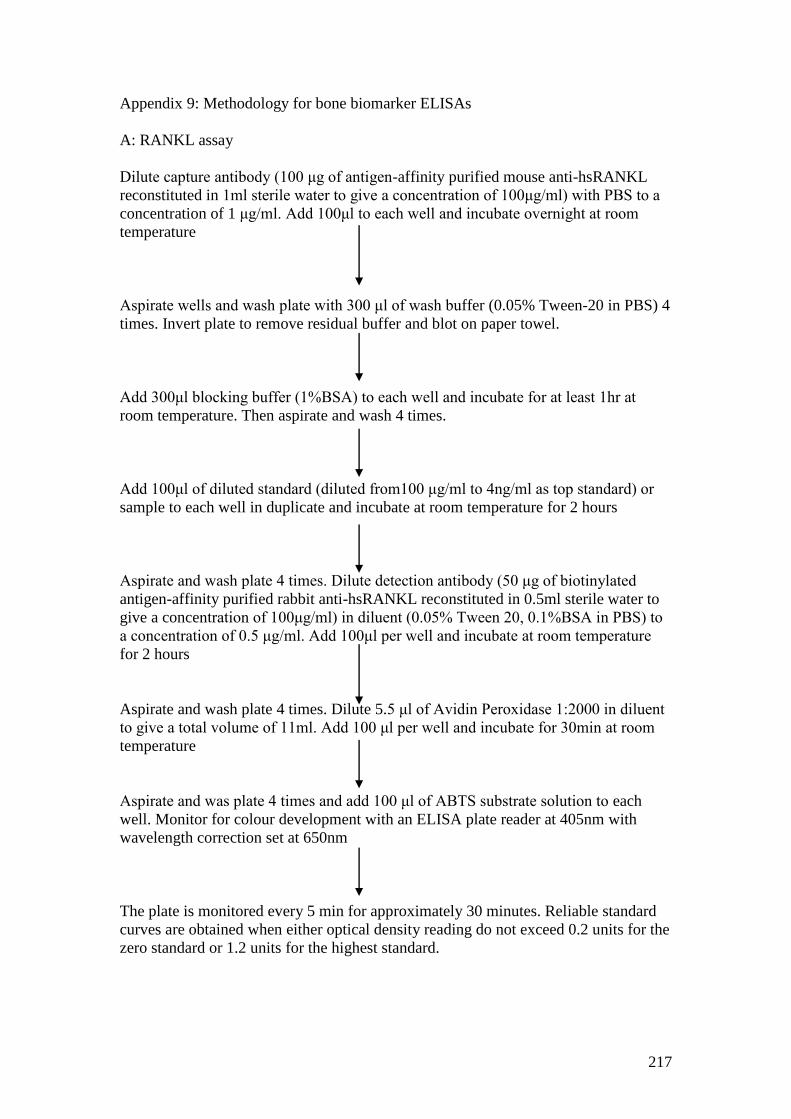
217
Appendix 9: Methodology for bone biomarker ELISAs
A: RANKL assay
Dilute capture antibody (100 μg of antigen-affinity purified mouse anti-hsRANKL
reconstituted in 1ml sterile water to give a concentration of 100μg/ml) with PBS to a
concentration of 1 μg/ml. Add 100μl to each well and incubate overnight at room
temperature
Aspirate wells and wash plate with 300 μl of wash buffer (0.05% Tween-20 in PBS) 4
times. Invert plate to remove residual buffer and blot on paper towel.
Add 300μl blocking buffer (1%BSA) to each well and incubate for at least 1hr at
room temperature. Then aspirate and wash 4 times.
Add 100μl of diluted standard (diluted from100 μg/ml to 4ng/ml as top standard) or
sample to each well in duplicate and incubate at room temperature for 2 hours
Aspirate and wash plate 4 times. Dilute detection antibody (50 μg of biotinylated
antigen-affinity purified rabbit anti-hsRANKL reconstituted in 0.5ml sterile water to
give a concentration of 100μg/ml) in diluent (0.05% Tween 20, 0.1%BSA in PBS) to
a concentration of 0.5 μg/ml. Add 100μl per well and incubate at room temperature
for 2 hours
Aspirate and wash plate 4 times. Dilute 5.5 μl of Avidin Peroxidase 1:2000 in diluent
to give a total volume of 11ml. Add 100 μl per well and incubate for 30min at room
temperature
Aspirate and was plate 4 times and add 100 μl of ABTS substrate solution to each
well. Monitor for colour development with an ELISA plate reader at 405nm with
wavelength correction set at 650nm
The plate is monitored every 5 min for approximately 30 minutes. Reliable standard
curves are obtained when either optical density reading do not exceed 0.2 units for the
zero standard or 1.2 units for the highest standard.
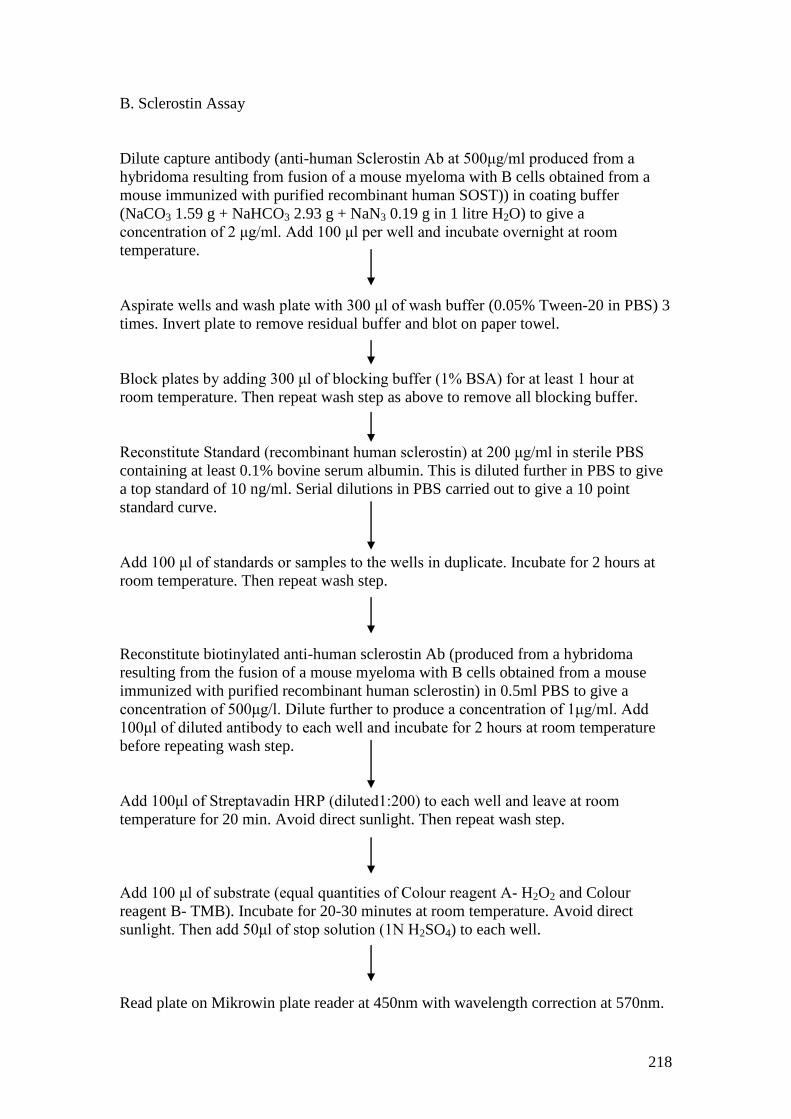
218
B. Sclerostin Assay
Dilute capture antibody (anti-human Sclerostin Ab at 500μg/ml produced from a
hybridoma resulting from fusion of a mouse myeloma with B cells obtained from a
mouse immunized with purified recombinant human SOST)) in coating buffer
(NaCO3 1.59 g + NaHCO3 2.93 g + NaN3 0.19 g in 1 litre H2O) to give a
concentration of 2 μg/ml. Add 100 μl per well and incubate overnight at room
temperature.
Aspirate wells and wash plate with 300 μl of wash buffer (0.05% Tween-20 in PBS) 3
times. Invert plate to remove residual buffer and blot on paper towel.
Block plates by adding 300 μl of blocking buffer (1% BSA) for at least 1 hour at
room temperature. Then repeat wash step as above to remove all blocking buffer.
Reconstitute Standard (recombinant human sclerostin) at 200 μg/ml in sterile PBS
containing at least 0.1% bovine serum albumin. This is diluted further in PBS to give
a top standard of 10 ng/ml. Serial dilutions in PBS carried out to give a 10 point
standard curve.
Add 100 μl of standards or samples to the wells in duplicate. Incubate for 2 hours at
room temperature. Then repeat wash step.
Reconstitute biotinylated anti-human sclerostin Ab (produced from a hybridoma
resulting from the fusion of a mouse myeloma with B cells obtained from a mouse
immunized with purified recombinant human sclerostin) in 0.5ml PBS to give a
concentration of 500μg/l. Dilute further to produce a concentration of 1μg/ml. Add
100μl of diluted antibody to each well and incubate for 2 hours at room temperature
before repeating wash step.
Add 100μl of Streptavadin HRP (diluted1:200) to each well and leave at room
temperature for 20 min. Avoid direct sunlight. Then repeat wash step.
Add 100 μl of substrate (equal quantities of Colour reagent A- H2O2 and Colour
reagent B- TMB). Incubate for 20-30 minutes at room temperature. Avoid direct
sunlight. Then add 50μl of stop solution (1N H2SO4) to each well.
Read plate on Mikrowin plate reader at 450nm with wavelength correction at 570nm.
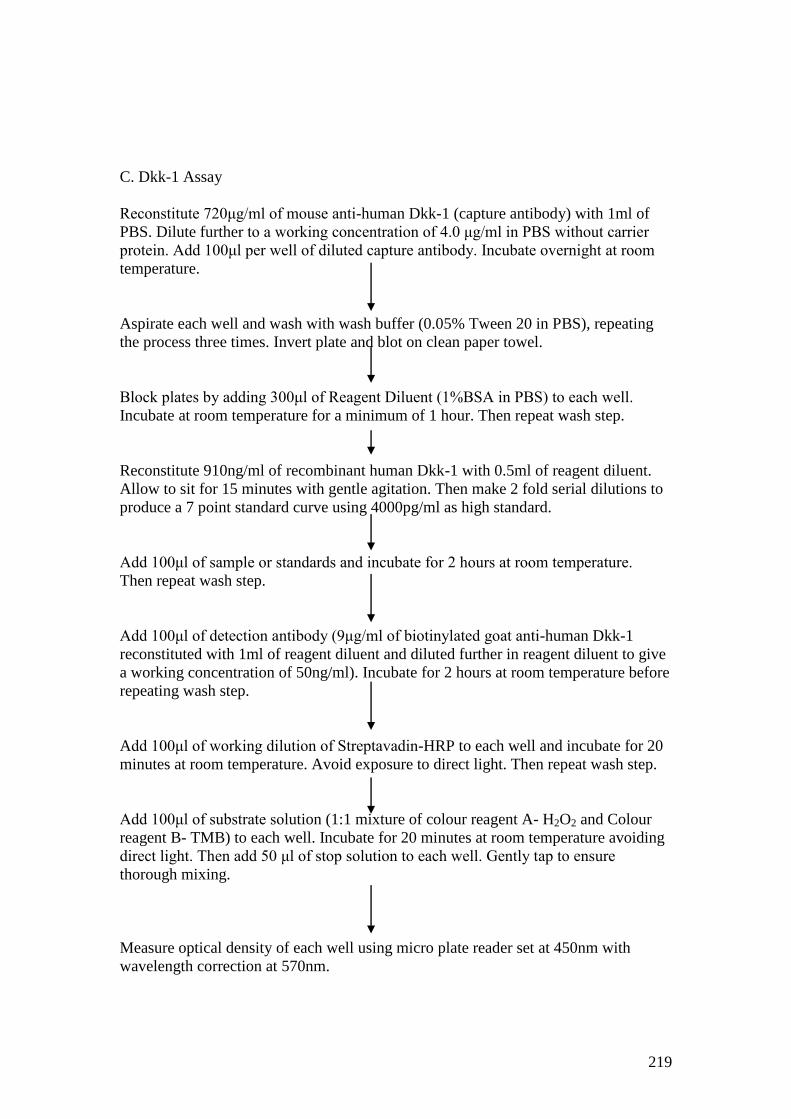
219
C. Dkk-1 Assay
Reconstitute 720μg/ml of mouse anti-human Dkk-1 (capture antibody) with 1ml of
PBS. Dilute further to a working concentration of 4.0 μg/ml in PBS without carrier
protein. Add 100μl per well of diluted capture antibody. Incubate overnight at room
temperature.
Aspirate each well and wash with wash buffer (0.05% Tween 20 in PBS), repeating
the process three times. Invert plate and blot on clean paper towel.
Block plates by adding 300μl of Reagent Diluent (1%BSA in PBS) to each well.
Incubate at room temperature for a minimum of 1 hour. Then repeat wash step.
Reconstitute 910ng/ml of recombinant human Dkk-1 with 0.5ml of reagent diluent.
Allow to sit for 15 minutes with gentle agitation. Then make 2 fold serial dilutions to
produce a 7 point standard curve using 4000pg/ml as high standard.
Add 100μl of sample or standards and incubate for 2 hours at room temperature.
Then repeat wash step.
Add 100μl of detection antibody (9μg/ml of biotinylated goat anti-human Dkk-1
reconstituted with 1ml of reagent diluent and diluted further in reagent diluent to give
a working concentration of 50ng/ml). Incubate for 2 hours at room temperature before
repeating wash step.
Add 100μl of working dilution of Streptavadin-HRP to each well and incubate for 20
minutes at room temperature. Avoid exposure to direct light. Then repeat wash step.
Add 100μl of substrate solution (1:1 mixture of colour reagent A- H2O2 and Colour
reagent B- TMB) to each well. Incubate for 20 minutes at room temperature avoiding
direct light. Then add 50 μl of stop solution to each well. Gently tap to ensure
thorough mixing.
Measure optical density of each well using micro plate reader set at 450nm with
wavelength correction at 570nm.
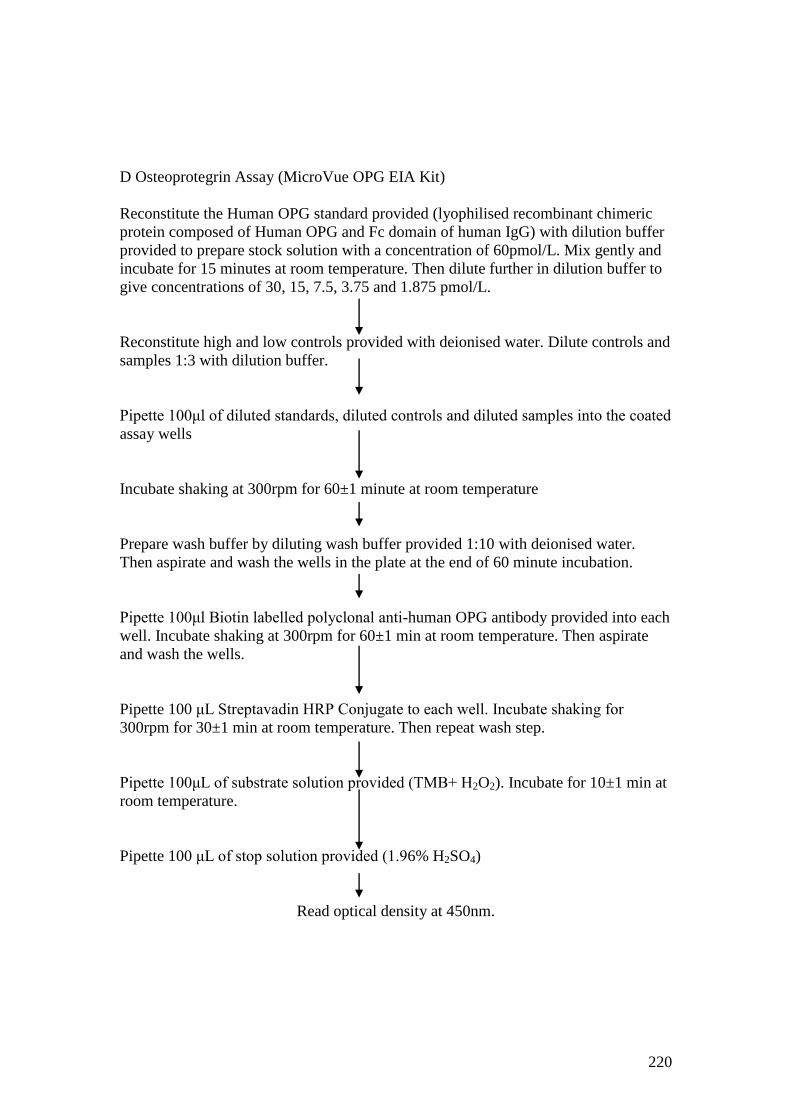
220
D Osteoprotegrin Assay (MicroVue OPG EIA Kit)
Reconstitute the Human OPG standard provided (lyophilised recombinant chimeric
protein composed of Human OPG and Fc domain of human IgG) with dilution buffer
provided to prepare stock solution with a concentration of 60pmol/L. Mix gently and
incubate for 15 minutes at room temperature. Then dilute further in dilution buffer to
give concentrations of 30, 15, 7.5, 3.75 and 1.875 pmol/L.
Reconstitute high and low controls provided with deionised water. Dilute controls and
samples 1:3 with dilution buffer.
Pipette 100μl of diluted standards, diluted controls and diluted samples into the coated
assay wells
Incubate shaking at 300rpm for 60±1 minute at room temperature
Prepare wash buffer by diluting wash buffer provided 1:10 with deionised water.
Then aspirate and wash the wells in the plate at the end of 60 minute incubation.
Pipette 100μl Biotin labelled polyclonal anti-human OPG antibody provided into each
well. Incubate shaking at 300rpm for 60±1 min at room temperature. Then aspirate
and wash the wells.
Pipette 100 μL Streptavadin HRP Conjugate to each well. Incubate shaking for
300rpm for 30±1 min at room temperature. Then repeat wash step.
Pipette 100μL of substrate solution provided (TMB+ H2O2). Incubate for 10±1 min at
room temperature.
Pipette 100 μL of stop solution provided (1.96% H2SO4)
Read optical density at 450nm.
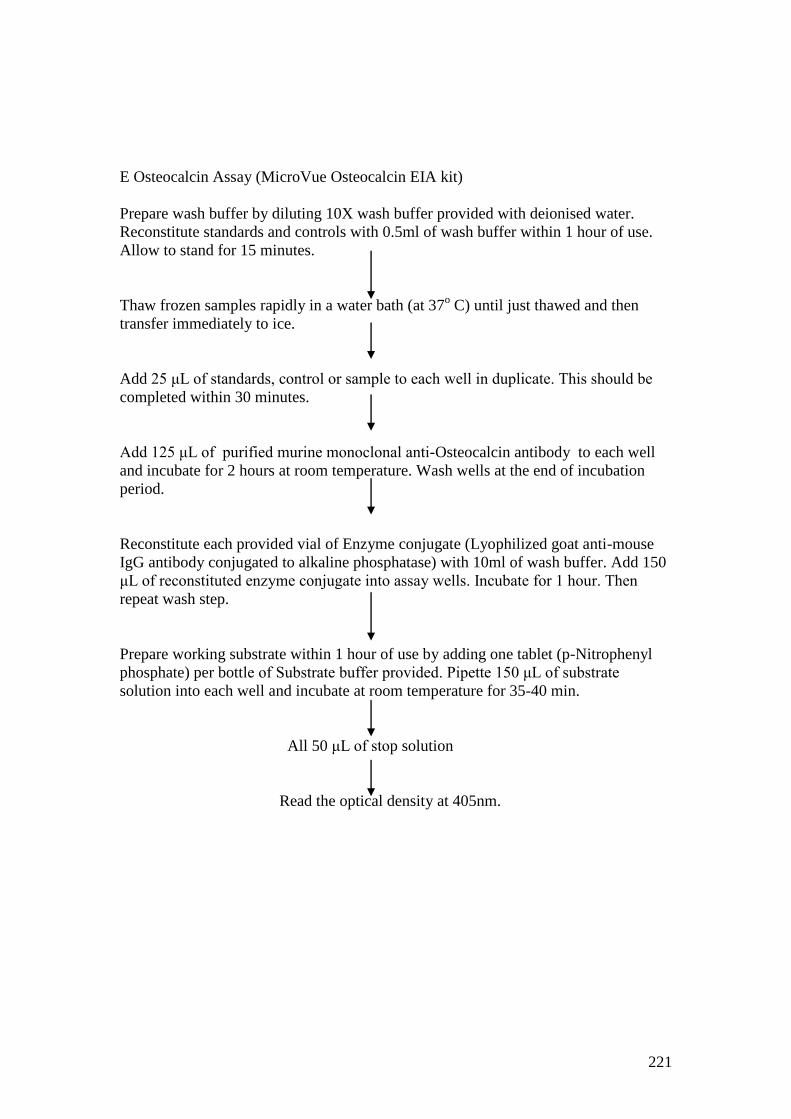
221
E Osteocalcin Assay (MicroVue Osteocalcin EIA kit)
Prepare wash buffer by diluting 10X wash buffer provided with deionised water.
Reconstitute standards and controls with 0.5ml of wash buffer within 1 hour of use.
Allow to stand for 15 minutes.
Thaw frozen samples rapidly in a water bath (at 37o C) until just thawed and then
transfer immediately to ice.
Add 25 μL of standards, control or sample to each well in duplicate. This should be
completed within 30 minutes.
Add 125 μL of purified murine monoclonal anti-Osteocalcin antibody to each well
and incubate for 2 hours at room temperature. Wash wells at the end of incubation
period.
Reconstitute each provided vial of Enzyme conjugate (Lyophilized goat anti-mouse
IgG antibody conjugated to alkaline phosphatase) with 10ml of wash buffer. Add 150
μL of reconstituted enzyme conjugate into assay wells. Incubate for 1 hour. Then
repeat wash step.
Prepare working substrate within 1 hour of use by adding one tablet (p-Nitrophenyl
phosphate) per bottle of Substrate buffer provided. Pipette 150 μL of substrate
solution into each well and incubate at room temperature for 35-40 min.
All 50 μL of stop solution
Read the optical density at 405nm.
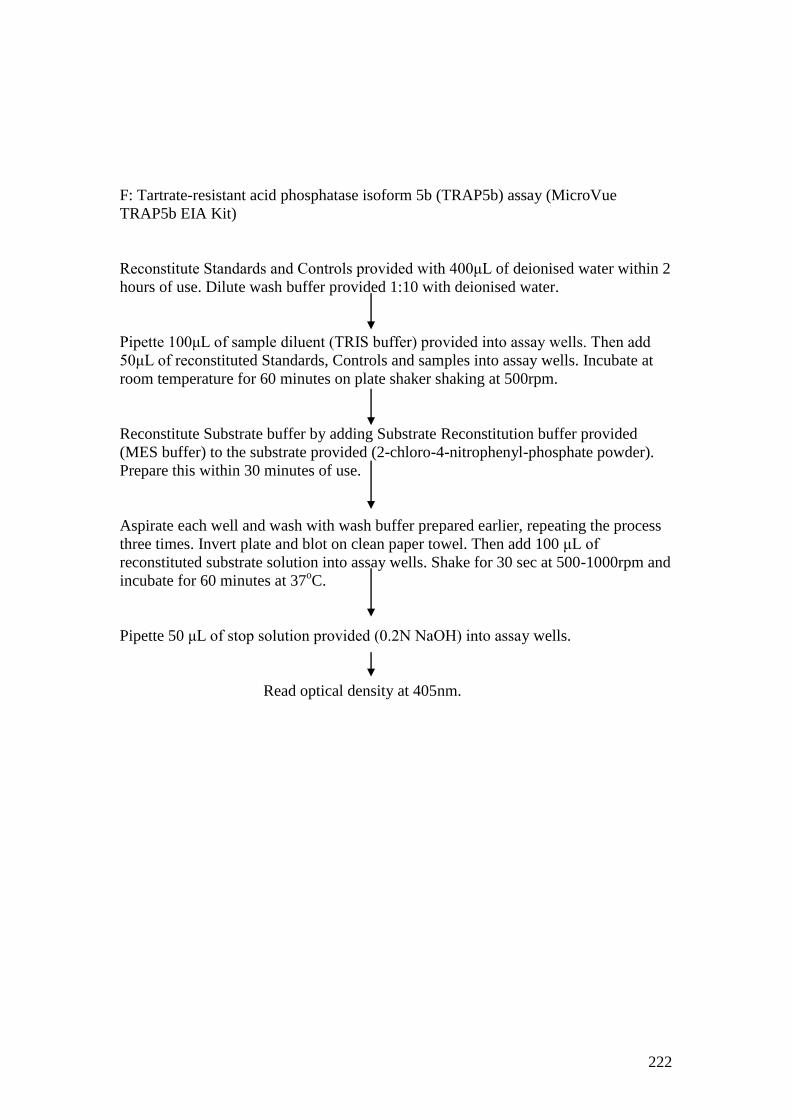
222
F: Tartrate-resistant acid phosphatase isoform 5b (TRAP5b) assay (MicroVue
TRAP5b EIA Kit)
Reconstitute Standards and Controls provided with 400μL of deionised water within 2
hours of use. Dilute wash buffer provided 1:10 with deionised water.
Pipette 100μL of sample diluent (TRIS buffer) provided into assay wells. Then add
50μL of reconstituted Standards, Controls and samples into assay wells. Incubate at
room temperature for 60 minutes on plate shaker shaking at 500rpm.
Reconstitute Substrate buffer by adding Substrate Reconstitution buffer provided
(MES buffer) to the substrate provided (2-chloro-4-nitrophenyl-phosphate powder).
Prepare this within 30 minutes of use.
Aspirate each well and wash with wash buffer prepared earlier, repeating the process
three times. Invert plate and blot on clean paper towel. Then add 100 μL of
reconstituted substrate solution into assay wells. Shake for 30 sec at 500-1000rpm and
incubate for 60 minutes at 37oC.
Pipette 50 μL of stop solution provided (0.2N NaOH) into assay wells.
Read optical density at 405nm.
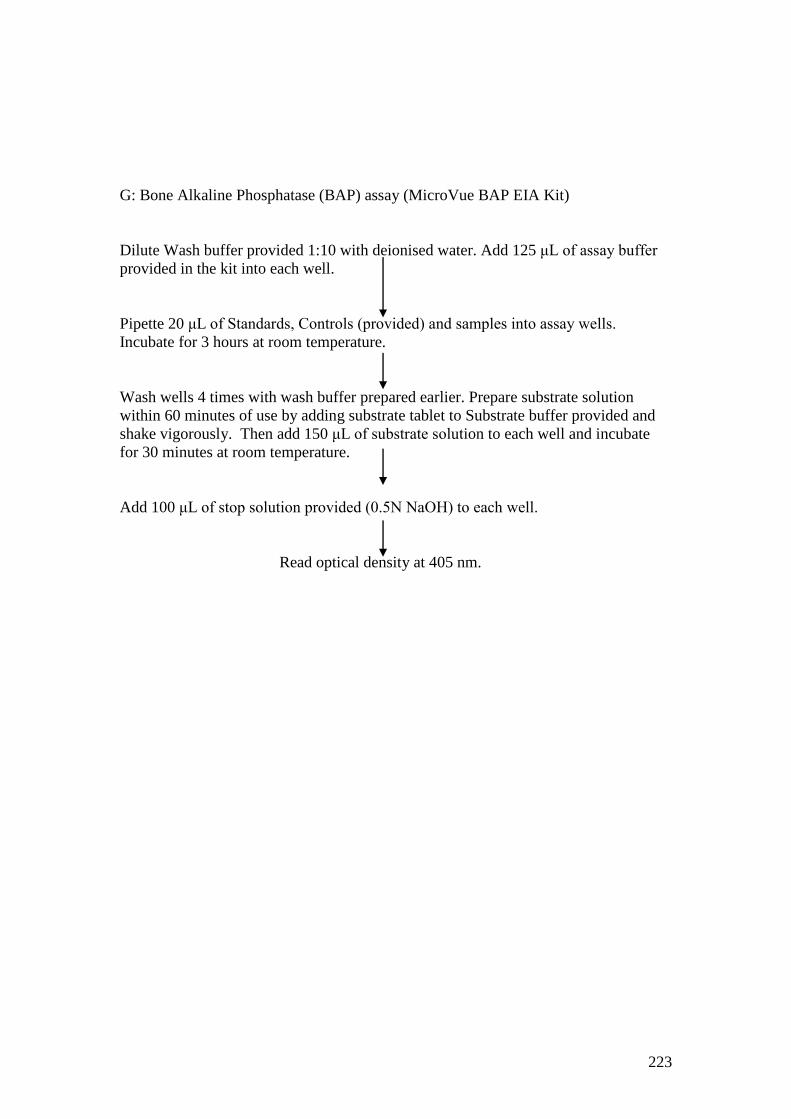
223
G: Bone Alkaline Phosphatase (BAP) assay (MicroVue BAP EIA Kit)
Dilute Wash buffer provided 1:10 with deionised water. Add 125 μL of assay buffer
provided in the kit into each well.
Pipette 20 μL of Standards, Controls (provided) and samples into assay wells.
Incubate for 3 hours at room temperature.
Wash wells 4 times with wash buffer prepared earlier. Prepare substrate solution
within 60 minutes of use by adding substrate tablet to Substrate buffer provided and
shake vigorously. Then add 150 μL of substrate solution to each well and incubate
for 30 minutes at room temperature.
Add 100 μL of stop solution provided (0.5N NaOH) to each well.
Read optical density at 405 nm.
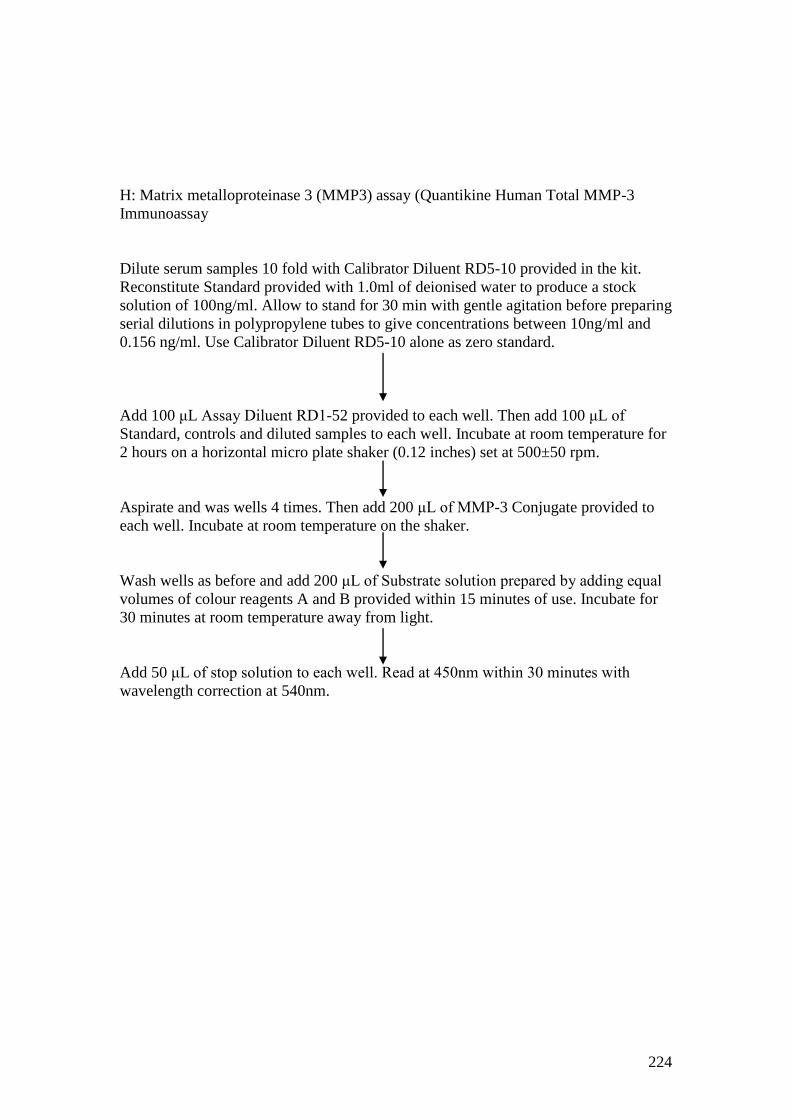
224
H: Matrix metalloproteinase 3 (MMP3) assay (Quantikine Human Total MMP-3
Immunoassay
Dilute serum samples 10 fold with Calibrator Diluent RD5-10 provided in the kit.
Reconstitute Standard provided with 1.0ml of deionised water to produce a stock
solution of 100ng/ml. Allow to stand for 30 min with gentle agitation before preparing
serial dilutions in polypropylene tubes to give concentrations between 10ng/ml and
0.156 ng/ml. Use Calibrator Diluent RD5-10 alone as zero standard.
Add 100 μL Assay Diluent RD1-52 provided to each well. Then add 100 μL of
Standard, controls and diluted samples to each well. Incubate at room temperature for
2 hours on a horizontal micro plate shaker (0.12 inches) set at 500±50 rpm.
Aspirate and was wells 4 times. Then add 200 μL of MMP-3 Conjugate provided to
each well. Incubate at room temperature on the shaker.
Wash wells as before and add 200 μL of Substrate solution prepared by adding equal
volumes of colour reagents A and B provided within 15 minutes of use. Incubate for
30 minutes at room temperature away from light.
Add 50 μL of stop solution to each well. Read at 450nm within 30 minutes with
wavelength correction at 540nm.

225
Appendix 10: Publications
Efficacy and safety of apremilast, an oral phosphodiesterase 4 inhibitor, in
ankylosing spondylitis
Ejaz Pathan,1 Sonya Abraham,
2 Elizabeth Van Rossen,
3 Robin Withrington,
3 Andrew
Keat,4 Peter Charles,
1 Erin Paterson,
1 Muslima Chowdhury,
1 Catherine McClinton,
5
Peter C. Taylor5
1Kennedy Institute of Rheumatology, Nuffield Department of Orthopaedics,
Rheumatology and Musculoskeletal Sciences, University of Oxford, 65 Aspenlea
Road, Hammersmith, London, UK, W6 8LH
2Faculty of Medicine, Imperial College London, UK, SW7 2AZ
3Kent and Canterbury Hospital, Ethelbert Road, Canterbury, Kent, UK, CT1 3NG
4Northwick Park Hospital, Watford Road, Harrow, UK, HA1 3UJ
5Kennedy Institute of Rheumatology, Nuffield Department of Orthopaedics,
Rheumatology and Musculoskeletal Sciences, University of Oxford, Botnar Research
Centre, Windmill Road, Headington, Oxford, UK, OX3 7LD
Correspondence to
Peter C. Taylor, MA, PhD, FRCP
Norman Collisson Professor of Musculoskeletal Sciences
Kennedy Institute of Rheumatology
Nuffield Department of Orthopaedics, Rheumatology and Musculoskeletal Sciences
University of Oxford
Botnar Research Centre
Windmill Road
Headington, Oxford, United Kingdom, OX3 7LD
Tel.: 01865 227323
Fax: 01865 227465
Email: [email protected]
Keywords: Apremilast, Phosphodiesterase 4 Inhibitor, Ankylosing Spondylitis,
Treatment, Sclerostin.
Word count: 2,993 (excluding title page, abstract, references, figures, tables)
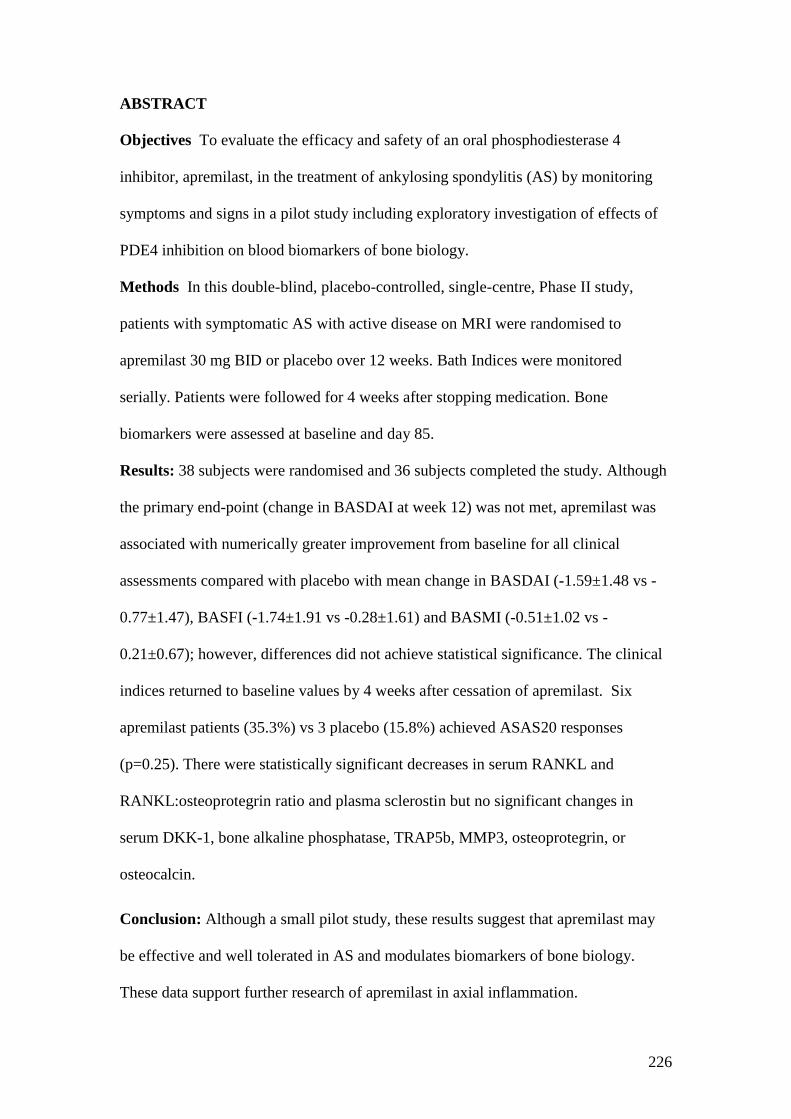
226
ABSTRACT
Objectives To evaluate the efficacy and safety of an oral phosphodiesterase 4
inhibitor, apremilast, in the treatment of ankylosing spondylitis (AS) by monitoring
symptoms and signs in a pilot study including exploratory investigation of effects of
PDE4 inhibition on blood biomarkers of bone biology.
Methods In this double-blind, placebo-controlled, single-centre, Phase II study,
patients with symptomatic AS with active disease on MRI were randomised to
apremilast 30 mg BID or placebo over 12 weeks. Bath Indices were monitored
serially. Patients were followed for 4 weeks after stopping medication. Bone
biomarkers were assessed at baseline and day 85.
Results: 38 subjects were randomised and 36 subjects completed the study. Although
the primary end-point (change in BASDAI at week 12) was not met, apremilast was
associated with numerically greater improvement from baseline for all clinical
assessments compared with placebo with mean change in BASDAI (-1.59±1.48 vs -
0.77±1.47), BASFI (-1.74±1.91 vs -0.28±1.61) and BASMI (-0.51±1.02 vs -
0.21±0.67); however, differences did not achieve statistical significance. The clinical
indices returned to baseline values by 4 weeks after cessation of apremilast. Six
apremilast patients (35.3%) vs 3 placebo (15.8%) achieved ASAS20 responses
(p=0.25). There were statistically significant decreases in serum RANKL and
RANKL:osteoprotegrin ratio and plasma sclerostin but no significant changes in
serum DKK-1, bone alkaline phosphatase, TRAP5b, MMP3, osteoprotegrin, or
osteocalcin.
Conclusion: Although a small pilot study, these results suggest that apremilast may
be effective and well tolerated in AS and modulates biomarkers of bone biology.
These data support further research of apremilast in axial inflammation.
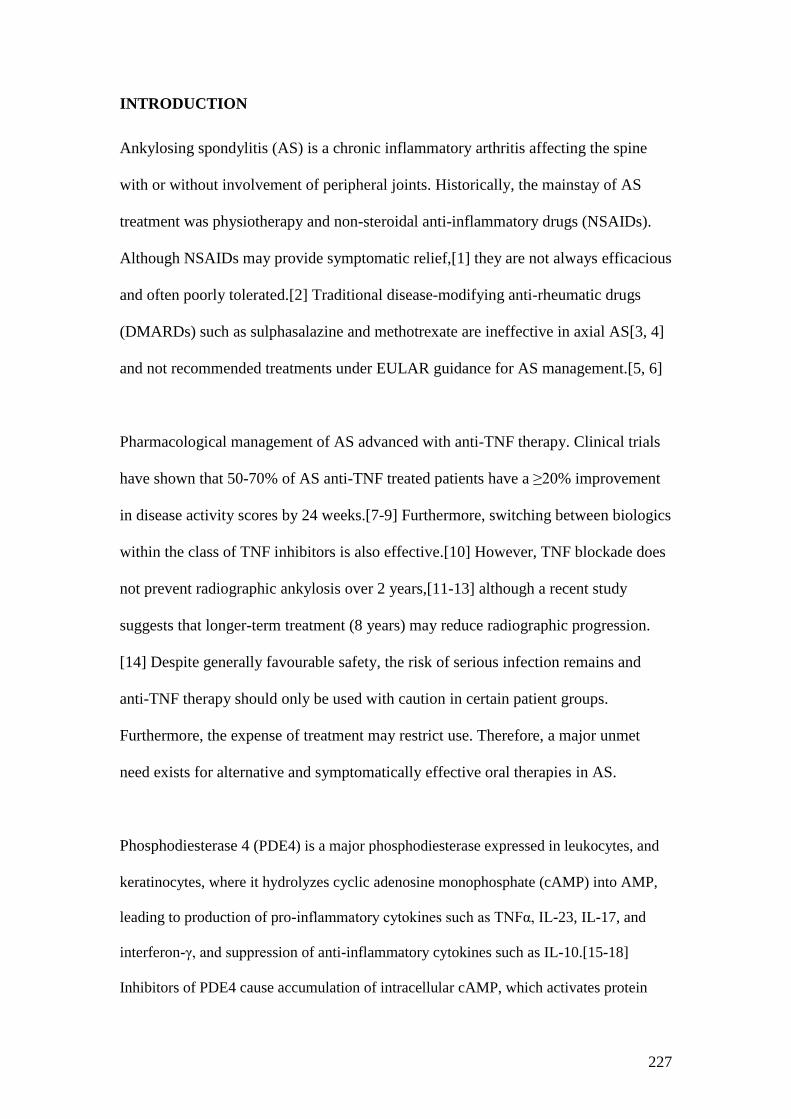
227
INTRODUCTION
Ankylosing spondylitis (AS) is a chronic inflammatory arthritis affecting the spine
with or without involvement of peripheral joints. Historically, the mainstay of AS
treatment was physiotherapy and non-steroidal anti-inflammatory drugs (NSAIDs).
Although NSAIDs may provide symptomatic relief,[1] they are not always efficacious
and often poorly tolerated.[2] Traditional disease-modifying anti-rheumatic drugs
(DMARDs) such as sulphasalazine and methotrexate are ineffective in axial AS[3, 4]
and not recommended treatments under EULAR guidance for AS management.[5, 6]
Pharmacological management of AS advanced with anti-TNF therapy. Clinical trials
have shown that 50-70% of AS anti-TNF treated patients have a ≥20% improvement
in disease activity scores by 24 weeks.[7-9] Furthermore, switching between biologics
within the class of TNF inhibitors is also effective.[10] However, TNF blockade does
not prevent radiographic ankylosis over 2 years,[11-13] although a recent study
suggests that longer-term treatment (8 years) may reduce radiographic progression.
[14] Despite generally favourable safety, the risk of serious infection remains and
anti-TNF therapy should only be used with caution in certain patient groups.
Furthermore, the expense of treatment may restrict use. Therefore, a major unmet
need exists for alternative and symptomatically effective oral therapies in AS.
Phosphodiesterase 4 (PDE4) is a major phosphodiesterase expressed in leukocytes, and
keratinocytes, where it hydrolyzes cyclic adenosine monophosphate (cAMP) into AMP,
leading to production of pro-inflammatory cytokines such as TNFα, IL-23, IL-17, and
interferon-γ, and suppression of anti-inflammatory cytokines such as IL-10.[15-18]
Inhibitors of PDE4 cause accumulation of intracellular cAMP, which activates protein
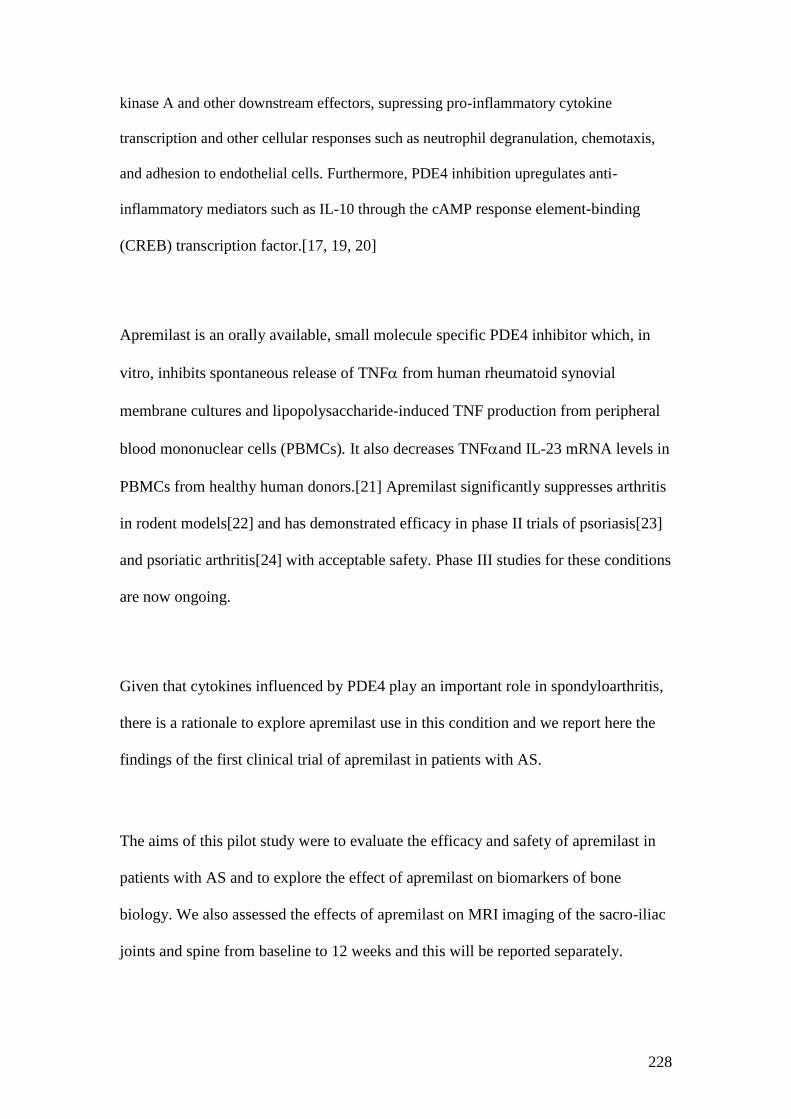
228
kinase A and other downstream effectors, supressing pro-inflammatory cytokine
transcription and other cellular responses such as neutrophil degranulation, chemotaxis,
and adhesion to endothelial cells. Furthermore, PDE4 inhibition upregulates anti-
inflammatory mediators such as IL-10 through the cAMP response element-binding
(CREB) transcription factor.[17, 19, 20]
Apremilast is an orally available, small molecule specific PDE4 inhibitor which, in
vitro, inhibits spontaneous release of TNF from human rheumatoid synovial
membrane cultures and lipopolysaccharide-induced TNF production from peripheral
blood mononuclear cells (PBMCs). It also decreases TNFand IL-23 mRNA levels in
PBMCs from healthy human donors.[21] Apremilast significantly suppresses arthritis
in rodent models[22] and has demonstrated efficacy in phase II trials of psoriasis[23]
and psoriatic arthritis[24] with acceptable safety. Phase III studies for these conditions
are now ongoing.
Given that cytokines influenced by PDE4 play an important role in spondyloarthritis,
there is a rationale to explore apremilast use in this condition and we report here the
findings of the first clinical trial of apremilast in patients with AS.
The aims of this pilot study were to evaluate the efficacy and safety of apremilast in
patients with AS and to explore the effect of apremilast on biomarkers of bone
biology. We also assessed the effects of apremilast on MRI imaging of the sacro-iliac
joints and spine from baseline to 12 weeks and this will be reported separately.
229
PATIENTS AND METHODS
Study design
This was a single-centre, randomized, double-blind, placebo-controlled, Phase II,
investigator-led, pilot study carried out at the Kennedy Clinical Trials Unit
(Clinicaltrials.gov number NCT00944658) and sponsored by Imperial College
London. It was conducted in accordance with good clinical practice and received
ethics committee approval from The Hammersmith Hospital Research Ethics
Committee. Each patient provided written informed consent.
The study involved a 12-week, double-blind, placebo-controlled period followed by a
4-week follow-up for safety and clinical assessments. Patients were randomized 1:1 to
receive apremilast 30 mg BID or placebo in a double-blind fashion. An unblinded
pharmacist allocated patients to receive either placebo or active drug according to a
randomization code generated by Celgene. All other study personnel remained
blinded to treatment until the end of the double-blind period. Patients were started on
apremilast 10 mg BID or placebo and the dose was titrated by 20 mg every 2 days
until the maximum dose of 30 mg BID was achieved on day 5. Apremilast/placebo
was then given daily until day 85 (week 12). Patients were allowed to continue stable
doses of NSAIDs but were not allowed DMARDs within 8 weeks of randomization or
corticosteroids in oral/parenteral form within 4 weeks of randomization.
Patients
Key inclusion criteria included modified New York criteria for AS, disease duration >
2 years, symptoms of back pain and stiffness confirmed with a score of ≥1 on
questions 2 and 5 of the Bath Ankylosing Spondylitis Disease Activity Index
230
(BASDAI; spinal pain and stiffness) and presence of active bone oedema either in the
spine or sacroiliac joints confirmed by magnetic resonance imaging (MRI). Patients
with prior treatment with TNF inhibitors were permitted to enrol.
Patients were excluded if there were abnormalities on routine blood tests other than a
raised erythrocyte sedimentation rate (ESR) or C-reactive protein (CRP),
contraindications to MRI scanning, or positive tuberculosis testing (Mantoux and TB
Elispot).
Evaluation of efficacy
The primary end point was the mean change in BASDAI score at week 12 compared
with baseline. Additional efficacy assessments included changes in function using the
Bath Ankylosing Spondylitis Functional Index (BASFI) and improvement in spinal
mobility using the Bath Ankylosing Spondylitis Metrology Index (BASMI). The Bath
Ankylosing Spondylitis Global Score (BAS-G) and night time pain scores were also
recorded. The Functional Assessment of Chronic Illness Therapy-Fatigue (FACIT-F)
questionnaire was used to assess improvement in the quality of life. The Ankylosing
Spondylitis Activity Score 20 (ASAS20) and ASAS40 responses were calculated. All
assessments were carried out at baseline (day1) and days 8, 15, 29, 56, and 85 (week
12) and were repeated at the end of the safety follow-up period (day 113). Post hoc
analyses of AS disease activity score (ASDAS) changes were undertaken.
Laboratory biomarkers
Routine biochemistry, including CRP and haematology with ESR, were performed at
all patient visits. Additional blood samples were centrifuged at 1200 g for 15 minutes
231
within 2 hours of phlebotomy and stored at -80oC. The following commercially
available enzyme-linked immunosorbent assays (ELISA) were used: osteocalcin,
tartarate-resistant acid phosphatase (TRAP5b), osteoprotegrin (OPG), and bone
alkaline phosphatase (BAP [MicroVue Bone Health, Quidel Corporation, CA, USA]),
matrix metalloproteinase 3 (MMP3 [Quantikine , R&D Systems, Abingdon, UK]),
and human serum receptor activator of NF-κB ligand (sRANKL [Peprotech Inc, NJ,
USA]). Commercially available DuoSet ELISA development system (R&D Systems)
was used to measure total DKK-1 levels in serum. A sandwich ELISA protocol was
developed using R&D Systems’ recombinant human sclerostin, biotinylated anti-
human sclerostin antibody (1:500 dilution), and monoclonal anti-human sclerostin
antibody (2 μg/ml) to measure sclerostin levels in plasma.
Statistical methods
Sample size estimation
This was an exploratory study conducted without prior knowledge of effect size of
apremilast in AS. The sample size was chosen based on feasibility and on the basis
that for an effect size similar to that of anti-TNF, a sample size of 18 patients in each
arm would have 80% power to detect differences between groups at a 95% level of
significance.
The primary objective was to evaluate the efficacy of apremilast. Analysis of
covariance (ANCOVA) was used to assess differences between treatment and placebo
arms for various clinical outcome measures. Baseline values were considered as
covariates to nullify any differences between groups.
232
Analyses on biomarkers were purely exploratory hence a simpler evaluation of
unpaired t-tests (ANOVA) or non-parametric Mann Whitney as appropriate. No
adjustment for baseline values were explicitly made, however the endpoint evaluated
was the percentage change from baseline. A p value <0.05 was considered significant.
RESULTS
Patient demographics and baseline characteristics
Fifty-five patients were screened (6 failing to demonstrate bone oedema on MRI) and
38 were enrolled into this study. With the exception of two patients (both receiving
apremilast), all others completed the study. The two withdrawals discontinued
treatment within 1 week of commencing due to non-serious adverse events and were
included in the safety population but not in the efficacy analysis. Hence, the efficacy
population consisted of 17 patients on apremilast and 19 on placebo.
Patient demographics and baseline characteristics in each group are shown in Table 1.
The study population was predominantly Caucasian and male (M:F=8:1). The mean
age was 42.95 years (range 27-67) and disease duration 19.5±11.01 years (range 2-
44). The majority of patients (33/36) were on stable doses of NSAIDs while the
remaining did not take any concomitant NSAID therapy during the trial period. Three
subjects had received prior anti-TNF therapy (placebo, 2; apremilast, 1).
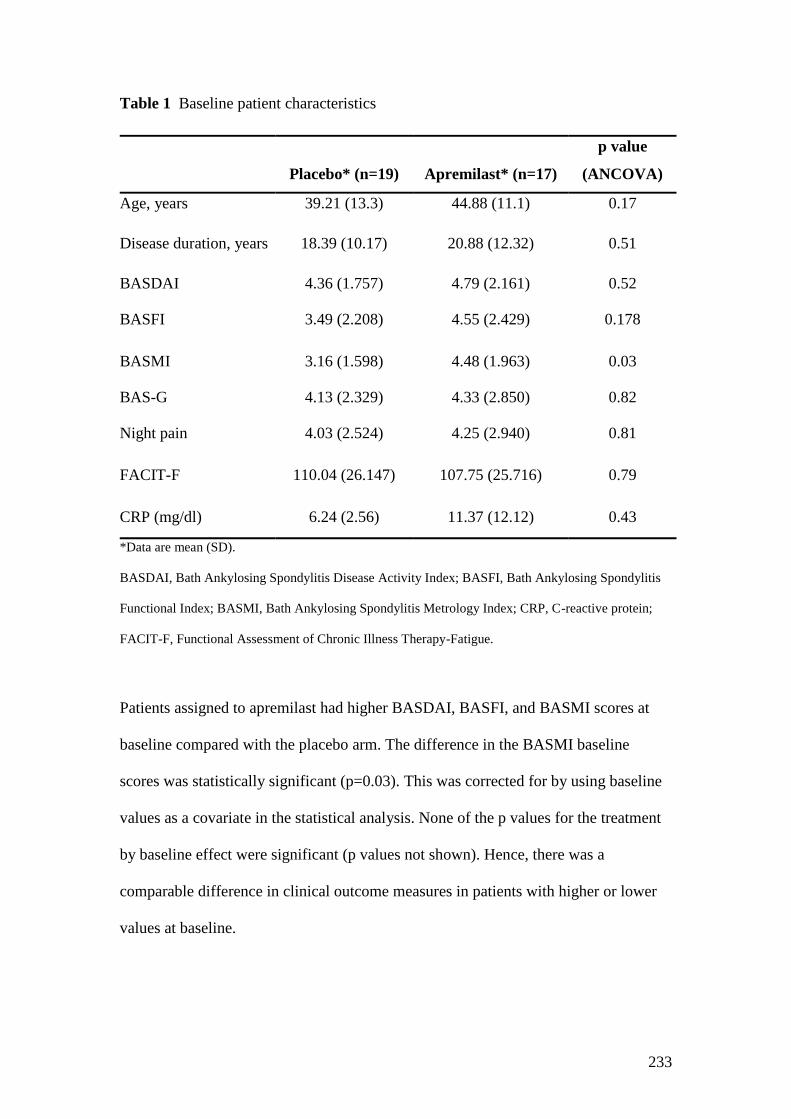
233
Table 1 Baseline patient characteristics
Placebo* (n=19) Apremilast* (n=17)
p value
(ANCOVA)
Age, years 39.21 (13.3) 44.88 (11.1) 0.17
Disease duration, years 18.39 (10.17) 20.88 (12.32) 0.51
BASDAI 4.36 (1.757) 4.79 (2.161) 0.52
BASFI 3.49 (2.208) 4.55 (2.429) 0.178
BASMI 3.16 (1.598) 4.48 (1.963) 0.03
BAS-G 4.13 (2.329) 4.33 (2.850) 0.82
Night pain 4.03 (2.524) 4.25 (2.940) 0.81
FACIT-F 110.04 (26.147) 107.75 (25.716) 0.79
CRP (mg/dl) 6.24 (2.56) 11.37 (12.12) 0.43
*Data are mean (SD).
BASDAI, Bath Ankylosing Spondylitis Disease Activity Index; BASFI, Bath Ankylosing Spondylitis
Functional Index; BASMI, Bath Ankylosing Spondylitis Metrology Index; CRP, C-reactive protein;
FACIT-F, Functional Assessment of Chronic Illness Therapy-Fatigue.
Patients assigned to apremilast had higher BASDAI, BASFI, and BASMI scores at
baseline compared with the placebo arm. The difference in the BASMI baseline
scores was statistically significant (p=0.03). This was corrected for by using baseline
values as a covariate in the statistical analysis. None of the p values for the treatment
by baseline effect were significant (p values not shown). Hence, there was a
comparable difference in clinical outcome measures in patients with higher or lower
values at baseline.
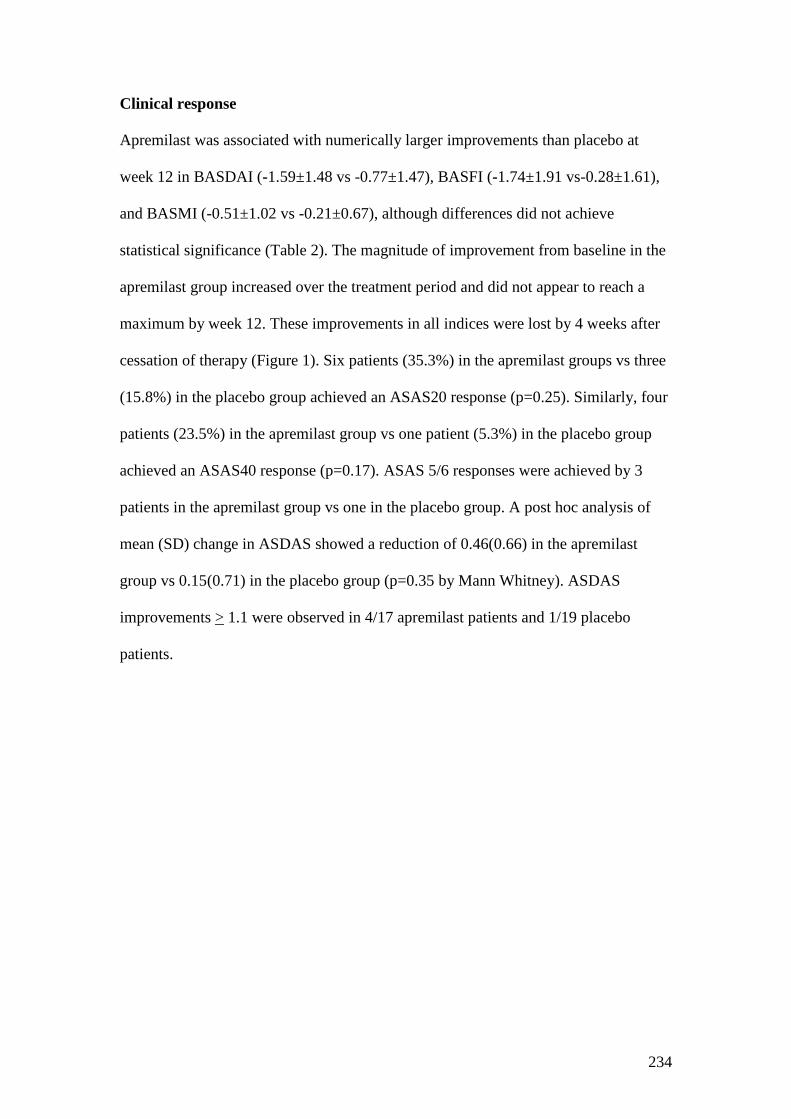
234
Clinical response
Apremilast was associated with numerically larger improvements than placebo at
week 12 in BASDAI (-1.59±1.48 vs -0.77±1.47), BASFI (-1.74±1.91 vs-0.28±1.61),
and BASMI (-0.51±1.02 vs -0.21±0.67), although differences did not achieve
statistical significance (Table 2). The magnitude of improvement from baseline in the
apremilast group increased over the treatment period and did not appear to reach a
maximum by week 12. These improvements in all indices were lost by 4 weeks after
cessation of therapy (Figure 1). Six patients (35.3%) in the apremilast groups vs three
(15.8%) in the placebo group achieved an ASAS20 response (p=0.25). Similarly, four
patients (23.5%) in the apremilast group vs one patient (5.3%) in the placebo group
achieved an ASAS40 response (p=0.17). ASAS 5/6 responses were achieved by 3
patients in the apremilast group vs one in the placebo group. A post hoc analysis of
mean (SD) change in ASDAS showed a reduction of 0.46(0.66) in the apremilast
group vs 0.15(0.71) in the placebo group (p=0.35 by Mann Whitney). ASDAS
improvements > 1.1 were observed in 4/17 apremilast patients and 1/19 placebo
patients.
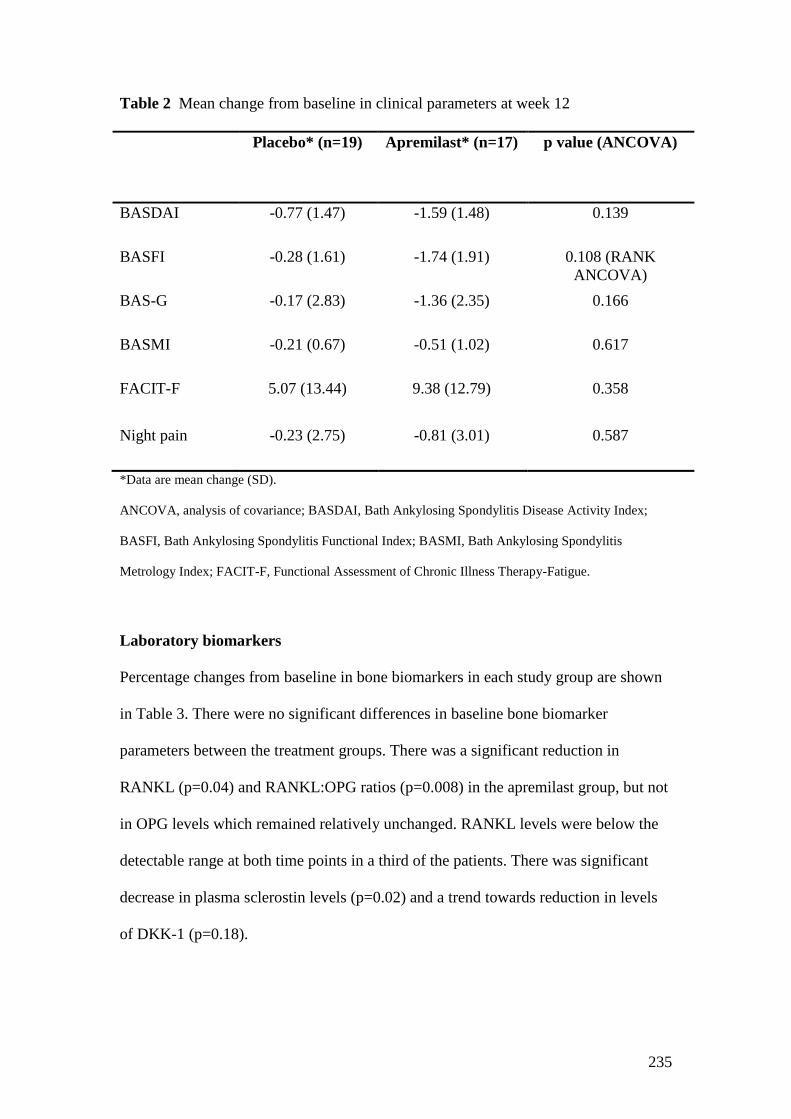
235
Table 2 Mean change from baseline in clinical parameters at week 12
Placebo* (n=19) Apremilast* (n=17) p value (ANCOVA)
BASDAI -0.77 (1.47) -1.59 (1.48) 0.139
BASFI -0.28 (1.61) -1.74 (1.91) 0.108 (RANK
ANCOVA)
BAS-G -0.17 (2.83) -1.36 (2.35) 0.166
BASMI -0.21 (0.67) -0.51 (1.02) 0.617
FACIT-F 5.07 (13.44) 9.38 (12.79) 0.358
Night pain -0.23 (2.75) -0.81 (3.01) 0.587
*Data are mean change (SD).
ANCOVA, analysis of covariance; BASDAI, Bath Ankylosing Spondylitis Disease Activity Index;
BASFI, Bath Ankylosing Spondylitis Functional Index; BASMI, Bath Ankylosing Spondylitis
Metrology Index; FACIT-F, Functional Assessment of Chronic Illness Therapy-Fatigue.
Laboratory biomarkers
Percentage changes from baseline in bone biomarkers in each study group are shown
in Table 3. There were no significant differences in baseline bone biomarker
parameters between the treatment groups. There was a significant reduction in
RANKL (p=0.04) and RANKL:OPG ratios (p=0.008) in the apremilast group, but not
in OPG levels which remained relatively unchanged. RANKL levels were below the
detectable range at both time points in a third of the patients. There was significant
decrease in plasma sclerostin levels (p=0.02) and a trend towards reduction in levels
of DKK-1 (p=0.18).
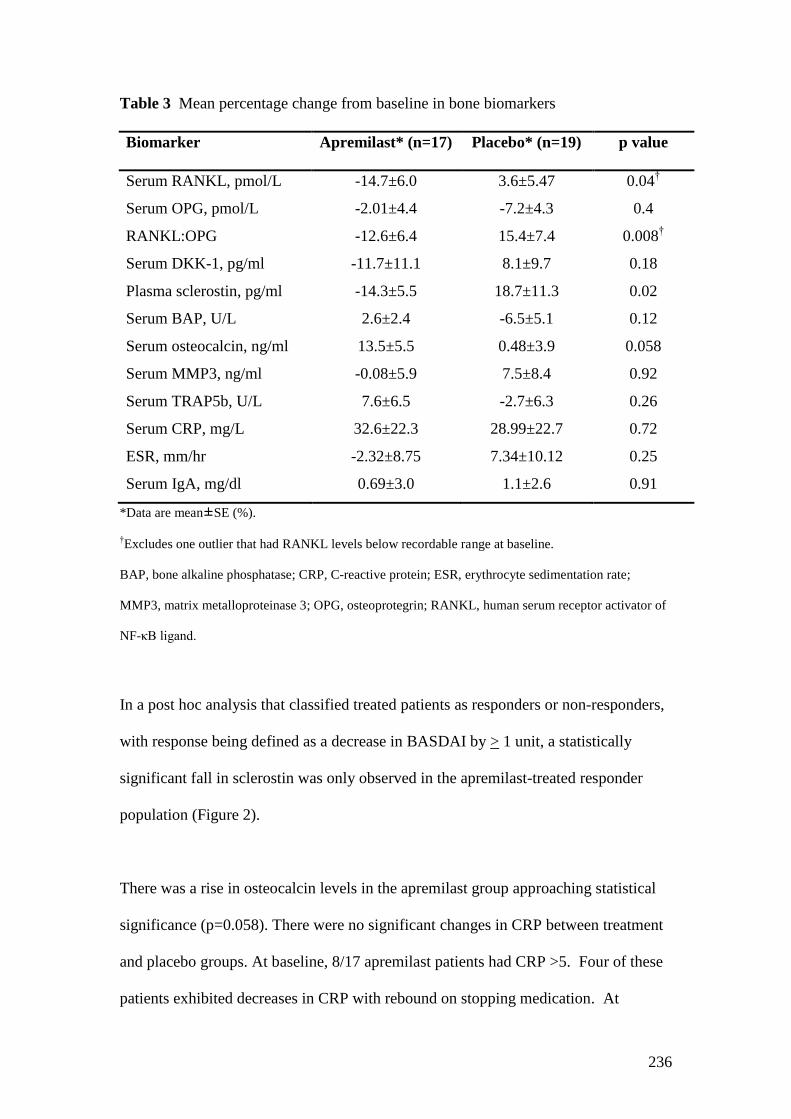
236
Table 3 Mean percentage change from baseline in bone biomarkers
Biomarker Apremilast* (n=17) Placebo* (n=19) p value
Serum RANKL, pmol/L -14.7±6.0 3.6±5.47 0.04†
Serum OPG, pmol/L -2.01±4.4 -7.2±4.3 0.4
RANKL:OPG -12.6±6.4 15.4±7.4 0.008†
Serum DKK-1, pg/ml -11.7±11.1 8.1±9.7 0.18
Plasma sclerostin, pg/ml -14.3±5.5 18.7±11.3 0.02
Serum BAP, U/L 2.6±2.4 -6.5±5.1 0.12
Serum osteocalcin, ng/ml 13.5±5.5 0.48±3.9 0.058
Serum MMP3, ng/ml -0.08±5.9 7.5±8.4 0.92
Serum TRAP5b, U/L 7.6±6.5 -2.7±6.3 0.26
Serum CRP, mg/L 32.6±22.3 28.99±22.7 0.72
ESR, mm/hr -2.32±8.75 7.34±10.12 0.25
Serum IgA, mg/dl 0.69±3.0 1.1±2.6 0.91
*Data are mean±SE (%).
†Excludes one outlier that had RANKL levels below recordable range at baseline.
BAP, bone alkaline phosphatase; CRP, C-reactive protein; ESR, erythrocyte sedimentation rate;
MMP3, matrix metalloproteinase 3; OPG, osteoprotegrin; RANKL, human serum receptor activator of
NF-κB ligand.
In a post hoc analysis that classified treated patients as responders or non-responders,
with response being defined as a decrease in BASDAI by > 1 unit, a statistically
significant fall in sclerostin was only observed in the apremilast-treated responder
population (Figure 2).
There was a rise in osteocalcin levels in the apremilast group approaching statistical
significance (p=0.058). There were no significant changes in CRP between treatment
and placebo groups. At baseline, 8/17 apremilast patients had CRP >5. Four of these
patients exhibited decreases in CRP with rebound on stopping medication. At
237
baseline, 8/19 placebo patients had CRP >5 of which all but two showed little change.
Of these two, one patient demonstrated a rise in CRP from 5 to 17 corresponding to
an increase in disease activity and the other showed an increase from 7.4 to 30
corresponding to an upper respiratory tract infection.
Safety data
The incidence of adverse events was similar in the two treatment arms at 17/19
(94.7%) in the apremilast and 18/19 (89.5%) in the placebo groups (Table 4). The
majority (68.4%) of all adverse events were classified as “mild” and no serious
adverse events were observed. Two apremilast patients withdrew from the study after
two to three doses of medication. The first discontinued due to diarrhoea, which
settled after stopping medication. The second patient developed poor concentration
and felt dazed after three doses with resolution on discontinuing treatment. Compared
with placebo, apremilast patients reported a higher incidence of headaches (26.3% vs
42.1%) and loose stools (10.5% vs 26.3%). Two apremilast patients developed
palpitations. One of these had sinus tachycardia and continued treatment with
spontaneous resolution of symptoms. The other had frequent ventricular ectopics
which resolved following medication withdrawal on study completion.

238
Table 4 Summary of treatment-emergent adverse events reported by two or more patients
Coded term Placebo* (n=19) Apremilast* (n=19)
Any
severity Mild Moderate Severe Missing
Any
severity Mild Moderate Severe Missing
Patients with AEs 17 (89.5) 13 (68.4) 3 (15.8) 0 1 (5.3) 18 (94.7) 13 (68.4) 4 (21.1) 0 1 (5.3)
Headache 5 (26.3) 5 (26.3) 0 0 0 8 (42.1) 7 (36.8) 1 ( 5.3) 0 0
URTI 6 (31.6) 6 (31.6) 0 0 0 6 (31.6) 5 (26.3) 0 0 1 (5.3)
Loose stools 2 (10.5) 2 (10.5) 0 0 0 5 (26.3) 5 (26.3) 0 0 0
Nausea 3 (15.8) 3 (15.8) 0 0 0 3 (15.8) 2 (10.5) 1 (5.3) 0 0
Diarrhoea 2 (10.5) 2 (10.5) 0 0 0 2 (10.5) 1 (5.3) 1 (5.3) 0 0
Flatulence 0 0 0 0 0 2 (10.5) 2 (10.5) 0 0 0
Raised serum
amylase
0 0 0 0 0 2 (10.5) 2 (10.5) 0 0 0
*Data are n (%)
AEs, adverse events; URTI, upper respiratory tract infection.
239
DISCUSSION
This exploratory pilot study is the first trial to investigate the effect of a PDE4
inhibitor, apremilast in AS. Although the primary endpoint was not met, Bath indices
showed trends towards responses over a 12 week treatment period. As expected, the
improvements in BASDAI, BASFI, and BAS-G were more marked compared with
the change in BASMI, which may have been due to higher baseline BASMI scores in
the apremilast group, as well as BASMI scores being generally more resistant to
change over short periods. It is noteworthy that the magnitude of reduction in disease
activity continued to increase in sequential measurements over 12 weeks, suggesting
that the maximal clinical response may not have been reached by that time point.
Cessation of medication led to rapid loss of improvement in Bath indices. This
observation may reflect patient bias. However, loss of response in apremilast-treated
patients was of greater magnitude than placebo patients, suggesting a possible
symptomatic benefit of apremilast and supporting the view that further studies are
warranted in AS. Similarly, at 12 weeks the proportions of patients achieving
ASAS20 (35% vs 16%) and ASAS40 (23.5 vs 5.3%), although greater in the
apremilast group, were not statistically distinct from placebo.
This study suggested that apremilast was well tolerated in the majority of patients.
The apremilast dose titration regimen over the first 5 days of treatment was designed
to optimise tolerability. Commonly observed adverse events were generally mild and
consistent with those reported for other phosphodiesterase inhibitors and previous
reports of apremilast,[25, 26] including nausea, diarrhoea/loose stools, and headaches.
No severe or serious adverse events were reported. There was no significant increase
in infection risk blood dyscrasias or abnormalities of liver function in the apremilast
240
group. Hence, from this small, short study, apremilast appears to have an acceptable
safety profile although long-term studies will be required to better characterise this.
Patients with AS may exhibit concurrent effects of bone resorption (eg, vertebral
osteopenia) and formation (eg, ligamentous ossification). It is therefore interesting to
note that our study suggests that apremilast may modulate certain biomarkers of bone
biology. Most published reports have studied bone biomarkers in AS after at least 24
weeks of treatment so we did not anticipate any statistically significant changes over
the 12 weeks of our study. This was largely true, except for serum RANKL and
plasma sclerostin both of which showed significant reduction with apremilast
treatment.
The binding of RANK to RANKL promotes osteoclast differentiation. RANKL
inhibition in arthritis models inhibits bone erosion[27] and denosumab, an inhibitor of
RANKL, has efficacy in osteoporosis.[28] In AS, the RANKL:OPG ratio is increased
and associated with reduced bone mineral density and radiological findings of active
inflammation.[29] Hence, successful treatment might be associated with a reduction
in this ratio and this is in keeping with our findings. However, levels of TRAP5b, a
marker of osteoclastic activity, did not show a corresponding fall in patients receiving
apremilast. This might be related to changes in osteoblast and osteoclast populations.
For example, PDE4 inhibition increases PGE2-induced cAMP production and
RANKL mRNA expression in murine osteoblasts in a manner directly proportional to
osteoclast formation in co-cultures of bone marrow cells and calvarial osteoblasts.[30]
241
Previous studies in AS reported low sclerostin levels to correlate with formation of
new syndesmophytes over 2 years.[31] Further, a recent report suggests that serum
sclerostin levels rise, but do not normalise, after 6 months of anti-TNF therapy.[32] It
is not currently known whether low sclerostin expression in AS has a causal
relationship to syndesmophyte formation or whether it is a response to it. In post-hoc
analyses, we observed significant reductions in plasma sclerostin in patients
responding to 12 weeks of apremilast. The clinical significance of this is uncertain.
DKK-1 is an inhibitory molecule regulating the Wnt pathway which controls
osteoblastogenesis. Blocking DKK-1 prevents inflammatory bone loss in hTNFtg
mice by stimulating osteoblast function[33] but also promotes ankylosis of sacroiliac
joints in the same model.[34] In AS patients, anti-TNF therapy is reported to increase
levels of DKK-1 without evidence of increased Wnt signalling, suggesting that DKK-
1 is dysfunctional in AS.[34] In the present study, there was a trend towards DKK-1
decrease on apremilast therapy. We also observed trends towards increases in
osteocalcin and BAP in the apremilast group suggestive of osteoblastic activity,
consistent with the changes observed in sclerostin and DDK-1 levels. However, the
longer term correlates of these findings are uncertain with respect to bone density or
syndesmophyte development. Larger, long-term studies with apremilast measuring
both bone density and imaging progression would be required to answer this question.
This pilot study has several limitations. Most notably it was likely underpowered to
detect a significant benefit of apremilast in AS patients because no information on an
effect size was available to aid in the study design. While the randomization process
included one unblinded pharmacist, this individual did not disclose any information to

242
investigators or patients, making bias unlikely. The long disease duration (~ 20 years)
of enrolled patients may have diminished the possibility to demonstrate symptomatic
improvement. Nonetheless, all subjects had symptomatically active AS and evidence
of disease activity on MRI. A further limitation was the short treatment duration
which may not have permitted the maximum therapeutic effect of apremilast to be
reached, a suggestion consistent with the incremental improvements in BASDAI and
BASFI during the treatment period. The relatively short nature of our study, together
with the differential and largely unknown long-term effects of certain bone
biomarkers, makes interpretation of the observed biomarker changes difficult. Any
conclusions on the impact of these changes in bone biomarkers should therefore be
made with extreme caution and further longer term studies with appropriate endpoints
are required to fully understand their clinical implications.
To summarize, although a small pilot study, these data suggest that apremilast may be
effective in AS. Given the current lack of effective oral DMARDs in AS, our findings
support the conduct of a suitably powered study of longer duration to further
investigate the role apremilast in axial inflammation and the management of AS.
Acknowledgments We would like to thank Ms Leslie Hastings and Ms. Amy Fox
for their assistance with nursing matters during the course of this clinical study. We
would also like to thank Dr Andrew Freiden and Ms Annette Winter for assistance
with data monitoring. Ms Winter also provided administrative support.
Competing interests EP [none]. SA [none]. EVR [none]. RW [none]. AK [none]. PC
[none]. EP [none]. MC [none]. CM [none]. PCT [PCT has received research grant
support from Celgene Corporation and has been an invited advisor to Celgene].
Funding The study was funded by an unrestricted grant from Celgene Corporation.

243
REFERENCES
1. van der Heijde D, Baraf HS, Ramos-Remus C, et al. Evaluation of the efficacy
of etoricoxib in ankylosing spondylitis: results of a fifty-two-week, randomized,
controlled study. Arthritis Rheum 2005;52:1205-15.
2. Dougados M, Gueguen A, Nakache JP, et al. Ankylosing spondylitis: what is
the optimum duration of a clinical study? A one year versus a 6 weeks non-
steroidal anti-inflammatory drug trial. Rheumatology (Oxford) 1999;38:235-44.
3. Braun J, Zochling J, Baraliakos X, et al. Efficacy of sulfasalazine in patients
with inflammatory back pain due to undifferentiated spondyloarthritis and early
ankylosing spondylitis: a multicentre randomised controlled trial. Ann Rheum
Dis 2006;65:1147-53.
4. Haibel H, Brandt HC, Song IH, et al. No efficacy of subcutaneous methotrexate
in active ankylosing spondylitis: a 16-week open-label trial. Ann Rheum Dis
2007;66:419-21.
5. Braun J, van den Berg R, Baraliakos X, et al. 2010 update of the
ASAS/EULAR recommendations for the management of ankylosing
spondylitis. Ann Rheum Dis 2011;70:896-904.
6. Zochling J, van der Heijde D, Burgos-Vargas R, et al. ASAS/EULAR
recommendations for the management of ankylosing spondylitis. Ann Rheum
Dis 2006;65:442-52.
7. Brandt J, Haibel H, Cornely D, et al. Successful treatment of active ankylosing
spondylitis with the anti-tumor necrosis factor alpha monoclonal antibody
infliximab. Arthritis Rheum 2000;43:1346-52.
8. Brandt J, Haibel H, Sieper J, et al. Infliximab treatment of severe ankylosing
spondylitis: one-year followup. Arthritis Rheum 2001;44:2936-7.
244
9. Brandt J, Khariouzov A, Listing J, et al. Six-month results of a double-blind,
placebo-controlled trial of etanercept treatment in patients with active
ankylosing spondylitis. Arthritis Rheum 2003;48:1667-75.
10. Lie E, van der Heijde D, Uhlig T, et al. Effectiveness of switching between TNF
inhibitors in ankylosing spondylitis: data from the NOR-DMARD register. Ann
Rheum Dis 2011;70:157-63.
11. van der Heijde D, Landewe R, Einstein S, et al. Radiographic progression of
ankylosing spondylitis after up to two years of treatment with etanercept.
Arthritis Rheum 2008;58:1324-31.
12. van der Heijde D, Landewe R, Baraliakos X, et al. Radiographic findings
following two years of infliximab therapy in patients with ankylosing
spondylitis. Arthritis Rheum 2008;58:3063-70.
13. van der Heijde D, Salonen D, Weissman BN, et al. Assessment of radiographic
progression in the spines of patients with ankylosing spondylitis treated with
adalimumab for up to 2 years. Arthritis Res Ther 2009;11:R127.
14. Baraliakos X, Haibel H, Listing J, et al. Radiographic progression in
ankylosing spondyylitis results after up to 8 years of infliximab treatment.
Arthritis Rheum 2011;63(Suppl).
15. Boniface K, Bak-Jensen KS, Li Y, et al. Prostaglandin E2 regulates Th17 cell
differentiation and function through cyclic AMP and EP2/EP4 receptor
signaling. J Exp Med 2009;206:535-48.
16. Claveau D, Chen SL, O'Keefe S, et al. Preferential inhibition of T helper 1, but
not T helper 2, cytokines in vitro by L-826,141 [4-[2-(3,4-
Bisdifluromethoxyphenyl)-2-[4-(1,1,1,3,3,3-hexafluoro-2-hydroxypropan- 2-yl)-
245
phenyl]-ethyl]3-methylpyridine-1-oxide], a potent and selective
phosphodiesterase 4 inhibitor. J Pharmacol Exp Ther 2004;310:752-60.
17. Seldon PM, Barnes PJ, Giembycz MA. Interleukin-10 does not mediate the
inhibitory effect of PDE-4 inhibitors and other cAMP-elevating drugs on
lipopolysaccharide-induced tumors necrosis factor-alpha generation from human
peripheral blood monocytes. Cell Biochem Biophys 1998;29:179-201.
18. Li X, Murray F, Koide N, et al. Divergent requirement for Galphas and cAMP
in the differentiation and inflammatory profile of distinct mouse Th subsets. J
Clin Invest 2012;122:963-73.
19. Liu J, Chen M, Wang X. Calcitonin gene-related peptide inhibits
lipopolysaccharide-induced interleukin-12 release from mouse peritoneal
macrophages, mediated by the cAMP pathway. Immunology 2000;101:61-7.
20. Persson E, Voznesensky OS, Huang YF, et al. Increased expression of
interleukin-6 by vasoactive intestinal peptide is associated with regulation of
CREB, AP-1 and C/EBP, but not NF-kappaB, in mouse calvarial osteoblasts.
Bone 2005;37:513-29.
21. Schafer PH, Parton A, Gandhi AK, et al. Apremilast, a cAMP
phosphodiesterase-4 inhibitor, demonstrates anti-inflammatory activity in vitro
and in a model of psoriasis. Br J Pharmacol 2010;159:842-55.
22. McCann FE, Palfreeman AC, Andrews M, et al. Apremilast, a novel PDE4
inhibitor, inhibits spontaneous production of tumour necrosis factor-alpha from
human rheumatoid synovial cells and ameliorates experimental arthritis.
Arthritis Res Ther 2010;12:R107.
23. Papp K, Cather J, Rosoph L, et al. The efficacy of apremilast, a
phosphodiesterase-4 inhibitor, in the treatment of moderate to severe psoriasis:
246
results of a phase 2 randomised study. Lancet 2012 Jun 28. [Epub ahead of
print].
24. Schett G, Wollenhaupt J, Papp K, et al. Oral apremilast is effective in the
treatment of subjects with active moderate to severe psoriatic arthritis: results of
a multicenter, multinational, randomized, double-blind, placebo-controlled,
parallel-group study. Arthritis Rheum 2012 Jun 21. [Epub ahead of print].
25. Schett G, Wollenhaupt J, Papp K, et al. Apremilast is active in the treatment of
psoriatic arthritis (PsA) [abstract]. Arthritis Rheum 2009;60(Suppl 10):1258.
26. Schett GA, Hu A, Stevens R. Oral apremilast is effective with and without
concomitant methotrexate therapy in the treatment of subjects with active
psoriatic arthritis [abstract 780]. Arthritis Rheum 2011;63(10 Suppl):S306-S307.
27. Schett G, Hayer S, Zwerina J, et al. Mechanisms of disease: the link between
RANKL and arthritic bone disease. Nat Clin Pract Rheumatol 2005;1:47-54.
28. Cummings SR, San MJ, McClung MR, et al. Denosumab for prevention of
fractures in postmenopausal women with osteoporosis. N Engl J Med
2009;361:756-65.
29. Kim HR, Lee SH, Kim HY. Elevated serum levels of soluble receptor activator
of nuclear factors-kappaB ligand (sRANKL) and reduced bone mineral density
in patients with ankylosing spondylitis (AS). Rheumatology (Oxford)
2006;45:1197-200.
30. Noh AL, Yang M, Lee JM, et al. Phosphodiesterase 3 and 4 negatively regulate
receptor activator of nuclear factor-kappaB ligand-mediated osteoclast
formation by prostaglandin E2. Biol Pharm Bull 2009;32(11) 1844—1848.
247
31. Appel H, Ruiz-Heiland G, Listing J, et al. Altered skeletal expression of
sclerostin and its link to radiographic progression in ankylosing spondylitis.
Arthritis Rheum 2009;60:3257-62.
32. Saad CGS, Ribeiro ACM, Moraes JCB, et al. Sclerostin as a marker of bone
formation in ankylosing spondylitis under anti-TNF therapy: a 12-month
longitudinal analysis [abstract 1647]. Arthritis Rheum 2011;63(Suppl 10):S644.
33. Heiland GR, Zwerina K, Baum W, et al. Neutralisation of Dkk-1 protects from
systemic bone loss during inflammation and reduces sclerostin expression. Ann
Rheum Dis 2010;69:2152-9.
34. Uderhardt S, Diarra D, Katzenbeisser J, et al. Blockade of Dickkopf (DKK)-1
induces fusion of sacroiliac joints. Ann Rheum Dis 2010;69:592-7.
35. Daoussis D, Liossis SN, Solomou EE, et al. Evidence that Dkk-1 is
dysfunctional in ankylosing spondylitis. Arthritis Rheum 2010;62:150-8.
248
Figure Legends
Figure 1. Mean absolute change in BASDAI over 12 weeks in AS patients
receiving apremilast (n=17) or placebo (n=19).
Figure 2. Study patients were classified as responders or non-responders with
response being defined as a decrease in BASDAI by at least 1 unit. Individual
patient change in plasma sclerostin levels over 12 weeks is depicted depending on
BASDAI response. A statistically significant fall in sclerostin was only observed
in the apremilast-treated responder population.