biology 3201 2016-17 - education.gov.nl.ca · #002 - henry gordon academy, cartwright grades: k-12...
TRANSCRIPT

Public Exam Course Results
Biology 3201
2016-17
#002 - Henry Gordon Academy, Cartwright Grades: K-12
NLESD - Labrador Region
Maintaining
Dynamic
Equilibrium
School
Region
Province
School
Region
Province
School
Region
Province
Genetic
Continuity
School
Region
Evolution,
Change and
Diversity
Reproductions/
Development
Province
Subtest
School
vs
Province
School
vs
Region
Final
Mark
School
vs
Province
School
vs
Region
Public
Exam
Mark
School
Region
Province
q q q q
q
q
q
q
q
q
q
q
52.0 50.7
6Number of Students
42.5
50.9
50.2
52.2
61.1
57.7
65.1
59.7
60.1
58.8
66.4
60.9
63.5 68.2
62.5 66.5
Biology 3201
0
10
20
30
40
50
60
70
80
90
100
5953 51
65
5752
Final MarkExam Mark
Average Mark, 2014-2017
2014 2015 2016 2017
1* The overall Public Exam is equated. Therefore, subtest scores may vary from the overall exam mark.
The school result may appear numerically the same as the district/province due to rounding. The arrow indicates a negligible difference.pq

Public Exam Course Results
Biology 3201
2016-17
#002 - Henry Gordon Academy, Cartwright Grades: K-12
NLESD - Labrador Region
Maintaining
Dynamic
Equilibrium
Reproductions/
Development
Genetic
Continuity
Evolution,
Change and
Diversity
-18
-16
-14
-12
-10
-8
-6
-4
-2
0
-1
-11-13
0
-11
-16
Final MarkExam Mark
2014 2015 2016
Difference from Provincial Mean, 2014-17
2017
0
10
20
30
40
50
60
70
80
90
100
43
53
43
78
66
51
70
40
50
23
42
52
2014 2015 2016 2017
4 Year Public Exam (Subtest) Mark Trend 2014-2017
2* The overall Public Exam is equated. Therefore, subtest scores may vary from the overall exam mark.
The school result may appear numerically the same as the district/province due to rounding. The arrow indicates a negligible difference.pq

Public Exam Course Results
Biology 3201
2016-17
#007 - Amos Comenius Memorial School, Hopedale Grades: K-12
NLESD - Labrador Region
Maintaining
Dynamic
Equilibrium
School
Region
Province
School
Region
Province
School
Region
Province
Genetic
Continuity
School
Region
Evolution,
Change and
Diversity
Reproductions/
Development
Province
Subtest
School
vs
Province
School
vs
Region
Final
Mark
School
vs
Province
School
vs
Region
Public
Exam
Mark
School
Region
Province
q q q q
q
q
q
q
q
q
q
q
3Number of Students
Biology 3201
Final MarkExam Mark
Average Mark, 2014-2017
2014 2015 2016 2017
School data with 5 or fewer
students withheld for reasons of
confidentiality.
School data with 5 or fewer
students withheld for reasons of
confidentiality.
School data with 5 or fewer students withheld for reasons of confidentiality.
3* The overall Public Exam is equated. Therefore, subtest scores may vary from the overall exam mark.
The school result may appear numerically the same as the district/province due to rounding. The arrow indicates a negligible difference.pq

Public Exam Course Results
Biology 3201
2016-17
#007 - Amos Comenius Memorial School, Hopedale Grades: K-12
NLESD - Labrador Region
Maintaining
Dynamic
Equilibrium
Reproductions/
Development
Genetic
Continuity
Evolution,
Change and
Diversity
Final MarkExam Mark
2014 2015 2016
Difference from Provincial Mean, 2014-17
2017
2014 2015 2016 2017
4 Year Public Exam (Subtest) Mark Trend 2014-2017
School data with 5 or fewer students withheld for reasons of confidentiality.
School data with 5 or fewer students withheld for reasons of confidentiality.
4* The overall Public Exam is equated. Therefore, subtest scores may vary from the overall exam mark.
The school result may appear numerically the same as the district/province due to rounding. The arrow indicates a negligible difference.pq

Public Exam Course Results
Biology 3201
2016-17
#010 - Menihek High School, Labrador City Grades: 8-12
NLESD - Labrador Region
Maintaining
Dynamic
Equilibrium
School
Region
Province
School
Region
Province
School
Region
Province
Genetic
Continuity
School
Region
Evolution,
Change and
Diversity
Reproductions/
Development
Province
Subtest
School
vs
Province
School
vs
Region
Final
Mark
School
vs
Province
School
vs
Region
Public
Exam
Mark
School
Region
Province
p p p p
p
p
p
p
p
p
p
p
70.4 67.6
69Number of Students
69.1
61.7
70.8
63.2
61.1
57.7
65.1
59.7
60.1
58.8
66.4
60.9
63.5 68.2
62.5 66.5
Biology 3201
0
10
20
30
40
50
60
70
80
90
100
58 5963
6862 64 66
70
Final MarkExam Mark
Average Mark, 2014-2017
2014 2015 2016 2017
5* The overall Public Exam is equated. Therefore, subtest scores may vary from the overall exam mark.
The school result may appear numerically the same as the district/province due to rounding. The arrow indicates a negligible difference.pq

Public Exam Course Results
Biology 3201
2016-17
#010 - Menihek High School, Labrador City Grades: 8-12
NLESD - Labrador Region
Maintaining
Dynamic
Equilibrium
Reproductions/
Development
Genetic
Continuity
Evolution,
Change and
Diversity
-6
-4
-2
0
2
4
6
-3
-4
-1
4
-3 -3
-2
2
Final MarkExam Mark
2014 2015 2016
Difference from Provincial Mean, 2014-17
2017
0
10
20
30
40
50
60
70
80
90
100
53
7064
69
6260 58
62 6257
61
71
4952
5963
2014 2015 2016 2017
4 Year Public Exam (Subtest) Mark Trend 2014-2017
6* The overall Public Exam is equated. Therefore, subtest scores may vary from the overall exam mark.
The school result may appear numerically the same as the district/province due to rounding. The arrow indicates a negligible difference.pq

Public Exam Course Results
Biology 3201
2016-17
#012 - J.C. Erhardt Memorial School, Makkovik Grades: K-12
NLESD - Labrador Region
Maintaining
Dynamic
Equilibrium
School
Region
Province
School
Region
Province
School
Region
Province
Genetic
Continuity
School
Region
Evolution,
Change and
Diversity
Reproductions/
Development
Province
Subtest
School
vs
Province
School
vs
Region
Final
Mark
School
vs
Province
School
vs
Region
Public
Exam
Mark
School
Region
Province
q q q q
q
p
p
p
p
q
q
q
4Number of Students
Biology 3201
Final MarkExam Mark
Average Mark, 2014-2017
2014 2015 2016 2017
School data with 5 or fewer
students withheld for reasons of
confidentiality.
School data with 5 or fewer
students withheld for reasons of
confidentiality.
School data with 5 or fewer students withheld for reasons of confidentiality.
7* The overall Public Exam is equated. Therefore, subtest scores may vary from the overall exam mark.
The school result may appear numerically the same as the district/province due to rounding. The arrow indicates a negligible difference.pq

Public Exam Course Results
Biology 3201
2016-17
#012 - J.C. Erhardt Memorial School, Makkovik Grades: K-12
NLESD - Labrador Region
Maintaining
Dynamic
Equilibrium
Reproductions/
Development
Genetic
Continuity
Evolution,
Change and
Diversity
Final MarkExam Mark
2014 2015 2016
Difference from Provincial Mean, 2014-17
2017
2014 2015 2016 2017
4 Year Public Exam (Subtest) Mark Trend 2014-2017
School data with 5 or fewer students withheld for reasons of confidentiality.
School data with 5 or fewer students withheld for reasons of confidentiality.
8* The overall Public Exam is equated. Therefore, subtest scores may vary from the overall exam mark.
The school result may appear numerically the same as the district/province due to rounding. The arrow indicates a negligible difference.pq

Public Exam Course Results
Biology 3201
2016-17
#014 - Jens Haven Memorial, Nain Grades: K-12
NLESD - Labrador Region
Maintaining
Dynamic
Equilibrium
School
Region
Province
School
Region
Province
School
Region
Province
Genetic
Continuity
School
Region
Evolution,
Change and
Diversity
Reproductions/
Development
Province
Subtest
School
vs
Province
School
vs
Region
Final
Mark
School
vs
Province
School
vs
Region
Public
Exam
Mark
School
Region
Province
p p p p
p
p
p
p
p
p
p
p
3Number of Students
Biology 3201
Final MarkExam Mark
Average Mark, 2014-2017
2014 2015 2016 2017
School data with 5 or fewer
students withheld for reasons of
confidentiality.
School data with 5 or fewer
students withheld for reasons of
confidentiality.
School data with 5 or fewer students withheld for reasons of confidentiality.
9* The overall Public Exam is equated. Therefore, subtest scores may vary from the overall exam mark.
The school result may appear numerically the same as the district/province due to rounding. The arrow indicates a negligible difference.pq

Public Exam Course Results
Biology 3201
2016-17
#014 - Jens Haven Memorial, Nain Grades: K-12
NLESD - Labrador Region
Maintaining
Dynamic
Equilibrium
Reproductions/
Development
Genetic
Continuity
Evolution,
Change and
Diversity
Final MarkExam Mark
2014 2015 2016
Difference from Provincial Mean, 2014-17
2017
2014 2015 2016 2017
4 Year Public Exam (Subtest) Mark Trend 2014-2017
School data with 5 or fewer students withheld for reasons of confidentiality.
School data with 5 or fewer students withheld for reasons of confidentiality.
10* The overall Public Exam is equated. Therefore, subtest scores may vary from the overall exam mark.
The school result may appear numerically the same as the district/province due to rounding. The arrow indicates a negligible difference.pq

Public Exam Course Results
Biology 3201
2016-17
#017 - Northern Lights Academy, Rigolet Grades: K-12
NLESD - Labrador Region
Maintaining
Dynamic
Equilibrium
School
Region
Province
School
Region
Province
School
Region
Province
Genetic
Continuity
School
Region
Evolution,
Change and
Diversity
Reproductions/
Development
Province
Subtest
School
vs
Province
School
vs
Region
Final
Mark
School
vs
Province
School
vs
Region
Public
Exam
Mark
School
Region
Province
q q q q
q
q
p
p
p
p
q
q
3Number of Students
Biology 3201
Final MarkExam Mark
Average Mark, 2014-2017
2014 2015 2016 2017
School data with 5 or fewer
students withheld for reasons of
confidentiality.
School data with 5 or fewer
students withheld for reasons of
confidentiality.
School data with 5 or fewer students withheld for reasons of confidentiality.
11* The overall Public Exam is equated. Therefore, subtest scores may vary from the overall exam mark.
The school result may appear numerically the same as the district/province due to rounding. The arrow indicates a negligible difference.pq

Public Exam Course Results
Biology 3201
2016-17
#017 - Northern Lights Academy, Rigolet Grades: K-12
NLESD - Labrador Region
Maintaining
Dynamic
Equilibrium
Reproductions/
Development
Genetic
Continuity
Evolution,
Change and
Diversity
Final MarkExam Mark
2014 2015 2016
Difference from Provincial Mean, 2014-17
2017
2014 2015 2016 2017
4 Year Public Exam (Subtest) Mark Trend 2014-2017
School data with 5 or fewer students withheld for reasons of confidentiality.
School data with 5 or fewer students withheld for reasons of confidentiality.
12* The overall Public Exam is equated. Therefore, subtest scores may vary from the overall exam mark.
The school result may appear numerically the same as the district/province due to rounding. The arrow indicates a negligible difference.pq

Public Exam Course Results
Biology 3201
2016-17
#040 - St. Mary's AG, Mary's Harbour Grades: K-12
NLESD - Labrador Region
Maintaining
Dynamic
Equilibrium
School
Region
Province
School
Region
Province
School
Region
Province
Genetic
Continuity
School
Region
Evolution,
Change and
Diversity
Reproductions/
Development
Province
Subtest
School
vs
Province
School
vs
Region
Final
Mark
School
vs
Province
School
vs
Region
Public
Exam
Mark
School
Region
Province
q q q q
q
q
q
q
q
q
q
q
2Number of Students
Biology 3201
Final MarkExam Mark
Average Mark, 2014-2017
2014 2015 2016 2017
School data with 5 or fewer
students withheld for reasons of
confidentiality.
School data with 5 or fewer
students withheld for reasons of
confidentiality.
School data with 5 or fewer students withheld for reasons of confidentiality.
13* The overall Public Exam is equated. Therefore, subtest scores may vary from the overall exam mark.
The school result may appear numerically the same as the district/province due to rounding. The arrow indicates a negligible difference.pq

Public Exam Course Results
Biology 3201
2016-17
#040 - St. Mary's AG, Mary's Harbour Grades: K-12
NLESD - Labrador Region
Maintaining
Dynamic
Equilibrium
Reproductions/
Development
Genetic
Continuity
Evolution,
Change and
Diversity
Final MarkExam Mark
2014 2015 2016
Difference from Provincial Mean, 2014-17
2017
2014 2015 2016 2017
4 Year Public Exam (Subtest) Mark Trend 2014-2017
School data with 5 or fewer students withheld for reasons of confidentiality.
School data with 5 or fewer students withheld for reasons of confidentiality.
14* The overall Public Exam is equated. Therefore, subtest scores may vary from the overall exam mark.
The school result may appear numerically the same as the district/province due to rounding. The arrow indicates a negligible difference.pq

Public Exam Course Results
Biology 3201
2016-17
#046 - Bayside Academy, Port Hope Simpson Grades: K-12
NLESD - Labrador Region
Maintaining
Dynamic
Equilibrium
School
Region
Province
School
Region
Province
School
Region
Province
Genetic
Continuity
School
Region
Evolution,
Change and
Diversity
Reproductions/
Development
Province
Subtest
School
vs
Province
School
vs
Region
Final
Mark
School
vs
Province
School
vs
Region
Public
Exam
Mark
School
Region
Province
q q q q
q
q
q
q
q
q
q
q
61.7 57.6
11Number of Students
51.8
50.5
61.2
59.1
61.1
57.7
65.1
59.7
60.1
58.8
66.4
60.9
63.5 68.2
62.5 66.5
Biology 3201
0
10
20
30
40
50
60
70
80
90
100
60 58
6562
Final MarkExam Mark
Average Mark, 2014-2017
2014 2015 2016 2017
15* The overall Public Exam is equated. Therefore, subtest scores may vary from the overall exam mark.
The school result may appear numerically the same as the district/province due to rounding. The arrow indicates a negligible difference.pq

Public Exam Course Results
Biology 3201
2016-17
#046 - Bayside Academy, Port Hope Simpson Grades: K-12
NLESD - Labrador Region
Maintaining
Dynamic
Equilibrium
Reproductions/
Development
Genetic
Continuity
Evolution,
Change and
Diversity
-7
-6
-5
-4
-3
-2
-1
0
-4
-6
-2
-7
Final MarkExam Mark
2014 2015 2016
Difference from Provincial Mean, 2014-17
2017
0
10
20
30
40
50
60
70
80
90
100
64
52
62
51
63 61
46
59
2014 2015 2016 2017
4 Year Public Exam (Subtest) Mark Trend 2014-2017
16* The overall Public Exam is equated. Therefore, subtest scores may vary from the overall exam mark.
The school result may appear numerically the same as the district/province due to rounding. The arrow indicates a negligible difference.pq

Public Exam Course Results
Biology 3201
2016-17
#054 - St. Lewis Academy, St. Lewis Grades: K-12
NLESD - Labrador Region
Maintaining
Dynamic
Equilibrium
School
Region
Province
School
Region
Province
School
Region
Province
Genetic
Continuity
School
Region
Evolution,
Change and
Diversity
Reproductions/
Development
Province
Subtest
School
vs
Province
School
vs
Region
Final
Mark
School
vs
Province
School
vs
Region
Public
Exam
Mark
School
Region
Province
q q p p
q
q
p
p
p
p
q
q
2Number of Students
Biology 3201
Final MarkExam Mark
Average Mark, 2014-2017
2014 2015 2016 2017
School data with 5 or fewer
students withheld for reasons of
confidentiality.
School data with 5 or fewer
students withheld for reasons of
confidentiality.
School data with 5 or fewer students withheld for reasons of confidentiality.
17* The overall Public Exam is equated. Therefore, subtest scores may vary from the overall exam mark.
The school result may appear numerically the same as the district/province due to rounding. The arrow indicates a negligible difference.pq

Public Exam Course Results
Biology 3201
2016-17
#054 - St. Lewis Academy, St. Lewis Grades: K-12
NLESD - Labrador Region
Maintaining
Dynamic
Equilibrium
Reproductions/
Development
Genetic
Continuity
Evolution,
Change and
Diversity
Final MarkExam Mark
2014 2015 2016
Difference from Provincial Mean, 2014-17
2017
2014 2015 2016 2017
4 Year Public Exam (Subtest) Mark Trend 2014-2017
School data with 5 or fewer students withheld for reasons of confidentiality.
School data with 5 or fewer students withheld for reasons of confidentiality.
18* The overall Public Exam is equated. Therefore, subtest scores may vary from the overall exam mark.
The school result may appear numerically the same as the district/province due to rounding. The arrow indicates a negligible difference.pq
Public Exam Course Results
Biology 3201
2016-17
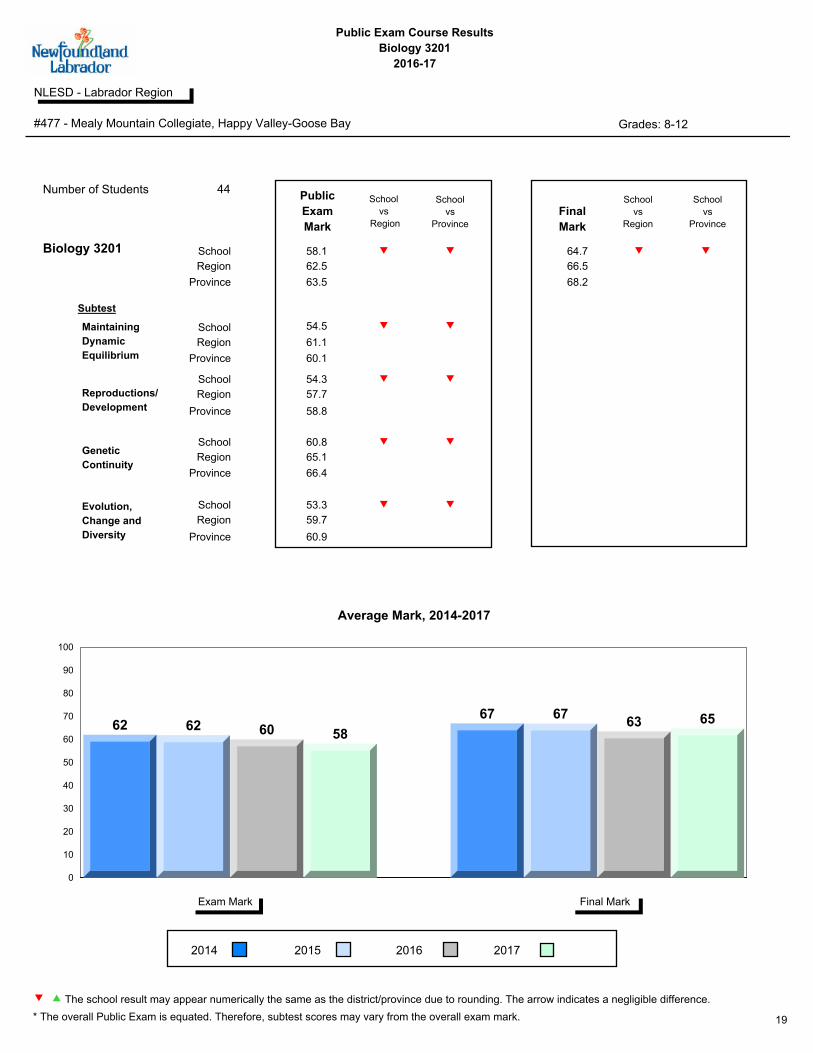
#477 - Mealy Mountain Collegiate, Happy Valley-Goose Bay Grades: 8-12
NLESD - Labrador Region
Maintaining
Dynamic
Equilibrium
School
Region
Province
School
Region
Province
School
Region
Province
Genetic
Continuity
School
Region
Evolution,
Change and
Diversity
Reproductions/
Development
Province
Subtest
School
vs
Province
School
vs
Region
Final
Mark
School
vs
Province
School
vs
Region
Public
Exam
Mark
School
Region
Province
q q q q
q
q
q
q
q
q
q
q
64.7 58.1
44Number of Students
54.5
54.3
60.8
53.3
61.1
57.7
65.1
59.7
60.1
58.8
66.4
60.9
63.5 68.2
62.5 66.5
Biology 3201
0
10
20
30
40
50
60
70
80
90
100
62 62 60 58
67 6763 65
Final MarkExam Mark
Average Mark, 2014-2017
2014 2015 2016 2017
19* The overall Public Exam is equated. Therefore, subtest scores may vary from the overall exam mark.
The school result may appear numerically the same as the district/province due to rounding. The arrow indicates a negligible difference.pq
Public Exam Course Results
Biology 3201
2016-17
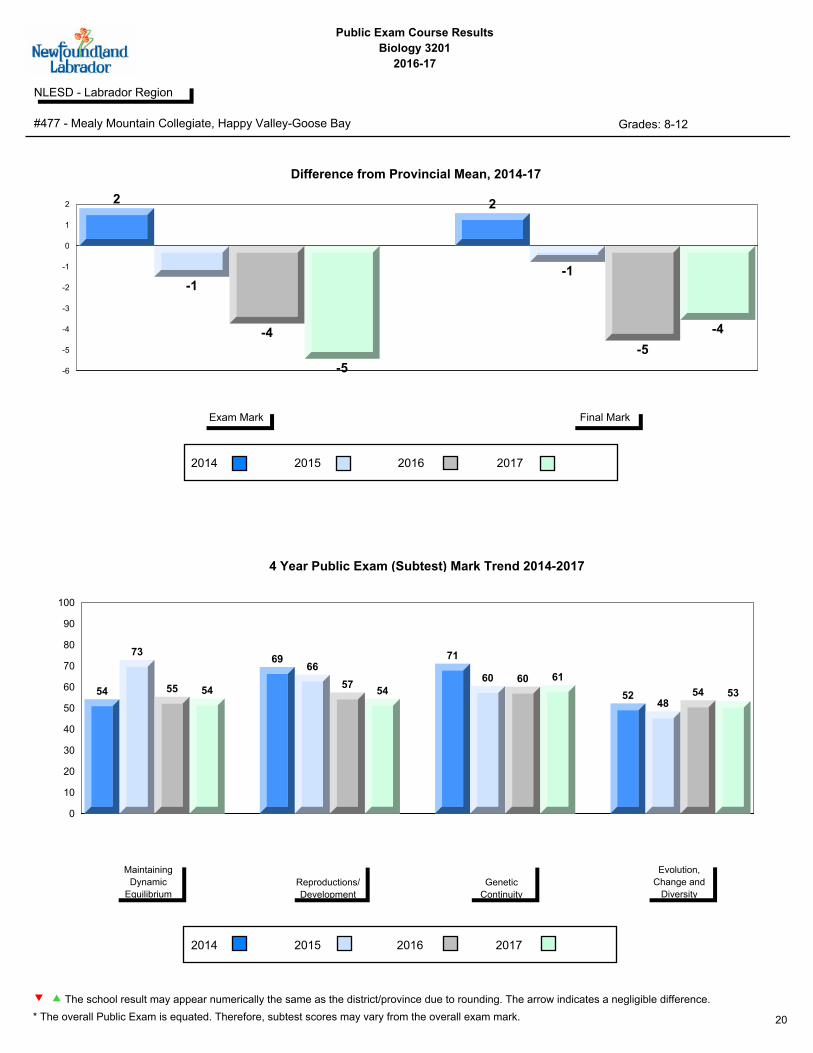
#477 - Mealy Mountain Collegiate, Happy Valley-Goose Bay Grades: 8-12
NLESD - Labrador Region
Maintaining
Dynamic
Equilibrium
Reproductions/
Development
Genetic
Continuity
Evolution,
Change and
Diversity
-6
-5
-4
-3
-2
-1
0
1
2 2
-1
-4
-5
2
-1
-5
-4
Final MarkExam Mark
2014 2015 2016
Difference from Provincial Mean, 2014-17
2017
0
10
20
30
40
50
60
70
80
90
100
54
73
55 54
6966
5754
71
60 60 61
5248
54 53
2014 2015 2016 2017
4 Year Public Exam (Subtest) Mark Trend 2014-2017
20* The overall Public Exam is equated. Therefore, subtest scores may vary from the overall exam mark.
The school result may appear numerically the same as the district/province due to rounding. The arrow indicates a negligible difference.pq

Public Exam Course Results
Biology 3201
2016-17
#487 - Labrador Straits Academy, L'Anse au Loup Grades: K-12
NLESD - Labrador Region
Maintaining
Dynamic
Equilibrium
School
Region
Province
School
Region
Province
School
Region
Province
Genetic
Continuity
School
Region
Evolution,
Change and
Diversity
Reproductions/
Development
Province
Subtest
School
vs
Province
School
vs
Region
Final
Mark
School
vs
Province
School
vs
Region
Public
Exam
Mark
School
Region
Province
p q p q
q
q
p
p p
q
q
q
67.3 63.3
7Number of Students
60.0
52.4
66.4
72.9
61.1
57.7
65.1
59.7
60.1
58.8
66.4
60.9
63.5 68.2
62.5 66.5
Biology 3201
0
10
20
30
40
50
60
70
80
90
100
59 5963 65 62
67
Final MarkExam Mark
Average Mark, 2014-2017
2014 2015 2016 2017
21* The overall Public Exam is equated. Therefore, subtest scores may vary from the overall exam mark.
The school result may appear numerically the same as the district/province due to rounding. The arrow indicates a negligible difference.pq

Public Exam Course Results
Biology 3201
2016-17
#487 - Labrador Straits Academy, L'Anse au Loup Grades: K-12
NLESD - Labrador Region
Maintaining
Dynamic
Equilibrium
Reproductions/
Development
Genetic
Continuity
Evolution,
Change and
Diversity
-6
-5
-4
-3
-2
-1
0
-1
-4
0-1
-5
-1
Final MarkExam Mark
2014 2015 2016
Difference from Provincial Mean, 2014-17
2017
0
10
20
30
40
50
60
70
80
90
100
52
80
60 6064
52
66
53
66
49
41
73
2014 2015 2016 2017
4 Year Public Exam (Subtest) Mark Trend 2014-2017
22* The overall Public Exam is equated. Therefore, subtest scores may vary from the overall exam mark.
The school result may appear numerically the same as the district/province due to rounding. The arrow indicates a negligible difference.pq

Public Exam Course Results
Biology 3201
2016-17
#024 - James Cook Memorial, Cook's Harbour Grades: K-1,5,10-12
NLESD - Western Region
Maintaining
Dynamic
Equilibrium
School
Region
Province
School
Region
Province
School
Region
Province
Genetic
Continuity
School
Region
Evolution,
Change and
Diversity
Reproductions/
Development
Province
Subtest
School
vs
Province
School
vs
Region
Final
Mark
School
vs
Province
School
vs
Region
Public
Exam
Mark
School
Region
Province
p p p p
p
p
p
p
p
p
p
p
4Number of Students
Biology 3201
Final MarkExam Mark
Average Mark, 2014-2017
2014 2015 2016 2017
School data with 5 or fewer
students withheld for reasons of
confidentiality.
School data with 5 or fewer
students withheld for reasons of
confidentiality.
School data with 5 or fewer students withheld for reasons of confidentiality.
23* The overall Public Exam is equated. Therefore, subtest scores may vary from the overall exam mark.
The school result may appear numerically the same as the district/province due to rounding. The arrow indicates a negligible difference.pq

Public Exam Course Results
Biology 3201
2016-17
#024 - James Cook Memorial, Cook's Harbour Grades: K-1,5,10-12
NLESD - Western Region
Maintaining
Dynamic
Equilibrium
Reproductions/
Development
Genetic
Continuity
Evolution,
Change and
Diversity
Final MarkExam Mark
2014 2015 2016
Difference from Provincial Mean, 2014-17
2017
2014 2015 2016 2017
4 Year Public Exam (Subtest) Mark Trend 2014-2017
School data with 5 or fewer students withheld for reasons of confidentiality.
School data with 5 or fewer students withheld for reasons of confidentiality.
24* The overall Public Exam is equated. Therefore, subtest scores may vary from the overall exam mark.
The school result may appear numerically the same as the district/province due to rounding. The arrow indicates a negligible difference.pq

Public Exam Course Results
Biology 3201
2016-17
#027 - Canon Richards Memorial Academy, Flower's Cove Grades: K-12
NLESD - Western Region
Maintaining
Dynamic
Equilibrium
School
Region
Province
School
Region
Province
School
Region
Province
Genetic
Continuity
School
Region
Evolution,
Change and
Diversity
Reproductions/
Development
Province
Subtest
School
vs
Province
School
vs
Region
Final
Mark
School
vs
Province
School
vs
Region
Public
Exam
Mark
School
Region
Province
q q q q
q
q
q
q
q
q
q
q
65.9 58.9
20Number of Students
55.8
55.4
59.9
58.3
61.5
60.7
68.3
61.5
60.1
58.8
66.4
60.9
63.5 68.2
64.8 68.7
Biology 3201
0
10
20
30
40
50
60
70
80
90
100
5259 59
66
Final MarkExam Mark
Average Mark, 2014-2017
2014 2015 2016 2017
25* The overall Public Exam is equated. Therefore, subtest scores may vary from the overall exam mark.
The school result may appear numerically the same as the district/province due to rounding. The arrow indicates a negligible difference.pq

Public Exam Course Results
Biology 3201
2016-17
#027 - Canon Richards Memorial Academy, Flower's Cove Grades: K-12
NLESD - Western Region
Maintaining
Dynamic
Equilibrium
Reproductions/
Development
Genetic
Continuity
Evolution,
Change and
Diversity
-12
-10
-8
-6
-4
-2
0
-11
-5
-9
-2
Final MarkExam Mark
2014 2015 2016
Difference from Provincial Mean, 2014-17
2017
0
10
20
30
40
50
60
70
80
90
100
63
56 53 5551
60
39
58
2014 2015 2016 2017
4 Year Public Exam (Subtest) Mark Trend 2014-2017
26* The overall Public Exam is equated. Therefore, subtest scores may vary from the overall exam mark.
The school result may appear numerically the same as the district/province due to rounding. The arrow indicates a negligible difference.pq

Public Exam Course Results
Biology 3201
2016-17
#072 - Holy Cross All Grade School, Daniel's Harbour Grades: K-4,6-12
NLESD - Western Region
Maintaining
Dynamic
Equilibrium
School
Region
Province
School
Region
Province
School
Region
Province
Genetic
Continuity
School
Region
Evolution,
Change and
Diversity
Reproductions/
Development
Province
Subtest
School
vs
Province
School
vs
Region
Final
Mark
School
vs
Province
School
vs
Region
Public
Exam
Mark
School
Region
Province
q q q q
q
q
q
q
q
q
q
q
2Number of Students
Biology 3201
Final MarkExam Mark
Average Mark, 2014-2017
2014 2015 2016 2017
School data with 5 or fewer
students withheld for reasons of
confidentiality.
School data with 5 or fewer
students withheld for reasons of
confidentiality.
School data with 5 or fewer students withheld for reasons of confidentiality.
27* The overall Public Exam is equated. Therefore, subtest scores may vary from the overall exam mark.
The school result may appear numerically the same as the district/province due to rounding. The arrow indicates a negligible difference.pq

Public Exam Course Results
Biology 3201
2016-17
#072 - Holy Cross All Grade School, Daniel's Harbour Grades: K-4,6-12
NLESD - Western Region
Maintaining
Dynamic
Equilibrium
Reproductions/
Development
Genetic
Continuity
Evolution,
Change and
Diversity
Final MarkExam Mark
2014 2015 2016
Difference from Provincial Mean, 2014-17
2017
2014 2015 2016 2017
4 Year Public Exam (Subtest) Mark Trend 2014-2017
School data with 5 or fewer students withheld for reasons of confidentiality.
School data with 5 or fewer students withheld for reasons of confidentiality.
28* The overall Public Exam is equated. Therefore, subtest scores may vary from the overall exam mark.
The school result may appear numerically the same as the district/province due to rounding. The arrow indicates a negligible difference.pq
Public Exam Course Results
Biology 3201
2016-17
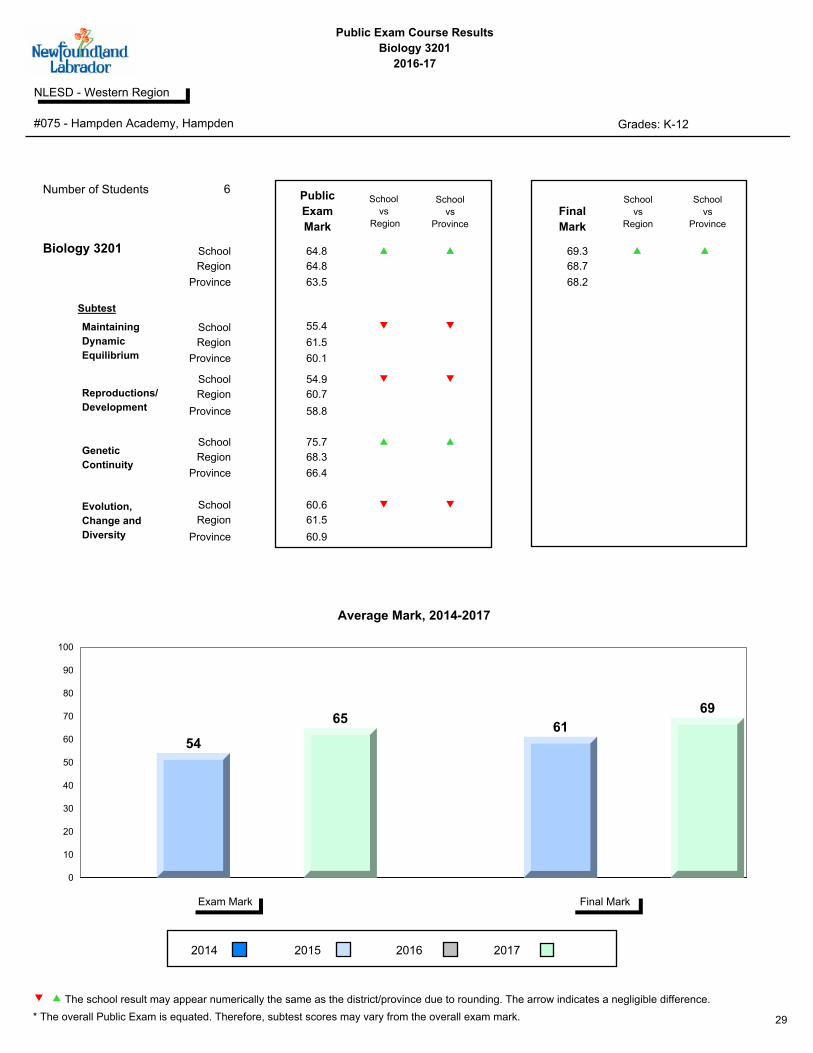
#075 - Hampden Academy, Hampden Grades: K-12
NLESD - Western Region
Maintaining
Dynamic
Equilibrium
School
Region
Province
School
Region
Province
School
Region
Province
Genetic
Continuity
School
Region
Evolution,
Change and
Diversity
Reproductions/
Development
Province
Subtest
School
vs
Province
School
vs
Region
Final
Mark
School
vs
Province
School
vs
Region
Public
Exam
Mark
School
Region
Province
p p p p
q
q
q
p p
q
q
q
69.3 64.8
6Number of Students
55.4
54.9
75.7
60.6
61.5
60.7
68.3
61.5
60.1
58.8
66.4
60.9
63.5 68.2
64.8 68.7
Biology 3201
0
10
20
30
40
50
60
70
80
90
100
54
6561
69
Final MarkExam Mark
Average Mark, 2014-2017
2014 2015 2016 2017
29* The overall Public Exam is equated. Therefore, subtest scores may vary from the overall exam mark.
The school result may appear numerically the same as the district/province due to rounding. The arrow indicates a negligible difference.pq

Public Exam Course Results
Biology 3201
2016-17
#075 - Hampden Academy, Hampden Grades: K-12
NLESD - Western Region
Maintaining
Dynamic
Equilibrium
Reproductions/
Development
Genetic
Continuity
Evolution,
Change and
Diversity
-10
-8
-6
-4
-2
0
2
-9
1
-6
1
Final MarkExam Mark
2014 2015 2016
Difference from Provincial Mean, 2014-17
2017
0
10
20
30
40
50
60
70
80
90
100
64
55 54 55 55
76
44
61
2014 2015 2016 2017
4 Year Public Exam (Subtest) Mark Trend 2014-2017
30* The overall Public Exam is equated. Therefore, subtest scores may vary from the overall exam mark.
The school result may appear numerically the same as the district/province due to rounding. The arrow indicates a negligible difference.pq

Public Exam Course Results
Biology 3201
2016-17
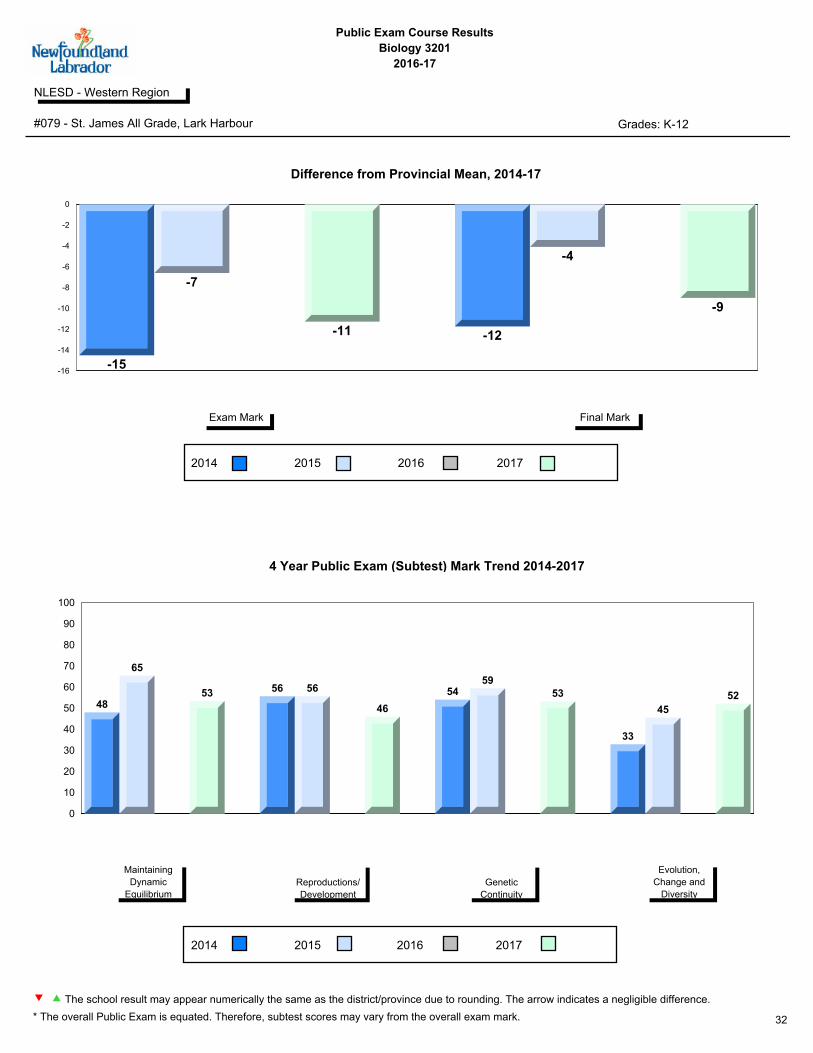
#079 - St. James All Grade, Lark Harbour Grades: K-12
NLESD - Western Region
Maintaining
Dynamic
Equilibrium
School
Region
Province
School
Region
Province
School
Region
Province
Genetic
Continuity
School
Region
Evolution,
Change and
Diversity
Reproductions/
Development
Province
Subtest
School
vs
Province
School
vs
Region
Final
Mark
School
vs
Province
School
vs
Region
Public
Exam
Mark
School
Region
Province
q q q q
q
q
q
q
q
q
q
q
59.2 52.2
13Number of Students
53.3
45.9
53.1
52.1
61.5
60.7
68.3
61.5
60.1
58.8
66.4
60.9
63.5 68.2
64.8 68.7
Biology 3201
0
10
20
30
40
50
60
70
80
90
100
46
5752 54
6459
Final MarkExam Mark
Average Mark, 2014-2017
2014 2015 2016 2017
31* The overall Public Exam is equated. Therefore, subtest scores may vary from the overall exam mark.
The school result may appear numerically the same as the district/province due to rounding. The arrow indicates a negligible difference.pq
Public Exam Course Results
Biology 3201
2016-17
#079 - St. James All Grade, Lark Harbour Grades: K-12
NLESD - Western Region
Maintaining
Dynamic
Equilibrium
Reproductions/
Development
Genetic
Continuity
Evolution,
Change and
Diversity
-16
-14
-12
-10
-8
-6
-4
-2
0
-15
-7
-11 -12
-4
-9
Final MarkExam Mark
2014 2015 2016
Difference from Provincial Mean, 2014-17
2017
0
10
20
30
40
50
60
70
80
90
100
48
65
53 56 56
46
5459
53
33
45
52
2014 2015 2016 2017
4 Year Public Exam (Subtest) Mark Trend 2014-2017
32* The overall Public Exam is equated. Therefore, subtest scores may vary from the overall exam mark.
The school result may appear numerically the same as the district/province due to rounding. The arrow indicates a negligible difference.pq

Public Exam Course Results
Biology 3201
2016-17
#080 - Templeton Academy, Meadows Grades: K-12
NLESD - Western Region
Maintaining
Dynamic
Equilibrium
School
Region
Province
School
Region
Province
School
Region
Province
Genetic
Continuity
School
Region
Evolution,
Change and
Diversity
Reproductions/
Development
Province
Subtest
School
vs
Province
School
vs
Region
Final
Mark
School
vs
Province
School
vs
Region
Public
Exam
Mark
School
Region
Province
p p p p
q
q
p
p
p
p
p
q
70.7 68.4
20Number of Students
61.1
68.5
73.5
60.3
61.5
60.7
68.3
61.5
60.1
58.8
66.4
60.9
63.5 68.2
64.8 68.7
Biology 3201
0
10
20
30
40
50
60
70
80
90
100
6168 69 68
6572 72 71
Final MarkExam Mark
Average Mark, 2014-2017
2014 2015 2016 2017
33* The overall Public Exam is equated. Therefore, subtest scores may vary from the overall exam mark.
The school result may appear numerically the same as the district/province due to rounding. The arrow indicates a negligible difference.pq

Public Exam Course Results
Biology 3201
2016-17
#080 - Templeton Academy, Meadows Grades: K-12
NLESD - Western Region
Maintaining
Dynamic
Equilibrium
Reproductions/
Development
Genetic
Continuity
Evolution,
Change and
Diversity
-1
0
1
2
3
4
5
6
1
5
6
5
0
4 4
2
Final MarkExam Mark
2014 2015 2016
Difference from Provincial Mean, 2014-17
2017
0
10
20
30
40
50
60
70
80
90
100
53
76
61 6166
76
67 69 6865
73 73
50
60
71
60
2014 2015 2016 2017
4 Year Public Exam (Subtest) Mark Trend 2014-2017
34* The overall Public Exam is equated. Therefore, subtest scores may vary from the overall exam mark.
The school result may appear numerically the same as the district/province due to rounding. The arrow indicates a negligible difference.pq

Public Exam Course Results
Biology 3201
2016-17
#083 - Pasadena Academy, Pasadena Grades: 7-12
NLESD - Western Region
Maintaining
Dynamic
Equilibrium
School
Region
Province
School
Region
Province
School
Region
Province
Genetic
Continuity
School
Region
Evolution,
Change and
Diversity
Reproductions/
Development
Province
Subtest
School
vs
Province
School
vs
Region
Final
Mark
School
vs
Province
School
vs
Region
Public
Exam
Mark
School
Region
Province
q q q q
q
q
q
q
p
p
p
q
66.7 62.4
26Number of Students
61.0
59.1
63.4
60.9
61.5
60.7
68.3
61.5
60.1
58.8
66.4
60.9
63.5 68.2
64.8 68.7
Biology 3201
0
10
20
30
40
50
60
70
80
90
100
5054
60 6257 57
65 67
Final MarkExam Mark
Average Mark, 2014-2017
2014 2015 2016 2017
35* The overall Public Exam is equated. Therefore, subtest scores may vary from the overall exam mark.
The school result may appear numerically the same as the district/province due to rounding. The arrow indicates a negligible difference.pq

Public Exam Course Results
Biology 3201
2016-17
#083 - Pasadena Academy, Pasadena Grades: 7-12
NLESD - Western Region
Maintaining
Dynamic
Equilibrium
Reproductions/
Development
Genetic
Continuity
Evolution,
Change and
Diversity
-12
-10
-8
-6
-4
-2
0
-11
-9
-4
-1
-8
-10
-3
-2
Final MarkExam Mark
2014 2015 2016
Difference from Provincial Mean, 2014-17
2017
0
10
20
30
40
50
60
70
80
90
100
37
61
50
61 63
55
6359
52 5457
63
46 47
6461
2014 2015 2016 2017
4 Year Public Exam (Subtest) Mark Trend 2014-2017
36* The overall Public Exam is equated. Therefore, subtest scores may vary from the overall exam mark.
The school result may appear numerically the same as the district/province due to rounding. The arrow indicates a negligible difference.pq

Public Exam Course Results
Biology 3201
2016-17
#086 - Gros Morne Academy, Rocky Harbour Grades: K-12
NLESD - Western Region
Maintaining
Dynamic
Equilibrium
School
Region
Province
School
Region
Province
School
Region
Province
Genetic
Continuity
School
Region
Evolution,
Change and
Diversity
Reproductions/
Development
Province
Subtest
School
vs
Province
School
vs
Region
Final
Mark
School
vs
Province
School
vs
Region
Public
Exam
Mark
School
Region
Province
p p p p
p
p
p
p
p
p
p
p
72.9 70.9
10Number of Students
70.5
63.5
74.5
70.7
61.5
60.7
68.3
61.5
60.1
58.8
66.4
60.9
63.5 68.2
64.8 68.7
Biology 3201
0
10
20
30
40
50
60
70
80
90
100
61
7064
7166
7265
73
Final MarkExam Mark
Average Mark, 2014-2017
2014 2015 2016 2017
37* The overall Public Exam is equated. Therefore, subtest scores may vary from the overall exam mark.
The school result may appear numerically the same as the district/province due to rounding. The arrow indicates a negligible difference.pq

Public Exam Course Results
Biology 3201
2016-17
#086 - Gros Morne Academy, Rocky Harbour Grades: K-12
NLESD - Western Region
Maintaining
Dynamic
Equilibrium
Reproductions/
Development
Genetic
Continuity
Evolution,
Change and
Diversity
-4
-2
0
2
4
6
8
1
7
0
7
1
4
-3
5
Final MarkExam Mark
2014 2015 2016
Difference from Provincial Mean, 2014-17
2017
0
10
20
30
40
50
60
70
80
90
100
51
78
54
71 70 6761 64
68 6965
74
50
74
64
71
2014 2015 2016 2017
4 Year Public Exam (Subtest) Mark Trend 2014-2017
38* The overall Public Exam is equated. Therefore, subtest scores may vary from the overall exam mark.
The school result may appear numerically the same as the district/province due to rounding. The arrow indicates a negligible difference.pq

Public Exam Course Results
Biology 3201
2016-17
#088 - Main River Academy, Pollard's Point Grades: K-12
NLESD - Western Region
Maintaining
Dynamic
Equilibrium
School
Region
Province
School
Region
Province
School
Region
Province
Genetic
Continuity
School
Region
Evolution,
Change and
Diversity
Reproductions/
Development
Province
Subtest
School
vs
Province
School
vs
Region
Final
Mark
School
vs
Province
School
vs
Region
Public
Exam
Mark
School
Region
Province
q q q q
q
q
q
q
q
q
q
q
2Number of Students
Biology 3201
Final MarkExam Mark
Average Mark, 2014-2017
2014 2015 2016 2017
School data with 5 or fewer
students withheld for reasons of
confidentiality.
School data with 5 or fewer
students withheld for reasons of
confidentiality.
School data with 5 or fewer students withheld for reasons of confidentiality.
39* The overall Public Exam is equated. Therefore, subtest scores may vary from the overall exam mark.
The school result may appear numerically the same as the district/province due to rounding. The arrow indicates a negligible difference.pq

Public Exam Course Results
Biology 3201
2016-17
#088 - Main River Academy, Pollard's Point Grades: K-12
NLESD - Western Region
Maintaining
Dynamic
Equilibrium
Reproductions/
Development
Genetic
Continuity
Evolution,
Change and
Diversity
Final MarkExam Mark
2014 2015 2016
Difference from Provincial Mean, 2014-17
2017
2014 2015 2016 2017
4 Year Public Exam (Subtest) Mark Trend 2014-2017
School data with 5 or fewer students withheld for reasons of confidentiality.
School data with 5 or fewer students withheld for reasons of confidentiality.
40* The overall Public Exam is equated. Therefore, subtest scores may vary from the overall exam mark.
The school result may appear numerically the same as the district/province due to rounding. The arrow indicates a negligible difference.pq

Public Exam Course Results
Biology 3201
2016-17
#092 - Grandy's River Collegiate, Burnt Islands Grades: K-12
NLESD - Western Region
Maintaining
Dynamic
Equilibrium
School
Region
Province
School
Region
Province
School
Region
Province
Genetic
Continuity
School
Region
Evolution,
Change and
Diversity
Reproductions/
Development
Province
Subtest
School
vs
Province
School
vs
Region
Final
Mark
School
vs
Province
School
vs
Region
Public
Exam
Mark
School
Region
Province
q p q q
q
q
p
p
p
p
p
q
67.0 64.7
10Number of Students
56.3
60.0
69.7
61.7
61.5
60.7
68.3
61.5
60.1
58.8
66.4
60.9
63.5 68.2
64.8 68.7
Biology 3201
0
10
20
30
40
50
60
70
80
90
100
5763 61
6560
66 68 67
Final MarkExam Mark
Average Mark, 2014-2017
2014 2015 2016 2017
41* The overall Public Exam is equated. Therefore, subtest scores may vary from the overall exam mark.
The school result may appear numerically the same as the district/province due to rounding. The arrow indicates a negligible difference.pq

Public Exam Course Results
Biology 3201
2016-17
#092 - Grandy's River Collegiate, Burnt Islands Grades: K-12
NLESD - Western Region
Maintaining
Dynamic
Equilibrium
Reproductions/
Development
Genetic
Continuity
Evolution,
Change and
Diversity
-6
-5
-4
-3
-2
-1
0
1
2
-3
-1
-3
1
-5
-1
0-1
Final MarkExam Mark
2014 2015 2016
Difference from Provincial Mean, 2014-17
2017
0
10
20
30
40
50
60
70
80
90
100
43
70
58 5662
68
59 6064
5761
70
53
65
51
62
2014 2015 2016 2017
4 Year Public Exam (Subtest) Mark Trend 2014-2017
42* The overall Public Exam is equated. Therefore, subtest scores may vary from the overall exam mark.
The school result may appear numerically the same as the district/province due to rounding. The arrow indicates a negligible difference.pq

Public Exam Course Results
Biology 3201
2016-17
#099 - St. James' Regional High School, Channel-Port Aux Basques Grades: 7-12
NLESD - Western Region
Maintaining
Dynamic
Equilibrium
School
Region
Province
School
Region
Province
School
Region
Province
Genetic
Continuity
School
Region
Evolution,
Change and
Diversity
Reproductions/
Development
Province
Subtest
School
vs
Province
School
vs
Region
Final
Mark
School
vs
Province
School
vs
Region
Public
Exam
Mark
School
Region
Province
q p q q
q
q
p
p
p
p
q
q
67.4 64.1
45Number of Students
65.5
57.2
66.1
62.8
61.5
60.7
68.3
61.5
60.1
58.8
66.4
60.9
63.5 68.2
64.8 68.7
Biology 3201
0
10
20
30
40
50
60
70
80
90
100
60 60 63 64 65 66 66 67
Final MarkExam Mark
Average Mark, 2014-2017
2014 2015 2016 2017
43* The overall Public Exam is equated. Therefore, subtest scores may vary from the overall exam mark.
The school result may appear numerically the same as the district/province due to rounding. The arrow indicates a negligible difference.pq

Public Exam Course Results
Biology 3201
2016-17
#099 - St. James' Regional High School, Channel-Port Aux Basques Grades: 7-12
NLESD - Western Region
Maintaining
Dynamic
Equilibrium
Reproductions/
Development
Genetic
Continuity
Evolution,
Change and
Diversity
-3.0
-2.5
-2.0
-1.5
-1.0
-0.5
0.0
0.5
1.0
0
-3
-1
1
-1
-2-2
-1
Final MarkExam Mark
2014 2015 2016
Difference from Provincial Mean, 2014-17
2017
0
10
20
30
40
50
60
70
80
90
100
58
68
6166
62 6359 57
67
5862
66
49
58 5963
2014 2015 2016 2017
4 Year Public Exam (Subtest) Mark Trend 2014-2017
44* The overall Public Exam is equated. Therefore, subtest scores may vary from the overall exam mark.
The school result may appear numerically the same as the district/province due to rounding. The arrow indicates a negligible difference.pq

Public Exam Course Results
Biology 3201
2016-17
#102 - All Saints All-Grade, Grey River Grades: K-2,4-6,12
NLESD - Western Region
Maintaining
Dynamic
Equilibrium
School
Region
Province
School
Region
Province
School
Region
Province
Genetic
Continuity
School
Region
Evolution,
Change and
Diversity
Reproductions/
Development
Province
Subtest
School
vs
Province
School
vs
Region
Final
Mark
School
vs
Province
School
vs
Region
Public
Exam
Mark
School
Region
Province
q q q q
q
q
q
q
p
q
q
q
2Number of Students
Biology 3201
Final MarkExam Mark
Average Mark, 2014-2017
2014 2015 2016 2017
School data with 5 or fewer
students withheld for reasons of
confidentiality.
School data with 5 or fewer
students withheld for reasons of
confidentiality.
School data with 5 or fewer students withheld for reasons of confidentiality.
45* The overall Public Exam is equated. Therefore, subtest scores may vary from the overall exam mark.
The school result may appear numerically the same as the district/province due to rounding. The arrow indicates a negligible difference.pq

Public Exam Course Results
Biology 3201
2016-17
#102 - All Saints All-Grade, Grey River Grades: K-2,4-6,12
NLESD - Western Region
Maintaining
Dynamic
Equilibrium
Reproductions/
Development
Genetic
Continuity
Evolution,
Change and
Diversity
Final MarkExam Mark
2014 2015 2016
Difference from Provincial Mean, 2014-17
2017
2014 2015 2016 2017
4 Year Public Exam (Subtest) Mark Trend 2014-2017
School data with 5 or fewer students withheld for reasons of confidentiality.
School data with 5 or fewer students withheld for reasons of confidentiality.
46* The overall Public Exam is equated. Therefore, subtest scores may vary from the overall exam mark.
The school result may appear numerically the same as the district/province due to rounding. The arrow indicates a negligible difference.pq

Public Exam Course Results
Biology 3201
2016-17
#110 - Piccadilly Central High, Piccadilly Grades: 9-12
NLESD - Western Region
Maintaining
Dynamic
Equilibrium
School
Region
Province
School
Region
Province
School
Region
Province
Genetic
Continuity
School
Region
Evolution,
Change and
Diversity
Reproductions/
Development
Province
Subtest
School
vs
Province
School
vs
Region
Final
Mark
School
vs
Province
School
vs
Region
Public
Exam
Mark
School
Region
Province
q q q q
q
q
q
q
q
q
q
q
61.0 53.2
22Number of Students
50.2
52.0
55.3
46.7
61.5
60.7
68.3
61.5
60.1
58.8
66.4
60.9
63.5 68.2
64.8 68.7
Biology 3201
0
10
20
30
40
50
60
70
80
90
100
6662 65
53
69 67 6861
Final MarkExam Mark
Average Mark, 2014-2017
2014 2015 2016 2017
47* The overall Public Exam is equated. Therefore, subtest scores may vary from the overall exam mark.
The school result may appear numerically the same as the district/province due to rounding. The arrow indicates a negligible difference.pq

Public Exam Course Results
Biology 3201
2016-17
#110 - Piccadilly Central High, Piccadilly Grades: 9-12
NLESD - Western Region
Maintaining
Dynamic
Equilibrium
Reproductions/
Development
Genetic
Continuity
Evolution,
Change and
Diversity
-12
-10
-8
-6
-4
-2
0
2
4
66
-1
1
-10
4
-1
0
-7
Final MarkExam Mark
2014 2015 2016
Difference from Provincial Mean, 2014-17
2017
0
10
20
30
40
50
60
70
80
90
100
59
68
5550
71
61 61
52
73
6467
5560
56
66
47
2014 2015 2016 2017
4 Year Public Exam (Subtest) Mark Trend 2014-2017
48* The overall Public Exam is equated. Therefore, subtest scores may vary from the overall exam mark.
The school result may appear numerically the same as the district/province due to rounding. The arrow indicates a negligible difference.pq

Public Exam Course Results
Biology 3201
2016-17
#113 - St. Boniface All Grade, Ramea Grades: K-1,3-4,6-12
NLESD - Western Region
Maintaining
Dynamic
Equilibrium
School
Region
Province
School
Region
Province
School
Region
Province
Genetic
Continuity
School
Region
Evolution,
Change and
Diversity
Reproductions/
Development
Province
Subtest
School
vs
Province
School
vs
Region
Final
Mark
School
vs
Province
School
vs
Region
Public
Exam
Mark
School
Region
Province
q q q q
q
q
q
q
q
q
q
q
3Number of Students
Biology 3201
Final MarkExam Mark
Average Mark, 2014-2017
2014 2015 2016 2017
School data with 5 or fewer
students withheld for reasons of
confidentiality.
School data with 5 or fewer
students withheld for reasons of
confidentiality.
School data with 5 or fewer students withheld for reasons of confidentiality.
49* The overall Public Exam is equated. Therefore, subtest scores may vary from the overall exam mark.
The school result may appear numerically the same as the district/province due to rounding. The arrow indicates a negligible difference.pq

Public Exam Course Results
Biology 3201
2016-17
#113 - St. Boniface All Grade, Ramea Grades: K-1,3-4,6-12
NLESD - Western Region
Maintaining
Dynamic
Equilibrium
Reproductions/
Development
Genetic
Continuity
Evolution,
Change and
Diversity
Final MarkExam Mark
2014 2015 2016
Difference from Provincial Mean, 2014-17
2017
2014 2015 2016 2017
4 Year Public Exam (Subtest) Mark Trend 2014-2017
School data with 5 or fewer students withheld for reasons of confidentiality.
School data with 5 or fewer students withheld for reasons of confidentiality.
50* The overall Public Exam is equated. Therefore, subtest scores may vary from the overall exam mark.
The school result may appear numerically the same as the district/province due to rounding. The arrow indicates a negligible difference.pq

Public Exam Course Results
Biology 3201
2016-17
#116 - Appalachia High School, St. George's Grades: 9-12
NLESD - Western Region
Maintaining
Dynamic
Equilibrium
School
Region
Province
School
Region
Province
School
Region
Province
Genetic
Continuity
School
Region
Evolution,
Change and
Diversity
Reproductions/
Development
Province
Subtest
School
vs
Province
School
vs
Region
Final
Mark
School
vs
Province
School
vs
Region
Public
Exam
Mark
School
Region
Province
q q q q
q
q
q
q
q
q
q
q
59.8 54.9
22Number of Students
49.7
55.1
53.7
53.9
61.5
60.7
68.3
61.5
60.1
58.8
66.4
60.9
63.5 68.2
64.8 68.7
Biology 3201
0
10
20
30
40
50
60
70
80
90
100
55 5551
5558
6157 60
Final MarkExam Mark
Average Mark, 2014-2017
2014 2015 2016 2017
51* The overall Public Exam is equated. Therefore, subtest scores may vary from the overall exam mark.
The school result may appear numerically the same as the district/province due to rounding. The arrow indicates a negligible difference.pq

Public Exam Course Results
Biology 3201
2016-17
#116 - Appalachia High School, St. George's Grades: 9-12
NLESD - Western Region
Maintaining
Dynamic
Equilibrium
Reproductions/
Development
Genetic
Continuity
Evolution,
Change and
Diversity
-14
-12
-10
-8
-6
-4
-2
0
-5
-8
-12
-9
-7-6
-11
-8
Final MarkExam Mark
2014 2015 2016
Difference from Provincial Mean, 2014-17
2017
0
10
20
30
40
50
60
70
80
90
100
47
64
43
50
6055
5155
5855
4954
51 51
5754
2014 2015 2016 2017
4 Year Public Exam (Subtest) Mark Trend 2014-2017
52* The overall Public Exam is equated. Therefore, subtest scores may vary from the overall exam mark.
The school result may appear numerically the same as the district/province due to rounding. The arrow indicates a negligible difference.pq

Public Exam Course Results
Biology 3201
2016-17
#119 - Stephenville High, Stephenville Grades: 9-12
NLESD - Western Region
Maintaining
Dynamic
Equilibrium
School
Region
Province
School
Region
Province
School
Region
Province
Genetic
Continuity
School
Region
Evolution,
Change and
Diversity
Reproductions/
Development
Province
Subtest
School
vs
Province
School
vs
Region
Final
Mark
School
vs
Province
School
vs
Region
Public
Exam
Mark
School
Region
Province
p p p p
p
p
p
p
p
p
p
p
73.3 69.3
47Number of Students
66.3
63.2
74.9
65.6
61.5
60.7
68.3
61.5
60.1
58.8
66.4
60.9
63.5 68.2
64.8 68.7
Biology 3201
0
10
20
30
40
50
60
70
80
90
100
61 6367 69 66
70 71 73
Final MarkExam Mark
Average Mark, 2014-2017
2014 2015 2016 2017
53* The overall Public Exam is equated. Therefore, subtest scores may vary from the overall exam mark.
The school result may appear numerically the same as the district/province due to rounding. The arrow indicates a negligible difference.pq

Public Exam Course Results
Biology 3201
2016-17
#119 - Stephenville High, Stephenville Grades: 9-12
NLESD - Western Region
Maintaining
Dynamic
Equilibrium
Reproductions/
Development
Genetic
Continuity
Evolution,
Change and
Diversity
-1
0
1
2
3
4
5
6
1
0
3
6
1
2
3
5
Final MarkExam Mark
2014 2015 2016
Difference from Provincial Mean, 2014-17
2017
0
10
20
30
40
50
60
70
80
90
100
56
70 68 6669
6668
6366
63 63
75
5154
6166
2014 2015 2016 2017
4 Year Public Exam (Subtest) Mark Trend 2014-2017
54* The overall Public Exam is equated. Therefore, subtest scores may vary from the overall exam mark.
The school result may appear numerically the same as the district/province due to rounding. The arrow indicates a negligible difference.pq

Public Exam Course Results
Biology 3201
2016-17
#125 - Copper Ridge Academy, Baie Verte Grades: K-12
NLESD - Western Region
Maintaining
Dynamic
Equilibrium
School
Region
Province
School
Region
Province
School
Region
Province
Genetic
Continuity
School
Region
Evolution,
Change and
Diversity
Reproductions/
Development
Province
Subtest
School
vs
Province
School
vs
Region
Final
Mark
School
vs
Province
School
vs
Region
Public
Exam
Mark
School
Region
Province
q q q q
q
q
q
p p
q
q
q
65.5 58.5
13Number of Students
65.8
53.6
56.4
52.6
61.5
60.7
68.3
61.5
60.1
58.8
66.4
60.9
63.5 68.2
64.8 68.7
Biology 3201
0
10
20
30
40
50
60
70
80
90
100
6457
6458
6761
6965
Final MarkExam Mark
Average Mark, 2014-2017
2014 2015 2016 2017
55* The overall Public Exam is equated. Therefore, subtest scores may vary from the overall exam mark.
The school result may appear numerically the same as the district/province due to rounding. The arrow indicates a negligible difference.pq

Public Exam Course Results
Biology 3201
2016-17
#125 - Copper Ridge Academy, Baie Verte Grades: K-12
NLESD - Western Region
Maintaining
Dynamic
Equilibrium
Reproductions/
Development
Genetic
Continuity
Evolution,
Change and
Diversity
-8
-6
-4
-2
0
2
4 4
-6
1
-5
1
-7
1
-3
Final MarkExam Mark
2014 2015 2016
Difference from Provincial Mean, 2014-17
2017
0
10
20
30
40
50
60
70
80
90
100
5660 61
66 66
5964
54
72
57
64
56 5549
61
53
2014 2015 2016 2017
4 Year Public Exam (Subtest) Mark Trend 2014-2017
56* The overall Public Exam is equated. Therefore, subtest scores may vary from the overall exam mark.
The school result may appear numerically the same as the district/province due to rounding. The arrow indicates a negligible difference.pq

Public Exam Course Results
Biology 3201
2016-17
#137 - St. Simon and St. Jude Academy, Francois Grades: 1-4,8,10-12
NLESD - Western Region
Maintaining
Dynamic
Equilibrium
School
Region
Province
School
Region
Province
School
Region
Province
Genetic
Continuity
School
Region
Evolution,
Change and
Diversity
Reproductions/
Development
Province
Subtest
School
vs
Province
School
vs
Region
Final
Mark
School
vs
Province
School
vs
Region
Public
Exam
Mark
School
Region
Province
q q q q
q
q
q
q
q
q
q
q
1Number of Students
Biology 3201
Final MarkExam Mark
Average Mark, 2014-2017
2014 2015 2016 2017
School data with 5 or fewer
students withheld for reasons of
confidentiality.
School data with 5 or fewer
students withheld for reasons of
confidentiality.
School data with 5 or fewer students withheld for reasons of confidentiality.
57* The overall Public Exam is equated. Therefore, subtest scores may vary from the overall exam mark.
The school result may appear numerically the same as the district/province due to rounding. The arrow indicates a negligible difference.pq

Public Exam Course Results
Biology 3201
2016-17
#137 - St. Simon and St. Jude Academy, Francois Grades: 1-4,8,10-12
NLESD - Western Region
Maintaining
Dynamic
Equilibrium
Reproductions/
Development
Genetic
Continuity
Evolution,
Change and
Diversity
Final MarkExam Mark
2014 2015 2016
Difference from Provincial Mean, 2014-17
2017
2014 2015 2016 2017
4 Year Public Exam (Subtest) Mark Trend 2014-2017
School data with 5 or fewer students withheld for reasons of confidentiality.
School data with 5 or fewer students withheld for reasons of confidentiality.
58* The overall Public Exam is equated. Therefore, subtest scores may vary from the overall exam mark.
The school result may appear numerically the same as the district/province due to rounding. The arrow indicates a negligible difference.pq

Public Exam Course Results
Biology 3201
2016-17
#152 - Valmont Academy, King's Point Grades: K-12
NLESD - Western Region
Maintaining
Dynamic
Equilibrium
School
Region
Province
School
Region
Province
School
Region
Province
Genetic
Continuity
School
Region
Evolution,
Change and
Diversity
Reproductions/
Development
Province
Subtest
School
vs
Province
School
vs
Region
Final
Mark
School
vs
Province
School
vs
Region
Public
Exam
Mark
School
Region
Province
q q q q
q
q
q
q
q
q
q
q
3Number of Students
Biology 3201
Final MarkExam Mark
Average Mark, 2014-2017
2014 2015 2016 2017
School data with 5 or fewer
students withheld for reasons of
confidentiality.
School data with 5 or fewer
students withheld for reasons of
confidentiality.
School data with 5 or fewer students withheld for reasons of confidentiality.
59* The overall Public Exam is equated. Therefore, subtest scores may vary from the overall exam mark.
The school result may appear numerically the same as the district/province due to rounding. The arrow indicates a negligible difference.pq

Public Exam Course Results
Biology 3201
2016-17
#152 - Valmont Academy, King's Point Grades: K-12
NLESD - Western Region
Maintaining
Dynamic
Equilibrium
Reproductions/
Development
Genetic
Continuity
Evolution,
Change and
Diversity
Final MarkExam Mark
2014 2015 2016
Difference from Provincial Mean, 2014-17
2017
2014 2015 2016 2017
4 Year Public Exam (Subtest) Mark Trend 2014-2017
School data with 5 or fewer students withheld for reasons of confidentiality.
School data with 5 or fewer students withheld for reasons of confidentiality.
60* The overall Public Exam is equated. Therefore, subtest scores may vary from the overall exam mark.
The school result may appear numerically the same as the district/province due to rounding. The arrow indicates a negligible difference.pq

Public Exam Course Results
Biology 3201
2016-17
#153 - Cape John Collegiate, La Scie Grades: 7-12
NLESD - Western Region
Maintaining
Dynamic
Equilibrium
School
Region
Province
School
Region
Province
School
Region
Province
Genetic
Continuity
School
Region
Evolution,
Change and
Diversity
Reproductions/
Development
Province
Subtest
School
vs
Province
School
vs
Region
Final
Mark
School
vs
Province
School
vs
Region
Public
Exam
Mark
School
Region
Province
p p p p
p
p
p
p
p
p
p
p
73.2 70.8
11Number of Students
63.0
69.4
70.9
78.5
61.5
60.7
68.3
61.5
60.1
58.8
66.4
60.9
63.5 68.2
64.8 68.7
Biology 3201
0
10
20
30
40
50
60
70
80
90
100
59 5750
7166
6258
73
Final MarkExam Mark
Average Mark, 2014-2017
2014 2015 2016 2017
61* The overall Public Exam is equated. Therefore, subtest scores may vary from the overall exam mark.
The school result may appear numerically the same as the district/province due to rounding. The arrow indicates a negligible difference.pq

Public Exam Course Results
Biology 3201
2016-17
#153 - Cape John Collegiate, La Scie Grades: 7-12
NLESD - Western Region
Maintaining
Dynamic
Equilibrium
Reproductions/
Development
Genetic
Continuity
Evolution,
Change and
Diversity
-16
-12
-8
-4
0
4
8
-1
-6
-13
7
1
-5
-10
5
Final MarkExam Mark
2014 2015 2016
Difference from Provincial Mean, 2014-17
2017
0
10
20
30
40
50
60
70
80
90
100
47
68
42
63
6964
49
69 70
51 50
71
59
52 52
78
2014 2015 2016 2017
4 Year Public Exam (Subtest) Mark Trend 2014-2017
62* The overall Public Exam is equated. Therefore, subtest scores may vary from the overall exam mark.
The school result may appear numerically the same as the district/province due to rounding. The arrow indicates a negligible difference.pq

Public Exam Course Results
Biology 3201
2016-17
#158 - MSB Regional Academy, Middle Arm Grades: K-12
NLESD - Western Region
Maintaining
Dynamic
Equilibrium
School
Region
Province
School
Region
Province
School
Region
Province
Genetic
Continuity
School
Region
Evolution,
Change and
Diversity
Reproductions/
Development
Province
Subtest
School
vs
Province
School
vs
Region
Final
Mark
School
vs
Province
School
vs
Region
Public
Exam
Mark
School
Region
Province
p p p p
p
p
p
p
p
p
p
p
78.3 75.6
7Number of Students
68.2
72.8
80.8
74.8
61.5
60.7
68.3
61.5
60.1
58.8
66.4
60.9
63.5 68.2
64.8 68.7
Biology 3201
0
10
20
30
40
50
60
70
80
90
100
66
8278 76
69
8480 78
Final MarkExam Mark
Average Mark, 2014-2017
2014 2015 2016 2017
63* The overall Public Exam is equated. Therefore, subtest scores may vary from the overall exam mark.
The school result may appear numerically the same as the district/province due to rounding. The arrow indicates a negligible difference.pq

Public Exam Course Results
Biology 3201
2016-17
#158 - MSB Regional Academy, Middle Arm Grades: K-12
NLESD - Western Region
Maintaining
Dynamic
Equilibrium
Reproductions/
Development
Genetic
Continuity
Evolution,
Change and
Diversity
0
4
8
12
16
20
6
19
1412
4
16
12
10
Final MarkExam Mark
2014 2015 2016
Difference from Provincial Mean, 2014-17
2017
0
10
20
30
40
50
60
70
80
90
100
55
86
68 6873
81 79
73 73
83 82 81
64
87
77 75
2014 2015 2016 2017
4 Year Public Exam (Subtest) Mark Trend 2014-2017
64* The overall Public Exam is equated. Therefore, subtest scores may vary from the overall exam mark.
The school result may appear numerically the same as the district/province due to rounding. The arrow indicates a negligible difference.pq

Public Exam Course Results
Biology 3201
2016-17
#162 - Dorset Collegiate, Pilley's Island Grades: 7-12
NLESD - Western Region
Maintaining
Dynamic
Equilibrium
School
Region
Province
School
Region
Province
School
Region
Province
Genetic
Continuity
School
Region
Evolution,
Change and
Diversity
Reproductions/
Development
Province
Subtest
School
vs
Province
School
vs
Region
Final
Mark
School
vs
Province
School
vs
Region
Public
Exam
Mark
School
Region
Province
q q q q
q
q
q
q
q
q
q
q
61.4 58.8
16Number of Students
53.8
57.5
63.5
46.9
61.5
60.7
68.3
61.5
60.1
58.8
66.4
60.9
63.5 68.2
64.8 68.7
Biology 3201
0
10
20
30
40
50
60
70
80
90
100
59
49
57 5965
5561 61
Final MarkExam Mark
Average Mark, 2014-2017
2014 2015 2016 2017
65* The overall Public Exam is equated. Therefore, subtest scores may vary from the overall exam mark.
The school result may appear numerically the same as the district/province due to rounding. The arrow indicates a negligible difference.pq

Public Exam Course Results
Biology 3201
2016-17
#162 - Dorset Collegiate, Pilley's Island Grades: 7-12
NLESD - Western Region
Maintaining
Dynamic
Equilibrium
Reproductions/
Development
Genetic
Continuity
Evolution,
Change and
Diversity
-16
-14
-12
-10
-8
-6
-4
-2
0
-1
-15
-7
-5
0
-12
-7 -7
Final MarkExam Mark
2014 2015 2016
Difference from Provincial Mean, 2014-17
2017
0
10
20
30
40
50
60
70
80
90
100
41
5551
54
67
5256 58
69
49
5863
54
38
5047
2014 2015 2016 2017
4 Year Public Exam (Subtest) Mark Trend 2014-2017
66* The overall Public Exam is equated. Therefore, subtest scores may vary from the overall exam mark.
The school result may appear numerically the same as the district/province due to rounding. The arrow indicates a negligible difference.pq

Public Exam Course Results
Biology 3201
2016-17
#171 - Indian River High School, Springdale Grades: 7-12
NLESD - Western Region
Maintaining
Dynamic
Equilibrium
School
Region
Province
School
Region
Province
School
Region
Province
Genetic
Continuity
School
Region
Evolution,
Change and
Diversity
Reproductions/
Development
Province
Subtest
School
vs
Province
School
vs
Region
Final
Mark
School
vs
Province
School
vs
Region
Public
Exam
Mark
School
Region
Province
q p q q
q
q
p
p
p
p
p
q
66.5 64.0
18Number of Students
60.8
61.8
64.2
64.1
61.5
60.7
68.3
61.5
60.1
58.8
66.4
60.9
63.5 68.2
64.8 68.7
Biology 3201
0
10
20
30
40
50
60
70
80
90
100
61 60
7164
6763
7367
Final MarkExam Mark
Average Mark, 2014-2017
2014 2015 2016 2017
67* The overall Public Exam is equated. Therefore, subtest scores may vary from the overall exam mark.
The school result may appear numerically the same as the district/province due to rounding. The arrow indicates a negligible difference.pq

Public Exam Course Results
Biology 3201
2016-17
#171 - Indian River High School, Springdale Grades: 7-12
NLESD - Western Region
Maintaining
Dynamic
Equilibrium
Reproductions/
Development
Genetic
Continuity
Evolution,
Change and
Diversity
-6
-4
-2
0
2
4
6
8
1
-3
7
0
2
-5
5
-2
Final MarkExam Mark
2014 2015 2016
Difference from Provincial Mean, 2014-17
2017
0
10
20
30
40
50
60
70
80
90
100
57
69 68
6166
6367
6266
58
72
64
50 52
73
64
2014 2015 2016 2017
4 Year Public Exam (Subtest) Mark Trend 2014-2017
68* The overall Public Exam is equated. Therefore, subtest scores may vary from the overall exam mark.
The school result may appear numerically the same as the district/province due to rounding. The arrow indicates a negligible difference.pq

Public Exam Course Results
Biology 3201
2016-17
#174 - St. Peter's Academy, Westport Grades: 1-6,9-12
NLESD - Western Region
Maintaining
Dynamic
Equilibrium
School
Region
Province
School
Region
Province
School
Region
Province
Genetic
Continuity
School
Region
Evolution,
Change and
Diversity
Reproductions/
Development
Province
Subtest
School
vs
Province
School
vs
Region
Final
Mark
School
vs
Province
School
vs
Region
Public
Exam
Mark
School
Region
Province
q q q q
q
q
q
p p
q
q
q
3Number of Students
Biology 3201
Final MarkExam Mark
Average Mark, 2014-2017
2014 2015 2016 2017
School data with 5 or fewer
students withheld for reasons of
confidentiality.
School data with 5 or fewer
students withheld for reasons of
confidentiality.
School data with 5 or fewer students withheld for reasons of confidentiality.
69* The overall Public Exam is equated. Therefore, subtest scores may vary from the overall exam mark.
The school result may appear numerically the same as the district/province due to rounding. The arrow indicates a negligible difference.pq

Public Exam Course Results
Biology 3201
2016-17
#174 - St. Peter's Academy, Westport Grades: 1-6,9-12
NLESD - Western Region
Maintaining
Dynamic
Equilibrium
Reproductions/
Development
Genetic
Continuity
Evolution,
Change and
Diversity
Final MarkExam Mark
2014 2015 2016
Difference from Provincial Mean, 2014-17
2017
2014 2015 2016 2017
4 Year Public Exam (Subtest) Mark Trend 2014-2017
School data with 5 or fewer students withheld for reasons of confidentiality.
School data with 5 or fewer students withheld for reasons of confidentiality.
70* The overall Public Exam is equated. Therefore, subtest scores may vary from the overall exam mark.
The school result may appear numerically the same as the district/province due to rounding. The arrow indicates a negligible difference.pq

Public Exam Course Results
Biology 3201
2016-17
#388 - Long Range Academy, Cow Head Grades: K-12
NLESD - Western Region
Maintaining
Dynamic
Equilibrium
School
Region
Province
School
Region
Province
School
Region
Province
Genetic
Continuity
School
Region
Evolution,
Change and
Diversity
Reproductions/
Development
Province
Subtest
School
vs
Province
School
vs
Region
Final
Mark
School
vs
Province
School
vs
Region
Public
Exam
Mark
School
Region
Province
q q q q
q
q
q
q
q
q
q
q
65.5 58.9
20Number of Students
47.4
57.1
63.2
57.5
61.5
60.7
68.3
61.5
60.1
58.8
66.4
60.9
63.5 68.2
64.8 68.7
Biology 3201
0
10
20
30
40
50
60
70
80
90
100
50
5954
65
Final MarkExam Mark
Average Mark, 2014-2017
2014 2015 2016 2017
71* The overall Public Exam is equated. Therefore, subtest scores may vary from the overall exam mark.
The school result may appear numerically the same as the district/province due to rounding. The arrow indicates a negligible difference.pq

Public Exam Course Results
Biology 3201
2016-17
#388 - Long Range Academy, Cow Head Grades: K-12
NLESD - Western Region
Maintaining
Dynamic
Equilibrium
Reproductions/
Development
Genetic
Continuity
Evolution,
Change and
Diversity
-14
-12
-10
-8
-6
-4
-2
0
-14
-5
-13
-3
Final MarkExam Mark
2014 2015 2016
Difference from Provincial Mean, 2014-17
2017
0
10
20
30
40
50
60
70
80
90
100
63
4751
57
48
63
40
58
2014 2015 2016 2017
4 Year Public Exam (Subtest) Mark Trend 2014-2017
72* The overall Public Exam is equated. Therefore, subtest scores may vary from the overall exam mark.
The school result may appear numerically the same as the district/province due to rounding. The arrow indicates a negligible difference.pq
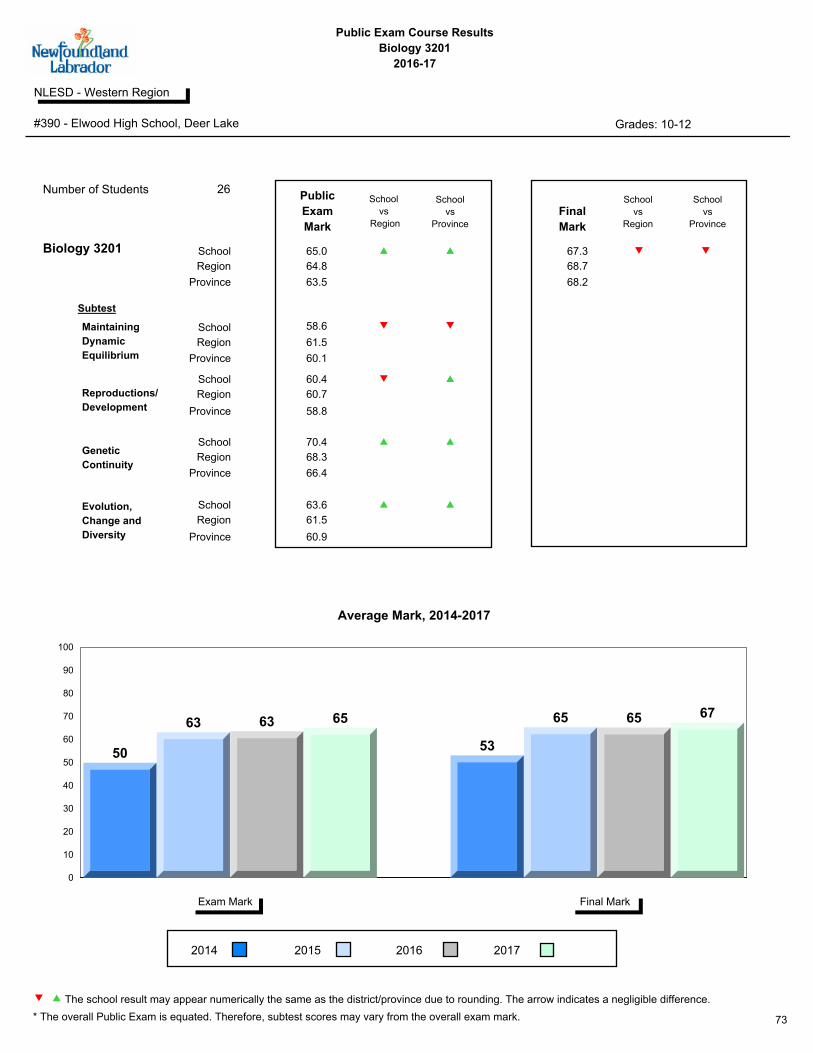
Public Exam Course Results
Biology 3201
2016-17
#390 - Elwood High School, Deer Lake Grades: 10-12
NLESD - Western Region
Maintaining
Dynamic
Equilibrium
School
Region
Province
School
Region
Province
School
Region
Province
Genetic
Continuity
School
Region
Evolution,
Change and
Diversity
Reproductions/
Development
Province
Subtest
School
vs
Province
School
vs
Region
Final
Mark
School
vs
Province
School
vs
Region
Public
Exam
Mark
School
Region
Province
p p q q
q
q
p
p
p
p
p
q
67.3 65.0
26Number of Students
58.6
60.4
70.4
63.6
61.5
60.7
68.3
61.5
60.1
58.8
66.4
60.9
63.5 68.2
64.8 68.7
Biology 3201
0
10
20
30
40
50
60
70
80
90
100
50
63 63 65
53
65 65 67
Final MarkExam Mark
Average Mark, 2014-2017
2014 2015 2016 2017
73* The overall Public Exam is equated. Therefore, subtest scores may vary from the overall exam mark.
The school result may appear numerically the same as the district/province due to rounding. The arrow indicates a negligible difference.pq

Public Exam Course Results
Biology 3201
2016-17
#390 - Elwood High School, Deer Lake Grades: 10-12
NLESD - Western Region
Maintaining
Dynamic
Equilibrium
Reproductions/
Development
Genetic
Continuity
Evolution,
Change and
Diversity
-14
-12
-10
-8
-6
-4
-2
0
2
-10
0 0
1
-12
-2 -3
-1
Final MarkExam Mark
2014 2015 2016
Difference from Provincial Mean, 2014-17
2017
0
10
20
30
40
50
60
70
80
90
100
40
69
5559 60
6562 60
51
63 64
70
43
58
64 64
2014 2015 2016 2017
4 Year Public Exam (Subtest) Mark Trend 2014-2017
74* The overall Public Exam is equated. Therefore, subtest scores may vary from the overall exam mark.
The school result may appear numerically the same as the district/province due to rounding. The arrow indicates a negligible difference.pq

Public Exam Course Results
Biology 3201
2016-17
#394 - E.A. Butler All Grade, McKay's Grades: K-12
NLESD - Western Region
Maintaining
Dynamic
Equilibrium
School
Region
Province
School
Region
Province
School
Region
Province
Genetic
Continuity
School
Region
Evolution,
Change and
Diversity
Reproductions/
Development
Province
Subtest
School
vs
Province
School
vs
Region
Final
Mark
School
vs
Province
School
vs
Region
Public
Exam
Mark
School
Region
Province
q q q q
q
q
q
q
q
q
q
q
5Number of Students
Biology 3201
Final MarkExam Mark
Average Mark, 2014-2017
2014 2015 2016 2017
School data with 5 or fewer
students withheld for reasons of
confidentiality.
School data with 5 or fewer
students withheld for reasons of
confidentiality.
School data with 5 or fewer students withheld for reasons of confidentiality.
75* The overall Public Exam is equated. Therefore, subtest scores may vary from the overall exam mark.
The school result may appear numerically the same as the district/province due to rounding. The arrow indicates a negligible difference.pq

Public Exam Course Results
Biology 3201
2016-17
#394 - E.A. Butler All Grade, McKay's Grades: K-12
NLESD - Western Region
Maintaining
Dynamic
Equilibrium
Reproductions/
Development
Genetic
Continuity
Evolution,
Change and
Diversity
Final MarkExam Mark
2014 2015 2016
Difference from Provincial Mean, 2014-17
2017
2014 2015 2016 2017
4 Year Public Exam (Subtest) Mark Trend 2014-2017
School data with 5 or fewer students withheld for reasons of confidentiality.
School data with 5 or fewer students withheld for reasons of confidentiality.
76* The overall Public Exam is equated. Therefore, subtest scores may vary from the overall exam mark.
The school result may appear numerically the same as the district/province due to rounding. The arrow indicates a negligible difference.pq

Public Exam Course Results
Biology 3201
2016-17
#397 - Belanger Memorial School, Upper Ferry Grades: K-12
NLESD - Western Region
Maintaining
Dynamic
Equilibrium
School
Region
Province
School
Region
Province
School
Region
Province
Genetic
Continuity
School
Region
Evolution,
Change and
Diversity
Reproductions/
Development
Province
Subtest
School
vs
Province
School
vs
Region
Final
Mark
School
vs
Province
School
vs
Region
Public
Exam
Mark
School
Region
Province
q q q q
q
q
q
q
q
q
q
q
46.8 41.0
11Number of Students
28.2
43.8
43.2
36.1
61.5
60.7
68.3
61.5
60.1
58.8
66.4
60.9
63.5 68.2
64.8 68.7
Biology 3201
0
10
20
30
40
50
60
70
80
90
100
87
52
41
90
56
47
Final MarkExam Mark
Average Mark, 2014-2017
2014 2015 2016 2017
77* The overall Public Exam is equated. Therefore, subtest scores may vary from the overall exam mark.
The school result may appear numerically the same as the district/province due to rounding. The arrow indicates a negligible difference.pq

Public Exam Course Results
Biology 3201
2016-17
#397 - Belanger Memorial School, Upper Ferry Grades: K-12
NLESD - Western Region
Maintaining
Dynamic
Equilibrium
Reproductions/
Development
Genetic
Continuity
Evolution,
Change and
Diversity
-30
-20
-10
0
10
20
30 27
-11
-23
25
-12
-21
Final MarkExam Mark
2014 2015 2016
Difference from Provincial Mean, 2014-17
2017
0
10
20
30
40
50
60
70
80
90
100
80
62
28
93
57
44
95
4943
87
46
36
2014 2015 2016 2017
4 Year Public Exam (Subtest) Mark Trend 2014-2017
78* The overall Public Exam is equated. Therefore, subtest scores may vary from the overall exam mark.
The school result may appear numerically the same as the district/province due to rounding. The arrow indicates a negligible difference.pq

Public Exam Course Results
Biology 3201
2016-17
#474 - Cloud River Academy, Roddickton Grades: K-12
NLESD - Western Region
Maintaining
Dynamic
Equilibrium
School
Region
Province
School
Region
Province
School
Region
Province
Genetic
Continuity
School
Region
Evolution,
Change and
Diversity
Reproductions/
Development
Province
Subtest
School
vs
Province
School
vs
Region
Final
Mark
School
vs
Province
School
vs
Region
Public
Exam
Mark
School
Region
Province
q q q q
q
q
q
q
q
q
q
q
63.6 56.2
11Number of Students
52.1
54.9
60.2
46.7
61.5
60.7
68.3
61.5
60.1
58.8
66.4
60.9
63.5 68.2
64.8 68.7
Biology 3201
0
10
20
30
40
50
60
70
80
90
100
50
6258 56 57
67 65 64
Final MarkExam Mark
Average Mark, 2014-2017
2014 2015 2016 2017
79* The overall Public Exam is equated. Therefore, subtest scores may vary from the overall exam mark.
The school result may appear numerically the same as the district/province due to rounding. The arrow indicates a negligible difference.pq

Public Exam Course Results
Biology 3201
2016-17
#474 - Cloud River Academy, Roddickton Grades: K-12
NLESD - Western Region
Maintaining
Dynamic
Equilibrium
Reproductions/
Development
Genetic
Continuity
Evolution,
Change and
Diversity
-12
-10
-8
-6
-4
-2
0
-11
-2
-6-7
-8
-1
-3
-5
Final MarkExam Mark
2014 2015 2016
Difference from Provincial Mean, 2014-17
2017
0
10
20
30
40
50
60
70
80
90
100
40
73
4752
6063
56 5551
61 59 60
38
4953
47
2014 2015 2016 2017
4 Year Public Exam (Subtest) Mark Trend 2014-2017
80* The overall Public Exam is equated. Therefore, subtest scores may vary from the overall exam mark.
The school result may appear numerically the same as the district/province due to rounding. The arrow indicates a negligible difference.pq

Public Exam Course Results
Biology 3201
2016-17
#475 - Viking Trail Academy, Plum Point Grades: K-12
NLESD - Western Region
Maintaining
Dynamic
Equilibrium
School
Region
Province
School
Region
Province
School
Region
Province
Genetic
Continuity
School
Region
Evolution,
Change and
Diversity
Reproductions/
Development
Province
Subtest
School
vs
Province
School
vs
Region
Final
Mark
School
vs
Province
School
vs
Region
Public
Exam
Mark
School
Region
Province
p p p p
q
q
p
p
p
p
p
p
73.4 66.4
20Number of Students
71.8
59.6
66.8
63.8
61.5
60.7
68.3
61.5
60.1
58.8
66.4
60.9
63.5 68.2
64.8 68.7
Biology 3201
0
10
20
30
40
50
60
70
80
90
100
64 6671 73
Final MarkExam Mark
Average Mark, 2014-2017
2014 2015 2016 2017
81* The overall Public Exam is equated. Therefore, subtest scores may vary from the overall exam mark.
The school result may appear numerically the same as the district/province due to rounding. The arrow indicates a negligible difference.pq

Public Exam Course Results
Biology 3201
2016-17
#475 - Viking Trail Academy, Plum Point Grades: K-12
NLESD - Western Region
Maintaining
Dynamic
Equilibrium
Reproductions/
Development
Genetic
Continuity
Evolution,
Change and
Diversity
0
1
2
3
4
5
6
1
33
5
Final MarkExam Mark
2014 2015 2016
Difference from Provincial Mean, 2014-17
2017
0
10
20
30
40
50
60
70
80
90
100
71 72
6560 62
6763 64
2014 2015 2016 2017
4 Year Public Exam (Subtest) Mark Trend 2014-2017
82* The overall Public Exam is equated. Therefore, subtest scores may vary from the overall exam mark.
The school result may appear numerically the same as the district/province due to rounding. The arrow indicates a negligible difference.pq

Public Exam Course Results
Biology 3201
2016-17
#485 - Corner Brook Regional High, Corner Brook Grades: 10-12
NLESD - Western Region
Maintaining
Dynamic
Equilibrium
School
Region
Province
School
Region
Province
School
Region
Province
Genetic
Continuity
School
Region
Evolution,
Change and
Diversity
Reproductions/
Development
Province
Subtest
School
vs
Province
School
vs
Region
Final
Mark
School
vs
Province
School
vs
Region
Public
Exam
Mark
School
Region
Province
p p p p
p
p
p
p
p
p
p
p
75.9 73.7
140Number of Students
71.1
69.1
78.8
69.1
61.5
60.7
68.3
61.5
60.1
58.8
66.4
60.9
63.5 68.2
64.8 68.7
Biology 3201
0
10
20
30
40
50
60
70
80
90
100
6268
74 74
6670
76 76
Final MarkExam Mark
Average Mark, 2014-2017
2014 2015 2016 2017
83* The overall Public Exam is equated. Therefore, subtest scores may vary from the overall exam mark.
The school result may appear numerically the same as the district/province due to rounding. The arrow indicates a negligible difference.pq
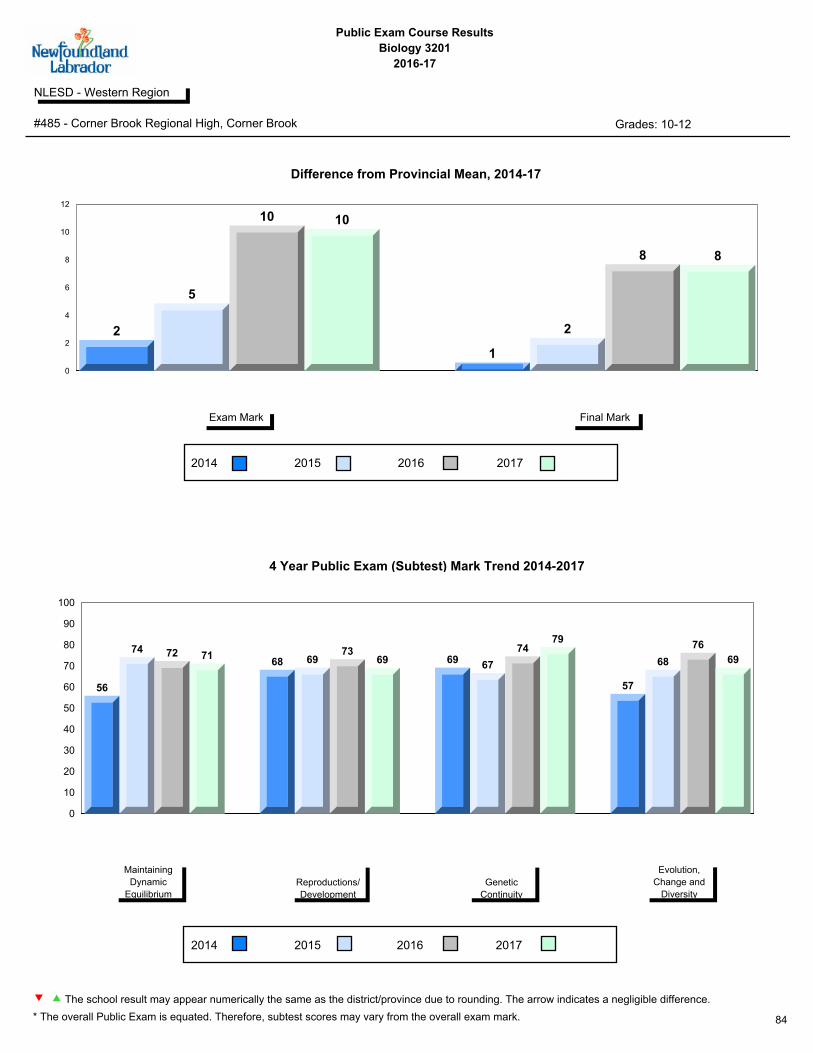
Public Exam Course Results
Biology 3201
2016-17
#485 - Corner Brook Regional High, Corner Brook Grades: 10-12
NLESD - Western Region
Maintaining
Dynamic
Equilibrium
Reproductions/
Development
Genetic
Continuity
Evolution,
Change and
Diversity
0
2
4
6
8
10
12
2
5
10 10
1
2
8 8
Final MarkExam Mark
2014 2015 2016
Difference from Provincial Mean, 2014-17
2017
0
10
20
30
40
50
60
70
80
90
100
56
74 72 7168 69
7369 69
67
7479
57
68
76
69
2014 2015 2016 2017
4 Year Public Exam (Subtest) Mark Trend 2014-2017
84* The overall Public Exam is equated. Therefore, subtest scores may vary from the overall exam mark.
The school result may appear numerically the same as the district/province due to rounding. The arrow indicates a negligible difference.pq

Public Exam Course Results
Biology 3201
2016-17
#488 - French Shore Academy, Port Saunders Grades: K-12
NLESD - Western Region
Maintaining
Dynamic
Equilibrium
School
Region
Province
School
Region
Province
School
Region
Province
Genetic
Continuity
School
Region
Evolution,
Change and
Diversity
Reproductions/
Development
Province
Subtest
School
vs
Province
School
vs
Region
Final
Mark
School
vs
Province
School
vs
Region
Public
Exam
Mark
School
Region
Province
p p p p
p
p
p
p
p
p
p
p
74.4 68.8
12Number of Students
66.5
62.4
72.4
67.8
61.5
60.7
68.3
61.5
60.1
58.8
66.4
60.9
63.5 68.2
64.8 68.7
Biology 3201
0
10
20
30
40
50
60
70
80
90
100
54 53 52
69
60 5954
74
Final MarkExam Mark
Average Mark, 2014-2017
2014 2015 2016 2017
85* The overall Public Exam is equated. Therefore, subtest scores may vary from the overall exam mark.
The school result may appear numerically the same as the district/province due to rounding. The arrow indicates a negligible difference.pq

Public Exam Course Results
Biology 3201
2016-17
#488 - French Shore Academy, Port Saunders Grades: K-12
NLESD - Western Region
Maintaining
Dynamic
Equilibrium
Reproductions/
Development
Genetic
Continuity
Evolution,
Change and
Diversity
-16
-12
-8
-4
0
4
8
-6
-10-12
5
-5
-8
-14
6
Final MarkExam Mark
2014 2015 2016
Difference from Provincial Mean, 2014-17
2017
0
10
20
30
40
50
60
70
80
90
100
48
57 57
66
58
51 49
62 6155
42
72
37
5357
68
2014 2015 2016 2017
4 Year Public Exam (Subtest) Mark Trend 2014-2017
86* The overall Public Exam is equated. Therefore, subtest scores may vary from the overall exam mark.
The school result may appear numerically the same as the district/province due to rounding. The arrow indicates a negligible difference.pq

Public Exam Course Results
Biology 3201
2016-17
#953 - White Hills Academy, St. Anthony Grades: K-12
NLESD - Western Region
Maintaining
Dynamic
Equilibrium
School
Region
Province
School
Region
Province
School
Region
Province
Genetic
Continuity
School
Region
Evolution,
Change and
Diversity
Reproductions/
Development
Province
Subtest
School
vs
Province
School
vs
Region
Final
Mark
School
vs
Province
School
vs
Region
Public
Exam
Mark
School
Region
Province
p p q q
q
q
p
p
p
p
p
q
68.2 66.2
15Number of Students
60.2
58.4
72.9
65.3
61.5
60.7
68.3
61.5
60.1
58.8
66.4
60.9
63.5 68.2
64.8 68.7
Biology 3201
0
10
20
30
40
50
60
70
80
90
100
7166 69 66
7468 71 68
Final MarkExam Mark
Average Mark, 2014-2017
2014 2015 2016 2017
87* The overall Public Exam is equated. Therefore, subtest scores may vary from the overall exam mark.
The school result may appear numerically the same as the district/province due to rounding. The arrow indicates a negligible difference.pq

Public Exam Course Results
Biology 3201
2016-17
#953 - White Hills Academy, St. Anthony Grades: K-12
NLESD - Western Region
Maintaining
Dynamic
Equilibrium
Reproductions/
Development
Genetic
Continuity
Evolution,
Change and
Diversity
-2
0
2
4
6
8
10
12 11
3
5
3
8
0
3
0
Final MarkExam Mark
2014 2015 2016
Difference from Provincial Mean, 2014-17
2017
0
10
20
30
40
50
60
70
80
90
100
7074
58 60
77
6670
58
78
6669
73
63 62
72
65
2014 2015 2016 2017
4 Year Public Exam (Subtest) Mark Trend 2014-2017
88* The overall Public Exam is equated. Therefore, subtest scores may vary from the overall exam mark.
The school result may appear numerically the same as the district/province due to rounding. The arrow indicates a negligible difference.pq

Public Exam Course Results
Biology 3201
2016-17
#132 - Botwood Collegiate, Botwood Grades: 7-12
NLESD - Central Region
Maintaining
Dynamic
Equilibrium
School
Region
Province
School
Region
Province
School
Region
Province
Genetic
Continuity
School
Region
Evolution,
Change and
Diversity
Reproductions/
Development
Province
Subtest
School
vs
Province
School
vs
Region
Final
Mark
School
vs
Province
School
vs
Region
Public
Exam
Mark
School
Region
Province
q q q q
q
q
q
q
p
q
q
q
61.9 58.4
28Number of Students
60.6
56.8
56.0
54.9
61.0
60.8
66.2
63.0
60.1
58.8
66.4
60.9
63.5 68.2
64.7 69.0
Biology 3201
0
10
20
30
40
50
60
70
80
90
100
65
82
6358
68
87
6562
Final MarkExam Mark
Average Mark, 2014-2017
2014 2015 2016 2017
89* The overall Public Exam is equated. Therefore, subtest scores may vary from the overall exam mark.
The school result may appear numerically the same as the district/province due to rounding. The arrow indicates a negligible difference.pq
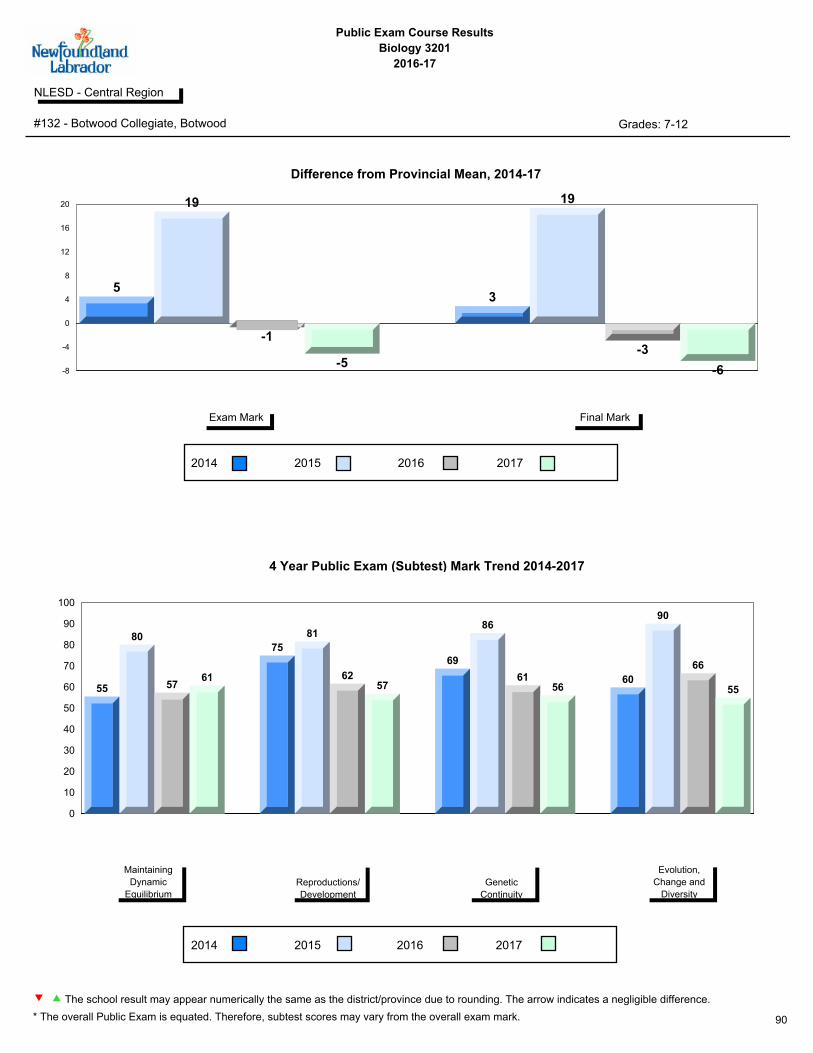
Public Exam Course Results
Biology 3201
2016-17
#132 - Botwood Collegiate, Botwood Grades: 7-12
NLESD - Central Region
Maintaining
Dynamic
Equilibrium
Reproductions/
Development
Genetic
Continuity
Evolution,
Change and
Diversity
-8
-4
0
4
8
12
16
20
5
19
-1
-5
3
19
-3
-6
Final MarkExam Mark
2014 2015 2016
Difference from Provincial Mean, 2014-17
2017
0
10
20
30
40
50
60
70
80
90
100
55
80
5761
75
81
6257
69
86
6156
60
90
66
55
2014 2015 2016 2017
4 Year Public Exam (Subtest) Mark Trend 2014-2017
90* The overall Public Exam is equated. Therefore, subtest scores may vary from the overall exam mark.
The school result may appear numerically the same as the district/province due to rounding. The arrow indicates a negligible difference.pq

Public Exam Course Results
Biology 3201
2016-17
#149 - King Academy, Harbour Breton Grades: 7-12
NLESD - Central Region
Maintaining
Dynamic
Equilibrium
School
Region
Province
School
Region
Province
School
Region
Province
Genetic
Continuity
School
Region
Evolution,
Change and
Diversity
Reproductions/
Development
Province
Subtest
School
vs
Province
School
vs
Region
Final
Mark
School
vs
Province
School
vs
Region
Public
Exam
Mark
School
Region
Province
p p p p
q
p
p
p
p
p
p
q
69.7 65.4
17Number of Students
64.3
61.9
64.9
67.3
61.0
60.8
66.2
63.0
60.1
58.8
66.4
60.9
63.5 68.2
64.7 69.0
Biology 3201
0
10
20
30
40
50
60
70
80
90
100
61
73
65 66
7670
Final MarkExam Mark
Average Mark, 2014-2017
2014 2015 2016 2017
91* The overall Public Exam is equated. Therefore, subtest scores may vary from the overall exam mark.
The school result may appear numerically the same as the district/province due to rounding. The arrow indicates a negligible difference.pq

Public Exam Course Results
Biology 3201
2016-17
#149 - King Academy, Harbour Breton Grades: 7-12
NLESD - Central Region
Maintaining
Dynamic
Equilibrium
Reproductions/
Development
Genetic
Continuity
Evolution,
Change and
Diversity
0
2
4
6
8
10
1
10
21
8
1
Final MarkExam Mark
2014 2015 2016
Difference from Provincial Mean, 2014-17
2017
0
10
20
30
40
50
60
70
80
90
100
51
7064
68 69
6268
76
65
51
77
67
2014 2015 2016 2017
4 Year Public Exam (Subtest) Mark Trend 2014-2017
92* The overall Public Exam is equated. Therefore, subtest scores may vary from the overall exam mark.
The school result may appear numerically the same as the district/province due to rounding. The arrow indicates a negligible difference.pq

Public Exam Course Results
Biology 3201
2016-17
#151 - John Watkins Academy, Hermitage Grades: K-12
NLESD - Central Region
Maintaining
Dynamic
Equilibrium
School
Region
Province
School
Region
Province
School
Region
Province
Genetic
Continuity
School
Region
Evolution,
Change and
Diversity
Reproductions/
Development
Province
Subtest
School
vs
Province
School
vs
Region
Final
Mark
School
vs
Province
School
vs
Region
Public
Exam
Mark
School
Region
Province
p p p p
p
p
p
p
p
p
p
p
1Number of Students
Biology 3201
Final MarkExam Mark
Average Mark, 2014-2017
2014 2015 2016 2017
School data with 5 or fewer
students withheld for reasons of
confidentiality.
School data with 5 or fewer
students withheld for reasons of
confidentiality.
School data with 5 or fewer students withheld for reasons of confidentiality.
93* The overall Public Exam is equated. Therefore, subtest scores may vary from the overall exam mark.
The school result may appear numerically the same as the district/province due to rounding. The arrow indicates a negligible difference.pq
Public Exam Course Results
Biology 3201
2016-17
#151 - John Watkins Academy, Hermitage Grades: K-12
NLESD - Central Region
Maintaining
Dynamic
Equilibrium
Reproductions/
Development
Genetic
Continuity
Evolution,
Change and
Diversity
Final MarkExam Mark
2014 2015 2016
Difference from Provincial Mean, 2014-17
2017
2014 2015 2016 2017
4 Year Public Exam (Subtest) Mark Trend 2014-2017
School data with 5 or fewer students withheld for reasons of confidentiality.
School data with 5 or fewer students withheld for reasons of confidentiality.
94* The overall Public Exam is equated. Therefore, subtest scores may vary from the overall exam mark.
The school result may appear numerically the same as the district/province due to rounding. The arrow indicates a negligible difference.pq

Public Exam Course Results
Biology 3201
2016-17
#163 - Point Leamington Academy, Point Leamington Grades: K-12
NLESD - Central Region
Maintaining
Dynamic
Equilibrium
School
Region
Province
School
Region
Province
School
Region
Province
Genetic
Continuity
School
Region
Evolution,
Change and
Diversity
Reproductions/
Development
Province
Subtest
School
vs
Province
School
vs
Region
Final
Mark
School
vs
Province
School
vs
Region
Public
Exam
Mark
School
Region
Province
q q q q
q
q
q
q
q
q
q
q
59.9 58.1
7Number of Students
57.5
57.4
57.3
53.8
61.0
60.8
66.2
63.0
60.1
58.8
66.4
60.9
63.5 68.2
64.7 69.0
Biology 3201
0
10
20
30
40
50
60
70
80
90
100
64
5256 58
71
56 58 60
Final MarkExam Mark
Average Mark, 2014-2017
2014 2015 2016 2017
95* The overall Public Exam is equated. Therefore, subtest scores may vary from the overall exam mark.
The school result may appear numerically the same as the district/province due to rounding. The arrow indicates a negligible difference.pq

Public Exam Course Results
Biology 3201
2016-17
#163 - Point Leamington Academy, Point Leamington Grades: K-12
NLESD - Central Region
Maintaining
Dynamic
Equilibrium
Reproductions/
Development
Genetic
Continuity
Evolution,
Change and
Diversity
-12
-10
-8
-6
-4
-2
0
2
4
6
3
-11
-8
-5
5
-12-10
-8
Final MarkExam Mark
2014 2015 2016
Difference from Provincial Mean, 2014-17
2017
0
10
20
30
40
50
60
70
80
90
100
60 63
50
58
67
5255 57
69
50 51
5760
46
6054
2014 2015 2016 2017
4 Year Public Exam (Subtest) Mark Trend 2014-2017
96* The overall Public Exam is equated. Therefore, subtest scores may vary from the overall exam mark.
The school result may appear numerically the same as the district/province due to rounding. The arrow indicates a negligible difference.pq

Public Exam Course Results
Biology 3201
2016-17
#165 - St. Stephen's AG, Rencontre East Grades: K-1,3-12
NLESD - Central Region
Maintaining
Dynamic
Equilibrium
School
Region
Province
School
Region
Province
School
Region
Province
Genetic
Continuity
School
Region
Evolution,
Change and
Diversity
Reproductions/
Development
Province
Subtest
School
vs
Province
School
vs
Region
Final
Mark
School
vs
Province
School
vs
Region
Public
Exam
Mark
School
Region
Province
q q q q
q
q
q
q
q
q
q
q
3Number of Students
Biology 3201
Final MarkExam Mark
Average Mark, 2014-2017
2014 2015 2016 2017
School data with 5 or fewer
students withheld for reasons of
confidentiality.
School data with 5 or fewer
students withheld for reasons of
confidentiality.
School data with 5 or fewer students withheld for reasons of confidentiality.
97* The overall Public Exam is equated. Therefore, subtest scores may vary from the overall exam mark.
The school result may appear numerically the same as the district/province due to rounding. The arrow indicates a negligible difference.pq

Public Exam Course Results
Biology 3201
2016-17
#165 - St. Stephen's AG, Rencontre East Grades: K-1,3-12
NLESD - Central Region
Maintaining
Dynamic
Equilibrium
Reproductions/
Development
Genetic
Continuity
Evolution,
Change and
Diversity
Final MarkExam Mark
2014 2015 2016
Difference from Provincial Mean, 2014-17
2017
2014 2015 2016 2017
4 Year Public Exam (Subtest) Mark Trend 2014-2017
School data with 5 or fewer students withheld for reasons of confidentiality.
School data with 5 or fewer students withheld for reasons of confidentiality.
98* The overall Public Exam is equated. Therefore, subtest scores may vary from the overall exam mark.
The school result may appear numerically the same as the district/province due to rounding. The arrow indicates a negligible difference.pq

Public Exam Course Results
Biology 3201
2016-17
#178 - Phoenix Academy, Carmanville Grades: K-12
NLESD - Central Region
Maintaining
Dynamic
Equilibrium
School
Region
Province
School
Region
Province
School
Region
Province
Genetic
Continuity
School
Region
Evolution,
Change and
Diversity
Reproductions/
Development
Province
Subtest
School
vs
Province
School
vs
Region
Final
Mark
School
vs
Province
School
vs
Region
Public
Exam
Mark
School
Region
Province
q q q q
q
q
q
q
q
q
q
q
56.1 50.2
28Number of Students
44.4
49.7
51.0
44.9
61.0
60.8
66.2
63.0
60.1
58.8
66.4
60.9
63.5 68.2
64.7 69.0
Biology 3201
0
10
20
30
40
50
60
70
80
90
100
58 59
50
61 6156
Final MarkExam Mark
Average Mark, 2014-2017
2014 2015 2016 2017
99* The overall Public Exam is equated. Therefore, subtest scores may vary from the overall exam mark.
The school result may appear numerically the same as the district/province due to rounding. The arrow indicates a negligible difference.pq

Public Exam Course Results
Biology 3201
2016-17
#178 - Phoenix Academy, Carmanville Grades: K-12
NLESD - Central Region
Maintaining
Dynamic
Equilibrium
Reproductions/
Development
Genetic
Continuity
Evolution,
Change and
Diversity
-14
-12
-10
-8
-6
-4
-2
0
-2
-4
-13
-5
-6
-12
Final MarkExam Mark
2014 2015 2016
Difference from Provincial Mean, 2014-17
2017
0
10
20
30
40
50
60
70
80
90
100
51
68
44
64 65
50
64
5751
4449
45
2014 2015 2016 2017
4 Year Public Exam (Subtest) Mark Trend 2014-2017
100* The overall Public Exam is equated. Therefore, subtest scores may vary from the overall exam mark.
The school result may appear numerically the same as the district/province due to rounding. The arrow indicates a negligible difference.pq

Public Exam Course Results
Biology 3201
2016-17
#187 - Jane Collins Academy, Hare Bay Grades: 10-12
NLESD - Central Region
Maintaining
Dynamic
Equilibrium
School
Region
Province
School
Region
Province
School
Region
Province
Genetic
Continuity
School
Region
Evolution,
Change and
Diversity
Reproductions/
Development
Province
Subtest
School
vs
Province
School
vs
Region
Final
Mark
School
vs
Province
School
vs
Region
Public
Exam
Mark
School
Region
Province
p p q q
q
q
p
p
p
p
p
q
68.1 65.6
19Number of Students
68.4
60.3
65.5
65.1
61.0
60.8
66.2
63.0
60.1
58.8
66.4
60.9
63.5 68.2
64.7 69.0
Biology 3201
0
10
20
30
40
50
60
70
80
90
100
60
45
6266 63
42
6468
Final MarkExam Mark
Average Mark, 2014-2017
2014 2015 2016 2017
101* The overall Public Exam is equated. Therefore, subtest scores may vary from the overall exam mark.
The school result may appear numerically the same as the district/province due to rounding. The arrow indicates a negligible difference.pq
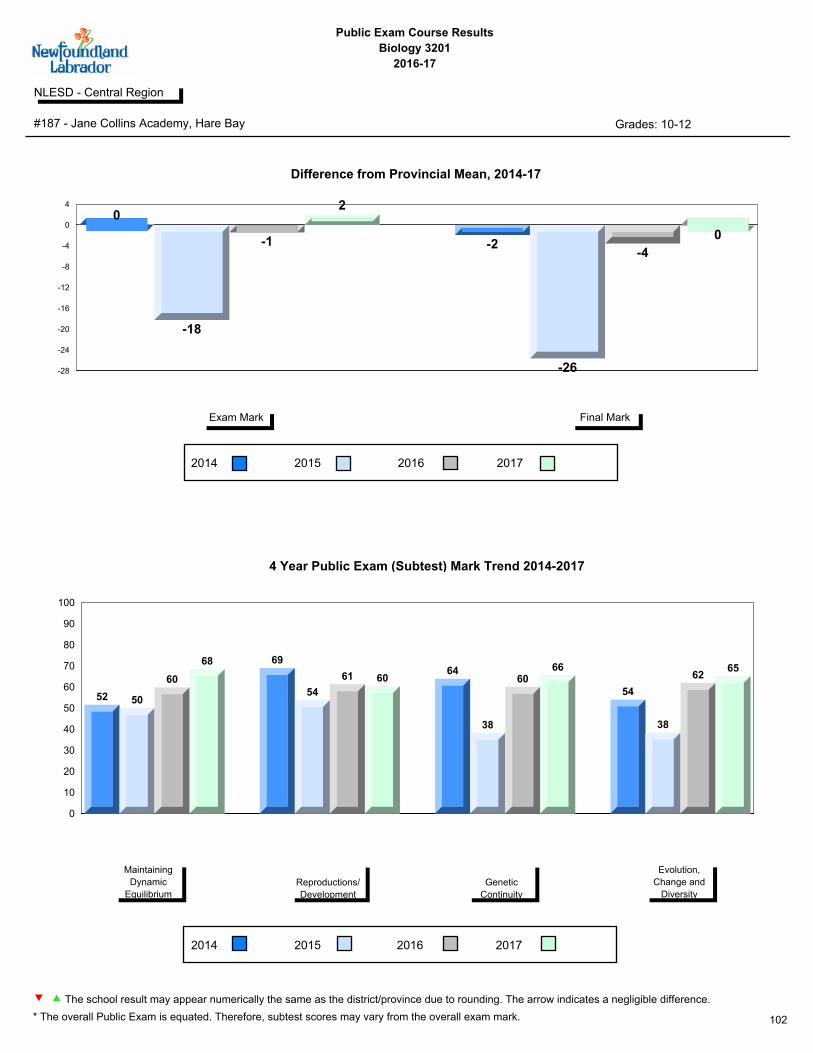
Public Exam Course Results
Biology 3201
2016-17
#187 - Jane Collins Academy, Hare Bay Grades: 10-12
NLESD - Central Region
Maintaining
Dynamic
Equilibrium
Reproductions/
Development
Genetic
Continuity
Evolution,
Change and
Diversity
-28
-24
-20
-16
-12
-8
-4
0
4
0
-18
-1
2
-2
-26
-4
0
Final MarkExam Mark
2014 2015 2016
Difference from Provincial Mean, 2014-17
2017
0
10
20
30
40
50
60
70
80
90
100
52 50
60
68 69
54
61 6064
38
6066
54
38
6265
2014 2015 2016 2017
4 Year Public Exam (Subtest) Mark Trend 2014-2017
102* The overall Public Exam is equated. Therefore, subtest scores may vary from the overall exam mark.
The school result may appear numerically the same as the district/province due to rounding. The arrow indicates a negligible difference.pq

Public Exam Course Results
Biology 3201
2016-17
#190 - Lewisporte Collegiate, Lewisporte Grades: 10-12
NLESD - Central Region
Maintaining
Dynamic
Equilibrium
School
Region
Province
School
Region
Province
School
Region
Province
Genetic
Continuity
School
Region
Evolution,
Change and
Diversity
Reproductions/
Development
Province
Subtest
School
vs
Province
School
vs
Region
Final
Mark
School
vs
Province
School
vs
Region
Public
Exam
Mark
School
Region
Province
q q q q
q
q
q
q
q
q
q
q
63.8 58.0
59Number of Students
53.5
54.6
58.4
60.0
61.0
60.8
66.2
63.0
60.1
58.8
66.4
60.9
63.5 68.2
64.7 69.0
Biology 3201
0
10
20
30
40
50
60
70
80
90
100
6268 66
5865
73 73
64
Final MarkExam Mark
Average Mark, 2014-2017
2014 2015 2016 2017
103* The overall Public Exam is equated. Therefore, subtest scores may vary from the overall exam mark.
The school result may appear numerically the same as the district/province due to rounding. The arrow indicates a negligible difference.pq

Public Exam Course Results
Biology 3201
2016-17
#190 - Lewisporte Collegiate, Lewisporte Grades: 10-12
NLESD - Central Region
Maintaining
Dynamic
Equilibrium
Reproductions/
Development
Genetic
Continuity
Evolution,
Change and
Diversity
-6
-4
-2
0
2
4
6
2
5
3
-6
0
65
-4
Final MarkExam Mark
2014 2015 2016
Difference from Provincial Mean, 2014-17
2017
0
10
20
30
40
50
60
70
80
90
100
52
74
62
54
70 70
63
55
7268 66
58
52
67 69
60
2014 2015 2016 2017
4 Year Public Exam (Subtest) Mark Trend 2014-2017
104* The overall Public Exam is equated. Therefore, subtest scores may vary from the overall exam mark.
The school result may appear numerically the same as the district/province due to rounding. The arrow indicates a negligible difference.pq

Public Exam Course Results
Biology 3201
2016-17
#194 - Gill Memorial Academy, Musgrave Harbour Grades: K-12
NLESD - Central Region
Maintaining
Dynamic
Equilibrium
School
Region
Province
School
Region
Province
School
Region
Province
Genetic
Continuity
School
Region
Evolution,
Change and
Diversity
Reproductions/
Development
Province
Subtest
School
vs
Province
School
vs
Region
Final
Mark
School
vs
Province
School
vs
Region
Public
Exam
Mark
School
Region
Province
q q q q
q
q
p
p
p
p
q
q
65.4 63.4
22Number of Students
52.5
63.6
64.5
66.7
61.0
60.8
66.2
63.0
60.1
58.8
66.4
60.9
63.5 68.2
64.7 69.0
Biology 3201
0
10
20
30
40
50
60
70
80
90
100
61 6367 65
Final MarkExam Mark
Average Mark, 2014-2017
2014 2015 2016 2017
105* The overall Public Exam is equated. Therefore, subtest scores may vary from the overall exam mark.
The school result may appear numerically the same as the district/province due to rounding. The arrow indicates a negligible difference.pq

Public Exam Course Results
Biology 3201
2016-17
#194 - Gill Memorial Academy, Musgrave Harbour Grades: K-12
NLESD - Central Region
Maintaining
Dynamic
Equilibrium
Reproductions/
Development
Genetic
Continuity
Evolution,
Change and
Diversity
-3.2
-2.8
-2.4
-2.0
-1.6
-1.2
-0.8
-0.4
0.0
-2
0 0
-3
Final MarkExam Mark
2014 2015 2016
Difference from Provincial Mean, 2014-17
2017
0
10
20
30
40
50
60
70
80
90
100
65
53
62 64 6265 65 67
2014 2015 2016 2017
4 Year Public Exam (Subtest) Mark Trend 2014-2017
106* The overall Public Exam is equated. Therefore, subtest scores may vary from the overall exam mark.
The school result may appear numerically the same as the district/province due to rounding. The arrow indicates a negligible difference.pq

Public Exam Course Results
Biology 3201
2016-17
#196 - St. Gabriel's AG, St. Brendan's Grades: 1-3,5-6,9-12
NLESD - Central Region
Maintaining
Dynamic
Equilibrium
School
Region
Province
School
Region
Province
School
Region
Province
Genetic
Continuity
School
Region
Evolution,
Change and
Diversity
Reproductions/
Development
Province
Subtest
School
vs
Province
School
vs
Region
Final
Mark
School
vs
Province
School
vs
Region
Public
Exam
Mark
School
Region
Province
p p p p
p
p
p
p
p
p
p
p
1Number of Students
Biology 3201
Final MarkExam Mark
Average Mark, 2014-2017
2014 2015 2016 2017
School data with 5 or fewer
students withheld for reasons of
confidentiality.
School data with 5 or fewer
students withheld for reasons of
confidentiality.
School data with 5 or fewer students withheld for reasons of confidentiality.
107* The overall Public Exam is equated. Therefore, subtest scores may vary from the overall exam mark.
The school result may appear numerically the same as the district/province due to rounding. The arrow indicates a negligible difference.pq

Public Exam Course Results
Biology 3201
2016-17
#196 - St. Gabriel's AG, St. Brendan's Grades: 1-3,5-6,9-12
NLESD - Central Region
Maintaining
Dynamic
Equilibrium
Reproductions/
Development
Genetic
Continuity
Evolution,
Change and
Diversity
Final MarkExam Mark
2014 2015 2016
Difference from Provincial Mean, 2014-17
2017
2014 2015 2016 2017
4 Year Public Exam (Subtest) Mark Trend 2014-2017
School data with 5 or fewer students withheld for reasons of confidentiality.
School data with 5 or fewer students withheld for reasons of confidentiality.
108* The overall Public Exam is equated. Therefore, subtest scores may vary from the overall exam mark.
The school result may appear numerically the same as the district/province due to rounding. The arrow indicates a negligible difference.pq

Public Exam Course Results
Biology 3201
2016-17
#201 - J.M. Olds Collegiate, Twillingate Grades: 7-12
NLESD - Central Region
Maintaining
Dynamic
Equilibrium
School
Region
Province
School
Region
Province
School
Region
Province
Genetic
Continuity
School
Region
Evolution,
Change and
Diversity
Reproductions/
Development
Province
Subtest
School
vs
Province
School
vs
Region
Final
Mark
School
vs
Province
School
vs
Region
Public
Exam
Mark
School
Region
Province
p p p p
p
p
p
p
p
p
p
p
73.3 71.2
17Number of Students
65.0
71.2
70.8
75.5
61.0
60.8
66.2
63.0
60.1
58.8
66.4
60.9
63.5 68.2
64.7 69.0
Biology 3201
0
10
20
30
40
50
60
70
80
90
100
7065
6871
75
6670
73
Final MarkExam Mark
Average Mark, 2014-2017
2014 2015 2016 2017
109* The overall Public Exam is equated. Therefore, subtest scores may vary from the overall exam mark.
The school result may appear numerically the same as the district/province due to rounding. The arrow indicates a negligible difference.pq

Public Exam Course Results
Biology 3201
2016-17
#201 - J.M. Olds Collegiate, Twillingate Grades: 7-12
NLESD - Central Region
Maintaining
Dynamic
Equilibrium
Reproductions/
Development
Genetic
Continuity
Evolution,
Change and
Diversity
-2
0
2
4
6
8
10
12
10
1
4
8
10
-1
2
5
Final MarkExam Mark
2014 2015 2016
Difference from Provincial Mean, 2014-17
2017
0
10
20
30
40
50
60
70
80
90
100
63
74
6165
75
63
70 71
79
6470 71
65 63
7075
2014 2015 2016 2017
4 Year Public Exam (Subtest) Mark Trend 2014-2017
110* The overall Public Exam is equated. Therefore, subtest scores may vary from the overall exam mark.
The school result may appear numerically the same as the district/province due to rounding. The arrow indicates a negligible difference.pq
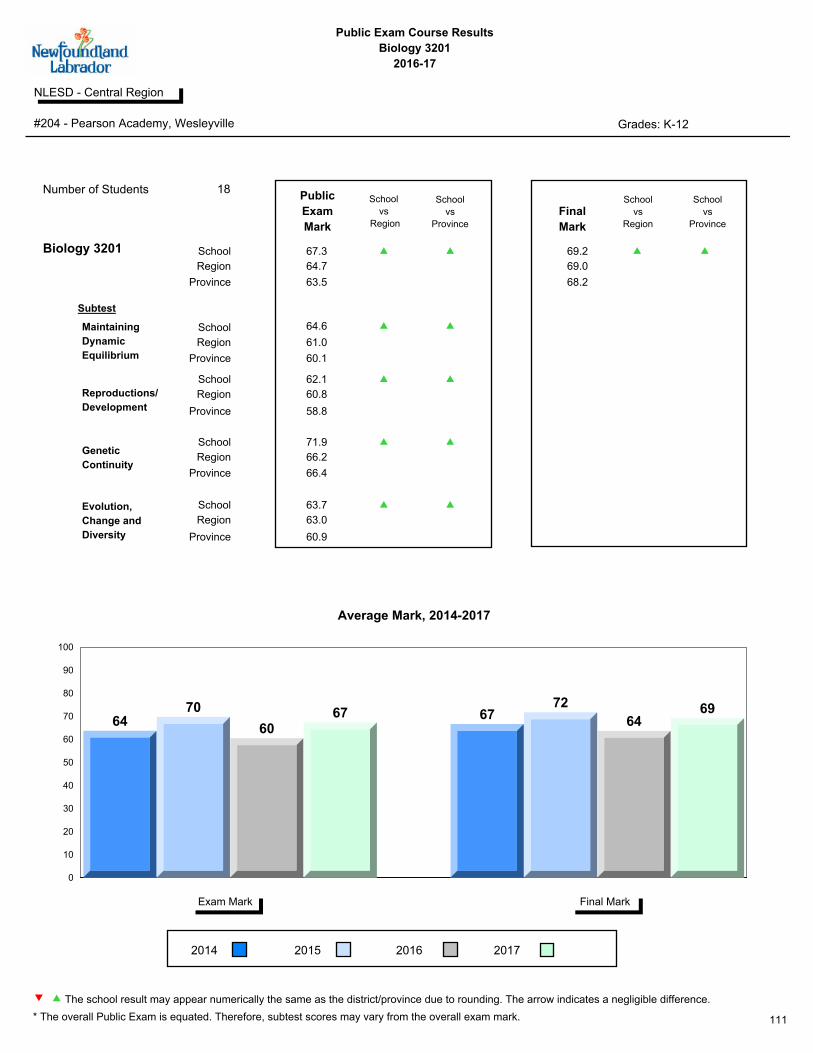
Public Exam Course Results
Biology 3201
2016-17
#204 - Pearson Academy, Wesleyville Grades: K-12
NLESD - Central Region
Maintaining
Dynamic
Equilibrium
School
Region
Province
School
Region
Province
School
Region
Province
Genetic
Continuity
School
Region
Evolution,
Change and
Diversity
Reproductions/
Development
Province
Subtest
School
vs
Province
School
vs
Region
Final
Mark
School
vs
Province
School
vs
Region
Public
Exam
Mark
School
Region
Province
p p p p
p
p
p
p
p
p
p
p
69.2 67.3
18Number of Students
64.6
62.1
71.9
63.7
61.0
60.8
66.2
63.0
60.1
58.8
66.4
60.9
63.5 68.2
64.7 69.0
Biology 3201
0
10
20
30
40
50
60
70
80
90
100
6470
6067 67
72
6469
Final MarkExam Mark
Average Mark, 2014-2017
2014 2015 2016 2017
111* The overall Public Exam is equated. Therefore, subtest scores may vary from the overall exam mark.
The school result may appear numerically the same as the district/province due to rounding. The arrow indicates a negligible difference.pq

Public Exam Course Results
Biology 3201
2016-17
#204 - Pearson Academy, Wesleyville Grades: K-12
NLESD - Central Region
Maintaining
Dynamic
Equilibrium
Reproductions/
Development
Genetic
Continuity
Evolution,
Change and
Diversity
-6
-4
-2
0
2
4
6
8
4
6
-3
4
1
4
-4
1
Final MarkExam Mark
2014 2015 2016
Difference from Provincial Mean, 2014-17
2017
0
10
20
30
40
50
60
70
80
90
100
55
76
55
6568
74
5962
68 70
57
72
65
52
66 64
2014 2015 2016 2017
4 Year Public Exam (Subtest) Mark Trend 2014-2017
112* The overall Public Exam is equated. Therefore, subtest scores may vary from the overall exam mark.
The school result may appear numerically the same as the district/province due to rounding. The arrow indicates a negligible difference.pq

Public Exam Course Results
Biology 3201
2016-17
#206 - Riverwood Academy, Wing's Point Grades: K-12
NLESD - Central Region
Maintaining
Dynamic
Equilibrium
School
Region
Province
School
Region
Province
School
Region
Province
Genetic
Continuity
School
Region
Evolution,
Change and
Diversity
Reproductions/
Development
Province
Subtest
School
vs
Province
School
vs
Region
Final
Mark
School
vs
Province
School
vs
Region
Public
Exam
Mark
School
Region
Province
q q q q
q
q
q
p p
p
q
q
66.7 62.3
15Number of Students
63.7
54.2
64.7
62.7
61.0
60.8
66.2
63.0
60.1
58.8
66.4
60.9
63.5 68.2
64.7 69.0
Biology 3201
0
10
20
30
40
50
60
70
80
90
100
53 5359
62 6158
6367
Final MarkExam Mark
Average Mark, 2014-2017
2014 2015 2016 2017
113* The overall Public Exam is equated. Therefore, subtest scores may vary from the overall exam mark.
The school result may appear numerically the same as the district/province due to rounding. The arrow indicates a negligible difference.pq

Public Exam Course Results
Biology 3201
2016-17
#206 - Riverwood Academy, Wing's Point Grades: K-12
NLESD - Central Region
Maintaining
Dynamic
Equilibrium
Reproductions/
Development
Genetic
Continuity
Evolution,
Change and
Diversity
-12
-10
-8
-6
-4
-2
0
-7
-10
-5
-1
-4
-10
-5
-2
Final MarkExam Mark
2014 2015 2016
Difference from Provincial Mean, 2014-17
2017
0
10
20
30
40
50
60
70
80
90
100
43
6359
6459
53 54 54 54 5359
65
51
43
5763
2014 2015 2016 2017
4 Year Public Exam (Subtest) Mark Trend 2014-2017
114* The overall Public Exam is equated. Therefore, subtest scores may vary from the overall exam mark.
The school result may appear numerically the same as the district/province due to rounding. The arrow indicates a negligible difference.pq

Public Exam Course Results
Biology 3201
2016-17
#214 - John Burke High School, Grand Bank Grades: 8-12
NLESD - Central Region
Maintaining
Dynamic
Equilibrium
School
Region
Province
School
Region
Province
School
Region
Province
Genetic
Continuity
School
Region
Evolution,
Change and
Diversity
Reproductions/
Development
Province
Subtest
School
vs
Province
School
vs
Region
Final
Mark
School
vs
Province
School
vs
Region
Public
Exam
Mark
School
Region
Province
q q p p
q
q
q
q
p
q
q
q
69.4 62.0
28Number of Students
60.6
56.8
64.0
59.2
61.0
60.8
66.2
63.0
60.1
58.8
66.4
60.9
63.5 68.2
64.7 69.0
Biology 3201
0
10
20
30
40
50
60
70
80
90
100
5754
61 62 64 6166
69
Final MarkExam Mark
Average Mark, 2014-2017
2014 2015 2016 2017
115* The overall Public Exam is equated. Therefore, subtest scores may vary from the overall exam mark.
The school result may appear numerically the same as the district/province due to rounding. The arrow indicates a negligible difference.pq

Public Exam Course Results
Biology 3201
2016-17
#214 - John Burke High School, Grand Bank Grades: 8-12
NLESD - Central Region
Maintaining
Dynamic
Equilibrium
Reproductions/
Development
Genetic
Continuity
Evolution,
Change and
Diversity
-10
-8
-6
-4
-2
0
2
-3
-9
-3-2 -1
-6
-2
1
Final MarkExam Mark
2014 2015 2016
Difference from Provincial Mean, 2014-17
2017
0
10
20
30
40
50
60
70
80
90
100
48
67
53
61 60
5359 57
66
5561
64
51
39
61 59
2014 2015 2016 2017
4 Year Public Exam (Subtest) Mark Trend 2014-2017
116* The overall Public Exam is equated. Therefore, subtest scores may vary from the overall exam mark.
The school result may appear numerically the same as the district/province due to rounding. The arrow indicates a negligible difference.pq

Public Exam Course Results
Biology 3201
2016-17
#218 - St. Joseph's Academy, Lamaline Grades: K-12
NLESD - Central Region
Maintaining
Dynamic
Equilibrium
School
Region
Province
School
Region
Province
School
Region
Province
Genetic
Continuity
School
Region
Evolution,
Change and
Diversity
Reproductions/
Development
Province
Subtest
School
vs
Province
School
vs
Region
Final
Mark
School
vs
Province
School
vs
Region
Public
Exam
Mark
School
Region
Province
p p p p
q
q
p
p
p
p
p
q
71.3 66.5
8Number of Students
66.6
59.3
66.0
72.5
61.0
60.8
66.2
63.0
60.1
58.8
66.4
60.9
63.5 68.2
64.7 69.0
Biology 3201
0
10
20
30
40
50
60
70
80
90
100
59
69 6762
73 71
Final MarkExam Mark
Average Mark, 2014-2017
2014 2015 2016 2017
117* The overall Public Exam is equated. Therefore, subtest scores may vary from the overall exam mark.
The school result may appear numerically the same as the district/province due to rounding. The arrow indicates a negligible difference.pq
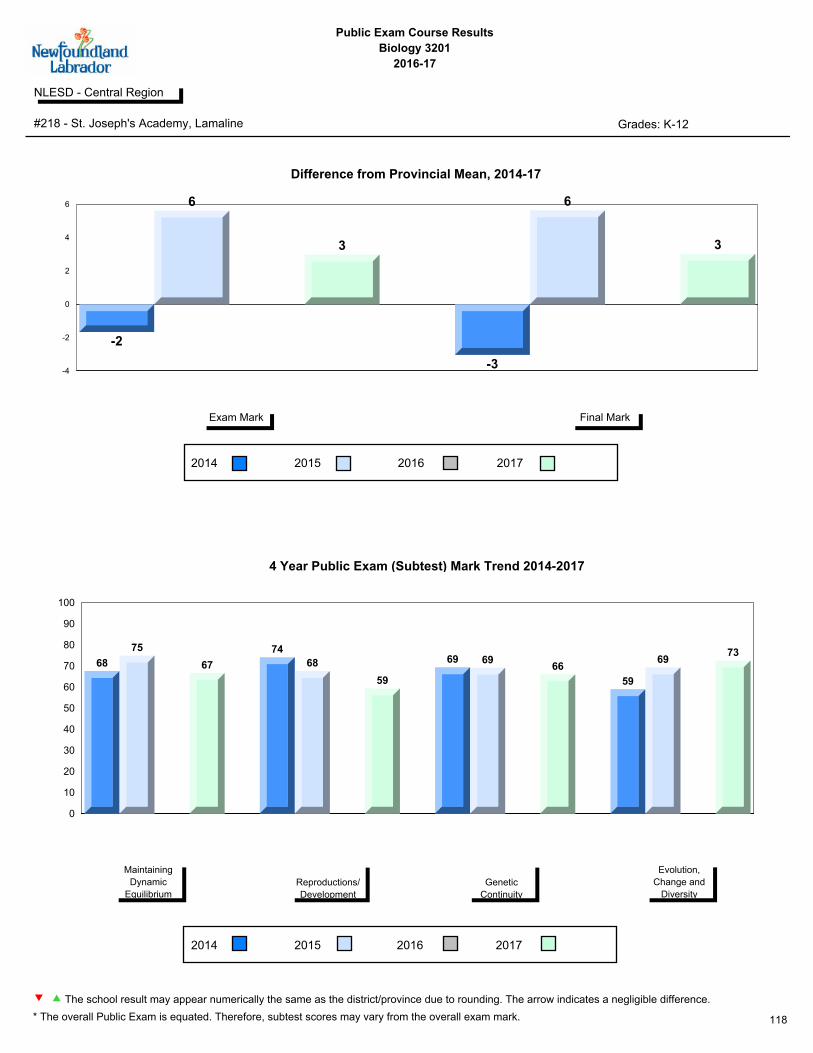
Public Exam Course Results
Biology 3201
2016-17
#218 - St. Joseph's Academy, Lamaline Grades: K-12
NLESD - Central Region
Maintaining
Dynamic
Equilibrium
Reproductions/
Development
Genetic
Continuity
Evolution,
Change and
Diversity
-4
-2
0
2
4
6
-2
6
3
-3
6
3
Final MarkExam Mark
2014 2015 2016
Difference from Provincial Mean, 2014-17
2017
0
10
20
30
40
50
60
70
80
90
100
68
75
67
74
68
59
69 6966
59
6973
2014 2015 2016 2017
4 Year Public Exam (Subtest) Mark Trend 2014-2017
118* The overall Public Exam is equated. Therefore, subtest scores may vary from the overall exam mark.
The school result may appear numerically the same as the district/province due to rounding. The arrow indicates a negligible difference.pq

Public Exam Course Results
Biology 3201
2016-17
#219 - Marystown Central High School, Marystown Grades: 10-12
NLESD - Central Region
Maintaining
Dynamic
Equilibrium
School
Region
Province
School
Region
Province
School
Region
Province
Genetic
Continuity
School
Region
Evolution,
Change and
Diversity
Reproductions/
Development
Province
Subtest
School
vs
Province
School
vs
Region
Final
Mark
School
vs
Province
School
vs
Region
Public
Exam
Mark
School
Region
Province
p p p p
q
p
p
p
p
p
p
q
70.1 65.1
67Number of Students
63.1
61.9
70.2
54.1
61.0
60.8
66.2
63.0
60.1
58.8
66.4
60.9
63.5 68.2
64.7 69.0
Biology 3201
0
10
20
30
40
50
60
70
80
90
100
57 5863 65
61 6066
70
Final MarkExam Mark
Average Mark, 2014-2017
2014 2015 2016 2017
119* The overall Public Exam is equated. Therefore, subtest scores may vary from the overall exam mark.
The school result may appear numerically the same as the district/province due to rounding. The arrow indicates a negligible difference.pq

Public Exam Course Results
Biology 3201
2016-17
#219 - Marystown Central High School, Marystown Grades: 10-12
NLESD - Central Region
Maintaining
Dynamic
Equilibrium
Reproductions/
Development
Genetic
Continuity
Evolution,
Change and
Diversity
-8
-6
-4
-2
0
2
-3
-5
-1
2
-4
-7
-2
2
Final MarkExam Mark
2014 2015 2016
Difference from Provincial Mean, 2014-17
2017
0
10
20
30
40
50
60
70
80
90
100
48
66
56
63 6561 61 62
65
5864
70
47 48
6054
2014 2015 2016 2017
4 Year Public Exam (Subtest) Mark Trend 2014-2017
120* The overall Public Exam is equated. Therefore, subtest scores may vary from the overall exam mark.
The school result may appear numerically the same as the district/province due to rounding. The arrow indicates a negligible difference.pq

Public Exam Course Results
Biology 3201
2016-17
#223 - Christ the King School, Rushoon Grades: K-12
NLESD - Central Region
Maintaining
Dynamic
Equilibrium
School
Region
Province
School
Region
Province
School
Region
Province
Genetic
Continuity
School
Region
Evolution,
Change and
Diversity
Reproductions/
Development
Province
Subtest
School
vs
Province
School
vs
Region
Final
Mark
School
vs
Province
School
vs
Region
Public
Exam
Mark
School
Region
Province
q q q q
q
q
q
q
q
q
q
q
3Number of Students
Biology 3201
Final MarkExam Mark
Average Mark, 2014-2017
2014 2015 2016 2017
School data with 5 or fewer
students withheld for reasons of
confidentiality.
School data with 5 or fewer
students withheld for reasons of
confidentiality.
School data with 5 or fewer students withheld for reasons of confidentiality.
121* The overall Public Exam is equated. Therefore, subtest scores may vary from the overall exam mark.
The school result may appear numerically the same as the district/province due to rounding. The arrow indicates a negligible difference.pq

Public Exam Course Results
Biology 3201
2016-17
#223 - Christ the King School, Rushoon Grades: K-12
NLESD - Central Region
Maintaining
Dynamic
Equilibrium
Reproductions/
Development
Genetic
Continuity
Evolution,
Change and
Diversity
Final MarkExam Mark
2014 2015 2016
Difference from Provincial Mean, 2014-17
2017
2014 2015 2016 2017
4 Year Public Exam (Subtest) Mark Trend 2014-2017
School data with 5 or fewer students withheld for reasons of confidentiality.
School data with 5 or fewer students withheld for reasons of confidentiality.
122* The overall Public Exam is equated. Therefore, subtest scores may vary from the overall exam mark.
The school result may appear numerically the same as the district/province due to rounding. The arrow indicates a negligible difference.pq

Public Exam Course Results
Biology 3201
2016-17
#228 - St. Lawrence Academy, St. Lawrence Grades: K-12
NLESD - Central Region
Maintaining
Dynamic
Equilibrium
School
Region
Province
School
Region
Province
School
Region
Province
Genetic
Continuity
School
Region
Evolution,
Change and
Diversity
Reproductions/
Development
Province
Subtest
School
vs
Province
School
vs
Region
Final
Mark
School
vs
Province
School
vs
Region
Public
Exam
Mark
School
Region
Province
q q q q
q
q
q
q
q
q
q
q
2Number of Students
Biology 3201
Final MarkExam Mark
Average Mark, 2014-2017
2014 2015 2016 2017
School data with 5 or fewer
students withheld for reasons of
confidentiality.
School data with 5 or fewer
students withheld for reasons of
confidentiality.
School data with 5 or fewer students withheld for reasons of confidentiality.
123* The overall Public Exam is equated. Therefore, subtest scores may vary from the overall exam mark.
The school result may appear numerically the same as the district/province due to rounding. The arrow indicates a negligible difference.pq

Public Exam Course Results
Biology 3201
2016-17
#228 - St. Lawrence Academy, St. Lawrence Grades: K-12
NLESD - Central Region
Maintaining
Dynamic
Equilibrium
Reproductions/
Development
Genetic
Continuity
Evolution,
Change and
Diversity
Final MarkExam Mark
2014 2015 2016
Difference from Provincial Mean, 2014-17
2017
2014 2015 2016 2017
4 Year Public Exam (Subtest) Mark Trend 2014-2017
School data with 5 or fewer students withheld for reasons of confidentiality.
School data with 5 or fewer students withheld for reasons of confidentiality.
124* The overall Public Exam is equated. Therefore, subtest scores may vary from the overall exam mark.
The school result may appear numerically the same as the district/province due to rounding. The arrow indicates a negligible difference.pq

Public Exam Course Results
Biology 3201
2016-17
#231 - Discovery Collegiate, Bonavista Grades: 7-12
NLESD - Central Region
Maintaining
Dynamic
Equilibrium
School
Region
Province
School
Region
Province
School
Region
Province
Genetic
Continuity
School
Region
Evolution,
Change and
Diversity
Reproductions/
Development
Province
Subtest
School
vs
Province
School
vs
Region
Final
Mark
School
vs
Province
School
vs
Region
Public
Exam
Mark
School
Region
Province
q p p p
q
q
p
p
p
p
q
q
71.3 64.0
62Number of Students
59.2
62.0
64.6
66.1
61.0
60.8
66.2
63.0
60.1
58.8
66.4
60.9
63.5 68.2
64.7 69.0
Biology 3201
0
10
20
30
40
50
60
70
80
90
100
52
69
5964
59
7366
71
Final MarkExam Mark
Average Mark, 2014-2017
2014 2015 2016 2017
125* The overall Public Exam is equated. Therefore, subtest scores may vary from the overall exam mark.
The school result may appear numerically the same as the district/province due to rounding. The arrow indicates a negligible difference.pq

Public Exam Course Results
Biology 3201
2016-17
#231 - Discovery Collegiate, Bonavista Grades: 7-12
NLESD - Central Region
Maintaining
Dynamic
Equilibrium
Reproductions/
Development
Genetic
Continuity
Evolution,
Change and
Diversity
-10
-8
-6
-4
-2
0
2
4
6
-8
6
-5
0
-6
5
-2
3
Final MarkExam Mark
2014 2015 2016
Difference from Provincial Mean, 2014-17
2017
0
10
20
30
40
50
60
70
80
90
100
37
78
47
5962
68
5762 61
67
5965
43
70
6066
2014 2015 2016 2017
4 Year Public Exam (Subtest) Mark Trend 2014-2017
126* The overall Public Exam is equated. Therefore, subtest scores may vary from the overall exam mark.
The school result may appear numerically the same as the district/province due to rounding. The arrow indicates a negligible difference.pq

Public Exam Course Results
Biology 3201
2016-17
#235 - Clarenville High School, Clarenville Grades: 10-12
NLESD - Central Region
Maintaining
Dynamic
Equilibrium
School
Region
Province
School
Region
Province
School
Region
Province
Genetic
Continuity
School
Region
Evolution,
Change and
Diversity
Reproductions/
Development
Province
Subtest
School
vs
Province
School
vs
Region
Final
Mark
School
vs
Province
School
vs
Region
Public
Exam
Mark
School
Region
Province
p p p p
p
p
p
p
p
p
p
p
72.1 69.8
66Number of Students
66.3
65.9
70.6
74.9
61.0
60.8
66.2
63.0
60.1
58.8
66.4
60.9
63.5 68.2
64.7 69.0
Biology 3201
0
10
20
30
40
50
60
70
80
90
100
6672 72 70 72
76 7672
Final MarkExam Mark
Average Mark, 2014-2017
2014 2015 2016 2017
127* The overall Public Exam is equated. Therefore, subtest scores may vary from the overall exam mark.
The school result may appear numerically the same as the district/province due to rounding. The arrow indicates a negligible difference.pq

Public Exam Course Results
Biology 3201
2016-17
#235 - Clarenville High School, Clarenville Grades: 10-12
NLESD - Central Region
Maintaining
Dynamic
Equilibrium
Reproductions/
Development
Genetic
Continuity
Evolution,
Change and
Diversity
0
2
4
6
8
10
6
9 9
67
9
8
4
Final MarkExam Mark
2014 2015 2016
Difference from Provincial Mean, 2014-17
2017
0
10
20
30
40
50
60
70
80
90
100
56
81
68 66 6871
74
66
73 73 72 7166
70
77 75
2014 2015 2016 2017
4 Year Public Exam (Subtest) Mark Trend 2014-2017
128* The overall Public Exam is equated. Therefore, subtest scores may vary from the overall exam mark.
The school result may appear numerically the same as the district/province due to rounding. The arrow indicates a negligible difference.pq

Public Exam Course Results
Biology 3201
2016-17
#242 - Random Island Academy, Hickman's Harbour Grades: K-1,3-12
NLESD - Central Region
Maintaining
Dynamic
Equilibrium
School
Region
Province
School
Region
Province
School
Region
Province
Genetic
Continuity
School
Region
Evolution,
Change and
Diversity
Reproductions/
Development
Province
Subtest
School
vs
Province
School
vs
Region
Final
Mark
School
vs
Province
School
vs
Region
Public
Exam
Mark
School
Region
Province
p p p p
p
p
p
p
p
p
p
p
73.3 68.2
9Number of Students
61.9
60.9
74.9
65.6
61.0
60.8
66.2
63.0
60.1
58.8
66.4
60.9
63.5 68.2
64.7 69.0
Biology 3201
0
10
20
30
40
50
60
70
80
90
100
6356
68 6662
73
Final MarkExam Mark
Average Mark, 2014-2017
2014 2015 2016 2017
129* The overall Public Exam is equated. Therefore, subtest scores may vary from the overall exam mark.
The school result may appear numerically the same as the district/province due to rounding. The arrow indicates a negligible difference.pq

Public Exam Course Results
Biology 3201
2016-17
#242 - Random Island Academy, Hickman's Harbour Grades: K-1,3-12
NLESD - Central Region
Maintaining
Dynamic
Equilibrium
Reproductions/
Development
Genetic
Continuity
Evolution,
Change and
Diversity
-8
-6
-4
-2
0
2
4
6
2
-7
5
1
-6
5
Final MarkExam Mark
2014 2015 2016
Difference from Provincial Mean, 2014-17
2017
0
10
20
30
40
50
60
70
80
90
100
59
69
62
69
59 61
70
56
75
45
35
66
2014 2015 2016 2017
4 Year Public Exam (Subtest) Mark Trend 2014-2017
130* The overall Public Exam is equated. Therefore, subtest scores may vary from the overall exam mark.
The school result may appear numerically the same as the district/province due to rounding. The arrow indicates a negligible difference.pq

Public Exam Course Results
Biology 3201
2016-17
#402 - Leo Burke Academy, Bishop's Falls Grades: 7-12
NLESD - Central Region
Maintaining
Dynamic
Equilibrium
School
Region
Province
School
Region
Province
School
Region
Province
Genetic
Continuity
School
Region
Evolution,
Change and
Diversity
Reproductions/
Development
Province
Subtest
School
vs
Province
School
vs
Region
Final
Mark
School
vs
Province
School
vs
Region
Public
Exam
Mark
School
Region
Province
p p p p
p
p
p
p
p
p
p
p
70.4 67.0
25Number of Students
66.0
66.4
67.2
63.9
61.0
60.8
66.2
63.0
60.1
58.8
66.4
60.9
63.5 68.2
64.7 69.0
Biology 3201
0
10
20
30
40
50
60
70
80
90
100
58
68
58
6763
71
60
70
Final MarkExam Mark
Average Mark, 2014-2017
2014 2015 2016 2017
131* The overall Public Exam is equated. Therefore, subtest scores may vary from the overall exam mark.
The school result may appear numerically the same as the district/province due to rounding. The arrow indicates a negligible difference.pq

Public Exam Course Results
Biology 3201
2016-17
#402 - Leo Burke Academy, Bishop's Falls Grades: 7-12
NLESD - Central Region
Maintaining
Dynamic
Equilibrium
Reproductions/
Development
Genetic
Continuity
Evolution,
Change and
Diversity
-8
-6
-4
-2
0
2
4
6
-2
4
-6
3
-2
3
-8
2
Final MarkExam Mark
2014 2015 2016
Difference from Provincial Mean, 2014-17
2017
0
10
20
30
40
50
60
70
80
90
100
50
77
56
66 6670
56
6664 63
57
67
49
66
54
64
2014 2015 2016 2017
4 Year Public Exam (Subtest) Mark Trend 2014-2017
132* The overall Public Exam is equated. Therefore, subtest scores may vary from the overall exam mark.
The school result may appear numerically the same as the district/province due to rounding. The arrow indicates a negligible difference.pq

Public Exam Course Results
Biology 3201
2016-17
#403 - Lakeside Academy, Buchans Grades: K-12
NLESD - Central Region
Maintaining
Dynamic
Equilibrium
School
Region
Province
School
Region
Province
School
Region
Province
Genetic
Continuity
School
Region
Evolution,
Change and
Diversity
Reproductions/
Development
Province
Subtest
School
vs
Province
School
vs
Region
Final
Mark
School
vs
Province
School
vs
Region
Public
Exam
Mark
School
Region
Province
p p p p
p
p
p
p
p
p
p
q
69.1 66.8
8Number of Students
66.6
65.5
66.3
63.8
61.0
60.8
66.2
63.0
60.1
58.8
66.4
60.9
63.5 68.2
64.7 69.0
Biology 3201
0
10
20
30
40
50
60
70
80
90
100
6661
67 68 68 69
Final MarkExam Mark
Average Mark, 2014-2017
2014 2015 2016 2017
133* The overall Public Exam is equated. Therefore, subtest scores may vary from the overall exam mark.
The school result may appear numerically the same as the district/province due to rounding. The arrow indicates a negligible difference.pq

Public Exam Course Results
Biology 3201
2016-17
#403 - Lakeside Academy, Buchans Grades: K-12
NLESD - Central Region
Maintaining
Dynamic
Equilibrium
Reproductions/
Development
Genetic
Continuity
Evolution,
Change and
Diversity
-3
-2
-1
0
1
2
3
4
3
-3
3
1
0
1
Final MarkExam Mark
2014 2015 2016
Difference from Provincial Mean, 2014-17
2017
0
10
20
30
40
50
60
70
80
90
100
76
53
6772
6166
69
57
66
44
63 64
2014 2015 2016 2017
4 Year Public Exam (Subtest) Mark Trend 2014-2017
134* The overall Public Exam is equated. Therefore, subtest scores may vary from the overall exam mark.
The school result may appear numerically the same as the district/province due to rounding. The arrow indicates a negligible difference.pq

Public Exam Course Results
Biology 3201
2016-17
#406 - Fitzgerald Academy, English Harbour West Grades: K-12
NLESD - Central Region
Maintaining
Dynamic
Equilibrium
School
Region
Province
School
Region
Province
School
Region
Province
Genetic
Continuity
School
Region
Evolution,
Change and
Diversity
Reproductions/
Development
Province
Subtest
School
vs
Province
School
vs
Region
Final
Mark
School
vs
Province
School
vs
Region
Public
Exam
Mark
School
Region
Province
p p p p
p
p
p
p
p
p
p
p
3Number of Students
Biology 3201
Final MarkExam Mark
Average Mark, 2014-2017
2014 2015 2016 2017
School data with 5 or fewer
students withheld for reasons of
confidentiality.
School data with 5 or fewer
students withheld for reasons of
confidentiality.
School data with 5 or fewer students withheld for reasons of confidentiality.
135* The overall Public Exam is equated. Therefore, subtest scores may vary from the overall exam mark.
The school result may appear numerically the same as the district/province due to rounding. The arrow indicates a negligible difference.pq

Public Exam Course Results
Biology 3201
2016-17
#406 - Fitzgerald Academy, English Harbour West Grades: K-12
NLESD - Central Region
Maintaining
Dynamic
Equilibrium
Reproductions/
Development
Genetic
Continuity
Evolution,
Change and
Diversity
Final MarkExam Mark
2014 2015 2016
Difference from Provincial Mean, 2014-17
2017
2014 2015 2016 2017
4 Year Public Exam (Subtest) Mark Trend 2014-2017
School data with 5 or fewer students withheld for reasons of confidentiality.
School data with 5 or fewer students withheld for reasons of confidentiality.
136* The overall Public Exam is equated. Therefore, subtest scores may vary from the overall exam mark.
The school result may appear numerically the same as the district/province due to rounding. The arrow indicates a negligible difference.pq
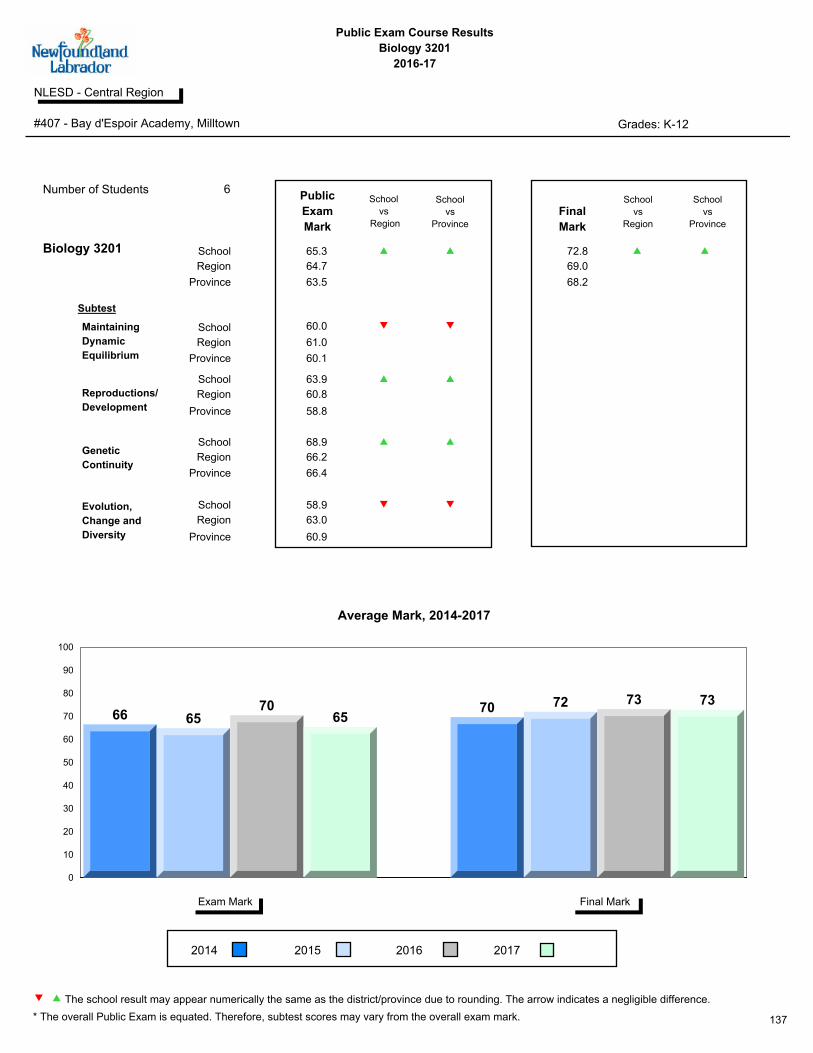
Public Exam Course Results
Biology 3201
2016-17
#407 - Bay d'Espoir Academy, Milltown Grades: K-12
NLESD - Central Region
Maintaining
Dynamic
Equilibrium
School
Region
Province
School
Region
Province
School
Region
Province
Genetic
Continuity
School
Region
Evolution,
Change and
Diversity
Reproductions/
Development
Province
Subtest
School
vs
Province
School
vs
Region
Final
Mark
School
vs
Province
School
vs
Region
Public
Exam
Mark
School
Region
Province
p p p p
q
q
p
p
p
p
q
q
72.8 65.3
6Number of Students
60.0
63.9
68.9
58.9
61.0
60.8
66.2
63.0
60.1
58.8
66.4
60.9
63.5 68.2
64.7 69.0
Biology 3201
0
10
20
30
40
50
60
70
80
90
100
66 6570
6570 72 73 73
Final MarkExam Mark
Average Mark, 2014-2017
2014 2015 2016 2017
137* The overall Public Exam is equated. Therefore, subtest scores may vary from the overall exam mark.
The school result may appear numerically the same as the district/province due to rounding. The arrow indicates a negligible difference.pq

Public Exam Course Results
Biology 3201
2016-17
#407 - Bay d'Espoir Academy, Milltown Grades: K-12
NLESD - Central Region
Maintaining
Dynamic
Equilibrium
Reproductions/
Development
Genetic
Continuity
Evolution,
Change and
Diversity
0
1
2
3
4
5
6
76
2
7
2
4 4
55
Final MarkExam Mark
2014 2015 2016
Difference from Provincial Mean, 2014-17
2017
0
10
20
30
40
50
60
70
80
90
100
56
70
60 60
7165 67
64
76
65
76
69
5962
74
59
2014 2015 2016 2017
4 Year Public Exam (Subtest) Mark Trend 2014-2017
138* The overall Public Exam is equated. Therefore, subtest scores may vary from the overall exam mark.
The school result may appear numerically the same as the district/province due to rounding. The arrow indicates a negligible difference.pq

Public Exam Course Results
Biology 3201
2016-17
#413 - Holy Cross School Complex, Eastport Grades: K-12
NLESD - Central Region
Maintaining
Dynamic
Equilibrium
School
Region
Province
School
Region
Province
School
Region
Province
Genetic
Continuity
School
Region
Evolution,
Change and
Diversity
Reproductions/
Development
Province
Subtest
School
vs
Province
School
vs
Region
Final
Mark
School
vs
Province
School
vs
Region
Public
Exam
Mark
School
Region
Province
q q q q
q
q
q
q
q
q
q
q
64.6 59.9
10Number of Students
53.3
58.0
64.6
50.3
61.0
60.8
66.2
63.0
60.1
58.8
66.4
60.9
63.5 68.2
64.7 69.0
Biology 3201
0
10
20
30
40
50
60
70
80
90
100
55 5460
5559
65
Final MarkExam Mark
Average Mark, 2014-2017
2014 2015 2016 2017
139* The overall Public Exam is equated. Therefore, subtest scores may vary from the overall exam mark.
The school result may appear numerically the same as the district/province due to rounding. The arrow indicates a negligible difference.pq

Public Exam Course Results
Biology 3201
2016-17
#413 - Holy Cross School Complex, Eastport Grades: K-12
NLESD - Central Region
Maintaining
Dynamic
Equilibrium
Reproductions/
Development
Genetic
Continuity
Evolution,
Change and
Diversity
-12
-10
-8
-6
-4
-2
0
-5
-9
-4
-10
-9
-4
Final MarkExam Mark
2014 2015 2016
Difference from Provincial Mean, 2014-17
2017
0
10
20
30
40
50
60
70
80
90
100
5862
53 52
59 58
66
56
65
30 32
50
2014 2015 2016 2017
4 Year Public Exam (Subtest) Mark Trend 2014-2017
140* The overall Public Exam is equated. Therefore, subtest scores may vary from the overall exam mark.
The school result may appear numerically the same as the district/province due to rounding. The arrow indicates a negligible difference.pq

Public Exam Course Results
Biology 3201
2016-17
#414 - Fogo Island Central Academy, Fogo Island Grades: K-12
NLESD - Central Region
Maintaining
Dynamic
Equilibrium
School
Region
Province
School
Region
Province
School
Region
Province
Genetic
Continuity
School
Region
Evolution,
Change and
Diversity
Reproductions/
Development
Province
Subtest
School
vs
Province
School
vs
Region
Final
Mark
School
vs
Province
School
vs
Region
Public
Exam
Mark
School
Region
Province
q q q q
q
q
q
q
q
q
q
q
63.8 56.9
16Number of Students
50.9
53.1
60.3
54.0
61.0
60.8
66.2
63.0
60.1
58.8
66.4
60.9
63.5 68.2
64.7 69.0
Biology 3201
0
10
20
30
40
50
60
70
80
90
100
61 5864
57
69 66 66 64
Final MarkExam Mark
Average Mark, 2014-2017
2014 2015 2016 2017
141* The overall Public Exam is equated. Therefore, subtest scores may vary from the overall exam mark.
The school result may appear numerically the same as the district/province due to rounding. The arrow indicates a negligible difference.pq

Public Exam Course Results
Biology 3201
2016-17
#414 - Fogo Island Central Academy, Fogo Island Grades: K-12
NLESD - Central Region
Maintaining
Dynamic
Equilibrium
Reproductions/
Development
Genetic
Continuity
Evolution,
Change and
Diversity
-8
-6
-4
-2
0
2
4
1
-5
0
-7
4
-2 -2
-4
Final MarkExam Mark
2014 2015 2016
Difference from Provincial Mean, 2014-17
2017
0
10
20
30
40
50
60
70
80
90
100
51
68
59
51
71
6057
53
67
59
6660
48 48
65
54
2014 2015 2016 2017
4 Year Public Exam (Subtest) Mark Trend 2014-2017
142* The overall Public Exam is equated. Therefore, subtest scores may vary from the overall exam mark.
The school result may appear numerically the same as the district/province due to rounding. The arrow indicates a negligible difference.pq

Public Exam Course Results
Biology 3201
2016-17
#416 - Smallwood Academy, Gambo Grades: K-12
NLESD - Central Region
Maintaining
Dynamic
Equilibrium
School
Region
Province
School
Region
Province
School
Region
Province
Genetic
Continuity
School
Region
Evolution,
Change and
Diversity
Reproductions/
Development
Province
Subtest
School
vs
Province
School
vs
Region
Final
Mark
School
vs
Province
School
vs
Region
Public
Exam
Mark
School
Region
Province
q q q q
q
q
q
p
p
p
q
q
65.9 62.7
22Number of Students
54.1
60.8
67.4
58.0
61.0
60.8
66.2
63.0
60.1
58.8
66.4
60.9
63.5 68.2
64.7 69.0
Biology 3201
0
10
20
30
40
50
60
70
80
90
100
58
44
63 63
42
66
Final MarkExam Mark
Average Mark, 2014-2017
2014 2015 2016 2017
143* The overall Public Exam is equated. Therefore, subtest scores may vary from the overall exam mark.
The school result may appear numerically the same as the district/province due to rounding. The arrow indicates a negligible difference.pq

Public Exam Course Results
Biology 3201
2016-17
#416 - Smallwood Academy, Gambo Grades: K-12
NLESD - Central Region
Maintaining
Dynamic
Equilibrium
Reproductions/
Development
Genetic
Continuity
Evolution,
Change and
Diversity
-28
-24
-20
-16
-12
-8
-4
0
-5
-20
-1
-4
-26
-2
Final MarkExam Mark
2014 2015 2016
Difference from Provincial Mean, 2014-17
2017
0
10
20
30
40
50
60
70
80
90
100
6863
54
61
35
6158
37
67
46
33
58
2014 2015 2016 2017
4 Year Public Exam (Subtest) Mark Trend 2014-2017
144* The overall Public Exam is equated. Therefore, subtest scores may vary from the overall exam mark.
The school result may appear numerically the same as the district/province due to rounding. The arrow indicates a negligible difference.pq

Public Exam Course Results
Biology 3201
2016-17
#418 - Gander Collegiate, Gander Grades: 10-12
NLESD - Central Region
Maintaining
Dynamic
Equilibrium
School
Region
Province
School
Region
Province
School
Region
Province
Genetic
Continuity
School
Region
Evolution,
Change and
Diversity
Reproductions/
Development
Province
Subtest
School
vs
Province
School
vs
Region
Final
Mark
School
vs
Province
School
vs
Region
Public
Exam
Mark
School
Region
Province
p p p p
p
p
p
p
p
p
p
p
75.6 73.0
74Number of Students
74.0
69.2
74.0
72.6
61.0
60.8
66.2
63.0
60.1
58.8
66.4
60.9
63.5 68.2
64.7 69.0
Biology 3201
0
10
20
30
40
50
60
70
80
90
100
6772 71 73 71 74 73 76
Final MarkExam Mark
Average Mark, 2014-2017
2014 2015 2016 2017
145* The overall Public Exam is equated. Therefore, subtest scores may vary from the overall exam mark.
The school result may appear numerically the same as the district/province due to rounding. The arrow indicates a negligible difference.pq

Public Exam Course Results
Biology 3201
2016-17
#418 - Gander Collegiate, Gander Grades: 10-12
NLESD - Central Region
Maintaining
Dynamic
Equilibrium
Reproductions/
Development
Genetic
Continuity
Evolution,
Change and
Diversity
0
2
4
6
8
10
6
9
7
10
6 65
7
Final MarkExam Mark
2014 2015 2016
Difference from Provincial Mean, 2014-17
2017
0
10
20
30
40
50
60
70
80
90
100
64
78
6974
70 7367 69
73 73 7174
6166
74 73
2014 2015 2016 2017
4 Year Public Exam (Subtest) Mark Trend 2014-2017
146* The overall Public Exam is equated. Therefore, subtest scores may vary from the overall exam mark.
The school result may appear numerically the same as the district/province due to rounding. The arrow indicates a negligible difference.pq

Public Exam Course Results
Biology 3201
2016-17
#422 - Glovertown Academy, Glovertown Grades: K-12
NLESD - Central Region
Maintaining
Dynamic
Equilibrium
School
Region
Province
School
Region
Province
School
Region
Province
Genetic
Continuity
School
Region
Evolution,
Change and
Diversity
Reproductions/
Development
Province
Subtest
School
vs
Province
School
vs
Region
Final
Mark
School
vs
Province
School
vs
Region
Public
Exam
Mark
School
Region
Province
p p p p
p
p
p
p
p
p
p
p
76.7 70.7
12Number of Students
63.8
71.5
75.0
63.6
61.0
60.8
66.2
63.0
60.1
58.8
66.4
60.9
63.5 68.2
64.7 69.0
Biology 3201
0
10
20
30
40
50
60
70
80
90
100
64
74 7771 70
7679 77
Final MarkExam Mark
Average Mark, 2014-2017
2014 2015 2016 2017
147* The overall Public Exam is equated. Therefore, subtest scores may vary from the overall exam mark.
The school result may appear numerically the same as the district/province due to rounding. The arrow indicates a negligible difference.pq

Public Exam Course Results
Biology 3201
2016-17
#422 - Glovertown Academy, Glovertown Grades: K-12
NLESD - Central Region
Maintaining
Dynamic
Equilibrium
Reproductions/
Development
Genetic
Continuity
Evolution,
Change and
Diversity
0
2
4
6
8
10
12
14
4
11
13
7
5
8
11
8
Final MarkExam Mark
2014 2015 2016
Difference from Provincial Mean, 2014-17
2017
0
10
20
30
40
50
60
70
80
90
100
59
80
71
64
7074
79
71 6974
7975
57
76 75
64
2014 2015 2016 2017
4 Year Public Exam (Subtest) Mark Trend 2014-2017
148* The overall Public Exam is equated. Therefore, subtest scores may vary from the overall exam mark.
The school result may appear numerically the same as the district/province due to rounding. The arrow indicates a negligible difference.pq
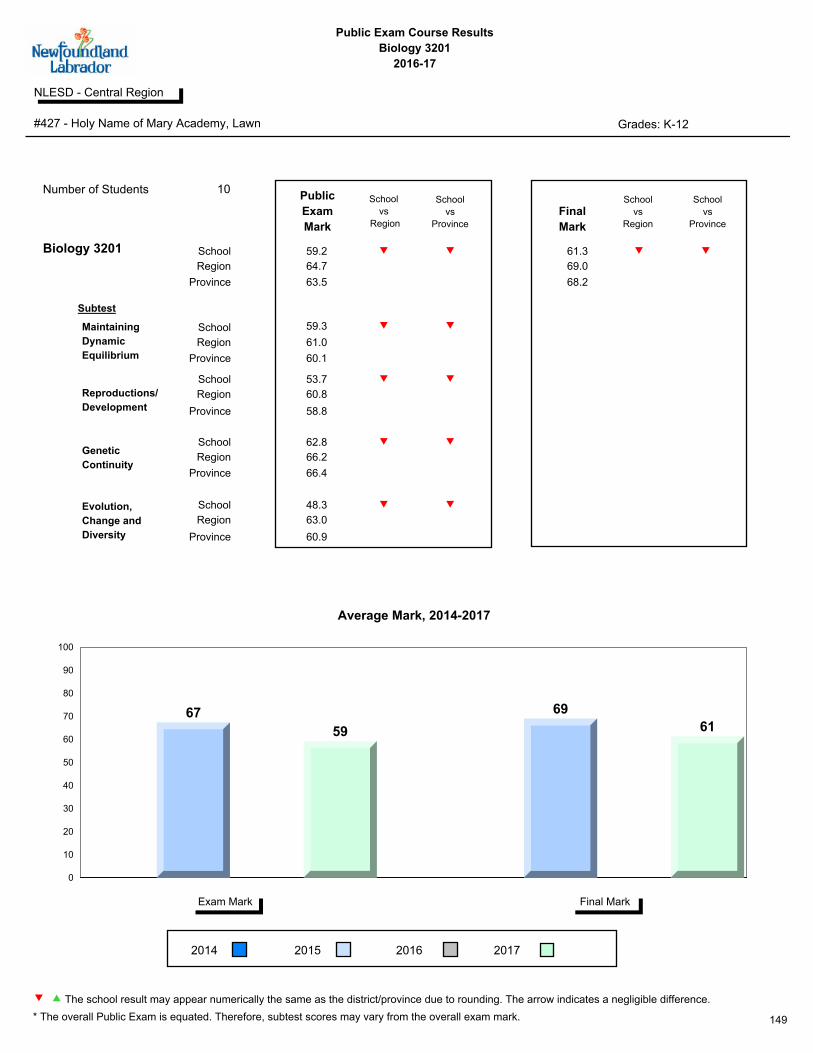
Public Exam Course Results
Biology 3201
2016-17
#427 - Holy Name of Mary Academy, Lawn Grades: K-12
NLESD - Central Region
Maintaining
Dynamic
Equilibrium
School
Region
Province
School
Region
Province
School
Region
Province
Genetic
Continuity
School
Region
Evolution,
Change and
Diversity
Reproductions/
Development
Province
Subtest
School
vs
Province
School
vs
Region
Final
Mark
School
vs
Province
School
vs
Region
Public
Exam
Mark
School
Region
Province
q q q q
q
q
q
q
q
q
q
q
61.3 59.2
10Number of Students
59.3
53.7
62.8
48.3
61.0
60.8
66.2
63.0
60.1
58.8
66.4
60.9
63.5 68.2
64.7 69.0
Biology 3201
0
10
20
30
40
50
60
70
80
90
100
67
59
69
61
Final MarkExam Mark
Average Mark, 2014-2017
2014 2015 2016 2017
149* The overall Public Exam is equated. Therefore, subtest scores may vary from the overall exam mark.
The school result may appear numerically the same as the district/province due to rounding. The arrow indicates a negligible difference.pq

Public Exam Course Results
Biology 3201
2016-17
#427 - Holy Name of Mary Academy, Lawn Grades: K-12
NLESD - Central Region
Maintaining
Dynamic
Equilibrium
Reproductions/
Development
Genetic
Continuity
Evolution,
Change and
Diversity
-8
-6
-4
-2
0
2
4
6
4
-4
1
-7
Final MarkExam Mark
2014 2015 2016
Difference from Provincial Mean, 2014-17
2017
0
10
20
30
40
50
60
70
80
90
100
75
5964
54
69
63 61
48
2014 2015 2016 2017
4 Year Public Exam (Subtest) Mark Trend 2014-2017
150* The overall Public Exam is equated. Therefore, subtest scores may vary from the overall exam mark.
The school result may appear numerically the same as the district/province due to rounding. The arrow indicates a negligible difference.pq

Public Exam Course Results
Biology 3201
2016-17
#430 - St. Mark's School, King's Cove Grades: K-12
NLESD - Central Region
Maintaining
Dynamic
Equilibrium
School
Region
Province
School
Region
Province
School
Region
Province
Genetic
Continuity
School
Region
Evolution,
Change and
Diversity
Reproductions/
Development
Province
Subtest
School
vs
Province
School
vs
Region
Final
Mark
School
vs
Province
School
vs
Region
Public
Exam
Mark
School
Region
Province
q q q q
q
q
q
q
q
q
q
q
1Number of Students
Biology 3201
Final MarkExam Mark
Average Mark, 2014-2017
2014 2015 2016 2017
School data with 5 or fewer
students withheld for reasons of
confidentiality.
School data with 5 or fewer
students withheld for reasons of
confidentiality.
School data with 5 or fewer students withheld for reasons of confidentiality.
151* The overall Public Exam is equated. Therefore, subtest scores may vary from the overall exam mark.
The school result may appear numerically the same as the district/province due to rounding. The arrow indicates a negligible difference.pq

Public Exam Course Results
Biology 3201
2016-17
#430 - St. Mark's School, King's Cove Grades: K-12
NLESD - Central Region
Maintaining
Dynamic
Equilibrium
Reproductions/
Development
Genetic
Continuity
Evolution,
Change and
Diversity
Final MarkExam Mark
2014 2015 2016
Difference from Provincial Mean, 2014-17
2017
2014 2015 2016 2017
4 Year Public Exam (Subtest) Mark Trend 2014-2017
School data with 5 or fewer students withheld for reasons of confidentiality.
School data with 5 or fewer students withheld for reasons of confidentiality.
152* The overall Public Exam is equated. Therefore, subtest scores may vary from the overall exam mark.
The school result may appear numerically the same as the district/province due to rounding. The arrow indicates a negligible difference.pq

Public Exam Course Results
Biology 3201
2016-17
#478 - New World Island Academy, Summerford Grades: K-12
NLESD - Central Region
Maintaining
Dynamic
Equilibrium
School
Region
Province
School
Region
Province
School
Region
Province
Genetic
Continuity
School
Region
Evolution,
Change and
Diversity
Reproductions/
Development
Province
Subtest
School
vs
Province
School
vs
Region
Final
Mark
School
vs
Province
School
vs
Region
Public
Exam
Mark
School
Region
Province
q p p p
q
q
q
p
p
p
p
q
70.2 64.0
14Number of Students
59.8
59.0
69.0
61.7
61.0
60.8
66.2
63.0
60.1
58.8
66.4
60.9
63.5 68.2
64.7 69.0
Biology 3201
0
10
20
30
40
50
60
70
80
90
100
63 65 64 64 66 69 68 70
Final MarkExam Mark
Average Mark, 2014-2017
2014 2015 2016 2017
153* The overall Public Exam is equated. Therefore, subtest scores may vary from the overall exam mark.
The school result may appear numerically the same as the district/province due to rounding. The arrow indicates a negligible difference.pq

Public Exam Course Results
Biology 3201
2016-17
#478 - New World Island Academy, Summerford Grades: K-12
NLESD - Central Region
Maintaining
Dynamic
Equilibrium
Reproductions/
Development
Genetic
Continuity
Evolution,
Change and
Diversity
-0.4
0.0
0.4
0.8
1.2
1.6
2.0
2.4
2.83
2
0 0
1
1
0
2
Final MarkExam Mark
2014 2015 2016
Difference from Provincial Mean, 2014-17
2017
0
10
20
30
40
50
60
70
80
90
100
50
70
5760
72
6360 59
6965 64
69
58
66 6562
2014 2015 2016 2017
4 Year Public Exam (Subtest) Mark Trend 2014-2017
154* The overall Public Exam is equated. Therefore, subtest scores may vary from the overall exam mark.
The school result may appear numerically the same as the district/province due to rounding. The arrow indicates a negligible difference.pq

Public Exam Course Results
Biology 3201
2016-17
#480 - Exploits Valley High, Grand Falls-Windsor Grades: 10-12
NLESD - Central Region
Maintaining
Dynamic
Equilibrium
School
Region
Province
School
Region
Province
School
Region
Province
Genetic
Continuity
School
Region
Evolution,
Change and
Diversity
Reproductions/
Development
Province
Subtest
School
vs
Province
School
vs
Region
Final
Mark
School
vs
Province
School
vs
Region
Public
Exam
Mark
School
Region
Province
p p p p
q
p
p
p
p
p
p
p
70.4 67.1
79Number of Students
61.8
60.7
71.8
68.7
61.0
60.8
66.2
63.0
60.1
58.8
66.4
60.9
63.5 68.2
64.7 69.0
Biology 3201
0
10
20
30
40
50
60
70
80
90
100
6569
66 67 69 7268 70
Final MarkExam Mark
Average Mark, 2014-2017
2014 2015 2016 2017
155* The overall Public Exam is equated. Therefore, subtest scores may vary from the overall exam mark.
The school result may appear numerically the same as the district/province due to rounding. The arrow indicates a negligible difference.pq

Public Exam Course Results
Biology 3201
2016-17
#480 - Exploits Valley High, Grand Falls-Windsor Grades: 10-12
NLESD - Central Region
Maintaining
Dynamic
Equilibrium
Reproductions/
Development
Genetic
Continuity
Evolution,
Change and
Diversity
0
1
2
3
4
5
6
7
5
6
2
44 4
1
2
Final MarkExam Mark
2014 2015 2016
Difference from Provincial Mean, 2014-17
2017
0
10
20
30
40
50
60
70
80
90
100
59
75
5862
7067 66
61
71 7066
72
61
70 68 69
2014 2015 2016 2017
4 Year Public Exam (Subtest) Mark Trend 2014-2017
156* The overall Public Exam is equated. Therefore, subtest scores may vary from the overall exam mark.
The school result may appear numerically the same as the district/province due to rounding. The arrow indicates a negligible difference.pq

Public Exam Course Results
Biology 3201
2016-17
#924 - Tricentia Academy, Arnold's Cove Grades: K-12
NLESD - Central Region
Maintaining
Dynamic
Equilibrium
School
Region
Province
School
Region
Province
School
Region
Province
Genetic
Continuity
School
Region
Evolution,
Change and
Diversity
Reproductions/
Development
Province
Subtest
School
vs
Province
School
vs
Region
Final
Mark
School
vs
Province
School
vs
Region
Public
Exam
Mark
School
Region
Province
q q q q
q
q
q
q
q
q
q
q
62.3 54.6
32Number of Students
48.5
50.4
57.3
54.6
61.0
60.8
66.2
63.0
60.1
58.8
66.4
60.9
63.5 68.2
64.7 69.0
Biology 3201
0
10
20
30
40
50
60
70
80
90
100
55 5562 62
Final MarkExam Mark
Average Mark, 2014-2017
2014 2015 2016 2017
157* The overall Public Exam is equated. Therefore, subtest scores may vary from the overall exam mark.
The school result may appear numerically the same as the district/province due to rounding. The arrow indicates a negligible difference.pq
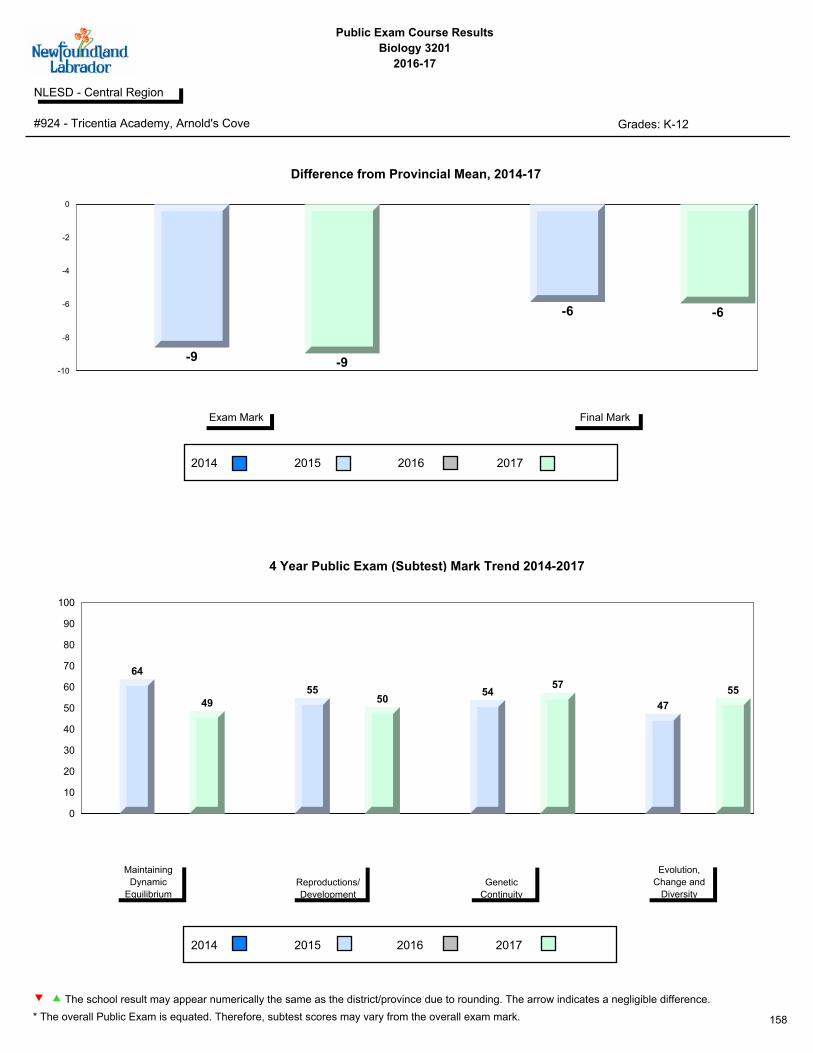
Public Exam Course Results
Biology 3201
2016-17
#924 - Tricentia Academy, Arnold's Cove Grades: K-12
NLESD - Central Region
Maintaining
Dynamic
Equilibrium
Reproductions/
Development
Genetic
Continuity
Evolution,
Change and
Diversity
-10
-8
-6
-4
-2
0
-9 -9
-6 -6
Final MarkExam Mark
2014 2015 2016
Difference from Provincial Mean, 2014-17
2017
0
10
20
30
40
50
60
70
80
90
100
64
4955
5054
57
47
55
2014 2015 2016 2017
4 Year Public Exam (Subtest) Mark Trend 2014-2017
158* The overall Public Exam is equated. Therefore, subtest scores may vary from the overall exam mark.
The school result may appear numerically the same as the district/province due to rounding. The arrow indicates a negligible difference.pq

Public Exam Course Results
Biology 3201
2016-17
#247 - Roncalli Central High, Avondale Grades: 7-12
NLESD - Eastern Region
Maintaining
Dynamic
Equilibrium
School
Region
Province
School
Region
Province
School
Region
Province
Genetic
Continuity
School
Region
Evolution,
Change and
Diversity
Reproductions/
Development
Province
Subtest
School
vs
Province
School
vs
Region
Final
Mark
School
vs
Province
School
vs
Region
Public
Exam
Mark
School
Region
Province
p p p p
p
p
p
p
p
p
p
p
70.8 69.2
26Number of Students
68.9
62.2
73.6
65.0
58.8
56.9
65.9
59.5
60.1
58.8
66.4
60.9
63.5 68.2
62.5 67.8
Biology 3201
0
10
20
30
40
50
60
70
80
90
100
6965 68 69
7367 70 71
Final MarkExam Mark
Average Mark, 2014-2017
2014 2015 2016 2017
159* The overall Public Exam is equated. Therefore, subtest scores may vary from the overall exam mark.
The school result may appear numerically the same as the district/province due to rounding. The arrow indicates a negligible difference.pq

Public Exam Course Results
Biology 3201
2016-17
#247 - Roncalli Central High, Avondale Grades: 7-12
NLESD - Eastern Region
Maintaining
Dynamic
Equilibrium
Reproductions/
Development
Genetic
Continuity
Evolution,
Change and
Diversity
-2
0
2
4
6
8
10 9
2
4
6
7
-1
23
Final MarkExam Mark
2014 2015 2016
Difference from Provincial Mean, 2014-17
2017
0
10
20
30
40
50
60
70
80
90
100
68
74
59
6973
64 63 62
75
63
72 74
63 6571
65
2014 2015 2016 2017
4 Year Public Exam (Subtest) Mark Trend 2014-2017
160* The overall Public Exam is equated. Therefore, subtest scores may vary from the overall exam mark.
The school result may appear numerically the same as the district/province due to rounding. The arrow indicates a negligible difference.pq

Public Exam Course Results
Biology 3201
2016-17
#249 - Ascension Collegiate, Bay Roberts Grades: 10-12
NLESD - Eastern Region
Maintaining
Dynamic
Equilibrium
School
Region
Province
School
Region
Province
School
Region
Province
Genetic
Continuity
School
Region
Evolution,
Change and
Diversity
Reproductions/
Development
Province
Subtest
School
vs
Province
School
vs
Region
Final
Mark
School
vs
Province
School
vs
Region
Public
Exam
Mark
School
Region
Province
q q q q
q
q
q
p
q
q
q
q
67.5 60.7
136Number of Students
53.4
54.6
65.4
59.6
58.8
56.9
65.9
59.5
60.1
58.8
66.4
60.9
63.5 68.2
62.5 67.8
Biology 3201
0
10
20
30
40
50
60
70
80
90
100
55
64 6661 60
70 7167
Final MarkExam Mark
Average Mark, 2014-2017
2014 2015 2016 2017
161* The overall Public Exam is equated. Therefore, subtest scores may vary from the overall exam mark.
The school result may appear numerically the same as the district/province due to rounding. The arrow indicates a negligible difference.pq
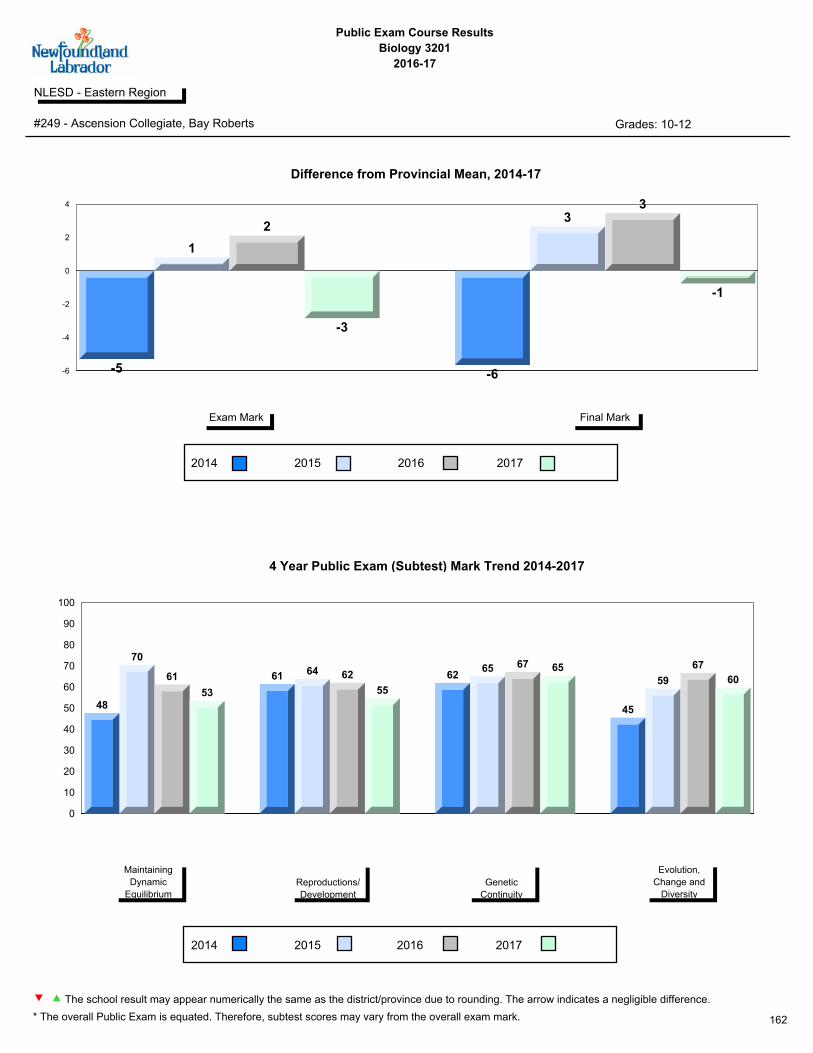
Public Exam Course Results
Biology 3201
2016-17
#249 - Ascension Collegiate, Bay Roberts Grades: 10-12
NLESD - Eastern Region
Maintaining
Dynamic
Equilibrium
Reproductions/
Development
Genetic
Continuity
Evolution,
Change and
Diversity
-6
-4
-2
0
2
4
-5
1
2
-3
-6
33
-1
Final MarkExam Mark
2014 2015 2016
Difference from Provincial Mean, 2014-17
2017
0
10
20
30
40
50
60
70
80
90
100
48
70
61
53
61 64 62
55
6265 67 65
45
59
67
60
2014 2015 2016 2017
4 Year Public Exam (Subtest) Mark Trend 2014-2017
162* The overall Public Exam is equated. Therefore, subtest scores may vary from the overall exam mark.
The school result may appear numerically the same as the district/province due to rounding. The arrow indicates a negligible difference.pq

Public Exam Course Results
Biology 3201
2016-17
#253 - Carbonear Collegiate, Carbonear Grades: 9-12
NLESD - Eastern Region
Maintaining
Dynamic
Equilibrium
School
Region
Province
School
Region
Province
School
Region
Province
Genetic
Continuity
School
Region
Evolution,
Change and
Diversity
Reproductions/
Development
Province
Subtest
School
vs
Province
School
vs
Region
Final
Mark
School
vs
Province
School
vs
Region
Public
Exam
Mark
School
Region
Province
q q q q
q
q
q
q
q
q
q
q
61.6 56.5
61Number of Students
52.9
51.0
59.8
53.7
58.8
56.9
65.9
59.5
60.1
58.8
66.4
60.9
63.5 68.2
62.5 67.8
Biology 3201
0
10
20
30
40
50
60
70
80
90
100
5461
57 5762
6764 62
Final MarkExam Mark
Average Mark, 2014-2017
2014 2015 2016 2017
163* The overall Public Exam is equated. Therefore, subtest scores may vary from the overall exam mark.
The school result may appear numerically the same as the district/province due to rounding. The arrow indicates a negligible difference.pq
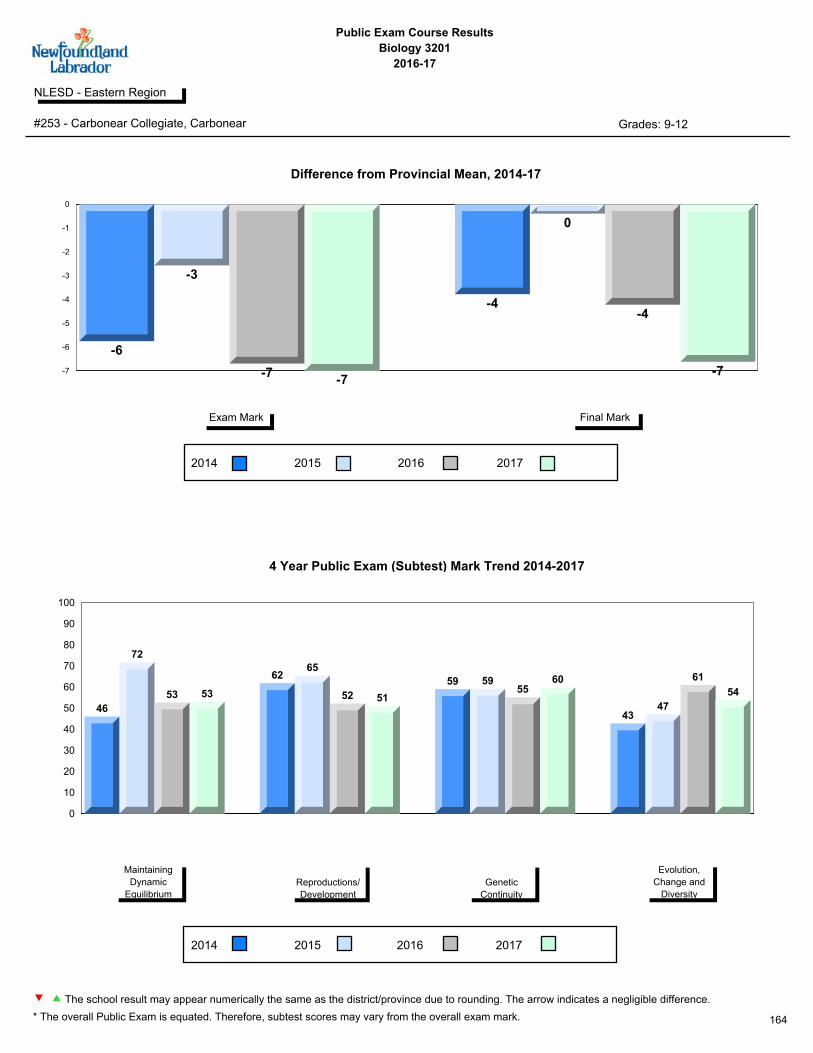
Public Exam Course Results
Biology 3201
2016-17
#253 - Carbonear Collegiate, Carbonear Grades: 9-12
NLESD - Eastern Region
Maintaining
Dynamic
Equilibrium
Reproductions/
Development
Genetic
Continuity
Evolution,
Change and
Diversity
-7
-6
-5
-4
-3
-2
-1
0
-6
-3
-7-7
-4
0
-4
-7
Final MarkExam Mark
2014 2015 2016
Difference from Provincial Mean, 2014-17
2017
0
10
20
30
40
50
60
70
80
90
100
46
72
53 53
6265
52 51
59 5955
60
4347
61
54
2014 2015 2016 2017
4 Year Public Exam (Subtest) Mark Trend 2014-2017
164* The overall Public Exam is equated. Therefore, subtest scores may vary from the overall exam mark.
The school result may appear numerically the same as the district/province due to rounding. The arrow indicates a negligible difference.pq

Public Exam Course Results
Biology 3201
2016-17
#280 - Laval High School, Placentia Grades: 7-12
NLESD - Eastern Region
Maintaining
Dynamic
Equilibrium
School
Region
Province
School
Region
Province
School
Region
Province
Genetic
Continuity
School
Region
Evolution,
Change and
Diversity
Reproductions/
Development
Province
Subtest
School
vs
Province
School
vs
Region
Final
Mark
School
vs
Province
School
vs
Region
Public
Exam
Mark
School
Region
Province
p p p p
p
p
p
p
p
p
p
p
73.8 71.2
16Number of Students
63.3
67.0
75.0
75.8
58.8
56.9
65.9
59.5
60.1
58.8
66.4
60.9
63.5 68.2
62.5 67.8
Biology 3201
0
10
20
30
40
50
60
70
80
90
100
6772
7671 70
7479
74
Final MarkExam Mark
Average Mark, 2014-2017
2014 2015 2016 2017
165* The overall Public Exam is equated. Therefore, subtest scores may vary from the overall exam mark.
The school result may appear numerically the same as the district/province due to rounding. The arrow indicates a negligible difference.pq

Public Exam Course Results
Biology 3201
2016-17
#280 - Laval High School, Placentia Grades: 7-12
NLESD - Eastern Region
Maintaining
Dynamic
Equilibrium
Reproductions/
Development
Genetic
Continuity
Evolution,
Change and
Diversity
0
2
4
6
8
10
12
7
9
12
8
5
7
11
6
Final MarkExam Mark
2014 2015 2016
Difference from Provincial Mean, 2014-17
2017
0
10
20
30
40
50
60
70
80
90
100
58
7874
63
70 69 7067
78
71
7975
56
78 78 76
2014 2015 2016 2017
4 Year Public Exam (Subtest) Mark Trend 2014-2017
166* The overall Public Exam is equated. Therefore, subtest scores may vary from the overall exam mark.
The school result may appear numerically the same as the district/province due to rounding. The arrow indicates a negligible difference.pq
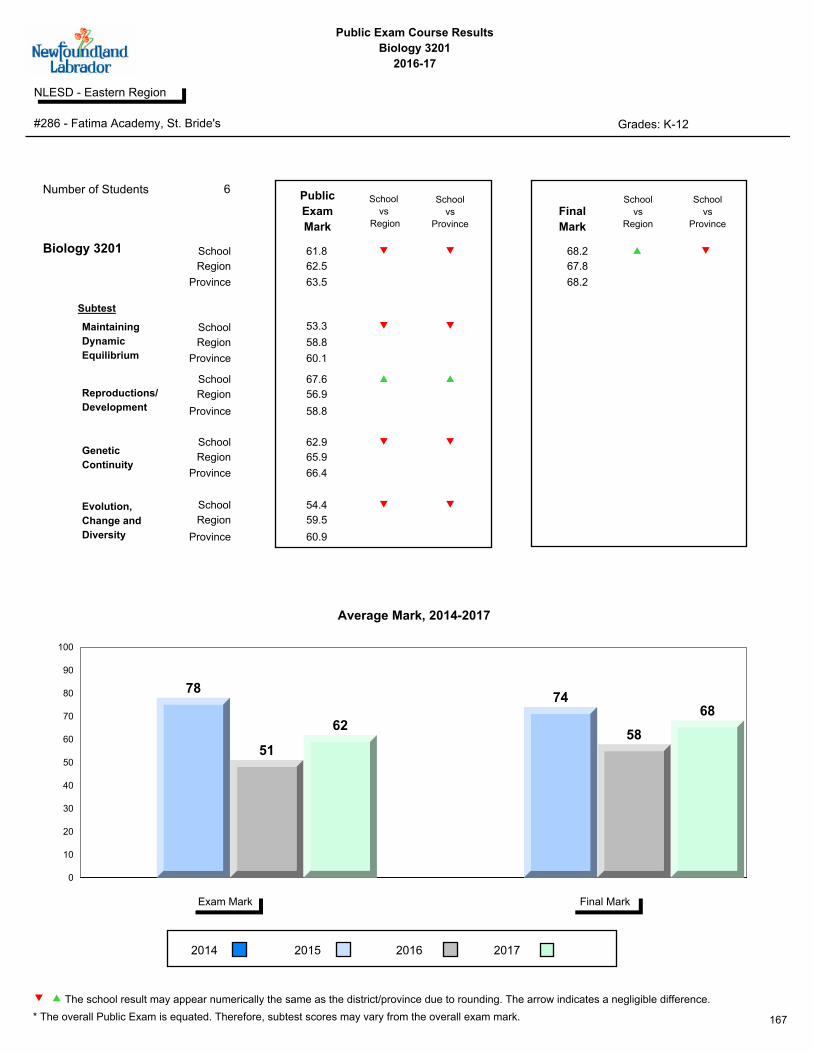
Public Exam Course Results
Biology 3201
2016-17
#286 - Fatima Academy, St. Bride's Grades: K-12
NLESD - Eastern Region
Maintaining
Dynamic
Equilibrium
School
Region
Province
School
Region
Province
School
Region
Province
Genetic
Continuity
School
Region
Evolution,
Change and
Diversity
Reproductions/
Development
Province
Subtest
School
vs
Province
School
vs
Region
Final
Mark
School
vs
Province
School
vs
Region
Public
Exam
Mark
School
Region
Province
q q p q
q
q
q
p p
q
q
q
68.2 61.8
6Number of Students
53.3
67.6
62.9
54.4
58.8
56.9
65.9
59.5
60.1
58.8
66.4
60.9
63.5 68.2
62.5 67.8
Biology 3201
0
10
20
30
40
50
60
70
80
90
100
78
51
62
74
58
68
Final MarkExam Mark
Average Mark, 2014-2017
2014 2015 2016 2017
167* The overall Public Exam is equated. Therefore, subtest scores may vary from the overall exam mark.
The school result may appear numerically the same as the district/province due to rounding. The arrow indicates a negligible difference.pq
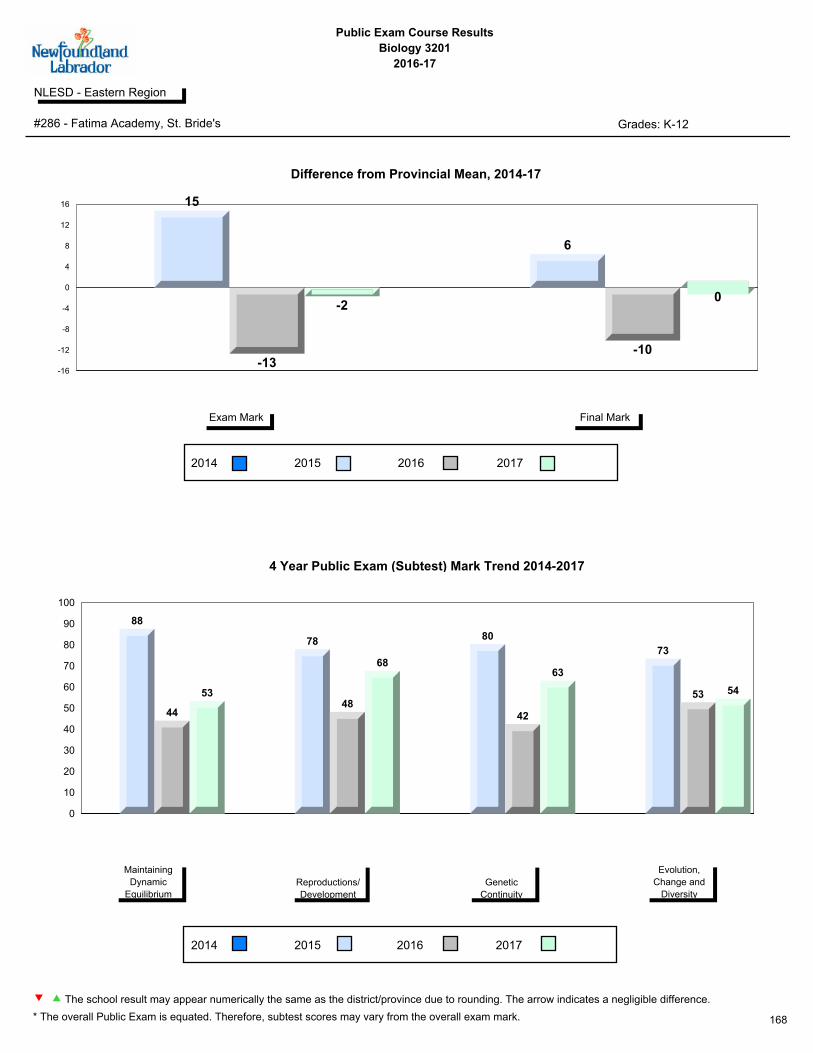
Public Exam Course Results
Biology 3201
2016-17
#286 - Fatima Academy, St. Bride's Grades: K-12
NLESD - Eastern Region
Maintaining
Dynamic
Equilibrium
Reproductions/
Development
Genetic
Continuity
Evolution,
Change and
Diversity
-16
-12
-8
-4
0
4
8
12
16 15
-13
-2
6
-10
0
Final MarkExam Mark
2014 2015 2016
Difference from Provincial Mean, 2014-17
2017
0
10
20
30
40
50
60
70
80
90
100
88
44
53
78
48
68
80
42
63
73
53 54
2014 2015 2016 2017
4 Year Public Exam (Subtest) Mark Trend 2014-2017
168* The overall Public Exam is equated. Therefore, subtest scores may vary from the overall exam mark.
The school result may appear numerically the same as the district/province due to rounding. The arrow indicates a negligible difference.pq

Public Exam Course Results
Biology 3201
2016-17
#296 - St. Michael's High, Bell Island Grades: 7-12
NLESD - Eastern Region
Maintaining
Dynamic
Equilibrium
School
Region
Province
School
Region
Province
School
Region
Province
Genetic
Continuity
School
Region
Evolution,
Change and
Diversity
Reproductions/
Development
Province
Subtest
School
vs
Province
School
vs
Region
Final
Mark
School
vs
Province
School
vs
Region
Public
Exam
Mark
School
Region
Province
q q q q
q
q
q
q
q
q
q
q
65.4 58.1
28Number of Students
55.7
51.6
61.3
56.1
58.8
56.9
65.9
59.5
60.1
58.8
66.4
60.9
63.5 68.2
62.5 67.8
Biology 3201
0
10
20
30
40
50
60
70
80
90
100
5055
77
58 5862
77
65
Final MarkExam Mark
Average Mark, 2014-2017
2014 2015 2016 2017
169* The overall Public Exam is equated. Therefore, subtest scores may vary from the overall exam mark.
The school result may appear numerically the same as the district/province due to rounding. The arrow indicates a negligible difference.pq
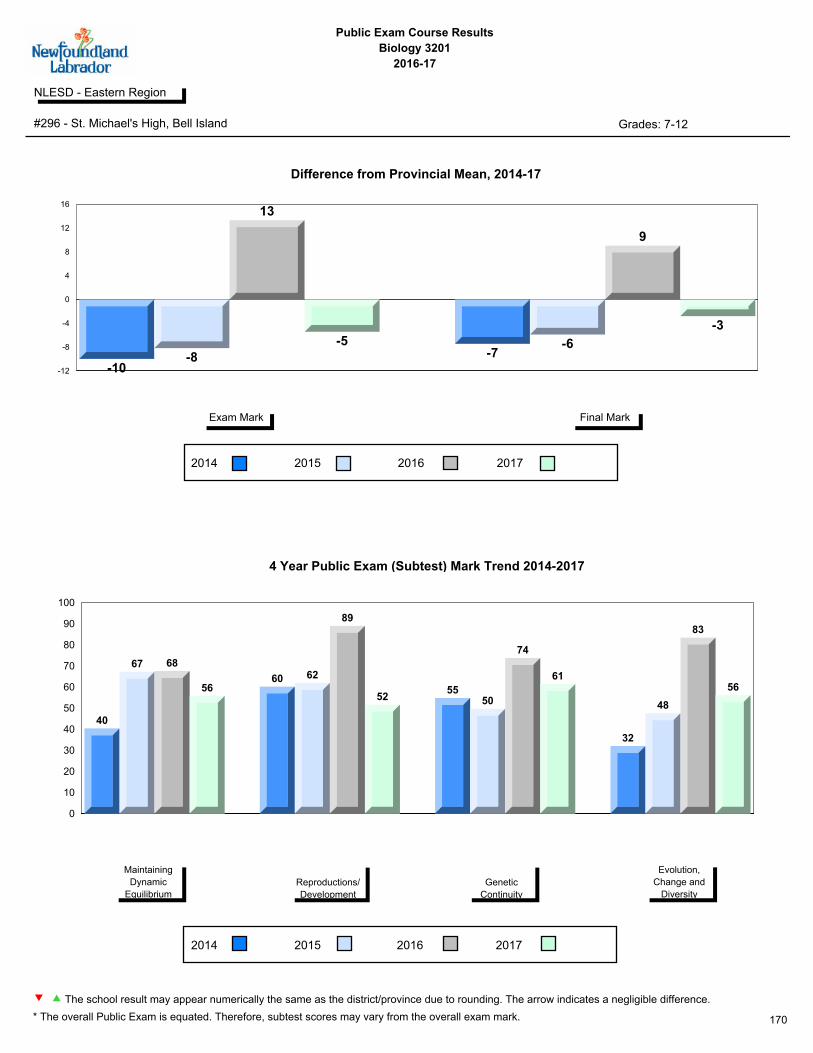
Public Exam Course Results
Biology 3201
2016-17
#296 - St. Michael's High, Bell Island Grades: 7-12
NLESD - Eastern Region
Maintaining
Dynamic
Equilibrium
Reproductions/
Development
Genetic
Continuity
Evolution,
Change and
Diversity
-12
-8
-4
0
4
8
12
16
-10-8
13
-5-7
-6
9
-3
Final MarkExam Mark
2014 2015 2016
Difference from Provincial Mean, 2014-17
2017
0
10
20
30
40
50
60
70
80
90
100
40
67 68
5660 62
89
5255
50
74
61
32
48
83
56
2014 2015 2016 2017
4 Year Public Exam (Subtest) Mark Trend 2014-2017
170* The overall Public Exam is equated. Therefore, subtest scores may vary from the overall exam mark.
The school result may appear numerically the same as the district/province due to rounding. The arrow indicates a negligible difference.pq

Public Exam Course Results
Biology 3201
2016-17
#302 - Queen Elizabeth Regional High, Conception Bay South (Foxtrap) Grades: 10-12
NLESD - Eastern Region
Maintaining
Dynamic
Equilibrium
School
Region
Province
School
Region
Province
School
Region
Province
Genetic
Continuity
School
Region
Evolution,
Change and
Diversity
Reproductions/
Development
Province
Subtest
School
vs
Province
School
vs
Region
Final
Mark
School
vs
Province
School
vs
Region
Public
Exam
Mark
School
Region
Province
p p p p
p
p
p
p
p
p
p
p
72.7 66.8
131Number of Students
65.7
60.1
71.5
62.1
58.8
56.9
65.9
59.5
60.1
58.8
66.4
60.9
63.5 68.2
62.5 67.8
Biology 3201
0
10
20
30
40
50
60
70
80
90
100
63 64 67 6771
6872 73
Final MarkExam Mark
Average Mark, 2014-2017
2014 2015 2016 2017
171* The overall Public Exam is equated. Therefore, subtest scores may vary from the overall exam mark.
The school result may appear numerically the same as the district/province due to rounding. The arrow indicates a negligible difference.pq

Public Exam Course Results
Biology 3201
2016-17
#302 - Queen Elizabeth Regional High, Conception Bay South (Foxtrap) Grades: 10-12
NLESD - Eastern Region
Maintaining
Dynamic
Equilibrium
Reproductions/
Development
Genetic
Continuity
Evolution,
Change and
Diversity
0
1
2
3
4
5
6
2
1
3 3
5
0
4
5
Final MarkExam Mark
2014 2015 2016
Difference from Provincial Mean, 2014-17
2017
0
10
20
30
40
50
60
70
80
90
100
56
74
64 6668
65 6360
6964
6972
5458
6662
2014 2015 2016 2017
4 Year Public Exam (Subtest) Mark Trend 2014-2017
172* The overall Public Exam is equated. Therefore, subtest scores may vary from the overall exam mark.
The school result may appear numerically the same as the district/province due to rounding. The arrow indicates a negligible difference.pq

Public Exam Course Results
Biology 3201
2016-17
#304 - Holy Spirit High, Conception Bay South (Manuels) Grades: 9-12
NLESD - Eastern Region
Maintaining
Dynamic
Equilibrium
School
Region
Province
School
Region
Province
School
Region
Province
Genetic
Continuity
School
Region
Evolution,
Change and
Diversity
Reproductions/
Development
Province
Subtest
School
vs
Province
School
vs
Region
Final
Mark
School
vs
Province
School
vs
Region
Public
Exam
Mark
School
Region
Province
q q q q
q
q
q
p
q
q
q
q
65.0 60.1
112Number of Students
53.0
56.6
63.6
59.6
58.8
56.9
65.9
59.5
60.1
58.8
66.4
60.9
63.5 68.2
62.5 67.8
Biology 3201
0
10
20
30
40
50
60
70
80
90
100
58 60 59 6065 67 65 65
Final MarkExam Mark
Average Mark, 2014-2017
2014 2015 2016 2017
173* The overall Public Exam is equated. Therefore, subtest scores may vary from the overall exam mark.
The school result may appear numerically the same as the district/province due to rounding. The arrow indicates a negligible difference.pq

Public Exam Course Results
Biology 3201
2016-17
#304 - Holy Spirit High, Conception Bay South (Manuels) Grades: 9-12
NLESD - Eastern Region
Maintaining
Dynamic
Equilibrium
Reproductions/
Development
Genetic
Continuity
Evolution,
Change and
Diversity
-6
-5
-4
-3
-2
-1
0
-2-3
-5
-3
0 -1
-3-3
Final MarkExam Mark
2014 2015 2016
Difference from Provincial Mean, 2014-17
2017
0
10
20
30
40
50
60
70
80
90
100
51
68
52 53
60 6155 57
6763
5864
51 49
60 60
2014 2015 2016 2017
4 Year Public Exam (Subtest) Mark Trend 2014-2017
174* The overall Public Exam is equated. Therefore, subtest scores may vary from the overall exam mark.
The school result may appear numerically the same as the district/province due to rounding. The arrow indicates a negligible difference.pq

Public Exam Course Results
Biology 3201
2016-17
#307 - Mobile Central High, Mobile Grades: 7-12
NLESD - Eastern Region
Maintaining
Dynamic
Equilibrium
School
Region
Province
School
Region
Province
School
Region
Province
Genetic
Continuity
School
Region
Evolution,
Change and
Diversity
Reproductions/
Development
Province
Subtest
School
vs
Province
School
vs
Region
Final
Mark
School
vs
Province
School
vs
Region
Public
Exam
Mark
School
Region
Province
p p p p
q
p
p
p
p
p
p
q
71.6 64.4
26Number of Students
63.2
60.1
65.3
65.5
58.8
56.9
65.9
59.5
60.1
58.8
66.4
60.9
63.5 68.2
62.5 67.8
Biology 3201
0
10
20
30
40
50
60
70
80
90
100
6158
65 6468
6571 72
Final MarkExam Mark
Average Mark, 2014-2017
2014 2015 2016 2017
175* The overall Public Exam is equated. Therefore, subtest scores may vary from the overall exam mark.
The school result may appear numerically the same as the district/province due to rounding. The arrow indicates a negligible difference.pq

Public Exam Course Results
Biology 3201
2016-17
#307 - Mobile Central High, Mobile Grades: 7-12
NLESD - Eastern Region
Maintaining
Dynamic
Equilibrium
Reproductions/
Development
Genetic
Continuity
Evolution,
Change and
Diversity
-6
-4
-2
0
2
4
1
-6
21
3
-3
3 3
Final MarkExam Mark
2014 2015 2016
Difference from Provincial Mean, 2014-17
2017
0
10
20
30
40
50
60
70
80
90
100
51
65
54
6366
5660 60
72
60
6865
57
49
7166
2014 2015 2016 2017
4 Year Public Exam (Subtest) Mark Trend 2014-2017
176* The overall Public Exam is equated. Therefore, subtest scores may vary from the overall exam mark.
The school result may appear numerically the same as the district/province due to rounding. The arrow indicates a negligible difference.pq

Public Exam Course Results
Biology 3201
2016-17
#311 - Mount Pearl Senior High, Mount Pearl Grades: 9-12
NLESD - Eastern Region
Maintaining
Dynamic
Equilibrium
School
Region
Province
School
Region
Province
School
Region
Province
Genetic
Continuity
School
Region
Evolution,
Change and
Diversity
Reproductions/
Development
Province
Subtest
School
vs
Province
School
vs
Region
Final
Mark
School
vs
Province
School
vs
Region
Public
Exam
Mark
School
Region
Province
p p p p
p
p
p
p
p
p
p
p
69.2 64.8
114Number of Students
61.8
60.2
67.6
63.9
58.8
56.9
65.9
59.5
60.1
58.8
66.4
60.9
63.5 68.2
62.5 67.8
Biology 3201
0
10
20
30
40
50
60
70
80
90
100
6367 66 65
68 70 70 69
Final MarkExam Mark
Average Mark, 2014-2017
2014 2015 2016 2017
177* The overall Public Exam is equated. Therefore, subtest scores may vary from the overall exam mark.
The school result may appear numerically the same as the district/province due to rounding. The arrow indicates a negligible difference.pq

Public Exam Course Results
Biology 3201
2016-17
#311 - Mount Pearl Senior High, Mount Pearl Grades: 9-12
NLESD - Eastern Region
Maintaining
Dynamic
Equilibrium
Reproductions/
Development
Genetic
Continuity
Evolution,
Change and
Diversity
0.0
0.5
1.0
1.5
2.0
2.5
3.0
3.5
4.0
3
4
2
1
3
2
2
1
Final MarkExam Mark
2014 2015 2016
Difference from Provincial Mean, 2014-17
2017
0
10
20
30
40
50
60
70
80
90
100
59
76
60 62
6967
62 60
69 68 67 68
5963
6964
2014 2015 2016 2017
4 Year Public Exam (Subtest) Mark Trend 2014-2017
178* The overall Public Exam is equated. Therefore, subtest scores may vary from the overall exam mark.
The school result may appear numerically the same as the district/province due to rounding. The arrow indicates a negligible difference.pq

Public Exam Course Results
Biology 3201
2016-17
#313 - O'Donel High School, Mount Pearl Grades: 10-12
NLESD - Eastern Region
Maintaining
Dynamic
Equilibrium
School
Region
Province
School
Region
Province
School
Region
Province
Genetic
Continuity
School
Region
Evolution,
Change and
Diversity
Reproductions/
Development
Province
Subtest
School
vs
Province
School
vs
Region
Final
Mark
School
vs
Province
School
vs
Region
Public
Exam
Mark
School
Region
Province
q q q q
q
q
q
q
q
q
q
q
66.4 60.1
107Number of Students
56.5
54.8
64.0
56.6
58.8
56.9
65.9
59.5
60.1
58.8
66.4
60.9
63.5 68.2
62.5 67.8
Biology 3201
0
10
20
30
40
50
60
70
80
90
100
54
6459 60 61
6865 66
Final MarkExam Mark
Average Mark, 2014-2017
2014 2015 2016 2017
179* The overall Public Exam is equated. Therefore, subtest scores may vary from the overall exam mark.
The school result may appear numerically the same as the district/province due to rounding. The arrow indicates a negligible difference.pq

Public Exam Course Results
Biology 3201
2016-17
#313 - O'Donel High School, Mount Pearl Grades: 10-12
NLESD - Eastern Region
Maintaining
Dynamic
Equilibrium
Reproductions/
Development
Genetic
Continuity
Evolution,
Change and
Diversity
-7
-6
-5
-4
-3
-2
-1
0
1
-6
0
-5
-3
-5
1
-3
-2
Final MarkExam Mark
2014 2015 2016
Difference from Provincial Mean, 2014-17
2017
0
10
20
30
40
50
60
70
80
90
100
45
72
5156
5965
56 5560
6559
64
41
52
58 57
2014 2015 2016 2017
4 Year Public Exam (Subtest) Mark Trend 2014-2017
180* The overall Public Exam is equated. Therefore, subtest scores may vary from the overall exam mark.
The school result may appear numerically the same as the district/province due to rounding. The arrow indicates a negligible difference.pq

Public Exam Course Results
Biology 3201
2016-17
#336 - Gonzaga Regional High, St. John's Grades: 10-12
NLESD - Eastern Region
Maintaining
Dynamic
Equilibrium
School
Region
Province
School
Region
Province
School
Region
Province
Genetic
Continuity
School
Region
Evolution,
Change and
Diversity
Reproductions/
Development
Province
Subtest
School
vs
Province
School
vs
Region
Final
Mark
School
vs
Province
School
vs
Region
Public
Exam
Mark
School
Region
Province
p p p p
p
p
p
p
p
p
p
p
73.9 69.1
152Number of Students
68.2
63.6
71.5
69.5
58.8
56.9
65.9
59.5
60.1
58.8
66.4
60.9
63.5 68.2
62.5 67.8
Biology 3201
0
10
20
30
40
50
60
70
80
90
100
67 67 69 69 70 71 72 74
Final MarkExam Mark
Average Mark, 2014-2017
2014 2015 2016 2017
181* The overall Public Exam is equated. Therefore, subtest scores may vary from the overall exam mark.
The school result may appear numerically the same as the district/province due to rounding. The arrow indicates a negligible difference.pq

Public Exam Course Results
Biology 3201
2016-17
#336 - Gonzaga Regional High, St. John's Grades: 10-12
NLESD - Eastern Region
Maintaining
Dynamic
Equilibrium
Reproductions/
Development
Genetic
Continuity
Evolution,
Change and
Diversity
0
1
2
3
4
5
6
7 7
4
6 6
5
3
4
6
Final MarkExam Mark
2014 2015 2016
Difference from Provincial Mean, 2014-17
2017
0
10
20
30
40
50
60
70
80
90
100
61
77
6568 70 67 68
64
75
69 70 71
6056
71 69
2014 2015 2016 2017
4 Year Public Exam (Subtest) Mark Trend 2014-2017
182* The overall Public Exam is equated. Therefore, subtest scores may vary from the overall exam mark.
The school result may appear numerically the same as the district/province due to rounding. The arrow indicates a negligible difference.pq

Public Exam Course Results
Biology 3201
2016-17
#340 - Holy Heart High School, St. John's Grades: 10-12
NLESD - Eastern Region
Maintaining
Dynamic
Equilibrium
School
Region
Province
School
Region
Province
School
Region
Province
Genetic
Continuity
School
Region
Evolution,
Change and
Diversity
Reproductions/
Development
Province
Subtest
School
vs
Province
School
vs
Region
Final
Mark
School
vs
Province
School
vs
Region
Public
Exam
Mark
School
Region
Province
p p p p
p
p
p
p
p
p
p
p
71.5 66.3
54Number of Students
60.5
59.3
72.1
61.4
58.8
56.9
65.9
59.5
60.1
58.8
66.4
60.9
63.5 68.2
62.5 67.8
Biology 3201
0
10
20
30
40
50
60
70
80
90
100
6267 64 66 68
73 71 71
Final MarkExam Mark
Average Mark, 2014-2017
2014 2015 2016 2017
183* The overall Public Exam is equated. Therefore, subtest scores may vary from the overall exam mark.
The school result may appear numerically the same as the district/province due to rounding. The arrow indicates a negligible difference.pq

Public Exam Course Results
Biology 3201
2016-17
#340 - Holy Heart High School, St. John's Grades: 10-12
NLESD - Eastern Region
Maintaining
Dynamic
Equilibrium
Reproductions/
Development
Genetic
Continuity
Evolution,
Change and
Diversity
0
1
2
3
4
5
6
2
4
0
3 3
5
43
Final MarkExam Mark
2014 2015 2016
Difference from Provincial Mean, 2014-17
2017
0
10
20
30
40
50
60
70
80
90
100
60
74
5660
69 69
60 59
7168 68
72
62 61 60 61
2014 2015 2016 2017
4 Year Public Exam (Subtest) Mark Trend 2014-2017
184* The overall Public Exam is equated. Therefore, subtest scores may vary from the overall exam mark.
The school result may appear numerically the same as the district/province due to rounding. The arrow indicates a negligible difference.pq

Public Exam Course Results
Biology 3201
2016-17
#347 - Prince of Wales Collegiate, St. John's Grades: 10-12
NLESD - Eastern Region
Maintaining
Dynamic
Equilibrium
School
Region
Province
School
Region
Province
School
Region
Province
Genetic
Continuity
School
Region
Evolution,
Change and
Diversity
Reproductions/
Development
Province
Subtest
School
vs
Province
School
vs
Region
Final
Mark
School
vs
Province
School
vs
Region
Public
Exam
Mark
School
Region
Province
q q q q
q
q
q
q
q
q
q
q
66.9 61.0
105Number of Students
56.3
56.5
65.6
56.0
58.8
56.9
65.9
59.5
60.1
58.8
66.4
60.9
63.5 68.2
62.5 67.8
Biology 3201
0
10
20
30
40
50
60
70
80
90
100
5862 62 61 63
67 67 67
Final MarkExam Mark
Average Mark, 2014-2017
2014 2015 2016 2017
185* The overall Public Exam is equated. Therefore, subtest scores may vary from the overall exam mark.
The school result may appear numerically the same as the district/province due to rounding. The arrow indicates a negligible difference.pq

Public Exam Course Results
Biology 3201
2016-17
#347 - Prince of Wales Collegiate, St. John's Grades: 10-12
NLESD - Eastern Region
Maintaining
Dynamic
Equilibrium
Reproductions/
Development
Genetic
Continuity
Evolution,
Change and
Diversity
-2.8
-2.4
-2.0
-1.6
-1.2
-0.8
-0.4
0.0
-2
-1
-1
-2
-2
-1
-1 -1
Final MarkExam Mark
2014 2015 2016
Difference from Provincial Mean, 2014-17
2017
0
10
20
30
40
50
60
70
80
90
100
50
70
54 56
63 63 6057
6663 64 66
46
54
6156
2014 2015 2016 2017
4 Year Public Exam (Subtest) Mark Trend 2014-2017
186* The overall Public Exam is equated. Therefore, subtest scores may vary from the overall exam mark.
The school result may appear numerically the same as the district/province due to rounding. The arrow indicates a negligible difference.pq

Public Exam Course Results
Biology 3201
2016-17
#354 - St. Kevin's High, St. John's (Goulds) Grades: 9-12
NLESD - Eastern Region
Maintaining
Dynamic
Equilibrium
School
Region
Province
School
Region
Province
School
Region
Province
Genetic
Continuity
School
Region
Evolution,
Change and
Diversity
Reproductions/
Development
Province
Subtest
School
vs
Province
School
vs
Region
Final
Mark
School
vs
Province
School
vs
Region
Public
Exam
Mark
School
Region
Province
q q q q
q
q
q
q
q
q
q
q
63.0 57.8
42Number of Students
54.5
51.5
60.7
57.2
58.8
56.9
65.9
59.5
60.1
58.8
66.4
60.9
63.5 68.2
62.5 67.8
Biology 3201
0
10
20
30
40
50
60
70
80
90
100
6257
49
58
66 64
55
63
Final MarkExam Mark
Average Mark, 2014-2017
2014 2015 2016 2017
187* The overall Public Exam is equated. Therefore, subtest scores may vary from the overall exam mark.
The school result may appear numerically the same as the district/province due to rounding. The arrow indicates a negligible difference.pq

Public Exam Course Results
Biology 3201
2016-17
#354 - St. Kevin's High, St. John's (Goulds) Grades: 9-12
NLESD - Eastern Region
Maintaining
Dynamic
Equilibrium
Reproductions/
Development
Genetic
Continuity
Evolution,
Change and
Diversity
-16
-14
-12
-10
-8
-6
-4
-2
0
2 1
-6
-14
-6
0
-3
-13
-5
Final MarkExam Mark
2014 2015 2016
Difference from Provincial Mean, 2014-17
2017
0
10
20
30
40
50
60
70
80
90
100
54
69
42
54
70
61
4552
69
56
47
61
48
41
5457
2014 2015 2016 2017
4 Year Public Exam (Subtest) Mark Trend 2014-2017
188* The overall Public Exam is equated. Therefore, subtest scores may vary from the overall exam mark.
The school result may appear numerically the same as the district/province due to rounding. The arrow indicates a negligible difference.pq

Public Exam Course Results
Biology 3201
2016-17
#368 - Holy Trinity High, Torbay Grades: 7-12
NLESD - Eastern Region
Maintaining
Dynamic
Equilibrium
School
Region
Province
School
Region
Province
School
Region
Province
Genetic
Continuity
School
Region
Evolution,
Change and
Diversity
Reproductions/
Development
Province
Subtest
School
vs
Province
School
vs
Region
Final
Mark
School
vs
Province
School
vs
Region
Public
Exam
Mark
School
Region
Province
q q q q
q
q
q
p p
q
q
q
67.5 61.7
94Number of Students
62.1
55.5
65.3
55.2
58.8
56.9
65.9
59.5
60.1
58.8
66.4
60.9
63.5 68.2
62.5 67.8
Biology 3201
0
10
20
30
40
50
60
70
80
90
100
61
69
5562
6772
6268
Final MarkExam Mark
Average Mark, 2014-2017
2014 2015 2016 2017
189* The overall Public Exam is equated. Therefore, subtest scores may vary from the overall exam mark.
The school result may appear numerically the same as the district/province due to rounding. The arrow indicates a negligible difference.pq

Public Exam Course Results
Biology 3201
2016-17
#368 - Holy Trinity High, Torbay Grades: 7-12
NLESD - Eastern Region
Maintaining
Dynamic
Equilibrium
Reproductions/
Development
Genetic
Continuity
Evolution,
Change and
Diversity
-10
-8
-6
-4
-2
0
2
4
6
0
5
-8
-2
2
4
-6
-1
Final MarkExam Mark
2014 2015 2016
Difference from Provincial Mean, 2014-17
2017
0
10
20
30
40
50
60
70
80
90
100
52
79
52
62 6468
5356
70 69
54
65
52
60
5255
2014 2015 2016 2017
4 Year Public Exam (Subtest) Mark Trend 2014-2017
190* The overall Public Exam is equated. Therefore, subtest scores may vary from the overall exam mark.
The school result may appear numerically the same as the district/province due to rounding. The arrow indicates a negligible difference.pq

Public Exam Course Results
Biology 3201
2016-17
#464 - Crescent Collegiate, Blaketown Grades: 7-12
NLESD - Eastern Region
Maintaining
Dynamic
Equilibrium
School
Region
Province
School
Region
Province
School
Region
Province
Genetic
Continuity
School
Region
Evolution,
Change and
Diversity
Reproductions/
Development
Province
Subtest
School
vs
Province
School
vs
Region
Final
Mark
School
vs
Province
School
vs
Region
Public
Exam
Mark
School
Region
Province
q q q q
q
q
q
q
q
q
q
q
61.9 55.2
53Number of Students
52.8
50.2
58.3
50.5
58.8
56.9
65.9
59.5
60.1
58.8
66.4
60.9
63.5 68.2
62.5 67.8
Biology 3201
0
10
20
30
40
50
60
70
80
90
100
5360 59
5559
63 63 62
Final MarkExam Mark
Average Mark, 2014-2017
2014 2015 2016 2017
191* The overall Public Exam is equated. Therefore, subtest scores may vary from the overall exam mark.
The school result may appear numerically the same as the district/province due to rounding. The arrow indicates a negligible difference.pq
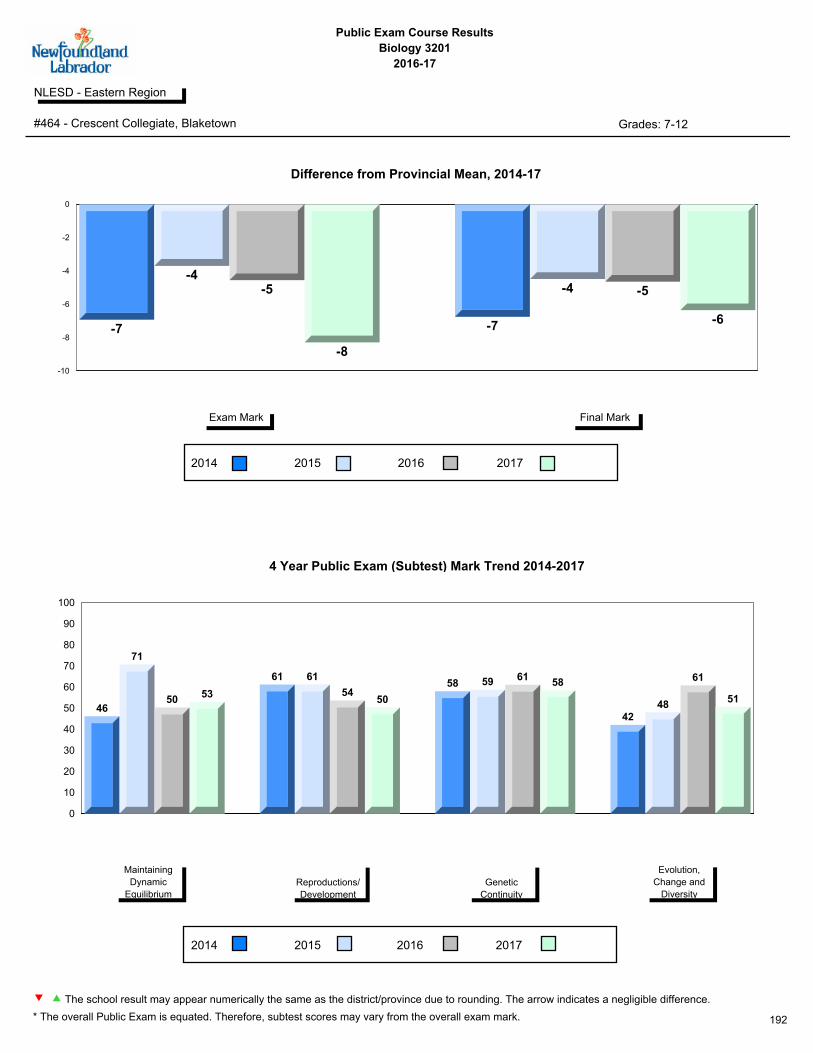
Public Exam Course Results
Biology 3201
2016-17
#464 - Crescent Collegiate, Blaketown Grades: 7-12
NLESD - Eastern Region
Maintaining
Dynamic
Equilibrium
Reproductions/
Development
Genetic
Continuity
Evolution,
Change and
Diversity
-10
-8
-6
-4
-2
0
-7
-4-5
-8
-7
-4 -5
-6
Final MarkExam Mark
2014 2015 2016
Difference from Provincial Mean, 2014-17
2017
0
10
20
30
40
50
60
70
80
90
100
46
71
5053
61 61
5450
58 59 6158
4248
61
51
2014 2015 2016 2017
4 Year Public Exam (Subtest) Mark Trend 2014-2017
192* The overall Public Exam is equated. Therefore, subtest scores may vary from the overall exam mark.
The school result may appear numerically the same as the district/province due to rounding. The arrow indicates a negligible difference.pq
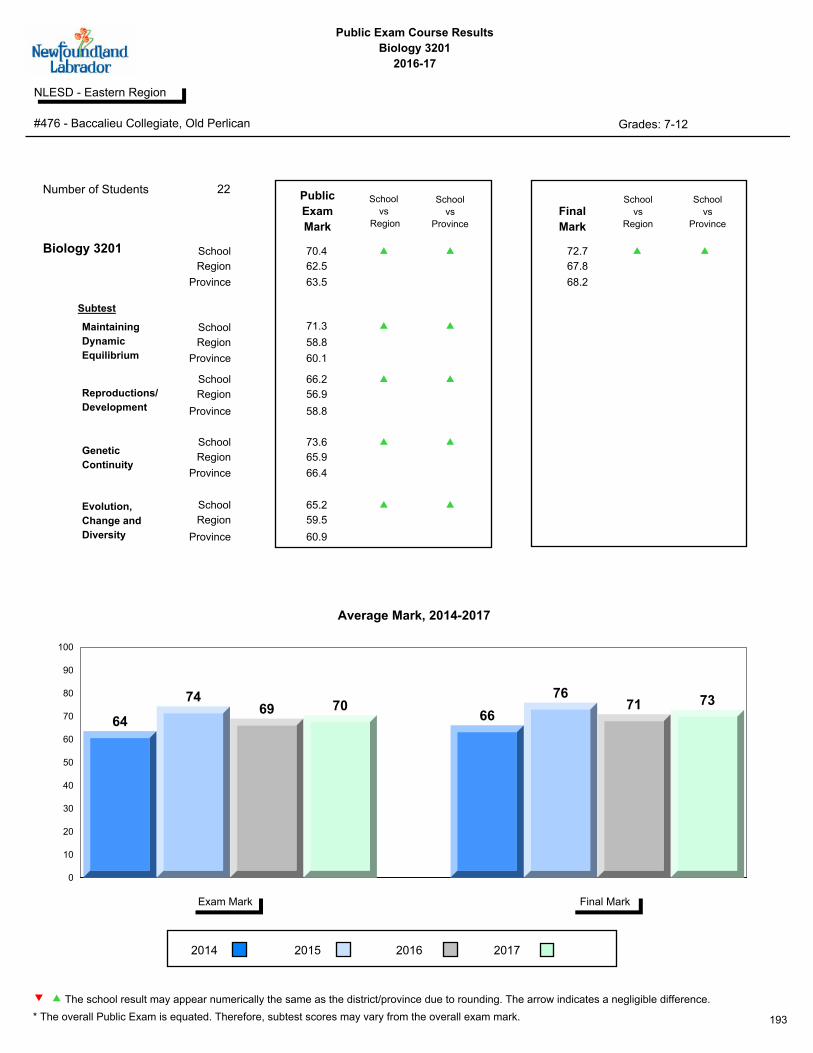
Public Exam Course Results
Biology 3201
2016-17
#476 - Baccalieu Collegiate, Old Perlican Grades: 7-12
NLESD - Eastern Region
Maintaining
Dynamic
Equilibrium
School
Region
Province
School
Region
Province
School
Region
Province
Genetic
Continuity
School
Region
Evolution,
Change and
Diversity
Reproductions/
Development
Province
Subtest
School
vs
Province
School
vs
Region
Final
Mark
School
vs
Province
School
vs
Region
Public
Exam
Mark
School
Region
Province
p p p p
p
p
p
p
p
p
p
p
72.7 70.4
22Number of Students
71.3
66.2
73.6
65.2
58.8
56.9
65.9
59.5
60.1
58.8
66.4
60.9
63.5 68.2
62.5 67.8
Biology 3201
0
10
20
30
40
50
60
70
80
90
100
64
7469 70
66
7671 73
Final MarkExam Mark
Average Mark, 2014-2017
2014 2015 2016 2017
193* The overall Public Exam is equated. Therefore, subtest scores may vary from the overall exam mark.
The school result may appear numerically the same as the district/province due to rounding. The arrow indicates a negligible difference.pq

Public Exam Course Results
Biology 3201
2016-17
#476 - Baccalieu Collegiate, Old Perlican Grades: 7-12
NLESD - Eastern Region
Maintaining
Dynamic
Equilibrium
Reproductions/
Development
Genetic
Continuity
Evolution,
Change and
Diversity
0
2
4
6
8
10
12
3
11
5
7
1
8
3
5
Final MarkExam Mark
2014 2015 2016
Difference from Provincial Mean, 2014-17
2017
0
10
20
30
40
50
60
70
80
90
100
55
86
6871 69
73
67 6671 70
67
74
53
78
7165
2014 2015 2016 2017
4 Year Public Exam (Subtest) Mark Trend 2014-2017
194* The overall Public Exam is equated. Therefore, subtest scores may vary from the overall exam mark.
The school result may appear numerically the same as the district/province due to rounding. The arrow indicates a negligible difference.pq
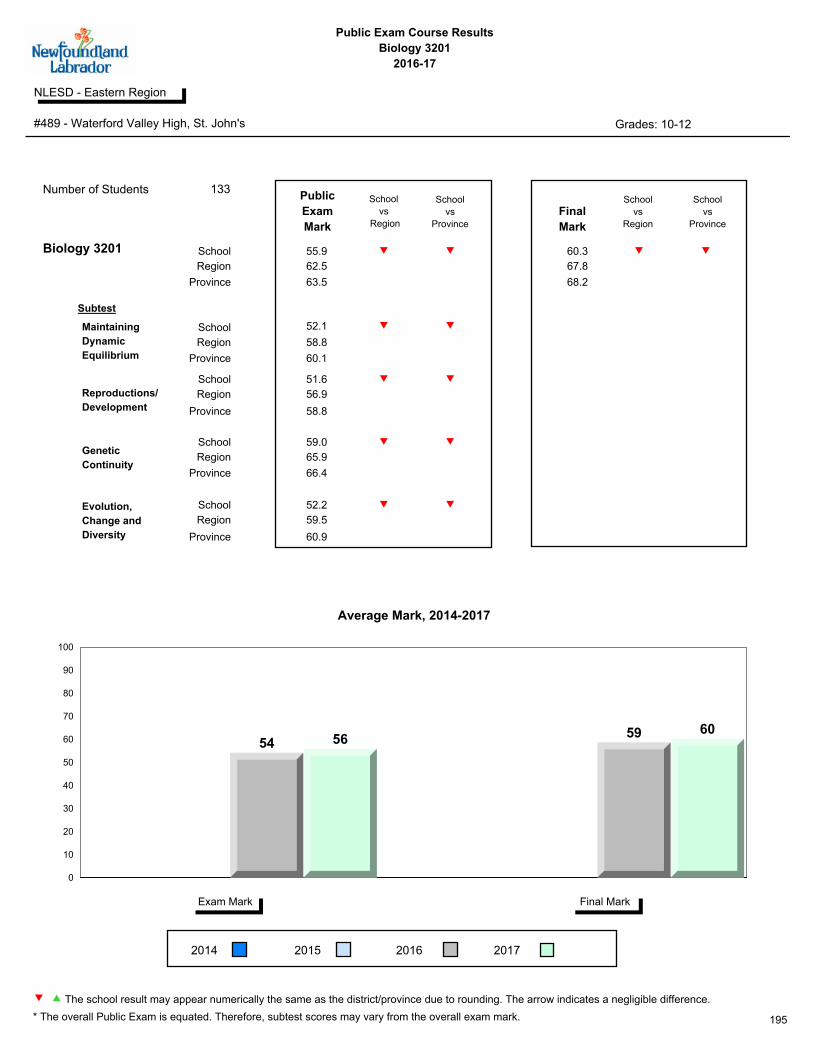
Public Exam Course Results
Biology 3201
2016-17
#489 - Waterford Valley High, St. John's Grades: 10-12
NLESD - Eastern Region
Maintaining
Dynamic
Equilibrium
School
Region
Province
School
Region
Province
School
Region
Province
Genetic
Continuity
School
Region
Evolution,
Change and
Diversity
Reproductions/
Development
Province
Subtest
School
vs
Province
School
vs
Region
Final
Mark
School
vs
Province
School
vs
Region
Public
Exam
Mark
School
Region
Province
q q q q
q
q
q
q
q
q
q
q
60.3 55.9
133Number of Students
52.1
51.6
59.0
52.2
58.8
56.9
65.9
59.5
60.1
58.8
66.4
60.9
63.5 68.2
62.5 67.8
Biology 3201
0
10
20
30
40
50
60
70
80
90
100
54 56 59 60
Final MarkExam Mark
Average Mark, 2014-2017
2014 2015 2016 2017
195* The overall Public Exam is equated. Therefore, subtest scores may vary from the overall exam mark.
The school result may appear numerically the same as the district/province due to rounding. The arrow indicates a negligible difference.pq

Public Exam Course Results
Biology 3201
2016-17
#489 - Waterford Valley High, St. John's Grades: 10-12
NLESD - Eastern Region
Maintaining
Dynamic
Equilibrium
Reproductions/
Development
Genetic
Continuity
Evolution,
Change and
Diversity
-10
-8
-6
-4
-2
0
-10
-8
-9
-8
Final MarkExam Mark
2014 2015 2016
Difference from Provincial Mean, 2014-17
2017
0
10
20
30
40
50
60
70
80
90
100
4852 51 52 53
5954 52
2014 2015 2016 2017
4 Year Public Exam (Subtest) Mark Trend 2014-2017
196* The overall Public Exam is equated. Therefore, subtest scores may vary from the overall exam mark.
The school result may appear numerically the same as the district/province due to rounding. The arrow indicates a negligible difference.pq

Public Exam Course Results
Biology 3201
2016-17
#374 - Murphy Centre, St. John's Grades: 10-12
District 803 - Private
Maintaining
Dynamic
Equilibrium
School
Region
Province
School
Region
Province
School
Region
Province
Genetic
Continuity
School
Region
Evolution,
Change and
Diversity
Reproductions/
Development
Province
Subtest
School
vs
Province
School
vs
Region
Final
Mark
School
vs
Province
School
vs
Region
Public
Exam
Mark
School
Region
Province
q q q q
q
q
q
q
p
p
q
q
65.9 63.1
21Number of Students
61.6
62.3
64.3
58.4
67.5
63.6
71.5
62.5
60.1
58.8
66.4
60.9
63.5 68.2
67.9 71.0
Biology 3201
0
10
20
30
40
50
60
70
80
90
100
59 56 5963 62 59 62
66
Final MarkExam Mark
Average Mark, 2014-2017
2014 2015 2016 2017
197* The overall Public Exam is equated. Therefore, subtest scores may vary from the overall exam mark.
The school result may appear numerically the same as the district/province due to rounding. The arrow indicates a negligible difference.pq

Public Exam Course Results
Biology 3201
2016-17
#374 - Murphy Centre, St. John's Grades: 10-12
District 803 - Private
Maintaining
Dynamic
Equilibrium
Reproductions/
Development
Genetic
Continuity
Evolution,
Change and
Diversity
-10
-8
-6
-4
-2
0
-1
-7
-5
0
-4
-8
-6
-2
Final MarkExam Mark
2014 2015 2016
Difference from Provincial Mean, 2014-17
2017
0
10
20
30
40
50
60
70
80
90
100
48
70
49
6264
5855
6265
5460
64
52
45
57 58
2014 2015 2016 2017
4 Year Public Exam (Subtest) Mark Trend 2014-2017
198* The overall Public Exam is equated. Therefore, subtest scores may vary from the overall exam mark.
The school result may appear numerically the same as the district/province due to rounding. The arrow indicates a negligible difference.pq

Public Exam Course Results
Biology 3201
2016-17
#450 - St. Bonaventure's College, St. John's Grades: K-12
District 803 - Private
Maintaining
Dynamic
Equilibrium
School
Region
Province
School
Region
Province
School
Region
Province
Genetic
Continuity
School
Region
Evolution,
Change and
Diversity
Reproductions/
Development
Province
Subtest
School
vs
Province
School
vs
Region
Final
Mark
School
vs
Province
School
vs
Region
Public
Exam
Mark
School
Region
Province
p p p p
q
p
p
p
p
p
p
p
76.9 73.1
13Number of Students
71.5
62.5
78.6
75.4
67.5
63.6
71.5
62.5
60.1
58.8
66.4
60.9
63.5 68.2
67.9 71.0
Biology 3201
0
10
20
30
40
50
60
70
80
90
100
73 73 74 7378 79 80
77
Final MarkExam Mark
Average Mark, 2014-2017
2014 2015 2016 2017
199* The overall Public Exam is equated. Therefore, subtest scores may vary from the overall exam mark.
The school result may appear numerically the same as the district/province due to rounding. The arrow indicates a negligible difference.pq

Public Exam Course Results
Biology 3201
2016-17
#450 - St. Bonaventure's College, St. John's Grades: K-12
District 803 - Private
Maintaining
Dynamic
Equilibrium
Reproductions/
Development
Genetic
Continuity
Evolution,
Change and
Diversity
0
2
4
6
8
10
12
14 13
1011
10
1212
12
9
Final MarkExam Mark
2014 2015 2016
Difference from Provincial Mean, 2014-17
2017
0
10
20
30
40
50
60
70
80
90
100
68
79
6972
76 74 73
63
83
74 7679
73
67
77 75
2014 2015 2016 2017
4 Year Public Exam (Subtest) Mark Trend 2014-2017
200* The overall Public Exam is equated. Therefore, subtest scores may vary from the overall exam mark.
The school result may appear numerically the same as the district/province due to rounding. The arrow indicates a negligible difference.pq

Public Exam Course Results
Biology 3201
2016-17
#453 - Eric G. Lambert All-Grade, Churchill Falls Grades: K-12
District 803 - Private
Maintaining
Dynamic
Equilibrium
School
Region
Province
School
Region
Province
School
Region
Province
Genetic
Continuity
School
Region
Evolution,
Change and
Diversity
Reproductions/
Development
Province
Subtest
School
vs
Province
School
vs
Region
Final
Mark
School
vs
Province
School
vs
Region
Public
Exam
Mark
School
Region
Province
p p p p
q
p
p
p
p
p
p
q
74.5 72.1
8Number of Students
76.6
68.8
78.6
52.1
67.5
63.6
71.5
62.5
60.1
58.8
66.4
60.9
63.5 68.2
67.9 71.0
Biology 3201
0
10
20
30
40
50
60
70
80
90
100
65 65
7872
68 68
8075
Final MarkExam Mark
Average Mark, 2014-2017
2014 2015 2016 2017
201* The overall Public Exam is equated. Therefore, subtest scores may vary from the overall exam mark.
The school result may appear numerically the same as the district/province due to rounding. The arrow indicates a negligible difference.pq
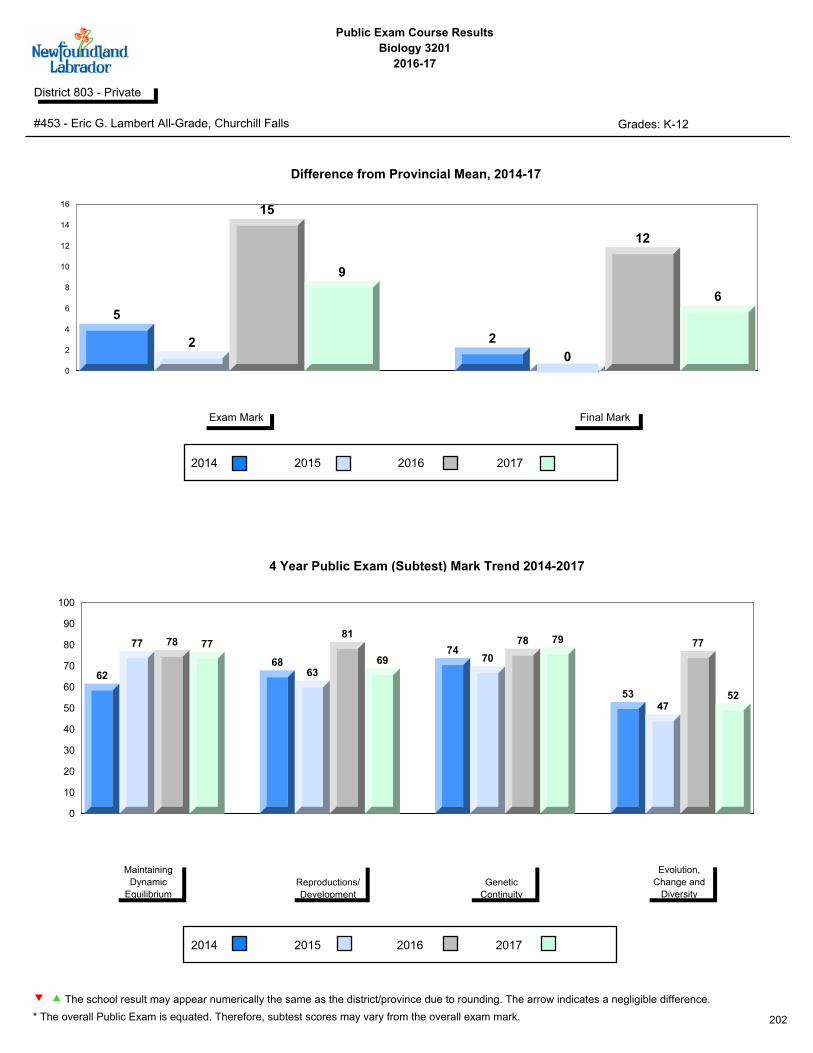
Public Exam Course Results
Biology 3201
2016-17
#453 - Eric G. Lambert All-Grade, Churchill Falls Grades: K-12
District 803 - Private
Maintaining
Dynamic
Equilibrium
Reproductions/
Development
Genetic
Continuity
Evolution,
Change and
Diversity
0
2
4
6
8
10
12
14
16
5
2
15
9
2
0
12
6
Final MarkExam Mark
2014 2015 2016
Difference from Provincial Mean, 2014-17
2017
0
10
20
30
40
50
60
70
80
90
100
62
77 78 77
6863
81
6974
70
78 79
5347
77
52
2014 2015 2016 2017
4 Year Public Exam (Subtest) Mark Trend 2014-2017
202* The overall Public Exam is equated. Therefore, subtest scores may vary from the overall exam mark.
The school result may appear numerically the same as the district/province due to rounding. The arrow indicates a negligible difference.pq

Public Exam Course Results
Biology 3201
2016-17
#018 - Sheshatshiu Innu School, Sheshatshiu Grades: K-12
District 804 - Native Federal
Maintaining
Dynamic
Equilibrium
School
Region
Province
School
Region
Province
School
Region
Province
Genetic
Continuity
School
Region
Evolution,
Change and
Diversity
Reproductions/
Development
Province
Subtest
School
vs
Province
School
vs
Region
Final
Mark
School
vs
Province
School
vs
Region
Public
Exam
Mark
School
Region
Province
p q p q
q
p
p
p
p
p
q
q
2Number of Students
Biology 3201
Final MarkExam Mark
Average Mark, 2014-2017
2014 2015 2016 2017
School data with 5 or fewer
students withheld for reasons of
confidentiality.
School data with 5 or fewer
students withheld for reasons of
confidentiality.
School data with 5 or fewer students withheld for reasons of confidentiality.
203* The overall Public Exam is equated. Therefore, subtest scores may vary from the overall exam mark.
The school result may appear numerically the same as the district/province due to rounding. The arrow indicates a negligible difference.pq

Public Exam Course Results
Biology 3201
2016-17
#018 - Sheshatshiu Innu School, Sheshatshiu Grades: K-12
District 804 - Native Federal
Maintaining
Dynamic
Equilibrium
Reproductions/
Development
Genetic
Continuity
Evolution,
Change and
Diversity
Final MarkExam Mark
2014 2015 2016
Difference from Provincial Mean, 2014-17
2017
2014 2015 2016 2017
4 Year Public Exam (Subtest) Mark Trend 2014-2017
School data with 5 or fewer students withheld for reasons of confidentiality.
School data with 5 or fewer students withheld for reasons of confidentiality.
204* The overall Public Exam is equated. Therefore, subtest scores may vary from the overall exam mark.
The school result may appear numerically the same as the district/province due to rounding. The arrow indicates a negligible difference.pq

Public Exam Course Results
Biology 3201
2016-17
#376 - Se't Anneway Kegnamogwom, Conne River Grades: K-12
District 804 - Native Federal
Maintaining
Dynamic
Equilibrium
School
Region
Province
School
Region
Province
School
Region
Province
Genetic
Continuity
School
Region
Evolution,
Change and
Diversity
Reproductions/
Development
Province
Subtest
School
vs
Province
School
vs
Region
Final
Mark
School
vs
Province
School
vs
Region
Public
Exam
Mark
School
Region
Province
q q q q
q
q
q
p
q
q
q
q
5Number of Students
Biology 3201
Final MarkExam Mark
Average Mark, 2014-2017
2014 2015 2016 2017
School data with 5 or fewer
students withheld for reasons of
confidentiality.
School data with 5 or fewer
students withheld for reasons of
confidentiality.
School data with 5 or fewer students withheld for reasons of confidentiality.
205* The overall Public Exam is equated. Therefore, subtest scores may vary from the overall exam mark.
The school result may appear numerically the same as the district/province due to rounding. The arrow indicates a negligible difference.pq

Public Exam Course Results
Biology 3201
2016-17
#376 - Se't Anneway Kegnamogwom, Conne River Grades: K-12
District 804 - Native Federal
Maintaining
Dynamic
Equilibrium
Reproductions/
Development
Genetic
Continuity
Evolution,
Change and
Diversity
Final MarkExam Mark
2014 2015 2016
Difference from Provincial Mean, 2014-17
2017
2014 2015 2016 2017
4 Year Public Exam (Subtest) Mark Trend 2014-2017
School data with 5 or fewer students withheld for reasons of confidentiality.
School data with 5 or fewer students withheld for reasons of confidentiality.
206* The overall Public Exam is equated. Therefore, subtest scores may vary from the overall exam mark.
The school result may appear numerically the same as the district/province due to rounding. The arrow indicates a negligible difference.pq