biological reference points for spiny dogfish · reference point and using the trawl footprint of...
TRANSCRIPT
Northeast Fisheries Science Center Reference Document 10-06
Biological Reference Points for Spiny Dogfish
by PJ Rago and KA Sosebee
May 2010

Northeast Fisheries Science Center Reference Document 10-06
US DEPARTMENT OF COMMERCENational Oceanic and Atmospheric Administration
National Marine Fisheries ServiceNortheast Fisheries Science Center
Woods Hole, Massachusetts
May 2010
Biological Reference Points for Spiny Dogfish
by PJ Rago and KA Sosebee
NOAA National Marine Fisheries Serv., 166 Water St., Woods Hole MA 02543

Northeast Fisheries Science Center Reference Documents
This series is a secondary scientific series designed to assure the long-term documentation and to enable the timely transmission of research results by Center and/or non-Center researchers, where such results bear upon the research mission of the Center (see the outside back cover for the mission statement). These documents receive internal scientific review, and most receive copy editing. The National Marine Fisheries Service does not endorse any proprietary material, process, or product mentioned in these documents. All documents issued in this series since April 2001, and several documents issued prior to that date, have been copublished in both paper and electronic versions. To access the electronic version of a document in this series, go to http://www.nefsc.noaa.gov/nefsc/publications/. The electronic version is available in PDF format to permit printing of a paper copy directly from the Internet. If you do not have Internet access, or if a desired document is one of the pre-April 2001 documents available only in the paper version, you can obtain a paper copy by contacting the senior Center author of the desired document. Refer to the title page of the document for the senior Center author’s name and mailing address. If there is no Center author, or if there is corporate (i.e., non-individualized) authorship, then contact the Center’s Woods Hole Labora-tory Library (166 Water St., Woods Hole, MA 02543-1026). Editorial Treatment: To distribute this report quickly, it has not undergone the normal tech-nical and copy editing by the Northeast Fisheries Science Center’s (NEFSC’s) Editorial Office as have most other issues in the NOAA Technical Memorandum NMFS-NE series. Other than the four covers and first two preliminary pages, all writing and editing have been performed by the authors listed within. This report was reviewed by the Stock Assessment Review Commit-tee, a planel of assessment experts from the Center for Independent Experts (CIE), University of Miami. Information Quality Act Compliance: In accordance with section 515 of Public Law 106-554, the Northeast Fisheries Science Center completed both technical and policy reviews for this report. These predissemination reviews are on file at the NEFSC Editorial Office. This document may be cited as:
Rago PJ and KA Sosebee. 2010. Biological Reference Points for Spiny Dogfish . North-east Fish Sci Cent Ref Doc. 10-06; 52 p. Available from: National Marine Fisheries Service, 166 Water Street, Woods Hole, MA 02543-1026, or online at: http://www.nefsc.noaa.gov/nefsc/publications/

1
Executive Summary Biological reference points are a critical component for the stewardship of fishery resources. Appropriate target levels of biomass and harvest rates allow managers to set regulations consistent with maximum sustainable yield, or an appropriate proxy. The primary focus of this report is to revise the biomass reference points for spiny dogfish (Squalus acanthias), and to update the fishing mortality reference points using the most recent catch and survey information. Previous biomass reference points for spiny dogfish were based on a Ricker stock-recruitment model derived from Northeast Fishery Science Center trawl survey data. SSBmax, the biomass that results in the maximum projected recruitment, is the proxy for BMSY. The revised biomass reference point incorporates additional information on the average size of the recruits as an important explanatory variable. A hierarchical AIC-based model building approach is used to identify the best model. Comparisons of maximum likelihood and robust nonlinear least squares regression models suggested that the robust estimator had the lowest AIC and highest precision for the estimate of SSBmax. The revised target reference point, expressed in terms of average weight (kg) per tow of female spiny dogfish greater than 80 cm, is estimated as 30.343 kg/tow. Conversion of this metric to swept area biomass depends on the average swept area per tow, i.e., the trawl footprint. The nominal footprint of the R/V Albatross is 0.01 nm2. Using this value, the swept area estimate of SSBmax is 189,553 mt. Using an alternative footprint more consistent with recent gear mensuration suggests that a footprint of 0.0119 nm2 is more appropriate. The revised swept area biomass target (SSBmax) corresponding to this footprint is 159,288 mt. Applying the convention defined in the current control rule in the Spiny Dogfish Fishery Management Plan, the threshold biomass is one half of the target or 79,644 mt. It is important to note that conversion to swept area biomass is not necessary for determination of overfished or rebuilt status, as long as the survey and biomass reference points are expressed in the same units. Based on the revised biomass reference point and using the trawl footprint of 0.0119 nm2, the US spiny dogfish resource was to be rebuilt in 2008 when the swept area female spawning stock biomass was 194,616 mt. Biomass in 2009 (163,256 mt) also exceeded the biomass reference point. Therefore, the stock is not overfished and it is rebuilt. Stochastic model estimates of female spawning stock biomass suggest a greater than 50% chance of exceeding the biomass target. Conversion to swept area biomass is important for estimation of appropriate catch levels and the estimation of fishing mortality rates that can be compared with fishing mortality reference points. The updated fishing mortality reference point incorporates the most recent information on size composition of discards, landings and surveys. Collectively, these data update the estimated selectivity pattern of the fishery. The updated target and threshold fishing mortality rates are 0.207 and 0.325, respectively. Updated estimates of fishing mortality rates in 2008 were 0.110. Therefore the stock is not experiencing overfishing. Stochastic model estimates of fishing mortality rates suggest that the probability of exceeding either the target or threshold F is near zero.
2
Biomass and fishing mortality reference points are required for US management purposes. The US is currently working with Canada on a more comprehensive joint stock assessment that may lead to revisions in the biomass estimates and biological reference points. Canada does not have the same requirements for fishery resource management. At present, the utility of the revised reference points herein is restricted to management processes in the US only. 1.0 Background This report summarizes analyses conducted after the Jan 25-29, 2010 meeting of the Transboundary Resource Assessment Committee (TRAC) for spiny dogfish. Despite major technical advances by both Canada and the US, the TRAC was unable to agree on a revised assessment model for spiny dogfish. The lack of an agreed-upon assessment meant that many of the Terms of Reference could not be met. In particular, a review of Biological Reference Points (BRP) could not be conducted. This posed a substantial problem for US management which requires biological reference points including an appropriate biomass reference point for a rebuilding program. BRPs are relevant for rebuilding purposes in the US management but are not relevant or binding for Canada. Current BRPs for the US fishery area have been controversial and no biomass target has been codified in the Mid Atlantic Fishery Management Council’s (MAFMC) Spiny Dogfish Fishery Management Plan (FMP). Near the end of the meeting, some initial analyses of the current biomass reference points were conducted but there was insufficient time for the reviewers to consider them. This report follows up on and extends those earlier analyses. The TRAC agreed that the reviewers (Drs. Thomas Miller, Maurice Clarke, Robert Mohn, and Vincent Gallucci) would consider these updated analyses and provide comments. On April 9, 2010 the TRAC reconvened via an internet- based conference call to discuss the major findings of this report. Unabridged written comments from the reviewers on a draft April 6, 2010 report and the conference call meeting may be found in Appendix 2. Where possible, their comments have been incorporated into this report. 2.0 Current Biological Reference Points In the current US management system, biological reference points for spiny dogfish are based on a life-history model to estimate appropriate fishing mortality rates, and a Ricker stock-recruitment model to estimate appropriate biomass targets. The assessment is based primarily on size- and sex-based swept area abundance indices derived from the NEFSC spring bottom trawl survey. A simple catch survey model (Rago and Sosebee, 2009) suggests that catchability is about 1.0 when the area swept per tow is based on the distance between the trawl wings. When the swept area is based on the area swept between the doors (twice as wide), the implied efficiency of the trawl is approximately 50%. The raw swept area indices (Table 1) provide useful measures of scale, but further experiments and/or a more formal analytical model are necessary to develop a more complete description of spiny dogfish dynamics. Nonetheless, the current assessment approach has proven to be useful for describing the important changes in the resource.
2.1 Effects of the 1989-2000 Fishery

3
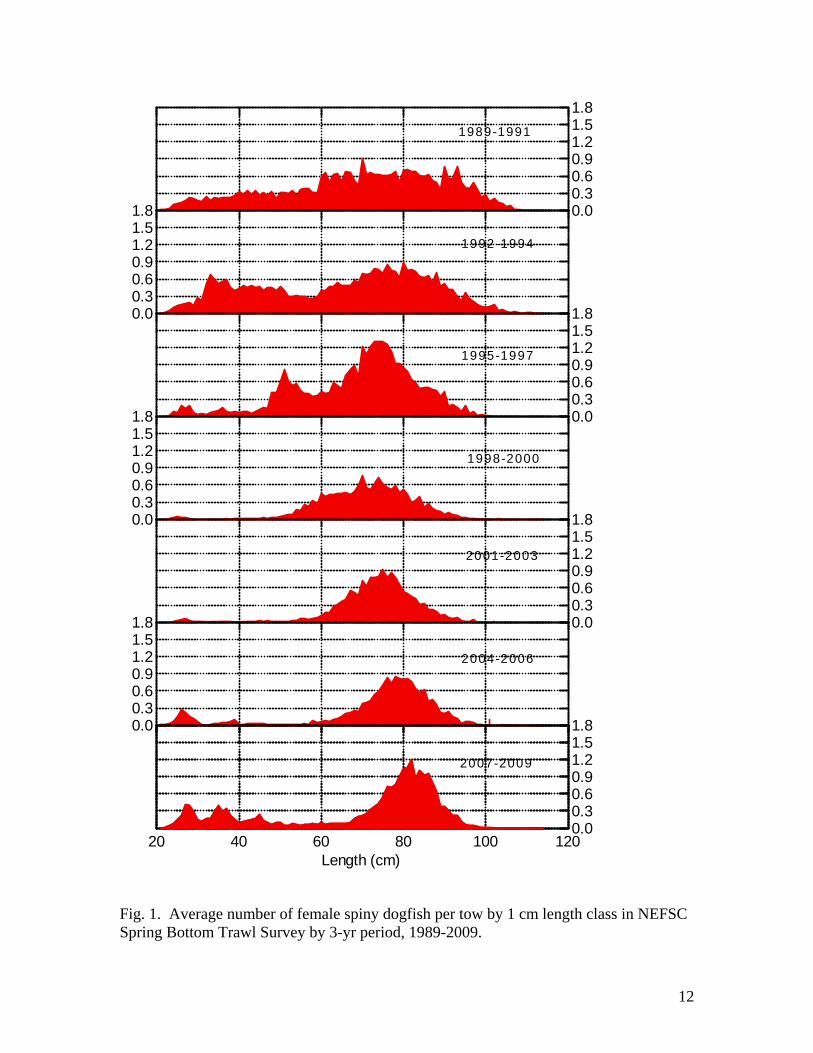
The domestic directed fishery that commenced in 1989 removed more than 260,000 mt of landings and an estimated 163,000 mt via discards. Most of the landings occurred close to shore. Over 92% of the landings were females; female dogfish constituted about 76% of the estimated dead discards. The disproportionate removal of mature female dogfish led to a decline in indices of spawning stock biomass, reductions in average size of mature female spiny dogfish, and an increase in the sex ratio of mature male to female abundance. Recruitment indices between 1997 and 2003 were the lowest on record (Table 2). This stanza of low pup production resulted in a reduction of dogfish between 50 and 70 cm in subsequent years. Effects on population size structure are illustrated in Fig. 1 and 2. Owing to their slow growth, longevity and sexual dimorphism, the changes in population structure induced by the fishery have long term implications for future harvesting. Those implications include a predicted oscillation in abundance as the maturation of the stanza of weak year classes reduces female SSB. The magnitude of future oscillations will vary depending on the intensity of the fishery (See Rago and Sosebee 2009, Fig 20, p. 362). As with year classes in any population, the influence of any single year class on stock dynamics is dampened as fishing mortality declines. 2.2 Reference Point for Fishing Mortality The Fmsy proxy for spiny dogfish is based on a length-based life history model that incorporates maturity, fecundity, expected number of female pups per female, a measure of population growth rate, and the contemporary selectivity pattern in the fishery. All of these attributes are expressed as functions of length. Details of the model are described in Rago et al. (1998) and Rago and Sosebee (2009, Appendix 2). This methodology underlying this biological reference point has been peer reviewed by the Stock Assessment Review Committee at SARCs 18 (NEFSC 1994), 26 (NEFSC 1998), 26 (NEFSC 2003) and most recently at SARC 43 (NEFSC 2006). The methodology for estimation of a biological reference point for fishing mortality was not updated as part of the present exercise. Therefore, the Fmsy proxy is the rate of fishing mortality, given the prevailing selectivity pattern in the fishery, that ensures that the lifetime pup production of the average female will be sufficient for replacement. The life history model for estimation of the Fmsy proxy is strongly dependent on the selectivity pattern in the fishery. Beverton and Holt (1957) demonstrated long ago that when other factors are held constant, the force of mortality on a population declines as the size or age-at-entry into the fishery increases. The size selectivity of the current fishery was estimated using Millar’s SELECT model by comparing the size frequencies in the survey and commercial catch (landings plus discards). The size selectivity estimates for males and females for the 2006-2008 fisheries are summarized in Appendix 1. This reflects an update from the last update at SARC 43 (NEFSC 2006). The selectivity function for the 2008 fishery suggested an L50 of 90 cm and the estimated threshold F=0.325. This is similar to the estimate of 0.390 estimated in NEFSC (2006). In absolute terms these fishing mortality rates are high in comparison to the F provided for
4
other elasmobranch studies. However, it must be remembered that the full force of mortality is applied to a relatively small fraction of the available size range owing to the shallow slope of the selectivity pattern (See Appendix 1). The target fishing mortality rate, that which allows 1.5 pups per recruit, is estimated as 0.207; the previous estimate of Ftarget in NEFSC 2006 was 0.284.
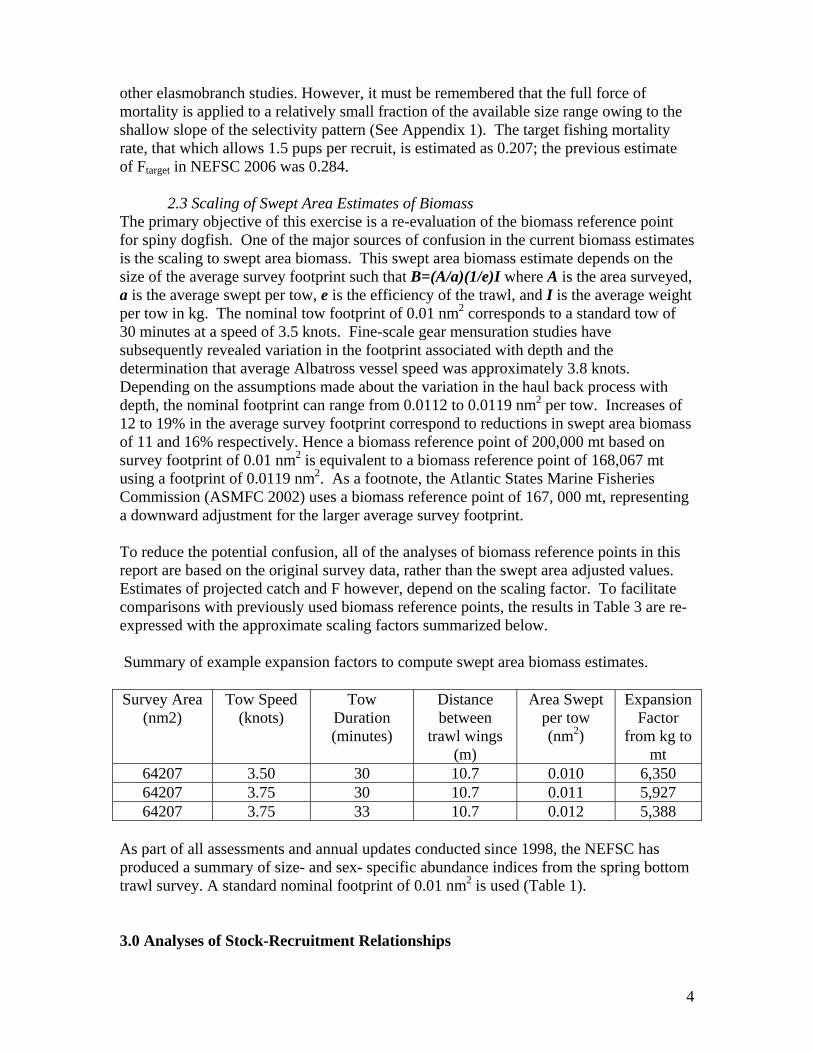
2.3 Scaling of Swept Area Estimates of Biomass The primary objective of this exercise is a re-evaluation of the biomass reference point for spiny dogfish. One of the major sources of confusion in the current biomass estimates is the scaling to swept area biomass. This swept area biomass estimate depends on the size of the average survey footprint such that B=(A/a)(1/e)I where A is the area surveyed, a is the average swept per tow, e is the efficiency of the trawl, and I is the average weight per tow in kg. The nominal tow footprint of 0.01 nm2 corresponds to a standard tow of 30 minutes at a speed of 3.5 knots. Fine-scale gear mensuration studies have subsequently revealed variation in the footprint associated with depth and the determination that average Albatross vessel speed was approximately 3.8 knots. Depending on the assumptions made about the variation in the haul back process with depth, the nominal footprint can range from 0.0112 to 0.0119 nm2 per tow. Increases of 12 to 19% in the average survey footprint correspond to reductions in swept area biomass of 11 and 16% respectively. Hence a biomass reference point of 200,000 mt based on survey footprint of 0.01 nm2 is equivalent to a biomass reference point of 168,067 mt using a footprint of 0.0119 nm2. As a footnote, the Atlantic States Marine Fisheries Commission (ASMFC 2002) uses a biomass reference point of 167, 000 mt, representing a downward adjustment for the larger average survey footprint. To reduce the potential confusion, all of the analyses of biomass reference points in this report are based on the original survey data, rather than the swept area adjusted values. Estimates of projected catch and F however, depend on the scaling factor. To facilitate comparisons with previously used biomass reference points, the results in Table 3 are re-expressed with the approximate scaling factors summarized below. Summary of example expansion factors to compute swept area biomass estimates. Survey Area
(nm2) Tow Speed
(knots) Tow
Duration (minutes)
Distance between
trawl wings (m)
Area Swept per tow (nm2)
Expansion Factor
from kg to mt
64207 3.50 30 10.7 0.010 6,350 64207 3.75 30 10.7 0.011 5,927 64207 3.75 33 10.7 0.012 5,388
As part of all assessments and annual updates conducted since 1998, the NEFSC has produced a summary of size- and sex- specific abundance indices from the spring bottom trawl survey. A standard nominal footprint of 0.01 nm2 is used (Table 1).
3.0 Analyses of Stock-Recruitment Relationships
5
3.1 Background
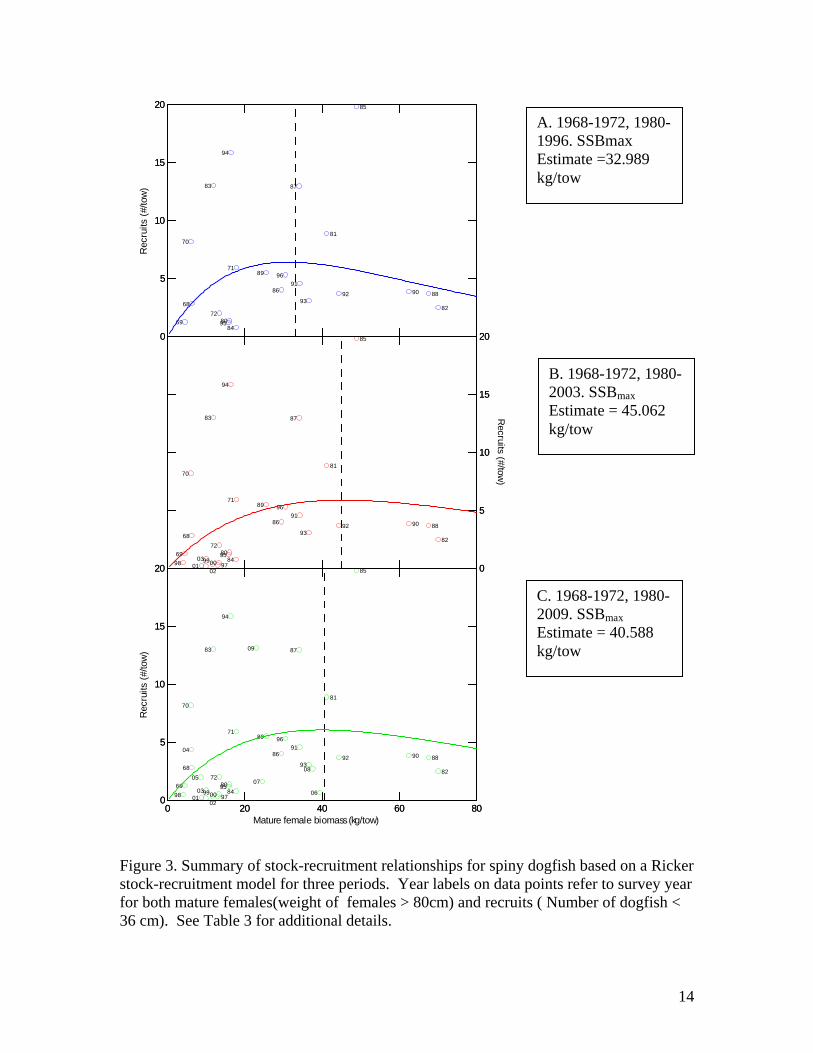
A brief history of the biomass reference points provides a useful starting point for the analytical approaches used in this report. A Ricker stock recruitment function was first used for the US spiny dogfish assessment in 1999 at a joint meeting of the Science and Statistical Committees (SSCs) of the New England and Mid-Atlantic Fishery Management Councils. Recruits were defined as dogfish less than 36 cm TL; spawners were defined as females greater than 80 cm. The SSCs endorsed an exploratory analysis of the stock recruitment relationship and selected SSBmax equal to 200,000 mt as a biomass reference point proxy for Bmsy. Owing to a variable rate of recruitment of juvenile spiny dogfish to the survey domain (juvenile are thought to be more pelagic than adults, and become more demersal with age), it was considered advisable to use the Ricker model primarily as a tool for estimating the stock size likely to produce maximum recruitment and, therefore, maximum potential yield. The original analyses were based on data from 1968 to 1996. SSB and recruitment estimates were smoothed in two-year stanzas as a way of reducing interannual variability and in part, to reflect the two-year gestation period for spiny dogfish. Comparisons with analyses that used the raw data (see Rago and Sosebee 2009, Table 5) suggested relatively minor effects of this approach on the estimated SSBmax. The basic analyses are recapitulated in Fig. 3 and summarized in Table 3 (Model 1). As a footnote, the SSBmax of 200,000 mt was not endorsed by the NEFMC; a lower alternative value proposed by NEFMC was not approved by NMFS. At SARC 37 additional data through 2003 included 7 years of the lowest recruitments on record (See Table 2 for a complete summary of the data). The resulting estimate of SSB max increased from 200,000 mt to nearly 300,000 mt. The SARC review panel noted that this increase was an artifact of the low recruitment stanza and not a credible measure of stock productivity. Hence, the SARC could not recommend a new BRP; the stalemate was confirmed again at SARC 43 in 2006. That panel suggested that the BRP of 200,000 mt was not a useful target but that the threshold, (i.e., ½ the target) could be used for management. A Frebuild estimate was based on attaining a target value of 200,000 mt even though official reference point was in the federal plan. The Atlantic States Marine Fisheries Commission, however, did adopt a BRP corresponding to a rescaled estimate corresponding to 200,000 mt (i.e., the nominal footprint). The use of a 2 yr moving average in previous analyses was noted earlier. Previous analyses also used imputed values of female SSB for 1968-1979. This was necessary at that time to account for the lack of sex information in the early years of the survey. The imputed estimate was based on the average sex ratio between 1980 and 1982. In view of the possible bias of this approach, we instead estimated SSB from actual survey data for 1968-1972, and dropped the imputed values for 1973-1979. A list of the original values, found in Table 5 of Rago and Sosebee (2009), can be compared with those summarized in Table 2 herein. The retrospective effects of adding additional years of data can be seen in Fig. 3. Inclusion of data through 2003 increased the SSBmax by 37% (Fig. 3 middle). The updated estimate of SSBmax through 2009 (Fig. 3 bottom) was only about 23% greater

6
than the original estimate from 1996, but it is clear that other sources of variation were influencing the lack of fit in the stock recruit relationship.
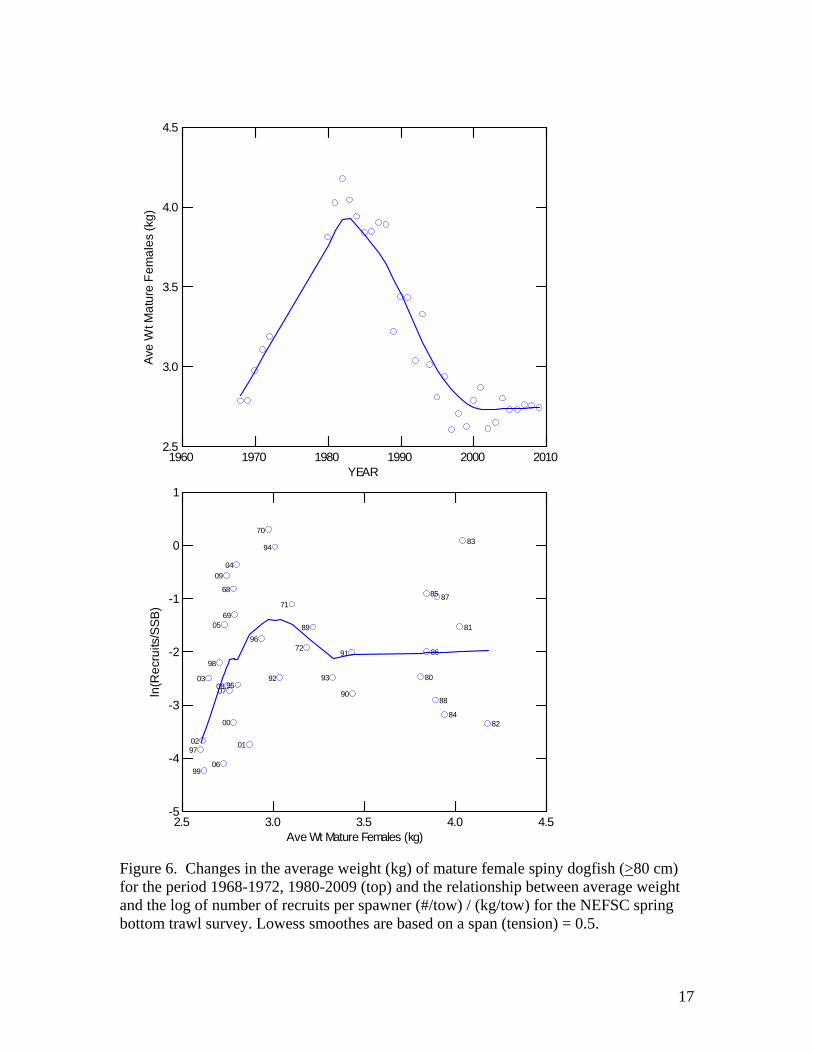
3.2 Incorporation of Covariates in the Ricker Model The Ricker model assumes that the total female biomass is an adequate measure of spawning potential. Earlier results, described in NEFSC (2003), illustrated that the number and average size of pups per female decline with declines in maternal size. Declines in pup size in smaller females could provide a possible explanatory mechanism for the lower than expected pup production since 1997. Analyses of the residuals of a Ricker model, summarized in Rago and Sosebee (2009) revealed a cluster of negative residuals particularly when the spawning stock size was below 100,000 mt in the 1997–2003 period. Model residuals, plotted against mean maternal length (see Figure 21 bottom in Rago and Sosebee 2009), revealed a strong clustering when maternal size was below the 1968–2006 median of 87 cm. An odds ratio test suggested that the odds of having a negative residual were 4.5 times greater when the mean length of spawners was below 87 cm. Three biological variables were considered as candidate explanatory variables in the Ricker model 1) average weight of mature females, 2) average weight of pups (<36 cm TL), and the 3) sex ratio of mature males to females. Each of these variables is related to general concepts of reproductive fitness, but they are correlated with each other (Fig. 4). An exploratory tree-based regression (Fig. 5) was used to gain further insights into the likely predictive utility of these variables. The regression tree model partitions the estimated log ratio of recruits per spawning stock biomass into groups using average weight of mature females, average weight of all pups and the mature male to mature female sex ratio as predictor variables. The model explained 35% of the variance in dependent variable. Highest average recruits per spawning stock biomass occurs when average weight of females exceeds 2.731 kg and average weight of pups exceeds 84 g. A model based only on accumulated stock biomass may be inadequate to predict recruitment for a population currently: a) exhibiting a strongly truncated size distribution (Fig. 1 and 2); b) a reduced average size of mature females (Fig. 6); c) smaller-than-average size pups (Fig. 7); and d) a skewed sex ratio (Fig. 8). The implications of the current sex ratio, which is dominated by males, are more problematic since this is a long-term transient condition. It is not known if biological mechanisms alone are sufficient to shift the balance toward the sex ratio observed before 1992 (Fig. 8). Recent information in the literature (Sims et al. 2001, Daly-Engel et al. 2010) highlight potential negative effects of skewed sex ratios for elasmobranch reproduction. To evaluate the utility of these candidate predictors , a reductionist model building approach was employed. The full model included all of the variables; the reduced models progressively tested all possible models (Table 3, Models 4-10, and Models 14-20). Two primary measure of model fit were employed. The first was a measure of AIC when maximum likelihood estimation was used. An approximation of AIC was used when robust estimation methods were employed (Burnham and Anderson 2002, p 63). The second primary measure of fit was associated the relative precision of the estimate of
7
SSBmax. Asymptotic standard errors of the SSBmax suggested wide confidence intervals when MLE methods were used. In many instances the confidence intervals included values less than zero and wide confidence intervals. The width of the confidence interval (High-Low) for the MLE based estimates were considered were considered unrealistic. (Table 3, Models 4-10) As an alternative estimation method, a robust estimation method recommended by Chen et al. (2003) was employed. The robust method was based on a down weighting of residuals using a t-distribution with 30 degrees of freedom. The full and all reduced models were examined using this approach (Models 14-20). In addition, the effect of alternative degrees of freedom was examined over the range of 5 to 20 (Model 21-23).
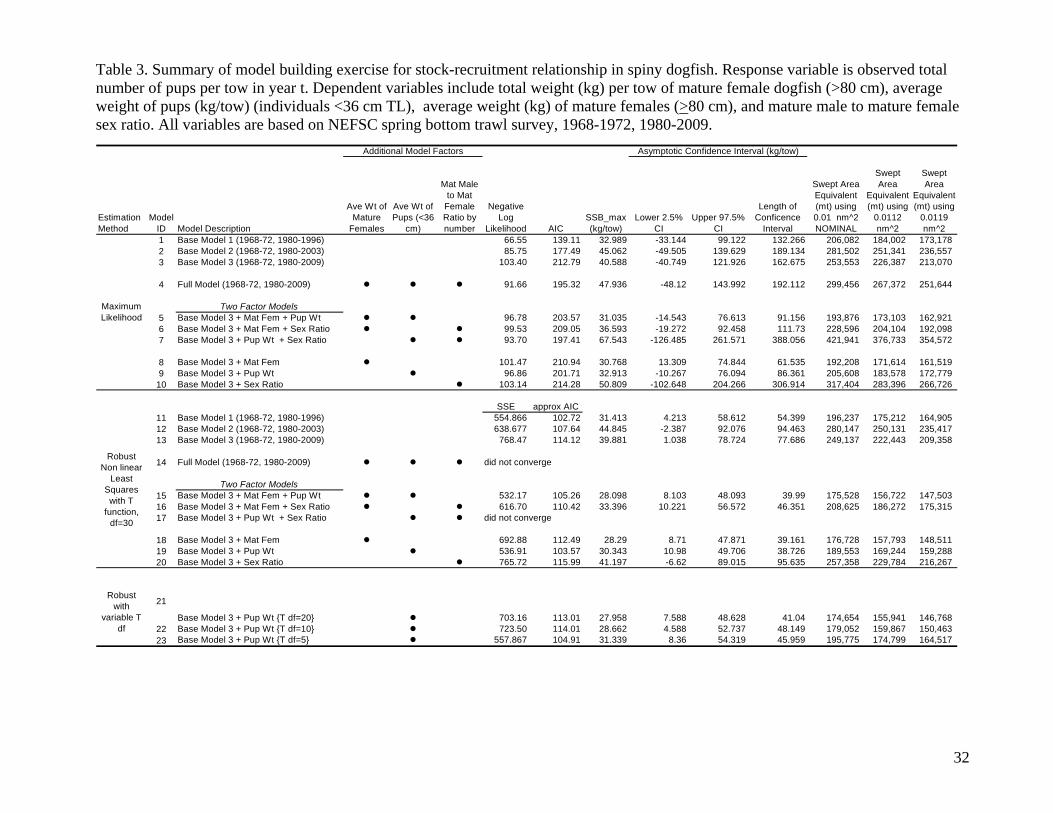
3.3 Stock Recruitment Results Comparison of the estimates based on MLE were not conclusive with respect to the “best” model. The best AIC was obtained when all three variables were included (Model 4) but the confidence interval width on SSBmax was more than 3-fold greater than the most precise estimate (Model 8). The lower bound of CI for SSBmax in the full model was less than zero. Model 7 included two factors and was next best in terms of AIC but less precise for SSBmax. Average pup weight was an improvement (lower AIC) over the average maternal weight, but the confidence interval was unacceptably wide. Robust nonlinear regression methods gave much smaller confidence intervals and the minimum AIC model also had the narrowest confidence interval. Model 19 was selected as the “best” model for these reasons. A sensitivity analysis of the effect of varying the degrees of freedom for the t-distribution in the robust regression did not reveal any significant trend (Models 21-23). An additional sensitivity analysis was conducted to evaluate the effects of measurement error in the regression estimate of SSB max (Table 4). Measurement error is particularly relevant for spiny dogfish because the input data for the analysis have not been filtered through a model. Moreover, variations in availability are likely to affect the number of recruits and SSB estimates similarly. To account for these effects, additional error was added to fitted estimates of R and the predictor variable SSB. This “errors-in-variables” like approach demonstrated that the estimate of SSB max increased consistently with additional measurement error. The percent bias increased for both correlated and uncorrelated error but was generally greater when correlation was equal to one. A similar trend of bias in parameter estimates was observed in Chen et al. (2003, especially their Fig. 6). Their work suggested that the bias was offset by robust regression methods. The overall analyses of alternative models suggested that an appropriate measure of SSBmax was 30.343 kg/tow of mature female spiny dogfish. This model includes the average weight of pups as a covariate. This corresponds to a nominal swept area biomass estimate (0.01 nm2 footprint) of 189,553 mt; and an estimate of 159,288 mt when using the 0.0119 footprint.

8
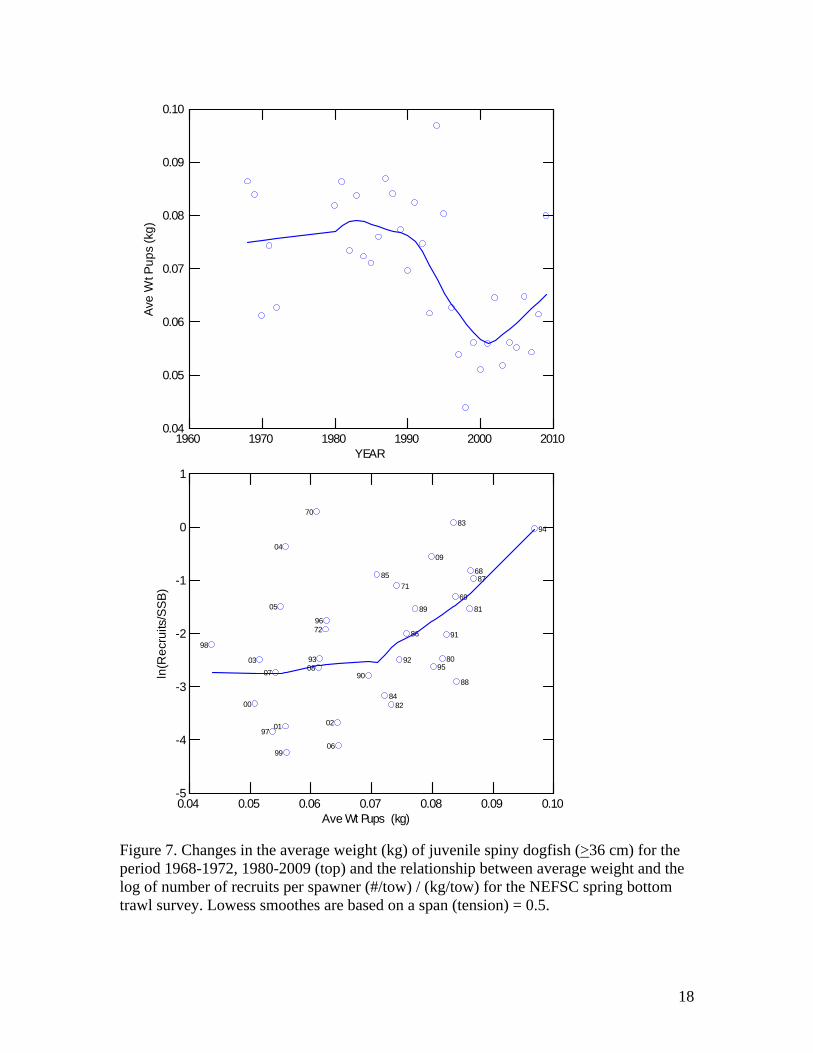
The overall model fit is summarized in Fig. 9 for varying levels of average pup weight. Model residuals suggest a reasonable degree of fit (Fig. 10) with no residual patterns. In other words, the inclusion of average pup weight seems to explain much of the variation. The exploratory tree-based regression (Fig. 5) suggested that exploration of a slightly more complex SR model that accounted for interactive effects might be useful for future research. Further exploration of the stock recruitment relation was conducted using lowess smoothing (Fig. 11). Results confirm that a simple Ricker model is insufficient to capture the changes in recruitment that occurred between 1997 and 2003. The smoothing algorithm supports the hypothesis that factors other than spawning stock biomass alone were responsible for the low recruitment. Interestingly, comparisons with the analytical model estimate of SSBmax and the lowess smooth are remarkably close (Fig. 11) Model 19 (Table 3) can be expressed as a three dimensional surface wherein recruitment is a function of both female spawning stock size and average pup weight. An examination of this response surface (Fig. 12) reveals the improvements in prediction by the inclusion of average pup weight. The solid contour lines (ranging from 3 to 15 pups per tow) represent predicted recruitment as a function of spawning stock biomass and average pup weight. The dotted lines represent intermediate steps of 0.5 pups/tow. The “conventional” stock recruit relationship for any fixed value of average pup size can be obtained as the height of the contour line as SSB increases. Each observation is labeled with the recruitment year. The size of the circle is proportional to the magnitude of the standardized residual; solid circles are positive residuals and open circles are negative residuals. The overall goodness-of-fit appears appropriate but the 1985 (standardized residual >4) appears to have a strong influence. The improvements in AIC from the robust regression over the MLE may be associated its down weighting of this observation. The utility of average pup weight is evinced in Fig. 7 where weight greater than 70 grams resulted in consistent increases in recruits per spawner. A plot of the slope of the SR curve at the regression (Fig. 13) suggests a sharp drop in slope with the onset of the directed fishery, but some suggestion in recent years that productivity may be improving.

9
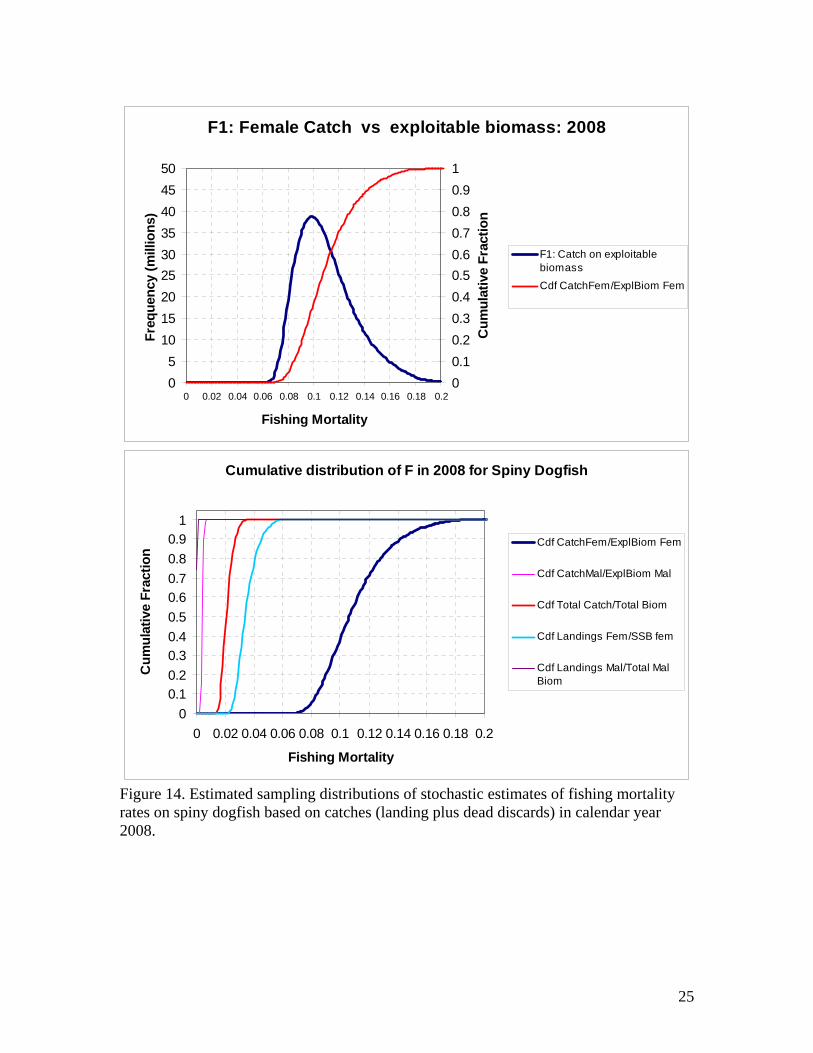
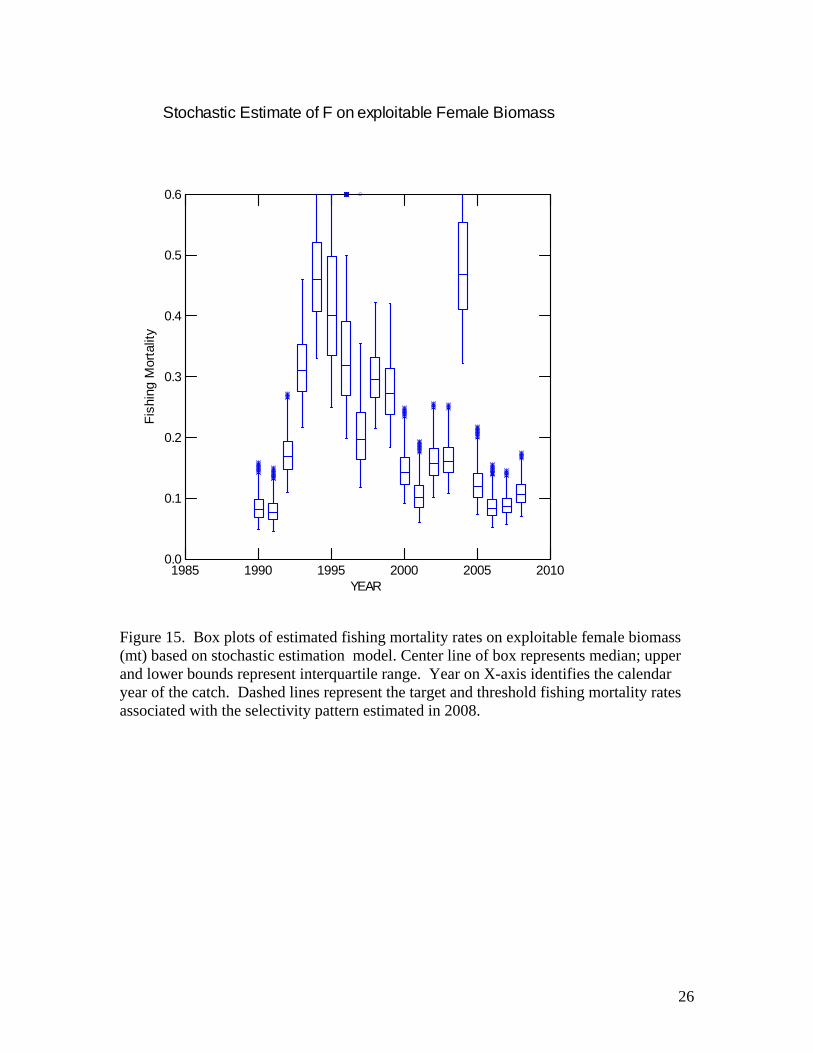
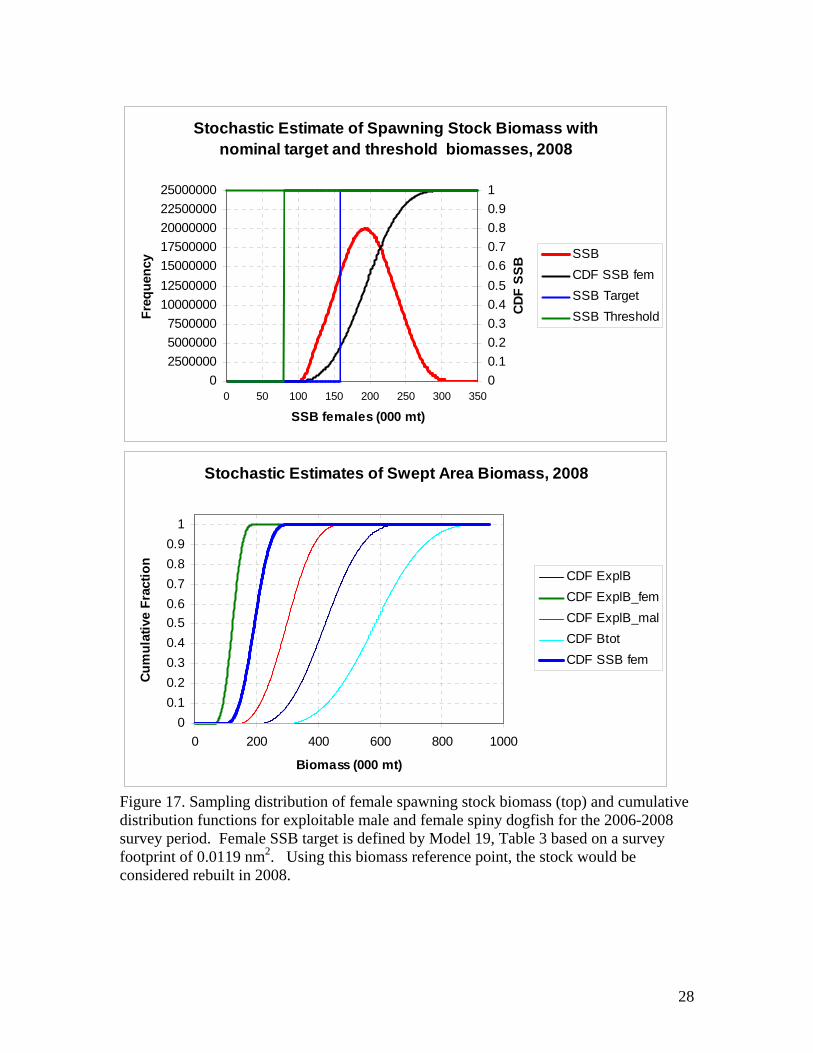
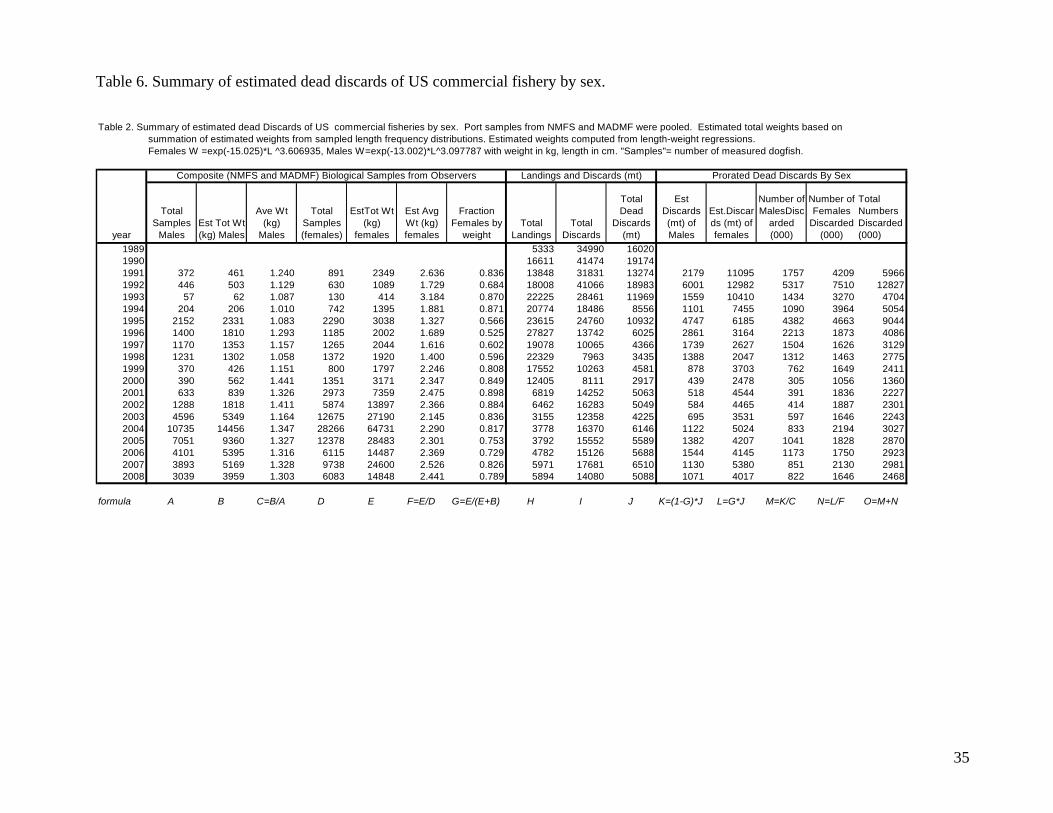
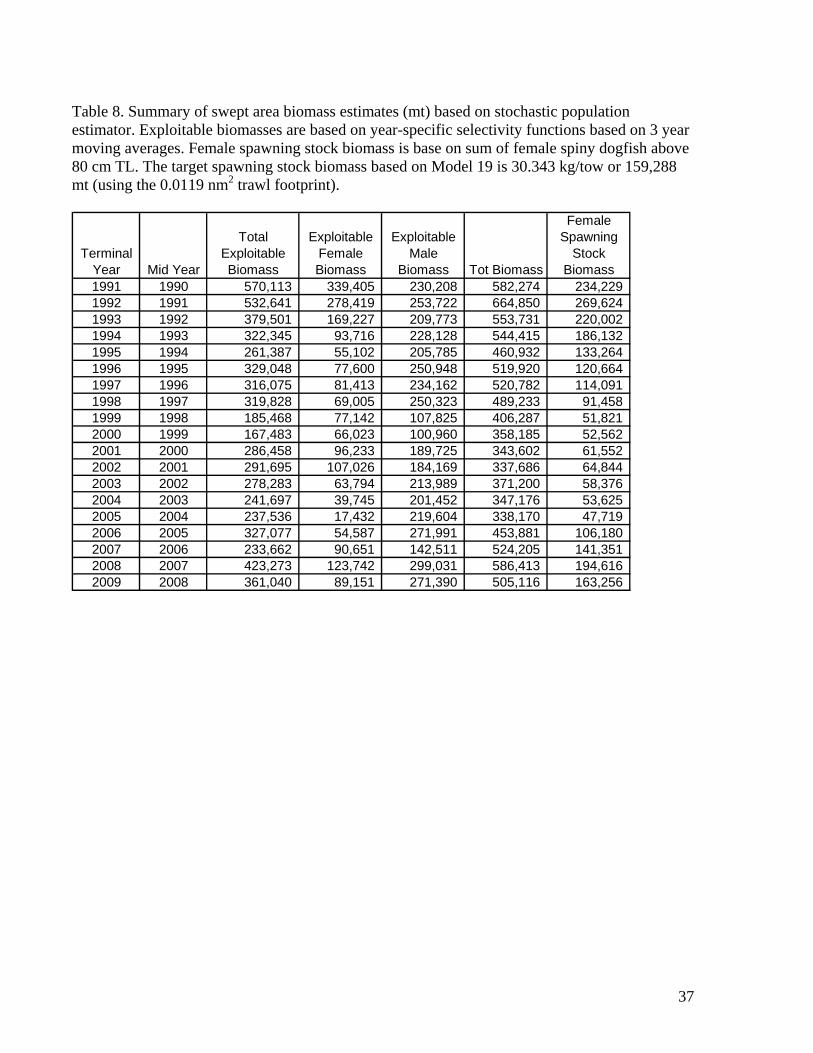
4.0 Comparisons with Current Biomass with Revised Biomass Reference Points Biological sampling of commercial landings and at-sea observer coverage have both improved in recent years. A summary of the biological samples and derived estimates of landings and discards by sex are given in Tables 5 and 6 respectively. Spiny dogfish are hardy fish and experimental evidence suggests that many survive capture. Estimated survival rates by gear type were applied to discards summarized in Table 6. Updated estimates of discards, landing and selectivity parameters were incorporated into a model to approximate the sampling distributions of swept area biomass and fishing mortality rates. Stochastic estimates of fishing mortality (Table 7) incorporate measurement error in stock size and total catch by incorporating sampling variability of the trawl survey, variations in the footprint of the trawl, and uncertainty in the discard estimates for commercial fisheries and the landings and discards in the recreational fishery. The resulting variations in the fishing mortality rates are depicted in 2008 (Fig. 14). Box plots of the entire sampling series are shown in Fig. 15. The high rate of fishing mortality in 2004 (Fig. 15) is due primarily to a change in selectivity. It should be remembered that the Fmsy proxy reference point also fluctuates annually in response to changes in selectivity. This is not necessarily a desirable feature of reference point estimation and comparisons of stock status. Future work will examine the multi-year selectivity patterns. The current modeling framework behaves similarly to a dynamic model with a random walk component for selectivity. Estimated exploitable biomass by sex (Table 8) varies annually. In part this is due to changes in size composition due to growth and recruitment, and interannual variability in catchability. Additional variability arises due to changes in selectivity of the fishery. A composite selectivity function is estimated across fleets. Landings and discard size frequencies are pooled so that the mixture of discard and landings by fleet can induce large swings in the magnitude of exploitable biomass. Female spawning stock biomass has varied over about a 4 fold range since 1991 reaching a low in 2005. Since then biomass estimates have increased steadily (Fig. 16). Comparisons of the newly defined biomass reference point with recent spawning stock biomass estimates (Fig. 16, 17, and 18) suggest that spiny dogfish exceeded the target biomass in 2008. The biomass estimate for 2008 is based on survey estimates for 2006-2008. There was about an 80% chance (Fig. 17) that the female spawning stock biomass exceeded the target of 30.343 kg per tow or equivalently, 159,288 mt based on the 0.0119 nm2 footprint (Table 3). Estimated spawning stock biomass again exceeded the threshold in 2009 (i.e., 2007-2009 survey years) (Fig. 18). Comparison of the 1991 to 2009 time series of biomass estimates (Fig. 16) revealed that female biomass fell below the target level in 1995 and remained below the threshold level from 1999 to 2005. Since then the stock has climbed steadily owing to growth of immature female dogfish into the 80 cm+ size range, survival and growth of the extant mature individuals, and a change in availability. Previous projections of stock biomass (SARC 37, Fig. 10) suggested that the population would increase to median biomass levels of about 130, 000 mt by about 2007
10
if status quo fishing persisted. Estimates made in 2006 at SARC 43 suggested that the median population biomass should exceed 175,000 mt by 2009 (See Fig. 20 in Rago and Sosebee). Hence, the current status is consistent with model forecasts made 7 and 5 years ago. Based on the revised biomass reference point and using the trawl footprint of 0.0119 nm2, the US spiny dogfish resource was rebuilt in 2008, when the swept area female spawning stock biomass was 194,616 mt. Biomass in 2009 (163,256 mt) also exceeded the biomass reference point. Therefore, the stock is not overfished and it is rebuilt. Stochastic model estimates of female spawning stock biomass suggest a greater than 50% chance of exceeding the biomass target. The updated target and threshold fishing mortality rates are 0.207 and 0.325, respectively. Updated estimates of fishing mortality rates in 2008 were 0.11. Therefore, the stock is not experiencing overfishing. Stochastic model estimates of fishing mortality rates suggest that the probability of exceeding either the target or threshold F is near zero. 5.0 Reviewer Comments The unabridged comments of the reviewers on the initial draft of this are summarized in Appendix 2. All of the comments were constructive and many provide guidance of future areas of research. Their comments have been incorporated into this report to the extent possible. Three of the four reviewers considered the Ricker model with covariates as a useful way forward. Additional analyses, especially Fig. 11 and 12 were designed to address some of the concerns raised by the fourth reviewer. All of the reviewers suggested addition research on other factors that may have been responsible for the complex patterns of recruitment in the past 15 years. References Atlantic States Marine Fisheries Commission (ASMFC). 2002. Interstate Fishery
Management Plan for Spiny Dogfish. Fishery Management Report No. 40. ASMFC. Washington DC. xi +107 pp.
Beverton, R. J. H. and S. J. Holt. 1957. On the dynamics of exploited fish populations.
Chapman and Hall. London. Burnham, K. P. and D. R. Anderson. 2002. Model selection and multimodel inference.
Second edition. Springer. New York. Chen, Y, Y. Jiao, and L. Chen. 2003. Developing robust frequentist and Bayesian fish
stock assessment methods. Fish and Fisheries 4:105-120. Daly-Engel, T. S., R. D. Grubbs, K. A. Feldheim, B. W. Bowen, and R. J. Toonen. 2010.
Is multiple mating beneficial or unavoidable? Low multiple paternity and genetic diversity in the shortspine spurdog Squalus mitsukurii. Marine Ecology Progress Series 403:255-267.

11
NEFSC [Northeast Fisheries Science Center]. 1994. Report of the 18th Northeast
Regional Stock Assessment Workshop: Stock Assessment Review Committee Consensus Summary of Assessments. National Marine Fisheries Service, Northeast Fisheries Science Center Reference Document, CRD 94-22. Woods Hole, MA, USA.
NEFSC [Northeast Fisheries Science Center]. 1998. Report of the 26th Northeast
Regional Stock Assessment Workshop: Stock Assessment Review Committee Consensus Summary of Assessments. National Marine Fisheries Service, Northeast Fisheries Science Center Reference Document, CRD 98-04. Woods Hole, MA, USA.
NEFSC [Northeast Fisheries Science Center]. 2003. Report of the 37th Northeast
Regional Stock Assessment Workshop: Stock Assessment Review Committee Consensus Summary of Assessments. National Marine Fisheries Service, Northeast Fisheries Science Center Reference Document, CRD 03-16. Woods Hole, MA, USA.
NEFSC [Northeast Fisheries Science Center]. 2006. Report of the 43rd Northeast
Regional Stock Assessment Workshop (43rd SAW): 43rd SAW Assessment Report. U.S. Department of Commerce, National Oceanic and Atmospheric Administration, National Marine Fisheries Service, Northeast Fisheries Science Center Reference Document, CRD 06-25. 400 pp. Woods Hole, MA, USA
Rago, P. J. and K. A. Sosebee. 2009 The Agony of Recovery: Scientific Challenges of
Spiny Dogfish Recovery Programs. pp 343-372. In V. F. Gallucci, G. A. McFarlane and G. G. Bargman eds. Biology and Management of Dogfish Sharks. American Fisheries Society, Bethesda Maryland.
Rago, P. J., K. A. Sosebee, J. K. T. Brodziak, S. A. Murawski, and E. D. Anderson. 1998.
Implications of recent increases in catches on the dynamics of Northwest Atlantic spiny dogfish (Squalus acanthias). Fisheries Research 39:165–181.
Ricker, W.E. 1975. Computation and interpretation of biological statistics of fish populations. Bulletin 191. Department of the Environment, Fisheries and Marine Service. Ottawa, Canada.
Sims, D.W., J. P. Nash, and D. Morritt. 2001. Movements and activity of male and
female dogfish in a tidal sea lough: alternative behavioural strategies and apparent sexual segregation. Marine Biology 139:1165-1175.
12
0.00.30.60.91.21.51.8
0.00.30.60.91.21.51.8
0.00.30.60.91.21.51.8
0.00.30.60.91.21.51.8
0.00.30.60.91.21.51.8
0.00.30.60.91.21.51.8
0.00.30.60.91.21.51.8
20 40 60 80 100 120Length (cm)
1989-1991
1992-1994
1995-1997
1998-2000
2001-2003
2004-2006
2007-2009
Fig. 1. Average number of female spiny dogfish per tow by 1 cm length class in NEFSC Spring Bottom Trawl Survey by 3-yr period, 1989-2009.

13
0.00.51.01.52.02.53.0
0.00.51.01.52.02.53.0
0.00.51.01.52.02.53.0
0.00.51.01.52.02.53.0
0.00.51.01.52.02.53.0
0.00.91.82.73.64.5
0.00.91.82.73.64.5
20 40 60 80 100 120Length (cm)
1989-1991
1992-1994
1995-1997
1998-2000
2001-2003
2004-2006
2007-2009
Fig. 2. Average number of male spiny dogfish per tow by 1 cm length class in NEFSC Spring Bottom Trawl Survey by 3-yr period, 1989-2009. Note the scale change for 2004-06 and 2007-2009.
14
0
5
10
15
20
Rec
rui ts
(#/
tow
)
69
70
68
83
72
9580
94
84
7189
82
8890
85
92
81
93
91
87
96
86
0
5
10
15
20
0
5
10
15
20
Recruits (#/tow
)
98
69
70
68
019903
02
83
9700
72
9580
82
8890
85
92
81
93
91
87
96
86
8971
84
94
0
5
10
15
20
0 20 40 60 80Mature female biomass (kg/tow)
0
5
10
15
20
Rec
rui ts
(#/
tow
)
98
69
70
04
68
05
019903
02
83
9700
72
9580
94
82
8890
85
92
81
06
0893
91
87
96
86
89
07
09
71
84
0 20 40 60 800
5
10
15
20
Figure 3. Summary of stock-recruitment relationships for spiny dogfish based on a Ricker stock-recruitment model for three periods. Year labels on data points refer to survey year for both mature females(weight of females > 80cm) and recruits ( Number of dogfish < 36 cm). See Table 3 for additional details.
A. 1968-1972, 1980-1996. SSBmax Estimate =32.989 kg/tow
B. 1968-1972, 1980-2003. SSBmax
Estimate = 45.062 kg/tow
C. 1968-1972, 1980-2009. SSBmax Estimate = 40.588 kg/tow

15
AV
EW
TM
AT
FE
MA
VE
WT
ALL
PU
PS
AVEWTMATFEM
MA
TM
ALF
EM
_N
AVEWTALLPUPS MATMALFEM_N
Fig 4. Scatterplot matrix of relationships between average weight of mature females (AVEWMATFEM), average weight of pups (AVEWTALLPUPS) and ratio of mature males to mature female spiny dogfish (MATMALFEM_N) in the NEFSC spring bottom trawl survey. Lowess smoothes are based on a span (tension) = 0.5.

16
Figure 5. Exploratory regression tree model of stock recruitment that partitions the estimated log ratio of recruits per spawning stock biomass using average weight of mature females, average weight of all pups and the mature male to mature female sex ratio as predictor variables. The model explained 35% of the variance in dependent variable. Highest average recruits per spawning stock biomass occurs when average weight of females exceeds 2.731 kg and average weight of pups exceeds 84 g.
LNRPSSB
Mean=-2.097
SD=1.224
N=35
Mean=-3.431
SD=0.860
N=6
AVEWTMATFEM<2.731
Mean=-1.820
SD=1.108
N=29
Mean=-2.058
SD=1.048
N=22
AVEWTALLPUPS<0.084
Mean=-1.074
SD=1.011
N=7
17
1960 1970 1980 1990 2000 2010YEAR
2.5
3.0
3.5
4.0
4.5
Ave
Wt M
atu
re F
em
ale
s (k
g)
2.5 3.0 3.5 4.0 4.5Ave Wt Mature Females (kg)
-5
-4
-3
-2
-1
0
1
ln(R
ecr
uits
/SS
B)
9702
99
03
98
06
05
09
0807
68
00
69
04
95
01
96
82
83
81
84
87
88
86
85
80
90
91
93
89
72
71
92
94
70
Figure 6. Changes in the average weight (kg) of mature female spiny dogfish (>80 cm) for the period 1968-1972, 1980-2009 (top) and the relationship between average weight and the log of number of recruits per spawner (#/tow) / (kg/tow) for the NEFSC spring bottom trawl survey. Lowess smoothes are based on a span (tension) = 0.5.
18
1960 1970 1980 1990 2000 2010YEAR
0.04
0.05
0.06
0.07
0.08
0.09
0.10
Ave
Wt P
up
s (k
g)
0.04 0.05 0.06 0.07 0.08 0.09 0.10Ave Wt Pups (kg)
-5
-4
-3
-2
-1
0
1
ln(R
ecr
uits
/SS
B)
98
00
03
97
07
05
01
04
99
70
0893
7296
02
06
90
94
8768
81
88
69
83
91
8095
09
89
86
92
71
8284
85
Figure 7. Changes in the average weight (kg) of juvenile spiny dogfish (>36 cm) for the period 1968-1972, 1980-2009 (top) and the relationship between average weight and the log of number of recruits per spawner (#/tow) / (kg/tow) for the NEFSC spring bottom trawl survey. Lowess smoothes are based on a span (tension) = 0.5.

19
1960 1970 1980 1990 2000 2010YEAR
0
5
10
15
20
Ra
tio o
f Ma
ture
Ma
les
to M
atu
re F
em
ale
s
0 5 10 15 20Ratio of Mature Males to Mature Females
-5
-4
-3
-2
-1
0
1
ln(R
ecr
uits
/ SS
B) 71
86
81
82
88
72
70
80 92
9093
91
89
08
84
87
07
98
05
99
03
02
04
01
94
97
85
00
09
68
83
95
96
69
06
Figure 8. Changes in the ratio of numbers of mature male (>60 cm) to mature female (>80 cm) for the period 1968-1972, 1980-2009 (top) and the relationship between sex ratio and the log of number of recruits per spawner (#/tow) / (kg/tow) for the NEFSC spring bottom trawl survey. Lowess smoothes are based on a span (tension) = 0.5.

20
0 20 40 60 800
5
10
15
20
0 20 40 60 800
5
10
15
20
0 20 40 60 800
5
10
15
20
Predicted R vs SSB for 10th (red), 90th (greeen) %ile and maximum (black) ave pup wt
0 20 40 60 80SSB (kg/tow)
0
5
10
15
20
Rec
ruits
(# /
tow
)
98
69
70
04
68
05
019903
02
83
97
00
72
9580
94
82
8890
85
92
81
06
0893
91
87
96
86
89
07
09
71
84
1.01.52.02.53.03.5
SIZE_PUPS
Figure 9. Summary of Ricker stock recruitment relationship fits for Model 19, Table 3 where R=0.005 SSB exp(-0.033 SSB + 59.437 Ave Pup Wt). Symbol size is proportional to average weight of pups. Lowest S-R curve corresponds to predicted recruitment at 10%ile of average pup weight or 0.054 kg. Middle line corresponds to predicted recruitment at 90%ile of pup weight = 0.085 kg. Top line depicts predicted recruitment at the maximum observed pup weight of 0.097 kg (1994).

21
Std Residuals: Robust regression S-R curve with Ave Wt Pups as Covariate
0 10 20 30 40 50 60 70 80SSBWT
-2
-1
0
1
2
3
4
5
Sta
n dar
dize
d R
esid
ual
1.01.52.02.53.03.5
SIZE_PUPS
Figure 10. Comparison of observed (circle) vs predicted (X) recruitments by year (top) for Model 19 (Table 3) and standardized residuals vs SSB weight (bottom). Symbol size is proportional to average weight of pups. Nonparametric kernel of the residuals suggest a slightly skewed normal distribution.
0 10 20 30 40 50 60 70 80Female SSB (kg/tow)
0
5
10
15
20
Rec
ruits
(#/
tow
)
98
69
70
04
68
05
019903
02
83
97
00
72
9580
94
82
8890
85
92
81
06
0893
91
87
96
86
89
07
09
71
8498
69
7004
68
05 0199
03
02
83
9700
72
9580
94
82
88
90
85
92
81
060893
91
87
96
8689
07
09
7184
ESTIMATEOBSTOTPUPS
1.01.52.02.53.03.5
SIZE_PUPS

22
0 10 20 30 40 50 60 70 80Female Spawning Stock Biomass (kg/tow)
0
5
10
15
20
Rec
ruits
(#/
t ow
)
98
69
70
04
68
05
019903
02
83
97
00
72
9580
94
82
8890
85
92
81
06
0893
91
87
96
86
89
07
09
71
84
Figure 11. Comparison of lowess smooth of stock recruitment data with the derived estimate of female spawning stock biomass from model 19, Table 3. Vertical dashed line is estimate of SSBmax =30.3 kg/tow. Lowess smooth is based on a span (tension) = 0.5.

23
0 20 40 60 80Female Spawning Stock Biomass (kg/tow)
0.040
0.055
0.070
0.085
0.100
Ave
rage
Wt
of P
ups
(kg)
3
5
7
9
11
13
15
0 20 40 60 800.040
0.055
0.070
0.085
0.100
98
69
70
04
68
050199
03
02
83
97
00
72
9580
94
82
88
9085
92
81
06
0893
91
87
96
8689
07
09
71
84
Figure 12. Alternative depiction of stock recruitment relationship for spiny dogfish (Model 19, Table 3). Dashed vertical align represents estimate of SSBmax. Curved contour lines represent predicted recruitment. Each data point is labeled by year with the size of the dot proportional to the standardized residual of the model fit. Open circles are negative residuals; filled circles are positive residuals. Note the small residuals when female SSB is less than 25 kg/tow and average pup weight is less than 0.06 kg.

24
1960 1970 1980 1990 2000 2010Year
0.0
0.5
1.0
1.5
2.0
Pre
dic
ted
Slo
pe
of S
R a
t Ori
gin
1960 1970 1980 1990 2000 2010YEAR
0
5
10
15
20
Est
ima
t ed
Re
cru
itme
nt (
#/to
w)
ba
sed
on
Mo
de
l 13
Figure 13. Year specific predictions of slope at the origin and predicted numbers of pups. This is based on estimated model alpha adjusted for average weight of pups in each year. See Model 19 in Table 3. The slope at the origin is equal to 0.005 * exp(59.437 * Ave Pup Wt in year t). Lowess smoothes are based on a span (tension) = 0.5.
25
F1: Female Catch vs exploitable biomass: 2008
0
5
10
15
20
25
30
35
40
45
50
0 0.02 0.04 0.06 0.08 0.1 0.12 0.14 0.16 0.18 0.2
Fishing Mortality
Fre
qu
ency
(m
illio
ns)
0
0.1
0.2
0.3
0.4
0.5
0.6
0.7
0.8
0.9
1
Cu
mu
lati
ve F
ract
ion
F1: Catch on exploitablebiomass
Cdf CatchFem/ExplBiom Fem
Cumulative distribution of F in 2008 for Spiny Dogfish
0
0.1
0.2
0.3
0.4
0.5
0.6
0.7
0.8
0.9
1
0 0.02 0.04 0.06 0.08 0.1 0.12 0.14 0.16 0.18 0.2
Fishing Mortality
Cu
mu
lati
ve F
ract
ion
Cdf CatchFem/ExplBiom Fem
Cdf CatchMal/ExplBiom Mal
Cdf Total Catch/Total Biom
Cdf Landings Fem/SSB fem
Cdf Landings Mal/Total MalBiom
Figure 14. Estimated sampling distributions of stochastic estimates of fishing mortality rates on spiny dogfish based on catches (landing plus dead discards) in calendar year 2008.
26
Stochastic Estimate of F on exploitable Female Biomass
1985 1990 1995 2000 2005 2010YEAR
0.0
0.1
0.2
0.3
0.4
0.5
0.6
Fis
hing
Mor
talit
y
Figure 15. Box plots of estimated fishing mortality rates on exploitable female biomass (mt) based on stochastic estimation model. Center line of box represents median; upper and lower bounds represent interquartile range. Year on X-axis identifies the calendar year of the catch. Dashed lines represent the target and threshold fishing mortality rates associated with the selectivity pattern estimated in 2008.

27
Stochastic Estimate of Female Spawning Stock Biomass
1985 1990 1995 2000 2005 2010Last Yr of 3 yr Moving Ave
0
100000
200000
300000
400000
500000
Fem
ale
Spa
wni
ng
Bio
ma s
s (
mt)
Figure 16. Box plots of estimated female spawning stock biomass (mt) based on stochastic estimation model (mt). Horizontal dashed lines represent female SSB target of 159,288 mt and threshold of 79,644 mt based on Ricker Stock-Recruitment model (Model 19, Table 3). Center line of box represents median; upper and lower bounds represent interquartile range. Year on X-axis identifies the last year of a 3-year moving average, e.g., 2009 is last year of 2007-2009. Threshold biomass target is assumed to be ½ target biomass.
28
Stochastic Estimate of Spawning Stock Biomass with nominal target and threshold biomasses, 2008
0
2500000
5000000
7500000
10000000
12500000
15000000
17500000
20000000
22500000
25000000
0 50 100 150 200 250 300 350
SSB females (000 mt)
Fre
qu
ency
0
0.1
0.2
0.3
0.4
0.5
0.6
0.7
0.8
0.9
1
CD
F S
SB
SSB
CDF SSB fem
SSB Target
SSB Threshold
Stochastic Estimates of Swept Area Biomass, 2008
0
0.1
0.2
0.3
0.4
0.5
0.6
0.7
0.8
0.9
1
0 200 400 600 800 1000
Biomass (000 mt)
Cu
mu
lati
ve F
ract
ion
CDF ExplB
CDF ExplB_fem
CDF ExplB_mal
CDF Btot
CDF SSB fem
Figure 17. Sampling distribution of female spawning stock biomass (top) and cumulative distribution functions for exploitable male and female spiny dogfish for the 2006-2008 survey period. Female SSB target is defined by Model 19, Table 3 based on a survey footprint of 0.0119 nm2. Using this biomass reference point, the stock would be considered rebuilt in 2008.

29
Stochastic Estimate of Spawning Stock Biomass with nominal target and threshold biomasses, 2009
0
2500000
5000000
7500000
10000000
12500000
15000000
17500000
20000000
22500000
25000000
0 50 100 150 200 250 300 350
SSB females (000 mt)
Fre
qu
ency
0
0.1
0.2
0.3
0.4
0.5
0.6
0.7
0.8
0.9
1
CD
F S
SB
SSB
CDF SSB fem
SSB Target
SSB Threshold
Stochastic Estimates of Swept Area Biomass, 2009
0
0.1
0.2
0.3
0.4
0.5
0.6
0.7
0.8
0.9
1
0 200 400 600 800 1000
Biomass (000 mt)
Cu
mu
lati
ve F
ract
ion
CDF ExplB
CDF ExplB_fem
CDF ExplB_mal
CDF Btot
CDF SSB fem
Figure 18. Sampling distribution of female spawning stock biomass (top) and cumulative distribution functions for exploitable male and female spiny dogfish for the 2007-2009 survey period. Female SSB target is defined by Model 19, Table 3 based on a survey footprint of 0.0119 nm2. Using this biomass reference point, the stock would be considered rebuilt in 2009, i.e. greater than 50% chance of exceeding the biomass reference point.

30
Table 1. Biomass estimates for spiny dogfish (thousands of metric tons) based on area swept by NEFSC trawl surveys, 1968-2009 . Estimates for 1968-2008 are based on nominal survey trawl footprint of 0.01 nm2 for the R/V Albatross. Estimates for 2009 are based on FSV Bigelow survey adjusted to an R/V Albatross equivalent by the calibration coefficient of 1.1468. A simple 3-yr moving average is used to estimate female SSB. Year Lengths >= 80 cm Lengths 36 to 79 cm Length <= 35 cm All Lengths
Females Males Total Females Males Total Females Males Total1968 41.4 110.4 1.52 153.31969 27.4 69.3 0.66 97.31970 36.7 33.0 3.19 72.91971 103.8 27.6 2.76 134.21972 126.6 145.9 1.55 274.11973 178.7 165.3 2.58 346.51974 221.9 179.6 2.66 404.11975 105.1 125.0 3.97 234.01976 96.3 120.8 1.20 218.31977 77.3 68.0 0.53 145.91978 87.4 131.2 1.24 219.81979 52.3 18.6 1.82 72.71980 104.7 15.3 168.1 16.8 72.2 123.5 0.32 0.39 0.84 292.4 104.71981 266.5 24.4 293.8 25.5 75.1 100.6 2.14 2.80 5.06 399.5 185.61982 454.0 34.6 488.6 61.6 143.3 204.9 0.48 0.69 1.17 694.6 275.11983 77.7 30.1 107.8 36.7 98.5 135.3 3.09 3.95 7.03 250.1 266.11984 115.6 27.5 143.1 33.4 88.0 121.4 0.14 0.21 0.35 264.9 215.81985 317.0 125.5 442.6 102.5 502.5 605.0 4.01 5.10 9.10 1056.7 170.11986 191.3 3.5 194.8 51.9 29.6 81.5 0.84 1.11 1.96 278.2 208.01987 219.1 90.5 309.6 61.5 171.7 233.1 2.46 4.76 7.22 550.0 242.51988 433.1 26.2 459.4 93.3 153.6 247.0 0.89 1.09 1.98 708.4 281.21989 162.1 40.5 202.6 100.4 158.2 258.6 1.14 1.54 2.68 463.9 271.51990 400.3 70.7 471.0 163.5 303.1 466.6 0.68 1.03 1.71 939.3 331.81991 220.4 30.0 250.3 108.4 186.3 294.7 0.98 1.43 2.41 547.4 260.91992 280.5 41.9 322.4 179.9 231.9 411.8 0.73 1.00 1.73 735.9 300.41993 234.6 27.8 262.5 104.1 198.5 302.6 0.55 0.65 1.21 566.3 245.21994 105.3 37.1 142.4 108.3 254.2 362.5 4.28 5.54 9.82 514.8 206.81995 102.4 29.5 131.9 154.0 174.5 328.5 0.25 0.35 0.59 460.9 147.51996 196.5 33.4 229.9 201.7 334.8 536.4 0.98 1.14 2.12 768.5 134.71997 83.7 17.5 101.2 205.2 209.1 414.3 0.05 0.05 0.10 515.5 127.51998 26.7 22.9 49.7 69.0 236.4 305.4 0.05 0.08 0.13 355.2 102.31999 62.7 20.4 83.1 140.8 256.4 397.2 0.02 0.03 0.05 480.4 57.72000 85.8 11.7 97.5 91.5 166.2 257.7 0.07 0.09 0.16 355.4 58.42001 56.7 16.7 73.4 71.4 160.5 231.9 0.04 0.03 0.07 305.4 68.42002 75.2 19.0 94.2 131.5 246.3 377.8 0.06 0.06 0.12 472.1 72.52003 64.5 22.5 87.1 125.5 256.3 381.8 0.13 0.14 0.27 469.1 65.52004 40.4 10.0 50.3 46.9 126.2 173.1 0.66 0.91 1.56 225.0 60.02005 55.8 30.8 86.6 59.8 294.7 354.5 0.28 0.42 0.69 441.9 53.62006 253.4 29.0 282.5 141.6 406.5 548.1 0.10 0.17 0.27 830.8 116.62007 158.0 18.9 176.9 73.6 227.6 301.1 0.23 0.32 0.56 478.6 155.82008 241.7 29.6 271.4 91.2 293.7 385.0 0.47 0.59 1.05 657.4 217.7
2009* 148.3 21.9 170.2 54.9 326.1 381.0 2.95 3.76 6.71 557.9 182.7
Notes: Total equals sum of males and females plus unsexed dogfish. Data for dogfish prior to 1980 are currently not available by sex.
Data 2009 have been adjusted to AL IV equivalents using preliminary HB Bigelow calibration coefficients.
3-pt average
Fem SSB

31
Table 2. Summary of input data for stock-recruitment analyses. Survey data are from NEFSC Spring Bottom Trawl Surveys, 1968-1972, 1980-2009. Sex data on spiny dogfish from 1973-1979 are not available.
Year
Female SSB
(kg/tow)
Total Recruits (#/tow)
AveWt Mature
Females (kg)
Ave Wt Pups (<36 cm) in kg
Mature Male to Mature Female
Sex Ratio ln(R/SSB) R/SSB SSB/R
3 yr Moving
average of female
SSB (kg)1968 6.373 2.793 2.783 0.086 4.245227 -0.825 0.438 2.2821969 4.595 1.235 2.788 0.084 3.708974 -1.314 0.269 3.7211970 6.157 8.172 2.974 0.061 1.299573 0.283 1.327 0.753 5.7091971 17.931 5.906 3.104 0.074 0.340913 -1.111 0.329 3.036 9.5611972 13.513 1.971 3.185 0.063 1.076171 -1.925 0.146 6.8571980 16.159 1.356 3.810 0.082 1.920072 -2.478 0.084 11.9151981 41.252 8.853 4.026 0.086 0.884929 -1.539 0.215 4.6601982 70.094 2.459 4.178 0.073 1.032874 -3.350 0.035 28.506 42.5021983 11.998 12.990 4.042 0.084 4.236328 0.079 1.083 0.924 41.1151984 17.844 0.744 3.941 0.072 2.633139 -3.178 0.042 23.991 33.3121985 48.946 19.799 3.840 0.071 5.158537 -0.905 0.405 2.472 26.2631986 29.528 3.982 3.843 0.076 0.34122 -2.004 0.135 7.415 32.1061987 34.130 12.942 3.900 0.087 2.877858 -0.970 0.379 2.637 37.5351988 67.571 3.671 3.890 0.084 1.03694 -2.913 0.054 18.408 43.7431989 25.586 5.482 3.220 0.077 2.49234 -1.541 0.214 4.667 42.4291990 62.511 3.841 3.436 0.070 2.242335 -2.790 0.061 16.275 51.8891991 34.319 4.548 3.433 0.082 2.288966 -2.021 0.133 7.546 40.8061992 44.407 3.663 3.038 0.075 2.046817 -2.495 0.082 12.124 47.0791993 36.678 3.060 3.328 0.062 2.26248 -2.484 0.083 11.985 38.4681994 16.448 15.840 3.011 0.097 5.455118 -0.038 0.963 1.038 32.5111995 15.953 1.151 2.807 0.080 3.914834 -2.629 0.072 13.857 23.0261996 30.603 5.276 2.937 0.063 3.772397 -1.758 0.172 5.800 21.0011997 13.088 0.281 2.603 0.054 5.360178 -3.843 0.021 46.644 19.8811998 4.164 0.454 2.706 0.044 19.55955 -2.216 0.109 9.169 15.9521999 9.978 0.143 2.621 0.056 8.869291 -4.242 0.014 69.576 9.0772000 13.364 0.479 2.785 0.051 4.427263 -3.328 0.036 27.873 9.1682001 8.825 0.208 2.870 0.056 6.510849 -3.747 0.024 42.397 10.7222002 11.709 0.297 2.613 0.064 6.972351 -3.674 0.025 39.427 11.2992003 10.052 0.825 2.646 0.052 8.307197 -2.500 0.082 12.186 10.1952004 6.288 4.346 2.802 0.056 6.896326 -0.370 0.691 1.447 9.3502005 8.698 1.951 2.731 0.055 11.49529 -1.495 0.224 4.459 8.3462006 39.472 0.645 2.728 0.065 3.397613 -4.113 0.016 61.160 18.1532007 24.610 1.597 2.761 0.054 3.051354 -2.735 0.065 15.406 24.2602008 37.648 2.670 2.752 0.061 2.57258 -2.646 0.071 14.102 33.9102009 23.122 13.106 2.744 0.080 4.382755 -0.568 0.567 1.764 28.460
Statistic
Female SSB
(kg/tow)
Total Recruits (#/tow)
AveWt Mature
Females (kg)
Ave Wt Pups (<36 cm) in kg
Mature Male to Mature Female
Sex Ratio ln(R/SSB) R/SSB SSB/R
3 yr Moving
average of female
SSB (kg)Average 24.675 4.478 3.168 0.070 4.202 -2.097 0.248 15.328 25.928Std Dev 18.120 4.946 0.512 0.013 3.695 1.224 0.320 17.366 14.003ave '07-09 28.460 5.791 2.753 0.065 3.336 -1.983 0.234 10.424min 4.164 0.143 2.603 0.044 0.341 -4.242 0.014 0.753 5.709max 70.094 19.799 4.178 0.097 19.560 0.283 1.327 69.576 51.889median 17.844 2.793 2.974 0.071 3.398 -2.216 0.109 9.169 25.26225%ile 10.880 0.988 2.757 0.059 2.145 -2.851 0.058 3.379 10.86775%ile 35.499 5.379 3.623 0.081 5.259 -1.212 0.299 17.341 38.23590%ile 47.131 12.971 3.925 0.085 7.773 -0.449 0.641 41.209 42.62610%ile 6.322 0.360 2.670 0.054 1.035 -3.718 0.024 1.574 9.159
32
Table 3. Summary of model building exercise for stock-recruitment relationship in spiny dogfish. Response variable is observed total number of pups per tow in year t. Dependent variables include total weight (kg) per tow of mature female dogfish (>80 cm), average weight of pups (kg/tow) (individuals <36 cm TL), average weight (kg) of mature females (>80 cm), and mature male to mature female sex ratio. All variables are based on NEFSC spring bottom trawl survey, 1968-1972, 1980-2009.
Estimation Method
Model ID Model Description
Ave Wt of Mature
Females
Ave Wt of Pups (<36
cm)
Mat Male to Mat
Female Ratio by number
Negative Log
Likelihood AICSSB_max (kg/tow)
Lower 2.5% CI
Upper 97.5% CI
Length of Conficence
Interval
Swept Area Equivalent (mt) using 0.01 nm^2 NOMINAL
Swept Area
Equivalent (mt) using
0.0112 nm^2
Swept Area
Equivalent (mt) using
0.0119 nm^2
1 Base Model 1 (1968-72, 1980-1996) 66.55 139.11 32.989 -33.144 99.122 132.266 206,082 184,002 173,178 2 Base Model 2 (1968-72, 1980-2003) 85.75 177.49 45.062 -49.505 139.629 189.134 281,502 251,341 236,557 3 Base Model 3 (1968-72, 1980-2009) 103.40 212.79 40.588 -40.749 121.926 162.675 253,553 226,387 213,070
4 Full Model (1968-72, 1980-2009) 91.66 195.32 47.936 -48.12 143.992 192.112 299,456 267,372 251,644
Two Factor Models5 Base Model 3 + Mat Fem + Pup Wt 96.78 203.57 31.035 -14.543 76.613 91.156 193,876 173,103 162,921 6 Base Model 3 + Mat Fem + Sex Ratio 99.53 209.05 36.593 -19.272 92.458 111.73 228,596 204,104 192,098 7 Base Model 3 + Pup Wt + Sex Ratio 93.70 197.41 67.543 -126.485 261.571 388.056 421,941 376,733 354,572
8 Base Model 3 + Mat Fem 101.47 210.94 30.768 13.309 74.844 61.535 192,208 171,614 161,519 9 Base Model 3 + Pup Wt 96.86 201.71 32.913 -10.267 76.094 86.361 205,608 183,578 172,779
10 Base Model 3 + Sex Ratio 103.14 214.28 50.809 -102.648 204.266 306.914 317,404 283,396 266,726
SSE approx AIC11 Base Model 1 (1968-72, 1980-1996) 554.866 102.72 31.413 4.213 58.612 54.399 196,237 175,212 164,905 12 Base Model 2 (1968-72, 1980-2003) 638.677 107.64 44.845 -2.387 92.076 94.463 280,147 250,131 235,417 13 Base Model 3 (1968-72, 1980-2009) 768.47 114.12 39.881 1.038 78.724 77.686 249,137 222,443 209,358
14 Full Model (1968-72, 1980-2009) did not converge
Two Factor Models15 Base Model 3 + Mat Fem + Pup Wt 532.17 105.26 28.098 8.103 48.093 39.99 175,528 156,722 147,503 16 Base Model 3 + Mat Fem + Sex Ratio 616.70 110.42 33.396 10.221 56.572 46.351 208,625 186,272 175,315 17 Base Model 3 + Pup Wt + Sex Ratio did not converge
18 Base Model 3 + Mat Fem 692.88 112.49 28.29 8.71 47.871 39.161 176,728 157,793 148,511 19 Base Model 3 + Pup Wt 536.91 103.57 30.343 10.98 49.706 38.726 189,553 169,244 159,288 20 Base Model 3 + Sex Ratio 765.72 115.99 41.197 -6.62 89.015 95.635 257,358 229,784 216,267
21
Base Model 3 + Pup Wt {T df=20} 703.16 113.01 27.958 7.588 48.628 41.04 174,654 155,941 146,768 22 Base Model 3 + Pup Wt {T df=10} 723.50 114.01 28.662 4.588 52.737 48.149 179,052 159,867 150,463 23 Base Model 3 + Pup Wt {T df=5} 557.867 104.91 31.339 8.36 54.319 45.959 195,775 174,799 164,517
Robust with
variable T df
Asymptotic Confidence Interval (kg/tow)Additional Model Factors
Maximum Likelihood
Robust Non linear
Least Squares with T
function, df=30

33
Table 4. Summary of simple Monte Carlo experiment to estimate the variation and bias induced in estimate of SSBmax when errors in variables are introduced into SSB and R. Both SSB and R were assumed to have lognormal distributions. Results are based on 500 simulations. The true underlying estimate of SSBmax was 32.913 kg in all simulations.
Measurement Error
Assumption
Input Coefficient of Variation in
SSB and R Mean
Standard Deviation of
MeanCV of
SSBmax Est
Percent Bias from True value
0.01 32.96 0.36 0.01 0.10.1 37.94 5.38 0.14 15.30.15 44.96 12.55 0.28 36.60.2 55.16 22.35 0.41 67.60.25 70.86 43.72 0.62 115.30.3 88.73 62.99 0.71 169.6
0.01 33.00 0.42 0.01 0.30.1 41.44 6.58 0.16 25.90.15 52.73 14.66 0.28 60.20.2 69.97 31.10 0.44 112.60.25 94.82 63.77 0.67 188.10.3 119.55 100.09 0.84 263.2
Uncorrelated. Variation in SSB
and R is independent
Correlation =100%.
Deviations in SSB and R are
perfectly correlated.
Estimates of SSBmax based on 500 simulations

34
Table 5. Summary of estimated landings of US, Canadian and foreign commercial fisheries by sex. Table 1. Summary of estimated landings of US, Canadian and foreign commercial fisheries by sex. US recreational landings included. Port samples from NMFS and MADMF were pooled.
Estimated total weights based on summation of estimated weights from sampled length frequency distributions. Estimated weights computed from length-weight regressions.Females W =exp(-15.025)*L ^3.606935, Males W=exp(-13.002)*L^3.097787 with weight in kg, length in cm. "Samples"= number of measured dogfish.
year
Total Samples
MalesEst Tot Wt (kg) Males
Ave Wt (kg)
Males
Total Samples (females)
EstTot Wt (kg)
females
Est Avg Wt (kg) females
Fraction Females by
weight
US Commercial
+ Recreational
Landings (mt)
Canada and Foreign
Landings (mt)
Total Landings (mt)
Est Landings
(mt) of Males
Est. Landings
(mt) of females
Number of Males
Landed (000)
Number of Females Landed (000)
Total Numbers Landed (000)
1982 24 52.0 2.167 680 3015.7 4.435 0.9830 5481 753 6234 106 6128 49 1382 14311983 610 2513.9 4.121 1.0000 4964 464 5428 0 5428 0 1317 13171984 9 15.8 1.760 1478 6448.9 4.363 0.9976 4542 393 4935 12 4923 7 1128 11351985 21 35.2 1.678 1657 6799.2 4.103 0.9948 4117 1025 5142 27 5116 16 1247 12631986 64 104.1 1.626 1152 4666.0 4.050 0.9782 2930 388 3318 72 3246 45 801 8461987 31 52.7 1.700 1999 7542.1 3.773 0.9931 3009 420 3429 24 3406 14 903 9171988 7 14.8 2.114 1764 7560.7 4.286 0.9980 3464 648 4112 8 4104 4 957 9611989 35 67.5 1.927 1375 5528.0 4.020 0.9879 4910 423 5333 64 5269 33 1311 13441990 19 33.7 1.772 2228 8898.3 3.994 0.9962 14909 1702 16611 63 16548 35 4143 41791991 148 379.1 2.562 1518 5923.9 3.902 0.9399 13307 541 13848 833 13016 325 3335 36601992 12 22.3 1.861 3187 12180.6 3.822 0.9982 17073 935 18008 33 17975 18 4703 47211993 42 78.4 1.866 2773 9927.5 3.580 0.9922 20763 1462 22225 174 22051 93 6159 62531994 47 86.6 1.843 2091 6618.8 3.165 0.9871 18952 1822 20774 268 20506 146 6478 66241995 25 38.9 1.555 2266 6676.6 2.946 0.9942 22645 970 23615 137 23479 88 7969 80561996 569 886.7 1.558 1644 4397.6 2.675 0.8322 27160 667 27827 4669 23158 2996 8657 116541997 303 449.1 1.482 382 780.9 2.044 0.6349 18418 660 19078 6966 12112 4700 5925 106251998 68 85.4 1.257 683 1434.5 2.100 0.9438 20667 1662 22329 1255 21073 999 10034 110331999 93 130.3 1.401 311 625.5 2.011 0.8276 14907 2645 17552 3026 14527 2160 7223 93822000 405 561.2 1.386 5144 12168.1 2.365 0.9559 9262 3143 12405 547 11858 395 5013 54072001 12 17.1 1.422 215 456.5 2.123 0.9640 2322 4497 6819 246 6573 173 3096 32692002 65 97.6 1.501 1893 5065.7 2.676 0.9811 2404 4058 6462 122 6340 81 2369 24502003 34 48.3 1.421 966 2338.4 2.421 0.9798 1210 1945 3155 64 3091 45 1277 13222004 15 23.9 1.593 1180 3296.9 2.794 0.9928 1086 2692 3778 27 3751 17 1343 13602005 745 1018.7 1.367 2065 5196.0 2.516 0.8361 1192 2600 3792 622 3171 455 1260 17152006 646 924.4 1.431 4211 10382.9 2.466 0.9182 2343 2439 4782 391 4391 273 1781 20542007 507 720.7 1.421 2863 7514.8 2.625 0.9125 3587 2384 5971 523 5449 368 2076 24442008 236 342.0 1.449 2925 7973.8 2.726 0.9589 4322 1572 5894 242 5652 167 2073 2240
formula A B C=B/A D E F=E/D G=E/(E+B) H I J=H+I K=(1-G)*J L=G*J M=K/C N=L/F O=M+N
Composite (NMFS and MADMF) Biological Samples from Ports Commercial Landings Prorated Landings By Sex
35
Table 6. Summary of estimated dead discards of US commercial fishery by sex.
Table 2. Summary of estimated dead Discards of US commercial fisheries by sex. Port samples from NMFS and MADMF were pooled. Estimated total weights based on summation of estimated weights from sampled length frequency distributions. Estimated weights computed from length-weight regressions.Females W =exp(-15.025)*L ^3.606935, Males W=exp(-13.002)*L^3.097787 with weight in kg, length in cm. "Samples"= number of measured dogfish.
year
Total Samples
MalesEst Tot Wt (kg) Males
Ave Wt (kg)
Males
Total Samples (females)
EstTot Wt (kg)
females
Est Avg Wt (kg) females
Fraction Females by
weightTotal
LandingsTotal
Discards
Total Dead
Discards (mt)
Est Discards (mt) of Males
Est.Discards (mt) of females
Number of MalesDisc
arded (000)
Number of Females
Discarded (000)
Total Numbers Discarded (000)
1989 5333 34990 160201990 16611 41474 191741991 372 461 1.240 891 2349 2.636 0.836 13848 31831 13274 2179 11095 1757 4209 59661992 446 503 1.129 630 1089 1.729 0.684 18008 41066 18983 6001 12982 5317 7510 128271993 57 62 1.087 130 414 3.184 0.870 22225 28461 11969 1559 10410 1434 3270 47041994 204 206 1.010 742 1395 1.881 0.871 20774 18486 8556 1101 7455 1090 3964 50541995 2152 2331 1.083 2290 3038 1.327 0.566 23615 24760 10932 4747 6185 4382 4663 90441996 1400 1810 1.293 1185 2002 1.689 0.525 27827 13742 6025 2861 3164 2213 1873 40861997 1170 1353 1.157 1265 2044 1.616 0.602 19078 10065 4366 1739 2627 1504 1626 31291998 1231 1302 1.058 1372 1920 1.400 0.596 22329 7963 3435 1388 2047 1312 1463 27751999 370 426 1.151 800 1797 2.246 0.808 17552 10263 4581 878 3703 762 1649 24112000 390 562 1.441 1351 3171 2.347 0.849 12405 8111 2917 439 2478 305 1056 13602001 633 839 1.326 2973 7359 2.475 0.898 6819 14252 5063 518 4544 391 1836 22272002 1288 1818 1.411 5874 13897 2.366 0.884 6462 16283 5049 584 4465 414 1887 23012003 4596 5349 1.164 12675 27190 2.145 0.836 3155 12358 4225 695 3531 597 1646 22432004 10735 14456 1.347 28266 64731 2.290 0.817 3778 16370 6146 1122 5024 833 2194 30272005 7051 9360 1.327 12378 28483 2.301 0.753 3792 15552 5589 1382 4207 1041 1828 28702006 4101 5395 1.316 6115 14487 2.369 0.729 4782 15126 5688 1544 4145 1173 1750 29232007 3893 5169 1.328 9738 24600 2.526 0.826 5971 17681 6510 1130 5380 851 2130 29812008 3039 3959 1.303 6083 14848 2.441 0.789 5894 14080 5088 1071 4017 822 1646 2468
formula A B C=B/A D E F=E/D G=E/(E+B) H I J K=(1-G)*J L=G*J M=K/C N=L/F O=M+N
Composite (NMFS and MADMF) Biological Samples from Observers Landings and Discards (mt) Prorated Dead Discards By Sex

36
Table 7. Summary of fishing mortality rates expressed as the full F on the exploitable biomass of female and male spiny dogfish. Year represents the year of the catch (landings plus dead discards).
Year
F1: Female Catch on
exploitable female
biomass
F2: Male Catch on
exploitable male
biomass1990 0.088 0.0441991 0.082 0.0261992 0.177 0.0401993 0.327 0.0211994 0.465 0.0181995 0.418 0.0141996 0.355 0.0311997 0.234 0.0381998 0.306 0.0251999 0.289 0.0432000 0.152 0.0072001 0.109 0.0052002 0.165 0.0032003 0.168 0.0042004 0.474 0.0082005 0.128 0.0072006 0.088 0.0122007 0.090 0.0052008 0.110 0.004
37
Table 8. Summary of swept area biomass estimates (mt) based on stochastic population estimator. Exploitable biomasses are based on year-specific selectivity functions based on 3 year moving averages. Female spawning stock biomass is base on sum of female spiny dogfish above 80 cm TL. The target spawning stock biomass based on Model 19 is 30.343 kg/tow or 159,288 mt (using the 0.0119 nm2 trawl footprint).
Terminal Year Mid Year
Total Exploitable Biomass
Exploitable Female Biomass
Exploitable Male
Biomass Tot Biomass
Female Spawning
Stock Biomass
1991 1990 570,113 339,405 230,208 582,274 234,229 1992 1991 532,641 278,419 253,722 664,850 269,624 1993 1992 379,501 169,227 209,773 553,731 220,002 1994 1993 322,345 93,716 228,128 544,415 186,132 1995 1994 261,387 55,102 205,785 460,932 133,264 1996 1995 329,048 77,600 250,948 519,920 120,664 1997 1996 316,075 81,413 234,162 520,782 114,091 1998 1997 319,828 69,005 250,323 489,233 91,458 1999 1998 185,468 77,142 107,825 406,287 51,821 2000 1999 167,483 66,023 100,960 358,185 52,562 2001 2000 286,458 96,233 189,725 343,602 61,552 2002 2001 291,695 107,026 184,169 337,686 64,844 2003 2002 278,283 63,794 213,989 371,200 58,376 2004 2003 241,697 39,745 201,452 347,176 53,625 2005 2004 237,536 17,432 219,604 338,170 47,719 2006 2005 327,077 54,587 271,991 453,881 106,180 2007 2006 233,662 90,651 142,511 524,205 141,351 2008 2007 423,273 123,742 299,031 586,413 194,616 2009 2008 361,040 89,151 271,390 505,116 163,256

38
Appendix 1. Comparison of size composition of commercial catch (landings + Discards) for male and female spiny dogfish with the NEFSC spring survey for 2006-2008. Both catch and survey frequencies represent 3-yr moving averages. Summary of estimated selectivity pattern for male and female spiny dogfish. Selectivity at length L is modeled as sel(L)=1/(1+exp(a + b L)) where sel(F) is the fraction of the spiny dogfish population vulnerable to the commercial fishery (both landings and discards). Size composition of the commercial fishery is based on analyses of port sampling and at-sea observer sampling, 1989-2008. Selectivity blocks are based on a 3-yr moving average, eg. 2006-2008.
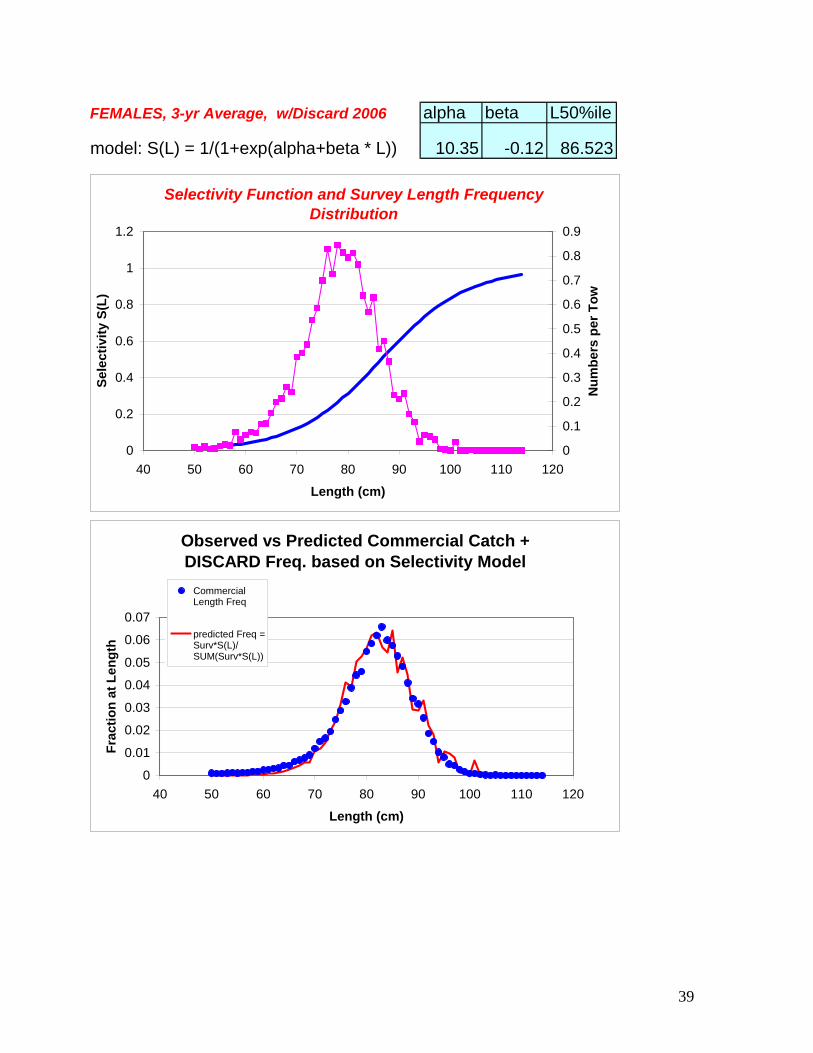
39
FEMALES, 3-yr Average, w/Discard 2006 alpha beta L50%ile
model: S(L) = 1/(1+exp(alpha+beta * L)) 10.35 -0.12 86.523
Selectivity Function and Survey Length Frequency Distribution
0
0.2
0.4
0.6
0.8
1
1.2
40 50 60 70 80 90 100 110 120
Length (cm)
Se
lec
tiv
ity
S(L
)
0
0.1
0.2
0.3
0.4
0.5
0.6
0.7
0.8
0.9
Nu
mb
ers
per
To
w
Observed vs Predicted Commercial Catch + DISCARD Freq. based on Selectivity Model
0
0.01
0.02
0.03
0.04
0.05
0.06
0.07
40 50 60 70 80 90 100 110 120
Length (cm)
Fra
ctio
n a
t L
en
gth
Commercial Length Freq
predicted Freq =Surv*S(L)/SUM(Surv*S(L))

40
Fig Y
FEMALES, 3-yr Average, w/Discard 2007 alpha beta L50%ile
model: S(L) = 1/(1+exp(alpha+beta * L)) 9.722 -0.113 86.169
Selectivity Function and Survey Length Frequency Distribution
0
0.2
0.4
0.6
0.8
1
1.2
40 50 60 70 80 90 100 110 120
Length (cm)
Se
lec
tiv
ity
S(L
)
0
0.2
0.4
0.6
0.8
1
1.2
Nu
mb
ers
per
To
w
Observed vs Predicted Commercial Catch + DISCARD Freq. based on Selectivity Model
0
0.01
0.02
0.03
0.04
0.05
0.06
0.07
0.08
40 50 60 70 80 90 100 110 120
Length (cm)
Fra
cti
on
at
Len
gth
Commercial Length Freq
predicted Freq =Surv*S(L)/SUM(Surv*S(L))
41
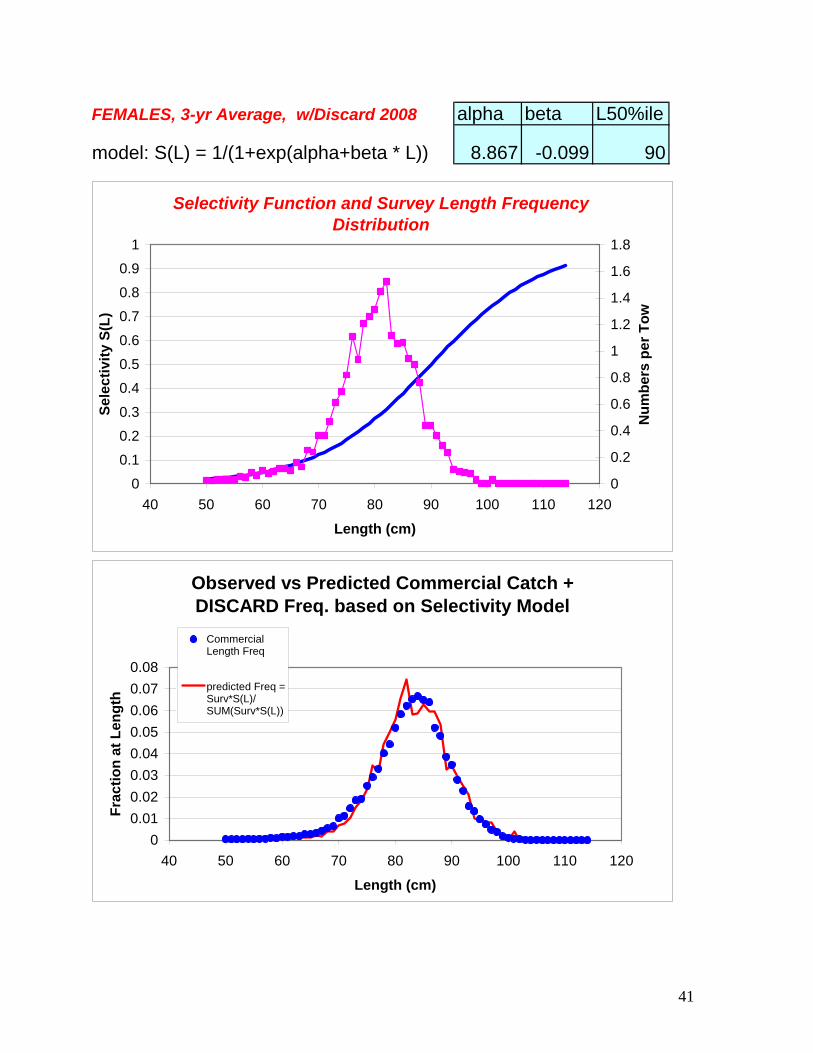
FEMALES, 3-yr Average, w/Discard 2008 alpha beta L50%ile
model: S(L) = 1/(1+exp(alpha+beta * L)) 8.867 -0.099 90
Selectivity Function and Survey Length Frequency Distribution
0
0.1
0.2
0.3
0.4
0.5
0.6
0.7
0.8
0.9
1
40 50 60 70 80 90 100 110 120
Length (cm)
Se
lec
tiv
ity
S(L
)
0
0.2
0.4
0.6
0.8
1
1.2
1.4
1.6
1.8
Nu
mb
ers
pe
r T
ow
Observed vs Predicted Commercial Catch + DISCARD Freq. based on Selectivity Model
0
0.01
0.02
0.03
0.04
0.05
0.06
0.07
0.08
40 50 60 70 80 90 100 110 120
Length (cm)
Fra
cti
on
at
Len
gth
Commercial Length Freq
predicted Freq =Surv*S(L)/SUM(Surv*S(L))
42
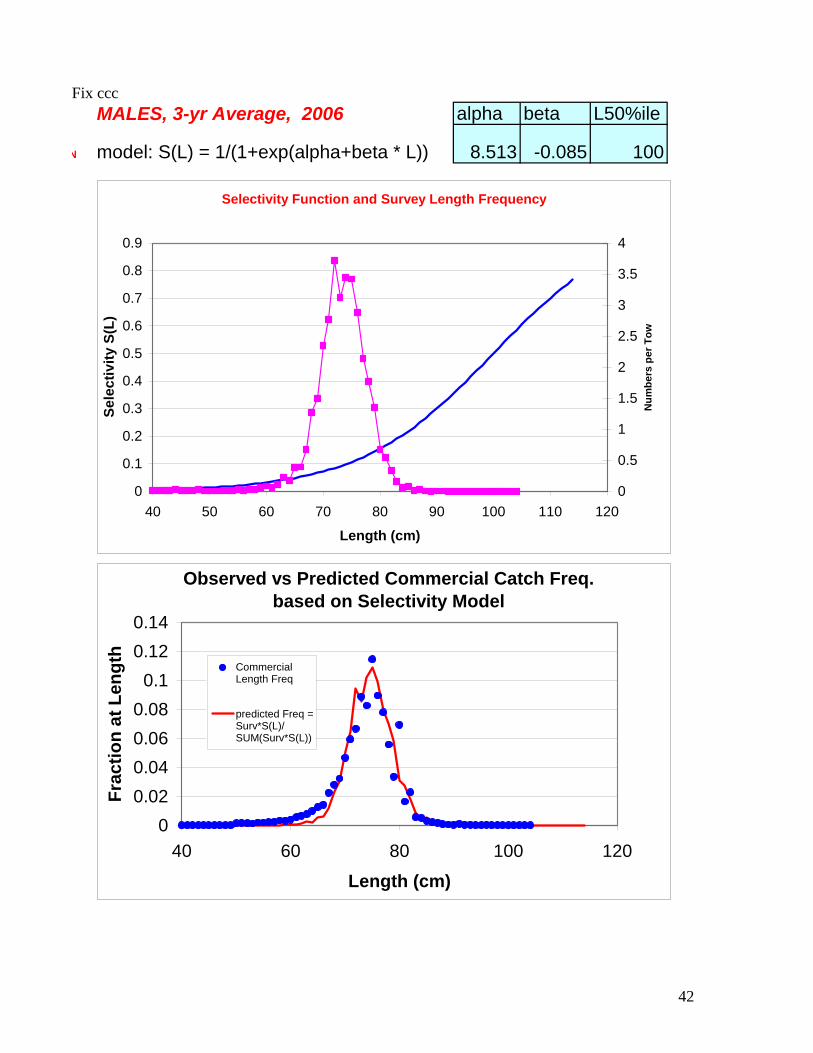
Fix ccc MALES, 3-yr Average, 2006 alpha beta L50%ile
N model: S(L) = 1/(1+exp(alpha+beta * L)) 8.513 -0.085 100
Selectivity Function and Survey Length Frequency
0
0.1
0.2
0.3
0.4
0.5
0.6
0.7
0.8
0.9
40 50 60 70 80 90 100 110 120
Length (cm)
Se
lec
tiv
ity
S(L
)
0
0.5
1
1.5
2
2.5
3
3.5
4
Nu
mb
ers
pe
r T
ow
Observed vs Predicted Commercial Catch Freq. based on Selectivity Model
0
0.02
0.04
0.06
0.08
0.1
0.12
0.14
40 60 80 100 120
Length (cm)
Fra
ctio
n a
t L
eng
th
Commercial Length Freq
predicted Freq =Surv*S(L)/SUM(Surv*S(L))
43
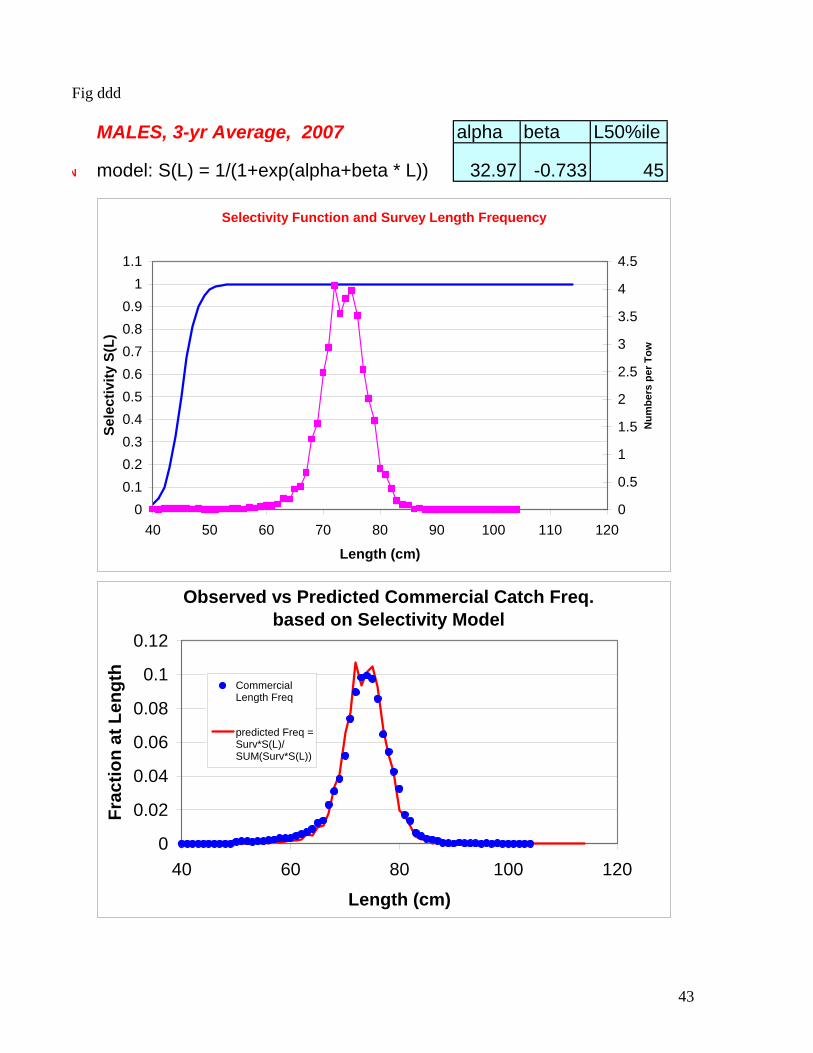
Fig ddd
MALES, 3-yr Average, 2007 alpha beta L50%ile
N model: S(L) = 1/(1+exp(alpha+beta * L)) 32.97 -0.733 45
Selectivity Function and Survey Length Frequency
0
0.1
0.2
0.3
0.4
0.5
0.6
0.7
0.8
0.9
1
1.1
40 50 60 70 80 90 100 110 120
Length (cm)
Se
lec
tiv
ity
S(L
)
0
0.5
1
1.5
2
2.5
3
3.5
4
4.5
Nu
mb
ers
pe
r T
ow
Observed vs Predicted Commercial Catch Freq. based on Selectivity Model
0
0.02
0.04
0.06
0.08
0.1
0.12
40 60 80 100 120
Length (cm)
Fra
ctio
n a
t L
eng
th
Commercial Length Freq
predicted Freq =Surv*S(L)/SUM(Surv*S(L))
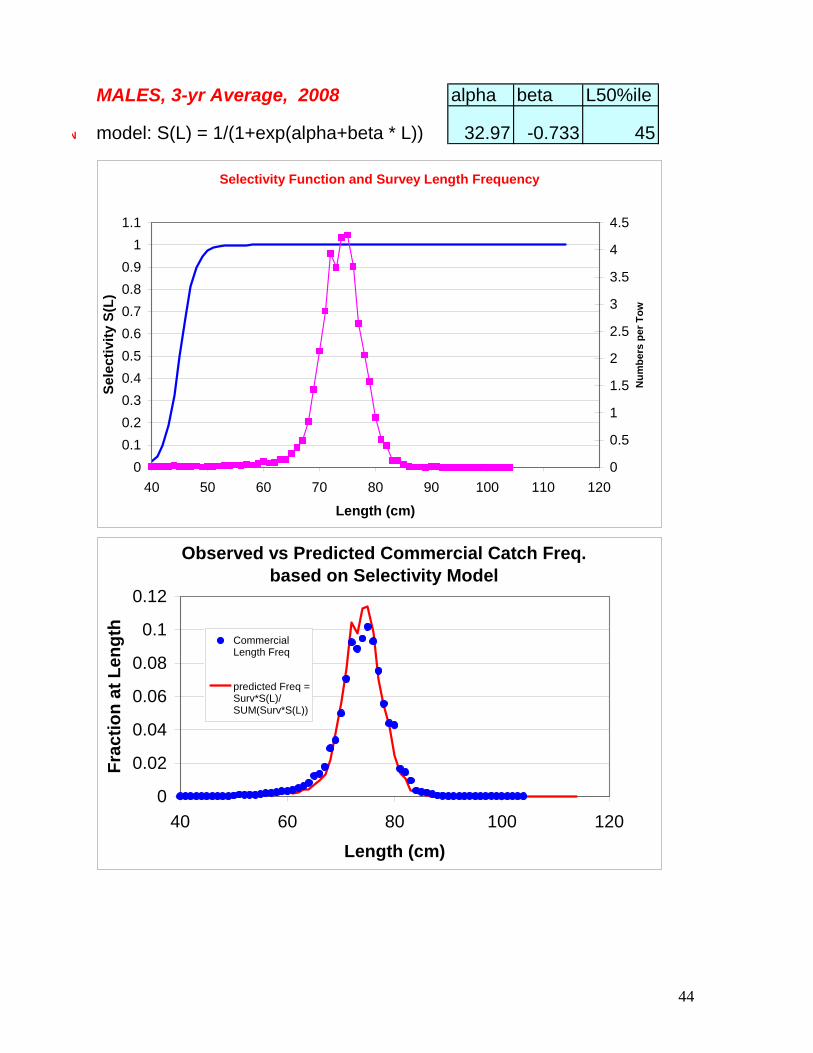
44
MALES, 3-yr Average, 2008 alpha beta L50%ile
N model: S(L) = 1/(1+exp(alpha+beta * L)) 32.97 -0.733 45
Selectivity Function and Survey Length Frequency
0
0.1
0.2
0.3
0.4
0.5
0.6
0.7
0.8
0.9
1
1.1
40 50 60 70 80 90 100 110 120
Length (cm)
Se
lec
tiv
ity
S(L
)
0
0.5
1
1.5
2
2.5
3
3.5
4
4.5
Nu
mb
ers
pe
r T
ow
Observed vs Predicted Commercial Catch Freq. based on Selectivity Model
0
0.02
0.04
0.06
0.08
0.1
0.12
40 60 80 100 120
Length (cm)
Fra
cti
on
at
Le
ng
th
Commercial Length Freq
predicted Freq =Surv*S(L)/SUM(Surv*S(L))

45
Appendix 2---Summary of Reviewer Comments. All comments are unedited. Reviewer comments are in alphabetical order. Reviewer #1: Review of Biological reference points for spiny dogfish 2010, by Rago and Sosebee Review by Maurice Clarke Date: 20th April 2010. I reviewed the paper “Biomass Reference Points for Spiny Dogfish” by Rago and Sosebee. I was not able to participate in the conference call. Based on my reading of the documents, I accept the work as a basis for setting the biomass reference point for this stock. The approach uses a stock recruit function derived from observations of SSB (larger dogfish) and recruits (small dogfish) from the NMFS groundfish survey. The method is not without its difficulties, being based on the NMFS trawl survey observations. The Ricker model seems plausible in this case. It seems reasonable that total female biomass is a measure of spawning potential. The Ricker model fit seems adequate. The raw data do seem to indicate low recruitment at high stock size. Error in the stock recruitment data are due to their coming from trawl survey observations in a given year. The recruits as defined, span several age groups. The recruit data do not match up with the SSB that produced those recruits. In addition recruits are more pelagic in their habits, indicating poorer selection to the survey. Both these factors introduce extra error into the stock recruitment relationship. Is the relationship as modeled sensitive to differing time lags, and smoothers in recruitment vs. stock? This could be explored in future work. Future work could consider other possible stock recruit models too, including segmented regression, where we assume an SSB level at which recruitment impairment takes place, but does not consider density dependency at high stock size. Underlying biases and errors in the trawl survey could be further explored and documented.

46
Reviewer #2 Date: 13 April, 2010 To: Paul Rago and Loretta O’Brien From: Vincent Gallucci Re: Commentary on the 9 April phone telephone review. Dear Paul and Loretta, GENERAL COMMENTS I have reviewed again the material we were sent in preparation for the 9 April 2010 telephone and Webex meeting. I feel that even right after that meeting that there was consensus on the material, viz., that it laid out reasonable analyses of biomass reference points (BRPs) for spiny dogfish and that the model # 19 found in Table 3 was the most appropriate of the models for estimation. My additional reading of this material confirms that opinion. The utility of the document entitled BRPs for Spiny Dogfish is, in my opinion, certainly adequate as a foundation for further analyses. Further, it is a practical document for making management decisions at the present time. Nevertheless, projecting into the future, I recommend that an alternative BRP other than, or supplementing, spawning stock biomass SSB be sought. Choosing an F that maximizes SSB is in my opinion excellent for herring or cod, but insensitive to many of the demographic changes that occur with dogfish sharks. SOME SPECIFIC COMMENTS
1. I think that the new work on estimates of area swept are an improvement from what I recall from the January meeting.
2. The choice of the Ricker model to make these model based estimates is a good step forward. It is biologically logical to include pup weight as a covariate as well as being the most statistically efficient covariate. Considering the average weight of pups as a plausible predictor of recruitment may, however, be a bit too easy. While the literature probably suggests that pup weight is correlated with health of the mother (is size the measure?) and size of the mother correlated with larger offspring, there are alternative interpretations to consider. Maternal size does correlate with number of offspring but there is a tradeoff between size of off spring and number of offspring. The fitness argument likely can go both ways. I am not sure how this connects biologically to be a “plausible predictor of recruitment’. I would like to see a tighter argument than I can construct now.
3. I understand the need for biological reference points in this country. And, I know that spawning stock biomass is an important indicator. However, I think that will be better for herring or cod than dogfish since it will be insensitive to many of the demographic characteristics of dogfish sharks. Thus the recommendation in the general comments. SINCE YOU NEED TO GO FORTH THIS MORNING WITH COMMENTS I WILL STOP HERE.
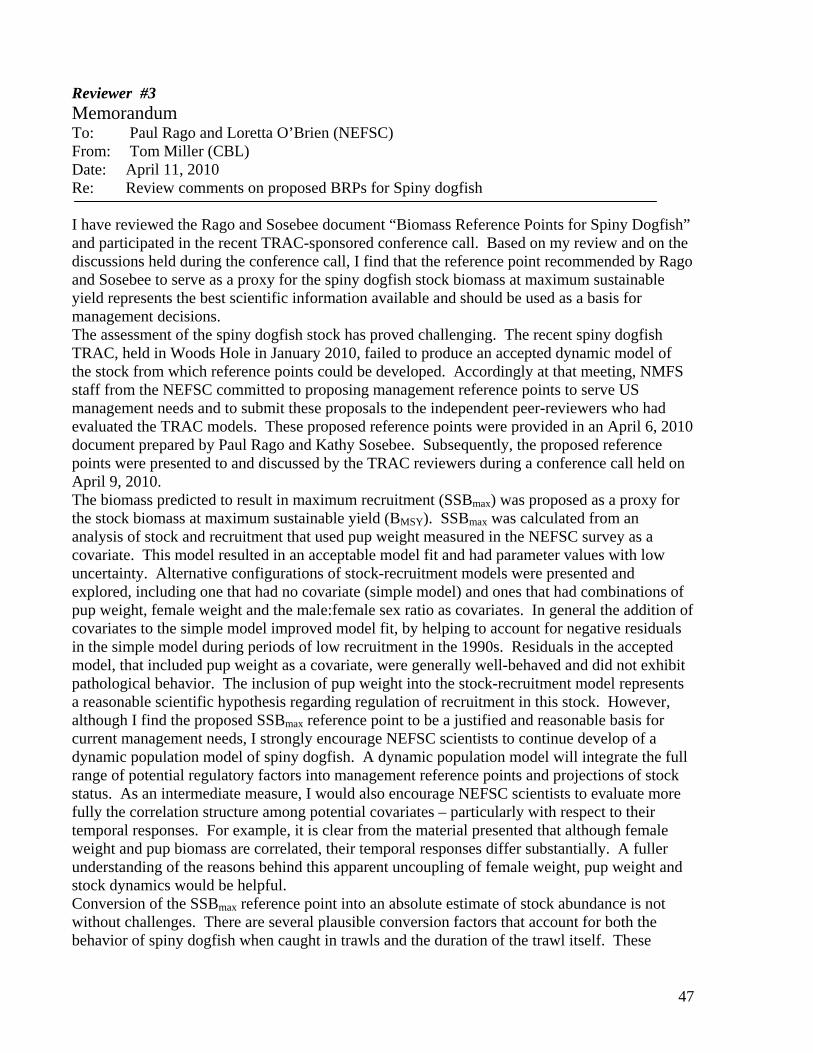
47
Reviewer #3 Memorandum To: Paul Rago and Loretta O’Brien (NEFSC) From: Tom Miller (CBL) Date: April 11, 2010 Re: Review comments on proposed BRPs for Spiny dogfish I have reviewed the Rago and Sosebee document “Biomass Reference Points for Spiny Dogfish” and participated in the recent TRAC-sponsored conference call. Based on my review and on the discussions held during the conference call, I find that the reference point recommended by Rago and Sosebee to serve as a proxy for the spiny dogfish stock biomass at maximum sustainable yield represents the best scientific information available and should be used as a basis for management decisions. The assessment of the spiny dogfish stock has proved challenging. The recent spiny dogfish TRAC, held in Woods Hole in January 2010, failed to produce an accepted dynamic model of the stock from which reference points could be developed. Accordingly at that meeting, NMFS staff from the NEFSC committed to proposing management reference points to serve US management needs and to submit these proposals to the independent peer-reviewers who had evaluated the TRAC models. These proposed reference points were provided in an April 6, 2010 document prepared by Paul Rago and Kathy Sosebee. Subsequently, the proposed reference points were presented to and discussed by the TRAC reviewers during a conference call held on April 9, 2010. The biomass predicted to result in maximum recruitment (SSBmax) was proposed as a proxy for the stock biomass at maximum sustainable yield (BMSY). SSBmax was calculated from an analysis of stock and recruitment that used pup weight measured in the NEFSC survey as a covariate. This model resulted in an acceptable model fit and had parameter values with low uncertainty. Alternative configurations of stock-recruitment models were presented and explored, including one that had no covariate (simple model) and ones that had combinations of pup weight, female weight and the male:female sex ratio as covariates. In general the addition of covariates to the simple model improved model fit, by helping to account for negative residuals in the simple model during periods of low recruitment in the 1990s. Residuals in the accepted model, that included pup weight as a covariate, were generally well-behaved and did not exhibit pathological behavior. The inclusion of pup weight into the stock-recruitment model represents a reasonable scientific hypothesis regarding regulation of recruitment in this stock. However, although I find the proposed SSBmax reference point to be a justified and reasonable basis for current management needs, I strongly encourage NEFSC scientists to continue develop of a dynamic population model of spiny dogfish. A dynamic population model will integrate the full range of potential regulatory factors into management reference points and projections of stock status. As an intermediate measure, I would also encourage NEFSC scientists to evaluate more fully the correlation structure among potential covariates – particularly with respect to their temporal responses. For example, it is clear from the material presented that although female weight and pup biomass are correlated, their temporal responses differ substantially. A fuller understanding of the reasons behind this apparent uncoupling of female weight, pup weight and stock dynamics would be helpful. Conversion of the SSBmax reference point into an absolute estimate of stock abundance is not without challenges. There are several plausible conversion factors that account for both the behavior of spiny dogfish when caught in trawls and the duration of the trawl itself. These

48
alternative but plausible parameterizations introduce uncertainty into the estimate of SSBmax accepted by the review panel. I strongly encourage NEFSC scientists to bring forward estimates of the uncertainty in the SSBmax reference point to the relevant regional councils and SSCs. It is important for these bodies to have a full understanding of the uncertainty in both the current stock status and the reference point when evaluating risk
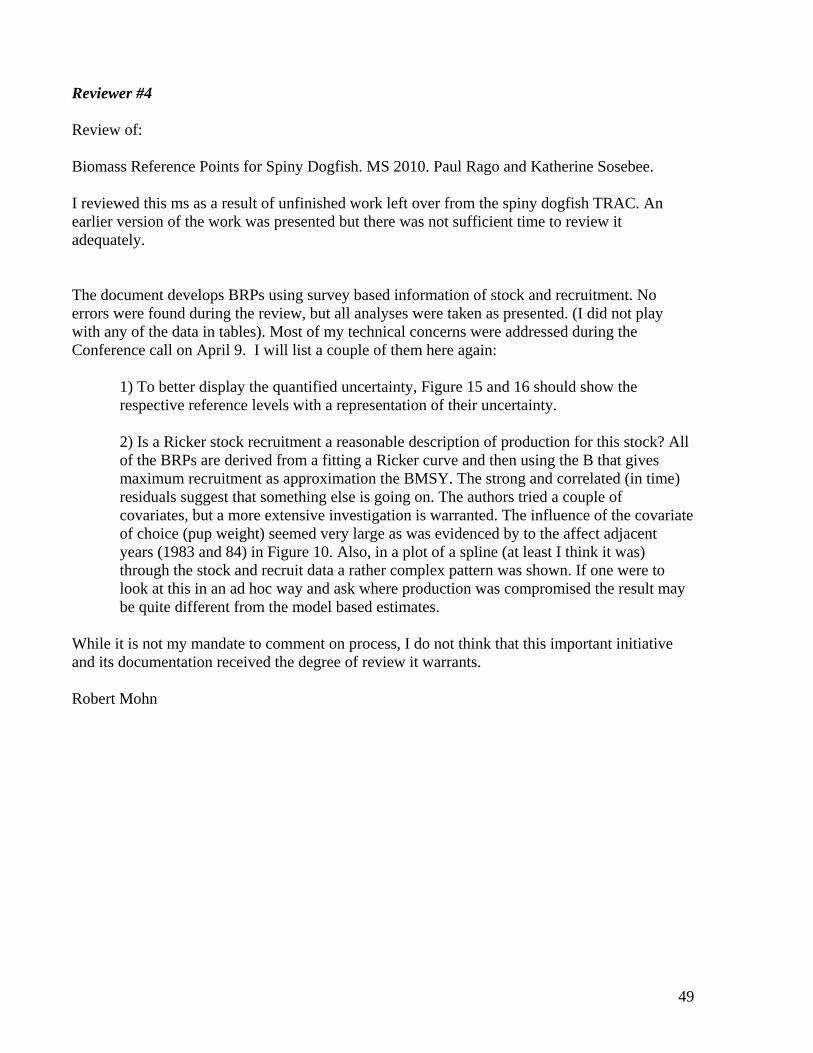
49
Reviewer #4 Review of: Biomass Reference Points for Spiny Dogfish. MS 2010. Paul Rago and Katherine Sosebee. I reviewed this ms as a result of unfinished work left over from the spiny dogfish TRAC. An earlier version of the work was presented but there was not sufficient time to review it adequately. The document develops BRPs using survey based information of stock and recruitment. No errors were found during the review, but all analyses were taken as presented. (I did not play with any of the data in tables). Most of my technical concerns were addressed during the Conference call on April 9. I will list a couple of them here again:
1) To better display the quantified uncertainty, Figure 15 and 16 should show the respective reference levels with a representation of their uncertainty. 2) Is a Ricker stock recruitment a reasonable description of production for this stock? All of the BRPs are derived from a fitting a Ricker curve and then using the B that gives maximum recruitment as approximation the BMSY. The strong and correlated (in time) residuals suggest that something else is going on. The authors tried a couple of covariates, but a more extensive investigation is warranted. The influence of the covariate of choice (pup weight) seemed very large as was evidenced by to the affect adjacent years (1983 and 84) in Figure 10. Also, in a plot of a spline (at least I think it was) through the stock and recruit data a rather complex pattern was shown. If one were to look at this in an ad hoc way and ask where production was compromised the result may be quite different from the model based estimates.
While it is not my mandate to comment on process, I do not think that this important initiative and its documentation received the degree of review it warrants. Robert Mohn
Procedures for Issuing Manuscriptsin the
Northeast Fisheries Science Center Reference Document (CRD) Series
Clearance All manuscripts submitted for issuance as CRDs must have cleared the NEFSC’s manuscript/abstract/webpage review process. If any author is not a federal employee, he/she will be required to sign an “NEFSC Release-of-Copyright Form.” If your manuscript includes material from another work which has been copyrighted, then you will need to work with the NEFSC’s Editorial Office to arrange for permission to use that material by securing release signatures on the “NEFSC Use-of-Copyrighted-Work Permission Form.” For more information, NEFSC authors should see the NEFSC’s online publication policy manual, “Manu-script/abstract/webpage preparation, review, and dis-semination: NEFSC author’s guide to policy, process, and procedure,” located in the Publications/Manuscript Review section of the NEFSC intranet page.
Organization Manuscripts must have an abstract and table of contents, and (if applicable) lists of figures and tables. As much as possible, use traditional scientific manu-script organization for sections: “Introduction,” “Study Area” and/or ”Experimental Apparatus,” “Methods,” “Results,” “Discussion,” “Conclusions,” “Acknowl-edgments,” and “Literature/References Cited.”
Style The CRD series is obligated to conform with the style contained in the current edition of the United States Government Printing Office Style Manual. That style manual is silent on many aspects of scientific manuscripts. The CRD series relies more on the CSE Style Manual. Manuscripts should be prepared to conform with these style manuals. The CRD series uses the American Fisheries Soci-ety’s guides to names of fishes, mollusks, and decapod
crustaceans, the Society for Marine Mammalogy’s guide to names of marine mammals, the Biosciences Information Service’s guide to serial title abbreviations, and the ISO’s (International Standardization Organiza-tion) guide to statistical terms. For in-text citation, use the name-date system. A special effort should be made to ensure that all neces-sary bibliographic information is included in the list of cited works. Personal communications must include date, full name, and full mailing address of the con-tact.
Preparation Once your document has cleared the review pro-cess, the Editorial Office will contact you with publica-tion needs – for example, revised text (if necessary) and separate digital figures and tables if they are embedded in the document. Materials may be submitted to the Editorial Office as files on zip disks or CDs, email attachments, or intranet downloads. Text files should be in Microsoft Word, tables may be in Word or Excel, and graphics files may be in a variety of formats (JPG, GIF, Excel, PowerPoint, etc.).
Production and Distribution The Editorial Office will perform a copy-edit of the document and may request further revisions. The Editorial Office will develop the inside and outside front covers, the inside and outside back covers, and the title and bibliographic control pages of the docu-ment. Once both the PDF (print) and Web versions of the CRD are ready, the Editorial Office will contact you to review both versions and submit corrections or changes before the document is posted online. A number of organizations and individuals in the Northeast Region will be notified by e-mail of the availability of the document online.
Research Communications BranchNortheast Fisheries Science Center
National Marine Fisheries Service, NOAA166 Water St.
Woods Hole, MA 02543-1026
Publications and Reportsof the
Northeast Fisheries Science CenterThe mission of NOAA’s National Marine Fisheries Service (NMFS) is “stewardship of living marine resources for the benefit of the nation through their science-based conservation and management and promotion of the health of their environment.” As the research arm of the NMFS’s Northeast Region, the Northeast Fisheries Science Center (NEFSC) supports the NMFS mission by “conducting ecosystem-based research and assess-ments of living marine resources, with a focus on the Northeast Shelf, to promote the recovery and long-term sustainability of these resources and to generate social and economic opportunities and benefits from their use.” Results of NEFSC research are largely reported in primary scientific media (e.g., anonymously-peer-reviewed scientific journals). However, to assist itself in providing data, information, and advice to its constituents, the NEFSC occasionally releases its results in its own media. Currently, there are three such media:
NOAA Technical Memorandum NMFS-NE -- This series is issued irregularly. The series typically includes: data reports of long-term field or lab studies of important species or habitats; synthesis reports for important species or habitats; annual reports of overall assessment or monitoring programs; manuals describing program-wide surveying or experimental techniques; literature surveys of important species or habitat topics; proceedings and collected papers of scientific meetings; and indexed and/or annotated bibliographies. All issues receive internal scientific review and most issues receive technical and copy editing.
Northeast Fisheries Science Center Reference Document -- This series is issued irregularly. The series typically includes: data reports on field and lab studies; progress reports on experiments, monitoring, and assessments; background papers for, collected abstracts of, and/or summary reports of scientific meetings; and simple bibliographies. Issues receive internal scientific review and most issues receive copy editing.
Resource Survey Report (formerly Fishermen’s Report) -- This information report is a regularly-issued, quick-turnaround report on the distribution and relative abundance of selected living marine resources as derived from each of the NEFSC’s periodic research ves-sel surveys of the Northeast’s continental shelf. This report undergoes internal review, but receives no technical or copy editing.
TO OBTAIN A COPY of a NOAA Technical Memorandum NMFS-NE or a Northeast Fisheries Science Center Reference Document, either contact the NEFSC Editorial Office (166 Water St., Woods Hole, MA 02543-1026; 508-495-2350) or consult the NEFSC webpage on “Reports and Publications” (http://www.nefsc.noaa.gov/nefsc/publications/). To access Resource Survey Report, consult the Ecosystem Surveys Branch webpage (http://www.nefsc.noaa.gov/femad/ecosurvey/mainpage/).
ANY USE OF TRADE OR BRAND NAMES IN ANY NEFSC PUBLICATION OR REPORT DOES NOT IMPLY ENDORSE-MENT.
MEDIA MAIL