biological interpretation of metabolomics data - bigcat€¦ · biological interpretation of...
TRANSCRIPT
Biological Interpretation of
Metabolomics DataMartina Kutmon – Maastricht University
Biological Interpretation of Metabolomics Data – Copenhagen – Dec 7, 2011 2
Contents
• Background on pathway analysis
• WikiPathways – Building Research Communities on Biological Pathways
• Data Analysis with PathVisio
• Introduction to the hands on part
Biological Interpretation of Metabolomics Data – Copenhagen – Dec 7, 2011 3
PATHWAY ANALYSIS
Biological Interpretation of Metabolomics Data – Copenhagen – Dec 7, 2011 4
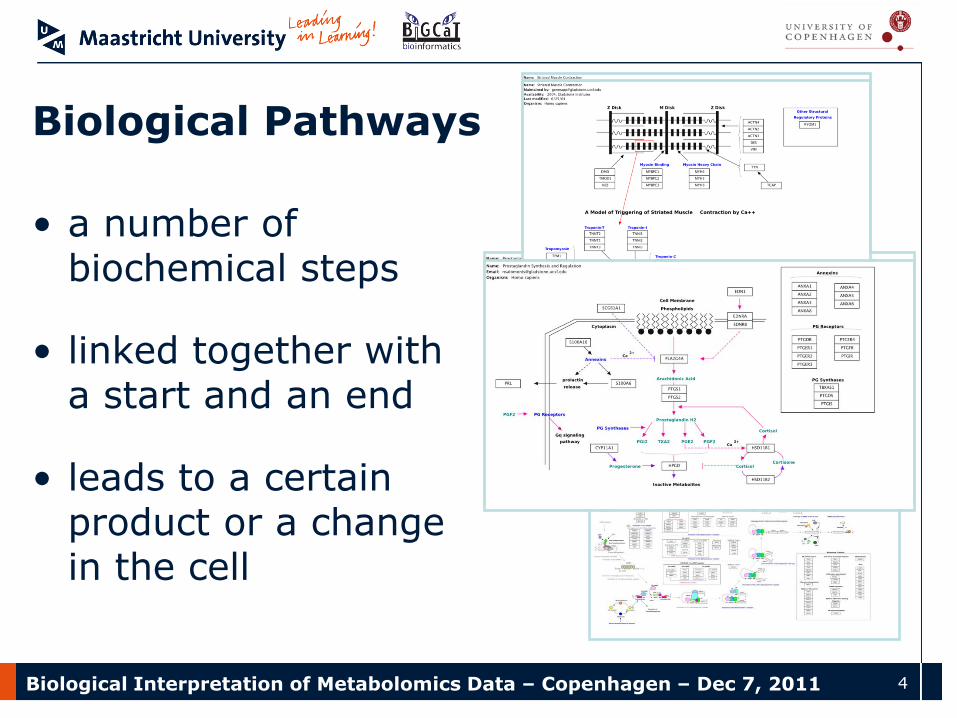
Biological Pathways
• a number of biochemical steps
• linked together with a start and an end
• leads to a certain product or a change in the cell
Biological Interpretation of Metabolomics Data – Copenhagen – Dec 7, 2011 5
Why Pathway Analysis?
• Intuitive to biologists• puts data in biological context
• more intuitive way of looking at your data
• more efficient than looking up gene-by gene
• Computational analysis• overrepresentation analysis
• network analysis
• Experimental Design
Biological Interpretation of Metabolomics Data – Copenhagen – Dec 7, 2011 6
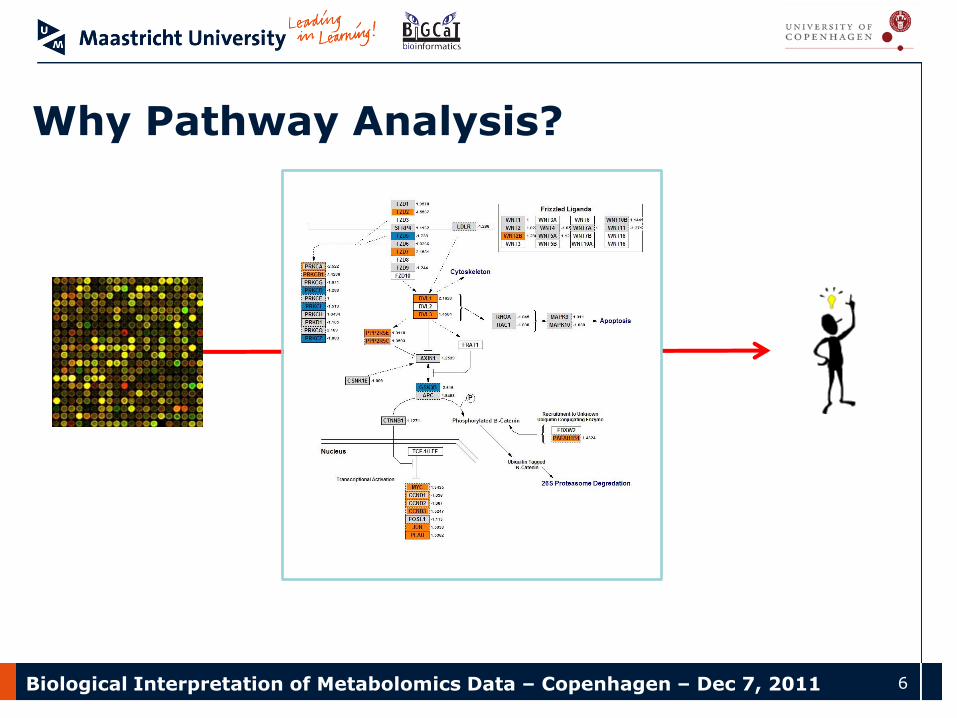
Why Pathway Analysis?
Biological Interpretation of Metabolomics Data – Copenhagen – Dec 7, 2011 7
Biological Context
• Statistical results:
– 1,300 genes are significantly regulated after treatment with X
• Biological Meaning:
– Is a certain biological process activated or deactivated?
– Which genes in a pathway are significantly changed?
Biological Interpretation of Metabolomics Data – Copenhagen – Dec 7, 2011 8
Usage of Pathway Analysis
• Pathway as a working hypothesis
– Describe expected process as a pathway
– Find out if the data supports the hypothesis
• Find enriched pathways for a dataset
– Which pathways are changed in my experiment setting?
Biological Interpretation of Metabolomics Data – Copenhagen – Dec 7, 2011 9
Pathway Creation
• PathVisio allows you to draw your own pathways
• Graphical description of the process how you think it works
• Use pathway analysis to see if the data supports your hypothesis
Biological Interpretation of Metabolomics Data – Copenhagen – Dec 7, 2011 10
Pathway Collections
• Which pathways should I use?
– more than 325 biological pathway related resources
• WikiPathways www.wikipathways.org
• Reactome www.reactome.org
• HMDB www.hmdb.ca
• KEGG www.genome.jp/kegg/
PathGuide: a pathway resource list. Bader et al. PubMed: 16381921
Biological Interpretation of Metabolomics Data – Copenhagen – Dec 7, 2011 11
Pathway Analysis Tools
• PathVisio
• BioRAG
• MetaCore (GeneGO)
• Pathway-Express
• GenMAPP / MAPPFinder
Biological Interpretation of Metabolomics Data – Copenhagen – Dec 7, 2011 12
WIKIPATHWAYSwww.wikipathways.org
Biological Interpretation of Metabolomics Data – Copenhagen – Dec 7, 2011 13
What is a wiki?
A wiki is a website that allows the creation and editing of any number of interlinked web pages via a web browser ...
[wikipedia.org, 2011]
Biological Interpretation of Metabolomics Data – Copenhagen – Dec 7, 2011 14
What is a wiki?
• Simple formating rules
• Collection of knowledge
• Multiple contributors
• Curation of knowledge
Examples
Wikipedia, Wikiquote, Wikibooks, Wikiversity
Wikispecies, Proteopedia, Gene Wiki, WikiPathways
Fan-wikis: Jedipedia, Simpsons wiki
Biological Interpretation of Metabolomics Data – Copenhagen – Dec 7, 2011 15
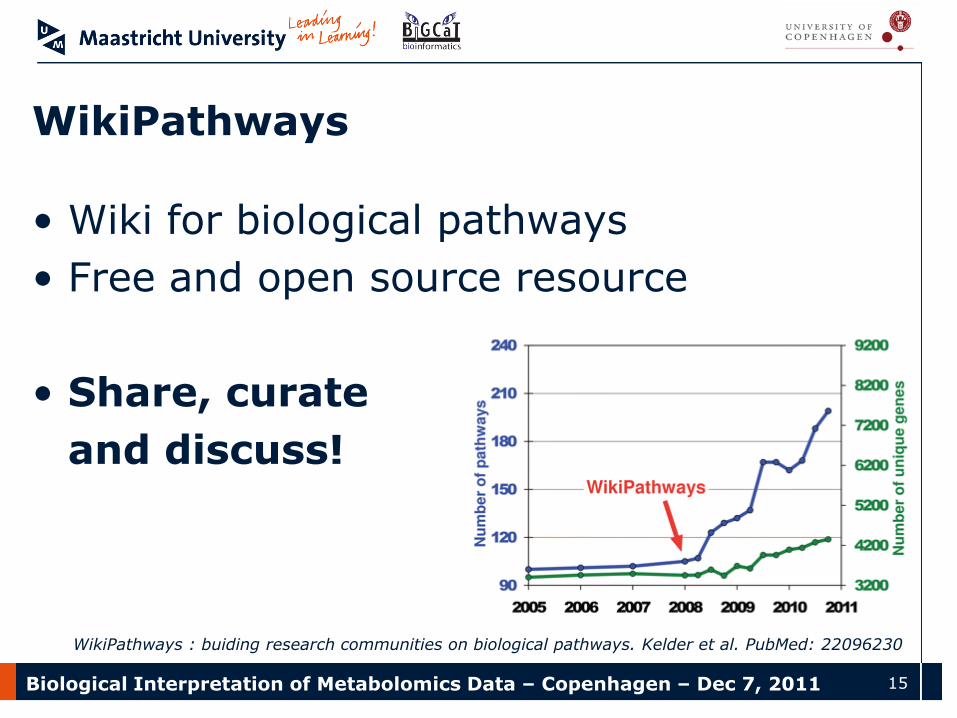
WikiPathways
• Wiki for biological pathways
• Free and open source resource
• Share, curate
and discuss!
WikiPathways : buiding research communities on biological pathways. Kelder et al. PubMed: 22096230
Biological Interpretation of Metabolomics Data – Copenhagen – Dec 7, 2011 16
Why WikiPathways?
• Repository for biological pathway information
• Organize knowledge
• Graphical pathway editing tool
• Community contribution and curation
• Version history
• Downloadable for further analysis
Biological Interpretation of Metabolomics Data – Copenhagen – Dec 7, 2011 17
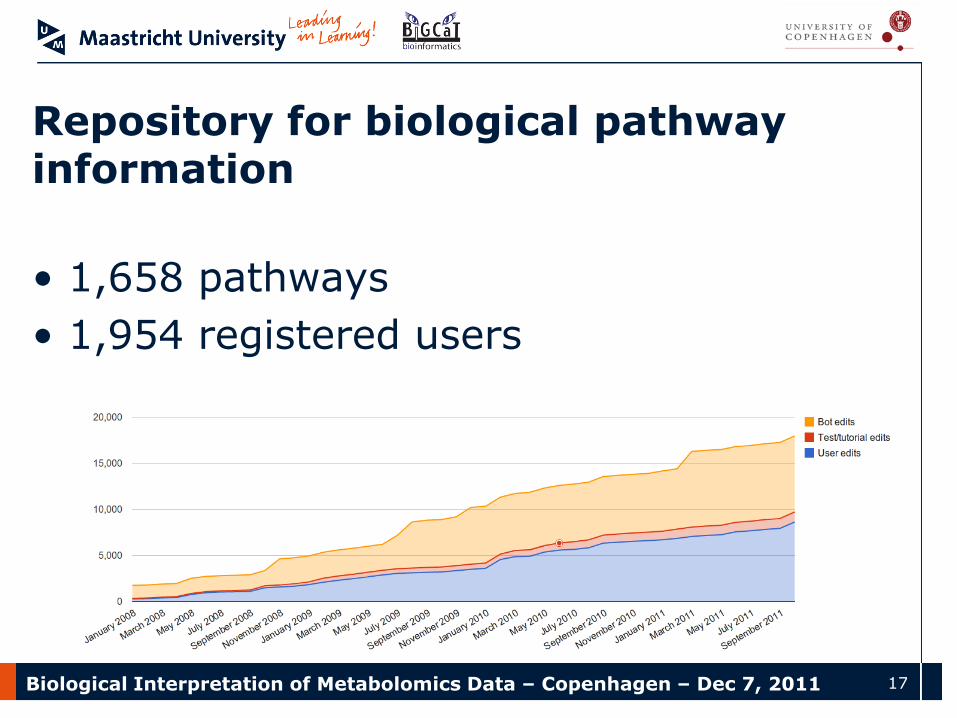
Repository for biological pathway information
• 1,658 pathways
• 1,954 registered users
Biological Interpretation of Metabolomics Data – Copenhagen – Dec 7, 2011 18
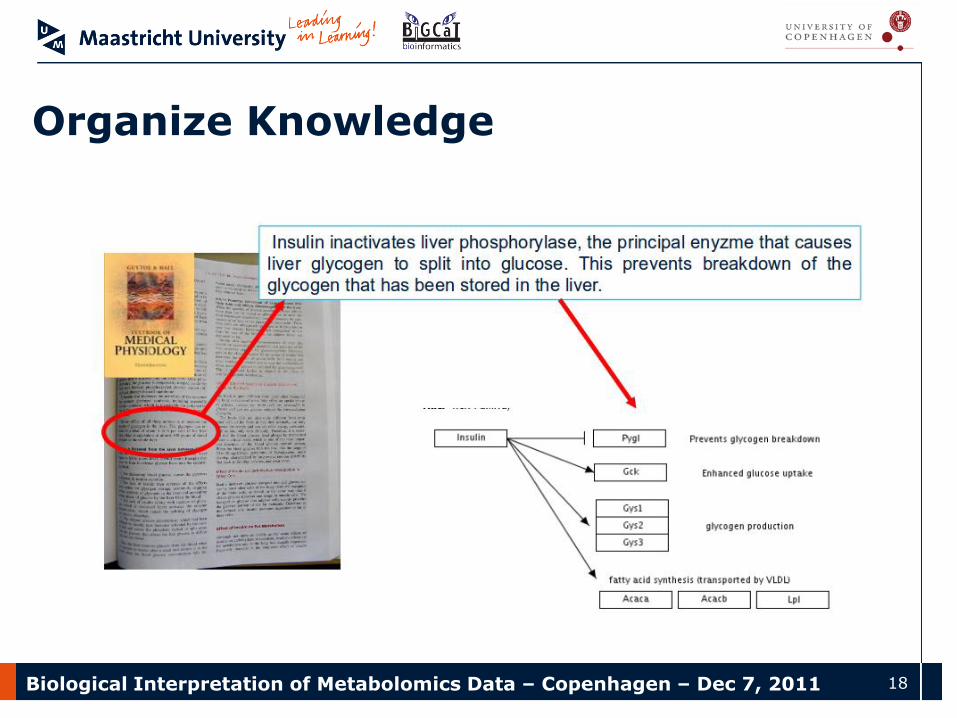
Organize Knowledge
Biological Interpretation of Metabolomics Data – Copenhagen – Dec 7, 2011 19
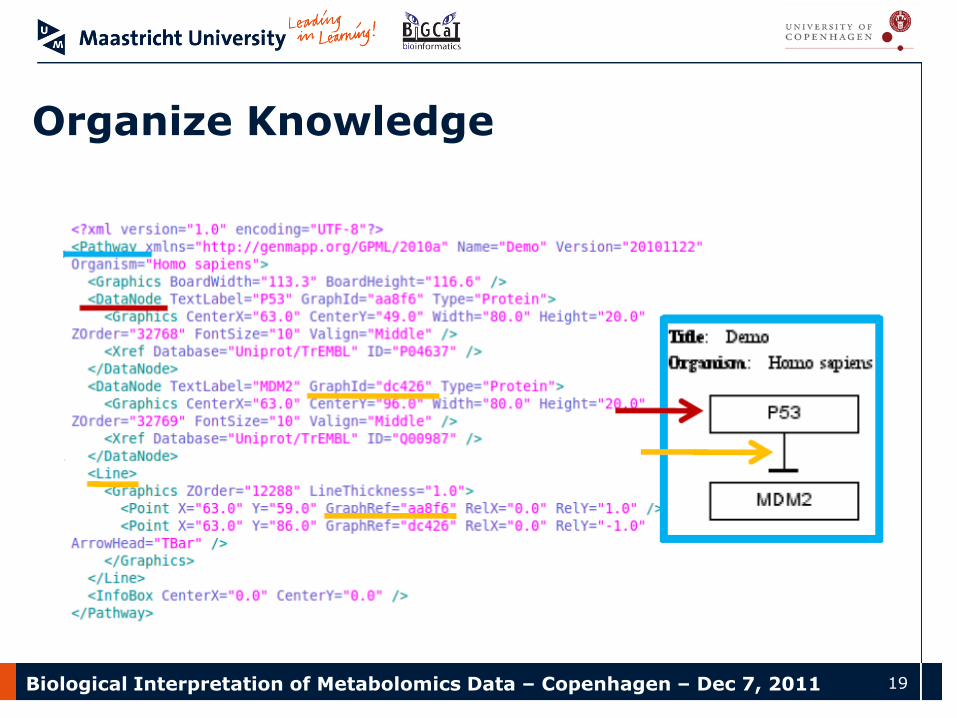
Organize Knowledge
Biological Interpretation of Metabolomics Data – Copenhagen – Dec 7, 2011 20
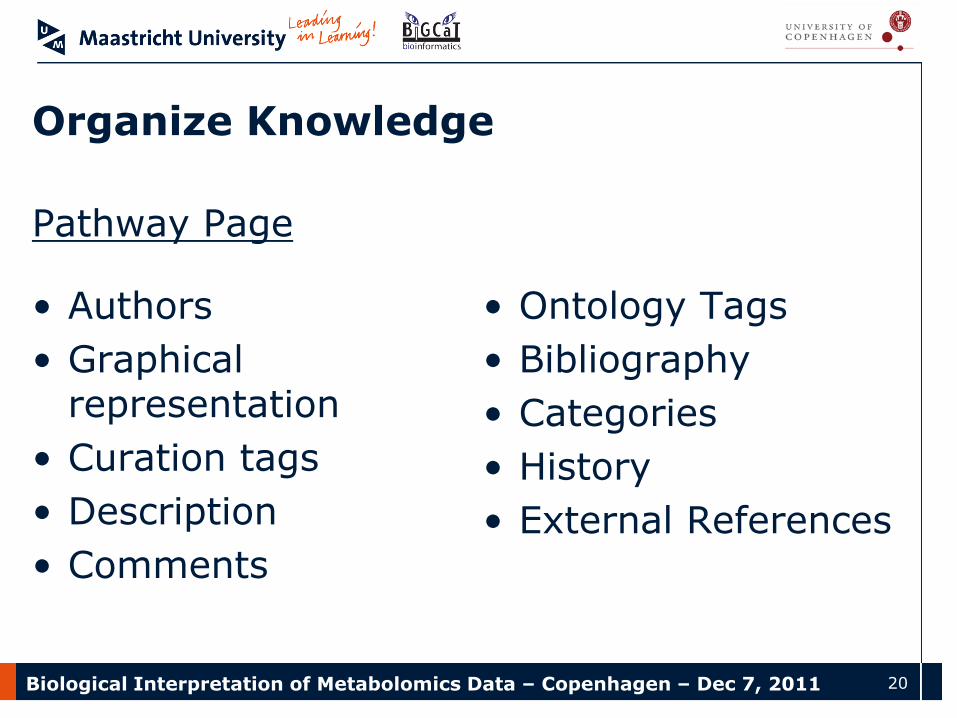
Organize Knowledge
Pathway Page
• Authors
• Graphical representation
• Curation tags
• Description
• Comments
• Ontology Tags
• Bibliography
• Categories
• History
• External References
Biological Interpretation of Metabolomics Data – Copenhagen – Dec 7, 2011 21
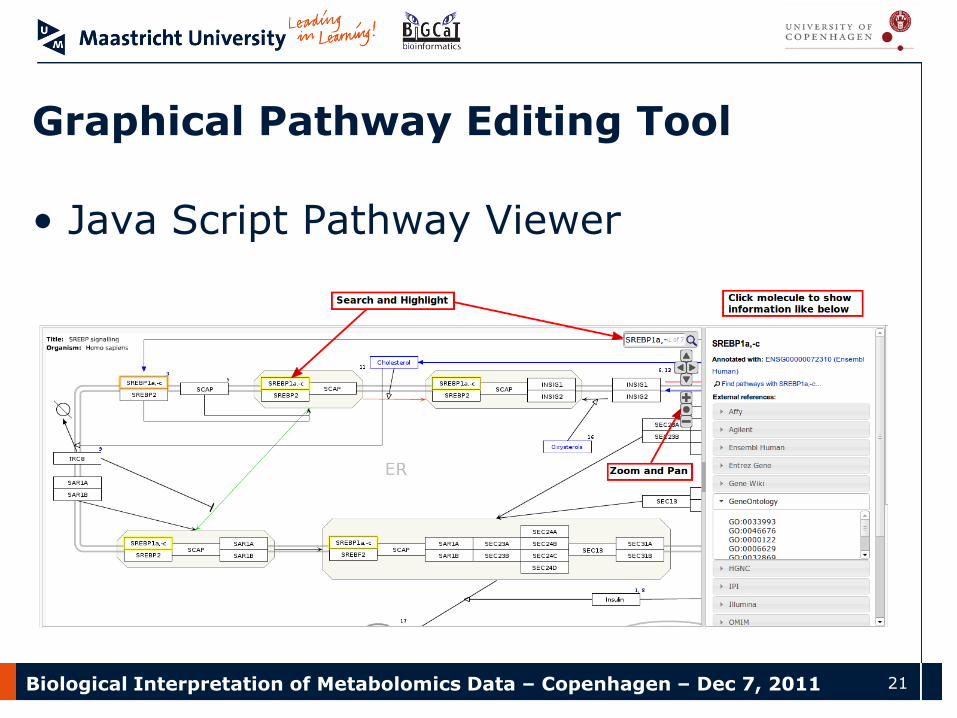
Graphical Pathway Editing Tool
• Java Script Pathway Viewer
Biological Interpretation of Metabolomics Data – Copenhagen – Dec 7, 2011 22
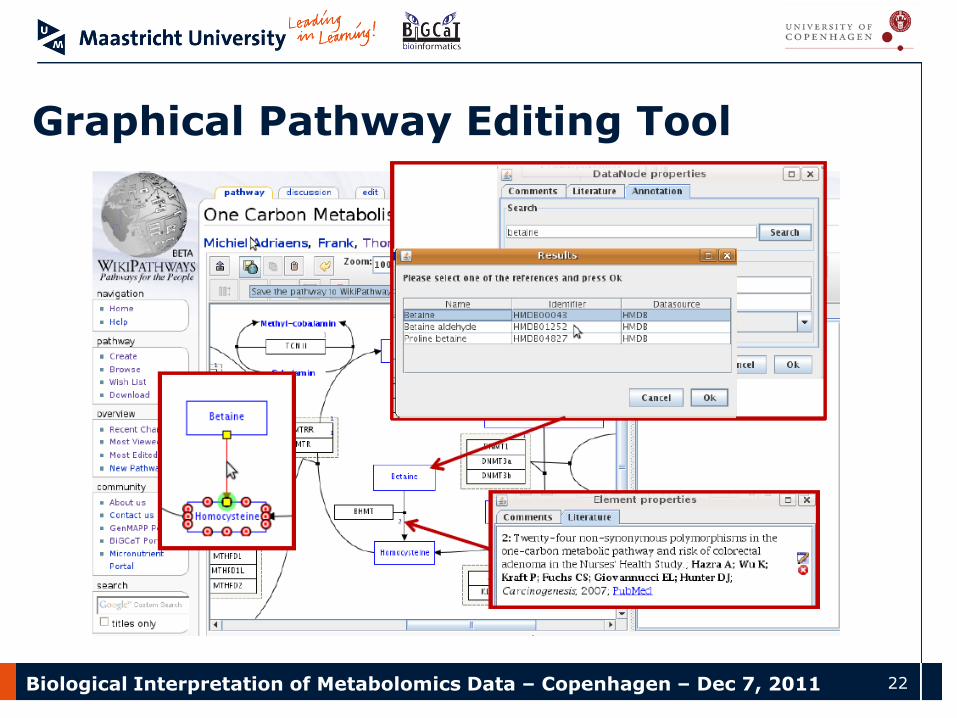
Graphical Pathway Editing Tool
Biological Interpretation of Metabolomics Data – Copenhagen – Dec 7, 2011 23
WikiPathways data model
• Pathway identifiers
– Unique & stable
– WP1, WP43, WP1373
• Curation tags provide quality annotations
• All other information is stored in GPML
Biological Interpretation of Metabolomics Data – Copenhagen – Dec 7, 2011 24
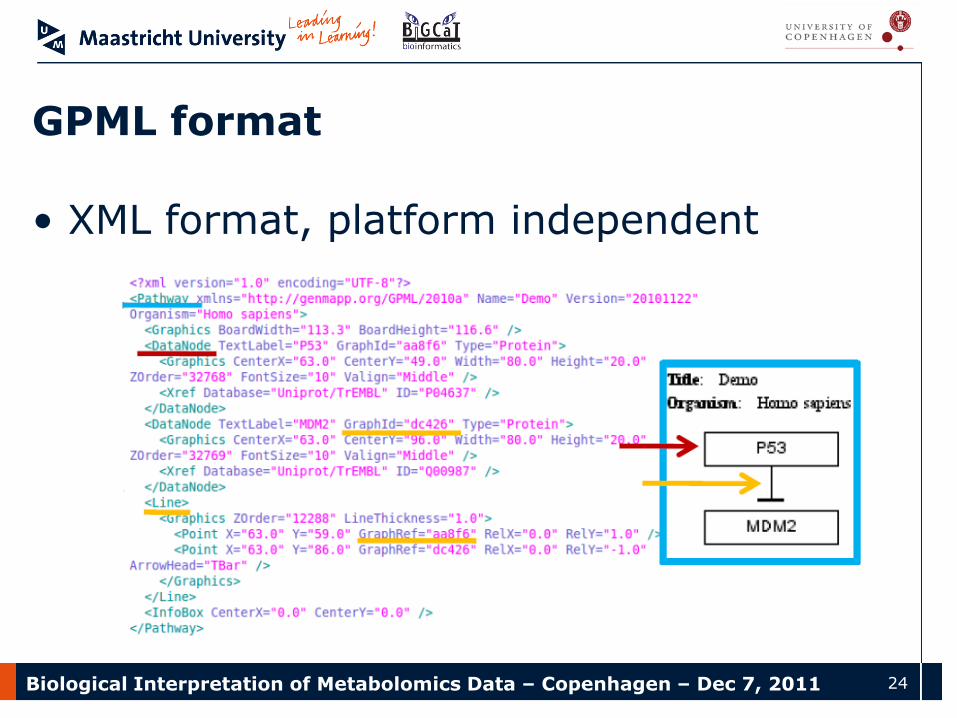
GPML format
• XML format, platform independent
Biological Interpretation of Metabolomics Data – Copenhagen – Dec 7, 2011 25
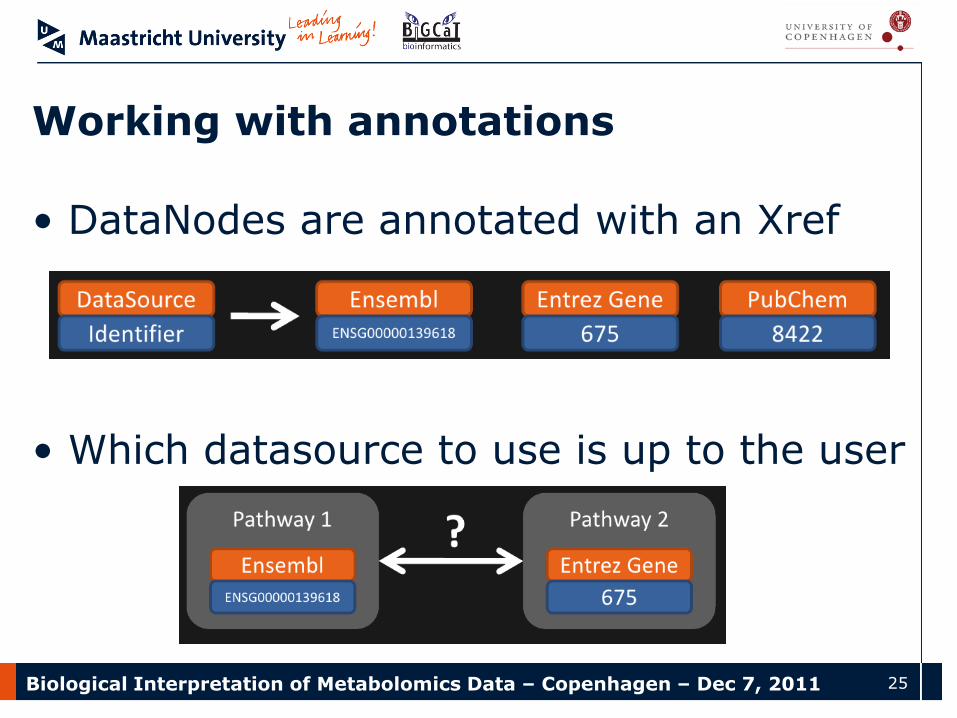
Working with annotations
• DataNodes are annotated with an Xref
• Which datasource to use is up to the user
Biological Interpretation of Metabolomics Data – Copenhagen – Dec 7, 2011 26
Working with annotations
• WikiPathways provides functions where the identifiers have been mapped for you
• Use BridgeDB library for solving your own mapping problems
http://www.bridgedb.org
Biological Interpretation of Metabolomics Data – Copenhagen – Dec 7, 2011 27
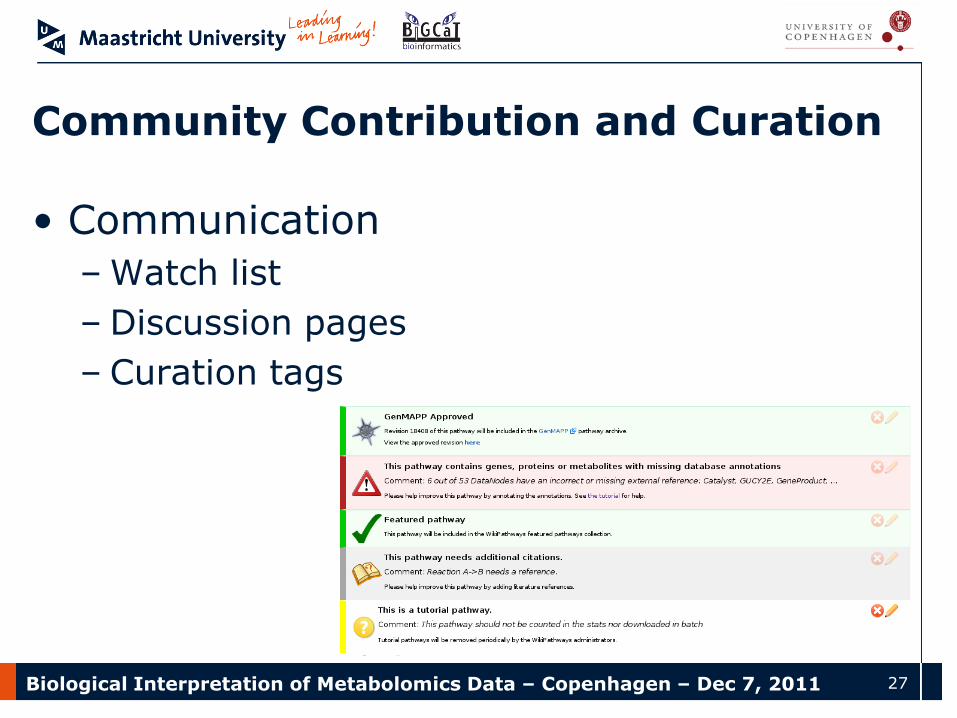
Community Contribution and Curation
• Communication
– Watch list
– Discussion pages
– Curation tags
Biological Interpretation of Metabolomics Data – Copenhagen – Dec 7, 2011 28
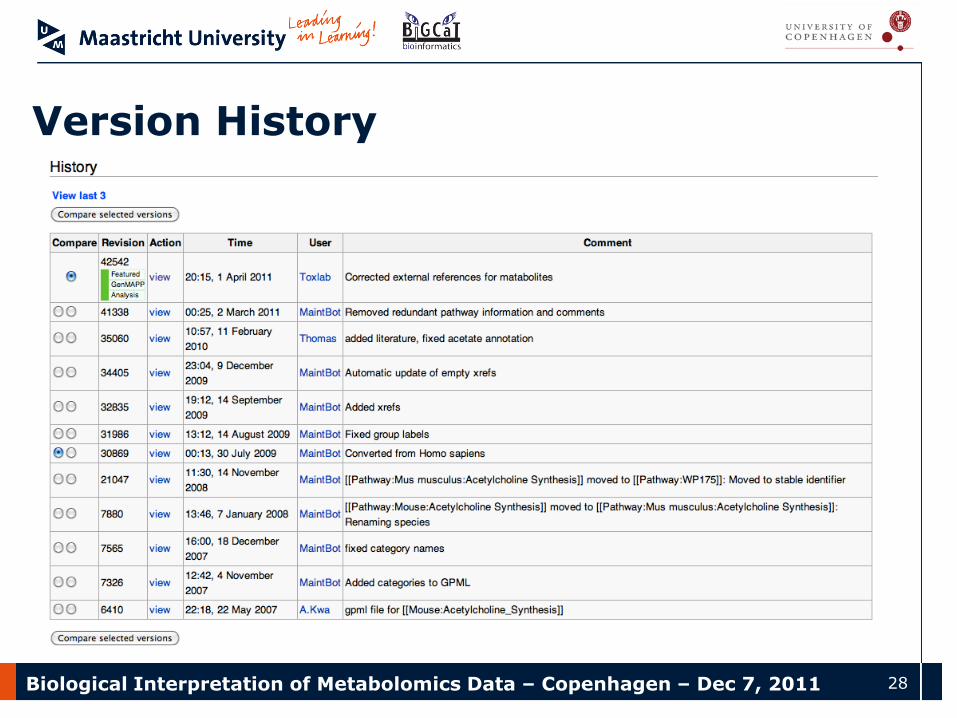
Version History
Biological Interpretation of Metabolomics Data – Copenhagen – Dec 7, 2011 29
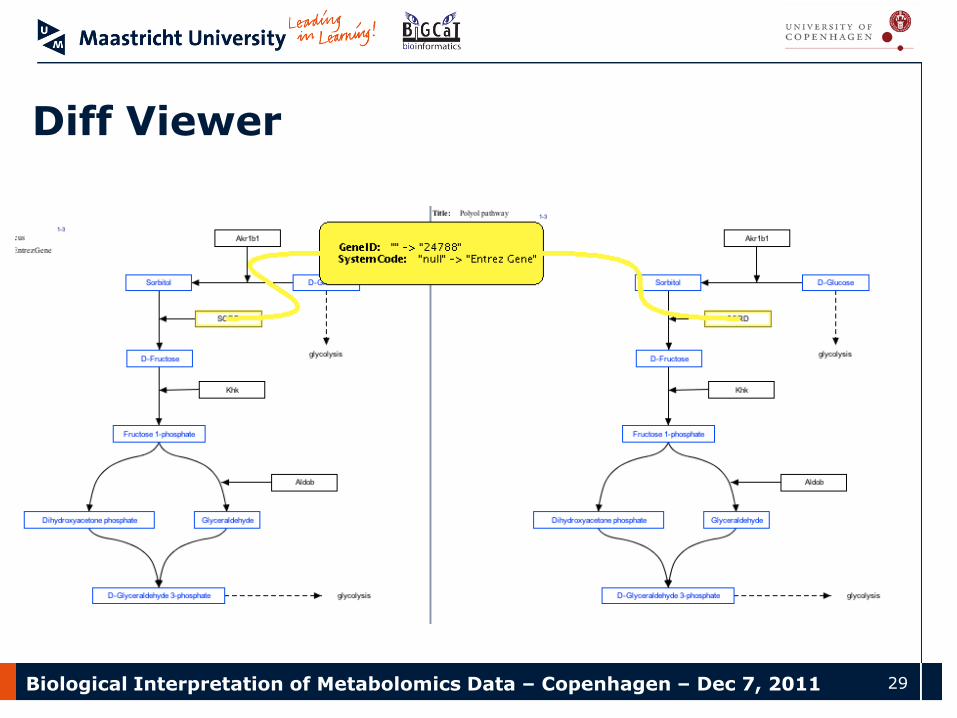
Diff Viewer
Biological Interpretation of Metabolomics Data – Copenhagen – Dec 7, 2011 30
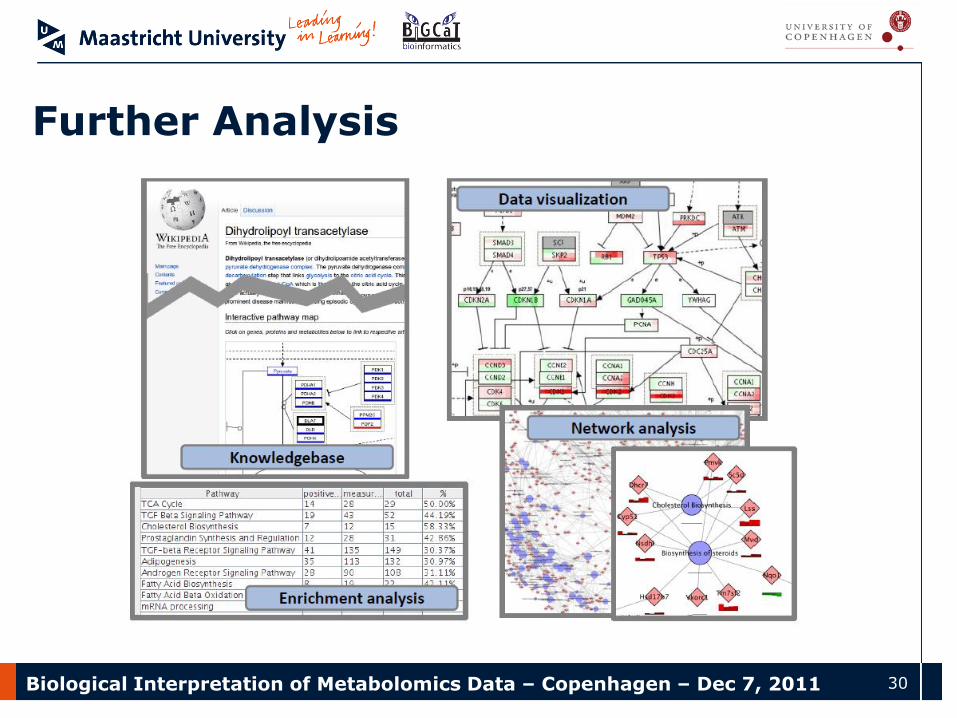
Further Analysis
Biological Interpretation of Metabolomics Data – Copenhagen – Dec 7, 2011 31
Tutorial and Mailinglist
• If you want to create a pathways in WikiPathways, the tutorial is a good way to start
http://wikipathways.org/index.php/Help:Tutorial
• If you have questions or problems, please contact the mailinglist
Biological Interpretation of Metabolomics Data – Copenhagen – Dec 7, 2011 32
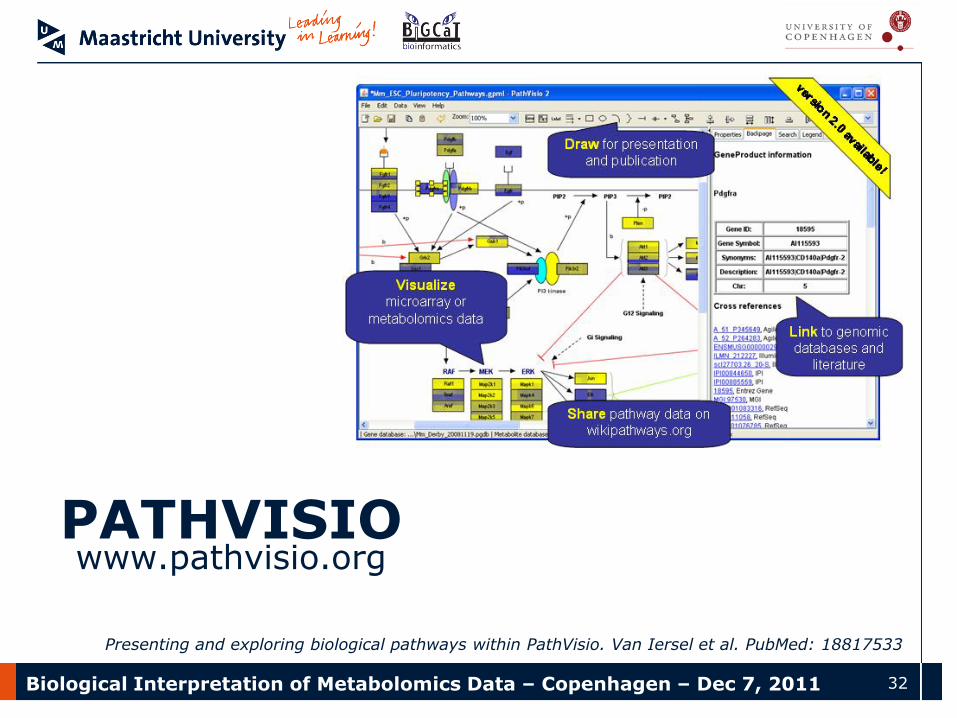
PATHVISIOwww.pathvisio.org
Presenting and exploring biological pathways within PathVisio. Van Iersel et al. PubMed: 18817533
Biological Interpretation of Metabolomics Data – Copenhagen – Dec 7, 2011 33
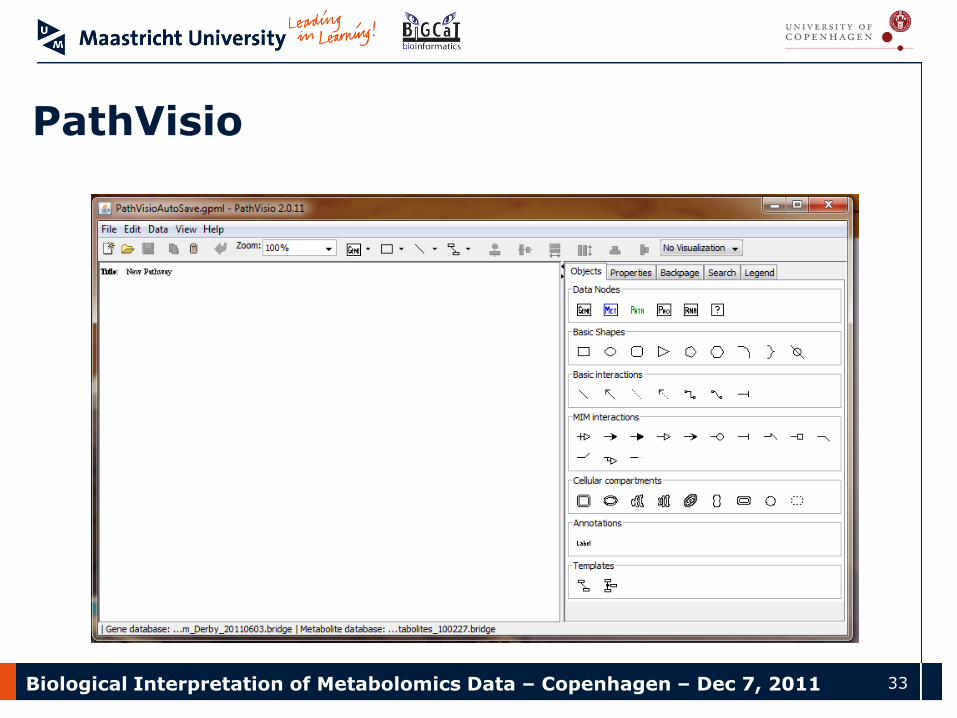
PathVisio
Biological Interpretation of Metabolomics Data – Copenhagen – Dec 7, 2011 34
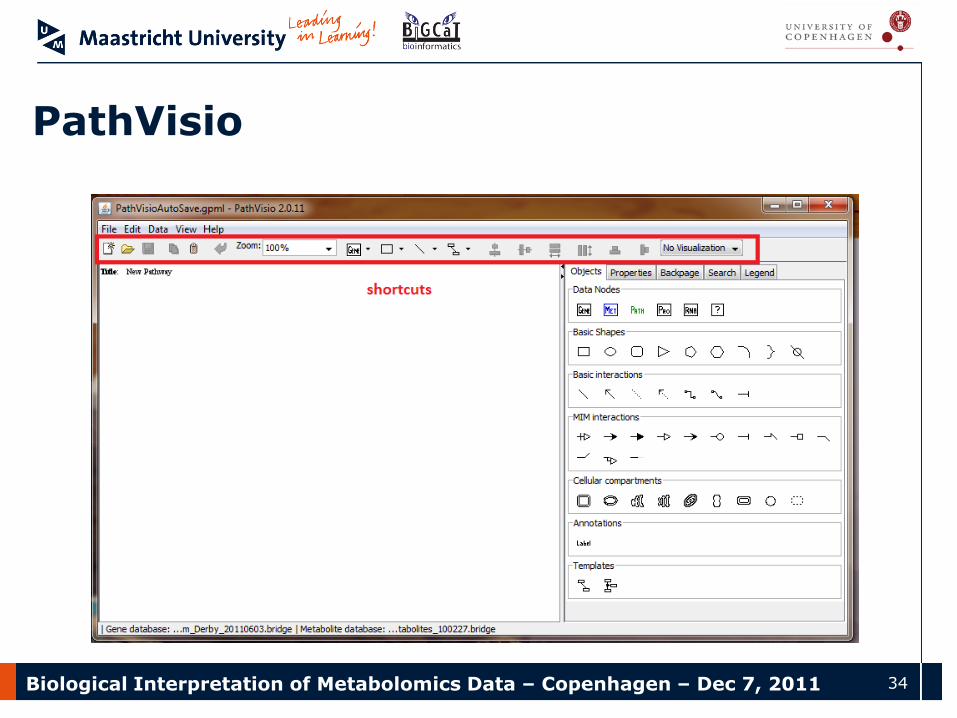
PathVisio
Biological Interpretation of Metabolomics Data – Copenhagen – Dec 7, 2011 35
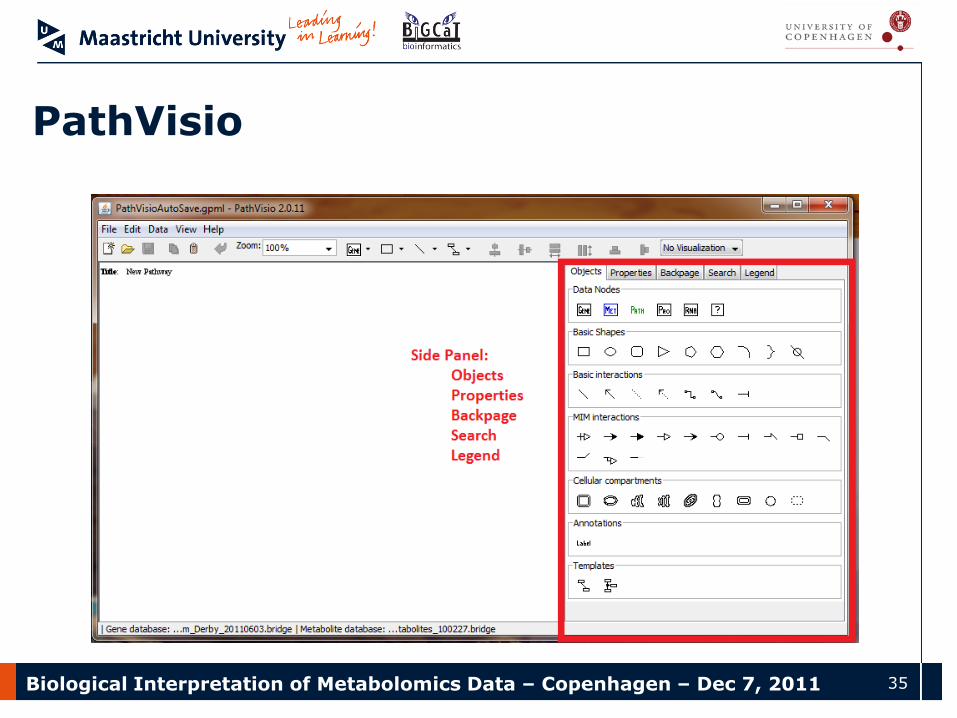
PathVisio
Biological Interpretation of Metabolomics Data – Copenhagen – Dec 7, 2011 36
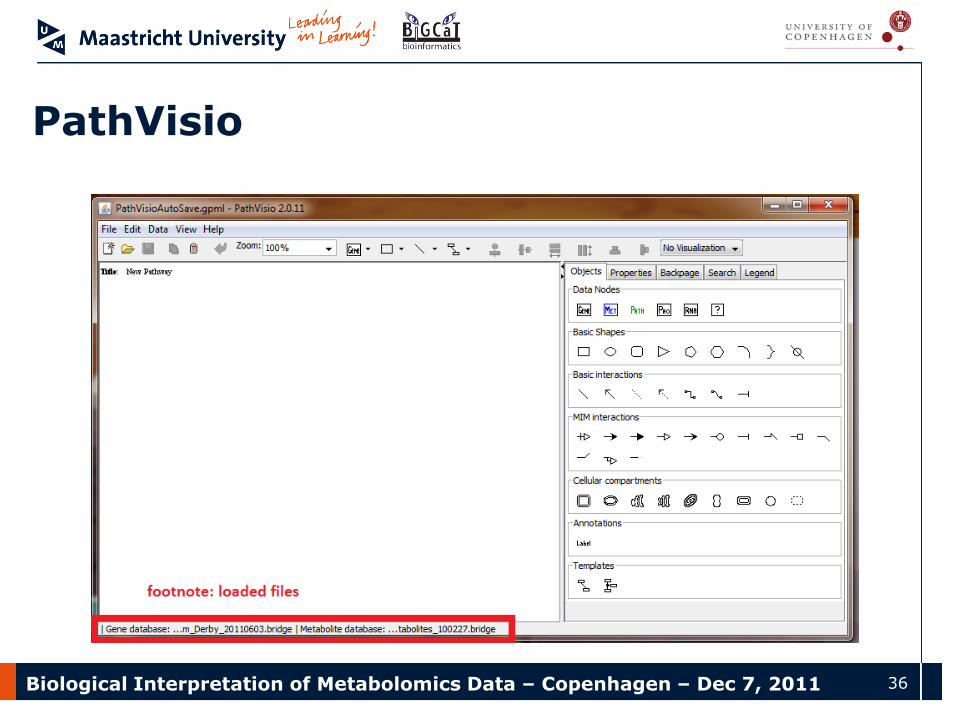
PathVisio
Biological Interpretation of Metabolomics Data – Copenhagen – Dec 7, 2011 37
Pathway Analysis Workflow
• Prepare your data
• Import data into PathVisio
• Find „enriched“ pathways
• Visualize data on pathways
• Export pathway images
Biological Interpretation of Metabolomics Data – Copenhagen – Dec 7, 2011 38
Prepare your data
• All kind of quantitative data, like microarray, sequencing or qPCR data
• Identifier system needs to be supported• Probes:
– Affymetrix, Illumina, Agilent,...
• Genes and Proteins:
– Entrez Gene, Ensembl, UniProt, HUGO,...
• Metabolites:
– ChEBI, HMDB, PubChem,...
Biological Interpretation of Metabolomics Data – Copenhagen – Dec 7, 2011 39
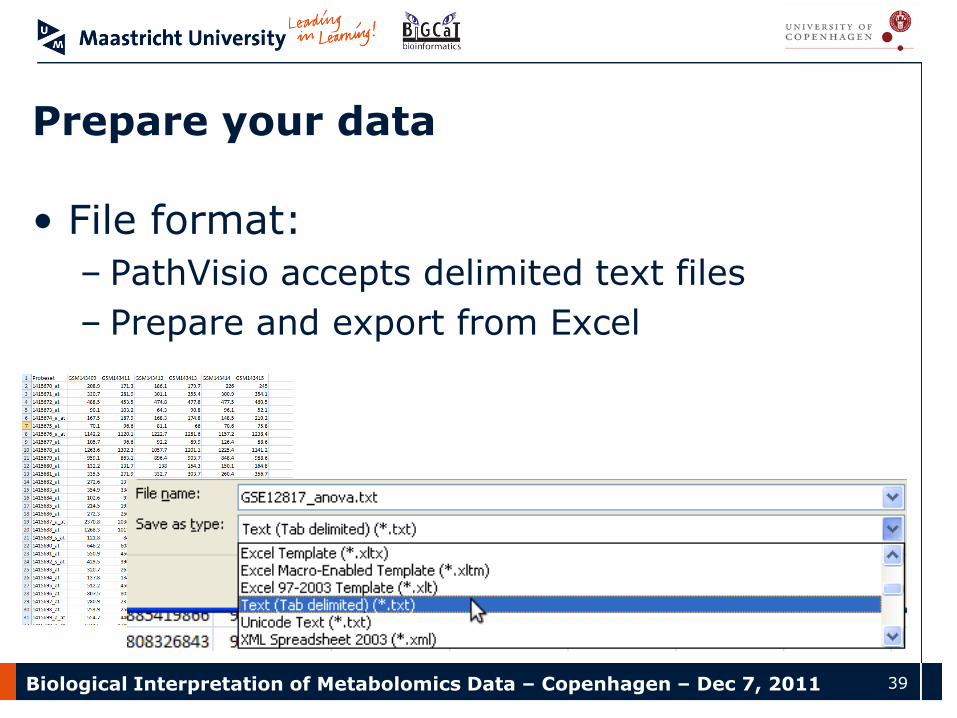
Prepare your data
• File format:
– PathVisio accepts delimited text files
– Prepare and export from Excel
Biological Interpretation of Metabolomics Data – Copenhagen – Dec 7, 2011 40
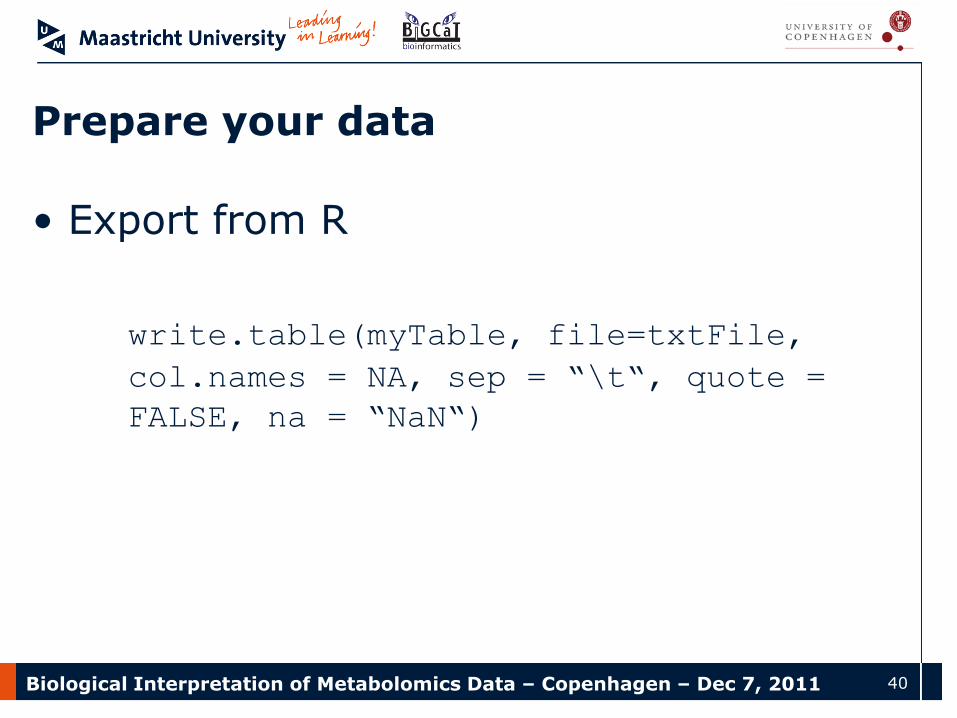
Prepare your data
• Export from R
write.table(myTable, file=txtFile,
col.names = NA, sep = “\t“, quote =
FALSE, na = “NaN“)
Biological Interpretation of Metabolomics Data – Copenhagen – Dec 7, 2011 41
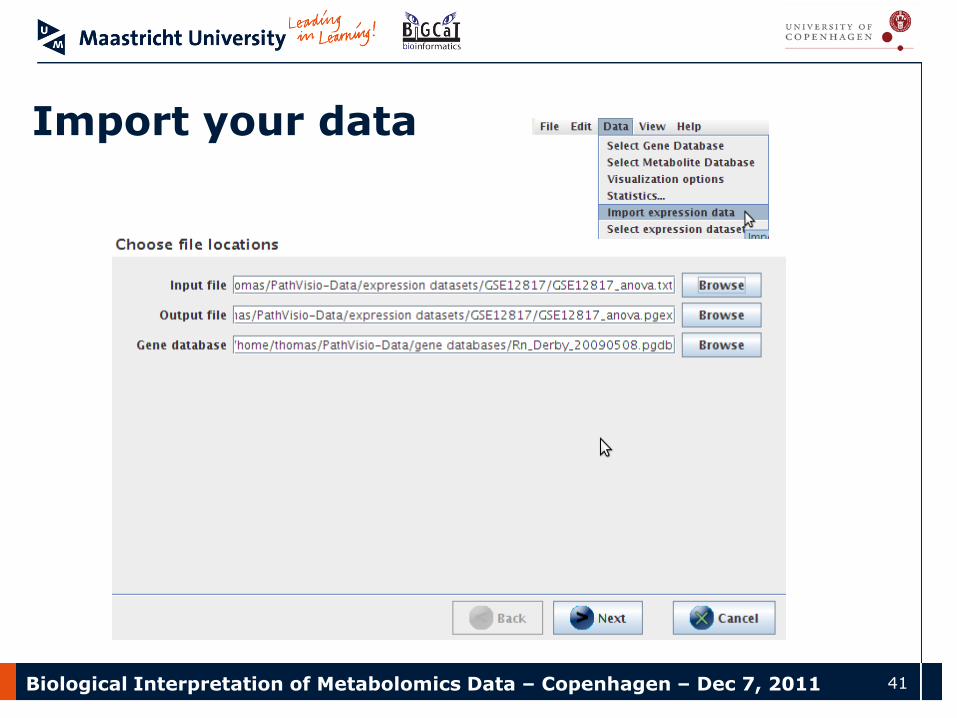
Import your data
Biological Interpretation of Metabolomics Data – Copenhagen – Dec 7, 2011 42
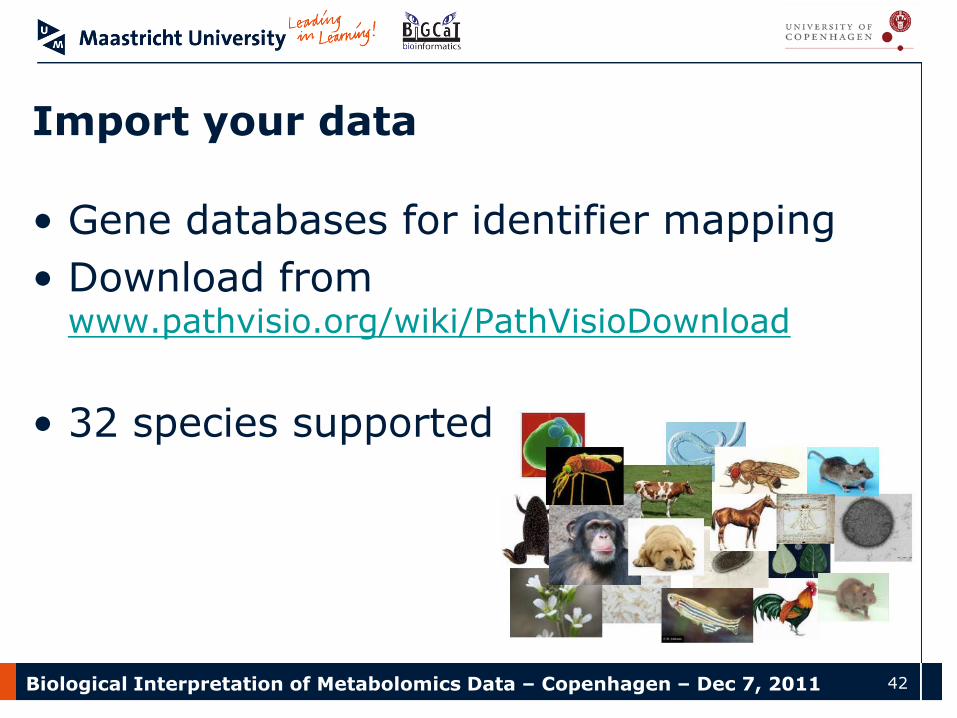
Import your data
• Gene databases for identifier mapping
• Download from www.pathvisio.org/wiki/PathVisioDownload
• 32 species supported
Biological Interpretation of Metabolomics Data – Copenhagen – Dec 7, 2011 43
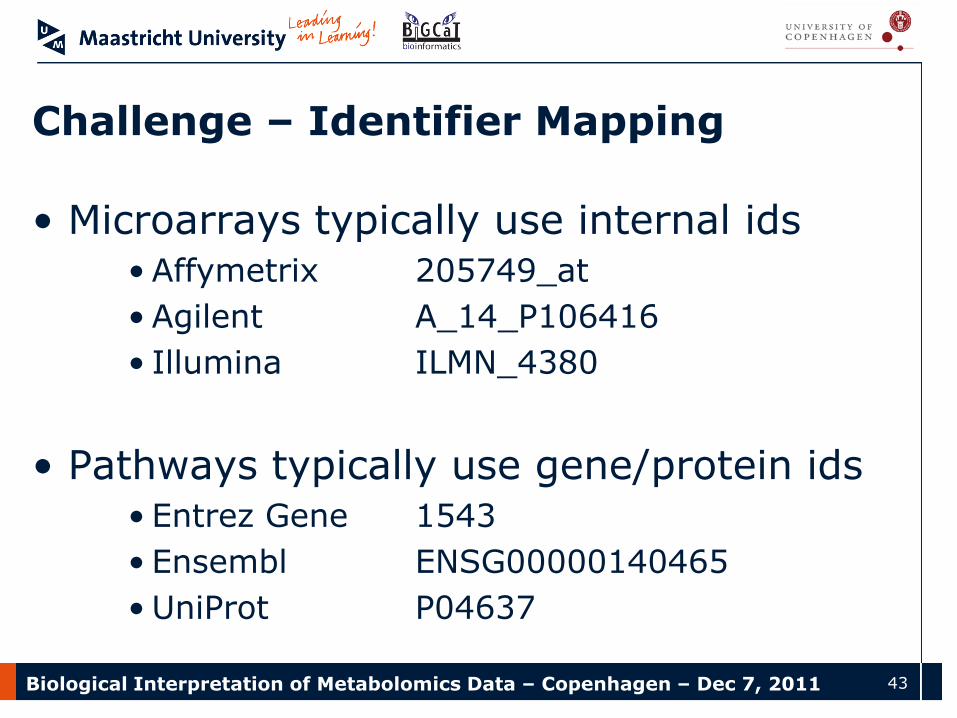
Challenge – Identifier Mapping
• Microarrays typically use internal ids• Affymetrix 205749_at
• Agilent A_14_P106416
• Illumina ILMN_4380
• Pathways typically use gene/protein ids• Entrez Gene 1543
• Ensembl ENSG00000140465
• UniProt P04637
Biological Interpretation of Metabolomics Data – Copenhagen – Dec 7, 2011 44
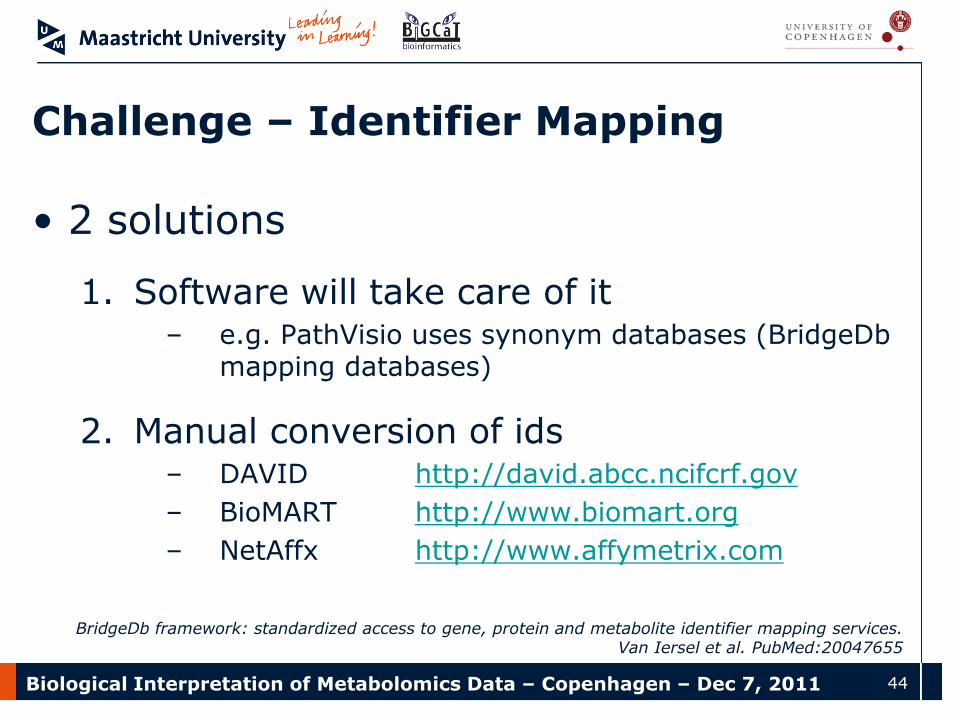
Challenge – Identifier Mapping
• 2 solutions
1. Software will take care of it– e.g. PathVisio uses synonym databases (BridgeDb
mapping databases)
2. Manual conversion of ids– DAVID http://david.abcc.ncifcrf.gov
– BioMART http://www.biomart.org
– NetAffx http://www.affymetrix.com
BridgeDb framework: standardized access to gene, protein and metabolite identifier mapping services. Van Iersel et al. PubMed:20047655

Biological Interpretation of Metabolomics Data – Copenhagen – Dec 7, 2011 45
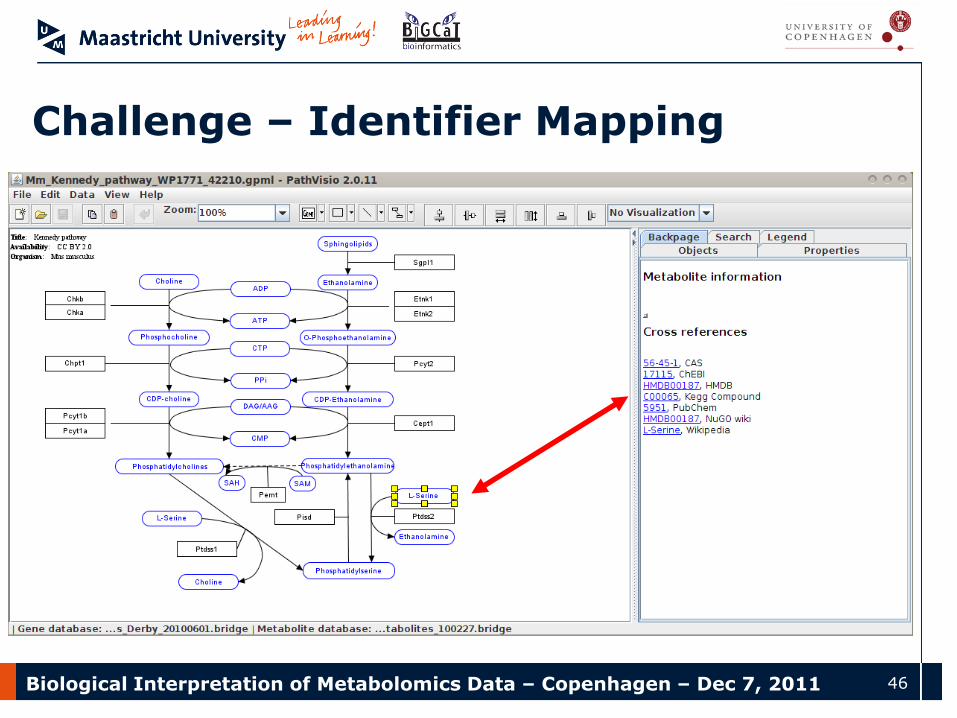
Challenge – Identifier Mapping
• Gene/metabolite databases in PathVisio?
1. User specifies one identifier for the element, e.g. 5951 in PubChem for L-Serine
2. Gene/metabolite database in PathVisio knows the identifier for this object in other databases, e.g. L-Serine has id 17115 in ChEBI
3. PathVisio shows all cross references in the backpage
4. The element is represented by any of the identifiers in the backpage
Biological Interpretation of Metabolomics Data – Copenhagen – Dec 7, 2011 46
Challenge – Identifier Mapping
Biological Interpretation of Metabolomics Data – Copenhagen – Dec 7, 2011 47
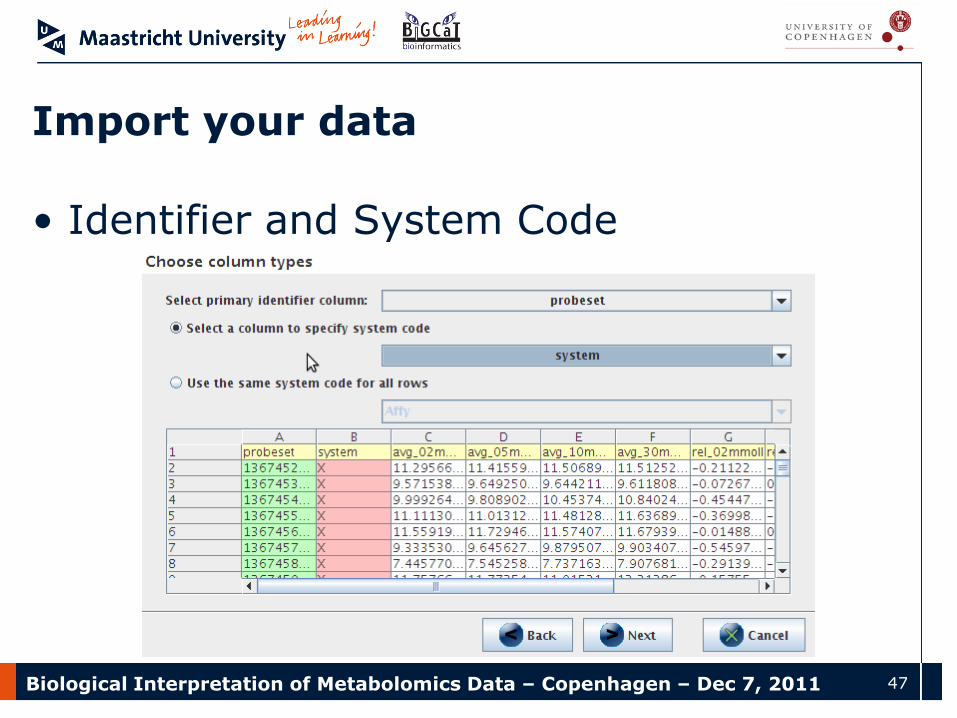
Import your data
• Identifier and System Code
Biological Interpretation of Metabolomics Data – Copenhagen – Dec 7, 2011 48
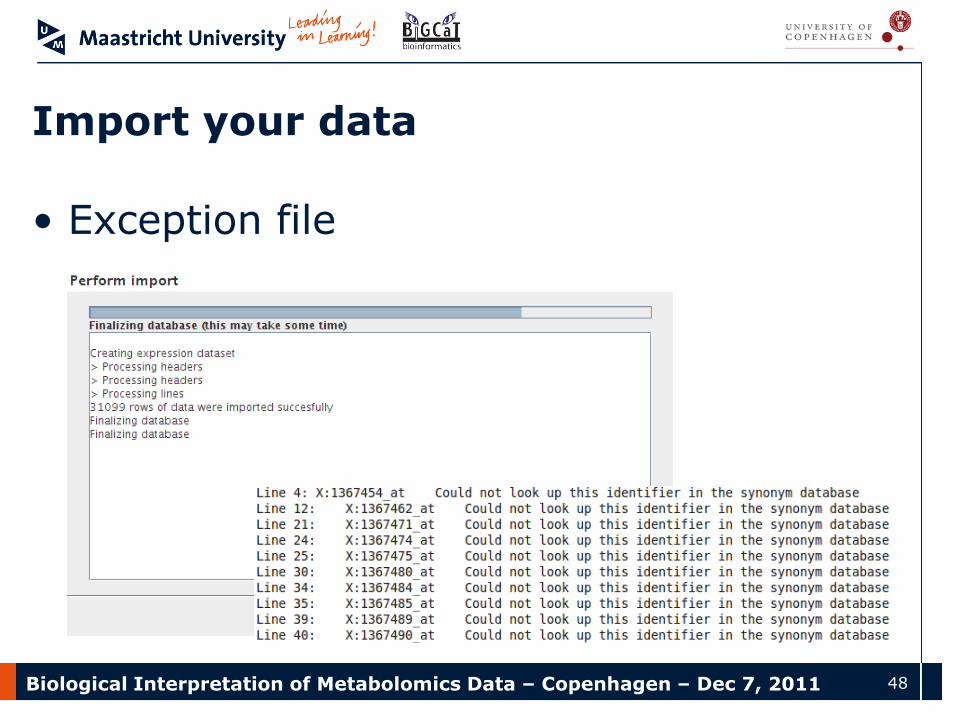
Import your data
• Exception file
Biological Interpretation of Metabolomics Data – Copenhagen – Dec 7, 2011 49
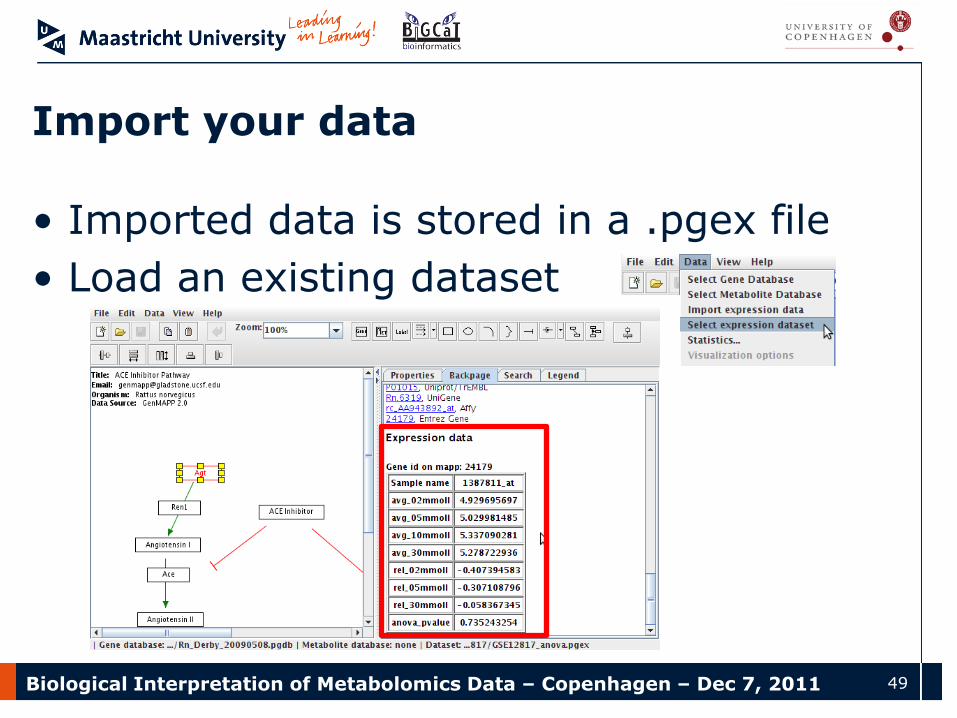
Import your data
• Imported data is stored in a .pgex file
• Load an existing dataset
Biological Interpretation of Metabolomics Data – Copenhagen – Dec 7, 2011 50
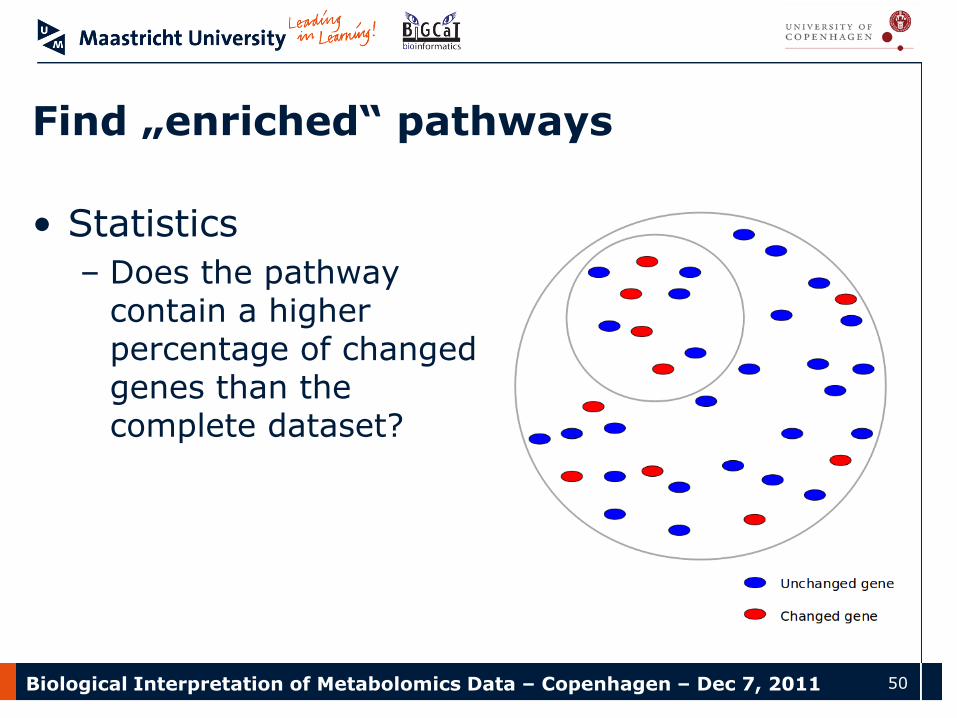
Find „enriched“ pathways
• Statistics
– Does the pathway contain a higher percentage of changed genes than the complete dataset?
Biological Interpretation of Metabolomics Data – Copenhagen – Dec 7, 2011 51
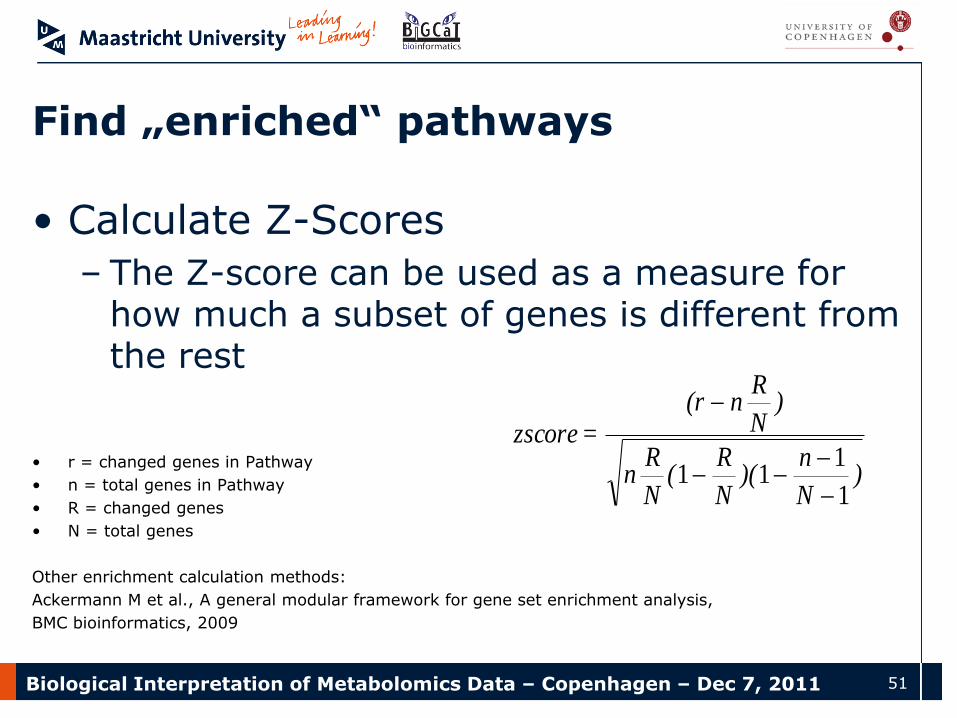
Find „enriched“ pathways
• Calculate Z-Scores
– The Z-score can be used as a measure for how much a subset of genes is different from the rest
• r = changed genes in Pathway
• n = total genes in Pathway
• R = changed genes
• N = total genes
Other enrichment calculation methods:
Ackermann M et al., A general modular framework for gene set enrichment analysis,
BMC bioinformatics, 2009
)N
n)(
N
R(
N
Rn
)N
Rn(r
=zscore
1
111
Biological Interpretation of Metabolomics Data – Copenhagen – Dec 7, 2011 52
Find „enriched“ pathways
• Z-Score is a method to rank pathways
– High Z-Score: Selection is very different from the rest of the dataset
– Z-Score = 0:Selection is not different at all
– Z-Score < 0:Selection is more stable than the rest
Biological Interpretation of Metabolomics Data – Copenhagen – Dec 7, 2011 53
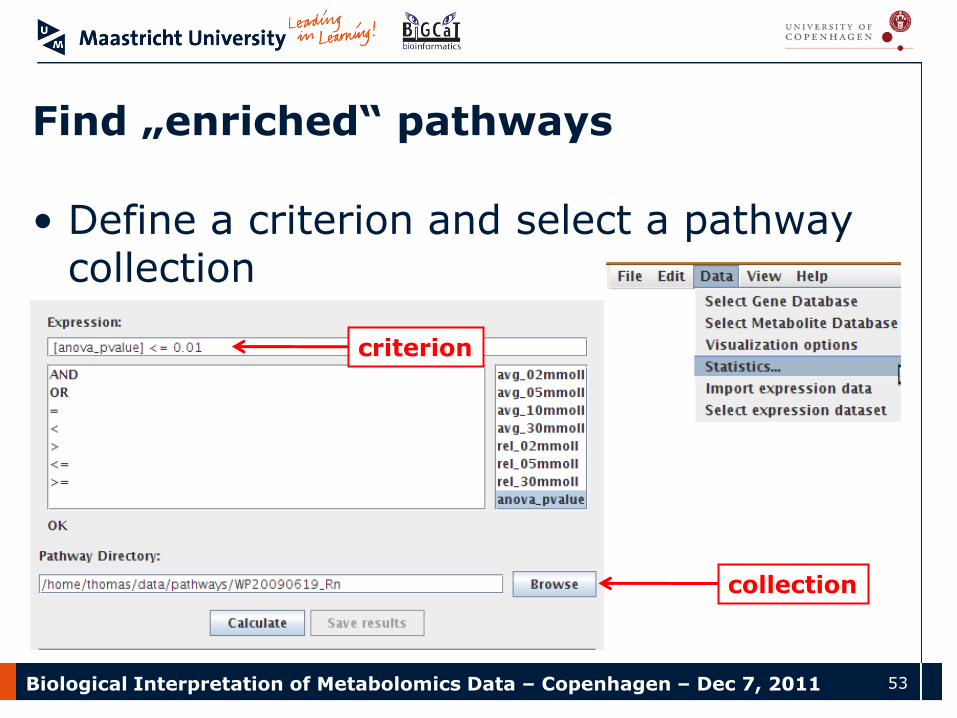
Find „enriched“ pathways
• Define a criterion and select a pathway collection
criterion
collection

Biological Interpretation of Metabolomics Data – Copenhagen – Dec 7, 2011 54
Find „enriched“ pathways
• Results
Biological Interpretation of Metabolomics Data – Copenhagen – Dec 7, 2011 55
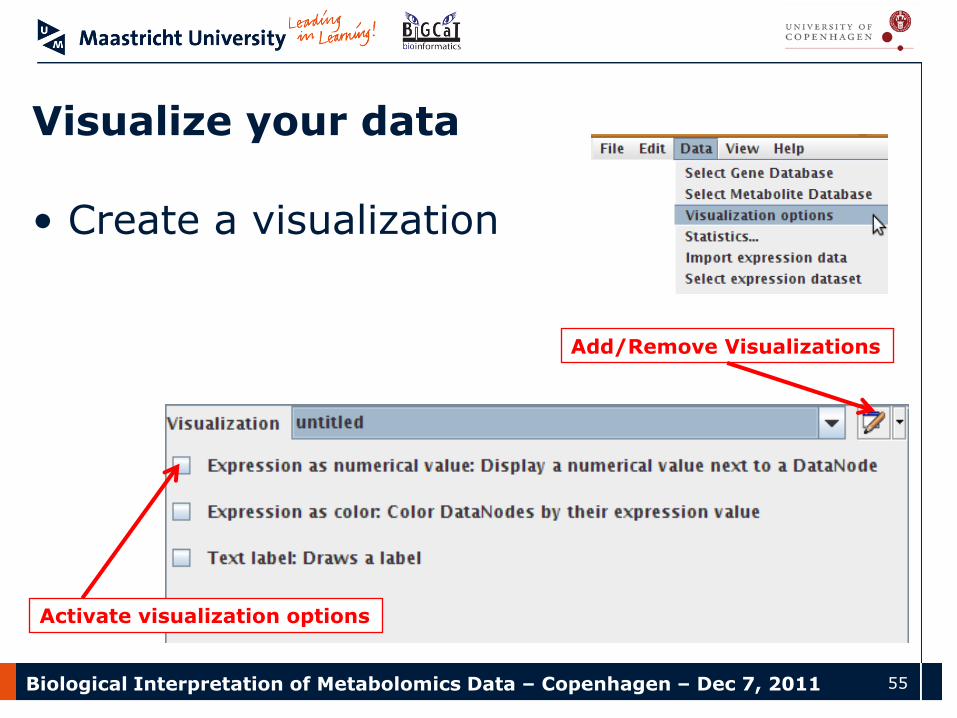
Visualize your data
• Create a visualization
Activate visualization options
Add/Remove Visualizations
Biological Interpretation of Metabolomics Data – Copenhagen – Dec 7, 2011 56
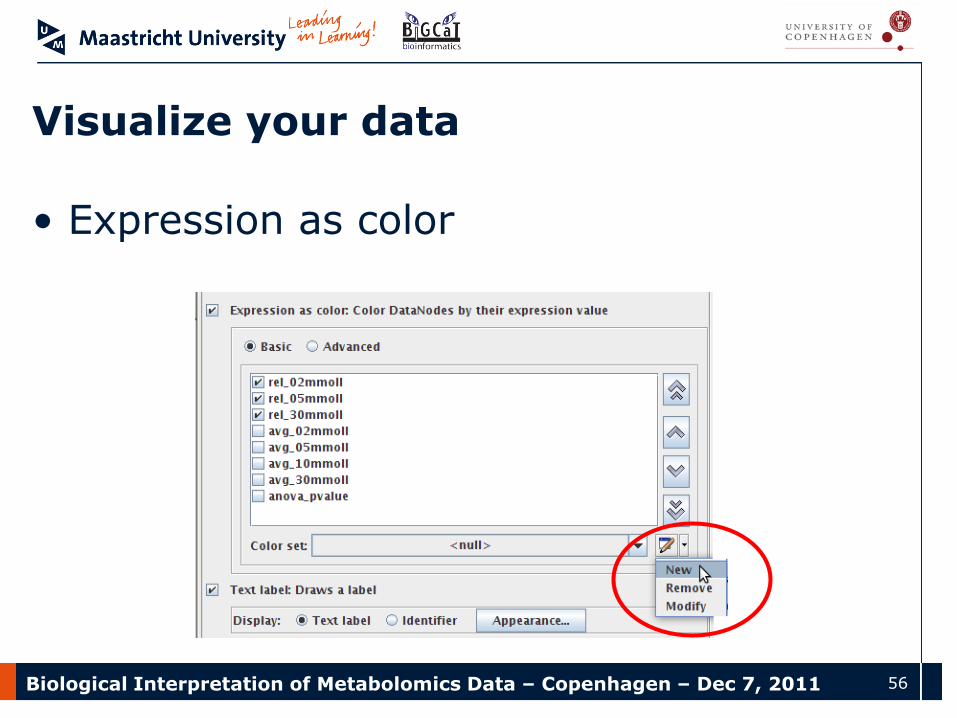
Visualize your data
• Expression as color
Biological Interpretation of Metabolomics Data – Copenhagen – Dec 7, 2011 57
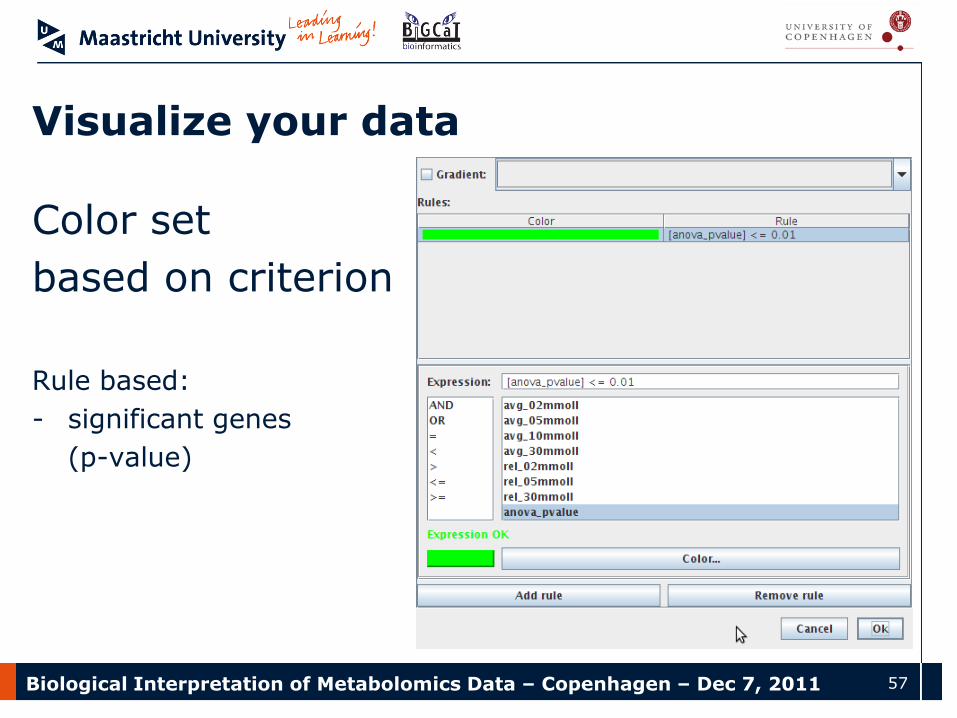
Visualize your data
Color set
based on criterion
Rule based:
- significant genes
(p-value)
Biological Interpretation of Metabolomics Data – Copenhagen – Dec 7, 2011 58
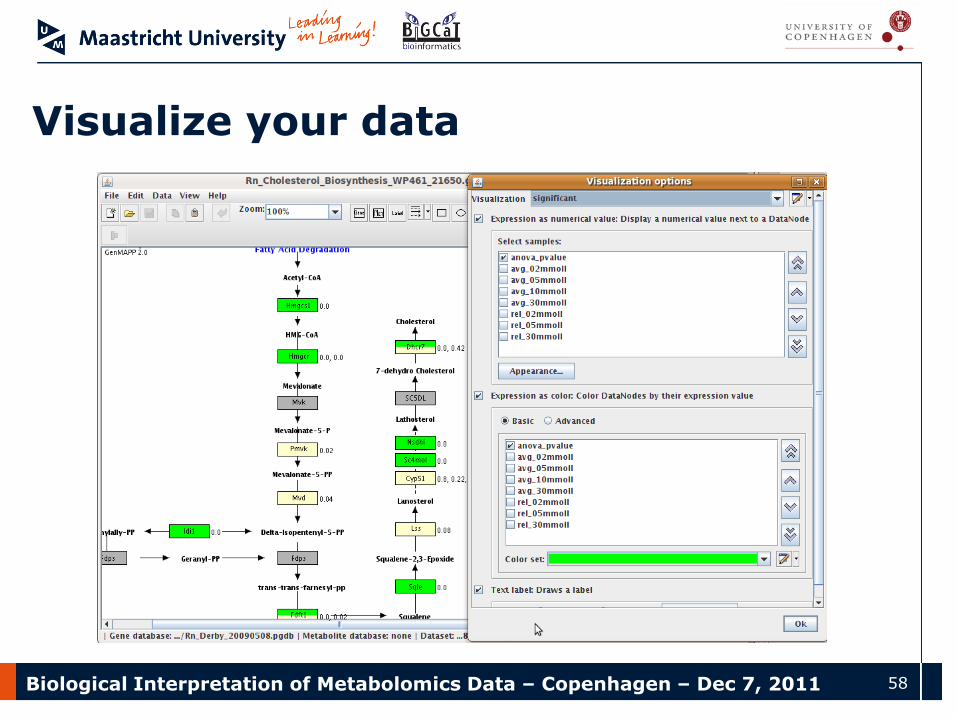
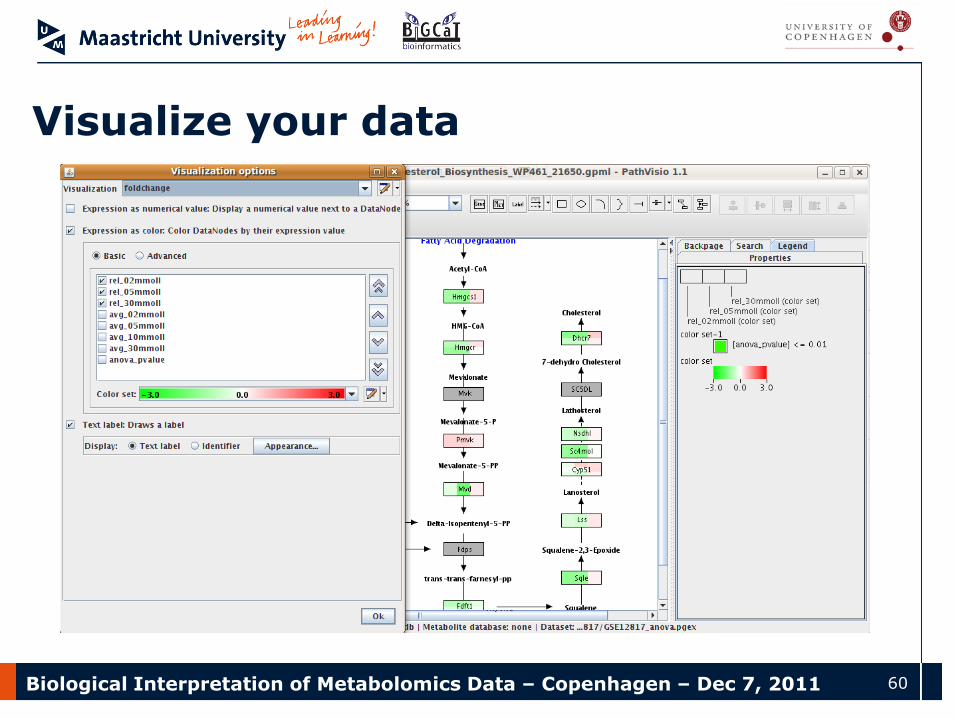
Visualize your data
Biological Interpretation of Metabolomics Data – Copenhagen – Dec 7, 2011 59
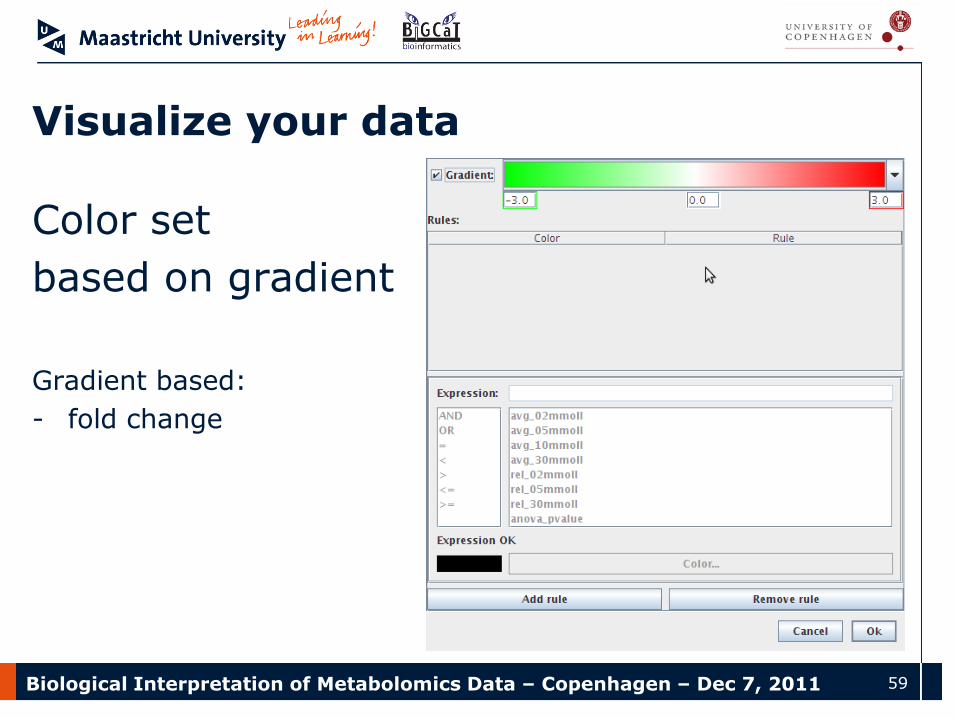
Visualize your data
Color set
based on gradient
Gradient based:
- fold change
Biological Interpretation of Metabolomics Data – Copenhagen – Dec 7, 2011 60
Visualize your data
Biological Interpretation of Metabolomics Data – Copenhagen – Dec 7, 2011 61
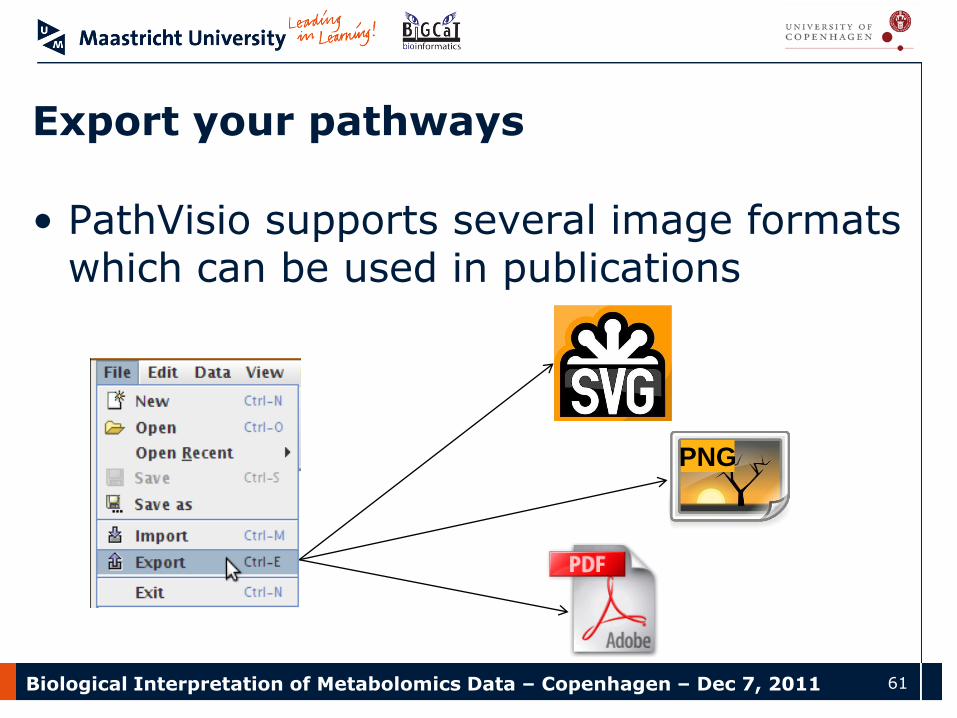
Export your pathways
• PathVisio supports several image formats which can be used in publications
PNG
Biological Interpretation of Metabolomics Data – Copenhagen – Dec 7, 2011 62
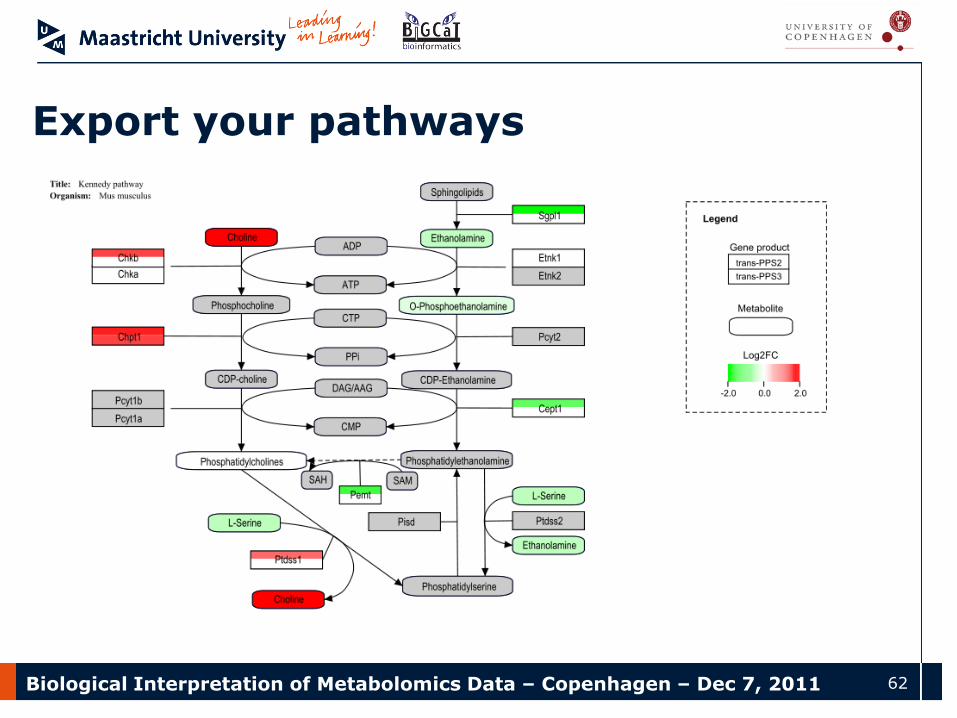
Export your pathways
Biological Interpretation of Metabolomics Data – Copenhagen – Dec 7, 2011 63
Acknowledgements
Martijn van IerselEBI, UK
Thomas KelderTNO, Zeist, NL
Bruce CollinsGladstone InstitutesSF, USA
Alex PicoGladstone InstitutesSF, USA
Kristina HanspersGladstone InstitutesSF, USA
Chris EveloMaastricht University, NL
… and many contributors around the world
Biological Interpretation of Metabolomics Data – Copenhagen – Dec 7, 2011 64
Questions?
Biological Interpretation of Metabolomics Data – Copenhagen – Dec 7, 2011 65
HANDS ON
Biological Interpretation of Metabolomics Data – Copenhagen – Dec 7, 2011 66
Dataset Description
• Liver samples from C57BL/6J mice
– 12 weeks of low- and high-fat feeding
– Samples from two intervention studies within NUGO
• Transcriptomics, proteomics and metabolomics technologies
• Goal: characterization of molecular changes that promote hepatic steatosis
Biological Interpretation of Metabolomics Data – Copenhagen – Dec 7, 2011 67
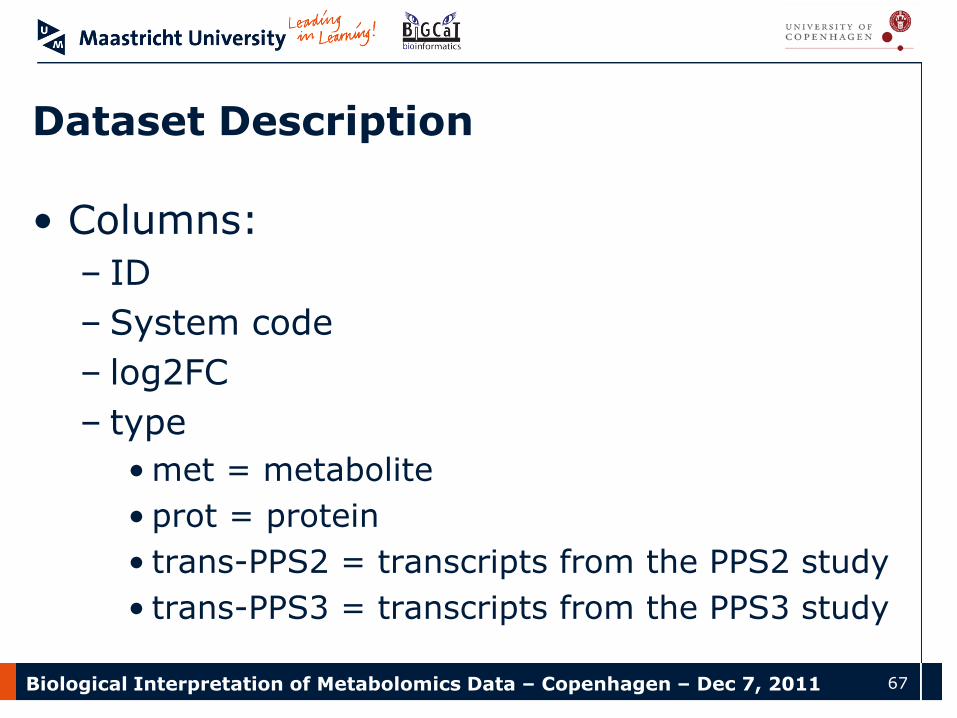
Dataset Description
• Columns:
– ID
– System code
– log2FC
– type
• met = metabolite
• prot = protein
• trans-PPS2 = transcripts from the PPS2 study
• trans-PPS3 = transcripts from the PPS3 study
Biological Interpretation of Metabolomics Data – Copenhagen – Dec 7, 2011 68
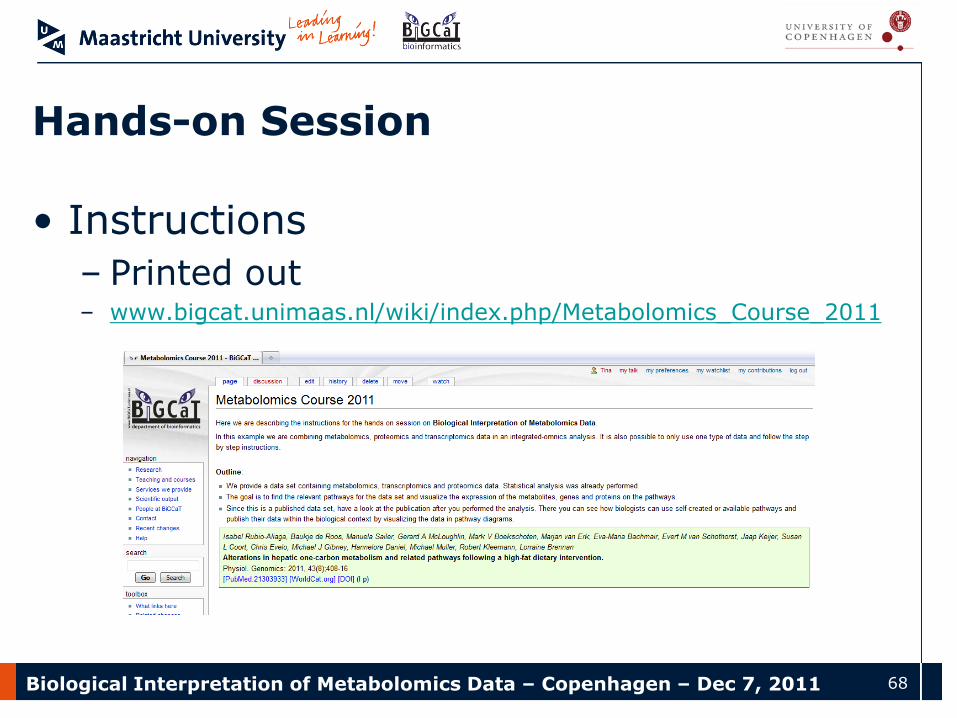
Hands-on Session
• Instructions
– Printed out– www.bigcat.unimaas.nl/wiki/index.php/Metabolomics_Course_2011
Biological Interpretation of Metabolomics Data – Copenhagen – Dec 7, 2011 69
Contact Details
• Questions?
1. Subscribe to the mailing listwww.pathvisio.org/wiki/MailingLists
2. Contact me [email protected]