biol 300: fundamentals of biostatisticsirwin/biol300/wp-content/uploads/2013/... · other ubc...
TRANSCRIPT

BIOL 300: Fundamentals of Biostatistics
Course web address:
http://www.zoology.ubc.ca/~irwin/irwinlab/BIOL300/
Instructor: Dr. Darren Irwin
Statistics: possibly the most important subject you study at UBC
• Statistics is about how we can use data to infer something about Truth, while taking into account Uncertainty.
• Applicable in all fields. • Vital for scientists, especially biologists (and
doctors). • Understanding of statistical principles is
important for everyone. – Making decisions (e.g. medical / safety /
environmental / purchasing) – Interpreting news reports

BIOL 300: Fundamentals of Biostatistics
Course web address:
http://www.zoology.ubc.ca/~irwin/irwinlab/BIOL300/
Instructor:
Darren Irwin (Associate Professor, Dept. of Zoology)
Office: 209 Biodiversity (Beaty Biodiversity Research Centre)
e-mail: [email protected]

Speciation in birds: lots of statistics!
Genes, plumage, body shape, habitat, migration Also: population trends (for conservation)
Office hours: Tues. 1:30-3:00 (Biodiversity 209)
and after class most days
Please feel free to ask questions during class

Teaching Assistants
• Sarah Amundrud
• Heather Kharouba
• Becca Kordas
• Alana Schick
• Ruth Sharpe
Please: Respect the TA’s; Respect each other.
Respect each other
Please do: – Come to class ready to think about
statistics. – Ask questions during class.
Please don’t: – Distract your fellow students.
(e.g., texting, killing aliens, having conversations)

Textbook
• Whitlock and Schluter (2009) The Analysis of Biological Data.
Lab manual
• Available for about $10 at Copiesmart in the UBC Village (near McDonald’s)
• Available at course web site

Lab
• Begins third week of term (January 14-18)
• BioSciences room 2078
• Attendance is highly recommended (but technically optional for some labs)
• Great opportunity for learning from TAs, using JMP, and for doing two lab assignments.
JMP
• Statistical software for PCs and Macs • Used in the labs
• You might be interested in using this on your own computer (optional, and free for BIOL 300 students). See the course website for details.

Evaluation
Homework assignments 10% Lab assignments 10% Mid-term 30% Final 50%
Homework Assignments • Question are in textbook (numbers will
be listed on website) • Due on Fridays at noon, at your TA’s
office
• Intended to help you learn
• First assignment due Jan. 11th: – Chapter 1, problems 10, 12, 14, 16. – Chapter 2, problems 14, 20, 25.

Midterm
March 1 (Friday), in class
Wait list
• If you are on the wait list, chances are good that you can take the course (but no promises now).
• If you are not registered, try to register for the wait list. If not successful, email me.
• If you do not want to take the course, please de-register yourself (make room for others).

Other UBC Statistics Courses
• Credit given for only one of BIOL 300, FRST 231, STAT 200, PSYC 218 or 366.
These are paired with BIOL 300, but do not count as biology courses
Introduction to statistics
Statistics is "a quantitative technology for empirical science; it is a logic and methodology for the measurement of uncertainty and for an examination of that uncertainty." The key word here is "uncertainty." Statistics become necessary when observations are variable.

Goals of statistics
• Estimate the values of important parameters
• Test hypotheses about those parameters
Parameter: a characteristic of a population.
Statistics is also about good scientific practice

Feline High-Rise Syndrome (FHRS)
The injuries associated with a cat falling out of a window.
“The diagnosis of high-rise syndrome is not difficult. Typically, the cat is found outdoors, several stories below, and a nearby window or patio door is open.”
http://www.petplace.com/cats/highrise-syndrome-in-cats/page1.aspx

High falls reported to show lower injury rates
Whitney and Mehloff, Journal of the American Veterinary Medicine Association, 1987
Why? 1. Cats have high surface-to-volume ratios 2. Cats have excellent vestibular systems 3. Cats reach terminal velocity quickly, relax,
and therefore absorb impact better 4. Cats land on their limbs and absorb shock
through soft tissue Jared Diamond, Nature 1988

Or not…
Sample of convenience: a collection of individuals that happen
to be available at the time.

A newer study reports more injuries with longer falls
Vnuk et al. 2004. Feline high-rise syndrome: 119 cases (1998-2001). J. Fel. Med. Surg. 6:305-312.
FHRS illustrates importance of:
• Unbiased sample • Large sample size • Replication of studies • Careful choice of variables measured • Careful interpretation of data

Let’s collect some data . . . On an index card, please write (all anonymous and
optional): a) Your height (indicate inches or cm) b) Number of siblings you have (count half sibs as half) c) # of cups of coffee consumed in past week d) Your writing hand (left/right/other) e) Length of your commute this morning (in minutes) f) Type of transportation used today (e.g., walk, bike,
car, bus) g) Your weight (indicate lbs or kg) h) A random number between 0 and 101 i) Your sex (M/F/other)
Variables and Data
• A variable is a characteristic measured on individuals drawn from a population under study.
• Data are measurements of one or more variables made on a collection of individuals.

Explanatory and response variables
We try to predict or explain a response variable from an explanatory variable.
Older terminology: dependent variable and independent variable
Mortality on the Titanic, as predicted by sex

Populations and samples
Populations <-> Parameters; Samples <-> Estimates
Estimates almost always differ from Parameters, for a variety of reasons . . .
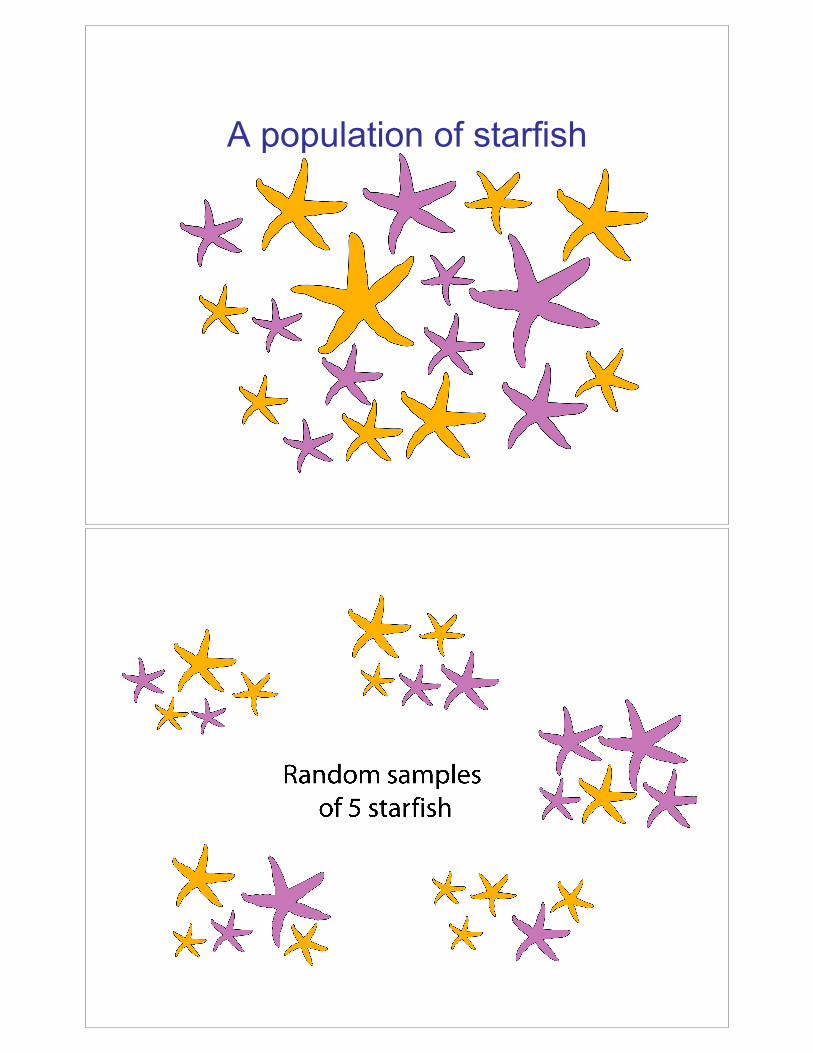
A population of starfish

A biased sample
Bias is a systematic discrepancy between an estimate and the true
population characteristic.

The 1936 US presidential election
vs.
Alf Landon Republican
Franklin Roosevelt Democrat
1936 Literary Digest Poll
• 2.4 million respondents
• Based on questionnaires mailed to 10 million people, chosen from telephone books and club lists
• Predicted Landon wins: Landen 57% over Roosevelt 43%

1936 election results
Roosevelt won with 62% of the vote
What went wrong?
Subjects given the questionnaire were chosen from telephone books and clubs, biasing the respondents to be those with greater wealth
Voting and party preference is correlated
with personal wealth

Volunteer bias
Volunteers for a study are likely to be different, on average, from the population
For example: – Volunteers for sex studies are more likely
to be open about sex – Volunteers for medical studies may be
sicker than the general population
Precise Imprecise
Biased
Unbiased
Each point represents an estimate of a parameter.

Properties of a good sample
• Random selection of individuals (each individual has equal probability of being selected)
• Independent selection of individuals
• Sufficiently large
In a random sample, each member of a population has an equal and independent
probability of being selected.

One procedure for random sampling
Population parameters are constants whereas estimates
are random variables, changing from one random sample to the next from the
same population.

Sampling error
• The chance difference between an estimate and the population parameter being estimated.
(note that sampling bias is not included here)
The good news: We can estimate the magnitude of sampling error using properties of the sample.
Bias is a systematic discrepancy between an estimate and the true
population characteristic.

Estimates (from samples) differ from Parameters (of populations) for four reasons:
“Bias” “Error”
Property of individuals
Measurement bias
Measurement error
Property of sample
Sampling bias
Sampling error
This is the main focus of Statistics
Larger samples on average will have smaller sampling
error

Average = 169.5
154
Larger samples tend to have less sampling error

Good samples are a foundation of good science
• When thinking about any study, one should always ask “How were the data collected?”
“B.C. residents support Northern Gateway pipeline project: poll”
Headline from the Vancouver Sun on January 5th, 2012:
The Ipsos-Reid press release: http://www.ipsos-na.com/news-polls/pressrelease.aspx?id=5460

You must think carefully about what population is being sampled • All cats falling out of windows vs.
survivors being brought into vets • American voters vs. Americans who
have telephones who respond to survey through mail
• British Columbians vs. British Columbians willing to fill out online survey