biol 109 laboratory two dna fingerprinting – real csi …web.mnstate.edu/marryand/biol...
TRANSCRIPT
BIOL 109
Laboratory Two
DNA Fingerprinting – Real CSI stuff!
Introduction Technicians working in forensic labs are often asked to do DNA profiling or “fingerprinting” to
analyze evidence in law enforcement cases and other applications1. DNA fingerprinting may
involve polymerase chain reaction (PCR2 ) amplification to analyze minute quantities of DNA or
restriction fragment length polymorphism (RFLP3) analysis, if large amounts of DNA are
recovered. A step in human RFLP analysis requires the student to compare band patterns
produced by cleavage of DNA samples when separated on an agarose gel. The patterns in this
exercise are produced from one sample that represents DNA taken at the crime scene and five
samples obtained from suspects in the case. It may be important for you to point out to your
students that this laboratory exercise models the more elaborate technique that is performed on
complex human DNA samples.
Restriction Enzymes A restriction enzyme acts like molecular scissors, making cuts at specific sequence of base pairs
that is recognizes. A restriction enzyme sits on a DNA molecule and slide along the helix until it
recognizes specific sequences of base pairs that signals the enzyme to stop sliding. The enzyme
then cuts or chemically separates the DNA molecule at that site—called a restriction site.
If a specific restriction site occurs in more than one location on a DNA molecule, a
restriction enzyme will make a cut at each of those sites, resulting in multiple fragments.
Therefore, if a given linear piece of DNA is cut with a restriction enzyme whose specific
recognition code is found at two different locations on the DNA molecule, the result will be three
fragments of different lengths. If the given piece of DNA is circular and is cut with a restriction
enzyme whose specific recognition code is found at two different locations on the DNA
molecule, the result will be two fragments of different lengths. The length of each fragment will
depend upon the location of restriction sites on the DNA molecule.
When restriction enzymes are used to cut strands of circular plasmid DNA, such as the
samples included in this kit, fragments of varying sizes are produced. DNA that has been cut
with restriction enzymes can be separated and observed using a process known as agarose gel
electrophoresis. The term electrophoresis means to carry with electricity.
Agarose Gel Electrophoresis Agarose gel electrophoresis separates DNA fragments by size. DNA fragments are loaded into
an agarose gel slab, which is placed into a chamber filled with a conductive buffer solution. A
direct current is passed between wire electrodes at each end of the chamber. Since DNA
fragments are negatively charged, they will be drawn toward the positive pole (anode) when
placed in an electric field. The matrix of the agarose gel acts as a molecular sieve through which
smaller DNA fragments can move more easily than larger ones. Therefore, the rate at which a
DNA fragment migrates through the gel is inversely proportional to its size in base pairs. Over a
period of time, smaller DNA fragments will travel farther than larger ones. Fragments of the
same size stay together and migrate in single bands of DNA. These bands will be seen in the gel
after the DNA is stained.
An analogous situation is one where all the desks and chairs in the classroom have been
randomly pushed together. An individual student can wind his/her way through the maze quickly
and with little difficulty, whereas a string of four students would require more time and have
difficulty working their way through the maze.
DNA Fingerprinting Each person has similarities and differences in DNA sequences. To show that a piece of DNA
contains a specific nucleotide sequence, a radioactive complementary DNA probe can be made
that will recognize and bind that sequence. Radioactive probes allow molecular biologists to
locate, identify, and compare the DNA of different individuals. This probe can be described as a
"radioactive tag" that will bind to a single stranded DNA fragment and produce a band in a gel or
a band on a piece of nylon blotting membrane that is a replica of the gel (also known as a
Southern blot). Because of its specificity, the radioactive probe can be used to demonstrate
genotypic similarities between individuals. In DNA fingerprinting, the relative positions of radio
labeled bands in a gel are determined by the size of the DNA fragments in each band. The size of
the fragments reflects variations in individuals’ DNA.
The evidence needed for DNA fingerprinting can be obtained from any biological
material that contains DNA: body tissues, body fluids (blood and semen), hair follicles, etc. The
DNA analysis can even be done from dried material, such as blood stains or mummified tissue. If
a sample of DNA is too small it may be amplified using PCR techniques. The DNA is then
treated with restriction enzymes that cut the DNA into fragments of various length4.
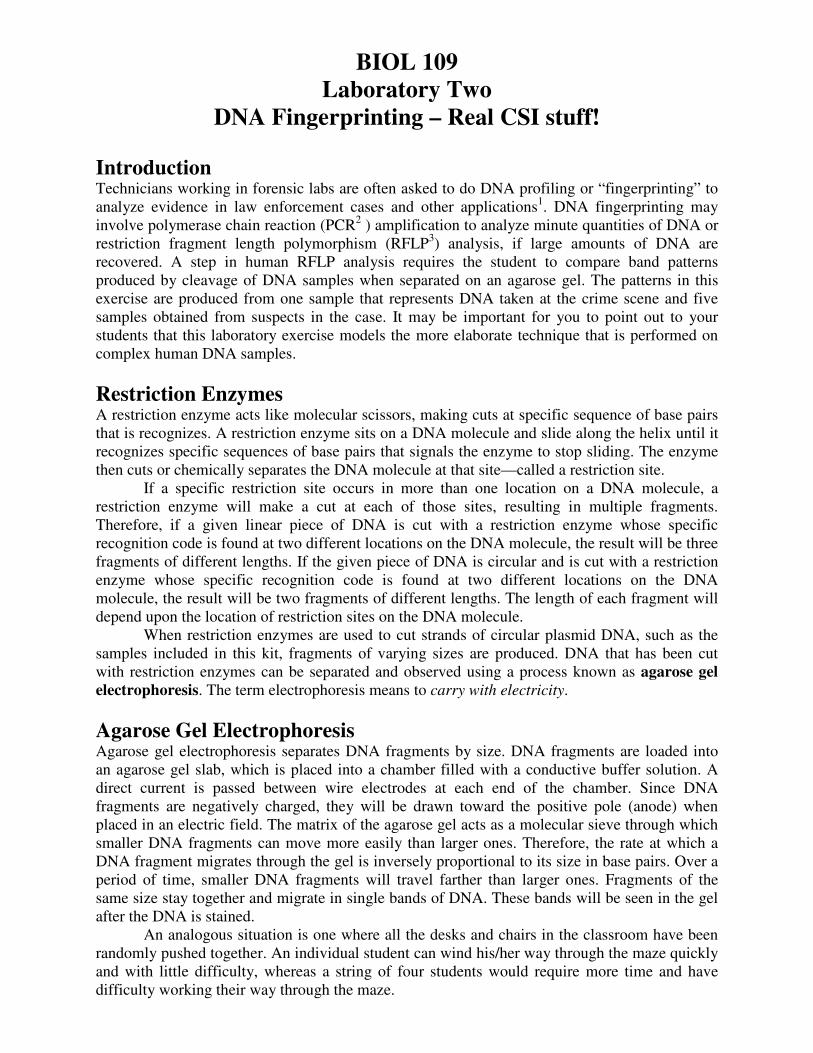
Restriction Digestion of DNA Because they cut DNA, restriction enzymes are the "chemical scissors" of the molecular
biologist. When a particular restriction enzyme "recognizes" a particular four - or six –base pair
(bp) recognition sequence on a segment of DNA, it cuts the DNA molecule at that point. The
recognition sequences for two commonly-used enzymes, EcoRI and PstI, are shown below. The
place on the DNA backbones where the DNA is
actually cut is shown with a ( ) symbol:
For the enzyme EcoRI
For the enzyme PstI
Like all enzymes, restriction enzymes function best under specific buffer and temperature
conditions. The proper restriction enzyme buffer has been included with the DNA sample, so that
when the rehydrated DNA and enzymes are mixed, the ideal conditions are created for the
enzymes to function optimally. The final reaction buffer consists of 50 mM Tris, 100 mM NaCl,
10 mM MgCl2, 1 mM DDT, pH 8.0, which is the ideal condition for EcoRI and PstI enzymes to
function.
Making DNA Visible DNA is colorless so DNA fragments in the gel cannot be seen during electrophoresis. A loading
dye containing two blue dyes is added to the DNA solution. The loading dye does not stain the
DNA itself but makes it easier to load the gels and monitor the progress of the DNA
electrophoresis. The dye fronts migrate toward the positive end of the gel, just like the DNA
fragments. The “faster” dye comigrates with DNA fragments of approximately 500 bp, while the
“slower” dye comigrates with DNA fragments approximately 5 kb in size. Staining the DNA
pinpoints its location on the gel. When the gel is immersed in Fast Blast DNA stain, the stain
molecules attach to the DNA trapped in the agarose gel. When the bands are visible, your
students can compare the DNA restriction patterns of the different samples of DNA.
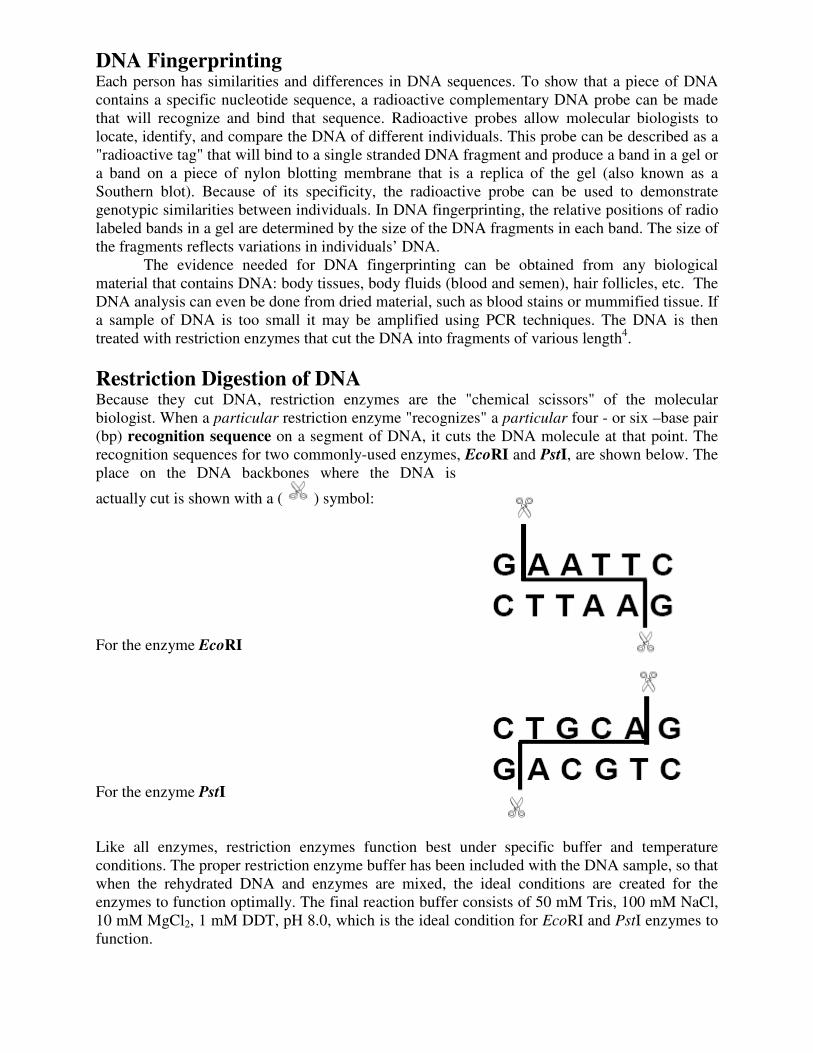
The gel below shows the DNA pattern that will be obtained by your students following
electrophoresis. The DNA from the crime scene has been labeled CS, that from Suspect #1, S1
and so on. The DNA from the crime scene is placed in lane 2; one suspect’s DNA is placed in
each of lanes 3, 4, 5, 6 and 7. Lane 1 contains HindIII lambda digest (DNA size markers). By
convention, the lanes are numbered from the top left. The students’ task is to look at the DNA
banding patterns and see if any of the suspects’ bands match those of the DNA found at the
crime scene.
It’s easy to see that the DNA taken from the crime scene and the DNA from S3 are identical.
You may want to point out how “strong” or “weak” this evidence is in convicting a suspect. The
DNA evidence may place the suspect at the scene, but other evidence may be needed to prove
him or her guilty!5,6
This is a simulation. In actual DNA fingerprinting, technicians analyze much larger
segments of DNA and many more bands and lanes are produced.

Reliability of DNA Evidence Two major factors affecting the reliability of DNA fingerprinting technology in forensics are
population genetics and genetic statistics. In humans there are thousands of RFLP loci or DNA
segments that can be selected and used for fingerprinting analysis. Depending on demographic
factors such as ethnicity or geographic isolation, some segments will show more variation than
others.
Some populations show much less variation in particular DNA segments than others.
The degree of variation will affect the statistical odds of more than one individual having the
same sequence. If 90% of a given population has the same frequency in its DNA fingerprinting
pattern for a certain DNA segment, then very little information will be attained. But if the
frequency of a DNA pattern turning up in a population for a particular segment is extremely low,
then this segment can serve as a powerful tool to discriminate between individuals in that
population. Different populations show different patterns in their genotypes due to the
contributions made to their individual gene pools over time.
Therefore, in analyzing how incriminating the DNA evidence is, one needs to ask the
question:
“Statistically, how many people in a population may have the same pattern as that taken from a
crime scene: 1 in 1,000,000? 1 in 10,000? Or, 1 in 10?”
References 1. DNA Profiling Fast Becoming Accepted Tool For Identification, Pamela Zurer, Chemical and
Engineering News, Oct. 10, 1994.
2. PCR means polymerase chain reaction; it is a technique used to amplify small amounts of
DNA (in this case so that further analysis of the DNA can occur).
3. RFLP means restriction fragment length polymorphisms..."riff-lips" in biotech jargon...Pieces
of DNA are cut with restriction enzymes into fragments of various lengths. Individuals possess
variable restriction recognition sites so that two pieces of DNA from separate sources may have
different fragment lengths when their DNA is cut by the same enzyme.
4. An excellent resource for the classroom teacher is Genetic Fingerprinting, Pauline Lowrie and
Susan Wells, New Scientist, 16 November 1991.
5. Is DNA Fingerprinting ready for the courts?, William C. Thompson and Simon Ford, New
Scientist, March 31, 1990.
6. When Science Takes the Witness Stand, Peter Neufeld and Nevelle Coleman, Scientific
American, Vol. 262: 5, May 1990.
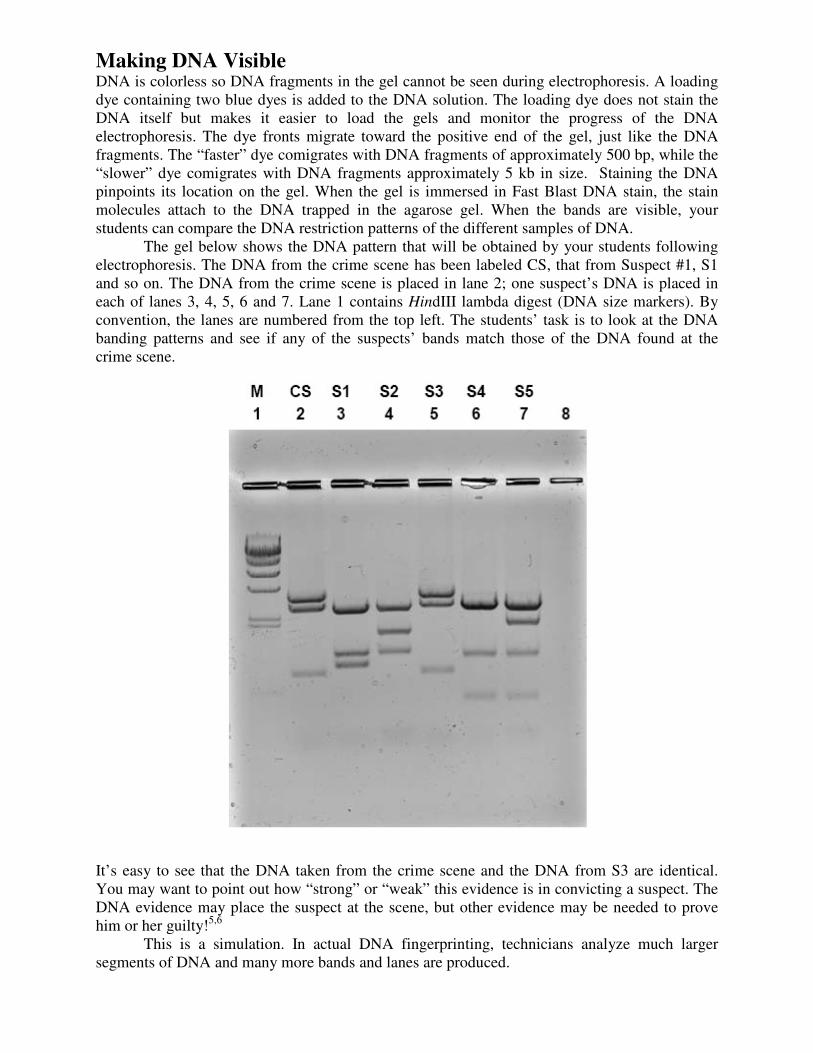
Restriction Digestion 1. Place the tube containing the restriction
enzyme mix, labeled ENZ, on ice.
2. Label one of each colored micro test
tubes as follows:
green tube CS (crime scene)
blue tube S1 (suspect 1)
orange tube S2 = suspect 2
violet tube S3 = suspect 3
red tube S4 = suspect 4
yellow tube S5 = suspect 5
Label the tubes with your name, date,
and lab period. Place the tubes in the
foam micro test tube holder.
3. Using a fresh tip for each sample,
pipette 10µl of each DNA sample from
the stock tubes and transfer to the
corresponding colored micro test
tubes. Make sure the sample is
transferred to the bottom of the tubes.
4. Pipet 10 µl of enzyme mix (ENZ) into
the very bottom of each tube. Use a
fresh tip to transfer the ENZ sample to
each tube.
5. Tightly cap the tubes and mix
the components by gently flicking
the tubes with your finger. If a
microcentrifuge is available, pulse spin
in the centrifuge to collect all the
liquid in the bottom of the tube.
Otherwise, gently tap the tube on
the table top.
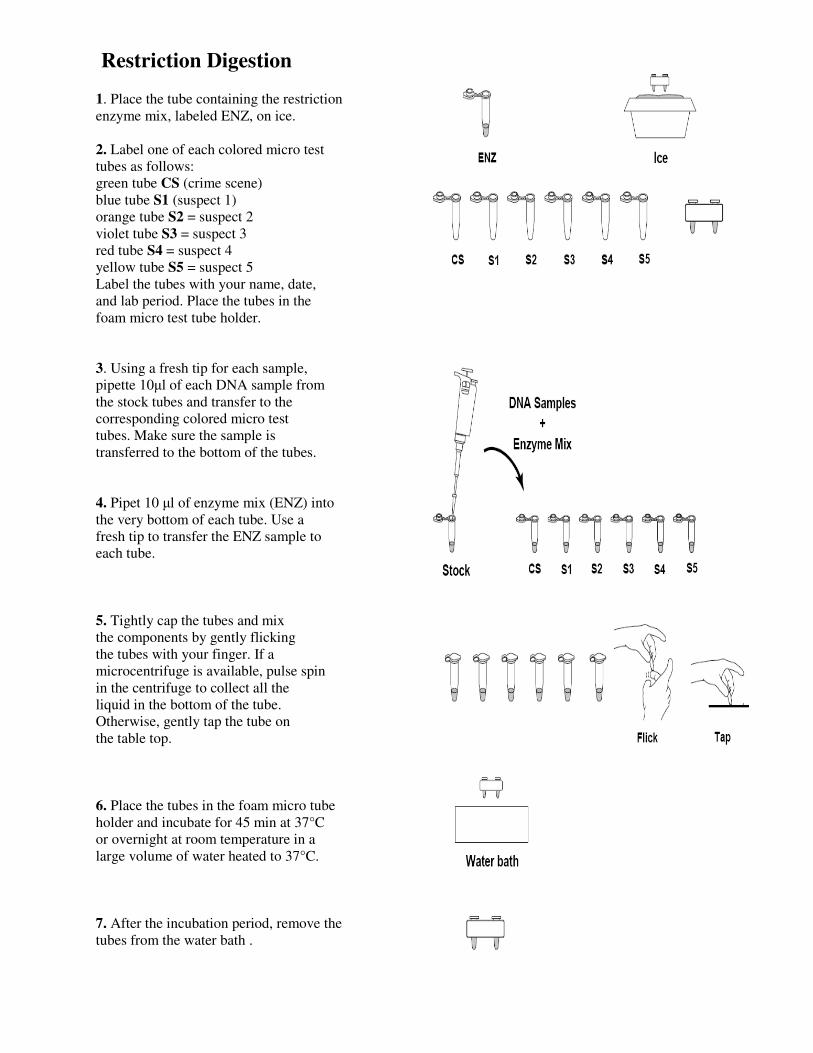
6. Place the tubes in the foam micro tube
holder and incubate for 45 min at 37°C
or overnight at room temperature in a
large volume of water heated to 37°C.
7. After the incubation period, remove the
tubes from the water bath .
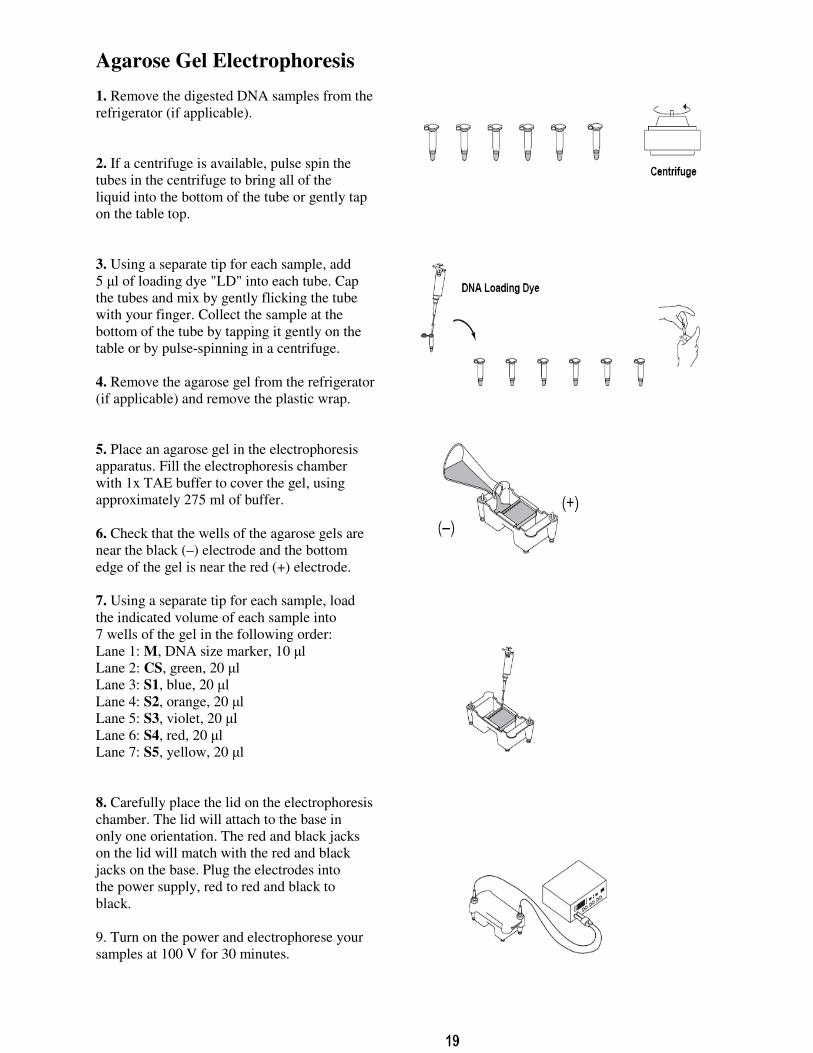
Agarose Gel Electrophoresis
1. Remove the digested DNA samples from the
refrigerator (if applicable).
2. If a centrifuge is available, pulse spin the
tubes in the centrifuge to bring all of the
liquid into the bottom of the tube or gently tap
on the table top.
3. Using a separate tip for each sample, add
5 µl of loading dye "LD" into each tube. Cap
the tubes and mix by gently flicking the tube
with your finger. Collect the sample at the
bottom of the tube by tapping it gently on the
table or by pulse-spinning in a centrifuge.
4. Remove the agarose gel from the refrigerator
(if applicable) and remove the plastic wrap.
5. Place an agarose gel in the electrophoresis
apparatus. Fill the electrophoresis chamber
with 1x TAE buffer to cover the gel, using
approximately 275 ml of buffer.
6. Check that the wells of the agarose gels are
near the black (–) electrode and the bottom
edge of the gel is near the red (+) electrode.
7. Using a separate tip for each sample, load
the indicated volume of each sample into
7 wells of the gel in the following order:
Lane 1: M, DNA size marker, 10 µl
Lane 2: CS, green, 20 µl
Lane 3: S1, blue, 20 µl
Lane 4: S2, orange, 20 µl
Lane 5: S3, violet, 20 µl
Lane 6: S4, red, 20 µl
Lane 7: S5, yellow, 20 µl
8. Carefully place the lid on the electrophoresis
chamber. The lid will attach to the base in
only one orientation. The red and black jacks
on the lid will match with the red and black
jacks on the base. Plug the electrodes into
the power supply, red to red and black to
black.
9. Turn on the power and electrophorese your
samples at 100 V for 30 minutes.
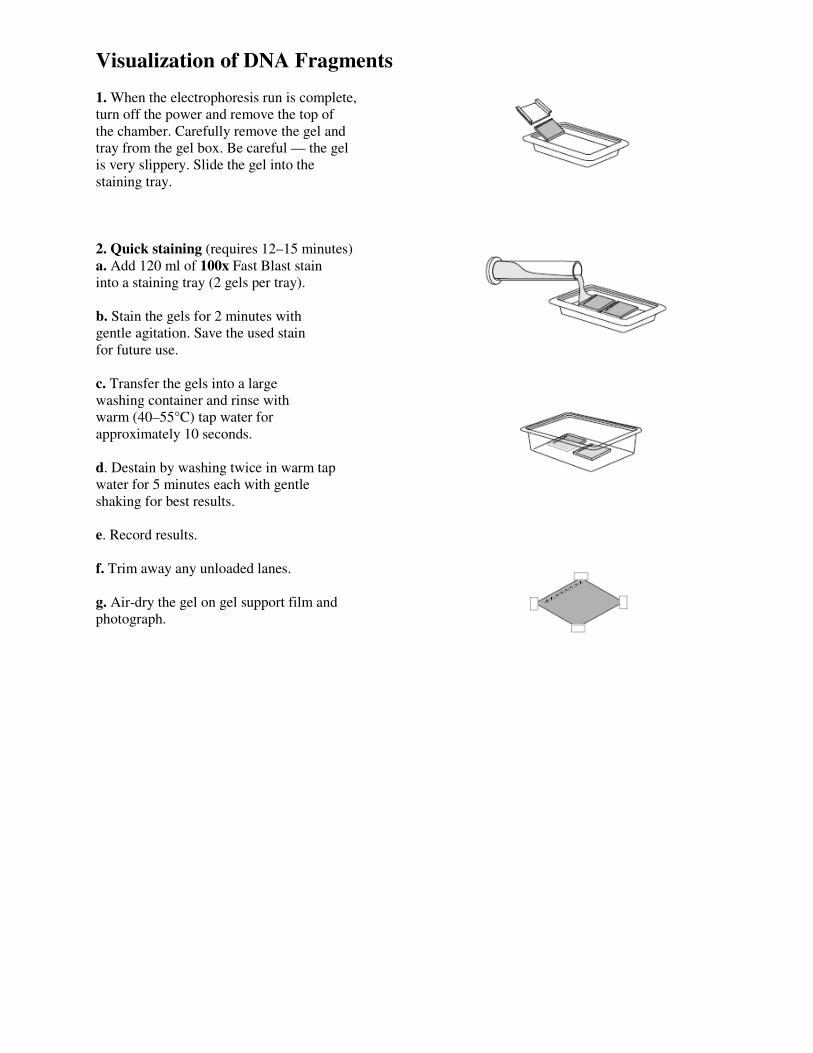
Visualization of DNA Fragments
1. When the electrophoresis run is complete,
turn off the power and remove the top of
the chamber. Carefully remove the gel and
tray from the gel box. Be careful — the gel
is very slippery. Slide the gel into the
staining tray.
2. Quick staining (requires 12–15 minutes)
a. Add 120 ml of 100x Fast Blast stain
into a staining tray (2 gels per tray).
b. Stain the gels for 2 minutes with
gentle agitation. Save the used stain
for future use.
c. Transfer the gels into a large
washing container and rinse with
warm (40–55°C) tap water for
approximately 10 seconds.
d. Destain by washing twice in warm tap
water for 5 minutes each with gentle
shaking for best results.
e. Record results.
f. Trim away any unloaded lanes.
g. Air-dry the gel on gel support film and
photograph.
Lesson 1 Introduction to DNA Fingerprinting You are about to perform a procedure known as DNA fingerprinting. The data obtained may
allow you to determine if the samples of DNA that you will be provided with are from the same
individual or from different individuals. For this experiment it is necessary to review the
structure of DNA molecules. DNA consists of a series of nitrogenous base molecules held
together by weak hydrogen bonds. These base pairs are in turn bonded to a sugar-phosphate
backbone. The four nitrogenous bases are adenine, thymine, guanine, and cytosine (A, T, G,
and C). Remember the base-pairing rule is A - T and G - C. Refer to the figure below of a DNA
molecule.
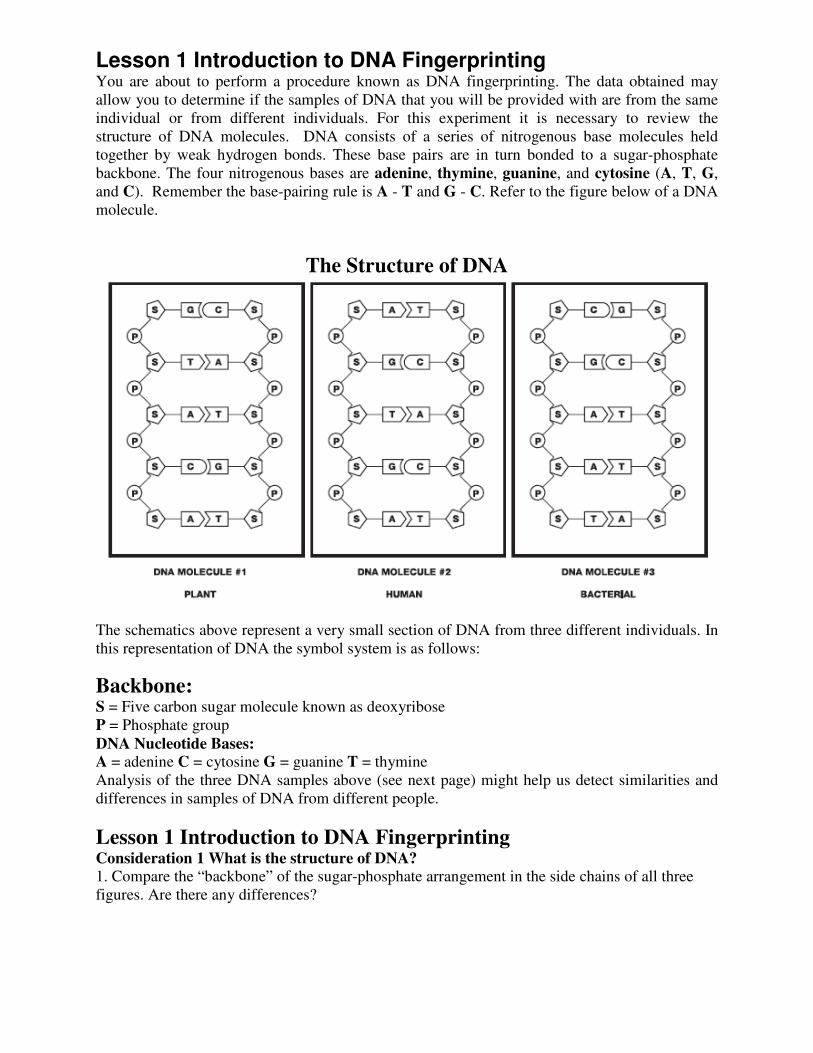
The Structure of DNA
The schematics above represent a very small section of DNA from three different individuals. In
this representation of DNA the symbol system is as follows:
Backbone: S = Five carbon sugar molecule known as deoxyribose
P = Phosphate group
DNA Nucleotide Bases: A = adenine C = cytosine G = guanine T = thymine
Analysis of the three DNA samples above (see next page) might help us detect similarities and
differences in samples of DNA from different people.
Lesson 1 Introduction to DNA Fingerprinting Consideration 1 What is the structure of DNA? 1. Compare the “backbone” of the sugar-phosphate arrangement in the side chains of all three
figures. Are there any differences?

2. In the above figure, do all three samples contain the same bases? Describe your observations.
3. Are the bases paired in an identical manner in all three samples? Describe the pattern of the
base pair bonding.
4. In your attempt to analyze DNA samples from three different individuals, what conclusions
can you make about the similarities and differences of the DNA samples?
5. What will you need to compare between these DNA samples to determine if they are identical
or non-identical?
Lesson 2 Restriction Digestion of DNA Samples Consideration 2 How can we detect differences in base sequences? At first sight, your task might seem rather difficult. You need to determine if the linear base pair
sequence in the DNA samples is identical or not! An understanding of somerelatively recent
developments in recombinant DNA technology might help you to develop a plan.
In 1968, Dr. Werner Arber at the University of Basel, Switzerland and Dr. Hamilton Smith at the
Johns Hopkins University, Baltimore, discovered a group of enzymes in bacteria, which when
added to any DNA will result in the breakage [hydrolysis] of the sugar-phosphate bond between
certain specific nucleotide bases [recognition sites]. This causes the double strand of DNA to
break along the recognition site and the DNA molecule becomes fractured into two pieces. These
molecular scissors or “cutting” enzymes are restriction endonucleases.
[Can you figure out why they are called restriction endonucleases?]
Two common restriction enzymes (endonucleases) are EcoRI and PstI which will be provided to
you in this lab procedure. To better understand how EcoRI and PstI may help you in performing
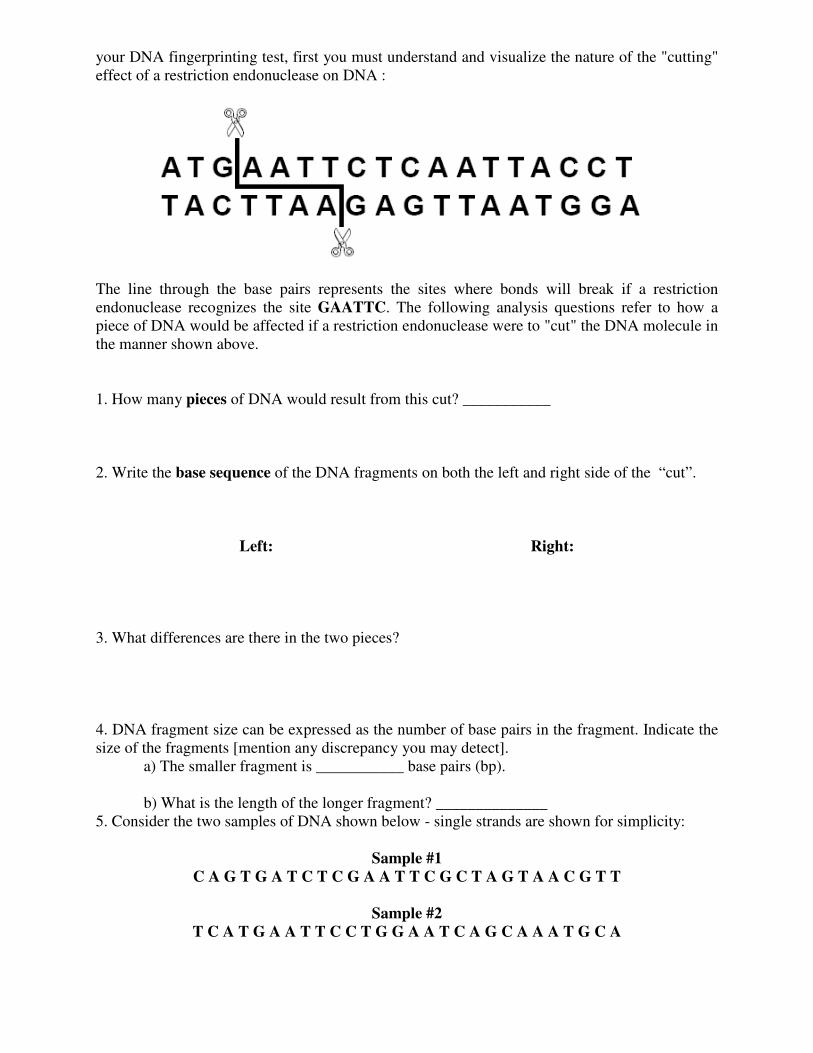
your DNA fingerprinting test, first you must understand and visualize the nature of the "cutting"
effect of a restriction endonuclease on DNA :
The line through the base pairs represents the sites where bonds will break if a restriction
endonuclease recognizes the site GAATTC. The following analysis questions refer to how a
piece of DNA would be affected if a restriction endonuclease were to "cut" the DNA molecule in
the manner shown above.
1. How many pieces of DNA would result from this cut? ___________
2. Write the base sequence of the DNA fragments on both the left and right side of the “cut”.
Left: Right:
3. What differences are there in the two pieces?
4. DNA fragment size can be expressed as the number of base pairs in the fragment. Indicate the
size of the fragments [mention any discrepancy you may detect].
a) The smaller fragment is ___________ base pairs (bp).
b) What is the length of the longer fragment? ______________
5. Consider the two samples of DNA shown below - single strands are shown for simplicity:
Sample #1
C A G T G A T C T C G A A T T C G C T A G T A A C G T T
Sample #2
T C A T G A A T T C C T G G A A T C A G C A A A T G C A

If both samples are treated with a restriction enzyme [recognition sequence GAATTC] then
indicate the number of fragments and the size of each fragment from each sample of DNA.
Sample # 1 Sample # 2
# of fragments:________ # of fragments:_________
List fragment size in order: largest ——> smallest
Sample # 1 Sample # 2
Lesson 2 Restriction Digestion of DNA Samples Upon careful observation, it is apparent that the only difference between the DNA of
different individuals is the linear sequence of their base pairs. In the lab, your team will be given
6 DNA samples. Recall that your task is to determine if any of them came from the same
individual or if they came from different individuals.
Thus far you have learned the following:
• The similarities and differences between the DNA from different individuals.
• How restriction endonucleases cut (hydrolyze) DNA molecules.
• How adding the same restriction endonuclease to two samples of DNA might provide some
clues about differences in their linear base pair sequence.
Now that you have a fairly clear understanding of these three items you are ready to proceed to
the first phase of the DNA fingerprinting procedure—performing a restriction digest of your
DNA samples.
Review Questions 1. Before you incubated your samples, describe any visible signs of change in the contents of the
tubes containing the DNA after it was combined with the restriction enzymes.
2. Can you see any evidence to indicate that your samples of DNA were fragmented or altered in
any way by the addition of EcoRI/PstI? Explain.
3. In the absence of any visible evidence of change, is it still possible that the DNA samples were
fragmented? Explain your reasoning.
4. Are there any visible clues that the restriction enzymes may have in some way changed the
DNA in any of the tubes? Explain your reasoning.
Lesson 3 Electrophoresis and Staining of DNA Samples
Consideration 3 How can we detect the position of EcoRI and PstI restriction sites on our
DNA samples?
Since we are attempting to detect changes at the molecular level, and there are no visible clues
for us to analyze, this task might seem beyond our capabilities and impossible to do. Let’s see if
we can figure this out. One way to determine the location of restriction sites might be to
determine the following:
1) How many different sizes of DNA fragments are in each sample?
2) What are the relative sizes of each fragment?
Therefore, you must somehow get evidence to answer the following question: Do the EcoRI and
PstI restriction sites occur at the same locations in any of the DNA samples?
The following facts will be helpful to you in your attempt to determine the actual rangeof DNA
fragment sizes in your samples.
Electrophoretic Analysis of Restriction Fragments: A restriction enzyme acts like molecular
scissors, making cuts at the specific sequence of base pairs that it recognizes. The three-
dimensional structure or shape of a restriction enzyme allows it to fit perfectly in the groove
formed by the two strands of a DNA molecule. When attached to the DNA, the enzyme slides
along the double helix until it recognizes a specific sequence of base pairs which signals the
enzyme to stop sliding. The enzyme then chemically separates, or cuts, the DNA molecule at that
site — called a restriction site.
If a specific restriction site occurs in more than one location on a DNA molecule, a
restriction enzyme will make a cut at each of those sites, resulting in multiple fragments of DNA.
Therefore, if a given piece of linear DNA is cut with a restriction enzyme whose specific
recognition sequence is found at five different locations on the DNA molecule, the result will be
six fragments of different lengths. The length of each fragment will depend upon the location of
restriction sites on the DNA molecule.
A DNA fragment that has been cut with restriction enzymes can be separated using a
process known as agarose gel electrophoresis. The term electrophoresis means to carry with
electricity. Agarose gel electrophoresis separates DNA fragments by size. DNA fragments are
loaded into an agarose gel slab, which is placed into a chamber filled with a conductive buffer
solution. A direct current is passed between wire electrodes at each end of the chamber. Since
DNA fragments are negatively charged, they will be drawn toward the positive pole (anode)
when placed in an electric field. The matrix of the agarose gel acts as a molecular sieve through
which smaller DNA fragments can move more easily than larger ones.
Therefore, the rate at which a DNA fragment migrates through the gel is inversely proportional
to its size in base pairs. Over a period of time, smaller DNA fragments will travel farther than
larger ones. Fragments of the same size stay together and migrate in single bands of DNA.
These bands will be seen in the gel after the DNA is stained.
An analogous situation is one where all the desks and chairs in the classroom have been
randomly pushed together. An individual student can wind his/her way through the maze quickly
and with little difficulty, whereas a string of four students would require more time and have
difficulty working their way through the maze.
Lesson 3 Electrophoresis of Your DNA Samples Review Questions 1. The electrophoresis apparatus creates an electrical field with positive and negative poles at the
ends of the gel. DNA molecules are negatively charged. To which electrode pole of the
electrophoresis field would you expect DNA to migrate? (+ or -)? Explain.
2. What color represents the negative pole?
3. After DNA samples are loaded into the sample wells, they are “forced” to move through the
gel matrix. What size fragments (large vs. small) would you expect to move toward the opposite
end of the gel most quickly? Explain.
4. Which fragments (large vs. small) are expected to travel the shortest distance from the
well? Explain.

Lesson 4 Questions
1. What can you assume is contained within each band?
2. If this were a fingerprinting gel, how many samples of DNA can you assume were placed in
each separate well?
3. What would be a logical explanation as to why there is more than one band of DNA for each
of the samples?
4. What caused the DNA to become fragmented?
5. Which of the DNA samples have the same number of restriction sites for the restriction
endonucleases used? Write the lane numbers.
6. Which sample has the smallest DNA fragment?
7. Assuming a circular piece of DNA (plasmid) was used as starting material, how many
restriction sites were there in lane three?
8. Which DNA samples appear to have been “cut” into the same number and size of fragments?
9. Based on your analysis of the gel, what is your conclusion about the DNA samples in the
drawing? Do any of the samples seem to be from the same source? If so, which ones? Describe
the evidence that supports your conclusion.
Quantitative Analysis of DNA Fragment Sizes If you were on trial, would you want to rely on a technician’s eyeball estimate of a match,
or would you want some more accurate measurement?
In order to make the most accurate comparison between the crime scene DNA and the suspect
DNA, other than just a visual match, a quantitative measurement of the fragment sizes needs to
be created. This is done below:
1. Using the ruler, measure the distance (in mm) that each of your DNA fragments or bands
traveled from the well. Measure the distance from the bottom of the well to the center of each
DNA band and record your numbers in the table on the next page. The data in the table will be
used to construct a standard curve and to estimate the sizes of the crime scene and suspect
restriction fragments.
2. To make an accurate estimate of the fragment sizes for either the crime scene or suspect DNA
samples, a standard curve is created using the distance (x-axis) and fragment size (y-axis) data
from the known HindIII lambda digest (DNA marker). Using both linear and semilog graph
paper, plot distance versus size for bands 2–6. On each graph, use a ruler and draw a line joining
the points. Extend the line all the way to the right hand edge of the graph. Which graph provides
the straightest line that you could use to estimate the crime scene or the suspects’ fragment sizes?
Why do you think one graph is straighter than the other?
3. Decide which graph, linear or semilog, should be used to estimate the DNA fragment sizes of
the crime scene and suspects. Justify your selection.
4. To estimate the size of an unknown crime scene or suspect fragment, find the distance that
fragment traveled. Locate that distance on the x-axis of your standard graph. From that position
on the x-axis, read up to the standard line, and then follow the graph line to over to the y-axis.
You might want to draw a light pencil mark from the x-axis up to the standard curve and over to
the y-axis showing what you’ve done. Where the graph line meets the y-axis, this is the
approximate size of your unknown DNA fragment. Do this for all crime scene and suspect
fragments.
5. Compare the fragment sizes of the suspects and the crime scene. Is there a suspect that
matches the crime scene? How sure are you that this is a match?


Interpretation of Results
1. What are we trying to determine? Restate the central question.
2. Which of your DNA samples were fragmented? What would your gel look like if the DNA
were not fragmented?
3. What caused the DNA to become fragmented?
4. What determines where a restriction endonuclease will “cut” a DNA molecule?
5. A restriction endonuclease “cuts” two DNA molecules at the same location. What can you
assume is identical about the molecules at that location?
6. Do any of your suspect samples appear to have EcoRI or PstI recognition sites at the same
location as the DNA from the crime scene?
7. Based on the above analysis, do any of the suspect samples of DNA seem to be from the same
individual as the DNA from the crime scene? Describe the scientific evidence that supports your
conclusion.

Extra information on DNA Fingerprinting. DNA typing, DNA profiling, and DNA fingerprinting are all names for the same process, a
process which uses DNA to show relatedness or identity of individual humans, plants, or
animals. DNA typing has become the subject of much debate and interest because of its uses for
forensics analysis in prominent criminal cases such as the O. J. Simpson case. The applications
of DNA typing, however, are much broader than forensic science alone and are having a
profound impact on our society.
DNA typing is used in forensics, anthropology, and conservation biology not only to
determine the identity of individuals but also to determine relatedness. This process has been
used to free innocent suspects, reunite children with their relatives, identify stolen animals, and
prove that whale meat has been substituted for fish in sushi. It is used in times of war to help
identify the remains of soldiers killed in combat. It is also being used to find genetic linkages to
inherited diseases. In addition, scientists are learning a great deal about our evolutionary history
from DNA analysis.
Each of the following paragraphs describes a scenario in which DNA has been used to
show how individuals are related to each other, or to show that a person is (or is not) the
perpetrator of a crime. These scenarios provide a context for using DNA typing for use in
teaching molecular biology, conservation biology, and biotechnology. Have your students
research a scenario that is interesting to them and present their findings to the class.
1. Food identification (endangered species identification). The purity (or impurity) of ground beef has been proven using DNA typing. Hamburger has been
shown to often be a mixture of pork and other non-beef meats. Using portable testing equipment,
authorities have used DNA typing to determine that the fish served in sushi was really meat from
whales and dolphins. These are, many times, endangered species that are protected by
international law.
2. Accused and convicted felons set free because of DNA typing. A man imprisoned for 10 years was released when DNA testing, unavailable when he was
convicted, was used to show that he could not have been the rapist. Statistics show that about
1/3 of all sexual assault suspects are freed as a result of DNA testing.
3. Identifying human remains. Scientists have used DNA typing to confirm that the body in the grave was (or was not) the
person that was supposed to be there. Bones found in Russia are believed to be those of the
Romanovs, Russia’s last imperial family. Czar Nicholas II and his family were executed by the
Bolsheviks in 1918. Experts from around the world have been studying the bones to match
skulls, teeth, and other features with photographs. DNA from the bones will be compared to that
of known descendants to determine whether the bones do indeed belong to the czar and his
family.
4. Determining relatedness of humans. DNA typing has shown that the 5,000 year old “Iceman” found in a melting glacier is most
closely related to modern Europeans. ("Iceman Gets Real." Science, vol. 264:1669. June 17,
1994.) The DNA typing evidence also “removes all the suspicions that the body was a fraud—
that it had been placed on the ice,” says Svante Paabo of the University of Munich. (Science, vol.
264:1775. June 17, 1994).
5. Studying relatedness among ancient peoples. DNA found at archeological sites in western Montana is being used to help determine how many
related groups of people (families) lived at a particular site. (Morell, Virginia. "Pulling Hair
from the Ground." Science, vol. 265:741-745 August 1994.)
6. DNA testing of families. DNA testing of families has been used in Argentina and El Salvador to identify the children of at
least 9,000 citizens of these countries who disappeared between 1975 and 1983, abducted by
special units of the ruling military and police. Many of the children born to the disappeared
adults were kidnapped and adopted by military "parents" who claimed to be their biological
parents. After genetic testing of the extended family revealed the true identity of a child, the
child was placed in the home of its biological relatives. It was feared that transferring a child
from its military "parents" who were kidnappers, but who had reared the child for years, would
be agonizing. In practice, the transferred children became integrated into their biological families
with minimal trauma.
7. Identifying organisms that cause disease. Eva Harris, a UCSF scientist, is helping scientists in Nicaragua and Ecuador to learn to use DNA
technology to detect tuberculosis, and identify the dengue virus and various strains of
Leishmania. Other available tests cause waits of many weeks while disease organisms are
cultured and sent to foreign labs to be identified. (Marcia Barinaga, "A Personal Technology
Transfer Effort in DNA Diagnostics." Science, vol. 266:1317–1318. Nov. 25, 1994.)
8. Identifying birth parents (paternity testing). Girls in Florida were discovered to have been switched at birth when one girl died of a hereditary
disease. The disease was not in her family, but was known to be in the family of another girl,
born in the same hospital and about the same time she was born.
9. Proving paternity. A woman, raped by her employer on Jan. 7, 1943, her 18th birthday, became pregnant. The
child knew who her father was, but as long as he lived, he refused to admit being her father.
After the man died, DNA testing proved that she was his daughter and she was granted a half of
his estate. ("A Child of Rape Wins Award from Estate of Her Father." New York Times, July 10,
1994.)
10. Determining effectiveness of bone marrow transplants. "DNA fingerprinting can help doctors to monitor bone marrow transplants. Leukemia is a cancer
of the bone marrow and the diseased marrow must be removed. The bone marrow makes new
blood cells, so the leukemia sufferer will die without a transplant of healthy marrow. Doctors can
quickly tell whether the transplant has succeeded by DNA typing of the patient and the donor. If
the transplant has worked, a fingerprint from the patient’s blood shows the donor’s bands. But if
the cancerous bone marrow has not been properly destroyed, then the cancerous cells multiply
rapidly and the patient’s own bands predominate." ("Our Ultimate Identity Card in Sickness and
in Health," in "Inside Science", New Scientist, Nov. 16, 1991.)
11. Proving relatedness of immigrants. DNA fingerprinting has been used as proof of paternity for immigration purposes. In 1986,
Britain’s Home Office received 12,000 immigration applications from the wives and children of
Bangladeshi and Pakistani men residing in the United Kingdom. The burden of proof is on the
applicant, but establishing the family identity can be difficult because of sketchy documentary
evidence. Blood tests can also be inconclusive, but DNA fingerprinting results are accepted as
proof of paternity by the Home Office. (DNA fingerprints, source unknown: Based on A. J.
Jeffreys et al., "Positive Identification of an Immigration Test-Case Using Human DNA
Fingerprints." Nature, vol. 317:818–819, 1985.)
12. Confirming relatedness among animals. Scientists who extracted DNA from the hair of chimpanzees throughout Africa now have
evidence that there might be a third species of chimpanzee. At the same time they have learned
things about chimp behavior and kinship patterns that would have once taken years to theorize.
They discovered a group of chimps living in western Africa to be genetically distinct from the
chimps living in other parts of Africa, suggesting that the group may be an endangered species.
The have discovered that male chimps living in a given area are often as closely related as half-
brothers, and many so-called sub-species may all be part of a single species. The male chimps’
relatedness may explain why, unlike other primates, the males are quite friendly to each other.
13. DNA testing of plant material puts murderer at the scene. Two small seed pods caught in the bed of his pick-up truck put an accused murderer at the
murder scene. Genetic testing showed that DNA in the seed pod exactly matched the DNA of a
plant found at the scene of the murder. The accused had admitted he had given the victim a ride,
but he denied ever having been near the crime scene.