bioinspired oxidation reactions involving mono- and poly
TRANSCRIPT

Bioinspired oxidation reactions involving mono- and poly-nuclear transition metal complexes: hydrogen atom abstraction and group
transfer reactions
Dissertation
zur Erlangung des akademischen Grades
doctor rerum naturalium
(Dr. rer. nat.)
im Fach Chemie
eingereicht an der
Mathematisch-Naturwissenschaftlichen Fakultät der Humboldt-Universität zu Berlin
von
M. Sc. Inés Monte Pérez
Präsidentin der Humboldt-Universität zu Berlin Prof. Dr.-Ing. Dr. Sabine Kunst
Dekan der Mathematisch-Naturwissenschaftlichen Fakultät Prof. Dr. Elmar Kulke
___________________________________________________________________________
Gutachter/innen:
1. Prof. Dr. Kallol Ray
2. Prof. Dr. Christian Limberg
Tag der mündlichen Prüfung:21.03.2017

II

III
Abstract
High-valent metal-oxo, -peroxo and -nitrene cores of late transition metals have been
proposed as reactive intermediates in transformations, like the activation of C−H bonds in
hydrocarbons and the reduction of dioxygen, that are both technologically attractive and
fundamental for the functioning of biological systems. The isolation and characterization of such
intermediates, despite being challenging, can provide valuable information about the mechanisms of
the reactions performed and can help in the design of improved catalysts. In this Thesis, we have
worked with three different kinds of intermediates, namely iron-oxo, cobalt-peroxo and copper-
nitrenes, with the aim of examining the effect that small changes in the ligand system, the
participating metal centers or the nitrene sources, have on the behavior of a given reactive system.
In our work with non-haem oxoiron(IV) complexes we found that, by placing the iron
center in a weaker ligand-field environment - via the insertion of oxygen donors in the ligand
system - the reactivity of the high-valent intermediate can be increased. Such increase in reactivity
was assigned to a combination of factors such as the greater accessibility of the S = 2 state and the
reduction of the steric hindrance around the iron-oxo core. An effect of the asymmetry of the ligand
on the reactivity was also detected.
In our work with a hexanuclear cobalt complex, we could assign both nucleophilic and
electrophilic character to a cobalt-peroxo intermediate formed in solution from the reaction of the
hexanuclear cobalt complex with dioxygen. Interestingly, we found that the hexanuclear complex
can also catalytically reduce dioxygen, in the presence of electron and proton sources, to H2O2 or
H2O depending on the temperature. This behavior proved to be in sharp contrast with the reaction
performed by a hexanuclear iron complex supported by the same ligand that performs O−O bond
formation, thus showing the enormous effect that the metal center has on the reactivity of a system.
Finally, we found that the nitrene source has an enormous impact on the stability and
reactivity of terminal copper-nitrenes; via nitrene-source design we could -for the first time- isolate
two terminal copper-nitrenes both as free species and as their Lewis acid-adducts. We also
determined that the reactivity and the electronic structure of the copper-nitrene adducts are
independent of the Lewis acid employed to stabilize them.
Taken together, we show in this work that the reactivity patterns of the high-valent reactive
intermediates here studied depend greatly on subtle changes in the ligand system, the metal center
and the oxidant employed.

IV

V
Zusammenfassung
Hochvalente Metal-oxo-, -peroxo- und -nitrenzentren später Übergangsmetalle werden als
reaktive Intermediate vieler technologisch interessanter und biologischer
Transformationsreaktionen wie die Oxidation von Kohlenwasserstoffen, Hydroxylierung,
Aminierung, Aziridierung und Sauerstoffreduktion angenommen. Die Isolierung und
Charakterisierung solcher Intermediate, wenngleich sie sich schwierig gestaltet, kann wichtige
Informationen zum Mechanismus solcher Reaktionen liefern und kann somit zu einer gezielten
Optimierung und Herstellung von verbesserten Katalysatoren genutzt werden. In dieser Arbeit
wurden drei unterschiedliche Intermediate – Eisenoxo-, Kobaltperoxo- und Kupfernitrenkomplexe –
näher untersucht, mit dem Ziel den Einfluss des Ligandsystems bzw. des Zentralmetalls oder der
Nitrenquelle auf das Reaktionsverhalten der Systeme zu ergründen.
Im Falle der nicht-Häm Eisen(IV)oxokomplexe konnte gezeigt werden, dass der Austausch
eines Stickstoffdonors des Liganden durch einen Sauerstoffdonor zu einer erhöhten Reaktivität des
Intermediates führt. Die erhöhte Reaktivität wurde durch eine Kombination mehrerer Faktoren
begründet: Zum einen besteht ein erleichterter Zugang des S = 2 Zustands, zum anderen findet eine
Reduktion der sterischen Abschirmung des Eisenoxo-Kerns statt. Zudem konnte gezeigt werden,
dass die Asymmetrie des Liganden eine Erhöhung der Reaktivität zur Folge hat.
Bei der Umsetzung eines hexanuklearen Kobaltsystems mit molekularem Sauerstoff konnte
ein Kobaltperoxointermediat in Lösung detektiert werden, welches sowohl nukleophilen als auch
elektrophilen Charakter aufweist. Ebenso konnte gezeigt werden, dass der hexanukleare Komplex
in der Lage ist Disauerstoff abhängig von der Temperatur und in Anwesenheit einer Elektronen-
und Protonenquelle katalytisch entweder zu H2O2 oder H2O zu reduzieren. Dies steht im starken
Kontrast zu der Reaktivät, die für den entsprechenden hexanuklearen Eisenkomplex berichtet
wurde. Dieser ist in der Lage an O–O-Bindungsknüpfungsreaktionen teilzunehmen, was den großen
Effekt des Zentralmetalls auf die Reaktivität demonstriert.
Abschließend konnte durch die Untersuchung der Kupfernitrene gezeigt werden, dass die
eingesetzte Nitrenquelle einen großen Effekt auf Stabilität und Reaktivität der gebildeten terminalen
Kupfernitrenverbindung hat. Erstmalig gelang es, durch ein gezieltes Design der Nitrenquelle zwei
terminale Kupfernitrene, sowohl als freie Spezies als auch als das Lewis-Säure-Addukt, zu
isolieren. Es konnte ebenfalls gezeigt werden, dass die Reaktivität und die elektronische Struktur
der Kupfernitrenkerne unabhängig von der zur Stabilisierung eingesetzten Lewis-Säure sind.
Es konnte somit in dieser Arbeit gezeigt werden, dass die Reaktivität der hier untersuchten
hoch-valenten reaktiven Intermediate maßgeblich abhängig vom Ligandsystem, dem Zentralmetall
und dem verwendeten Oxidanten sind.

VI

VII
This work was developed under the supervision of Prof. Dr. Kallol Ray from October 2012 to
September 2016 at the Institut für Chemie of the Mathematisch-Naturwissenschaftliche Fakultät I at
the Humboldt-Universität zu Berlin.

VIII

IX
Acknowledgments
Firstly, I would like to express my sincere gratitude to Prof. Dr. Kallol Ray for the
continuous support of my PhD studies, for his motivation and immense knowledge. He provided an
enthusiastic guidance throughout the past four years that, though hard sometimes, allowed me to
grow both professionally and personally.
I am indebted to Prof. Dr. Christian Limberg for the valuable suggestions and discussions
during the group seminars and for being the second reviewer of my Thesis. I’m also thankful to him
for allowing me to participate in the activities of his group and for giving me access to the
instruments and equipment much necessary for the development of my work.
I would like to thank the members of the Ray group that accompanied me throughout the
demanding process of learning to do independent research. My special thanks go to Xenia
Engelmann, who has helped me the most during the last years with insightful discussions, amusing
coffee-breaks and providing always a solidary and friendly hand; I am also thankful to her for the
studies on oxoiron complexes that I present in this Thesis and that we developed together. Thanks
to the former members of the group: Dr. Subrata Kundu, Dr. Florian Pfaff and Dr. Florian Heims,
from whom I learned a lot and to whom I will always be grateful. I am particularly grateful to Dr.
Subrata Kundu, whose research served as a starting point for most of the work that I present in this
Thesis, to Dr. Florian Pfaff for the rRaman and Möβbauer measurements, to Vikoria Steck for the
initial work on copper-nitrenes with substituted nitrene sources and to Sarah-Luise Abram for the
starting studies on the copper-mesityl azide system. Thank you also to the current group members:
Katrin Warm, Anirban Chandra and Jennifer Deutscher, for the nice atmosphere in the laboratory
and for their comradeship.
I am thankful to the members of the groups of Prof. Dr. Christian Limberg and Dr. Matthias
Schwalbe for providing a nice working atmosphere. Especially, I am grateful to Dr. Fabian Schax
for the XRD measurement, to Dr. Iweta Pryjomska-Ray for the support and advice from the
beginning of my time here and for her help with ESI-MS and GC-MS measurements and to Dr.
Corinna Matlachowski, Siu Ting-Li and Marie-Louise Wind for the fruitful discussions and their
continuous help. I am especially thankful to Malu for reading and correcting this Thesis.
I am grateful to the scientific, technical and administrative staff of the Institut für Chemie of
the Humboldt Universiät zu Berlin, particularly, to Mrs.Ursula Kätel for the elemental analysis and
to the NMR department for measuring my samples.
X
I would like to acknowledge the contributions of the following groups and individuals to
the development of this Thesis. They kindly provided their facilities and expertise in different
techniques that allowed us to make interesting chemistry.
- I am thankful to Dr. Eckhard Bill at the Max-Plank-Institut für Chemische
Energiekonversion (Germany) for his support with EPR and Magnetic Möβbauer measurements.
- Thanks to Erik Farquhar at the Brookhaven National Laboratory (USA) for the X-Ray
absorption studies.
- I am grateful to Prof. Dr. Marcel Swart from the Universitat de Girona (Spain), who
performed DFT calculations on our systems.
- I am also thankful to Prof. Nicolai Lehnert and Casey van Stappen from the University of
Michigan (USA) for their work on the challenging characterization of the hexanuclear cobalt
complex.
- I am grateful also to Prof. Jason England from the Nanyang Technological University
(Singapore) for the NMR measurements.
- I would like to thank also Dr. Alexander Schnegg from the Helmholtz Zentrum Berlin
(Germany) for the access to the EPR under their supervision.
- I am also grateful to Prof. Dr. Peter Hildebrandt and Dr. Uwe Kuhlmann in the Technische-
Universität Berlin (Germany) for the access to the rRaman.
My most sincere thanks go to the BIG-NSE and UniCat for the economic and academic
support, and for providing an open and inclusive learning atmosphere. Especially, I want to thank
Dr. Lonjaret (JP) for his kindness and support throughout this process.
Finally, I want to thank my family and friends for their never-ending love and support.
Thank you to my parents and my brother for always being there for me, no matter how far away we
are. Thank you to Andrés, my husband, for standing with me in the good and the bad times and for
being the best life companion one could ever have.

XI

XII

XIII
Contents Chapter 1: General Introduction .......................................................................................................... 1
1.1 O2 activation .............................................................................................................................. 3
1.2. Relevant enzymatic mechanisms and their intermediates ........................................................ 5
1.2.1 Cytochrome P450 monooxygenases .................................................................................. 5
1.2.2 Taurine dioxygenase........................................................................................................... 7
1.2.3. Soluble methane monooxygenase ..................................................................................... 8
1.2.4 Cytochrome c oxidase ........................................................................................................ 9
1.3. Synthetic model systems ........................................................................................................ 10
1.4 Bonding of metal-oxo and metal-nitrene complexes............................................................... 12
1.5. Stabilizing late transition metal-oxo and metal-nitrene complexes........................................ 14
1.6. The aim of this work .............................................................................................................. 16
1.7. References .............................................................................................................................. 17
Chapter 2: Trapping and Characterization of a New FeIV=O Intermediate with Enhanced Reactivity due to Innovative Ligand Design ...................................................................................................... 21
2.1. Introduction ............................................................................................................................ 23
2.2. Results and discussion ............................................................................................................ 30
2.2.1 Synthesis of the TMCO ligand ........................................................................................ 30
2.2.2 Synthesis and characterization of Fe-1 ............................................................................ 33
2.2.3 Generation and characterization of Fe-2 .......................................................................... 35
2.2.4 Oxidative reactivity of Fe-2 ............................................................................................. 43
2.2.5 Comparison with the TMCN system ............................................................................... 52
2.3 Conclusions ............................................................................................................................. 56
2.4 References ............................................................................................................................... 57
Chapter 3: Reactivity Studies of a Hexanuclear Cobalt Complex Supported on a Stannoxane Core 63
3.1. Introduction ............................................................................................................................ 65
3.2. Results and discussion ............................................................................................................ 71
3.2.1 Characterization of Co-L6 ................................................................................................ 71
3.2.2 Nucleophilic oxidative reactivity of Co-1 ........................................................................ 77
3.2.3 Electrophilic oxidative reactivity of Co-1 ........................................................................ 80
3.2.4 Dioxygen reduction catalyzed by Co-L6 .......................................................................... 83
3.3 Conclusions ............................................................................................................................. 94
3.4 References ............................................................................................................................... 94

XIV
Chapter 4: Systematic Studies involving the Trapping and Characterization of Elusive Copper-Nitrenes Using Different Nitrene-Sources and Lewis Acids ............................................................ 99
4.1. Introduction .......................................................................................................................... 101
4.2. Results and Discussion ......................................................................................................... 105
4.2.1 Variation of the Lewis acid bound to the copper-tosylnitrene intermediate .................. 105
4.2.2 Variation of the nitrene source employed for stabilizing the copper-nitrene intermediates ................................................................................................................................................. 116
4.3 Conclusions ........................................................................................................................... 136
4.4 References ............................................................................................................................. 137
Chapter 5: Conclusions and outlook ............................................................................................... 141
Chapter 6: Equipment and experimental work ................................................................................ 147
6.1 General techniques and chemicals employed ........................................................................ 148
6.2 Analytical techniques ............................................................................................................ 148
6.2.1. Elemental analysis ......................................................................................................... 148
6.2.2. Nuclear magnetic resonance spectroscopy (NMR) ....................................................... 148
6.2.3. Mass spectrometry ......................................................................................................... 149
6.2.4. Infrared spectroscopy (IR) ............................................................................................. 149
6.2.5. UV-vis absorption spectroscopy ................................................................................... 149
6.2.6. Gas chromatography coupled to mass spectrometry (GC-MS) ..................................... 150
6.2.7. X-Ray diffraction crystallography (XRD)..................................................................... 150
6.2.8. Electron paramagnetic resonance spectroscopy (EPR) ................................................. 151
6.2.9. Resonance Raman (rR) spectroscopy ............................................................................ 151
6.2.10. Möβbauer spectroscopy ............................................................................................... 152
6.2.11. X-ray absorption spectroscopy (XAS) ........................................................................ 153
6.2.12. Magnetic Circular Dichroism (MCD) ......................................................................... 154
6.2.13. Superconducting quantum interference device (SQUID) susceptibility measurements ................................................................................................................................................. 154
6.2.14. Density Functional Theory (DFT) calculations ........................................................... 155
6.3. Syntheses of compounds and generation of intermediates ................................................... 156
6.3.1. Synthesis of the ligands TMCO and TMCO-d ............................................................ 156
6.3.2. Synthesis of the complexes Fe-1, Fe-1d and 57Fe-1 ..................................................... 159
6.3.3. Synthesis of the oxidants sPhIO and sPhI18O .............................................................. 160
6.3.4. Generation of the intermediates Fe-2, Fe-2d, Fe-2-18O and 57Fe-2 .............................. 161
6.3.5. Synthesis of the ligand TMCN and TMCN-d .............................................................. 162

XV
6.3.6. Synthesis of the complexes Fe-3 and Fe-3d ................................................................. 164
6.3.7. Generation of the intermediates Fe-4 and Fe-4d .......................................................... 165
6.3.8. Synthesis of the ligand L6 ............................................................................................. 165
6.3.9. Synthesis of the complex Co-L6 ................................................................................... 166
6.3.10. Generation of the intermediate Co-1 ........................................................................... 166
6.3.11. Synthesis of the Complex [(AN)Cu]BF4 .................................................................... 166
6.3.12. Synthesis of the oxidants sPhINTs and sPhI15NTs .................................................... 167
6.3.13. Generation of the intermediates Cu-1-M and Cu-1-Y-15N ......................................... 168
6.3.14. Synthesis of the oxidants sPhINArCF3 and sPhI15NArCF3 .......................................... 169
6.3.15. Synthesis of the oxidants sPhINArNO2 and sPhI15NArNO2 ......................................... 170
6.3.16. Generation of the intermediate Cu-2 ........................................................................... 171
6.3.17. Generation of the intermediates Cu-2-Sc and Cu-2-Sc-15N ....................................... 171
6.3.18. Generation of the intermediate Cu-3 ........................................................................... 172
6.3.19. Generation of the intermediates Cu-3-M and Cu-3-15N ............................................. 172
6.3.20. Synthesis of the oxidant Mes-N3 ................................................................................. 173
6.3.21. Generation of the intermediate Cu-4-Sc ..................................................................... 173
6.4. References ............................................................................................................................ 174
Appendices ...................................................................................................................................... 179
A1. Crystallographic data ............................................................................................................ 180
A2. Lists of abbreviations ........................................................................................................... 181
A3. Declaration ........................................................................................................................... 185
A4. Publications and presentations ............................................................................................. 187

XVI

Chapter 1:
General Introduction

2
The activation of small molecules such as N2, O2, H2, CO2 or CH4 has been in the spotlight
of chemical research and technology development for some decades; the interest in activating such
molecules stems from the context of the current environmental crisis and the demand for cleaner
chemical processes and energy sources.[1] Some small molecules, like H2 and O2, have the potential
to be used as clean energy alternatives to fossil fuels in devices such as fuel cells. The activation of
other molecules, like N2 and O2, would allow the fixation of their elements in atom-efficient ways
and may lead to the generation of value-added chemicals like ammonia and oxidized hydrocarbons,
some of which are essential for sustaining life on our planet. The activation of a third group of
molecules that includes CO2 and NOx, which act as pollutants and greenhouse gases, would
facilitate their removal from the atmosphere, thus significantly improving environmental conditions.
Finally, the activation of CH4 is also of particular relevance in the context of efficient
natural energy resource use. Methane is the main component in natural gas, but is also one of the
most prevalent greenhouse gases, with a comparative impact on climate change 25 times greater
than CO2 over a 100-year period. Its characteristics give methane two contrasting facets: on the one
hand, with the depletion of oil reserves, methane has the potential to become the most important
hydrocarbon feedstock for the generation of chemicals;[2] on the other hand, given its environmental
impact, a large amount of methane released in crude oil extraction is being flared because of the
lack of technology to properly transport the gas to marketplaces.[3,4] The activation of methane, for
example by oxidation to methanol, would prevent the need to flare it by making it easier to transport
as a liquid, and would provide a starting point for the generation of value-added chemicals, thus
promoting the exploitation of methane resources in a cleaner and more efficient way.[5] The
activation of methane is, however, not an easy process and is still not employed to its full potential
in the chemical industry. This is because methane is highly stable, since it has four strong and
localized C−H bonds with high bond-dissociation energies (104 kcal mol-1) and lacks any low-
energy empty orbitals or high-energy filled molecular orbitals.[2] The activation of the C−H bonds
of methane and other alkanes into useful functional groups has therefore become an active and
expanding field of research that could revolutionize the chemical industry and greatly impact the
environment.[2,6]
Transition metals play an important role in the activation of small molecules by providing
low-barrier reaction pathways for their transformations. A number of examples of synthetic C−H
bond activation reactions promoted by transition metal centers have been reported in the past
decades.[7,8] So far, the most efficient known catalyst for methane activation is the platinum-based
Periana catalyst; however, its potential industrial applications are limited by the cost of platinum – a
3
non-abundant metal – as well as by the extreme reaction conditions required.[9] Nature, on the other
hand, uses cheap non-toxic transition metals (like Fe, Cu and Mn) at the active sites of
metalloenzymes, for the oxidation and selective functionalization of strong C−H bonds in atom-
economical transformations under mild pressure and temperature conditions.[10] Interestingly, in
natural systems the controlled oxidation of organic substrates is coupled with the activation of yet
another small molecule: dioxygen. Thus, in a great variety of metalloenzymes, the activation of
oxygen – the cheapest and most naturally abundant oxidant – precedes the activation of strong C−H
bonds (including those of methane) and their conversion to their oxidized counterparts.
1.1 O2 activation
The use of molecular oxygen as a terminal oxidant, as employed in biological systems, is
desirable because O2 is both naturally abundant and inexpensive. Nonetheless, it is not
straightforward to use, as evidenced by the fact that oxygen coexists with a number of combustibles
under ambient conditions without oxidizing them. From a thermodynamic point of view, dioxygen
is potentially reactive; however, the direct oxidation of organic molecules with O2 is kinetically
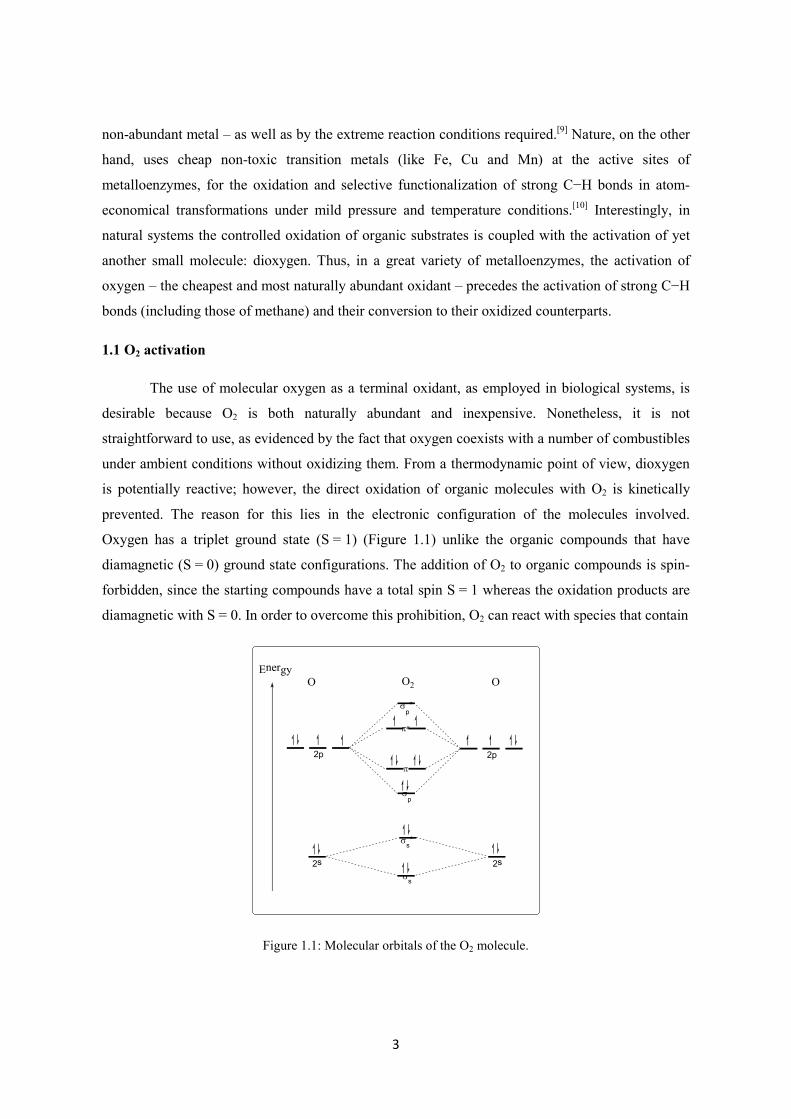
prevented. The reason for this lies in the electronic configuration of the molecules involved.
Oxygen has a triplet ground state (S = 1) (Figure 1.1) unlike the organic compounds that have
diamagnetic (S = 0) ground state configurations. The addition of O2 to organic compounds is spin-
forbidden, since the starting compounds have a total spin S = 1 whereas the oxidation products are
diamagnetic with S = 0. In order to overcome this prohibition, O2 can react with species that contain
2s 2sss
ss*
sp
sp*
p
p*
2p 2p
EnergyO OO2
Figure 1.1: Molecular orbitals of the O2 molecule.

4
unpaired electrons or are able to undergo single-electron transfer reactions, such as free radicals (as
in combustion), photochemical-induced excited triplet states or transition metals. Nature’s preferred
strategy is the use of transition metals.[1]
N
N N
N
R R
FeIII
OH2
SCys
FeII
OH2
H2O
OH2O
CuB
N
NNHN
NH
N
His
His
His
HO
Tyr
N
NHHis
N NH
His
Asp
HO
a) b) c)
FeIII FeIII
O
O
H2O O
O O
Glu
O O O
GluOGlu
N
NH
His
Glu
N
NH
His
d)
CuII
NN
N
OH2
OH2
NH
NH
NH
HisHis
His
e)
CuI
HN
HN
HN
N
N
N
His
His
NH
HisCuI
f )
N
N N
NR
R
RR
R
FeIII
NHis
OH2
H
O
O
Figure 1.2: Structures of representative active sites employed in biology for oxygen activation.
a) Mononuclear haem iron unit in Cytochrome P450; b) mononuclear non-haem iron core in Taurine
dioxygenase; c) dinuclear non-haem site in soluble Methane monooxygenase; d) mononuclear copper site in
Copper amine oxidase; e) dinuclear copper site in particulate Methane monooxygenase and f) heterodinuclear
Cu/Fe center in Cytochrome c oxidase.
Metalloenzymes employ a wide variety of metallic sites to activate O2, such as
mononuclear haem and non-haem iron units, mononuclear copper centers, homodinuclear iron and
copper centers, as well as heterodinuclear iron/copper centers (Figure 1.2).[11,12] In these active sites,
O2 is activated in a controlled manner to generate a variety of reactive intermediates that lead to the
selective oxidation of suitable substrates by avoiding any over-oxidation of products as well as the
dangerous oxidation of the protein subunit surrounding the active metal site. A common mechanism
for the activation of O2 in metalloenzymes has been proposed (Scheme 1.1).[13] In this mechanism,
the oxygen first binds to the metal center to generate a metal-superoxo species, converting the
kinetically inert triplet ground state of O2 to a more reactive doublet state in O2●-. The metal-
superoxo intermediate can further gain an electron to generate a metal-peroxo species and
subsequently a proton to generate a metal-hydroperoxo core or directly abstract a hydrogen atom to
form the metal-hydroperoxo intermediate. Finally, this species can undergo either O−O bond homo-
or heterolysis to generate a highly reactive metal-oxo intermediate (Scheme 1.1 a). In dinuclear

5
systems, the unified mechanism is similar but the intermediates formed are the superoxo-, peroxo-
and the high-valent metal-oxo species shown in Scheme 1.1 b. Although Scheme 1.1 presents a
general unified method for the biological activation of dioxygen, the catalytic cycle of each enzyme
is unique and dependent on its own function and structure.
Mn+ + O2 M(n+1)+ O2 -
superoxo
M(n+1)+ O22-e-
peroxo
M(n+1)+ O2H
hydroperoxo
HH+
heterolysis
homolysis
M(n+3)+ O
M(n+2)+ O
+ OH
-
+ OH
oxo
Mn+ + O2Mn+ M(n+1)+ O2 -
superoxo
Mn+ M(n+1)+ O22-
peroxo
M(n+1)+ M(n+2)+ M(n+2)+
O
O
oxo
a)
b)
Scheme 1.1: Proposed unified mechanisms for the activation of O2 at a) mononuclear and b) dinuclear
enzymatic active sites.
1.2. Relevant enzymatic mechanisms and their intermediates
Enzymes are the perfect catalysts. They are able to perform reactions – that are otherwise too
energy-demanding – in mild conditions via the generation and reaction of the above-mentioned
reactive intermediates. Metalloenzymes provide access to these species in a controlled fashion, thus
regulating the reaction’s mechanism and selectivity. In the following sections, detailed descriptions
of the catalytic cycles of four relevant metalloenzymes are provided, with special emphasis on the
nature of their key reactive intermediates.
1.2.1 Cytochrome P450 monooxygenases
Cytochrome P450s (P450s) are a family of haem-containing enzymes ubiquitous to most
biochemical systems. They play a vital role in the synthesis of biomolecules and the metabolism of
exogenous substances like drugs and toxicants by catalyzing reactions such as aliphatic C−H bond
hydroxylation, olefin epoxidation and the oxidation of aromatic compounds and aldehydes.[14] The
most common P450s are monooxygenases, as they activate O2 and incorporate one oxygen atom
into a substrate while the other oxygen atom is reduced to water.
The accepted catalytic cycle of P450 monooxygenases is presented in Scheme 1.2.[1,14,15]
The active site of this family of enzymes contains an iron-protoporphyrin IX complex, where the
6
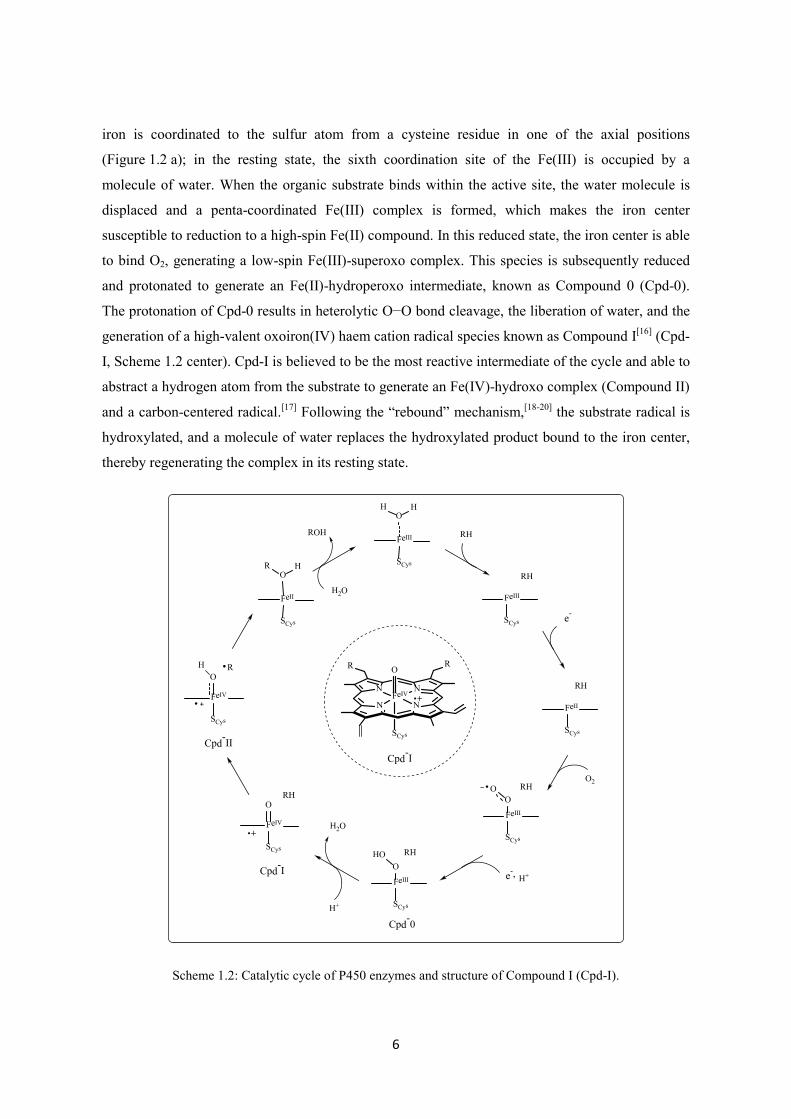
iron is coordinated to the sulfur atom from a cysteine residue in one of the axial positions
(Figure 1.2 a); in the resting state, the sixth coordination site of the Fe(III) is occupied by a
molecule of water. When the organic substrate binds within the active site, the water molecule is
displaced and a penta-coordinated Fe(III) complex is formed, which makes the iron center
susceptible to reduction to a high-spin Fe(II) compound. In this reduced state, the iron center is able
to bind O2, generating a low-spin Fe(III)-superoxo complex. This species is subsequently reduced
and protonated to generate an Fe(II)-hydroperoxo intermediate, known as Compound 0 (Cpd-0).
The protonation of Cpd-0 results in heterolytic O−O bond cleavage, the liberation of water, and the
generation of a high-valent oxoiron(IV) haem cation radical species known as Compound I[16] (Cpd-
I, Scheme 1.2 center). Cpd-I is believed to be the most reactive intermediate of the cycle and able to
abstract a hydrogen atom from the substrate to generate an Fe(IV)-hydroxo complex (Compound II)
and a carbon-centered radical.[17] Following the “rebound” mechanism,[18-20] the substrate radical is
hydroxylated, and a molecule of water replaces the hydroxylated product bound to the iron center,
thereby regenerating the complex in its resting state.
FeIII
O
SCys
H H
FeIII
SCys
RH
FeII
O
SCys
R H
FeII
SCys
RH
FeIII
SCys
RHO
O
FeIII
SCys
RHO
HO
FeIV
SCys
ORH
RH
e-
e-, H+
ROH
H+
H2O
O2
Cpd-0
Cpd-I
N
N N
N
R R
FeIV
O
SCys
Cpd-I
FeIV
SCys
OR
Cpd-II
H
H2O
Scheme 1.2: Catalytic cycle of P450 enzymes and structure of Compound I (Cpd-I).

7
1.2.2 Taurine dioxygenase
Taurine Dioxygenase (TauD) is a member of the large and diverse family of the
α-ketoglutarate (α-KG)-dependent dioxygenases. Notably, dioxygenases – in contrast to
monooxygenases – catalyze the oxidation of a substrate without reducing one of the oxygen atoms
from O2 into a water molecule; instead, both oxygen atoms are incorporated into a substrate or a co-
substrate.[21] The α-KG-dependent dioxygenases often employ in their active sites a monomeric
non-haem Fe(II) center, facially coordinated by the array of two histidines and one aspartate or
glutamate (Figure 1.2 b). The iron center activates O2 to effectuate the decarboxylation of the
α-KG, acting as a co-substrate, and the two-electron oxidation of the substrate, which is typically a
hydroxylation but can also be a desaturation or a cyclization reaction. The biological functions of
this family of enzymes include the degradation of xenobiotics and the biosynthesis of connective
tissue, antibiotics and secondary metabolites, as well as the reparation of methylated DNA and
RNA and the control of oxygen and iron homeostasis.[22] TauD, in particular, plays a fundamental
role in the metabolism of cysteine, an important amino acid that is toxic in high concentrations, by
regulating its concentration in the body.[21] TauD’s catalytic cycle is commonly regarded as
representative of those of the α-KG dependent dioxygenases since the first reactive intermediate
trapped in this family of enzymes was the intermediate-J from the TauD enzyme.[23]
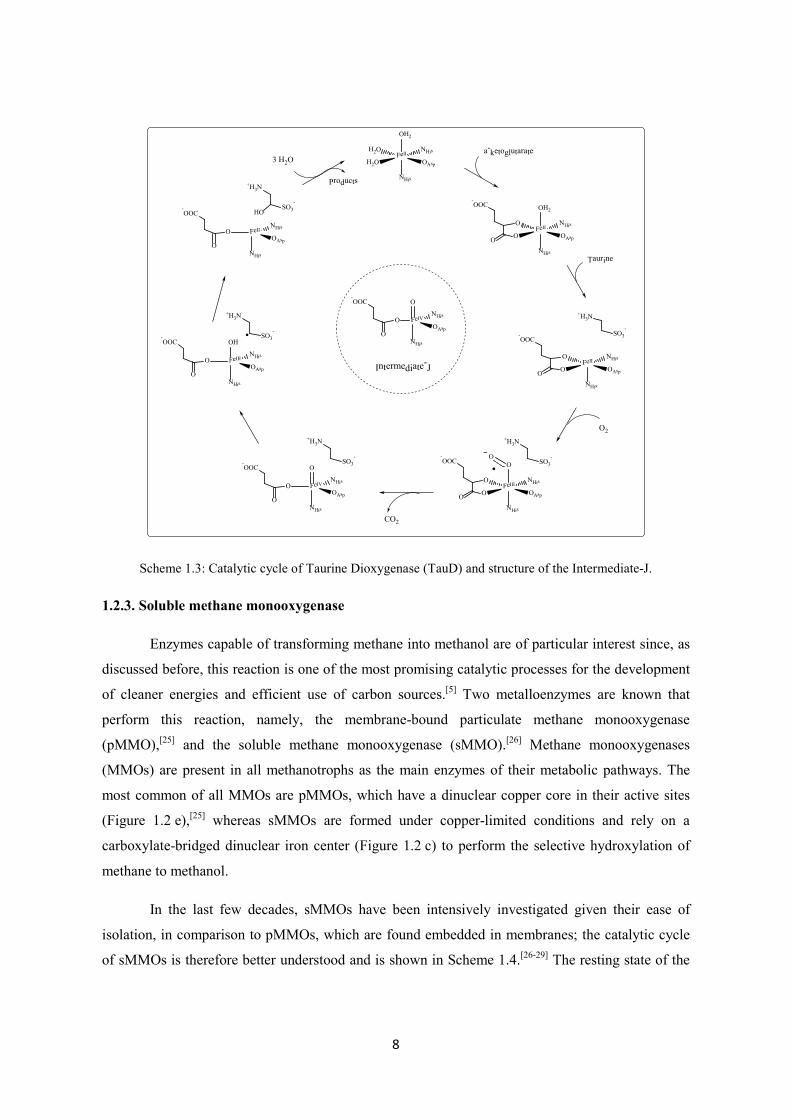
The accepted catalytic mechanism of TauD is shown in Scheme 1.3.[21,22,24] In the resting
state the Fe(II) center is coordinated to the 2-His/1-Carboxylate ligand motif that links the iron
center to the enzyme, and the three remaining coordination sites are occupied by water molecules.
Upon coordination of the co-substrate, α-KG, two water molecules are released. The third water
molecule is liberated after the substrate, taurine, docks in the active site, leaving the Fe(II) center
penta-coordinated. The O2 molecule then binds to the iron center, generating an Fe(III)-superoxo
intermediate, which presumably attacks the α-keto position of the α−KG, forming a structure whose
subsequent decarboxylation leads to the formation of a high-valent S = 2 oxoiron(IV) species
known as Intermediate-J[23,24] (Scheme 1.3 center). Intermediate-J is believed to be responsible for
hydrogen atom abstraction from the substrate, followed by O-rebound to yield the hydroxylated
product. Further departure of the succinate, together with the coordination of water molecules,
returns the iron center to the resting state.
8
FeII
OH2
NHis
H2O NHis
OAspH2O
FeII
OH2
NHis
O NHis
OAspOO
-OOC
FeII
NHis
O NHis
OAspOO
-OOC
+H3N
SO3-
FeIII
O
NHis
O NHis
OAspOO
-OOC
+H3N
SO3-O
FeIV
O
NHis
ONHis
OAspO
-OOC
+H3N
SO3-
CO2
FeIII
OH
NHis
ONHis
OAspO
-OOC
+H3N
SO3-
FeII
HO
NHis
ONHis
OAspO
-OOC
+H3N
SO3-
a-ketoglutarate
Taurine
O2
3 H2O
Products
FeIV
O
NHis
ONHis
OAspO
-OOC
Intermediate-J
Scheme 1.3: Catalytic cycle of Taurine Dioxygenase (TauD) and structure of the Intermediate-J.
1.2.3. Soluble methane monooxygenase
Enzymes capable of transforming methane into methanol are of particular interest since, as
discussed before, this reaction is one of the most promising catalytic processes for the development
of cleaner energies and efficient use of carbon sources.[5] Two metalloenzymes are known that
perform this reaction, namely, the membrane-bound particulate methane monooxygenase
(pMMO),[25] and the soluble methane monooxygenase (sMMO).[26] Methane monooxygenases
(MMOs) are present in all methanotrophs as the main enzymes of their metabolic pathways. The
most common of all MMOs are pMMOs, which have a dinuclear copper core in their active sites
(Figure 1.2 e),[25] whereas sMMOs are formed under copper-limited conditions and rely on a
carboxylate-bridged dinuclear iron center (Figure 1.2 c) to perform the selective hydroxylation of
methane to methanol.
In the last few decades, sMMOs have been intensively investigated given their ease of
isolation, in comparison to pMMOs, which are found embedded in membranes; the catalytic cycle
of sMMOs is therefore better understood and is shown in Scheme 1.4.[26-29] The resting state of the

9
enzyme is the oxidized di-iron(III) cluster that is further reduced by two electrons to yield the
reduced di-iron(II) species; this reactive species binds O2 to generate a peroxo-di-iron(III)
intermediate. The further cleavage of the O−O bond yields the reactive species MMO-Q (Scheme
1.4 center) that contains a high-valent bis(µ-oxo)diiron(IV) core. The MMO-Q intermediate is
recognized as the key oxidizing species of the sMMO catalytic cycle. Spectroscopic studies suggest
that it possesses a unique [FeIV2(µ-O)2]4+ diamond core where the iron centers are in a high-spin
configuration (S = 2) and strongly exchange-coupled.[28] The formulation of the exact structure of
the MMO-Q intermediate is still debated;[26,29] however, the schematic structure presented in
Scheme 1.4 is the most widely accepted, where a high-valent oxodiron(IV) diamond core can be
observed.
FeIII FeIII
O O
Glu
O
O
FeIV FeIV
O O
Glu
O
O
FeIII FeIII
O O
Glu
O
O
H2
H
FeII FeII
O O
Glu
OH2
O2
CH4
CH3OH
H2O
H2O
2H+, 2e-
FeIV FeIV
O O
Glu
O
O
MMO-Q
Scheme 1.4: Overview of the catalytic cycle of the soluble methane monooxygenase (sMMO).
1.2.4 Cytochrome c oxidase
Besides the controlled activation of C−H bonds, metalloenzymes perform other vital
processes that involve the activation of O2, like the four-electron reduction of dioxygen to water.
Redox reactions such as this one are performed by enzymes known as oxidases. Cytochrome c
oxidase[30] (CcO) is a vital enzyme in the respiratory pathway of aerobic organisms. It is capable of
reducing dioxygen as a part of the cellular process to generate energy in the form of ATP
molecules. The protein CcO contains two iron-porphyrin units (haem a and haem a3) and two
mononuclear copper sites (CuA and CuB). The haem a and CuA cores act as electron transfer sites,

10
while the haem a3 and CuB form a dinuclear active site that activates dioxygen (Figure 1.2 f).[12,31]
The roles of the different amino acid residues and metals of the active site of CcO are still under
discussion[32-34] However, based on the intermediates that have been spectroscopically detected, the
catalytic cycle shown in Scheme 1.5 has been proposed.[35] Even when the active site is bimetallic,
the reduction of O2 involves intermediates that are very similar to those observed in monometallic
enzymes, including the iron-superoxo and the oxoiron(IV) species.
FeII
OH2
FeII
O2
L
FeIII
OOH
L
FeIV
O
L
FeIII
OH
L
e-, H+
e-, H+
e-, H+
e-, H+
O2
H2O
H2O
Scheme 1.5: Overview of the catalytic O2 reduction performed in the active site of the Cytochrome c oxidase.
1.3. Synthetic model systems
The previously described enzymes are all distinct and perform unique and specific
reactions; nevertheless they all proceed via the same classes of intermediates. A full comprehension
of these reactive species -including their generation, structure and reactivity- is necessary to achieve
a better understanding of the catalytic enzymatic mechanisms and for the further design of synthetic
catalysts capable of performing similar processes. The study of these reactive species in the active
sites of metalloenzymes presents multiple challenges related to their location within a complex
protein environment, in addition to the difficulty of altering them directly – for example, through
variation of their ligand system or metallic cores. The reduced size of synthetic biomimetic models,
on the other hand, enables them to be easily isolated and spectroscopically studied. Furthermore, the
ligand environments of the models can be modified both sterically and electronically to get more
insights into the catalytic mechanisms and structural proprieties of biological systems.[27,36] Models
can provide information on unclear enzymatic mechanisms or boost our understanding of known
biological intermediates, but they can also deviate from the biological structural resemblance and be
employed for the development of better catalysts with potential applications.[36,37]

11
Based on the enzymatic catalytic cycles presented above, it is clear that metal-oxo species
play a fundamental role in nature. Given their relevance, vast studies on synthetic metal-oxo
complexes have been carried out.[10,35,38-41] Of special interest for this work are mononuclear non-
haem oxoiron(IV) complexes. Over 60 synthetic non-haem oxoiron(IV) complexes have been
reported in the last 15 years,[10-35,42–54] most of which have been fully characterized, and their
reactivities in oxidation reactions have been intensively tested.[10] The most important non-haem
oxoiron(IV) models are discussed in detail in Chapter 2. It is important to state that until very
recently all the reported non-haem oxoiron(IV) complexes failed to mimic the actual spin state of
the enzymatic active sites (S = 2) and were also not successful in activating C−H bonds at the same
rates as the natural reactive intermediates. However, in 2015, Que Jr. and coworkers stabilized an
oxoiron(IV) complex in a high-spin configuration that activates C−H bonds at rates comparable
with those of the Intermediate-J of TauD, which represented a major breakthrough in the field.[47]
Despite the clear scientific interest in synthesizing complexes that closely mimic the active
species of biological systems, an attractive feature of the bioinspired modeling is that the chemistry
can be taken one step further and new systems can be built beyond the scope of the typical
biological choices. Gas phase studies,[55,56] together with theoretical calculations[57] on methane
activation processes mediated by different metal-oxo systems, have suggested that metal-oxo cores
with metals beyond iron, such as nickel and cobalt, are more reactive towards hydrocarbon
functionalization than their oxoiron counterparts due to the weaker metal-oxo bonds in their naked
[MO]n+ cores. The search for high-valent metal-oxo cores with later transition metals such as cobalt
and nickel has engendered a new working field that includes the search for terminal copper(III)-oxo
cores, a structure that has also been proposed as a plausible intermediate in natural and artificial
systems, but which has yet to be isolated.[13] The challenges posed by this emerging field are related
to the anticipated strong repulsion between the electron-rich oxo ligand and the late transition metal,
and the bonding considerations that will be discussed later in this Chapter.
Another attractive field in synthetic bioinorganic chemistry deals with multi-nuclear
complexes. Many enzymes choose polynuclear sites to perform important oxidative
transformations. Some use dinuclear active sites, like sMMO and CcO, as has already been
discussed. Others occupy active centers with higher nuclearity, like nitrogenase, which employs a
Fe7MoS9C cofactor to reduce nitrogen to ammonia, or photosystem II, where water oxidation takes
place in a Mn4CaO5 cluster. Synthetic polynuclear complexes can reveal information on the
importance of cooperativity for the reactivity of these enzymes and their intermediates. This topic
12
will be further addressed in Chapter 3, which will deal with the activation of O2 with a hexanuclear
cobalt system.
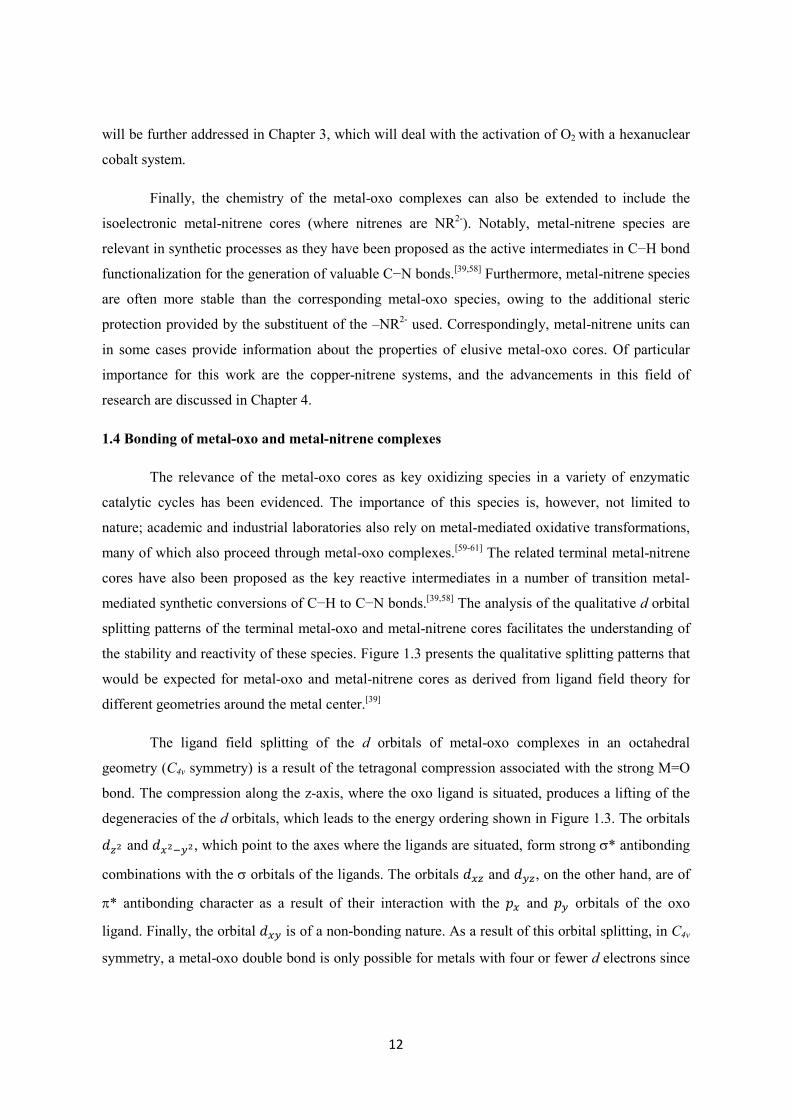
Finally, the chemistry of the metal-oxo complexes can also be extended to include the
isoelectronic metal-nitrene cores (where nitrenes are NR2-). Notably, metal-nitrene species are
relevant in synthetic processes as they have been proposed as the active intermediates in C−H bond
functionalization for the generation of valuable C−N bonds.[39,58] Furthermore, metal-nitrene species
are often more stable than the corresponding metal-oxo species, owing to the additional steric
protection provided by the substituent of the –NR2- used. Correspondingly, metal-nitrene units can
in some cases provide information about the properties of elusive metal-oxo cores. Of particular
importance for this work are the copper-nitrene systems, and the advancements in this field of
research are discussed in Chapter 4.
1.4 Bonding of metal-oxo and metal-nitrene complexes
The relevance of the metal-oxo cores as key oxidizing species in a variety of enzymatic
catalytic cycles has been evidenced. The importance of this species is, however, not limited to
nature; academic and industrial laboratories also rely on metal-mediated oxidative transformations,
many of which also proceed through metal-oxo complexes.[59-61] The related terminal metal-nitrene
cores have also been proposed as the key reactive intermediates in a number of transition metal-
mediated synthetic conversions of C−H to C−N bonds.[39,58] The analysis of the qualitative d orbital
splitting patterns of the terminal metal-oxo and metal-nitrene cores facilitates the understanding of
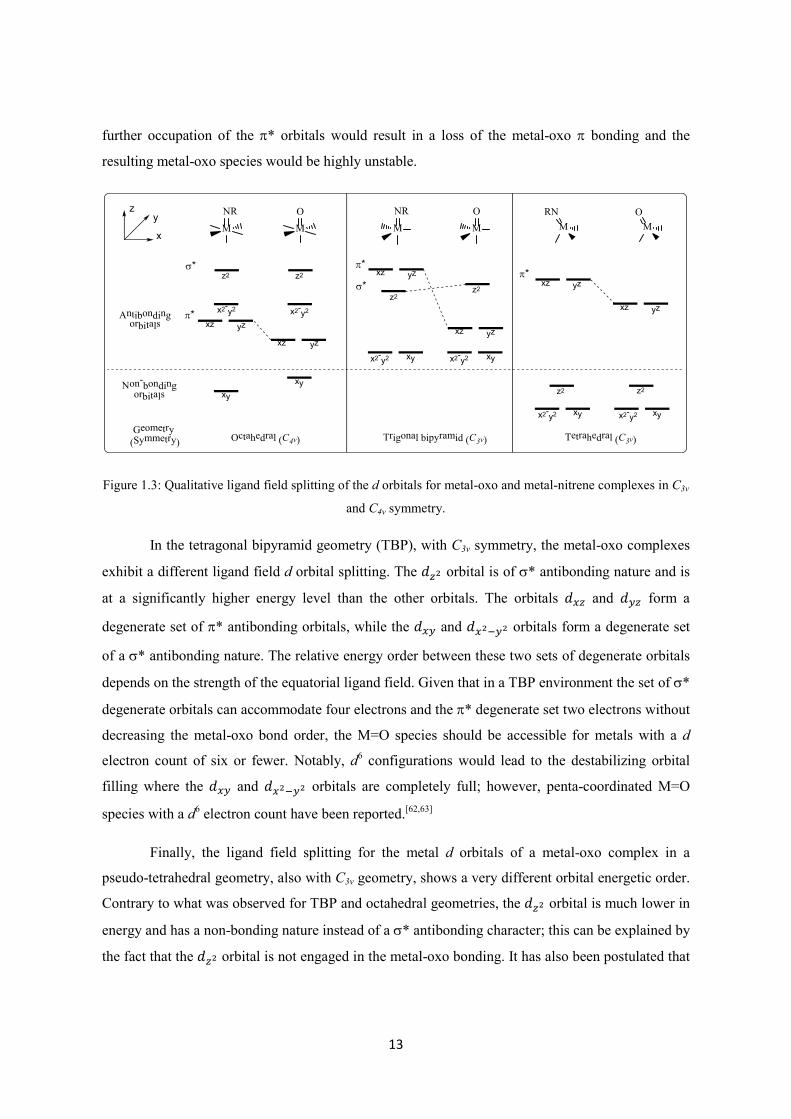
the stability and reactivity of these species. Figure 1.3 presents the qualitative splitting patterns that
would be expected for metal-oxo and metal-nitrene cores as derived from ligand field theory for
different geometries around the metal center.[39]
The ligand field splitting of the d orbitals of metal-oxo complexes in an octahedral
geometry (C4v symmetry) is a result of the tetragonal compression associated with the strong M=O
bond. The compression along the z-axis, where the oxo ligand is situated, produces a lifting of the
degeneracies of the d orbitals, which leads to the energy ordering shown in Figure 1.3. The orbitals
𝑑𝑑𝑧𝑧2 and 𝑑𝑑𝑥𝑥2−𝑦𝑦2, which point to the axes where the ligands are situated, form strong s* antibonding
combinations with the s orbitals of the ligands. The orbitals 𝑑𝑑𝑥𝑥𝑧𝑧 and 𝑑𝑑𝑦𝑦𝑧𝑧, on the other hand, are of
p* antibonding character as a result of their interaction with the 𝑝𝑝𝑥𝑥 and 𝑝𝑝𝑦𝑦 orbitals of the oxo
ligand. Finally, the orbital 𝑑𝑑𝑥𝑥𝑦𝑦 is of a non-bonding nature. As a result of this orbital splitting, in C4v
symmetry, a metal-oxo double bond is only possible for metals with four or fewer d electrons since
13
further occupation of the p* orbitals would result in a loss of the metal-oxo p bonding and the
resulting metal-oxo species would be highly unstable.
MO
MO
M
NRM
RN
Tetrahedral (C3v)Octahedral
(C4v)
z2 z2
x2-y2 xy x2-y2 xy
xz yz
xz yz
xz yz
xz yz
z2 z2
x2-y2 x2-y2
xy
xy
p*
p*
s*
z
x
y
Antibondingorbitals
Non-bondingorbitals
MO
M
NR
Trigonal bipyramid
(C3v)
xz yz
xz yz
z2z2
x2-y2 xy x2-y2 xy
p*
s*
Geometry (Symmetry)
Figure 1.3: Qualitative ligand field splitting of the d orbitals for metal-oxo and metal-nitrene complexes in C3v
and C4v symmetry.
In the tetragonal bipyramid geometry (TBP), with C3v symmetry, the metal-oxo complexes
exhibit a different ligand field d orbital splitting. The 𝑑𝑑𝑧𝑧2 orbital is of s* antibonding nature and is
at a significantly higher energy level than the other orbitals. The orbitals 𝑑𝑑𝑥𝑥𝑧𝑧 and 𝑑𝑑𝑦𝑦𝑧𝑧 form a
degenerate set of p* antibonding orbitals, while the 𝑑𝑑𝑥𝑥𝑦𝑦 and 𝑑𝑑𝑥𝑥2−𝑦𝑦2 orbitals form a degenerate set
of a s* antibonding nature. The relative energy order between these two sets of degenerate orbitals
depends on the strength of the equatorial ligand field. Given that in a TBP environment the set of s*
degenerate orbitals can accommodate four electrons and the p* degenerate set two electrons without
decreasing the metal-oxo bond order, the M=O species should be accessible for metals with a d
electron count of six or fewer. Notably, d6 configurations would lead to the destabilizing orbital
filling where the 𝑑𝑑𝑥𝑥𝑦𝑦 and 𝑑𝑑𝑥𝑥2−𝑦𝑦2 orbitals are completely full; however, penta-coordinated M=O
species with a d6 electron count have been reported.[62,63]
Finally, the ligand field splitting for the metal d orbitals of a metal-oxo complex in a
pseudo-tetrahedral geometry, also with C3v geometry, shows a very different orbital energetic order.
Contrary to what was observed for TBP and octahedral geometries, the 𝑑𝑑𝑧𝑧2 orbital is much lower in
energy and has a non-bonding nature instead of a s* antibonding character; this can be explained by
the fact that the 𝑑𝑑𝑧𝑧2 orbital is not engaged in the metal-oxo bonding. It has also been postulated that
14
the possibility of the 𝑑𝑑𝑧𝑧2 orbital getting hybridized by mixing with the 4s and 4𝑝𝑝z orbitals of the
metal, a phenomenon allowed in non-centrosymmetric geometries, lowers its energy and mitigates
its antibonding character.[64] Higher d-electron counts of up to eight electrons in low-spin
configuration could stabilize metal-oxo complexes in tetrahedral geometry.
The orbital splitting patterns discussed for the metal-oxo systems also apply for the metal-
nitrene cores, with small variations. The oxo (O2-) and nitrene (NR2-) ligands are isoelectronic;
however, they differ in their nuclear effective charge (Z*). The nitrene ligand has a smaller Z* than
the oxo since it possesses the same number of electrons but fewer protons. The filled p orbitals of
the nitrene are therefore higher in energy than those in the oxo, which makes them better
energetically matched with the d orbitals of the metal and results in the observed character of the
nitrene ligand being a better p donor than the oxo ligand. The better p donor character of the nitrene
ligand results in a stronger destabilization of the p* dxz and dyz orbitals of the metal relative to
those of the metal-oxo complexes (see Figure 1.3), which alters the qualitative ligand field splitting
in the C4v symmetry, giving rise to a 1+3+1 splitting pattern.
The ligand field d orbital splitting patterns can be useful to rationalize the occurrence of
transition metals M=X systems (X= O2- or NR2-), especially the metal-oxo ones, which are more
common and well-studied.[59] In an octahedral geometry, up to two electrons can fill the non-
bonding orbital 𝑑𝑑𝑥𝑥𝑦𝑦 for the complexes to maintain a bond order of three and be stable; hence, oxo-
complexes of early transition metals with low electron counts (d ≤ 2) are ubiquitous and unreactive.
With every electron added to the system, the bond order is reduced by 0.5, the metal-oxo bond is
activated and the resulting species are more reactive. The M=O bond remains a double bond up to a
d electron count of four. However, with d > 4 electrons, the metal-oxo bond is weakened and the
stabilization of such species is harder. Hence, as we move right in the periodic table, M=X cores
become rarer and more strongly oxidizing. Nature typically selects oxoiron(IV) complexes for
oxidizing substrates with strong C−H bonds. Since the Fe(IV) centers have four d-electrons, they
form metal-oxo complexes that are right at the balance point between stability and reactivity: they
can be generated but they are highly reactive. Indeed, at this balance point between stability and
reactivity lies the biggest challenge in the study of reactive intermediates.
1.5. Stabilizing late transition metal-oxo and metal-nitrene complexes
The stabilization of first-row high-valent late transition metal-oxo or -nitrene cores presents
difficulties due to the repulsive interactions between the electron-rich terminal oxo or nitrene
ligands and the electrons of the metal center, which are related to the above-discussed bonding

15
considerations. Accordingly, given that d4 metals can preserve the double bond character of the
M=O core, over 50 synthetic oxoiron(IV) complexes have been stabilized; however, metal-oxo
cores with later metals such as cobalt have only been trapped in a couple of cases, and only in the
form of Lewis acid adducts.[65,66] The strategy of utilizing external redox-innocent Lewis acids, such
as Sc(III) and similar cations, for stabilizing the short-lived intermediates has been employed in the
successful trapping of a low-spin (S = 1/2)[65] and an intermediate-spin (S = 3/2)[66] cobalt(IV)-oxo
intermediates in the form of [CoIV-O-Sc3+] cores, as well as for the trapping of a Lewis acid adduct
of a cationic copper-tosylnitrene species in the form of a [CuII-(NTs•)-Sc] core.[67] These three
species are shown in Figure 1.4. It is believed that the effect of the external electron withdrawing
group in these systems is related to its interaction with the M=X core, that lowers the electronic
repulsion between the metal and the ligand.[68]
NCoIV
N
N
NO
OO
O O
Sc(OTf)3
CoIV
NN
NN
ON
NN
N
N
N
Sc(OTf)3
[(TMG3tren)CoIV(O)Sc(OTf)3]2+ [(TAML)CoIV(O)Sc(OTf)3]2-
NCu
N
N
H
N
Sc(OTf)3Ts
II
[(AN)CuII(NTs)Sc(OTf)3]+
a) b) c)
Figure 1.4: Non-covalent interactions with external Lewis acids for the stabilization of the otherwise elusive
CoIV-oxo and terminal Cu-nitrene species in the complexes a) [(TMG3tren)CoIV(O)-Sc(OTf)3]2+,
b)[(TAML)CoIV(O)-Sc(OTf)3]2- and c) [(AN)CuII(NTs●)-Sc(OTf)3]+ where Ts= tosyl group.
Other important factor that must be considered for the trapping of high-valent reactive
intermediates is the design of the ligand that anchors the metal center. The ligands can be chosen to
enforce a certain geometry around the metal center; this strategy has been employed by several
groups to stabilize high-spin oxoiron(IV) complexes by using bulky tripodal ligands that enforce a
trigonal-bipyramidal geometry around the iron center.[49,54,69] The structure and nature of the donor
atoms of the ligand can also be chosen to provide a suitable ligand field environment to favor
certain electronic configuration on the metal center; for example Que Jr. and coworkers reported the
stabilization of the most reactive synthetic high-spin non-haem oxoiron(IV) complex by employing
a tripodal ligand with weaker field donors.[47] Additionally, ligands with sites capable of providing
non-covalent interactions with the terminal oxo or nitrene ligands have been also designed; the most
notorious example is the ligand H3Buea, employed by Borovik and coworkers, which is able to

16
mimic the secondary interactions of the enzyme by hydrogen-bond stabilization of an
Fe(III)−hydroxo complex.[54]
A purposeful ligand design is, hence, necessary for the stabilization of highly reactive M=X
cores. For systems dealing with late transition metals with high d electron counts, the introduction
of electron withdrawing groups that can alter the electronic distribution of the metal-oxo or metal-
nitrene cores must also be considered. Other aspects, like the solvent and temperature used for the
generation and testing of the M=X species, are also important in achieving the proper balance
between stability and reactivity of these species. All of these factors will be considered and
discussed in this work, which deals with the generation, trapping and reactivity testing of reactive
intermediates.
1.6. The aim of this work
The importance of, and interest in, the isolation and characterization of reactive
intermediates such as metal-oxo and metal-nitrene cores with late transition metals has been widely
discussed. During my doctoral research, I worked with a series of reactive intermediates with
terminal oxo and nitrene ligands. My work is divided into three different projects, according to the
metal center and the kind of ligand employed in each case. The aim of these projects was to
examine the effect that small changes in the ligand system, the participating metal centers or the
nitrene sources, have on the behavior of a given reactive system.
In the first project (Chapter 2), a new oxoiron(IV) complex, namely [(TMCO)FeIV(O)]2+,
was synthesized. The ligand TMCO is analogous to the existing TMC ligand but instead of having
four nitrogen donors, it has three nitrogen donors and an oxygen donor, which places the iron center
in a weaker field environment. The effect that this change has on the stability, electronic structure
and reactivity of this set of oxoiron(IV) complexes was thoroughly investigated.
In the second project (Chapter 3), the reactivity of a hexanuclear cobalt system [(L6)Co6II]
was studied. It has been reported that [(L6)Co6II] reacts with O2 to generate a peroxo and
subsequently an oxo intermediate.[70] The nucleophilic and electrophilic reactivity of the detected
intermediates was evaluated. The ability of [(L6)Co6II] to catalytically reduce O2 was also studied,
and proved to contrast with the previously reported analogous iron compound [(L6)Fe6II] that
performed the O−O bond formation reaction.[71]
Finally, in the third project (Chapter 4), a complete series of terminal copper-nitrenes was
studied. The effect that the Lewis acids (M) have on the generation and reactivity of the Lewis-acid
17
copper-nitrene adducts [(AN)Cu(NTs)(M)] was evaluated. Different nitrene sources were also
employed to test the role that the nitrene plays in the stabilization of terminal copper-nitrenes. For
the first time, it was possible to isolate two terminal copper nitrenes without a bound Lewis acid
together with their related Lewis acid adducts and characterize them.
The performed studies were supported by spectroscopic characterizations including isotope-
labeling experiments. Density functional theory (DFT) studies were also included to provide deeper
insights in the analysis of the experimental data. In order to complete the studies of the three
different systems, a significant number of collaborations took place both within our working group
and with external collaborators; all of them receive proper recognition for their work in the
acknowledgment section of this Thesis.
1.7. References
[1] W. B. Tolman, Ed., Activation of Small Molecules, Wiley-VCH Verlag GmbH & Co. KGaA, Weinheim, Germany, 2006.
[2] P. Tang, Q. Zhu, Z. Wu, D. Ma, Energy Environ. Sci. 2014, 7, 2580.
[3] Editorial, Nature 2013, 495, 281.
[4] J. Tollefson, Nat. News 2016.
[5] G. A. Olah, A. Goeppert, G. K. S. Prakash, Beyond Oil Gas Methanol Econ,.2nd Ed. 2009.
[6] R. G. Bergman, Nature 2007, 446, 391–393.
[7] A. E. Shilov, G. B. Shulpin, Chem. Rev. 1997, 97, 2879–2932.
[8] J. A. Labinger, J. E. Bercaw, Nature 2002, 417, 507–514.
[9] R. A. Periana, D. J. Taube, S. Gamble, H. Taube, T. Satoh, H. Fujii, Science 1998, 280, 560–564.
[10] X. Engelmann, I. Monte-Pérez, K. Ray, Angew. Chem. Int. Ed. 2016, 55, 7632–7649.
[11] R. H. Holm, P. Kennepohl, E. I. Solomon, E. I. Solomon, Chem. Rev. 1996, 96, 2239–2314.
[12] C. R. Hess, R. W. D. Welford, J. P. Klinman, Wiley Encycl. Chem. Biol. 2008, DOI:10.1002/9780470048672.wecb431.
[13] K. Ray, F. Felix, B. Wang, W. Nam, J. Am. Chem. Soc. 2014, 136, 13942–13958.
[14] M. Swart, M. Costas, Eds., Spin States in Biochemistry and Inorganic Chemistry, Wiley, Singapore, 2016.
[15] A. B. McQuarters, M. W. Wolf, A. P. Hunt, N. Lehnert, Angew. Chem. Int. Ed. 2014, 53, 4750–4752.
18
[16] J. Rittle, M. T. Green, Science 2010, 330, 933–938.
[17] M. J. Cryle, J. J. De Voss, Angew. Chem. Int. Ed. 2006, 45, 8221–8223.
[18] J. T. Groves, G. A. McClusky, J. Am. Chem. Soc. 1976, 98, 859–861.
[19] F. Ogliaro, N. Harris, S. Cohen, M. Filatov, S. P. de Visser, S. Shaik, J. Am. Chem. Soc. 2000, 122, 8977–8989.
[20] S. Shaik, S. Cohen, S. P. de Visser, P. K. Sharma, D. Kumar, S. Kozuch, F. Ogliaro, D. Danovich, Eur. J. Inorg. Chem. 2004, 207–226.
[21] S. P. de Visser, Coord. Chem. Rev. 2009, 253, 754–768.
[22] J. M. Bollinger, J. C. Price, L. M. Hoffart, E. W. Barr, C. Krebs, Eur. J. Inorg. Chem. 2005, 4245–4254.
[23] J. C. Price, E. W. Barr, B. Tirupati, J. M. Bollinger, C. Krebs, Biochemistry 2003, 42, 7497–7508.
[24] S. P. de Visser, J. U. Rohde, Y. M. Lee, J. Cho, W. Nam, Coord. Chem. Rev. 2013, 257, 381–393.
[25] R. L. Lieberman, A. C. Rosenzweig, Nature 2005, 434, 177–182.
[26] M. Merkx, D. A. Kopp, M. H. Sazinsky, J. L. Blazyk, J. Müller, S. J. Lippard, Angew. Chem. Int. Ed. 2001, 40, 2782–2807.
[27] I. Siewert, C. Limberg, Chem. - A Eur. J. 2009, 15, 10316–10328.
[28] T. C. Brunhold, Proc. Natl. Acad. Sci. U. S. A. 2007, 104, 20641–20642.
[29] C. E. Tinberg, S. J. Lippard, Acc. Chem. Res. 2011, 44, 280–288.
[30] S. Ferguson-Miller, G. T. Babcock, Chem. Rev. 1996, 96, 2889–2907.
[31] S. Yoshikawa, A. Shimada, Chem. Rev. 2015, 115, 1936–1989.
[32] A. A. Konstantinov, FEBS Lett. 2012, 586, 630–639.
[33] M. R. A. Blomberg, Biochemistry 2016, 55, 489–500.
[34] M. Wikström, Biochim. Biophys. Acta - Bioenerg. 2012, 1817, 468–475.
[35] K. Ray, F. Heims, M. Schwalbe, W. Nam, Curr. Opin. Chem. Biol. 2015, 25, 159–171.
[36] E. Bouwman, J. Reedijk, Coord. Chem. Rev. 2005, 249, 1555–1581.
[37] D. J. Xiao, E. D. Bloch, J. a Mason, W. L. Queen, M. R. Hudson, N. Planas, J. Borycz, A. L. Dzubak, P. Verma, K. Lee, F. Bonino, V. Crocella, J. Yano, S. Bordiga, D. G. Truhlar, L. Gagliardi, C. M. Brown, J. R. Long, Nat. Chem. 2014, 6, 590–595.
[38] S. Kundu, M. Schwalbe, K. Ray, Bioinorg. React. Mec. 2012, 8, 41–57.
[39] K. Ray, F. Heims, F. F. Pfaff, Eur. J. Inorg. Chem. 2013, 3784–3807.

19
[40] A. S. Borovik, Chem. Soc. Rev. 2011, 40, 1870–1874.
[41] K. Gunay, A.; Theopold, Chem. Rev. 2010, 1060–1081.
[42] J. Cho, R. Sarangi, W. Nam, Acc. Chem. Res. 2012, 45, 1321–1330.
[43] C. Krebs, D. G. Fujimori, C. T. Walsh, J. M. Bollinger, Acc. Chem. Res. 2007, 40, 484–492.
[44] L. Que Jr., Acc. Chem. Res. 2007, 40, 493–500.
[45] D. Wang, K. Ray, M. J. Collins, E. R. Farquhar, J. R. Frisch, L. Gomez, T. A. Jackson, M. Kerscher, A. Waleska, P. Comba, M. Costas, L. Que Jr., Chem. Sci. 2013, 4, 282–291.
[46] S. Fukuzumi, Y. Morimoto, H. Kotani, P. Naumov, Y.-M. Lee, W. Nam, Nat. Chem. 2010, 2, 756–759.
[47] A. N. Biswas, M. Puri, K. K. Meier, W. N. Oloo, G. T. Rohde, E. L. Bominaar, E. Münck, L. Que Jr., J. Am. Chem. Soc. 2015, 137, 2428–2431.
[48] S. T. Kleespies, W. N. Oloo, A. Mukherjee, L. Que Jr., Inorg. Chem. 2015, 54, 5053–5064.
[49] J. England, M. Martinho, E. R. Farquhar, J. R. Frisch, E. L. Bominaar, E. Münck, L. Que Jr., Angew. Chem. Int. Ed. 2009, 48, 3622–3626.
[50] J. Hohenberger, K. Ray, K. Meyer, Nat. Commun. 2012, 3, 720.
[51] C. V. Sastri, M. J. Park, T. Ohta, T. A. Jackson, A. Stubna, M. S. Seo, J. Lee, J. Kim, T. Kitagawa, E. Münck, L. Que Jr., W. Nam, J. Am. Chem. Soc. 2005, 127, 12494–12495.
[52] J. Kaizer, E. J. Klinker, N. Y. Oh, J. Rohde, W. J. Song, A. Stubna, J. Kim, E. Munck, W. Nam, L. Que Jr., J. Am Chem. Soc. 2004, 126, 472–473.
[53] S. T. Kleespies, W. N. Oloo, A. Mukherjee, L. Que Jr., Inorg. Chem. 2015, 54, 5053–5064.
[54] D. C. Lacy, R. Gupta, K. L. Stone, J. Greaves, J. W. Ziller, M. P. Hendrich, A. S. Borovik, J. Am. Chem. Soc. 2010, 132, 12188–12190.
[55] D. Schroder, H. Schwarz, Angew. Chem. Int. Ed. 1995, 34, 1973–1995.
[56] M. Schlangen, H. Schwarz, Chem. Commun. 2010, 46, 1878–80.
[57] Y. Shiota, K. Yoshizawa, J. Am. Chem. Soc. 2000, 122, 12317–12326.
[58] R. T. Gephart, T. H. Warren, Organometallics 2012, 31, 7728–7752.
[59] C. Limberg, Angew. Chem. Int. Ed. 2009, 48, 2270–2273.
[60] J. A. Labinger, Nature 2016, 536, 280–281.
[61] B. E. R. Snyder, P. Vanelderen, M. L. Bols, S. D. Hallaert, L. H. Böttger, L. Ungur, K. Pierloot, R. A. Schoonheydt, B. F. Sels, E. I. Solomon, Nature 2016, 536, 317–321.
[62] I. Efremenko, E. Poverenov, J. M. L. Martin, D. Milstein, J. Am. Chem. Soc. 2010, 132, 14886–14900.
[63] E. Poverenov, I. Efremenko, A. I. Frenkel, Y. Ben-David, L. J. W. Shimon, G. Leitus, L.
20
Konstantinovski, J. M. L. Martin, D. Milstein, Nature 2008, 455, 1093–1096.
[64] J. J. Scepaniak, M. D. Fulton, R. P. Bontchev, E. N. Duesler, M. L. Kirk, Je. M. Smith, J. Am. Chem. Soc. 2008, 130, 10515–10517.
[65] S. Hong, F. F. Pfaff, E. Kwon, Y. Wang, M. S. Seo, E. Bill, K. Ray, W. Nam, Angew. Chem. Int. Ed. 2014, 53, 10403–10407.
[66] F. F. Pfaff, S. Kundu, M. Risch, S. Pandian, F. Heims, I. Pryjomska-Ray, P. Haack, R. Metzinger, E. Bill, H. Dau, P. Comba, K. Ray, Angew. Chem. Int. Ed. 2011, 50, 1711–5.
[67] S. Kundu, E. Miceli, E. Farquhar, F. F. Pfaff, U. Kuhlmann, P. Hildebrandt, B. Braun, C. Greco, K. Ray, J. Am. Chem. Soc. 2012, 134, 14710–14713.
[68] I. Monte-Pérez, S. Kundu, K. Ray, Zeitschrift für Anorg. und Allg. Chemie 2015, 641, 78-82.
[69] J. P. Bigi, W. H. Harman, B. Lassalle-Kaiser, D. M. Robles, T. A. Stich, J. Yano, R. D. Britt, C. J. Chang, J. Am. Chem. Soc. 2012, 134, 1536–1542.
[70] S. Kundu, PhD Thesis: Synthesis, Spectroscopic Characterization and Reactivity of the High-Valent Metal-Oxo/Imido Cores of the Late Transition Metals, Humboldt-Universität zu Berlin, Berlin, 2013.
[71] S. Kundu, E. Matito, S. Walleck, F. F. Pfaff, F. Heims, B. Rábay, J. M. Luis, A. Company, B. Braun, T. Glaser, K. Ray, Chem.- Eur. J. 2012, 18, 2787–91.

Chapter 2:
Trapping and Characterization of a New FeIV=O Intermediate with Enhanced Reactivity due
to Innovative Ligand Design

22
Compounds discussed in Chapter 2
Ligand Fe(II) complex Oxoiron(IV) intermediate
N N
N N
N N
N NFeII
N N
N NFeIV
O
TMC Fe-TMC
NN
ON
N N
N OFeII
N N
N OFeIV
O
TMCO Fe-1 Fe-2
NN
NN
N N
N NFeII
N N
N NFeIV
O
TMCN Fe-3 Fe-4
NN
ON
D3C
D3C
CD3
N N
N O
D3C CD3
D3C
FeII
N N
N OCD3
D3C
FeIV
O
D3C
TMCO-d Fe-1d Fe-2d
NN
NN
D3C
D3C
CD3
CD3
N N
N N
D3C CD3
D3C
FeII
CD3
N N
N N
CD3
D3C
FeIV
O
D3C
CD3
TMCN-d Fe-3d Fe-4d
23
2.1. Introduction
High-valent oxoiron species have been proposed, and in many cases identified, as key
reactive intermediates in the catalytic cycles of iron enzymes responsible for processes that couple
the activation of dioxygen with the oxidation of substrates. The reactions catalyzed by these species
are as diverse as hydroxylation, halogenation, cyclization, epoxidation and desaturation, many of
which are vital for processes like respiration, catabolism and angiogenesis.[1] Oxoiron species have
been trapped in enzymes with haem and non-haem active sites, the latter ones involving both mono-
metallic as well as di-metallic active sites.
The first evidence of high-valent oxoiron species involved in enzymatic activity was
reported in the early 1980s for the haem peroxidases.[2,3] Now, after nearly 40 years of intense
research in this field, crystal structures of the active sites of various haem-enzymes have been
reported, including peroxidases, oxygenases and catalases such as horseradish peroxidase,
cytochrome P450 (P450) and catalase.[4] In all cases, the detected high-valent iron-oxo active
intermediate consists of an iron center in a ferryl state coordinated to an oxo ligand, and coupled to
a cationic radical. Depending on the enzyme, the cationic radical is located in the porphyrin ring or
in the amino acid residue near the haem ring.[4] The iron(IV) center in these systems is in an
intermediate S = 1 state and it is either ferromagnetically or antiferromagnetically coupled to the
radical, resulting in overall S = 3/2 or S = 1/2 states, respectively.[1] A relevant example of a haem-
containing oxoiron intermediate is Compound-I of P450 (Cpd-I), a ferryl-porphyrin cation radical,
shown in Figure 2.1 a.
N
N N
N
-OOC COO
-
FeIV
O
X
Compound-I
a) b)
FeIV FeIVO
O
O OH
O O
Glu
NHis
OGluNHis
OGlu
Glu
Intermediate Q
c)
FeIV
NHis
O
OOAspNHis
R
O
TauD-J
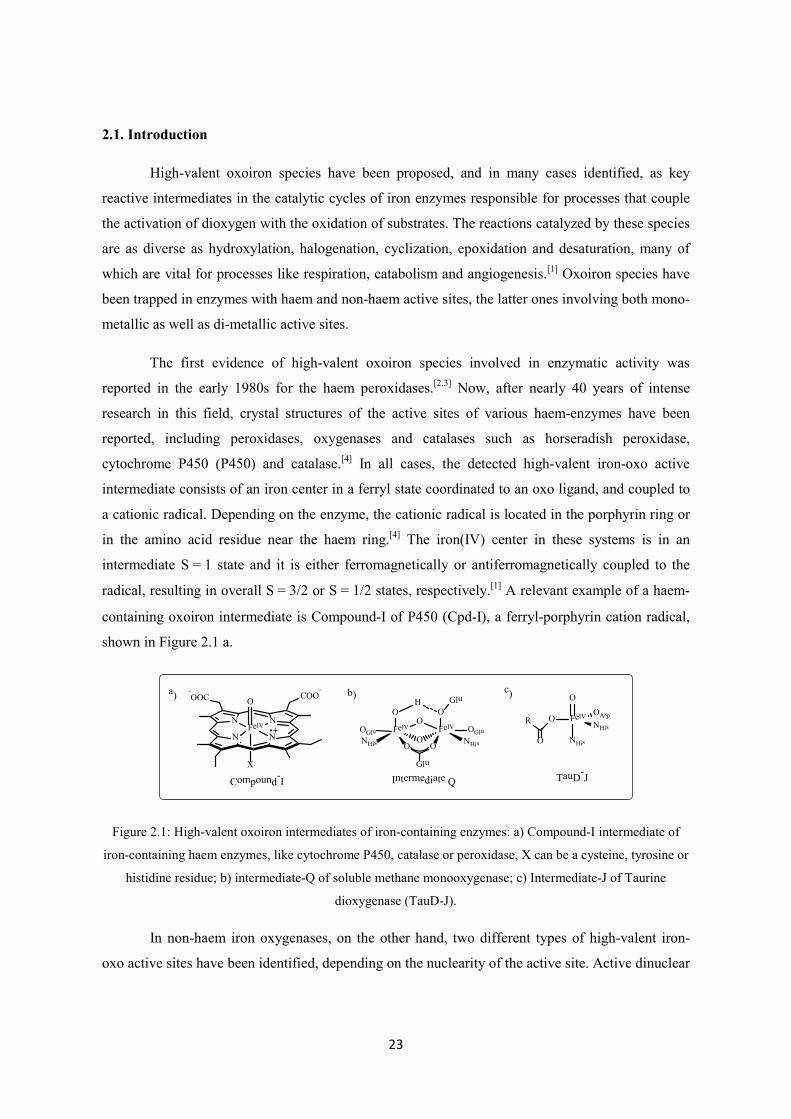
Figure 2.1: High-valent oxoiron intermediates of iron-containing enzymes: a) Compound-I intermediate of
iron-containing haem enzymes, like cytochrome P450, catalase or peroxidase, X can be a cysteine, tyrosine or
histidine residue; b) intermediate-Q of soluble methane monooxygenase; c) Intermediate-J of Taurine
dioxygenase (TauD-J).
In non-haem iron oxygenases, on the other hand, two different types of high-valent iron-
oxo active sites have been identified, depending on the nuclearity of the active site. Active dinuclear
24
iron centers can be found in the enzymes methane and toluene mono-oxygenases, fatty acid
desaturases and the ribonucleotide-reductase. The intermediate-Q shown in Figure 2.1 b is
associated with the soluble methane monooxygenase (MMO). The active site of this enzyme
contains a diiron center coordinated by two histidines and four carboxylates and the intermediate-Q
is postulated to involve a Fe2IV-(µ-O)2 diamond core.[5]
A third type of high-valent oxoiron active species has been detected for non-haem
mononuclear sites. Despite the size and mechanistic diversity of the family of enzymes that utilize
mononuclear non-haem iron centers, most of them present a common structural arrangement in
which the iron center is coordinated by two histidines and a carboxylate group, forming the
characteristic 2-His/1-Carboxylate facial triad, which occupies a face of the octahedron. The active
species for this family of enzymes contains a high-valent iron-oxo core coordinated by the facial
triad and a fifth ligand. The nature of the fifth ligand depends on the enzyme. For the Taurine
dioxygenase (TauD)[6], the fifth ligand in the intermediate-J (TauD-J, Figure 2.1 c) is a succinate
resulting from the decarboxylation of the co-substrate α-ketoglutarate.[7,8] In all the non-haem
enzymes studied so far, the iron(IV) center has been found to be in the high-spin S = 2 state. It has
been suggested that this is due to the weak ligand field exerted by the combination of histidine and
carboxylate ligands present at the non-haem active sites.[1,9]
Given the extended natural occurrence of the high-valent iron-oxo units and their
participation as active species in a number of valuable chemical transformations, vast attempts have
been made to model these crucial intermediates in the last few decades. The first fully characterized
high-valent iron-oxo complex was reported in 1981 by Groves and coworkers.[10] They were able to
obtain the oxoiron(IV) porphyrin cation radical [(TMP●+)FeIV(O)(CH3OH)]+ via the oxidation of
[(TMP)FeIII(Cl)] (TMP = meso-tetramesityl porphinate anion), with meta-choroperbenzoic acid at
−78 °C. Characterized by UV-vis absorption spectroscopy (UV-vis), electron paramagnetic
resonance (EPR), Möβbauer, resonance Raman (rRaman) and extended X-ray absorption fine
structure (EXAFS), the iron center of the active species was found to be in a S = 1 configuration
and was active in olefin epoxidation and alkane hydroxylation reactions. After this report, a great
number of oxoiron(IV) porphyrin radicals have been synthesized, spectroscopically characterized
and exhaustively researched in a variety of oxidation reactions.[11]
Despite the initial success in stabilizing the iron-oxo complexes with porphyrinic ligands, it
was not until 2000 that the first characterized non-haem oxoiron(IV) was reported by Wieghardt
and coworkers.[12] It has been suggested that the reason for this 20-year delay was the difficulty in
25
characterizing non-haem iron-oxo species by routine spectroscopy techniques given the lack of
suitable spectroscopic signatures for the presence of an iron-oxo unit.[9,13] However, a great
breakthrough in the area came in 2003 when the groups led by Que Jr. and Nam came together and
reported the first crystal structure of an oxoiron(IV) complex formed from the reaction of the
complex [(TMC)FeII(OTf)2] (TMC = 1,4,8,11-tetramethyl-1,4,8,11-tetraazacyclotetradecane) and
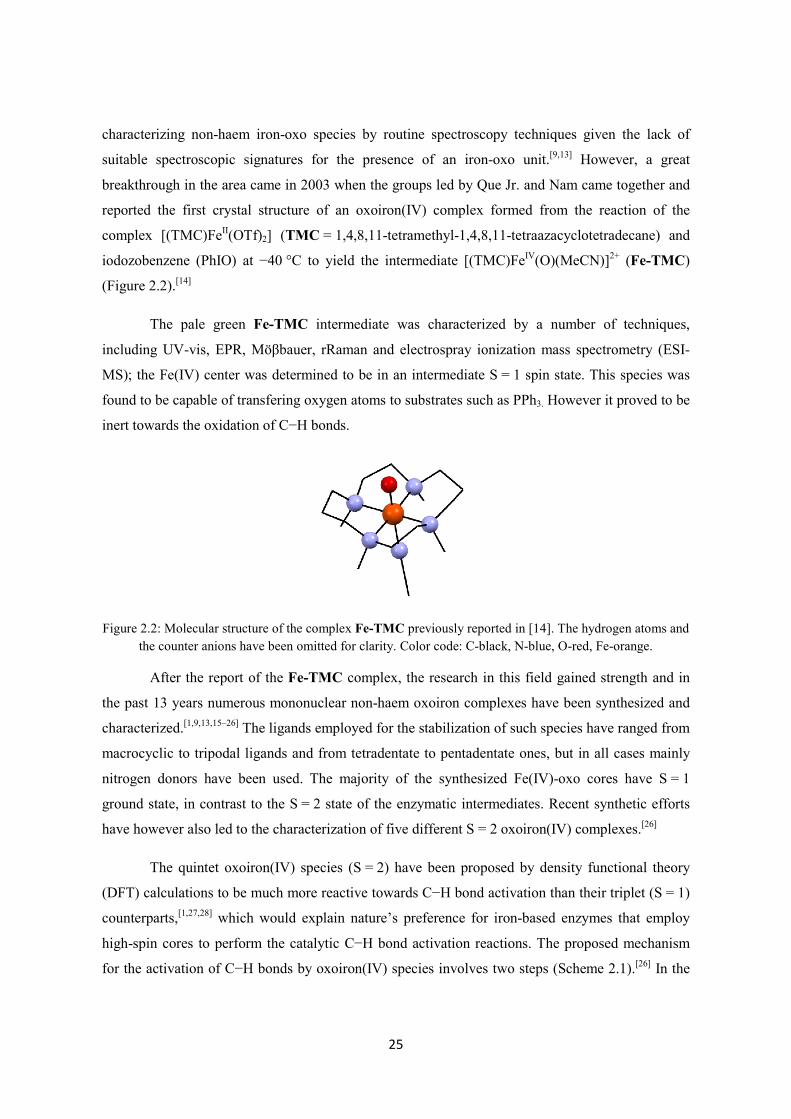
iodozobenzene (PhIO) at −40 °C to yield the intermediate [(TMC)FeIV(O)(MeCN)]2+ (Fe-TMC)
(Figure 2.2).[14]
The pale green Fe-TMC intermediate was characterized by a number of techniques,
including UV-vis, EPR, Möβbauer, rRaman and electrospray ionization mass spectrometry (ESI-
MS); the Fe(IV) center was determined to be in an intermediate S = 1 spin state. This species was
found to be capable of transfering oxygen atoms to substrates such as PPh3. However it proved to be
inert towards the oxidation of C−H bonds.
Figure 2.2: Molecular structure of the complex Fe-TMC previously reported in [14]. The hydrogen atoms and the counter anions have been omitted for clarity. Color code: C-black, N-blue, O-red, Fe-orange.
After the report of the Fe-TMC complex, the research in this field gained strength and in
the past 13 years numerous mononuclear non-haem oxoiron complexes have been synthesized and
characterized.[1,9,13,15–26] The ligands employed for the stabilization of such species have ranged from
macrocyclic to tripodal ligands and from tetradentate to pentadentate ones, but in all cases mainly
nitrogen donors have been used. The majority of the synthesized Fe(IV)-oxo cores have S = 1
ground state, in contrast to the S = 2 state of the enzymatic intermediates. Recent synthetic efforts
have however also led to the characterization of five different S = 2 oxoiron(IV) complexes.[26]
The quintet oxoiron(IV) species (S = 2) have been proposed by density functional theory
(DFT) calculations to be much more reactive towards C−H bond activation than their triplet (S = 1)
counterparts,[1,27,28] which would explain nature’s preference for iron-based enzymes that employ
high-spin cores to perform the catalytic C−H bond activation reactions. The proposed mechanism
for the activation of C−H bonds by oxoiron(IV) species involves two steps (Scheme 2.1).[26] In the

26
first step, the hydrogen atom transfer (HAT) takes place from the substrate C−H bond to the
oxoiron complex, affording an alkyl radical and an [FeIII(OH)] species. In the second step, an
oxygen rebound (OR)[29–32] typically occurs, leading to the generation of an Fe(II) species and the
oxidized substrate. The higher reactivity of the S = 2 oxoiron(IV) species compared to the S = 1
cores has been rationalized by the action of two factors both affecting the HAT step of the
mechanism; the first of them relates to the way the substrate approaches the oxoiron center in each
case and the second one regards the exchange interactions.
FeIV
O
FeIII
OHR3C H R3C
FeII
LR3C-OH+
HAT OR
Scheme 2.1: Proposed mechanism of C−H bond activation performed by oxoiron(IV) complexes. The first
step proposed is a hydrogen atom transfer (HAT), followed by an oxygen rebound (OR) step.
The orbital splitting, derived from considerations of simple ligand field theory, for an
iron(IV)-oxo species in a fourfold symmetry is shown in Figure 2.3.[33] The energetic order of the d
orbitals is a consequence of the tetragonal compression due to the strong M=O bond. The orbitals
𝑑𝑑𝑧𝑧2 and 𝑑𝑑𝑥𝑥2−𝑦𝑦2 form strong antibonding combinations with the s orbitals of the ligand, whereas the
𝑑𝑑𝑥𝑥𝑧𝑧 and 𝑑𝑑𝑦𝑦𝑧𝑧 orbitals form strong p* antibonding combinations with the 𝑝𝑝𝑥𝑥 and 𝑝𝑝𝑦𝑦 orbitals of the
oxo ligand. Since the HAT reaction is an electrophilic attack by the Fe=O core, the frontier
molecular orbitals (FMOs) of the oxoiron(IV) need to be low-energy, unoccupied orbitals that are
highly localized and able to achieve a good overlap with the substrate FMOs.[34] The key FMOs
likely to be involved in the HAT step have been determined, by experimental and theoretical
methods,[34–36] to be the singly-occupied p* 𝑑𝑑𝑥𝑥𝑧𝑧/𝑦𝑦𝑧𝑧 and the unoccupied s* 𝑑𝑑𝑧𝑧2 .
The transfer of a hydrogen atom from the substrate to the oxoiron species would be
accompanied by the introduction of one electron to either one of these FMOs. If a p-attack takes
place both in the S = 1 and S = 2 cases (Figure 2.3 a and b), the insertion of the electron into the p*
𝑑𝑑𝑥𝑥𝑧𝑧/𝑦𝑦𝑧𝑧 orbitals implies that the substrate must approach in a side-on manner to achieve maximum
overlapping of the orbitals; this approach would result in a high steric interaction between the
substrate and the ligand of the oxoiron complex, thereby raising the reaction energy barrier. An
additional pathway, a s attack (Figure 2.3 c), is available only for the S = 2 complexes (the triplet
s-path has been determined to be too high in energy).[37] In this pathway, the insertion of one

27
electron into the s* orbital 𝑑𝑑𝑧𝑧2 involves a linear transition state where the steric interactions
between the oxoiron core and the substrate are limited, thus reducing the reaction barrier.[16,21,33]
S=1
sCH
s*z2
s*x2-y2
p*xz-yz
δxy
p*FeO
sCH
p-approach
S=2
sCH
s*z2
s*x2-y2
p*xz-yz
δxy
sCH
s*z2
s-approach
S=2
sCH
s*z2
s*x2-y2
p*xz-yz
δxy
p*FeO
sCH
p-approacha) b)
c)
Figure 2.3: Comparison of the FMOs involved in the single electron transfer HAT process carried out by
oxoiron(IV) complexes with fourfold symmetry on the S = 1 and S = 2 surfaces. Reproduced from [33].
The exchange interactions, on the other hand, measure the decrease in electron-electron
repulsion between the spin-identical electrons as a result of their mutual avoidance.[33] The
exchange-enhanced reactivity predicts that the pathway where the number of spin-identical
electrons in the metal increases will be favored by exchange stabilization, since the number of
exchange interactions will increase. This effect is maximized in an S = 2 oxoiron(IV) core in which
the initial number of spin-identical electrons is four (Figure 2.3). The addition of one more electron
stabilizes the system with four new exchange interactions, which is the maximum exchange
stabilization.[33] In the case of an intermediate-spin S = 1 oxoiron(IV) core, the opposite occurs,
since the addition of one electron to a singly-occupied p* orbital reduces the number of exchange
interactions. Thus, due to the exchange interactions, the quintet barrier is lower than the triplet one
(Figure 2.4).[16,33]
The reactivity of the oxoiron(IV) compounds has been shown to be affected not only by the
nature of the ground spin state of the iron in the complex but also by the accessibility of the excited
state. The higher reactivity of the S = 2 state was employed by Shaik and coworkers to explain the

28
reactivity patterns observed for S = 1 oxoiron(IV) compounds through the introduction of the two-
state reactivity model (TSR).[38,39] This model postulates that the net activation barrier for the C−H
bond cleavage performed by an S = 1 oxoiron compound is a weighted blend of the barrier of the
reaction on the ground triplet surface and that on the excited quintet surface. Since the transition
state on the quintet surface lies lower in energy than the transition state on the triplet surface, a
decrease in the gap between the triplet and quintet states in a compound (∆ETQ) results in an
increase in the accessibility of the quintet state and thus a decrease the activation barrier for the
C−H bond activation. This phenomenon is represented in Figure 2.4 and has proven to be
fundamental in understanding the reactivity of S = 1 oxoiron(IV) complexes.
Reaction Coordinate
S=2
S=1
∆ETQ
FeIV
OR H
FeIII
OHR
Transition State
∆G
S=2
S=1
Figure 2.4: Representation of the TSR during the hydrogen atom abstraction reactions of an oxoiron(IV)
compound in a tetragonal geometry. ∆ETQ is the energy gap between the triplet and quintet states. Figure
reproduced from reference [26].
To date, the two most reactive mononuclear non-haem oxoiron(IV) models synthesized and
completely characterized are the [(Me3NTB)FeIV(O)(MeCN)]2+ (Me3NTB = tris((N-methyl-
benzimidazol-2-yl)methyl)amine)) complex reported by Latour, Shaik, Nam and coworkers,[22] and
the [(TQA)FeIV(O)(MeCN)]2+ (TQA = tris(2-quinolyl-methyl)amine)) compound reported by
Bominaar, Münk, Que Jr. et al;[24] both are presented in Figure 2.5. The first one, obtained from the
reaction of [(Me3NTB)FeII(MeCN)](OTf)2 with m-chlorperbenzoic acid in acetonitrile at −40 °C,
possesses an intermediate-spin (S = 1) triplet ground state but a highly accessible S = 2 high-spin
state, resulting in extremely low activation barriers and high reactivity. In contrast, the recently
reported [(TQA)FeIV(O)(MeCN)]2+ complex, obtained from the reaction of [(TQA)FeII(OTf)2] with
soluble iodosobenzene (sPhIO) in MeCN at −40 °C was found to have a high-spin (S = 2) quintet
ground state and reactivity rates comparable to those of the natural intermediate TauD-J.
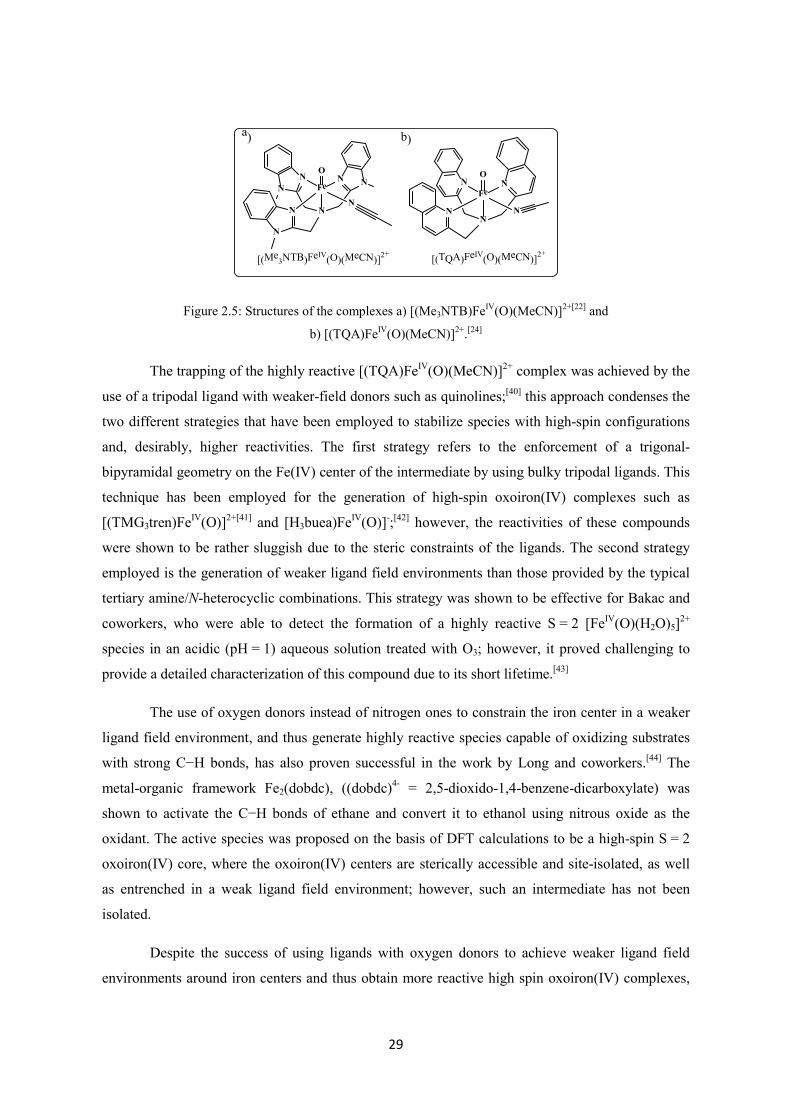
29
Fe
ON N
NN
N
N
NN
Fe
ON N
NN N
[(Me3NTB)FeIV(O)(MeCN)]2+ [(TQA)FeIV(O)(MeCN)]2+
a) b)
Figure 2.5: Structures of the complexes a) [(Me3NTB)FeIV(O)(MeCN)]2+[22] and
b) [(TQA)FeIV(O)(MeCN)]2+.[24]
The trapping of the highly reactive [(TQA)FeIV(O)(MeCN)]2+ complex was achieved by the
use of a tripodal ligand with weaker-field donors such as quinolines;[40] this approach condenses the
two different strategies that have been employed to stabilize species with high-spin configurations
and, desirably, higher reactivities. The first strategy refers to the enforcement of a trigonal-
bipyramidal geometry on the Fe(IV) center of the intermediate by using bulky tripodal ligands. This
technique has been employed for the generation of high-spin oxoiron(IV) complexes such as
[(TMG3tren)FeIV(O)]2+[41] and [H3buea)FeIV(O)]-;[42] however, the reactivities of these compounds
were shown to be rather sluggish due to the steric constraints of the ligands. The second strategy
employed is the generation of weaker ligand field environments than those provided by the typical
tertiary amine/N-heterocyclic combinations. This strategy was shown to be effective for Bakac and
coworkers, who were able to detect the formation of a highly reactive S = 2 [FeIV(O)(H2O)5]2+
species in an acidic (pH = 1) aqueous solution treated with O3; however, it proved challenging to
provide a detailed characterization of this compound due to its short lifetime.[43]
The use of oxygen donors instead of nitrogen ones to constrain the iron center in a weaker
ligand field environment, and thus generate highly reactive species capable of oxidizing substrates
with strong C−H bonds, has also proven successful in the work by Long and coworkers.[44] The
metal-organic framework Fe2(dobdc), ((dobdc)4- = 2,5-dioxido-1,4-benzene-dicarboxylate) was
shown to activate the C−H bonds of ethane and convert it to ethanol using nitrous oxide as the
oxidant. The active species was proposed on the basis of DFT calculations to be a high-spin S = 2
oxoiron(IV) core, where the oxoiron(IV) centers are sterically accessible and site-isolated, as well
as entrenched in a weak ligand field environment; however, such an intermediate has not been
isolated.
Despite the success of using ligands with oxygen donors to achieve weaker ligand field
environments around iron centers and thus obtain more reactive high spin oxoiron(IV) complexes,

30
as proved by Long[44] and Bakac[43], no study has been carried out that systematically shows the
effect of replacing nitrogen donors with oxygen ones in a given ligand. Such a study could improve
our understanding of the factors that control both the electronic structure as well as the reactivity
patterns in non-haem oxoiron(IV) complexes, and thus help us to generate more reactive
compounds and eventually design better catalysts to perform synthetic C−H bond oxidations.
In this chapter, we present a first step towards a systematic study of the effect that the
replacement of nitrogen donors with oxygen ones in a given ligand has on the generation, electronic
structure and reactivity of the related oxoiron(IV) compounds. The TMC ligand, used to obtain the
first crystal structure of a mononuclear non-haem oxoiron(IV) complex (Fe-TMC), was taken as a
point of reference and the analogous ligand TMCO (4,8,12-trimethyl-1-oxa-4,8,12-
triazacyclotetradecane), containing one oxygen donor and three nitrogen ones, was produced. The
iron complex [(TMCO)FeII(MeCN)(OTf)](OTf) (Fe-1) was synthesized and a new oxoiron(IV)
complex, [(TMCO)FeIV(O)(MeCN)]2+ (Fe-2), was generated from the reaction of Fe-1 with sPhIO
at −90 °C in CH2Cl2. This new complex was further characterized and tested; the results obtained
are described and discussed below.
2.2. Results and discussion
2.2.1 Synthesis of the TMCO ligand
Since they were first synthesized in 1961,[45] macrocyclic polyamines, such as the
12-membered ring Cyclen (1,4,7,10-tetraazacyclododecane), also called [12]aneN4, and its
derivatives[46], have received a lot of attention, particularly after it was discovered that they were
able to chelate a wide variety of metal cations and generate stable complexes.[47] Research into this
family of macrocyclic polyamines and their applications has extended to various fields. In
medicinal chemistry, some derivatives are employed as magnetic resonance imaging (MRI) and
positron emission tomography (PET) contrasting agents as well as deoxyribonucleic acid (DNA)
cleavage agents.[48,49] In the field of bioinorganic chemistry, which is of greater interest for this
study, they have been utilized as versatile ligands for the biomimetic chemistry of dioxygen
activation by metal complexes.[50] The most studied ligand in this large family of macrocycles is the
TMC or Me4[14]aneN4, which is a 14 membered ring with four methylated amines in positions 1,5,
8 and 12 of the cycle, as shown in Figure 2.6.
The oxaaza counterparts of these tetraaza macrocycles, where one or more of the nitrogen
donors are replaced by oxygen atoms, have received less attention but, nonetheless, some
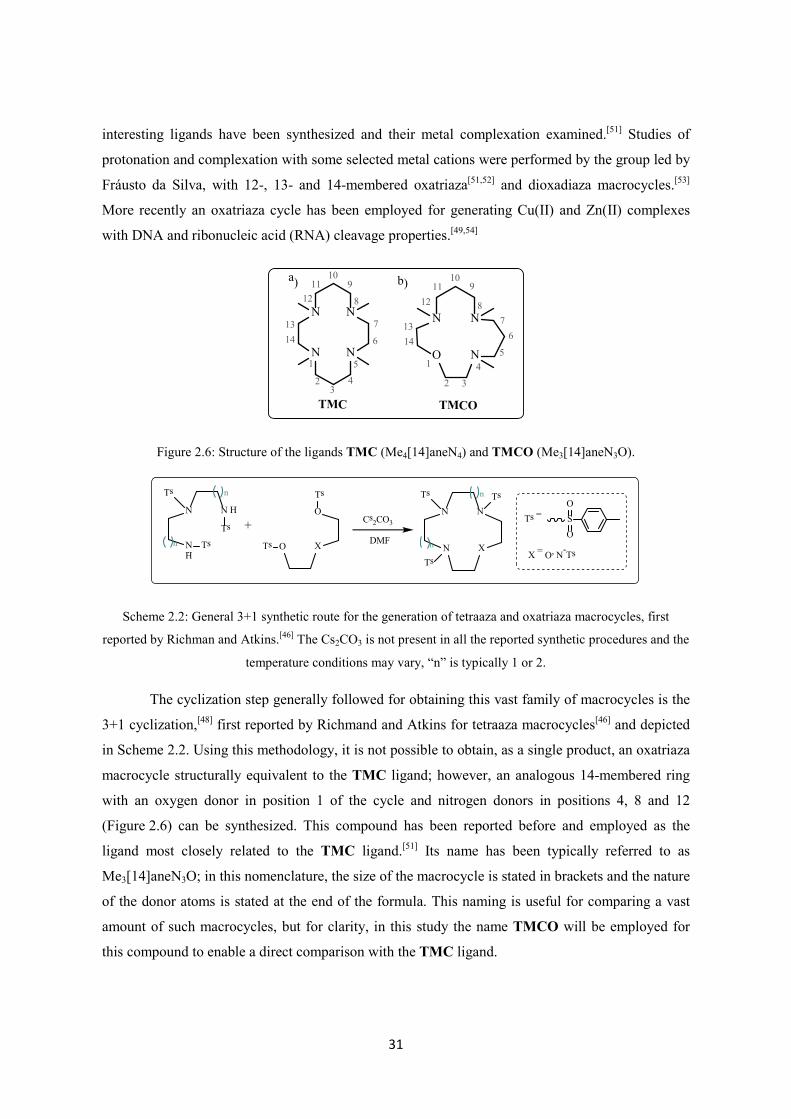
31
interesting ligands have been synthesized and their metal complexation examined.[51] Studies of
protonation and complexation with some selected metal cations were performed by the group led by
Fráusto da Silva, with 12-, 13- and 14-membered oxatriaza[51,52] and dioxadiaza macrocycles.[53]
More recently an oxatriaza cycle has been employed for generating Cu(II) and Zn(II) complexes
with DNA and ribonucleic acid (RNA) cleavage properties.[49,54]
N N
N N
TMC TMCO
a) b)
N N
O N1
2 3
45
67
8
910
1112
1314
1
23
4
5
6
7
8
910
1112
1314
Figure 2.6: Structure of the ligands TMC (Me4[14]aneN4) and TMCO (Me3[14]aneN3O).
N
N N
Ts
Ts
Ts
O
XOTs
Ts
+
H
H
n
n XN
N N
Ts Ts
Ts
n
n
Ts = SO
O
X =
O, N-Ts
Cs2CO3
DMF
Scheme 2.2: General 3+1 synthetic route for the generation of tetraaza and oxatriaza macrocycles, first
reported by Richman and Atkins.[46] The Cs2CO3 is not present in all the reported synthetic procedures and the
temperature conditions may vary, “n” is typically 1 or 2.
The cyclization step generally followed for obtaining this vast family of macrocycles is the
3+1 cyclization,[48] first reported by Richmand and Atkins for tetraaza macrocycles[46] and depicted
in Scheme 2.2. Using this methodology, it is not possible to obtain, as a single product, an oxatriaza
macrocycle structurally equivalent to the TMC ligand; however, an analogous 14-membered ring
with an oxygen donor in position 1 of the cycle and nitrogen donors in positions 4, 8 and 12
(Figure 2.6) can be synthesized. This compound has been reported before and employed as the
ligand most closely related to the TMC ligand.[51] Its name has been typically referred to as
Me3[14]aneN3O; in this nomenclature, the size of the macrocycle is stated in brackets and the nature
of the donor atoms is stated at the end of the formula. This naming is useful for comparing a vast
amount of such macrocycles, but for clarity, in this study the name TMCO will be employed for
this compound to enable a direct comparison with the TMC ligand.

32
O
OOTs
Ts
+
ON
N N
Ts Ts
Ts
SO
O
Cs2CO3
DMFNH
N HN
Ts Ts
Ts
+
NH2
NH NH2
H2O / CH2Cl2
NH
N HN
Ts Ts
Ts 90 %
Cl
TsCl
92 %
ON
N N
Ts Ts
Ts
24 hrs.
72 hrs.
HBr in acetic
acid
Reflux48
hrs. ON
N N
H H
H63
%
ON
N N
H H
H
H2O24
hrs. ON
N N
50 %
Formaldehyde/Formic
acid
1)
2)
3)
4)
TMCO
Scheme 2.3: Four-stepped synthesis of the TMCO ligand.
The full synthesis of the ligand TMCO was performed via the four steps shown in Scheme
2.3, with small modifications from previous reports.[51,55,56] Firstly, the 3,3’-diaminodipropyl-amine
was tritosylated by using tosyl-chloride. This was a facile synthesis with a good yield of 90% of the
tri-tosylated product and could be performed on a gram scale. The second step was the 3+1
macrocyclization of the protected polyamine with diethyleneglycol-di(p-toluenesulfonate) in the
presence of Cs2CO3. In this reaction, the cesium carbonate acts as a base to generate the dianion of
the sulfonamide-protected polyamine that would further couple with the ditosylate; in this step, the
sulfonamides act as protecting groups but also provide a Thorpe-Ingold-type effect on the transition
state that favors intramolecular cyclization instead of intermolecular oligomerization.[57] Despite the
fact that this step requires long reaction times, the obtained yields were good. The third step
consisted of the deprotection of the polyazamacrocycle using a hydrobromic acid / acetic acid
mixture to obtain [14]aneN3O in modest yields. Finally, in the last step, the methylation of the
macrocycle yielded the ligand TMCO in the form of a yellow oil, again in only modest yields. The
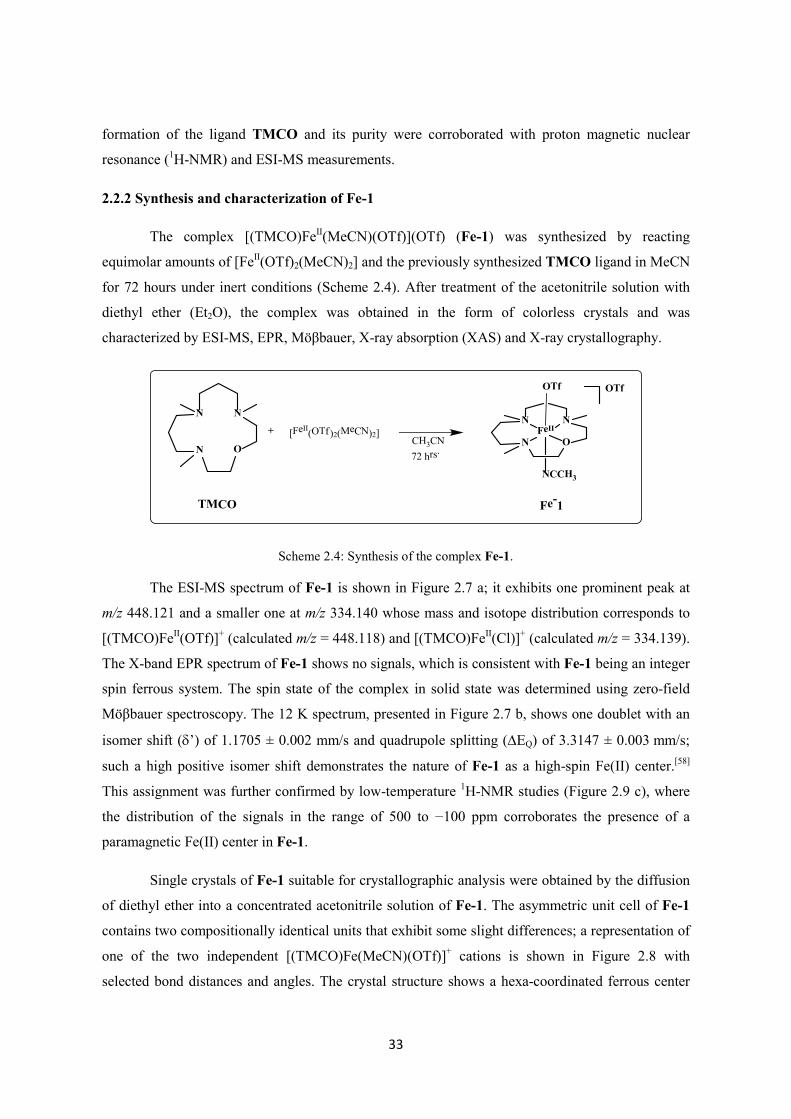
33
formation of the ligand TMCO and its purity were corroborated with proton magnetic nuclear
resonance (1H-NMR) and ESI-MS measurements.
2.2.2 Synthesis and characterization of Fe-1
The complex [(TMCO)FeII(MeCN)(OTf)](OTf) (Fe-1) was synthesized by reacting
equimolar amounts of [FeII(OTf)2(MeCN)2] and the previously synthesized TMCO ligand in MeCN
for 72 hours under inert conditions (Scheme 2.4). After treatment of the acetonitrile solution with
diethyl ether (Et2O), the complex was obtained in the form of colorless crystals and was
characterized by ESI-MS, EPR, Möβbauer, X-ray absorption (XAS) and X-ray crystallography.
N N
N OFeII
OTf
NCCH3
OTf
N N
N O
+ [FeII(OTf)2(MeCN)2]
72 hrs.
CH3CN
TMCO Fe-1
Scheme 2.4: Synthesis of the complex Fe-1.
The ESI-MS spectrum of Fe-1 is shown in Figure 2.7 a; it exhibits one prominent peak at
m/z 448.121 and a smaller one at m/z 334.140 whose mass and isotope distribution corresponds to
[(TMCO)FeII(OTf)]+ (calculated m/z = 448.118) and [(TMCO)FeII(Cl)]+ (calculated m/z = 334.139).
The X-band EPR spectrum of Fe-1 shows no signals, which is consistent with Fe-1 being an integer
spin ferrous system. The spin state of the complex in solid state was determined using zero-field
Möβbauer spectroscopy. The 12 K spectrum, presented in Figure 2.7 b, shows one doublet with an
isomer shift (δ’) of 1.1705 ± 0.002 mm/s and quadrupole splitting (∆EQ) of 3.3147 ± 0.003 mm/s;
such a high positive isomer shift demonstrates the nature of Fe-1 as a high-spin Fe(II) center.[58]
This assignment was further confirmed by low-temperature 1H-NMR studies (Figure 2.9 c), where
the distribution of the signals in the range of 500 to −100 ppm corroborates the presence of a
paramagnetic Fe(II) center in Fe-1.
Single crystals of Fe-1 suitable for crystallographic analysis were obtained by the diffusion
of diethyl ether into a concentrated acetonitrile solution of Fe-1. The asymmetric unit cell of Fe-1
contains two compositionally identical units that exhibit some slight differences; a representation of
one of the two independent [(TMCO)Fe(MeCN)(OTf)]+ cations is shown in Figure 2.8 with
selected bond distances and angles. The crystal structure shows a hexa-coordinated ferrous center

34
with the four donor atoms of the TMCO ligand in the equatorial positions and one acetonitrile and
one triflate ion acting as axial ligands. The acetonitrile molecule is oriented syn relative to the
methyl groups of the macrocycle. The coordination geometry around the iron is best described as a
distorted octahedral.
Figure 2.7: a) ESI-MS spectrum of Fe-1 recorded in MeCN; inset: experimental and calculated isotopic
distribution for the main peak; b) Möβbauer spectrum of the solid Fe-1 recorded at 12K; black points:
experimental results, black line: simulation; c) 1H-NMR and d) 19F-NMR of Fe-2 in d3-dichloromethane
obtained at low temperature.
Notably, the reported Fe(II) complexes with the TMC ligand are penta-coordinated, and
bear an anionic/neutral ligand in the axial position, oriented syn relative to the methyl groups;[59–62]
in Fe-1 this position is occupied by an acetonitrile molecule while the triflate occupies the sixth
coordination position that remains empty for the Fe(II)-TMC derivatives. The only reported
structure where an oxygen donor from the counterion-triflate points towards the Fe(II) center
through the vacant axial position is [(TMC)Fe(SC6H4-p-OMe)](OTf);[59] however, the Fe-O distance

35
in this case is 4.097 Å, much larger than the 2.237 Å found for Fe-1. The hexa-coordinated nature
of the iron center in Fe-1, in contrast to the penta-coordinated nature of Fe-TMC, is consistent with
the higher electron donation of the TMC ligand in relation to TMCO. Despite the structural
differences, for all the Fe(II)-TMC complexes, as well as for Fe-1, the iron center has been found to
be in a high-spin configuration.[59,63]
Figure 2.8: Molecular structure of Fe-1 determined by X-ray crystallography. The hydrogen atoms and the
triflate counterion have been omitted for clarity. Color code: C-black, N-blue, O-red, S-yellow, F-green, Fe-
orange. Selected distances: Fe(1)-O(1) 2.085(2) Å; Fe(1)-N(1) 2.178(2) Å; Fe(1)-N(2) 2.107(2) Å; Fe(1)-N(3)
2.192(2) Å; Fe(1)-N(4) 2.130(2) Å; Fe(1)-O(2) 2.237(2) Å. Selected angles: O(1)-Fe(1)-N(2) 165.03(9)°,
O(1)-Fe(1)-N(4) 96.98(9)°; N(2)-Fe(1)-N(4) 97.99(10)°; O(1)-Fe(1)-N(1) 78.63(9)°; N(2)-Fe(1)-N(1)
101.23(10)°; N(4)-Fe(1)-N(1) 89.59(9)°; O(1)-Fe(1)-N(3) 78.82(9)°; N(2)-Fe(1)-N(3) 101.71(10)°; N(4)-
Fe(1)-N(3) 88.73(9)°; N(1)-Fe(1)-N(3) 157.01(9)°; O(1)-Fe(1)-O(2) 82.33(8)°; N(2)-Fe(1)-O(2) 82.71(8)°;
N(4)-Fe(1)-O(2) 178.65(9)°; N(1)-Fe(1)-O(2) 91.40(8)°; N(3)-Fe(1)-O(2) 90.01(8)°.
19F-NMR studies showed that the presence of the triflate in the sixth coordination position
around the Fe(II) center observed in the solid state is not retained in solution. This is evident from
the single NMR peak at −79 ppm (Figure 2.7 d), a position typically associated with uncoordinated
triflates in paramagnetic Fe(II) compounds.[64–67]
2.2.3 Generation and characterization of Fe-2
The reaction between a colorless solution of Fe-1 with 1.5 equivalents of sPhIO in
anhydrous dichloromethane at −90 °C led to the immediate formation of the pale green intermediate
Fe-2 (Scheme 2.5) that proved to be stable at −90 °C for more than 2 hours; at −50 °C Fe-2 was
found to be metastable with a half-life of 90 minutes. Fe-2 presented an absorption spectrum typical
of oxoiron(IV) complexes (Figure 2.9), with a near-UV shoulder at ca. 390 nm

36
(εmax > 3000 M-1cm-1) and two bands of low intensity at 585 nm (εmax = 200 M-1cm-1) and 848 nm
(εmax = 150 M-1cm-1).
-90°CCH2Cl2
N N
N OFeIV
O
NCCH3
N N
N OFeII
OTf
NCCH3
OTf
IO
SO
O
sPhIO
+
Fe-1 Fe-2
Scheme 2.5: Generation of the intermediate Fe-2.
Figure 2.9: Absorption spectra of Fe-1 (gray line) and Fe-2 (black line) in anhydrous CH2Cl2 at −90°C.
Oxoiron(IV) compounds have been reported to exhibit pale green or yellowish green
color[9,14,22,25] derived from near-infrared bands known to be arising from d-d ligand-field transitions
of the Fe(IV)=O center;[20] the assignment from the origin of this band has been carefully made by
magnetic circular dichroism (MCD) measurements on the Fe-TMC complex.[68] Furthermore, the
more intense near-UV feature observed in many oxoiron(IV) complexes has been assigned to be a
O2- to Fe(IV) charge transfer (CT) in nature.[61] By making an analogy between these previous
studies and the absorption spectrum of Fe-2, it was possible to assign the nature of the strong
shoulder band at 390 nm to an O2- to Fe(IV) CT and the two low-intensity bands at 585 and 848 nm
to d-d transitions.
Electrospray ionization mass spectrometry (ESI-MS) analysis of Fe-2 supported the
formulation of the new intermediate as [(TMCO)FeIV(O)]2+ (Figure 2.10). One of the dominant
features in the spectra in the positive ion detection mode appeared at m/z = 464.1; a value that
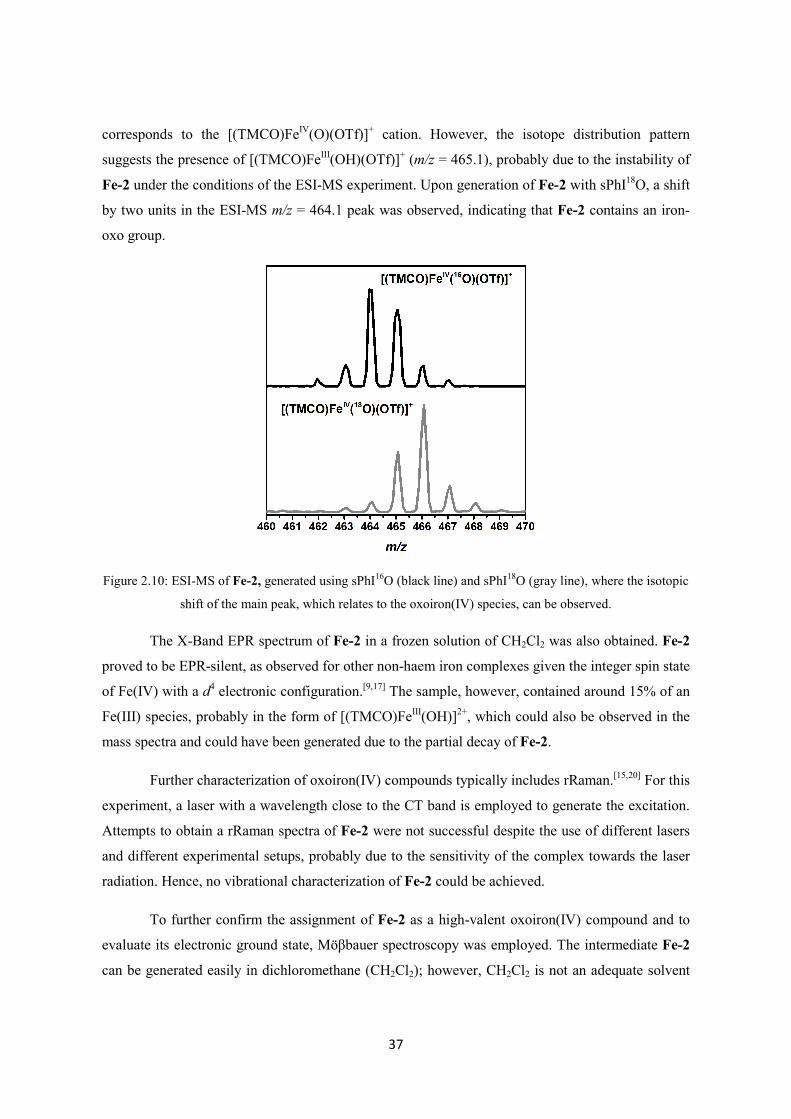
37
corresponds to the [(TMCO)FeIV(O)(OTf)]+ cation. However, the isotope distribution pattern
suggests the presence of [(TMCO)FeIII(OH)(OTf)]+ (m/z = 465.1), probably due to the instability of
Fe-2 under the conditions of the ESI-MS experiment. Upon generation of Fe-2 with sPhI18O, a shift
by two units in the ESI-MS m/z = 464.1 peak was observed, indicating that Fe-2 contains an iron-
oxo group.
Figure 2.10: ESI-MS of Fe-2, generated using sPhI16O (black line) and sPhI18O (gray line), where the isotopic
shift of the main peak, which relates to the oxoiron(IV) species, can be observed.
The X-Band EPR spectrum of Fe-2 in a frozen solution of CH2Cl2 was also obtained. Fe-2
proved to be EPR-silent, as observed for other non-haem iron complexes given the integer spin state
of Fe(IV) with a d4 electronic configuration.[9,17] The sample, however, contained around 15% of an
Fe(III) species, probably in the form of [(TMCO)FeIII(OH)]2+, which could also be observed in the
mass spectra and could have been generated due to the partial decay of Fe-2.
Further characterization of oxoiron(IV) compounds typically includes rRaman.[15,20] For this
experiment, a laser with a wavelength close to the CT band is employed to generate the excitation.
Attempts to obtain a rRaman spectra of Fe-2 were not successful despite the use of different lasers
and different experimental setups, probably due to the sensitivity of the complex towards the laser
radiation. Hence, no vibrational characterization of Fe-2 could be achieved.
To further confirm the assignment of Fe-2 as a high-valent oxoiron(IV) compound and to
evaluate its electronic ground state, Möβbauer spectroscopy was employed. The intermediate Fe-2
can be generated easily in dichloromethane (CH2Cl2); however, CH2Cl2 is not an adequate solvent

38
for Möβbauer measurements since it is virtually opaque to Möβbauer radiation due to the non-
resonant mass absorption effect of the atoms with larger atomic numbers, such as Cl and S.[69]
Several attempts were made to generate Fe-2 in different solvents, such as acetonitrile,
tetrahydrofuran (THF), 2-methyl THF, propionitrile and acetone. However, none allowed the
stabilization of Fe-2. Most of the reported oxoiron(IV) complexes can be generated in acetonitrile
(MeCN),[20] but Fe-2 is not stable at temperatures higher than −50 °C. It is therefore reasonable that
MeCN (freezing point = -45 °C) would not be able to stabilize it. Propionitrile (EtCN), on the other
hand, is similar to MeCN and has a lower freezing point (−93 °C) but was also unable to stabilize
Fe-2. The reason for this was thought to be the strong coordination of the solvent to Fe-1 prior to
the addition of sPhIO, which would prevent the reaction between them. In order to overcome this
obstacle, a highly concentrated solution of Fe-2 was generated in CH2Cl2 at −90 °C and was further
diluted with EtCN at the same temperature to achieve a solution with only 12% CH2Cl2. In this way,
the coordination of the solvent was prevented and the intermediate Fe-2 could be generated, while
avoiding the large excess amount of Cl in the sample.
Figure 2.11: Möβbauer spectra of a 3 mM solution of 57Fe-enriched Fe-2 in propionitrile with 12% CH2Cl2
recorded at 13 K in the absence of an external magnetic field. Black dots: experimental points; light gray line:
absorption due to the unreacted starting Fe-1; dark gray line: absorption due to Fe-2; black line: total fitting of
the experimental spectra.
Figure 2.11 shows the Möβbauer spectrum of a 3 mM frozen solution of the 57Fe-enriched
Fe-2 in propionitrile with 12% dichloromethane. The spectrum was recorded at 13 K with a zero
applied magnetic field. It exhibits a dominant quadrupole doublet with an isomer shift δ =
0.213 mm/s and a quadrupole splitting ∆EQ = 1.578 mm/s. Additionally, a smaller signal can be
discerned, representing a minor contribution of a high-spin ferrous species, with parameters

39
corresponding to those of Fe-1. The obtained isomer shift of the major species is in the range of
other non-haem oxoiron(IV) complexes,[9,24] although higher than that observed for Fe-TMC[14]
(Table 2.1). However, the zero-field Möβbauer parameters are not sufficient to establish the spin
state of the iron center. Therefore, Möβbauer measurements with the application of external
magnetic fields are needed. Upon the application of large magnetic fields, the quadrupole doublet
splits due to magnetic hyperfine interactions between the d electrons and the 57Fe nucleus. The
analysis of the resulting spectra allows for a distinction between an intermediate (S = 1) and a high
spin (S = 2) iron(IV) center.
Magnetic Möβbauer data for the same Fe-2 sample were collected over the temperature
range from 4.2 to 50 K in a perpendicular applied field of 5.0 T (Figure 2.12). A spin-Hamiltonian
simulation of the data could be achieved only under the assumption that the spin state of Fe-2 is
S = 1. An excellent fit to the data was obtained using the parameters presented in Table 2.1, where
D and E are the axial and rhombic zero field spitting (ZFS) parameters respectively, A is the
magnetic hyperfine tensor and η is the asymmetry parameter of the electric field gradient. The
parameters reported for Fe-TMC[14] are also presented in Table 2.1 for the purposes of comparison.
A large positive ZFS, given by the axial ZFS parameter D > 20 cm-1, has been consistently observed
in S = 1 oxoiron(IV) complexes.[70,71] The ZFS originates primarily from spin-orbit coupling
between the ground-state spin triplet and the first excited-state quintet, and its magnitude is
inversely proportional to the triplet-quintet energy separation.[72,73] The D value obtained for Fe-2
(D = 37) is higher than that of Fe-TMC (D = 28) and other S = 1 oxoiron complexes.[70] This
indicates that, while Fe-2 has a triplet ground state, the quintet excited state lies closer to the triplet
state in this complex than in Fe-TMC.
Table 2.1: Spin-Hamiltonian parameters of the Fe(IV) center in Fe-2 and for the reported Fe-TMC.[14]
S D
(cm-1) E/D gx gy gz
A/gNβN (T)
δ (mm s-1)
∆EQ (mm s-1)
η
Fe-TMC[14] 1 28 0 2.3, 2.3, 2.3 -25, -20, -5 0.17 1.24 0.5
Fe-2 1 37.09 0.02 2.0, 2.0, 2.0 -28,-24.5,-0.9 0.2 1.6 0

40
Figure 2.12: Möβbauer spectra of a solution of Fe-2 in propionitrile with 12% CH2Cl2 (dots) measured at
a) 4.2 K, b) 50.0 K and c) 20.0 K in a magnetic field of 5.0 T applied perpendicular to the γ-rays. Spin-
Hamiltonian fitting obtained for a S = 1 configuration of the Fe(IV) species is shown as a black solid line and
the parameters used are given in Table 2.1.
X-ray absorption spectroscopy (XAS) confirmed the formulation of Fe-2 as an oxoiron(IV)
complex. The normalized Fe K-edge spectra of Fe-2 and Fe-1 are shown in Figure 2.13. The
spectrum of Fe-2 shows a single intense pre-edge feature at 7113.8 eV with an edge at 7124.3 eV.
Compared to Fe-1, the edge of Fe-2 is shifted to higher energy, which is indicative of an increase in
the Z* of the iron center, a change that is consistent with the Möβbauer assignment of an Fe(IV)
oxidation state.[23,74,75] Additionally, Fe-2 shows an intense 1s→3d pre-edge transition with an area
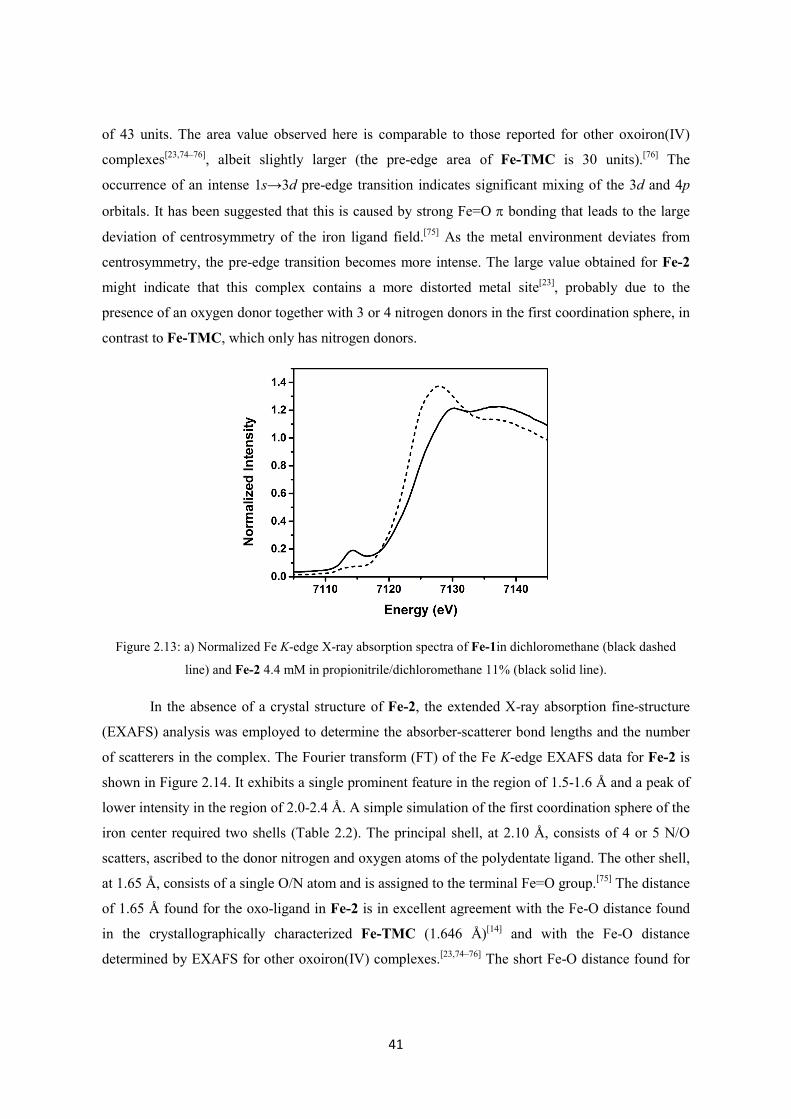
41
of 43 units. The area value observed here is comparable to those reported for other oxoiron(IV)
complexes[23,74–76], albeit slightly larger (the pre-edge area of Fe-TMC is 30 units).[76] The
occurrence of an intense 1s→3d pre-edge transition indicates significant mixing of the 3d and 4p
orbitals. It has been suggested that this is caused by strong Fe=O p bonding that leads to the large
deviation of centrosymmetry of the iron ligand field.[75] As the metal environment deviates from
centrosymmetry, the pre-edge transition becomes more intense. The large value obtained for Fe-2
might indicate that this complex contains a more distorted metal site[23], probably due to the
presence of an oxygen donor together with 3 or 4 nitrogen donors in the first coordination sphere, in
contrast to Fe-TMC, which only has nitrogen donors.
Figure 2.13: a) Normalized Fe K-edge X-ray absorption spectra of Fe-1in dichloromethane (black dashed
line) and Fe-2 4.4 mM in propionitrile/dichloromethane 11% (black solid line).
In the absence of a crystal structure of Fe-2, the extended X-ray absorption fine-structure
(EXAFS) analysis was employed to determine the absorber-scatterer bond lengths and the number
of scatterers in the complex. The Fourier transform (FT) of the Fe K-edge EXAFS data for Fe-2 is
shown in Figure 2.14. It exhibits a single prominent feature in the region of 1.5-1.6 Å and a peak of
lower intensity in the region of 2.0-2.4 Å. A simple simulation of the first coordination sphere of the
iron center required two shells (Table 2.2). The principal shell, at 2.10 Å, consists of 4 or 5 N/O
scatters, ascribed to the donor nitrogen and oxygen atoms of the polydentate ligand. The other shell,
at 1.65 Å, consists of a single O/N atom and is assigned to the terminal Fe=O group.[75] The distance
of 1.65 Å found for the oxo-ligand in Fe-2 is in excellent agreement with the Fe-O distance found
in the crystallographically characterized Fe-TMC (1.646 Å)[14] and with the Fe-O distance
determined by EXAFS for other oxoiron(IV) complexes.[23,74–76] The short Fe-O distance found for

42
oxoiron(IV) complexes supports the description of the Fe=O bond as a highly covalent interaction
between the oxo ligand and the 3𝑑𝑑𝑧𝑧2 , 3𝑑𝑑𝑥𝑥𝑧𝑧 and 3𝑑𝑑𝑦𝑦𝑧𝑧 orbitals of the iron center.[68,75]
Figure 2.14: Fourier-transformed (FT) Fe K-edge EXAFS spectra of Fe-2 (experimental data: solid line,
simulation: dotted line). The inset shows the corresponding EXAFS data in wave-vector scale before the
Fourier transformation.
Table 2.2: Results of Fe K-edge EXAFS simulations (fit) for Fe-2a. The best fits are presented in bold.
Fe-O/N Fe-N/O Fe···C
fit N R s2 n R s2 N R s2 ΔE0 χ2 R
1 3 2.08 3.7 0.96 142.3 0.160 2 4 2.08 5.7 0.24 107.5 0.121 3 5 2.08 7.5 -0.48 101.2 0.114 4 6 2.08 9.2 -1.14 112.9 0.127 5 4 2.11 6.9 1 1.64 6.7 5.93 86.5 0.034 6 5 2.11 8.9 1 1.65 6.9 4.53 53.3 0.021
7 5 2.11 8.4 1 1.65 6.8 4.79 88.4 0.176 8 5 2.10 8.8 1 1.64 6.6 4 2.99 5.2 4.11 56.2 0.081 a Fitting range was k = 1.5-11.25 Å-1 (resolution = 0.16 Å) with back transform ranges of 1-2 Å for fits 1-6
and 1-3 Å for fits 7-8. r is in units of Å; σ² is in units of 10-3 Å; ΔE0 is in units of eV; R represents the
fractional misfit of the data, while χ2 is the χ2 fitting metric normalized by the number of independent data
points in a given fit.
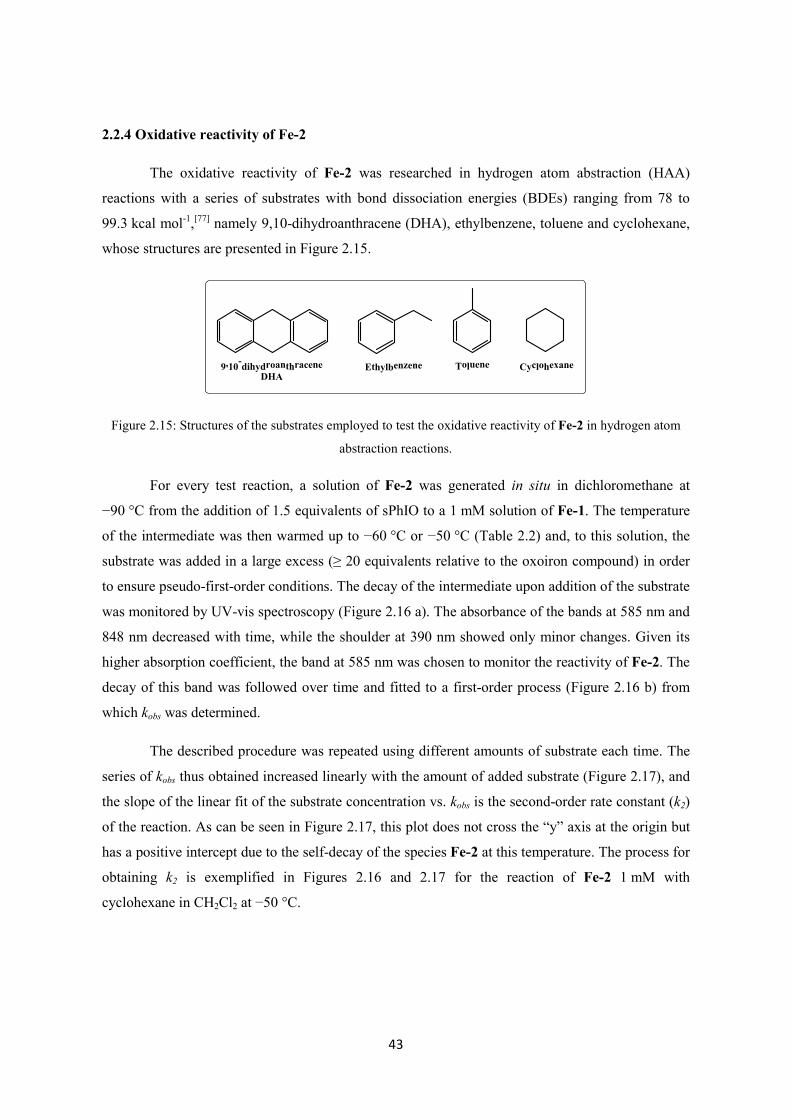
43
2.2.4 Oxidative reactivity of Fe-2
The oxidative reactivity of Fe-2 was researched in hydrogen atom abstraction (HAA)
reactions with a series of substrates with bond dissociation energies (BDEs) ranging from 78 to
99.3 kcal mol-1,[77] namely 9,10-dihydroanthracene (DHA), ethylbenzene, toluene and cyclohexane,
whose structures are presented in Figure 2.15.
9,10-dihydroanthraceneDHA
Ethylbenzene CyclohexaneToluene
Figure 2.15: Structures of the substrates employed to test the oxidative reactivity of Fe-2 in hydrogen atom
abstraction reactions.
For every test reaction, a solution of Fe-2 was generated in situ in dichloromethane at
−90 °C from the addition of 1.5 equivalents of sPhIO to a 1 mM solution of Fe-1. The temperature
of the intermediate was then warmed up to −60 °C or −50 °C (Table 2.2) and, to this solution, the
substrate was added in a large excess (≥ 20 equivalents relative to the oxoiron compound) in order
to ensure pseudo-first-order conditions. The decay of the intermediate upon addition of the substrate
was monitored by UV-vis spectroscopy (Figure 2.16 a). The absorbance of the bands at 585 nm and
848 nm decreased with time, while the shoulder at 390 nm showed only minor changes. Given its
higher absorption coefficient, the band at 585 nm was chosen to monitor the reactivity of Fe-2. The
decay of this band was followed over time and fitted to a first-order process (Figure 2.16 b) from
which kobs was determined.
The described procedure was repeated using different amounts of substrate each time. The
series of kobs thus obtained increased linearly with the amount of added substrate (Figure 2.17), and
the slope of the linear fit of the substrate concentration vs. kobs is the second-order rate constant (k2)
of the reaction. As can be seen in Figure 2.17, this plot does not cross the “y” axis at the origin but
has a positive intercept due to the self-decay of the species Fe-2 at this temperature. The process for
obtaining k2 is exemplified in Figures 2.16 and 2.17 for the reaction of Fe-2 1 mM with
cyclohexane in CH2Cl2 at −50 °C.

44
Figure 2.16: a) Decay of Fe-2, generated in situ from the reaction of Fe-1 1 mM with 1.5 equivalents of
sPhIO at −90 °C in dichloromethane, after addition of 93 equivalents of cyclohexane in dichloromethane at
−50 °C. Inset: decrease in the absorption band at 585 nm, employed for the determination of kobs. b) Decay of
the band at 585 nm (black dots) and fitting to a first-order decay (gray solid line) of the reaction of Fe-2 with
93 equivalents of cyclohexane in dichloromethane at −50 °C.
Figure 2.17: Linear dependence of kobs on the concentration of the substrate for the reaction of Fe-2 with
cyclohexane at −50 °C in CH2Cl2.
The obtained k2 values for the HAA reactions of Fe-2 with the tested substrates are
presented in Table 2.3. The reaction of Fe-2 with DHA, the substrate with the weakest bond
dissociation energy (BDE) among all those tested, was too fast to be monitored with our setup even
at −90 °C. After the addition of DHA to a solution of Fe-2, the bands at 585 nm and 848 nm
immediately decayed and anthracene was formed. For substrates with stronger BDEs, on the other
hand, temperatures higher than −90 °C were necessary to observe the activation of the substrates
and the concomitant decay of Fe-2; while Fe-2 was found to be capable of oxidizing toluene and
ethylbenzene at −60 °C, it required a higher temperature, namely −50 °C, to oxidize cyclohexane.

45
The analysis of the reaction mixture with gas chromatography (GC) after the oxidation of
cyclohexane with Fe-2 showed the formation of both cyclohexanol and cyclohexanone in a ca. 1:1
ratio.
Table 2.3: Second-order rate constants (k2) determined in HAA reactions performed by Fe-2 with different
substrates. The temperature employed in each case is stated in brackets.
Substrate Number of
equivalent H
BDE[77]
kcal mol-1
k2
L mol-1 s-1
k2’
L mol-1 s-1
DHA 4 77 Too fast (−90 °C)
Ethylbenzene 2 87 5.0x10⁻² (−60 °C) 2.5x10⁻² (−60 °C)
Toluene 3 90 3.3x10⁻³ (−60 °C) 1.1x10⁻³ (−60 °C)
Cyclohexane 12 99.3 4.7x10⁻³ (−50 °C) 3.9x10⁻⁴ (−50 °C)
Figure 2.18: Plot of the pseudo-first-order rate constants, kobs (s-1), against substrate concentrations to
determine the second-order rate constant (k2) and the kinetic isotope effect (KIE) for the reaction of Fe-2 with
ethylbenzene (black circles: experimental points, black solid line: linear fitting) and deuterated ethylbenzene-
d10 (gray squares: experimental points, gray solid line: linear fitting) in dichloromethane at −60 °C.
The obtained k2 values were adjusted according to the reaction stoichiometry, based on the
number of target C−H bonds of each substrate, to yield k2’ (Table 2.3). The k2’ values correlated
well with the BDEs of the substrates since the second-order rate constant decreased as the C−H
BDE of the substrate increased, a trend that had been previously observed for the oxidation of
hydrocarbons with other oxoiron(IV) systems.[22,24,25,78] In addition, a deuterium kinetic isotope
effect (KIE = kH/kD) of 24.8 was determined for the reaction of Fe-2 with ethylbenzene and its
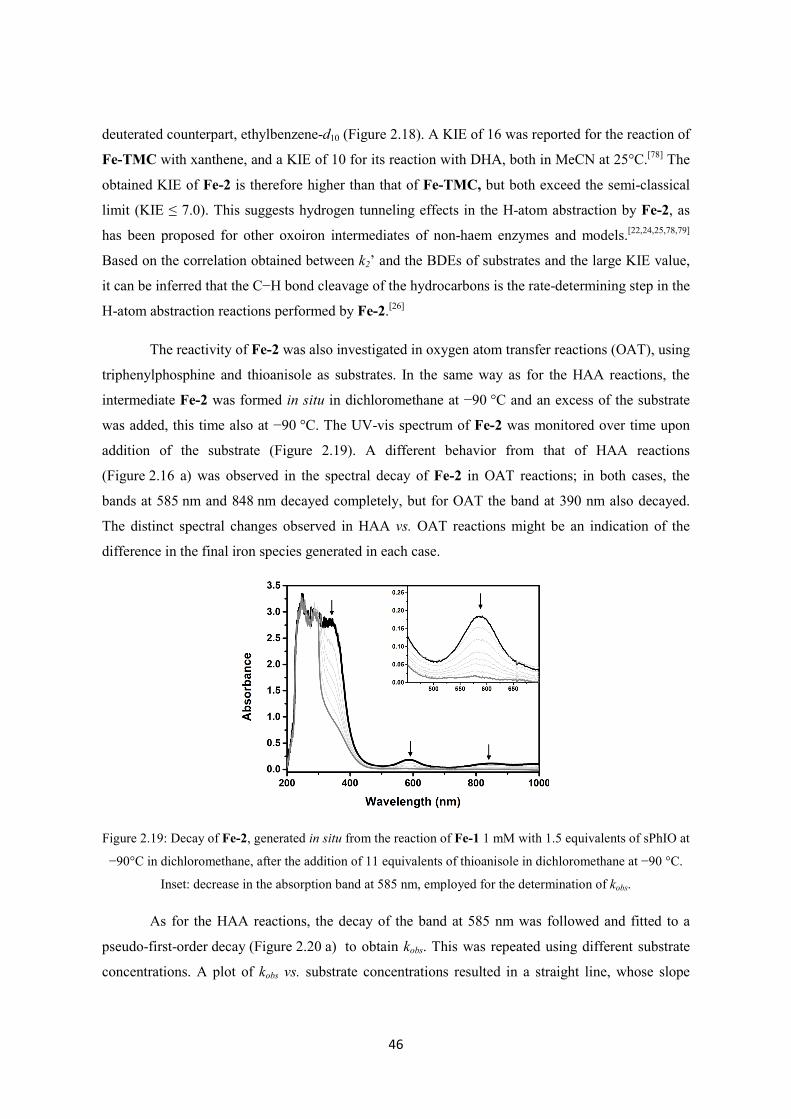
46
deuterated counterpart, ethylbenzene-d10 (Figure 2.18). A KIE of 16 was reported for the reaction of
Fe-TMC with xanthene, and a KIE of 10 for its reaction with DHA, both in MeCN at 25°C.[78] The
obtained KIE of Fe-2 is therefore higher than that of Fe-TMC, but both exceed the semi-classical
limit (KIE ≤ 7.0). This suggests hydrogen tunneling effects in the H-atom abstraction by Fe-2, as
has been proposed for other oxoiron intermediates of non-haem enzymes and models.[22,24,25,78,79]
Based on the correlation obtained between k2’ and the BDEs of substrates and the large KIE value,
it can be inferred that the C−H bond cleavage of the hydrocarbons is the rate-determining step in the
H-atom abstraction reactions performed by Fe-2.[26]
The reactivity of Fe-2 was also investigated in oxygen atom transfer reactions (OAT), using
triphenylphosphine and thioanisole as substrates. In the same way as for the HAA reactions, the
intermediate Fe-2 was formed in situ in dichloromethane at −90 °C and an excess of the substrate
was added, this time also at −90 °C. The UV-vis spectrum of Fe-2 was monitored over time upon
addition of the substrate (Figure 2.19). A different behavior from that of HAA reactions
(Figure 2.16 a) was observed in the spectral decay of Fe-2 in OAT reactions; in both cases, the
bands at 585 nm and 848 nm decayed completely, but for OAT the band at 390 nm also decayed.
The distinct spectral changes observed in HAA vs. OAT reactions might be an indication of the
difference in the final iron species generated in each case.
Figure 2.19: Decay of Fe-2, generated in situ from the reaction of Fe-1 1 mM with 1.5 equivalents of sPhIO at
−90°C in dichloromethane, after the addition of 11 equivalents of thioanisole in dichloromethane at −90 °C.
Inset: decrease in the absorption band at 585 nm, employed for the determination of kobs.
As for the HAA reactions, the decay of the band at 585 nm was followed and fitted to a
pseudo-first-order decay (Figure 2.20 a) to obtain kobs. This was repeated using different substrate
concentrations. A plot of kobs vs. substrate concentrations resulted in a straight line, whose slope

47
represented the k2 value (Figure 2.20 b). Fe-2 was capable of performing OAT reactions even at
−90 °C, in contrast to most of the HAT transformations, which required higher temperatures. Given
that Fe-2 is stable at −90 °C, the plot of kobs vs. substrate concentration intercepts the origin unlike
those obtained for HAA reactions. The k2 values obtained for the oxygen atom transfer reactions
performed by Fe-2 at −90 °C in dichloromethane are presented in Table 2.4. The reaction with
triphenylphosphine was too fast to be followed with our methodology and instrumentation; however
the analysis of the reaction mixture showed the formation of triphenylphosphine oxide.
Figure 2.20: a) Decay of the band at 585 nm (black dots) and fitting to a first-order decay (gray solid line) for
the reaction of Fe-2 with thioanisole in dichloromethane at −90 °C. b) Linear dependence of kobs on the
concentration of the substrate for the reaction of Fe-2 with thioanisole at −90 °C in CH2Cl2.
Table 2.4: Second-order rate constants (k2) determined in OAT reactions performed by Fe-2 with different
substrates in dichloromethane at −90 °C.
Substrate k2
L mol-1 s-1
PPh3 Too fast
Thioanisole 7.87
It is interesting to compare the reactivity of Fe-2 with that of other oxoiron(IV) models in
order to evaluate the effectiveness of our ligand design and the effect of the change of the
coordination sphere around the iron center: from only nitrogen donors to the inclusion of one
oxygen donor in Fe-2. For comparison, the most active oxoiron(IV) models were chosen, as well as
other oxoiron(IV) complexes capable of oxidizing cyclohexane and the model complex taken as a

48
reference for this study: the intermediate Fe-TMC. The structures of the chosen active oxoiron(IV)
models are presented in Figure 2.21.
Fe
ON N
NN
N
N
NNCCH3
Fe
ON N
NN NCCH3
[(Me3NTB)FeIV(O)(MeCN)]2+[(TQA)FeIV(O)(MeCN)]2+
Fe
ON N
NN N
CH2Ph
Fe
ON N
NN N
Fe
ON N
NCCH3
N N
[(BnTPEN)FeIV(O)]2+
[(N4Py)FeIV(O)]2+
[(TMC)FeIV(O)(MeCN)]2+
Fe
ON N
NN N
N
[(N3Py-NMB)FeIV(O)]2+
Fe
ON N
NN N
NN
[(N2Py-(NMB)2)FeIV(O)]2+
Figure 2.21: Structures of other relevant oxoiron(IV) models.
Table 2.5: Second-order rate constants (k2) reported for the oxygen atom transfer and the hydrogen atom
abstraction reactions with the substrates thioanisole and cyclohexane, respectively, performed by different
oxoiron(IV) species.
Complex FeIV spin state k2 thioanisole
L mol-1 s-1
k2 cyclohexane
L mol-1 s-1 Reference
[(TQA)FeIV(O)(MeCN)]2+ 2 Not reported 3.7x10⁻¹ (−40 °C) [24]
[(Me3NTB)FeIV(O)(MeCN)]2+ 1
(2 accessible) 2.1x10⁴ (−40 °C) 2.5x10⁻¹ (−40 °C) [22]
Fe-2 1
(2 accessible) 7.87 (−90 °C) 4.7x10⁻³ (−50 °C)
[(N2Py-(NMB)2)FeIV(O)]2+ 1 3.1x10⁻¹ (−30 °C) 2.9x10⁻³ (25 °C) [21]
[N3Py-(NMB))FeIV(O)]2+ 1 3.3x10⁻² (−30 °C) 3.0x10⁻⁴ (25 °C) [21]
[(BnTPEN)FeIV(O)]2+ 1 1.4x10⁻² (−40 °C) 3.9x10⁻⁴ (25 °C) [22,25]
[(N4Py)FeIV(O)]2+ 1 2.4x10⁻⁴ (−40 °C) 5.5x10⁻⁵ (25 °C) [22,25]
Fe-TMC 1 1.3x10⁻³ (−40 °C) 0 [14,17]

49
The complexes [(TQA)FeIV(O)(MeCN)]2+[24] and [Me3NTB)FeIV(O)(MeCN)]2+[22] were
presented in the introduction of this Chapter, and are the most reactive oxoiron(IV) models
synthesized so far. The compounds [(N4Py)FeIV(O)]2+,[25] [(BnTPEN)FeIV(O)]2+,[25] [(N3Py-
(NMB))FeIV(O)]2+,[21] and [(N2Py-(NMB)2)FeIV(O)]2+,[21] on the other hand, are related complexes
for which oxidation of cyclohexane has been observed and reported (N4Py = N,N-bis(2-
pyridylmethyl)-N-bis(2-pyridyl)methylamine; BnTPEN = N-benzyl-N,N’,N’-tris(2-pyridylmethyl)-
ethylenediamine; N3Py-(NMB) = N-(1-methyl-2-benzimidazolyl)-methyl-N-(2-pyridyl)-methyl-N-
(bis-2-pyridylmethyl)amin; N2Py-(NMB)2 = N-bis(1-methyl-2-benzimidazolyl)methyl-N-(bis-2-
pyridylmethyl)-amine). Finally, Fe-TMC[14] is the oxoiron(IV) complex typically used for
comparisons since it was the first fully characterized compound. The reaction rates k2 reported for
these complexes as well as those obtained for Fe-2 in the oxidation reactions of thioanisole (OAT)
and cyclohexane (HAA) are presented in Table 2.5.
The complex Fe-2 was found to be more reactive than the parent compound Fe-TMC.
While 2-Fe could activate cyclohexane even at −50 °C, Fe-TMC was incapable of activating a
substrate with such a high BDE. The large ZFS, in comparison with Fe-TMC, determined with
magnetic Möβbauer spectroscopy for Fe-2, might reasonably explain the higher activity of this
complex. While in Fe-2 the triplet-quintet gap is lower, the more reactive S = 2 is more accessible
and therefore its reactivity increases. On the contrary, for the complex Fe-TMC the quintet state is
less accessible (lower value of D) and it exhibits poorer reactivity.
An interesting analysis in this regard can be made from the k2 values obtained for the
different species listed in Table 2.5. It is known that the nature of the equatorial ligands has an
effect on the reactivity of the oxoiron(IV) complexes. Strong equatorial donation causes a
destabilization of the 𝑑𝑑𝑥𝑥2−𝑦𝑦2 orbital, which results in a higher energy gap between the triplet and
quintet states (∆ETQ), lower accessibility of the S = 2 state and a lower HAA reactivity.[16] This
effect can be appreciated when comparing the reactivity trend of the related complexes:
[(N4Py)FeIV(O)]2+ < [(N3Py-(NMB))FeIV(O)]2+ < [(N2Py-(NMB)2)FeIV(O)]2+. For every complex in
the series, an equatorial pyridine ligand has been replaced with an N-methylbenzymidazol ligand
that enforces a steric demand in the equatorial plane and affects its equatorial donation ability. A
similar trend could be occurring between Fe-TMC and Fe-2, where one nitrogen donor is being
substituted by a more electronegative oxygen donor. This new donor could be diminishing the
equatorial donation on Fe-2 and thus increasing its reactivity.

50
The complex Fe-2, however, was not as reactive as the two most efficient oxoiron(IV)
oxidants reported so far. Complex [(Me3NTB)FeIV(O)(MeCN)]2+[22] exhibits the highest oxidation
rate for cyclohexane and thioanisole for any S = 1 oxoiron(IV) complex to date. It has been
suggested that its high reactivity is derived from a highly reactive S = 2 state in close proximity to
the S = 1 ground state. Complex [(TQA)FeIV(O)(MeCN)]2+,[24] on the other hand, has an S = 2
ground state and its reactivity proceeds on a single surface. While Fe-2 is the third most reactive
complex reported so far, its reactivity is still far from that of these two highly reactive complexes.
The replacement of one nitrogen donor for an oxygen one, however, seems to be an effective
strategy for achieving more reactive oxoiron(IV) complexes, as evidenced by the comparison of
Fe-2 with Fe-TMC.
In order to explain the difference in reactivity between Fe-2 and Fe-TMC, distinct factors
can be proposed that might enhance the reactivity of Fe-2 in contrast to that of Fe-TMC. The first
factor to be considered is the difference in the electronic spin state in which the reaction might
proceed for each complex. The experimental evidence proves that both Fe-TMC and Fe-2 have an
intermediate spin S = 1 ground state. However, the unusually large zero-field splitting found for
Fe-2 shows that the intermediate- and high-spin configurations in this complex are much closer in
energy than those in Fe-TMC. These findings were corroborated by DFT studies. It was found that
while for Fe-TMC the energy difference between the S = 1 ground state and the S = 2 excited state
is 5-6 kcal mol-1, this difference is only 1-2 kcal mol-1 for Fe-2 (at OLYP/TDZP or B3LYP/TDZP
for both). The lower ∆ETQ gap in Fe-2 therefore increases the accessibility of the quintet state in this
complex and can make Fe-2 more reactive.
To get insights into the effect of the spin state in Fe-2 and Fe-TMC, the mechanism of the
oxidation of cyclohexane by both complexes was researched in detail with DFT calculations. The
reaction energy surfaces and the stationary points were optimized with OLYP/TDZP (see Chapter 6
for details). The optimized geometries of the reactant (R) high-valent oxoiron(IV) complexes are
shown in Figure 2.22, while Figure 2.23 shows the energy profiles found for the reaction performed
by Fe-2 and Fe-TMC on S = 1 and S = 2 surfaces. The reaction mechanism for the hydroxylation of
cyclohexane was found to involve two steps, as expected: first a hydrogen atom transfer (HAT)
from the cyclohexane to the iron-oxo, followed by a rebound (OR) step to form the cyclohexanol
product (P).

51
Fe-TMC Fe-2
Figure 2.22: Optimized geometries of Fe-TMC and Fe-2; bottom: space-filling models where the hydrogen
atoms have been omitted for clarity. Color code: C-gray, N-blue, Fe-orange, O-red, H-white.
Figure 2.23: Energy profiles for the oxidation of cyclohexane with Fe-TMC (S = 1, dotted black line; S = 2
solid black line) and Fe-2 (S = 1, dotted blue line; S = 2 solid blue line).
In keeping with previous studies on oxoiron(IV) systems,[1,27,28] the lowest energy pathway,
for both Fe-2 and Fe-TMC, was found to be that of the quintet (S = 2) state. However, regardless of
the spin state, the energy barriers of the oxidation of cyclohexane were found to be significantly
lower for Fe-2 than for Fe-TMC. Since the energy barriers of Fe-2 are lower than those of
Fe-TMC regardless of the spin surface in which they proceed, the spin effect alone cannot account
for the higher reactivity of Fe-2 with regard to Fe-TMC.

52
Another factor that might have an effect on the enhanced reactivity of Fe-2 is a steric one.
The space-filling models of both compounds, obtained from their geometry optimization, are
presented in Figure 2.22. While in the Fe-TMC complex the oxo group is hidden by the backbone
of the ligand, in the Fe-2 complex the oxo group is more exposed through the site occupied by the
coordinated oxygen, leaving it more accessible to further approach by the substrate and thus
increasing its reactivity. A related effect would be the possibility that the oxygen donor from the
TMCO ligand comes out in solution, thus leaving space for the substrate to approach the
oxoiron(IV) center and increasing the reactivity of Fe-2 with regard to that of Fe-TMC, that has no
such possibility.
However appealing it is to ascribe the observed increase in reactivity of Fe-2 vs Fe-TMC to
the exchange of one nitrogen donor for an oxygen one, such an assumption might not be entirely
correct. Not only does the nature of the donor atoms vary between Fe-2 and Fe-TMC, but the
backbone of the ligand is also different (Figure 2.6). In order to properly analyze the effect of
exchanging a nitrogen donor for an oxygen one in an otherwise identical ligand, a new ligand with
the same backbone structure as TMCO but with four nitrogen donors, namely TMCN
(Figure 2.24), was synthesized and its iron(II) and oxoiron(IV) complexes were studied.
N N
N N
a) b)
N N
O N
TMCO TMCN
Figure 2.24: Structure of the ligands TMCO and TMCN.
2.2.5 Comparison with the TMCN system
The ligand TMCN was synthesized using a strategy analogous to that employed for the
TMCO ligand (Scheme 2.3) but in the second step, N,O,O′-Tritosyldiethanolamine was employed
instead of diethyleneglycol-di(p-toluensulfonate). From the reaction between TMCN and
[FeII(OTf)2(MeCN)2], the complex [(TMCN)FeII]2+ (Fe-3) was generated (Scheme 2.6 a) and, in
turn, it was set to react with the oxidant sPhIO in acetonitrile at −40 °C (Scheme 2.6 b). The
formation of a transient intermediate Fe-4 could be observed, whose very fast decay prevented its
isolation at −40 °C. Unfortunately, Fe-4 was also too unstable to be isolated in other solvents at
temperatures ranging from −40 to −100 °C.

53
N N
N NFeII
N N
N N+ [FeII(OTf)2(MeCN)2]
CH3CN
Fe-3
CH3CN
N N
N NFeIV
OIO
SO
O
sPhIO
+
Fe-3 Fe-4
TMCN
OTf2
N N
N NFeII
OTf2
a)
b)
Scheme 2.6: a) Synthesis of the complex Fe-3 and b) generation of the intermediate Fe-4
Since the complexes Fe-2, Fe-TMC and the related oxoiron(IV) species[61,78] can be
generated and stabilized with relative ease at low temperatures, the transient nature of Fe-4 was
surprising. Such behavior might be due to an alternative decay pathway of Fe-4 that is not
accessible in Fe-TMC and Fe-2, or the result of an asymmetry within the complex. DFT
calculations provided an insight into the unstable nature of Fe-4.
N N
N NFeIV
O
Fe-4
N N
N OFeIV
O
Fe-2
Intramolecular
C-H bond
activation
vs.
No intramolecular
C-H bond
activation
Figure 2.25: Spatial arrangement of the N-methyl groups in Fe-2 and Fe-4 and illustration of possible
intramolecular C−H bond activation.
According to DFT calculations, the most stable conformation found for complex Fe-2 has
all the three N-methyl groups oriented in the same direction with respect to the FeN3O plane and
pointing away from the oxo group (anti, Figure 2.25), as observed in the Fe-TMC crystal
structure.[14] In contrast, for the complex Fe-4 the most stable conformation has one of the four
methyl groups facing towards the oxo ligand (syn, Figure 2.25). This flip of the N-methyl group
favors the intramolecular C−H bond activation of the methyl group of the ligand, making the
complex Fe-4 decay rapidly in solution even at low temperatures. In fact, the reaction barrier for the

54
auto-oxidation of the syn-complex was found to be 13-14 kcal mol-1 lower than the oxidation barrier
for the reaction of this complex with cyclohexane, which explains the instability of Fe-4.
Fe-3d
N N
N N
D3C CD3
D3C
FeII
CD3
N N
N N
CD3
D3C
FeIV
O
D3C
CD3
Fe-4d
CH3CN
IO
SO
O
sPhIO
+
Scheme 2.7: Generation of Fe-4d from the reaction of Fe-3d with sPhIO in MeCN at 10 °C.
In order to access the oxoiron(IV) complex of this system, the ligand TMCN-d with
deuterated N-methyl groups was synthesized. Since the oxoiron(IV) compounds show large
deuterium kinetic isotope effects, the introduction of deuterium on the methyl groups was expected
to slow down the intramolecular C−H bond activation in Fe-4. The TMCN-d ligand was
synthesized following the same procedure used for the synthesis of TMCN but the deuterated forms
of formaldehyde and formic acid were used in the last step. The TMCN-d ligand was set to react
with [FeII(OTf)2(MeCN)2] to generate the complex Fe-3d, which , in turn, was set to react with
sPhIO in MeCN at 10 °C (Scheme 2.7). This time the formation of Fe-4d could be detected and
followed by UV-vis spectroscopy (Figure 2.26). Fe-4d showed a characteristic UV-vis band at
820 nm (εmax = 125 M-1 cm-1) and a big shoulder rising at around 400 nm.
Figure 2.26: Absorption spectra of Fe-3d (gray line) and the intermediate Fe-4d (black line) in anhydrous
MeCN at 10°C.
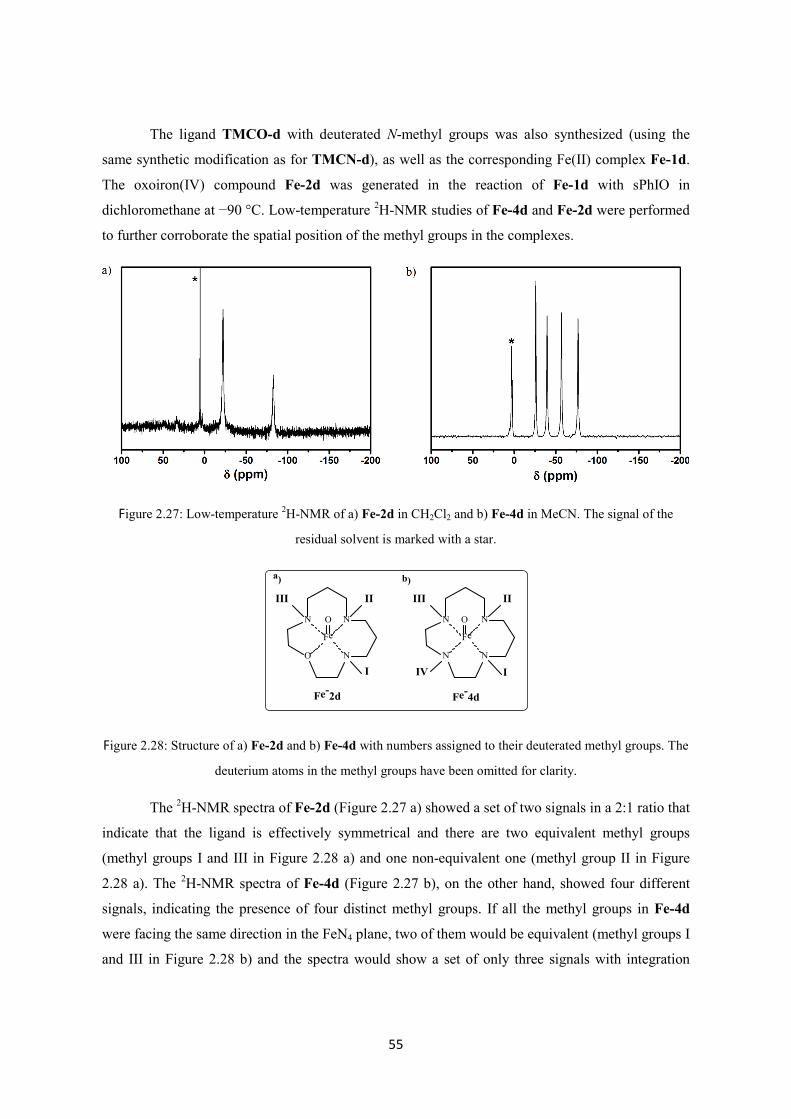
55
The ligand TMCO-d with deuterated N-methyl groups was also synthesized (using the
same synthetic modification as for TMCN-d), as well as the corresponding Fe(II) complex Fe-1d.
The oxoiron(IV) compound Fe-2d was generated in the reaction of Fe-1d with sPhIO in
dichloromethane at −90 °C. Low-temperature 2H-NMR studies of Fe-4d and Fe-2d were performed
to further corroborate the spatial position of the methyl groups in the complexes.
Figure 2.27: Low-temperature 2H-NMR of a) Fe-2d in CH2Cl2 and b) Fe-4d in MeCN. The signal of the
residual solvent is marked with a star.
Fe-4dFe-2d
N N
N N
N N
O N
FeO
FeO
I
IIIII
I
IIIII
IV
a) b)
Figure 2.28: Structure of a) Fe-2d and b) Fe-4d with numbers assigned to their deuterated methyl groups. The
deuterium atoms in the methyl groups have been omitted for clarity.
The 2H-NMR spectra of Fe-2d (Figure 2.27 a) showed a set of two signals in a 2:1 ratio that
indicate that the ligand is effectively symmetrical and there are two equivalent methyl groups
(methyl groups I and III in Figure 2.28 a) and one non-equivalent one (methyl group II in Figure
2.28 a). The 2H-NMR spectra of Fe-4d (Figure 2.27 b), on the other hand, showed four different
signals, indicating the presence of four distinct methyl groups. If all the methyl groups in Fe-4d
were facing the same direction in the FeN4 plane, two of them would be equivalent (methyl groups I
and III in Figure 2.28 b) and the spectra would show a set of only three signals with integration

56
ratios 2:1:1. The fact that the two otherwise equivalent N-methyl groups appear at different
chemical shifts indicated that their chemical environments are different and provided evidence for
the flip of one of these N-methyl groups above the plane, towards the oxo ligand (syn).
The oxidation reactivity of Fe-4d was tested in HAA and OAT reactions with the substrates
cyclohexane and thioanisole in acetonitrile at −40 °C. The k2 values obtained are presented in
Table 2.6. The complex Fe-4d was not capable of activating cyclohexane at −40 °C, nor substrates
with lower BDEs such as toluene. However, Fe-4d proved to be capable of performing group
transfer reactions towards thioanisole, but at a rate three orders of magnitude slower than that
obtained for Fe-2. This was much in keeping with the reactivity trend observed for Fe-TMC, which
was incapable of activating substrates with high BDEs but could perform OAT to substrates like
PPh3 and thioanisole. Even though the reaction rates for the oxidation of thioanisole with Fe-TMC
and Fe-4d are comparable in magnitude, the rate obtained for Fe-4d is three times higher than that
of Fe-TMC. This evidence shows that asymmetry does play a role in increasing the reactivity of the
TMCO and TMCN-d-derived complexes with respect to the more symmetric TMC one. This
effect must be taken into consideration when explaining the increased reactivity of Fe-2.
Table 2.6: Second-order rate constants (k2) reported for the oxygen atom transfer reaction to thioanisole and
for the hydrogen atom abstraction reaction from cyclohexane by Fe-2, Fe-4d and Fe-TMC.
Substrate Fe-2
k2 (L mol-1 s-1)
Fe-4d
k2 (L mol-1 s-1)
Fe-TMC
k2 (L mol-1 s-1)
Cyclohexane 4.7x10⁻³ (−50 °C) No reaction No reaction
Thioanisole 7.87 (−90 °C) 4.0x10⁻³ (−40 °C) 1.3x10⁻³ (−40 °C)
2.3 Conclusions
A new oxoiron(IV) intermediate Fe-2 has been generated employing the ligand TMCO.
TMCO is an analogous ligand to the widely studied TMC, but in it one of the four nitrogen donors
has been exchanged for an oxygen donor and the backbone of the ligand has been slightly modified,
introducing an additional asymmetry but leaving the macrocycle size unchanged. The iron(II)
complex of the TMCO ligand (Fe-1) is in a high-spin configuration and has been completely
characterized by various spectroscopic methods including X-ray diffraction. Its reaction with sPhIO
in CH2Cl2 at −90 °C led to the formation of Fe-2. Fe-2 has an S = 1 ground state; however, the high
spin S = 2 state is easily accessible, as demonstrated by the unusually large zero-field splitting (D)

57
value obtained by Möβbauer spectroscopy. Fe-2 shows high reactivity in C−H bond activation and
group transfer reactions, much higher than that of Fe-TMC.
The factors that have been proposed to influence the increase in reactivity in Fe-2 in
contrast with Fe-TMC are a) the smaller ∆ETQ gap that increases the accessibility of the quintet
state in Fe-2; b) the steric factor that exposes the oxo group in Fe-2 through the site occupied by the
coordinated oxygen, leaving it more accessible for a further approach by the substrate; c) a possible
de-coordination of the oxygen donor from the TMCO ligand in solution, which leaves space for the
substrate to approach the oxoiron center; and d) a minor role of the asymmetry of Fe-2 in
comparison with Fe-TMC, which has been evidenced by the difference in reactivity between the
otherwise identical Fe-TMC and Fe-4d. The results presented here prove that the exchange of one
nitrogen donor for an oxygen one does have an important impact on the reactivity of oxoiron(IV)
complexes, making them more reactive.
2.4 References
[1] J. Hohenberger, K. Ray, K. Meyer, Nat. Commun. 2012, 3, 720-733.
[2] J. E. Penner-Hshn, T. J. McMurry, M. Renner, L. Latos-Grazynsky, K. S. Eble, I. M. Davis, A. L. Balch, J. T. Groves, J. H. Dawson, K. O. Hodgson, J. Biol. 1983, 258, 12761–12765.
[3] G. I. Berglund, G. H. Carlsson, A. T. Smith, H. Szöke, A. Henriksen, J. Hajdu, Nature 2002, 417, 463–468.
[4] H. P. Hersleth, U. Ryde, P. Rydberg, C. H. Görbitz, K. K. Andersson, J. Inorg. Biochem. 2006, 100, 460–476.
[5] M. Merkx, D. A. Kopp, M. H. Sazinsky, J. L. Blazyk, J. Müller, S. J. Lippard, Angew. Chem. Int. Ed. 2001, 40, 2782–2807.
[6] J. C. Price, E. W. Barr, L. M. Hoffart, C. Krebs, J. M. Bollinger, Biochemistry 2005, 44, 8138–47.
[7] C. Krebs, D. G. Fujimori, C. T. Walsh, J. M. Bollinger, Acc. Chem. Res. 2007, 40, 484–492.
[8] M. Costas, M. P. Mehn, M. P. Jensen, L. Que Jr., Chem. Rev. 2004, 104, 939–986.
[9] L. Que Jr., Acc. Chem. Res. 2007, 40, 493–500.
[10] J. T. Groves, R. C. Haushalter, M. Nakamura, T. E. Nemo, B. J. Evans, J. Am. Chem. Soc. 1981, 103, 2884–2886.
[11] H. Fujii, Coord. Chem. Rev. 2002, 226, 51–60.
[12] C. A. Grapperhaus, B. Mienert, E. Bill, T. Weyhermüller, K. Wieghardt, Inorg. Chem. 2000, 39, 5306–5317.

58
[13] W. Nam, Acc. Chem. Res. 2007, 40, 522–531.
[14] J.-U. Rohde, J.-H. In, M. H. Lim, W. W. Brennessel, M. R. Bukowski, A. Stubna, E. Münck, W. Nam, L. Que Jr., Science 2003, 299, 1037–9.
[15] S. P. de Visser, J. U. Rohde, Y. M. Lee, J. Cho, W. Nam, Coord. Chem. Rev. 2013, 257, 381–393.
[16] X. Engelmann, I. Monte-Pérez, K. Ray, Angew. Chem. Int. Ed. 2016, 55, 7632–7649.
[17] S. Hong, H. So, H. Yoon, K. B. Cho, Y. M. Lee, S. Fukuzumi, W. Nam, Dalt. Trans. 2013, 42, 7842–7845.
[18] A. R. McDonald, L. Que Jr., Coord. Chem. Rev. 2013, 257, 414–428.
[19] K. Ray, F. Felix, B. Wang, W. Nam, J. Am. Chem. Soc. 2014, 136, 13942–13958.
[20] D. Wang, K. Ray, M. J. Collins, E. R. Farquhar, J. R. Frisch, L. Gomez, T. A. Jackson, M. Kerscher, A. Waleska, P. Comba, M. Comba, L. Que Jr., Chem. Sci. 2013, 4, 282–291.
[21] M. Mitra, H. Nimir, S. Demeshko, S. S. Bhat, S. O. Malinkin, M. Haukka, J. Lloret-Fillol, G. C. Lisensky, F. Meyer, A. A. Shteinman, W. R. Browne, D. A. Hrovat, M. G. Richmond, M. Costas, E. Nordlander, Inorg. Chem. 2015, 54, 7152–7164.
[22] M. S. Seo, N. H. Kim, K.-B. Cho, J. E. So, S. K. Park, M. Clémancey, R. Garcia-Serres, J.-M. Latour, S. Shaik, W. Nam, Chem. Sci. 2011, 2, 1039–1045.
[23] S. A. Wilson, J. Chen, S. Hong, Y. Lee, R. García-Serres, T. Nomura, T. Ogura, B. Hedman, K. O. Hodgson, W. Nam, E. I, Solomon, J. Am. Chem. Soc. 2012, 134, 11791.
[24] A. N. Biswas, M. Puri, K. K. Meier, W. N. Oloo, G. T. Rohde, E. L. Bominaar, E. Münck, L. Que Jr., J. Am. Chem. Soc. 2015, 137, 2428–2431.
[25] J. Kaizer, E. J. Klinker, N. Y. Oh, J. Rohde, W. J. Song, A. Stubna, J. Kim, E. Münck, W. Nam, L. Que Jr., J. Am Chem. Soc. 2004, 126, 472–473.
[26] S. T. Kleespies, W. N. Oloo, A. Mukherjee, L. Que Jr., Inorg. Chem. 2015, 54, 5053–5064.
[27] S. Shaik, H. Hirao, D. Kumar, Acc. Chem. Res. 2007, 40, 532–542.
[28] K.-B. Cho, S. Shaik, W. Nam, Chem. Commun. 2010, 46, 4511-4513.
[29] J. T. Groves, G. A. McClusky, J. Am. Chem. Soc. 1976, 98, 859–861.
[30] F. Ogliaro, N. Harris, S. Cohen, M. Filatov, S. P. de Visser, S. Shaik, J. Am. Chem. Soc. 2000, 122, 8977–8989.
[31] S. Shaik, S. Cohen, S. P. de Visser, P. K. Sharma, D. Kumar, S. Kozuch, F. Ogliaro, D. Danovich, Eur. J. Inorg. Chem. 2004, 207–226.
[32] J. T. Groves, J. Chem. Educ. 1985, 62, 928–931.
[33] S. Shaik, H. Chen, D. Janardanan, Nat. Chem. 2011, 3, 19–27.
[34] A. Decker, J. U. Rohde, E. J. Klinker, S. D. Wong, L. Que Jr., E. I. Solomon, J. Am. Chem.

59
Soc. 2007, 129, 15983–15996.
[35] A. Decker, M. S. Chow, J. N. Kemsley, N. Lehnert, E. I. Solomon, J. Am. Chem. Soc. 2006, 4719–4733.
[36] M. L. Neidig, A. Decker, O. W. Choroba, F. Huang, M. Kavana, G. R. Moran, J. B. Spencer, E. I. Solomon, Proc. Natl. Acad. Sci. 2006, 103, 12966–12973.
[37] C. Geng, S. Ye, F. Neese, Angew. Chem. Int. Ed. 2010, 49, 5717–5720.
[38] H. Hirao, D. Kumar, L. Que Jr., S. Shaik, J. Am. Chem. Soc. 2006, 128, 8590–8606.
[39] H. Hirao, L. Que Jr., W. Nam, S. Shaik, Chem. Eur. J. 2008, 14, 1740–1756.
[40] T. K. Paine, M. Costas, J. Kaizer, L. Que Jr., J. Biol. Inorg. Chem. 2006, 11, 272–276.
[41] J. England, M. Martinho, E. R. Farquhar, J. R. Frisch, E. L. Bominaar, E. Münck, L. Que Jr., Angew. Chem. Int. Ed. 2009, 48, 3622–3626.
[42] D. C. Lacy, R. Gupta, K. L. Stone, J. Greaves, J. W. Ziller, M. P. Hendrich, A. S. Borovik, J. Am. Chem. Soc. 2010, 132, 12188–12190.
[43] O. Pestovsky, S. Stoian, E. L. Bominaar, X. Shan, E. M??nck, L. Que Jr., A. Bakac, Angew. Chem. Int. Ed. 2005, 44, 6871–6874.
[44] D. J. Xiao, E. D. Bloch, J. a Mason, W. L. Queen, M. R. Hudson, N. Planas, J. Borycz, A. L. Dzubak, P. Verma, K. Lee, F. Bonino, V. Crocella, J. Yano, S. Bordiga, D. G. Truhlar, L. Gagliardi, C. M. Brown, J. R. Long, Nat. Chem. 2014, 6, 590–595.
[45] H. Stetter, K.-H. Mayer, Chem. Ber. 1961, 94, 1410–1416.
[46] J. E. Richman, T. J. Atkins, J. Am. Chem. Soc. 1974, 96, 2268–2270.
[47] D. K. Cabbiness, D. W. Margerum, J. Am. Chem. Soc. 1969, 91, 6540–6541.
[48] M. Suchý, R. H. E. Hudson, European J. Org. Chem. 2008, 4847–4865.
[49] J. Hormann, C. Perera, N. Deibel, D. Lentz, B. Sarkar, N. Kulak, Dalt. Trans. 2013, 42, 4357–4360.
[50] J. Cho, R. Sarangi, W. Nam, Acc. Chem. Res. 2012, 45, 1321–1330.
[51] M. T. S. Amorim, S. Chaves, R. Delgado, J. J. R. Fraústo da Silva, J. Chem. Soc. Dalt. Trans. 1991, 938, 3065–3072.
[52] V. Felix, R. Delgado, M. T. S. Amorim, S. Chaves, A. M. Galvao, M. T. Duarte, M. A. A. F. de C. T. Carrondo, I. Moura, J. J. R. Frausto da Silva, J. Chem. Soc. Dalt. Trans. 1994, 3099–3106.
[53] M. T. S. Amorim, J. R. Ascenso, R. Delgado, J. R. Frausto da Silva, J. Chem. Soc. Dalt. Trans. 1990, 41, 3449–3455.
[54] C. S. Rossiter, R. A. Mathews, I. M. A. del Mundo, J. R. Morrow, J. Inorg. Biochem. 2009, 103, 64–71.

60
[55] T. W. Bell, H. J. Choi, W. Harte, M. G. B. Drew, J. Am. Chem. Soc. 2003, 125, 12196–12210.
[56] C. S. Rossiter, R. A. Mathews, J. R. Morrow, Inorg. Chem. 2005, 44, 9397–9404.
[57] J. M. Wilson, F. Giordani, L. J. Farrugia, M. P. Barrett, D. J. Robins, A. Sutherland, Org. Biomol. Chem. 2007, 5, 3651.
[58] M. Swart, M. Costas, Eds., Spin States in Biochemistry and Inorganic Chemistry, Wiley, Singapore, 2016.
[59] A. T. Fiedler, H. L. Halfen, J. A. Halfen, T. C. Brunold, J. Am. Chem. Soc. 2005, 127, 1675–1689.
[60] A. R. Mcdonald, M. R. Bukowski, E. R. Farquhar, T. A. Jackson, K. D. Koehntop, M. S. Seo, R. F. De Hont, A. Stubna, J. A. Halfen, E. Münck, W. Nam, L. Que Jr., J. Am. Chem. Soc. 2010, 132, 17118–17129.
[61] C. V. Sastri, M. J. Park, T. Ohta, T. A. Jackson, A. Stubna, M. S. Seo, J. Lee, J. Kim, T. Kitagawa, E. Münck, L. Que Jr., W. Nam, J. Am. Chem. Soc. 2005, 127, 12494–12495.
[62] J. Prakash, G. T. Rohde, K. K. Meier, E. Münck, L. Que Jr., Inorg. Chem. 2015, 54, 11055−11057.
[63] K. D. Hodges, R. G. Wollmann, E. K. Barefield, D. N. Hendrickson, Inorg. Chem. 1977, 16, 2746–2751.
[64] H. Börzel, P. Comba, K. S. Hagen, Y. D. Lampeka, A. Lienke, G. Linti, M. Merz, H. Pritzkow, L. V. Tsymbal, Inorganica Chim. Acta 2002, 337, 407–419.
[65] D. W. Blakesley, S. C. Payne, K. S. Hagen, Inorg. Chem. 2000, 39, 1979–1989.
[66] G. J. P. Britovsek, J. England, A. J. P. White, Inorg. Chem. 2005, 44, 8125–8134.
[67] G. J. P. Britovsek, J. England, A. J. P. White, Dalt. Trans. 2006, 1399–1408.
[68] A. Decker, J. Rohde, L. Que Jr., E. I. Solomon, J. Am. Chem. Soc. 2004, 126, 5378–5379.
[69] P. Gütlich, E. Bill, A. X. Trautwein, Möβbauer Spectroscopy and Transition Metal Chemistry: Fundamentals and Applications, Springer Science & Business Media, 2010.
[70] T. A. Jackson, J. Rohde, M. S. Seo, C. V Sastri, R. Dehont, J. Am. Chem. Soc. 2008, 130, 12394–12407.
[71] M. P. Jensen, M. Costas, R. Y. N. Ho, J. Kaizer, A. Mairata I Payeras, E. Munck, L. Que Jr., Jr., J.-U. Rhode, A. Stubna, J. Am. Chem. Soc. 2005, 127, 10512–10522.
[72] J. C. Schöneboom, F. Neese, W. Thiel, J. Am. Chem. Soc. 2005, 127, 5840–5853.
[73] J. Krzystek, J. England, K. Ray, A. Ozarowski, D. Smirnov, L. Que Jr., J. Telser, Inorg. Chem. 2008, 47, 3483–3485.
[74] J. U. Rohde, a Stubna, E. L. Bominaar, E. Münck, W. Nam, L. Que Jr, Inorg. Chem. 2006, 45, 6435–6445.

61
[75] J. U. Rohde, S. Torelli, X. Shan, M. H. Lim, E. J. Klinker, J. Kaizer, K. Chen, W. Nam, L. Que Jr, J. Am. Chem. Soc. 2004, 126, 16750–16761.
[76] M. H. Lim, J.-U. Rohde, A. Stubna, M. R. Bukowski, M. Costas, R. Y. N. Ho, E. Munck, W. Nam, L. Que Jr., Proc. Natl. Acad. Sci. 2003, 100, 3665–3670.
[77] Y.-R. Luo, Comprehensive Handbook of Chemical Bond Energies, CRC Press, Boca Raton, Florida, 2007.
[78] C. V Sastri, J. Lee, K. Oh, Y. J. Lee, T. A. Jackson, K. Ray, H. Hirao, W. Shin, J. A. Halfen, J. Kim, L. Que Jr., S. Shaik, W. Nam, Proc. Natl. Acad. Sci. 2007, 104, 19181–19186.
[79] A. Kohen, J. P. Klinman, Chem. Biol. 1999, 6, R191–R198.

62

Chapter 3:
Reactivity Studies of a Hexanuclear Cobalt Complex Supported on a Stannoxane Core

64
Compounds discussed in Chapter 3
Ligand
L6
Complex
3
Attached to the S6O6 core
Co-L6
Intermediate
CoIIICoIII
O O
CoIVCoIV
O O3
Proposed equilibrium between a bridging µ-peroxo-dicobalt(III) and oxocobalt(IV) units
Co-1
Color code: N-blue, O-red, Sn-green, C-gray, S-yellow, F-light green, Fe-orange. Hydrogen atoms have been ommited for clarity.
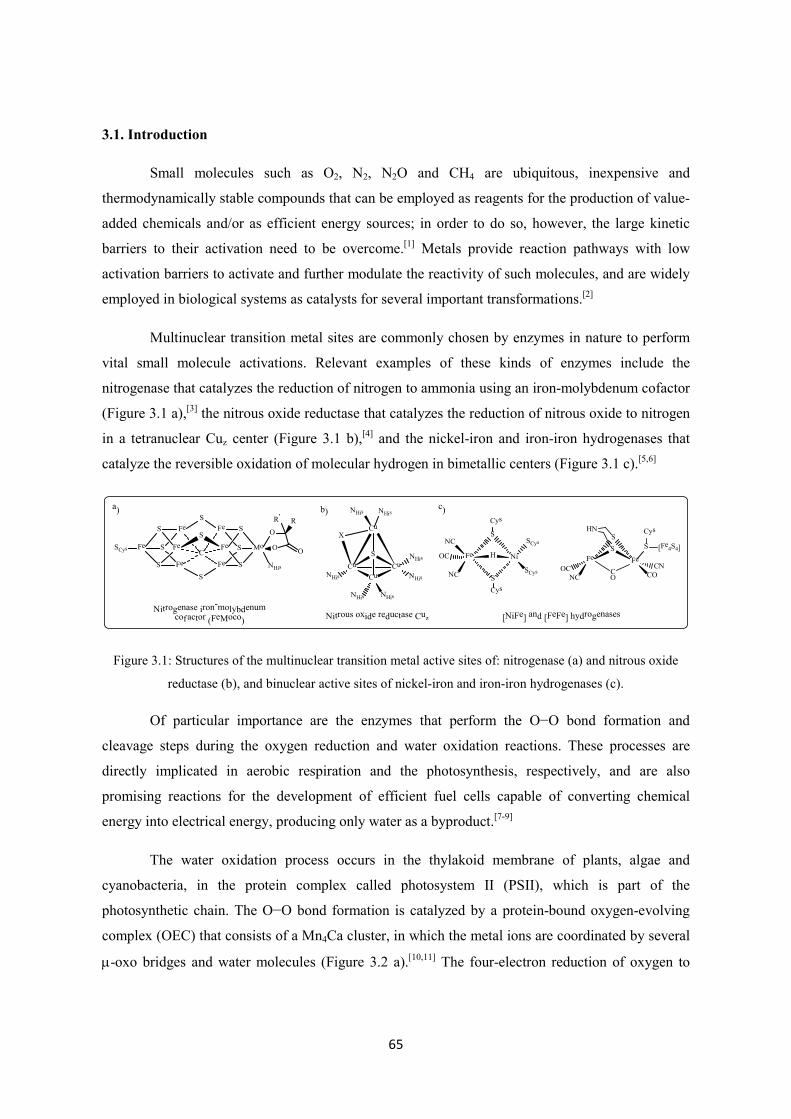
65
3.1. Introduction
Small molecules such as O2, N2, N2O and CH4 are ubiquitous, inexpensive and
thermodynamically stable compounds that can be employed as reagents for the production of value-
added chemicals and/or as efficient energy sources; in order to do so, however, the large kinetic
barriers to their activation need to be overcome.[1] Metals provide reaction pathways with low
activation barriers to activate and further modulate the reactivity of such molecules, and are widely
employed in biological systems as catalysts for several important transformations.[2]
Multinuclear transition metal sites are commonly chosen by enzymes in nature to perform
vital small molecule activations. Relevant examples of these kinds of enzymes include the
nitrogenase that catalyzes the reduction of nitrogen to ammonia using an iron-molybdenum cofactor
(Figure 3.1 a),[3] the nitrous oxide reductase that catalyzes the reduction of nitrous oxide to nitrogen
in a tetranuclear Cuz center (Figure 3.1 b),[4] and the nickel-iron and iron-iron hydrogenases that
catalyze the reversible oxidation of molecular hydrogen in bimetallic centers (Figure 3.1 c).[5,6]
a) b) c)
SCys Fe S
Fe
FeS
S
Fe
S
S
S
Fe
Fe
Fe
S Mo
S
S NHis
O
O O
RR'
C
Nitrogenase iron-molybdenum
cofactor (FeMoco)
Cu
S
CuCuCu
NHis NHis
NHis NHis
NHis
NHis
NHis
X
Nitrous oxide reductase Cuz
Fe
S
S
Ni
SCys
SCys
Cys
Cys
NC
OC
NC
Fe
SS
Fe
CO
S
NCOC CN
[Fe4S4]
Cys
CO
HN
[NiFe] and
[FeFe]
hydrogenases
H
Figure 3.1: Structures of the multinuclear transition metal active sites of: nitrogenase (a) and nitrous oxide
reductase (b), and binuclear active sites of nickel-iron and iron-iron hydrogenases (c).
Of particular importance are the enzymes that perform the O−O bond formation and
cleavage steps during the oxygen reduction and water oxidation reactions. These processes are
directly implicated in aerobic respiration and the photosynthesis, respectively, and are also
promising reactions for the development of efficient fuel cells capable of converting chemical
energy into electrical energy, producing only water as a byproduct.[7-9]
The water oxidation process occurs in the thylakoid membrane of plants, algae and
cyanobacteria, in the protein complex called photosystem II (PSII), which is part of the
photosynthetic chain. The O−O bond formation is catalyzed by a protein-bound oxygen-evolving
complex (OEC) that consists of a Mn4Ca cluster, in which the metal ions are coordinated by several
µ-oxo bridges and water molecules (Figure 3.2 a).[10,11] The four-electron reduction of oxygen to

66
water, on the other hand, is performed by different known enzymes. Two groups of enzymes are
especially important for oxygen reduction: multicopper oxidases such as laccase, which uses a tri-
nuclear copper cluster as the active site (Figure 3.2 b),[12] and the cytochrome c oxidases, which
utilize a bimetallic heterodinuclear iron-copper site (Figure 3.2 c) to perform this reaction at the end
of the respiratory chain. [13,14]
CaO
MnMn
OO
O
Mn
O
O
MnO
H
a) b) c)
Oxygen-evolving complex
of Photosystem
II
Cu Cu
Cu
O
NHis
OH2
NHis
NHis
NHis
NHis NHis
NHis
NHis
H
Tri-nuclear copper cluster of Laccase
N
N N
N
R2
R3R4
R1
R5
Fe
CuNHis
NHis
NHis
NHis
Cytochrome c oxidase
Figure 3.2: Structures of the multinuclear transition metal active sites of enzymes involved in O−O bond
formation and O2 reduction processes: a) the oxygen-evolving complex of photosystem II, b) the tri-nuclear
copper cluster of laccase and c) the cytochrome c oxidase.
In order to get a better understanding of the effects of metal nuclearity in the activation of
small molecules, great efforts have been made to generate multinuclear transition metal compounds
in which the synergism between the multiple metal centers can be studied.[15-17] Simultaneously,
much attention has been given to the incorporation of transition metals to dendrimer structures due
to their potential applications in various fields[18,19] and the fact that they provide an organization
frame for the metals to work together.[20,21] The convergence of these two views results in the
interest in generating dendrimer-like structures capable of coordinating metals in such a way that
they can work synergistically in the activation of small molecules.
The synthetic difficulties related to the generation of such multinuclear ligands have
restricted research in this field; however, the organostannoxane approach has proven to be a simple
and efficient methodology to generate dendrimer-like multinuclear ligands with multiple binding
sites for transition metals. This methodology was first reported by Chandrasekhar and coworkers in
2005, when they used it to generate a hexanuclear Cu-porphyrin complex supported in a stannoxane
Sn6O6 core, capable of cleaving the supercoiled DNA structure, thanks to the cooperativity between
the metal centers.[21]
Following the same approach, in 2012 Kundu et al. reported the synthesis and
characterization of a hexanuclear non-heme iron complex Fe-L6 supported in a stannoxane core.[22]

67
The hexanucleating ligand L6, characterized by X-Ray, 119Sn-NMR and IR, showed a drum-like
stannoxane central core supporting a wheel arrangement of the six non-heme ligands with two
pyridine and two amine donor sites per ligand fraction (Scheme 3.1). The hexanuclear iron complex
Fe-L6, obtained from the reaction of L6 with 6 equivalents of Fe(OTf)2, was characterized by
inductively coupled plasma mass spectroscopy (ICP-MS), elemental analysis, 119Sn-NMR, 19F NMR
and Möβbauer spectroscopy together with DFT calculations and was shown to contain six high-spin
Fe(II) centers supported in the intact tin core with two triflate ions per metallic ion (Scheme 3.1).
Fe(OTf)2
3
Attached to the
Sn6O6
core
L6 Fe-L6
Scheme 3.1: Structures of the hexanuclear ligand L6 and the complex Fe-L6 as reported by Kundu et al.[22]
Color code: N-blue, O-red, Sn-green, C-gray, S-yellow, F-light green, Fe-orange. Hydrogen atoms have been
ommited for clarity.
PhIO
FeIIFeII FeIVFeIV
O O
FeIIIFeIII
O O
FeIII
O O
FeII
Scheme 3.2: Proposed mechanism for the O−O bond formation reaction mediated by Fe-L6 as reported by
Kundu et al.[22] Color code: N-blue, O-red, Sn-green, C-gray, S-yellow, F-light green, Fe-orange. Hydrogen
atoms have been ommited for clarity.

68
Kundu and coworkers showed that Fe-L6 performed an intramolecular O−O bond formation
reaction when it was set to react with 2-(tert-butylsulfonyl)-iodosylbenzene (sPhIO) in CH2Cl2 at
25 °C. It was proposed that this reaction would proceed through the mechanism shown in Scheme
3.2. The iron centers in Fe-L6 initially formed transient oxoiron(IV) intermediates. The coupling of
two neighboring oxoiron units generated a peroxo-bridged diiron(III) complex. Finally, this species
underwent a rearrangement to generate the detected superoxo FeIII-(O2●-) FeII units. These findings
supported the previous reports of iron complexes as suitable catalysts for water oxidation in
homogeneous conditions[23,24] and showed that the dendrimer-like ligand structure facilitates the
synergistic work between the metal centers for this crucial O−O bond formation reaction.
Furthermore, Kundu also reported the synthesis of a hexanuclear cobalt(II) complex Co-L6
supported by the same hexanuclear ligand L6 and characterized it through elemental analysis,
inductively coupled plasma mass spectroscopy (ICP-MS), 119Sn-NMR and infrared spectroscopy
(IR).[25] This characterization, which was consistent with the preliminary density functional theory
(DFT) calculations, suggested that the structure of the hexanuclear cobalt complex was similar to
that of the hexanuclear iron complex Fe-L6 (Scheme 3.1) where each cobalt is coordinated by three
nitrogen donors from the ligand L6, together with two triflate ligands. However, the possible
interaction between the cobalt centers of the complex was not explored and more robust theoretical
and experimental studies were lacking to properly determine the coordination around the cobalt
centers.
In contrast to the Fe-L6 complex, Co-L6 barely reacted with sPhIO but rapidly reacted with
O2 in CH2Cl2 or acetone at 25 °C to yield an orange species Co-1 with a maximum absorbance band
λmax (εmax, M-1 cm-1) centered at 470 nm (11600) and a half-life of 3600 s (Figure 3.3). Complex
Co-1 was further characterized by rRaman, XAS and DFT calculations. The rRaman of Co-1
(Figure 3.4 a), measured using a 458 nm laser excitation in resonance with the 470 nm transition,
showed three 16O/18O isotopically sensitive vibrational bands at 868, 825 and 611 cm-1 with
observed isotopic downshifts of 49, 27 and 34 cm-1 respectively. The bands at 868 and 611 cm-1
were assigned to the O−O stretching vibration of a peroxo ligand and to a Co−O stretching
vibration. The rR band at 825 cm-1, on the other hand, was assigned to a simple Co−O harmonic
oscillator; it has been proposed that this higher-energy Co−O vibrational band is an indicator of the
presence of CoIV=O units in solution. The band observed in the UV-vis at 470 nm was thus assigned
to be predominantly a peroxo-to-cobalt charge transfer band. As for the peroxo ligand coordination
mode, it was assigned to a bridging µ-peroxo-dicobalt(III) complex, given the resemblance of its
spectral features with those of previously reported bridging peroxo complexes[26-28] and given that

69
the alternative side-on Co(III) peroxo complexes would be expected to display absorption features
with much lower extinction coefficients (ε < 1000 M-1s-1).[29–31]
Figure 3.3: Absorption spectra showing the formation of Co-1 (straight line) from the reaction of Co-L6 0.75
mM (dotted line) with O2 in CH2Cl2 at 25 °C. Inset: Absorbance change at 470 nm against time due to the
formation of Co-1.
Figure 3.4: a) rRaman spectra with 458 nm laser excitation in d6-acetone at −80 °C of Co-1-18O (orange solid
line), Co-1-16O (blue solid line) and the difference [Co-1-18O]-[Co-1-16O] (gray solid line). b) normalized Co
K-edge near edge X-ray absorption spectrum of Co-L6 (gray solid line) and Co-1 (black solid line); the inset
shows the expansion of the pre-edge. Reported by Kundu.[25]
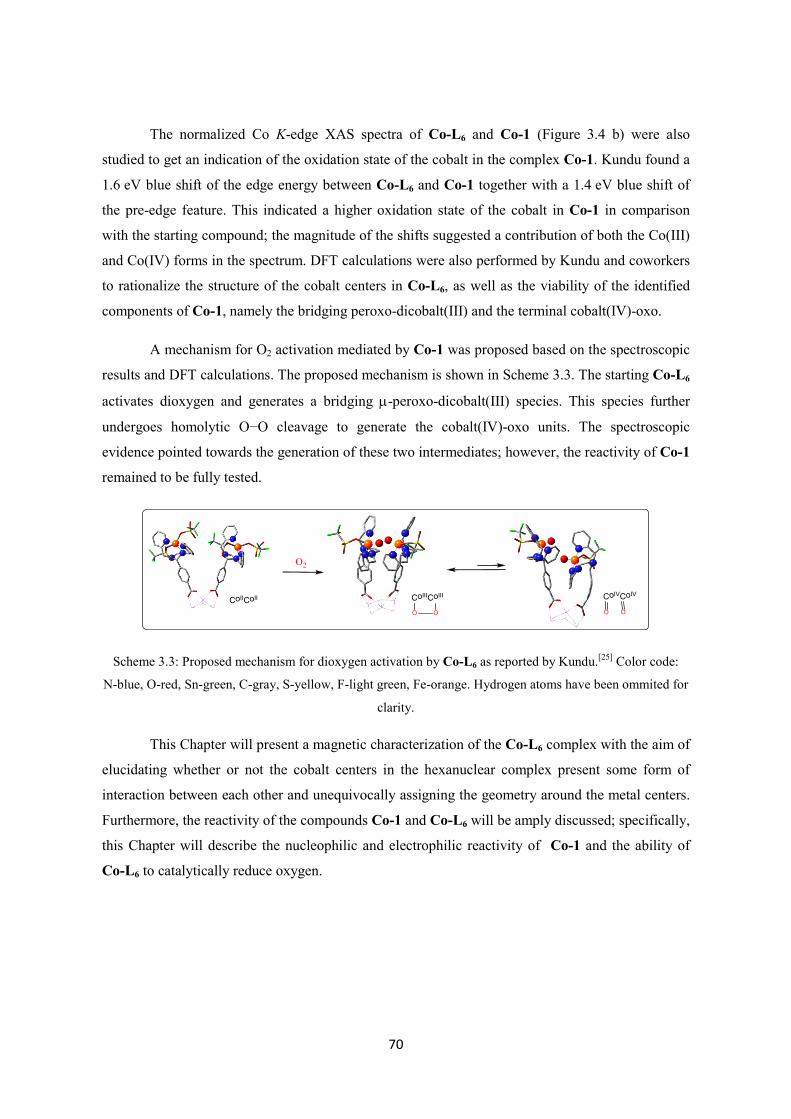
70
The normalized Co K-edge XAS spectra of Co-L6 and Co-1 (Figure 3.4 b) were also
studied to get an indication of the oxidation state of the cobalt in the complex Co-1. Kundu found a
1.6 eV blue shift of the edge energy between Co-L6 and Co-1 together with a 1.4 eV blue shift of
the pre-edge feature. This indicated a higher oxidation state of the cobalt in Co-1 in comparison
with the starting compound; the magnitude of the shifts suggested a contribution of both the Co(III)
and Co(IV) forms in the spectrum. DFT calculations were also performed by Kundu and coworkers
to rationalize the structure of the cobalt centers in Co-L6, as well as the viability of the identified
components of Co-1, namely the bridging peroxo-dicobalt(III) and the terminal cobalt(IV)-oxo.
A mechanism for O2 activation mediated by Co-1 was proposed based on the spectroscopic
results and DFT calculations. The proposed mechanism is shown in Scheme 3.3. The starting Co-L6
activates dioxygen and generates a bridging µ-peroxo-dicobalt(III) species. This species further
undergoes homolytic O−O cleavage to generate the cobalt(IV)-oxo units. The spectroscopic
evidence pointed towards the generation of these two intermediates; however, the reactivity of Co-1
remained to be fully tested.
O2
CoIICoII CoIIICoIII
O O
CoIVCoIV
O O
Scheme 3.3: Proposed mechanism for dioxygen activation by Co-L6 as reported by Kundu.[25] Color code:
N-blue, O-red, Sn-green, C-gray, S-yellow, F-light green, Fe-orange. Hydrogen atoms have been ommited for
clarity.
This Chapter will present a magnetic characterization of the Co-L6 complex with the aim of
elucidating whether or not the cobalt centers in the hexanuclear complex present some form of
interaction between each other and unequivocally assigning the geometry around the metal centers.
Furthermore, the reactivity of the compounds Co-1 and Co-L6 will be amply discussed; specifically,
this Chapter will describe the nucleophilic and electrophilic reactivity of Co-1 and the ability of
Co-L6 to catalytically reduce oxygen.

71
3.2. Results and discussion
3.2.1 Characterization of Co-L6
The complex Co-L6 has been characterized before with a variety of techniques, as reported
by Kundu.[25] The elemental analysis confirmed the purity of the hexanuclear cobalt compound,
while ICP-MS revealed the presence of six cobalt atoms per hexameric ligand L6. The infra-red
spectrum of Co-L6, on the other hand, supported the presence of the drum core in the structure of
the complex. However, the techniques employed do not provide information on any possible
interaction between the cobalt centers within the molecule or in neighboring molecules.
Magnetic measurements of Co-L6 were performed in order to evaluate whether or not the
metallic centers are interacting with each other within the hexanuclear complex. The magnetization
data Mmol/Ngβ versus βH/kT of Co-L6 was recorded in a SQUID (Superconducting Quantum
Interference Device) magnetometer at fields ranging from 1 to 7 Tesla (Figure 3.5), where Mmol
represents molecular magnetization, N is Avogadro’s number, β is the Bohr magneton, H is the
magnetic field, k is the Boltzmann constant and T is the absolute temperature. The collected data
was properly modeled by zero-field splitting (ZFS), using the spin Hamiltonian:
Ĥ = gµBHS + D[Sz2-S(S+1)/3] + E[Sx
2-Sy2]
where H is the applied magnetic field, g is the g-tensor, S is the electronic spin, and D and E are
parameters that describe the effects of axial and rhombic ligand fields, respectively. The following
magnetic parameters gave the best fits for the magnetization curves obtained: E = 0.05, D = 3.5 cm-1
and g = 2.23 for a cobalt(II) S = 3/2 complex. Small amounts of diamagnetic impurity (5%) were
also taken into consideration to better fit the magnetization intensity of the raw data. The fits and
the parameters thus obtained confirmed that the cobalt centers in Co-L6 are in an S = 3/2 ground
state[32] and suggested that there is no interaction between the metallic centers in the molecule.
Further studies employing electron paramagnetic resonance (EPR) spectroscopy were
performed. The X-band EPR spectrum of Co-L6 (10 mM in CH2Cl2) obtained at 8 K is presented in
Figure 3.6 (solid black line). It exhibits a slightly rhombic signal with g values g┴ = 4.2 and
g║ ≈ 2.1, which are characteristic of a high-spin cobalt(II) center.[33,34] The spectra obtained thus
support the assignation of the cobalt centers in Co-L6 as S = 3/2 as determined by fitting the
magnetization curves. Further on, in order to evaluate the possibility of the cobalt centers
interacting with each other, EPR studies varying the concentration of the hexanuclear complex
Co-L6 in CH2Cl2 were carried out and are also shown in Figure 3.6. It turned out that the EPR

72
spectra did not depend on the concentration of the complex employed, thus proving the absence of
any interaction between the metallic centers.
Figure 3.5: Magnetization data Mmol/Ngβ vs βH/kT for Co-L6 in applied fields ranging from 1 to 7 Tesla. Raw
experimental data is presented as black figures and the scaled best fits as solid gray lines (with the parameters
discussed in the text).
Figure 3.6: EPR spectra of Co-L6 in CH2Cl2 at 8 K in increasing concentrations (red: 1 Mm, purple: 3 mM,
blue: 6mM and black: 10 mM).
As Co-L6 lacks a determined crystal structure, computational studies were performed to
establish the geometry of the complex. An annotated model of Co-L6 was utilized for the
computational study through abbreviation to a single arm extending from the stannoxane core; this
model can correctly represent each of the six cobalt centers since the magnetic studies confirmed

73
that there is no interaction between them. As triflate was the sole counter-anion utilized during the
synthesis, it was sensible to determine whether the triflates were bound to the complex, and if so,
how many. Model complexes A, B and C were generated, in which zero, one and two triflates are
bound to the cobalt(II) center, respectively. The optimized molecular structures of A, B and C are
shown in Figure 3.7 (the computational details are described in Chapter 6).
Model complex A Model complex B Model complex C
Figure 3.7: Optimized molecular structures of the model complexes A, B and C for the single-arm cobalt(II)
fraction of Co-L6. Color code: C-dark gray, N-blue, O-red, S-yellow, F-light blue, Co-bluish-gray; the
hydrogen atoms are omitted for clarity.
Table 3.1: Relative energies of the model complexes A, B and C for comparing the relative favorability of the
triflate binding in the single-arm cobalt(II) fraction of Co-L6.
Model complex Short formulation
(L = single-arm fraction) ∆E (kcal mol-1)
A [L-CoII]2+ + (OTf)22- 135.5
B [L-CoII(OTf)]+ + (OTf)- 42.9
C [L-CoII(OTf)2] 0
In model complex A, the unsubstituted Co(II) single-arm compound, the metal coordination
appears t-shaped, with approximate C2v symmetry in the first coordination sphere (Figure 3.7 a). In
model complex B, the one-triflate Co(II) single-arm compound, the metal coordination appears
square planar, with approximate D4h symmetry in the first coordination sphere (Figure 3.7 b).
Finally, in model complex C, the two-triflate Co(II) single-arm compound, the metal coordination
appears trigonal bipyramidal, with approximate D3h symmetry in the first coordination sphere.
The relative energies of the calculated Co(II) single-arm complexes A, B and C are
presented in Table 3.1. From the energy values calculated, it is clear that the binding of two triflates
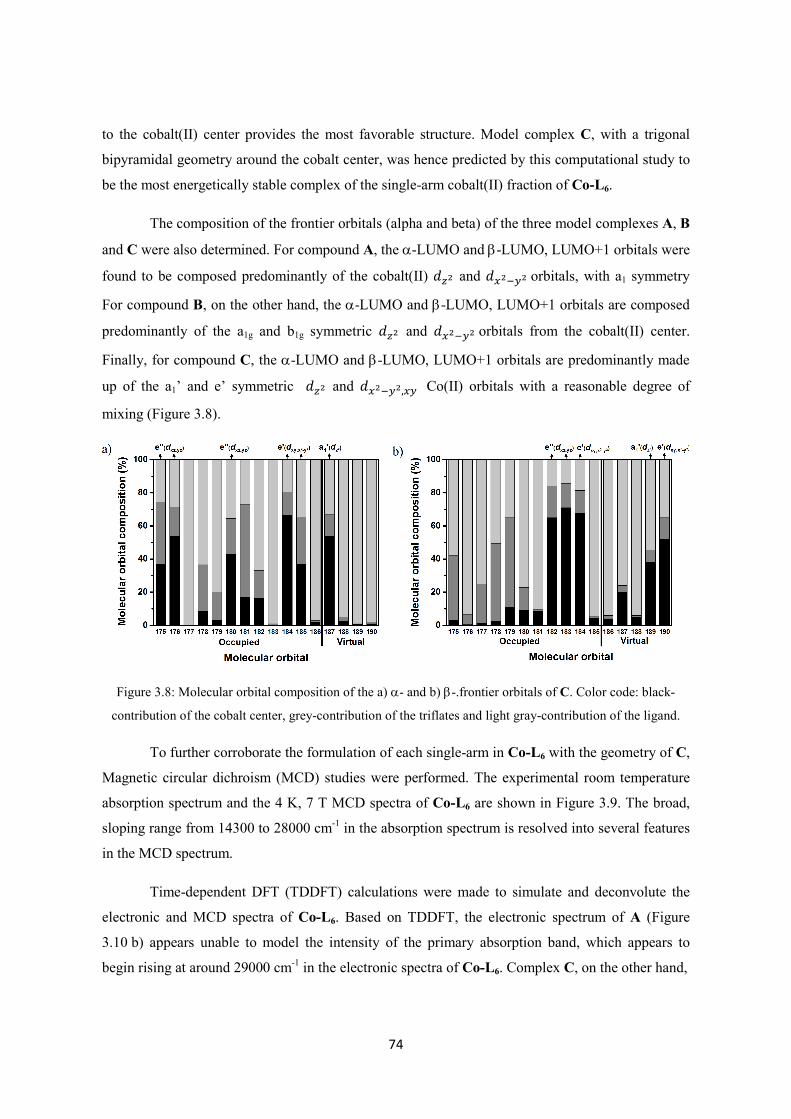
74
to the cobalt(II) center provides the most favorable structure. Model complex C, with a trigonal
bipyramidal geometry around the cobalt center, was hence predicted by this computational study to
be the most energetically stable complex of the single-arm cobalt(II) fraction of Co-L6.
The composition of the frontier orbitals (alpha and beta) of the three model complexes A, B
and C were also determined. For compound A, the α-LUMO and β-LUMO, LUMO+1 orbitals were
found to be composed predominantly of the cobalt(II) 𝑑𝑑𝑧𝑧2 and 𝑑𝑑𝑥𝑥2−𝑦𝑦2 orbitals, with a1 symmetry
For compound B, on the other hand, the α-LUMO and β-LUMO, LUMO+1 orbitals are composed
predominantly of the a1g and b1g symmetric 𝑑𝑑𝑧𝑧2 and 𝑑𝑑𝑥𝑥2−𝑦𝑦2 orbitals from the cobalt(II) center.
Finally, for compound C, the α-LUMO and β-LUMO, LUMO+1 orbitals are predominantly made
up of the a1’ and e’ symmetric 𝑑𝑑𝑧𝑧2 and 𝑑𝑑𝑥𝑥2−𝑦𝑦2,𝑥𝑥𝑦𝑦 Co(II) orbitals with a reasonable degree of
mixing (Figure 3.8).
Figure 3.8: Molecular orbital composition of the a) α- and b) β-.frontier orbitals of C. Color code: black-
contribution of the cobalt center, grey-contribution of the triflates and light gray-contribution of the ligand.
To further corroborate the formulation of each single-arm in Co-L6 with the geometry of C,
Magnetic circular dichroism (MCD) studies were performed. The experimental room temperature
absorption spectrum and the 4 K, 7 T MCD spectra of Co-L6 are shown in Figure 3.9. The broad,
sloping range from 14300 to 28000 cm-1 in the absorption spectrum is resolved into several features
in the MCD spectrum.
Time-dependent DFT (TDDFT) calculations were made to simulate and deconvolute the
electronic and MCD spectra of Co-L6. Based on TDDFT, the electronic spectrum of A (Figure
3.10 b) appears unable to model the intensity of the primary absorption band, which appears to
begin rising at around 29000 cm-1 in the electronic spectra of Co-L6. Complex C, on the other hand,

75
Figure 3.9: Experimental UV-vis absorption (top) and MCD spectrum (bottom). The UV-vis was recorded at
room temperature. The MCD spectrum was acquired at 4 K, 7 T, and the intensity normalized to 4 K, 1 T.
Figure 3.10: Comparison of the experimental UV-vis spectra of Co-L6 with the TDDFT-calculated spectra of
A, B and C model complexes, as calculated by ORCA 3.0.2.
appears able to model the experimental electronic spectrum (Figure 3.10 d). The low-energy MCD
spectrum, in the region of 15000 to 22000 cm-1, was also deconvoluted based on TDDFT results for
C (Figure 3.11). The first observable transition of the MCD spectrum arises from several d-centered
e’’,e’→e’,a1’ transitions, while slightly higher energy features are due to several LMCT (ligand to
metal charge transfer)-type excitations. The predominant peak of the spectrum, centered at around

76
32000 cm-1 (Figure 3.9 b) may be ascribed to several pyridine-centered p to p* transitions. Table
3.2 presents the energies, oscillator values and band assignments for the low-energy transitions for
model complex C, which best fits the experimental results.
Figure 3.11: Band deconvolution analysis of the low-energy MCD region (4 K, 7 T) based on TDDFT results
for C calculated by ORCA. Black line- experimental spectrum, red- Gaussian deconvolution bands, blue-sum
of Gaussian deconvolution bands.
Table 3.2: First fifteen electronic transitions of C calculated via TDDFT as implemented in ORCA 3.0.2.
TDDFT-calculated Electronic Excitations Energy (cm-1) f osc. Transition type
1 7,231 0.00003 e' e' 2 8,348 0.00003 e" a1’ 3 9,384 0.00005 Pyr. π + e” a1’ 4 9,633 0.00001 e' a1’ 5 11,963 0.00008 e” e’ 6 13,484 0.00115 Pyr. π + e” a1’ 7 14,009 0.00361 e" a1’ 8 16,475 0.00245 e' a1’ 9 18,111 0.00010 e" a1’ + π*
10 19,187 0.00006 e” e’ 11 22,999 0.00035 LMCT (to a1’) 12 28,134 0.00024 LMCT 13 28,334 0.01091 LMCT 14 29,337 0.00008 LMCT 15 29,422 0.00001 LMCT

77
The results obtained so far indicate that the cobalt centers in Co-L6 are in a high spin S=3/2
configuration and no interaction exists between them, so they can be treated independently to study
the geometry of the cobalt centers within the hexanuclear complex. The single-arm model complex
C, with two triflates coordinated to the cobalt(II) and a bipyramidal geometry around the metallic
center, was found to be the lowest in energy, in comparison with the A and B structures (with zero
or one triflate in the cobalt coordination sphere respectively). C was also found to best fit the
electronic and MCD experimental spectra. It was found that the main peak in the spectra could be
ascribed to several pyridine-centered p to p* transitions, while those at lower energies were
d-centered and LMCT in nature.
3.2.2 Nucleophilic oxidative reactivity of Co-1
As described before, the reaction of the hexanuclear complex Co-L6 with oxygen at 25 °C
was proposed to result in the formation of bridging µ-peroxo-dicobalt(III) units that further partially
convert to cobalt(IV)-oxo units. The presence of both species was detected in the rRaman spectrum
obtained via excitation of the oxidized species with a 458 nm laser in resonance with the UV-vis
band at 470 nm, which indicates that Co-1 comprises both species in solution. In order to complete
the characterization of Co-1, reactivity studies were performed to test the reactivity-character of the
intermediates detected.
Metal-peroxo species are believed to play key roles in the oxidative transformations of
organic molecules by metalloenzymes.[35,36] In biomimetic studies, a number of metal-peroxo model
complexes have been characterized and their reactivities have been intensely researched.[35] Late
transition metal-peroxo species,[37] including cobalt-peroxo complexes,[31,38] have been found able to
perform nucleophilic oxidations, such as the deformilation of aldehydes, but not electrophilic
oxidations such as C−H bond activation reactions or the oxygen transfer to triphenylphosphine. In
an effort to elucidate the chemical behavior of the intermediate Co-1, its reactivity in nucleophilic
reactions was tested.
Co-1 was generated in situ by bubbling O2 in a 0.15 mM dichloromethane solution of
Co-L6; its formation was monitored by following the rise in the 470 nm band in the UV-vis spectra.
An excess of more than 20 equivalents of benzoyl chloride were then added to the reaction mixture.
The decay of the band at 470 nm (Figure 3.12) was monitored and fitted to a pseudo-first-order rate
(Figure 3.12, inset) from which kobs was determined. An analysis of the reaction mixture with
GC-MS showed the formation of benzoic acid as the product of the reaction.
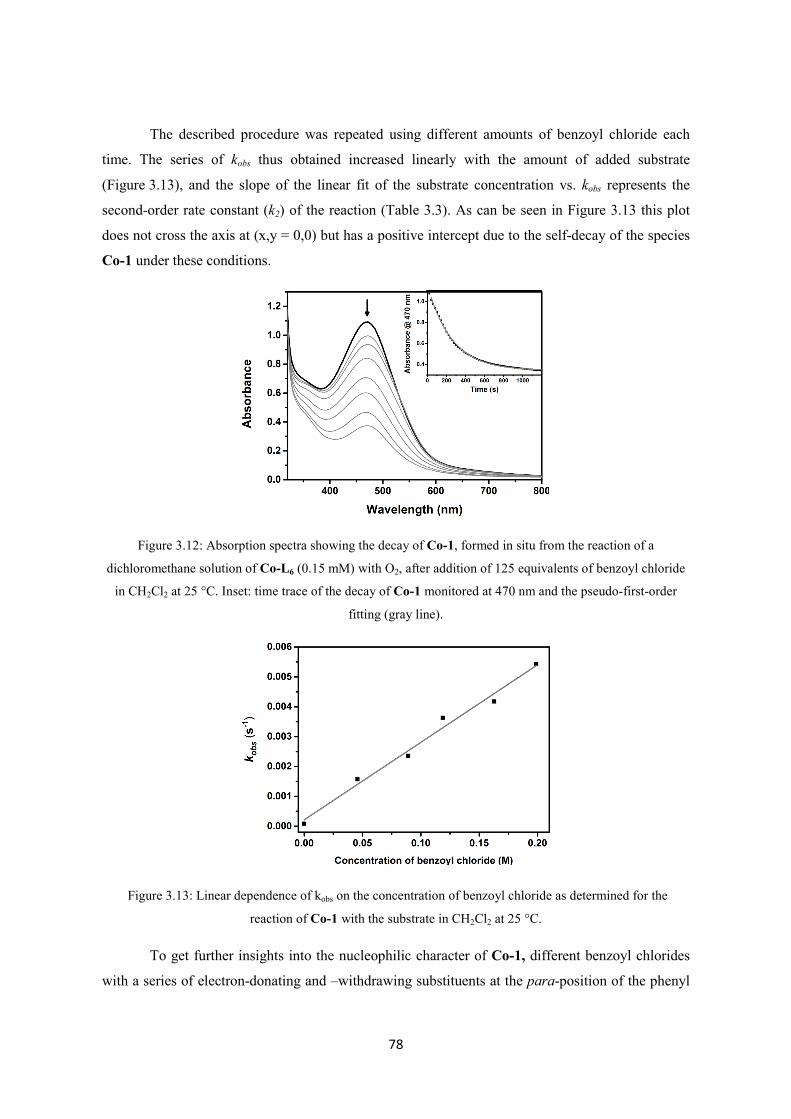
78
The described procedure was repeated using different amounts of benzoyl chloride each
time. The series of kobs thus obtained increased linearly with the amount of added substrate
(Figure 3.13), and the slope of the linear fit of the substrate concentration vs. kobs represents the
second-order rate constant (k2) of the reaction (Table 3.3). As can be seen in Figure 3.13 this plot
does not cross the axis at (x,y = 0,0) but has a positive intercept due to the self-decay of the species
Co-1 under these conditions.
Figure 3.12: Absorption spectra showing the decay of Co-1, formed in situ from the reaction of a
dichloromethane solution of Co-L6 (0.15 mM) with O2, after addition of 125 equivalents of benzoyl chloride
in CH2Cl2 at 25 °C. Inset: time trace of the decay of Co-1 monitored at 470 nm and the pseudo-first-order
fitting (gray line).
Figure 3.13: Linear dependence of kobs on the concentration of benzoyl chloride as determined for the
reaction of Co-1 with the substrate in CH2Cl2 at 25 °C.
To get further insights into the nucleophilic character of Co-1, different benzoyl chlorides
with a series of electron-donating and –withdrawing substituents at the para-position of the phenyl

79
group were employed as substrates, namely para-X-Ph-COCl where X= OMe, Me, H, Cl and CN.
The second-order rate constants obtained are presented in Table 3.3.
Table 3.3: Second-order rate constants (k2) for the nucleophilic oxidative reactions of Co-1 with para-
substituted benzoyl chlorides (p-X-Ph-COCl; X= OMe, Me, H, Cl and CN) determined in CH2Cl2 at 25 °C.
X OMe Me H Cl CN
k2
(L mol-1 s-1) 0.0158 0.0199 0.0260 0.0393 0.2132
As expected for a nucleophilic mechanism, the rate constant increases as the electron
withdrawing capability of the para-substituents of the benzoyl chloride is increased. However,
when the log k2 vs. the para-substituent constants (sp+) are plotted, a notable anomaly in the trend
can be observed (Figure 3.14); while the first four points reveal a good linear correlation, the last
point, corresponding to the reactivity of Co-1 with para-CN-Ph-COCl, is located outside of the
trend (Figure 3.14). This can indicate a change in the reaction mechanism of Co-1 with the CN-
substituted benzoyl chloride; we attribute this sudden change to the possibility that the CN- group
may be coordinated to the metallic complex, thus substantially increasing the rate of the reaction.
Figure 3.14: Hammett plot of log k2 against sp+ for the reaction of Co-1 with para-substituted benzoyl
chlorides (para-X-Ph-COCl; X= OMe, Me, H, Cl and CN) in CH2Cl2 at 25 °C.
By taking only the initial four points of the plot, a Hammett reaction constant (ρ) value of
+2.0 was obtained for the reaction of Co-1 with benzoyl chlorides. The positive value of ρ
corroborates the nucleophilic character of Co-1, which can be ascribed to the bridging µ-peroxo-
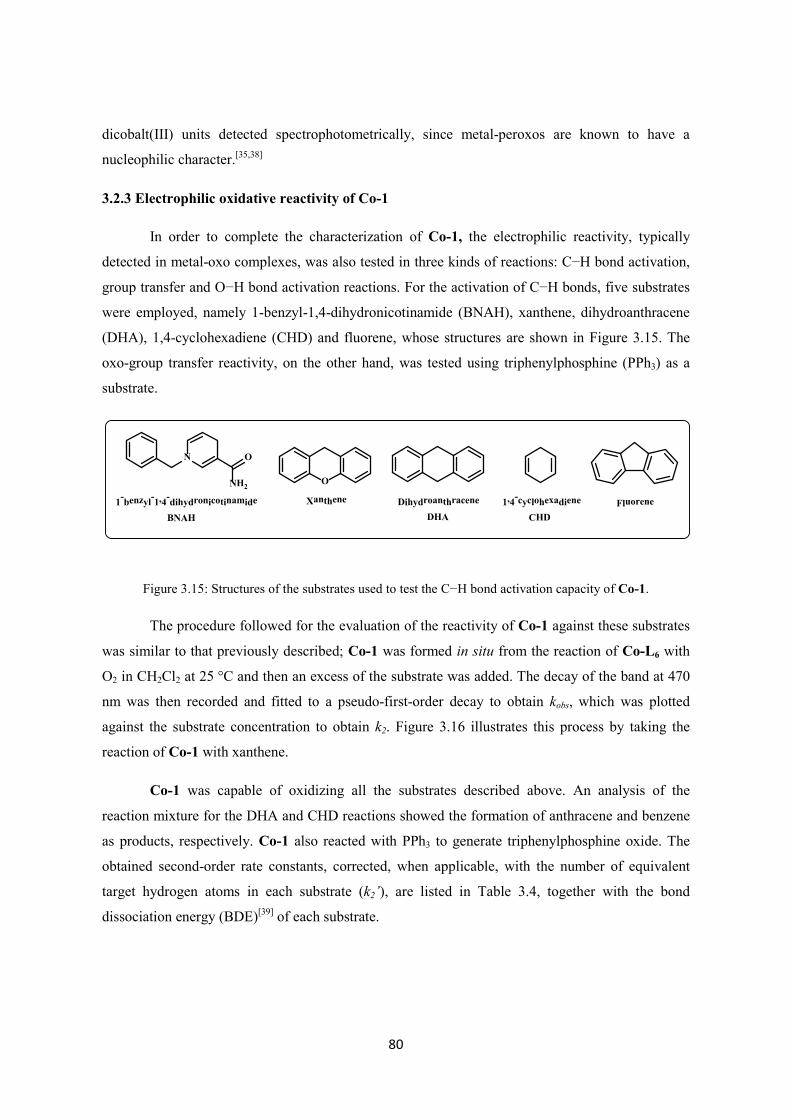
80
dicobalt(III) units detected spectrophotometrically, since metal-peroxos are known to have a
nucleophilic character.[35,38]
3.2.3 Electrophilic oxidative reactivity of Co-1
In order to complete the characterization of Co-1, the electrophilic reactivity, typically
detected in metal-oxo complexes, was also tested in three kinds of reactions: C−H bond activation,
group transfer and O−H bond activation reactions. For the activation of C−H bonds, five substrates
were employed, namely 1-benzyl-1,4-dihydronicotinamide (BNAH), xanthene, dihydroanthracene
(DHA), 1,4-cyclohexadiene (CHD) and fluorene, whose structures are shown in Figure 3.15. The
oxo-group transfer reactivity, on the other hand, was tested using triphenylphosphine (PPh3) as a
substrate.
N O
NH2
BNAH
O
Xanthene
DHA1-benzyl-1,4-dihydronicotinamide Dihydroanthracene 1,4-cyclohexadiene
CHDFluorene
Figure 3.15: Structures of the substrates used to test the C−H bond activation capacity of Co-1.
The procedure followed for the evaluation of the reactivity of Co-1 against these substrates
was similar to that previously described; Co-1 was formed in situ from the reaction of Co-L6 with
O2 in CH2Cl2 at 25 °C and then an excess of the substrate was added. The decay of the band at 470
nm was then recorded and fitted to a pseudo-first-order decay to obtain kobs, which was plotted
against the substrate concentration to obtain k2. Figure 3.16 illustrates this process by taking the
reaction of Co-1 with xanthene.
Co-1 was capable of oxidizing all the substrates described above. An analysis of the
reaction mixture for the DHA and CHD reactions showed the formation of anthracene and benzene
as products, respectively. Co-1 also reacted with PPh3 to generate triphenylphosphine oxide. The
obtained second-order rate constants, corrected, when applicable, with the number of equivalent
target hydrogen atoms in each substrate (k2’), are listed in Table 3.4, together with the bond
dissociation energy (BDE)[39] of each substrate.
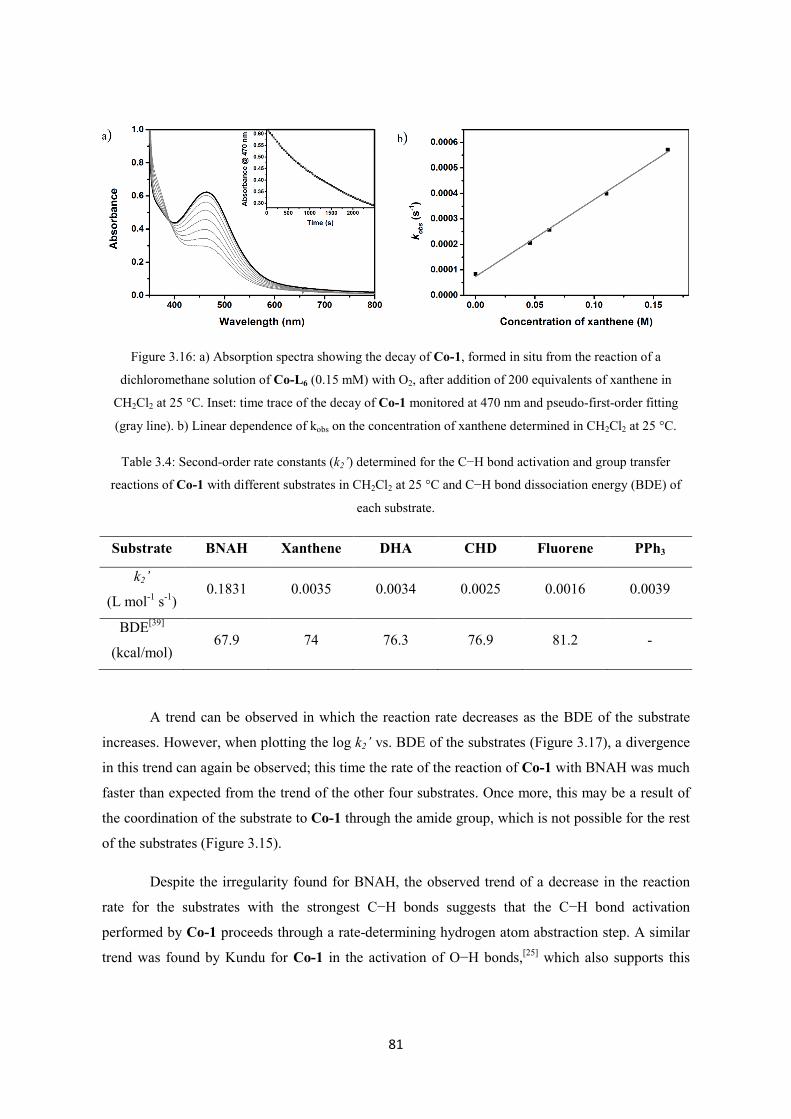
81
Figure 3.16: a) Absorption spectra showing the decay of Co-1, formed in situ from the reaction of a
dichloromethane solution of Co-L6 (0.15 mM) with O2, after addition of 200 equivalents of xanthene in
CH2Cl2 at 25 °C. Inset: time trace of the decay of Co-1 monitored at 470 nm and pseudo-first-order fitting
(gray line). b) Linear dependence of kobs on the concentration of xanthene determined in CH2Cl2 at 25 °C.
Table 3.4: Second-order rate constants (k2’) determined for the C−H bond activation and group transfer
reactions of Co-1 with different substrates in CH2Cl2 at 25 °C and C−H bond dissociation energy (BDE) of
each substrate.
Substrate BNAH Xanthene DHA CHD Fluorene PPh3
k2’
(L mol-1 s-1) 0.1831 0.0035 0.0034 0.0025 0.0016 0.0039
BDE[39]
(kcal/mol) 67.9 74 76.3 76.9 81.2 -
A trend can be observed in which the reaction rate decreases as the BDE of the substrate
increases. However, when plotting the log k2’ vs. BDE of the substrates (Figure 3.17), a divergence
in this trend can again be observed; this time the rate of the reaction of Co-1 with BNAH was much
faster than expected from the trend of the other four substrates. Once more, this may be a result of
the coordination of the substrate to Co-1 through the amide group, which is not possible for the rest
of the substrates (Figure 3.15).
Despite the irregularity found for BNAH, the observed trend of a decrease in the reaction
rate for the substrates with the strongest C−H bonds suggests that the C−H bond activation
performed by Co-1 proceeds through a rate-determining hydrogen atom abstraction step. A similar
trend was found by Kundu for Co-1 in the activation of O−H bonds,[25] which also supports this
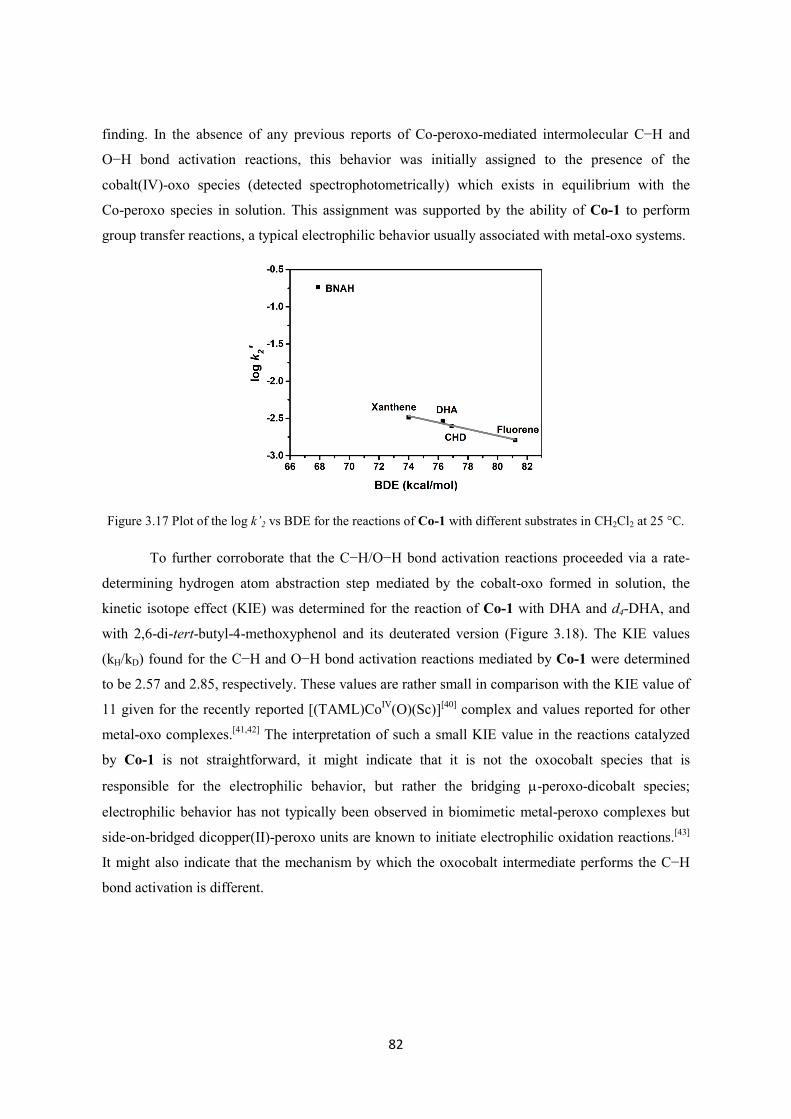
82
finding. In the absence of any previous reports of Co-peroxo-mediated intermolecular C−H and
O−H bond activation reactions, this behavior was initially assigned to the presence of the
cobalt(IV)-oxo species (detected spectrophotometrically) which exists in equilibrium with the
Co-peroxo species in solution. This assignment was supported by the ability of Co-1 to perform
group transfer reactions, a typical electrophilic behavior usually associated with metal-oxo systems.
Figure 3.17 Plot of the log k’2 vs BDE for the reactions of Co-1 with different substrates in CH2Cl2 at 25 °C.
To further corroborate that the C−H/O−H bond activation reactions proceeded via a rate-
determining hydrogen atom abstraction step mediated by the cobalt-oxo formed in solution, the
kinetic isotope effect (KIE) was determined for the reaction of Co-1 with DHA and d4-DHA, and
with 2,6-di-tert-butyl-4-methoxyphenol and its deuterated version (Figure 3.18). The KIE values
(kH/kD) found for the C−H and O−H bond activation reactions mediated by Co-1 were determined
to be 2.57 and 2.85, respectively. These values are rather small in comparison with the KIE value of
11 given for the recently reported [(TAML)CoIV(O)(Sc)][40] complex and values reported for other
metal-oxo complexes.[41,42] The interpretation of such a small KIE value in the reactions catalyzed
by Co-1 is not straightforward, it might indicate that it is not the oxocobalt species that is
responsible for the electrophilic behavior, but rather the bridging µ-peroxo-dicobalt species;
electrophilic behavior has not typically been observed in biomimetic metal-peroxo complexes but
side-on-bridged dicopper(II)-peroxo units are known to initiate electrophilic oxidation reactions.[43]
It might also indicate that the mechanism by which the oxocobalt intermediate performs the C−H
bond activation is different.

83
Figure 3.18: Linear dependence of kobs with the concentration of substrate for the reaction of Co-1 with
a) DHA and d4-DHA and b) 2,6-di-tert-butyl-4-methoxyphenol and 2,6-di-tert-butyl-4-methoxy-d-phenol in
CH2Cl2 at 25 °C.
One indirect method frequently used to prove the presence of a metal-oxo complex in
solution is to carry out the catalytic oxidation reactions in the presence of 18O-labled water (H218O),
since metal-oxo complexes can exchange their O-atom with 18O-labled water prior to the O-atom
transfer to organic substrates.[44-46] In order to determine whether or not an oxocobalt(IV) species
was forming in solution and was responsible for the electrophilic reactivity in this system, Co-1 was
set to react with PPh3 in acetone in the presence of 0.01 mL of H218O. The analysis of the reaction
mixture after the reaction was completed showed no presence of 18O incorporated in the
triphenylphosphine oxide. This indicates that there is probably no oxocobalt(IV) in solution, but
rather the bridging µ-peroxo-dicobalt species is responsible for both the nucleophilic and the
electrophilic reactivity of Co-1. This is an exciting finding since bridging peroxos are not typically
reported to perform electrophilic oxidations.
3.2.4 Dioxygen reduction catalyzed by Co-L6
The catalytic four-electron reduction of oxygen to water, as mentioned at the beginning of
this chapter, has attracted much interest due to its vital role in respiration as well as its technological
relevance in fuel cells.[7-9,47] In nature, this process is carried out by an iron-haem/copper
heterodinuclear center in cytochrome c oxidases[13,14] (Figure 3.2 c). By contrast, in fuel cells the
same reaction is catalyzed at a cathode by platinum impregnated in carbon.[48] The high loads of Pt
required for achieving adequate activity in fuel cells has prompted the development of new catalysts
based on metals that are more earth-abundant and cheaper, such as Co, Fe or Cu.[26,49-57]
Until recently, electrocatalytic reduction of oxygen was the only technique available for
probing the catalytic activity of synthetic catalysts in the oxygen reduction reaction. However, this

84
procedure prevented the detection of the active intermediates and limited the mechanistic studies of
the employed homogeneous catalysts.[53,56] To overcome this limitation, in 2004 Fukuzumi, Guiliard
and coworkers reported an innovative way of testing the homogeneous catalytic reduction of O2 by
using one-electron reductants such as ferrocene derivatives in the presence of an acid.[53] This
technique has provided mechanistic insights into the reaction of oxygen reduction by metal
complexes. In several studies, dinuclear metal-peroxos have been detected as key intermediates for
this transformation. [52-57]
Given the evidence, from both spectroscopic and reactivity studies, of the occurrence of
cobalt-peroxo units in the reaction of Co-L6 with O2, and the possibility that they may perform O−O
bond cleavage to generate Co(IV)-oxo units, the reactivity of Co-L6 in the oxygen reduction
reaction was tested. The evaluation of the catalytic activity of Co-L6 towards oxygen reduction was
carried out using Fukuzumi and Guilard’s method; ferrocene derivatives were employed as one-
electron donors, trifluoroacetic acid (TFA) or perchloric acid (HClO4) were used as proton sources,
and, in their presence, O2 was set to react with a catalytic amount of Co-L6 in acetone. The
occurrence of the oxygen reduction reaction was proved by the formation of ferrocenium ions with
characteristic absorption bands (ferrocenium λmax= 620 nm, ε620nm= 430 M-1cm-1;
dimethylferrocenium λmax= 650 nm, ε650nm= 360 M-1 cm-1; decamethylferrocenium λmax= 780 nm,
ε780nm= 520 M-1cm-1 in acetone).[54,58]
When employing Ferrocene (Fc) as a reductant (1.5 mM) in the presence of TFA (10 mM)
and Co-L6 as a catalyst (0.02 mM) in an acetone solution saturated with O2 (11 mM) at 25 °C, no
oxygen reduction took place, as evidenced by the absence of ferrocenium ions in solution. Table 3.5
lists the oxidation potentials for some ferrocene derivatives. It may be noted that ferrocene is not the
best reductant in the family, and therefore, better reductants such as dimethylferrocene (Me2Fc) and
decamethylferrocene (Me10Fc) were also tested under similar conditions. When Me2Fc was
employed, no oxygen reduction took place either; however, when Me10Fc, the strongest reductant
listed, was used, the formation of decamethylferrocenium ions (Me10Fc+) could be detected and
monitored by a rise in absorbance at 780 nm (Figure 3.19), which indicated that the oxidation of
Me10Fc took place with the concomitant O2 reduction in the presence of Co-L6 as a catalyst. Since
Me10Fc is a good electron donor and is easily oxidized in the presence of acid, this reaction also
occurs in the absence of Co-L6 but at a slower rate (vide infra); however, the non-catalytic
oxidation was always taken into consideration in determining the catalytic capacity of the system.

85
Table 3.5: Oxidation potentials of different ferrocene derivatives referred against the saturated calomel
electrode (SCE).[59]
Ferrocene derivative Fc Me2Fc Me10Fc
Eox vs SCE (V) 0.37 0.26 -0.08
Figure 3.19: Spectral changes of the absorption during the reduction of oxygen by Me10Fc (1.5 mM) catalyzed
by Co-L6 (0.02 mM) in the presence of TFA (10 mM) in O2-saturated acetone at 25 °C. Inset: time trace of
absorption at 780 nm due to the formation of Me10Fc+.
The dioxygen reduction reaction can occur as a two-electron reduction process, in which
case H2O2 is liberated (Equation 1), or as a four-electron reduction process, in which the O−O bond
is broken and H2O is liberated (Equation 2); examples exist of catalysts that can selectively perform
the two-electron[56,58,60,61] or the four-electron reduction.[52-55,57,62]
O2 + 2 Me10Fc + 2 H+ → 2 Me10Fc+ + H2O2 (1)
O2 + 4 Me10Fc + 4 H+ → 4 Me10Fc+ + 2 H2O (2)
In order to get an idea of the process occurring when Co-L6 is employed as a catalyst at
25 °C, O2 was used as the limiting reagent. To 3 mL of a dry and oxygen-free acetone solution
containing Me10Fc (3 mM), TFA (10 mM) and Co-L6 (0.02 mM), 0.05 mL of an oxygen saturated
acetone solution were added (11 mM; final concentration 0.18 mM). The formation of Me10Fc+ ions
was monitored (Figure 3.20, gray circles) until complete conversion of O2 was achieved and the
increase in the 780 nm band was no longer observed. The concentration of Me10Fc+ formed
(0.34 mM), calculated with the reported value of ε780nm = 520 M-1cm-1 in acetone,[54] was found to be

86
around twice that of the O2 concentration (0.18 mM) in the Co-L6 catalyzed reaction of O2 at 25 °C;
this indicated that in these conditions only two-electron oxygen reduction occurred (Equation 1).
Figure 3.20: Time profiles of the formation of Me10Fc+ monitored at 780 nm during the electron-transfer
oxidation reaction of Me10Fc (3 mM) with O2 (0.18 mM) catalyzed by Co-L6 (0.04 mM) in the presence of
TFA (10 mM) in acetone at 25 °C (gray circles) as well as at −50 °C (black squares).
Figure 3.21: Spectral changes in the reaction of NaI (30 mM) and the 1:2 diluted reaction mixture of Co-L6
(0.04 mM), Me10Fc (3 mM), TFA (10 mM) and O2 (0.18 mM) in acetone at 25 °C.
The formation of H2O2 from the two-electron reduction of oxygen was further corroborated
by iodometric titrations. NaI reacts in the presence of H2O2 in acidic media to form the anion I3-
(Equation 3).
3 I- + H2O2 + 2 H+ → I3- + 2 H2O (3)

87
I3- displays strong absorbance at λmax= 360 nm (ε360nm = 28000 M-1cm-1)[61] and can be easily
detected. A 1:2 dilution of the solution with the reduced product of the O2 (0.18 mM) reduction
catalyzed by Co-L6 was treated with sodium iodide (NaI). After a few seconds the band at 360 nm
reached its maximum (Figure 3.21), indicating the presence of H2O2 in the reaction mixture. A 64 %
yield of H2O2 (0.057 mM) was determined relative to the concentration of H2O2 (0.09 mM)
expected if all the O2 had been transformed to H2O2 in a two-electron process. The yield obtained is
not quantitative, but lower yields have been observed before when iodometric titration is performed
at 25 °C due to competition with the direct reduction of H2O2 with Me10Fc at this temperature.[56]
However, these results do confirm that the process catalyzed by Co-L6 at 25 °C is the two-electron
reduction of dioxygen to hydrogen peroxide.
Figure 3.22: Time profiles of the formation of Me10Fc+ monitored at 780 nm during the oxidation reaction of
a) Me10Fc (3 mM) with O2 (saturated acetone solution, 11 mM) in the presence of TFA (10 mM) in acetone at
25 °C catalyzed by Co-L6 (0.05 mM) (black squares) and without a catalyst (gray circles). b) Me10Fc
(3.75 mM) with O2 (saturated acetone solution, 11 mM) in the presence of TFA (40 mM) in acetone at −50 °C
catalyzed by Co-L6 (0.01 mM) (black squares) and without a catalyst (gray circles).
A turnover number (TON) of 16 during a lapse of 2000 seconds was determined for the
catalyst Co-L6 in the reduction of O2 to H2O2 in acetone at 25 °C. The TON was calculated from the
moles of H2O2 that were the product of O2 reduction (calculated from the moles of Me10Fc+ formed)
divided by the initial moles of the catalyst Co-L6 from a reaction mixture containing Co-L6, Me10Fc
and TFA with concentrations of 0.05 mM, 3 mM and 10 mM respectively in 3 mL of O2-saturated
acetone (Figure 3.22 a, black squares). The control reaction performed in the absence of Co-L6 was
also monitored (Figure 3.22 a, gray circles) and the amount of Me10Fc+ formed in this process was
subtracted from that obtained in the catalytic reaction. Since the TONs are not frequently reported
for related systems, making an assessment of the efficiency of the catalyst based on the obtained

88
number is not straightforward; for the two-electron reduction of O2 to H2O2, the TONs of two
different systems have been reported: TON = 7 for a mononuclear copper catalyst with Me10Fc as a
reductant[55] and TON = 83,000 for cobalt chlorin derivatives as catalysts using Me2Fc as a
reductant.[61] With regard to these systems, it can only be stated that Co-L6 is a fair O2-reduction
catalyst at 25 °C.
Kinetic studies were performed in order to obtain more information about the mechanism
by which Co-L6 reduces O2 to H2O2 in acetone at 25 °C. The spectral changes observed at 25 °C
due to the formation of Me10Fc+ during the course of the O2 reduction reaction are shown in Figure
3.23 a; the initial rate of formation of Me10Fc+ obeys pseudo-first-order kinetics when
[Co-L6] << [Me10Fc] < [TFA] (Figure 3.23 a). The pseudo-first-order rate constant (kobs) increased
linearly with an increasing concentration of Co-L6 (Figure 3.23 c). As previously discussed, it
should be noted that under the experimental conditions employed, the oxidation of Me10Fc takes
place in the presence of TFA even in the absence of a catalyst; hence, the linear plot of kobs vs [Co-
L6] does not cross the “y” axis at 0 but the intercept has a positive value. The kobs values were also
found to be proportional to the concentration of Me10Fc (Figure 3.23 b and d), TFA (Figure 3.23 f)
and O2 (Figure 3.23 e).
The observed dependency of the reaction rate on the concentration of Co-L6, Me10Fc, O2
and TFA is quite unique. Typically, Co and Cu catalysts for O2 reduction show a rate that is
independent of O2 or H+.[52,56,58] The rate’s dependency on the four species has only been observed
before for a dinuclear copper catalyst that performs the four-electron O2 reduction reaction to
H2O.[62] Such dependency reveals that the rate-determining step in the catalytic cycle should involve
the reactions of Co-L6 with Me10Fc, O2 and TFA. This indicates that the Co-L6-catalyzed two-
electron reduction to H2O2 at 25 °C proceeds in a rather complicated fashion and more detailed
mechanistic studies are necessary. Unfortunately, since Co-1 absorbs at the same wavelength as
Me10Fc, UV-vis mechanistic studies in this system proved unsuccessful.
It is known that factors such as temperature and acid source can alter the O2 reaction
pathways and mechanisms, so different conditions were tested for the catalytic reaction of Co-L6
with O2.When 3 mL of a dry, oxygen-free acetone solution of Me10Fc (3 mM), TFA (10 mM) and
Co-L6 as a catalyst (0.04 mM) were cooled down to −50 °C, and 0.05 mL of oxygen-saturated
acetone (11 mM) were added (O2 final concentration 0.18 mM), a different behavior was observed
(Figure 3.20, black squares). This time, the amount of Me10Fc+ generated during the O2 catalytic
reduction was 0.67 mM, which represents 3.74 equivalents relative to the initial concentration of O2
(0.18 mM). This clearly indicated that at −50 °C a four-electron reduction took place (Equation 2)

89
Figure 3.24: Studies on the two electron reduction of O2 in acetone at 25 °C catalyzed by Co-L6. a) Spectral
changes due to the reduction of O2 (11 mM) by Me10Fc (3 mM) catalyzed by Co-L6 (0.1 mM) in the presence
of TFA (10 mM) Inset: absorption at 780 nm due to the formation of Me10Fc+. b) Time profiles of the
absorbance at 780 nm for different initial concentrations of Me10Fc. c) kobs vs Co-L6 concentration for the
reduction of O2 (11 mM) with Me10Fc (3 mM) catalyzed by Co-L6 (0.05-0.2 mM) with TFA (10 mM). d) kobs
vs Me10Fc concentration for the reduction of O2 (11 mM) with Me10Fc (1.5-7.5 mM) catalyzed by Co-L6 (0.1
mM) with TFA (10 mM). e) Plot of kobs vs O2 concentration for the reduction of O2 (1.8-4.2 mM) with Me10Fc
(3 mM) catalyzed by Co-L6 (0.1 mM) with TFA (10 mM). f) Plot of kobs vs TFA concentration for the
reduction of O2 (11 mM) with Me10Fc (3 mM) catalyzed by Co-L6 (0.1 mM) with TFA (2-20 mM).

90
instead of the two-electron reduction that was observed at a higher temperature (Equation 1). The
absence of H2O2 in solution was further corroborated with iodometric titrations.
Even though the two-electron reduction of O2 to H2O2 has been targeted as a possible
efficient process for obtaining hydrogen peroxide[58,61] and utilizing it as a sustainable and clean
energy carrier[63–65] and an environmentally benign oxidant,[66,67] the possibility that Co-L6 may
perform full O−O bond cleavage in contrast to Fe-L6, which performs the opposite process, O−O
bond formation, led us to further investigate the four-electron process of O2 reduction catalyzed by
Co-L6 at −50 °C to get a better understanding of the factors that control this process.
A turnover number (TON) of 65 during a lapse of 2000 seconds was determined for the
catalyst Co-L6 in the reduction of O2 to H2O in acetone at −50 °C. The TON was calculated from
the moles of H2O that were the product of the O2 reduction (calculated from the moles of Me10Fc+
formed) divided by the initial moles of the catalyst Co-L6 from a reaction mixture containing
Co-L6, Me10Fc and TFA with concentrations of 0.01 mM, 3.75 mM and 40 mM respectively, in 3
mL of O2-saturated acetone (Figure 3.22 black squares). The control reaction performed in the
absence of Co-L6 was also monitored (Figure 3.22 gray circles) and the amount of Me10Fc+ formed
in this process was subtracted from that obtained in the catalyzed reaction. The TON (65) obtained
for Co-L6 for the four-electron O2 reduction reaction is at least 4 times higher than the TON (16)
obtained for the two-electron reduction of O2 catalyzed by Co-L6 at 25 °C in otherwise similar
conditions. This indicated that Co-L6 is a much better catalyst for the four-electron reduction of O2
to H2O than it is for the two-electron process.
Figure 3.24: Time profile of the formation of Me10Fc+ monitored at 780 nm during the oxidation reaction of
Me10Fc (3.75 mM) with O2 (saturated acetone solution, 11 mM) catalyzed by Co-L6 (0.01 mM) in acetone at
−50 °C in the presence of TFA (40 mM) (black squares) or HClO4 (40 mM) (gray circles).

91
Besides the observed temperature effect, another factor that has been reported to affect the
reduction of dioxygen is the acid employed as the proton source. In some studies it has been shown
that a change in the acidity of the proton source employed, or in the nature of the acid, modulates
the catalysis mechanism, even changing the process from a two-electron reduction to a four-electron
one.[60,62] Other studies have found that the coordination capability of the acid counter-ion affects
the rate of the oxygen reduction reaction.[68] For the reaction catalyzed by Co-L6 at −50 °C the acid
employed was found to be unimportant; when using HClO4 instead of TFA, the O2 conversion rate
after 3000 seconds remained unchanged (Figure 3.24).
Kinetic studies were also performed to obtain information about the mechanism by which
Co-L6 reduces O2 to H2O in acetone at −50 °C. The spectral changes observed at −50 °C due to the
formation of Me10Fc+ during the course of the O2 reduction reaction are shown in Figure 3.25 a; the
initial rate of formation of Me10Fc+ obeys pseudo-first-order kinetics when [Co-L6] << [Me10Fc] <
[TFA] (Figure 3.25 a). The pseudo-first-order rate constant (kobs) increased linearly with an
increasing concentration of Co-L6 (Figure 3.25 c). Again, it should be noted that under the
experimental conditions employed, the oxidation of Me10Fc takes place in the presence of TFA even
in the absence of a catalyst; hence, the linear plot of kobs vs [Co-L6] does not cross the “y” axis at
(x,y = 0,0) but the intercept has a positive value. The kobs values were also found to be proportional
to the concentration of Me10Fc (Figure 3.25 b and d) and TFA (Figure 3.25 f); however, they were
not affected by the concentration of O2 (Figure 3.25 e). The reaction rate’s dependency on the
concentration of Co-L6, Me10Fc and TFA indicates that the rate determining step on the catalytic
cycle should involve a reaction with the three of them participating.
It is likely that the catalytic cycle of the four-electron O2 reduction by Co-L6 will start with
the reaction of O2 with the cobalt centers and the formation of the bridging-µ-peroxo-dicobalt(III)
intermediate. This step should be a fast one since O2 is not involved in the rate-determining step of
the cycle. Unfortunately, since Me10Fc and Co-1 absorb at very close wavelengths, it was not
possible to monitor the formation of the intermediate in the reaction mixture during the course of
the reaction. To investigate what occurs with Co-1 in the next step of the cycle, its reactivity was
tested towards TFA and Me10Fc.
Co-1 was generated in situ in acetone at −50 °C and, after removal of the excess of O2, one
equivalent of Me10Fc per di-cobalt center was added to the reaction mixture. No reduction occurred
as the band at 470 nm due to Co-1 did not decrease, nor did the band at 780 nm rise due to Me10Fc+
formation. Similarly, upon addition of one equivalent of TFA per di-cobalt center to Co-1 in the

92
Figure 3.25: Studies on the four electron reduction of O2 in acetone at −50 °C catalyzed by Co-L6. a) Spectral
changes due to the reduction of O2 (11 mM) by Me10Fc (3 mM) catalyzed by Co-L6 (0.02 mM) in the
presence of TFA (10 mM) Inset: absorption at 780 nm due to the formation of Me10Fc+. b) Time profiles of
the absorbance at 780 nm for different initial concentrations of Me10Fc. c) kobs vs Co-L6 concentration for the
reduction of O2 (11 mM) with Me10Fc (3 mM) catalyzed by Co-L6 (0.01-0.03 mM) with TFA (10 mM). d)
kobs vs Me10Fc concentration for the reduction of O2 (11 mM) with Me10Fc (1.5-4 mM) catalyzed by Co-L6
(0.02 mM) with TFA (10 mM). e) Plot of kobs vs O2 concentration for the reduction of O2 (1.75-4.25 mM)
with Me10Fc (3 mM) catalyzed by Co-L6 (0.02 mM) with TFA (10 mM). f) Plot of kobs vs TFA concentration
for the reduction of O2 (11 mM) with Me10Fc (3 mM) catalyzed by Co-L6 (0.02 mM) with TFA (5-40 mM).

93
absence of O2, the band at 470 nm did not decrease in intensity. However, when both Me10Fc and
TFA (1 equivalent each per di-cobalt center) were added to the degassed acetone solution of Co-1,
the band at 470 nm deceased with an increase in the band at 780 nm due to the formation of
Me10Fc+. This proves that both species, the electron source and the proton source, are necessary in
this step of the reaction and therefore a proton-coupled electron transfer (PCET) is likely.
Unfortunately, no further intermediates could be detected during the catalytic O2 reduction,
which makes the assignment of a mechanism difficult. However, with the information obtained, we
can propose that the O2-reduction catalytic cycle starts when oxygen binds to Co-L6 and the
bridging-µ-peroxo-dicobalt(III) is formed. Subsequently, a proton-coupled electron transfer takes
place, in what is probably the rate-determining step of the cycle. By making an analogy with the
mechanism proposed for a similar system[52] this PCET should be followed by a subsequent one to
generate the Co(III)-aqua complexes that are further reduced to cobalt(II) and liberate the H2O
molecules upon coordination of a new molecule of O2 (Scheme 3.4). However, the precise
assignation of a catalytic cycle is not possible with the information obtained from this system.
Co Co
O2
O O
III III
Co CoII II
Co Co
OH O
III III
Co Co
OH2 OH2
III IIICo Co
OH2 OH2
II III
Co Co
OH2 OH2
II II
Me10Fc +
H+
Me10Fc+
PCETRate-determining
step
Me10Fc +
3H+
Me10Fc+
Me10FcMe
10Fc+
Me10Fc
Me10Fc+
O2
2 H2O
Co-L6
Co-1
Scheme 3.4 Proposed catalytic cycle for the four-electron reduction of O2 to H2O by Co-L6 in
dichloromethane at −50 °C by analogy with a previously reported mechanism.[52]

94
3.3 Conclusions
The reactivity of the hexanuclear cobalt complex Co-L6 and that of the bridging-µ-peroxo-
dicobalt(III) intermediate in Co-1 were tested. The bridging-µ-peroxo-dicobalt(III) species showed
a typical nucleophilic character; however, it also proved to be capable of initiating electrophilic
transformations. The electrophilic character of Co-1 had previously been assigned to a potential
oxocobalt(IV) complex; however, due to the small KIE values and the lack of 18O-incoroporation to
the oxidized products in the presence of H218O found in this work the electrophilic nature of Co-1
could finally be assigned to the bridging-µ-peroxo-dicobalt(III) species.
Co-L6 was found to be capable of catalytically reducing O2 to H2O2 at 25 °C with a TON of
16 after 2000 s. Interestingly, at −50 °C, Co-L6 proved to be capable of catalyzing the four-electron
reduction of O2 to H2O with a larger TON of 65 (also after 2000 s). The four-electron reduction of
dioxygen to water proved to proceed through a rate-determining PCET step, but the complete
mechanism could not be clarified. The reactivity of Co-L6 researched here is in sharp contrast with
that observed for the analogous complex Fe-L6, which proved to be capable of performing the
opposite reaction, O−O bond formation, thus showing that changes in the metal centers in the same
ligand structures can lead to reversed reactivity behaviors.
3.4 References
[1] F. Meyer, W. B. Tolman, Inorg. Chem. 2015, 54, 5039–5039.
[2] W. B. Tolman, Ed. , Activation of Small Molecules, Wiley-VCH Verlag GmbH & Co. KGaA, Weinheim, Germany, 2006.
[3] K. M. Lancaster, M. Roemelt, P. Ettenhuber, Y. Hu, M. W. Ribbe, F. Neese, U. Bergmann, S. DeBeer, Science, 2011, 334, 974–977.
[4] A. Pomowski, W. G. Zumft, P. M. H. Kroneck, O. Einsle, Nature 2011, 477, 234–237.
[5] J. C. Fontecilla-Camps, A. Volbeda, C. Cavazza, Y. Nicolet, Chem. Rev. 2007, 107, 4273–4303.
[6] D. Schilter, J. M. Camara, M. T. Huynh, S. Hammes-Schiffer, T. B. Rauchfuss, Chem. Rev. 2016, DOI: acs.chemrev.6b00180.
[7] L. Carrette, A. Friedrich, U. Stimming, Fuel Cells 2001, 1, 5–39.
[8] A. Boudghene Stambouli, E. Traversa, Renew. Sustain. Energy Rev. 2002, 6, 297–306.
[9] N. S. Lewis, D. G. Nocera, Proc. Natl. Acad. Sci. 2007, 104, 15729–15735.
[10] Y. Umena, K. Kawakami, J.-R. Shen, N. Kamiya, Nature 2011, 473, 55–60.

95
[11] N. Cox, M. Retegan, F. Neese, D. a. Pantazis, A. Boussac, W. Lubitz, Science, 2014, 345, 804–808.
[12] E. I. Solomon, P. Chen, M. Metz, S.-K. Lee, A. E. Palmer, Angew. Chem. Int. Ed. 2001, 40, 4570–4590.
[13] T. Tsukihara, H. Aoyama, E. Yamashita, T. Tomizaki, H. Yamaguchi, K. Shinzawa-Itoh, R. Nakashima, R. Yaono, S. Yoshikawa, Science 1995, 269, 1069–1074.
[14] C. F. Blanford, R. S. Heath, F. a Armstrong, Chem. Commun.. 2007, 1710–1712.
[15] J. Klingele, S. Dechert, F. Meyer, Coord. Chem. Rev. 2009, 253, 2698–2741.
[16] A. L. Gavrilova, B. Bosnich, Chem. Rev. 2004, 104, 349–383.
[17] A. McAuley, S. Subramanian, Coord. Chem. Rev. 2000, 200–202, 75–103.
[18] V. Balzani, A. Juris, M. Venturi, S. Campagna, S. Serroni, Chem. Rev. 1996, 96, 759–834.
[19] J. W. J. Knapen, A. W. van der Made, J. C. de Wilde, A. W. van Leeuwen, P. Wijkens, D. M. Grove, G. van Koten, Nature 1994, 372, 659–663.
[20] H. P. Dijkstra, P. Steenwinkel, D. M. Grove, M. Lutz, A. L. Spek, G. Van Koten, Angew. Chem. Int. Ed. 1999, 38, 2185–2188.
[21] V. Chandrasekhar, S. Nagendran, R. Azhakar, M. R. Kumar, A. Srinivasan, K. Ray, T. K. Chandrashekar, C. Madhavaiah, S. Verma, U. D. Priyakumar, G. N. Sastri, J. Am. Chem. Soc. 2005, 127, 2410–2411.
[22] S. Kundu, E. Matito, S. Walleck, F. F. Pfaff, F. Heims, B. Rábay, J. M. Luis, A. Company, B. Braun, T. Glaser, K. Ray., Chem.- Eur. J. 2012, 18, 2787–91.
[23] W. C. Ellis, N. D. McDaniel, S. Bernhard, T. J. Collins, J. Am. Chem. Soc. 2010, 132, 10990–10991.
[24] J. L. Fillol, Z. Codolà, I. Garcia-Bosch, L. Gómez, J. J. Pla, M. Costas, Nat. Chem. 2011, 3, 807–13.
[25] S. Kundu, PhD Thesis: Synthesis, Spectroscopic Characterization and Reactivity of the High-Valent Metal-Oxo/Imido Cores of the Late Transition Metals, Humboldt-Universität Zu Berlin, Berlin, 2013.
[26] E. Askarizadeh, S. B. Yaghoob, D. M. Boghaei, A. M. Z. Slawin, J. B. Love, Chem. Commun. 2010, 46, 710–712.
[27] G. Givaja, M. Volpe, M. A. Edwards, A. J. Blake, C. Wilson, M. Schröder, J. B. Love, Angew. Chem. Int. Ed. 2007, 46, 584–586.
[28] T. Tanase, T. Onaka, M. Nakagoshi, I. Kinoshita, K. Shibata, M. Doe, J. Fujii, S. Yano, Chem. Commun. 1997, 2115–2116.
[29] J. Cho, R. Sarangi, H. Y. Kang, J. Y. Lee, M. Kubo, T. Ogura, E. I. Solomon, W. Nam, J. Am. Chem. Soc. 2010, 132, 16977–16986.
[30] J. Cho, R. Sarangi, W. Nam, Acc. Chem. Res. 2012, 45, 1321–1330.

96
[31] X. Hu, I. Castro-Rodriguez, K. Meyer, J. Am. Chem. Soc. 2004, 126, 13464–13473.
[32] R. Boča, Coord. Chem. Rev. 2004, 248, 757–815.
[33] C. Benelli, D. Gatteschi, Inorg. Chem. 1982, 21, 1788–1790.
[34] K. Fukui, H. Ohya-Nishiguchi, N. Hirota, K. Aoyagi, H. Ogoshi, Chem. Phys. Lett. 1987, 140, 15–19.
[35] B. Meunier, Ed. , Structure and Bonding 97: Metal-Oxo and Metal-Peroxo Species, Springer, Berlin, Germany, 2000.
[36] M. Costas, M. P. Mehn, M. P. Jensen, L. Que Jr., Chem. Rev. 2004, 104, 939–986.
[37] S. P. de Visser, J. U. Rohde, Y. M. Lee, J. Cho, W. Nam, Coord. Chem. Rev. 2013, 257, 381–393.
[38] Y. Jo, J. Annaraj, M. S. Seo, Y. M. Lee, S. Y. Kim, J. Cho, W. Nam, J. Inorg. Biochem. 2008, 102, 2155–2159.
[39] Y.-R. Luo, Comprehensive Handbook of Chemical Bond Energies, CRC Press, Boca Raton, Florida, 2007.
[40] S. Hong, F. F. Pfaff, E. Kwon, Y. Wang, M. S. Seo, E. Bill, K. Ray, W. Nam, Angew. Chem. Int. Ed. 2014, 53, 10403–10407.
[41] K. Gunay, A.; Theopold, Chem. Rev. 2010, 1060–1081.
[42] X. Engelmann, I. Monte-Pérez, K. Ray, Angew. Chem. Int. Ed. 2016, 55, 7632–7649.
[43] K. Ray, F. Felix, B. Wang, W. Nam, J. Am. Chem. Soc. 2014, 136, 13942–13958.
[44] W. Nam, Y.-M. Lee, S. Fukuzumi, Acc. Chem. Res. 2014, 47, 1146–1154.
[45] M. S. Seo, J.-H. In, S. O. Kim, N. Y. Oh, J. Hong, J. Kim, L. Que, W. Nam, Angew. Chem. Int. Ed. 2004, 43, 2417–2420.
[46] I. Prat, A. Company, V. Postils, X. Ribas, L. Que, J. M. Luis, M. Costas, Chemistry 2013, 6724–6738.
[47] K. Ray, F. Heims, M. Schwalbe, W. Nam, Curr. Opin. Chem. Biol. 2015, 25, 159–171.
[48] B. C. H. Steele, A. Heinzel, Nature 2001, 414, 345–352.
[49] D. K. Dogutan, S. A. Stoian, R. McGuire, M. Schwalbe, T. S. Teets, D. G. Nocera, J. Am. Chem. Soc. 2011, 133, 131–140.
[50] J. Rosenthal, D. G. Nocera, Acc. Chem. Res. 2007, 40, 543–553.
[51] F. C. Anson, C. N. Shi, B. Steiger, Acc. Chem. Res. 1997, 30, 437–444.
[52] S. Fukuzumi, S. Mandal, K. Mase, K. Ohkubo, H. Park, J. Benet-buchholz, W. Nam, A. Llobet, J. Am. Chem. Soc. 2012, 134, 9906–9909.
[53] S. Fukuzumi, K. Okamoto, C. P. Gros, R. Guilard, J. Am. Chem. Soc. 2004, 126, 10441–10449.

97
[54] Z. Halime, H. Kotani, Y. Li, S. Fukuzumi, K. D. Karlin, Proc. Natl. Acad. Sci. 2011, 108, 1399–13994.
[55] S. Fukuzumi, H. Kotani, H. R. Lucas, K. Doi, T. Suenobu, R. L. Peterson, K. D. Karlin, J. Am. Chem. Soc. 2010, 132, 6874–6875.
[56] S. Fukuzumi, L. Tahsini, Y. Lee, K. Ohkubo, W. Nam, J. Am. Chem. Soc. 2012, 134, 7025–7035.
[57] L. Tahsini, H. Kotani, Y.-M. Lee, J. Cho, W. Nam, K. D. Karlin, S. Fukuzumi, Chemistry 2012, 18, 1084–93.
[58] D. Das, Y.-M. Lee, K. Ohkubo, W. Nam, K. D. Karlin, S. Fukuzumi, J. Am. Chem. Soc. 2013, 135, 2825–2834.
[59] S. Fukuzumi, H. Kotani, K. A. Prokop, D. P. Goldberg, J. Am. Chem. Soc. 2011, 133, 1859–1869.
[60] S. Kakuda, C. J. Rolle, K. Ohkubo, M. A. Siegler, K. D. Karlin, S. Fukuzumi, J. Am. Chem. Soc. 2015, 137, 3330–3337.
[61] K. Mase, K. Ohkubo, S. Fukuzumi, Inorg. Chem. 2015, 54, 1808–1815.
[62] D. Das, Y.-M. Lee, K. Ohkubo, W. Nam, K. D. Karlin, S. Fukuzumi, J. Am. Chem. Soc. 2013, 135, 4018–4026.
[63] R. S. Disselkamp, Energy & Fuels 2008, 22, 2771–2774.
[64] R. S. Disselkamp, Int. J. Hydrogen Energy 2010, 35, 1049–1053.
[65] S. Fukuzumi, Y. Yamada, K. D. Karlin, Electrochim. Acta 2012, 82, 493–511.
[66] S. Abrantes, E. Amaral, A. P. Costa, A. A. Shatalov, A. P. Duarte, Ind. Crops Prod. 2007, 25, 288–293.
[67] S. H. Zeronian, M. K. Inglesby, Cellulose 1995, 2, 265–272.
[68] S. Kakuda, R. L. Peterson, K. Ohkubo, K. D. Karlin, S. Fukuzumi, J. Am. Chem. Soc. 2013, 135, 6513–6522.

98

Chapter 4:
Systematic Studies involving the Trapping and Characterization of Elusive Copper-Nitrenes
Using Different Nitrene-Sources and Lewis Acids
Part of this work has been published in:
I. Monte-Pérez, S. Kundu, K. Ray*, Zeitschrift für Anorg. und Allg. Chemie 2015, 641, 78–82
S.-L. Abram,‡ I. Monte-Pérez,‡ F. F. Pfaff, E. R. Farquhar, K. Ray*, Chem. Commun. 2014, 50,
9852–4
‡ Equal contribution of the two authors

100
Compounds discussed in Chapter 4
Nitrene Source Copper-nitrene as Lewis-acid adduct
Copper-nitrene as free species
IN
S
O
O
S
O
O
NCu
N
N
H
N
M
2+
Ts
sPhINTs Cu-1-M
IN
S
O
O CF3
S
O
O
NCu
N
N
H
N
M
2+
R R = -SO2-PhCF3
NCu
N
N
H
N
2+
R R = -SO2-PhCF3
sPhINArCF3 Cu-2-M Cu-2
IN
S
O
O NO2
S
O
O
NCu
N
N
H
N
M
2+
R R = -SO2-PhNO2
NCu
N
N
H
N
2+
R R = -SO2-PhNO2
sPhINArNO2 Cu-3-M Cu-3
N3
NCu
N
N
H
N
M
2+
Mes
Mes-N3 Cu-4-M

101
4.1. Introduction
Carbon-nitrogen bonds are ubiquitous in biologically active molecules, natural products,
pharmaceuticals and agrochemicals.[1,2] Consequently, the formation of C−N bonds is a crucial
chemical target and the reactions of alkane amination and aziridination are key synthetic processes.
The use of transition metals has proved to be a convenient and atom-efficient way of catalyzing the
activation of C−H bonds in hydrocarbons to produce the more valuable C−N bond containing
analogs.[3-5] In particular, the use of catalysts based on inexpensive and biologically innocuous
transition metals such as copper has experienced an explosive growth since the late 1960s, when
Kwart and Khan reported the first copper-catalyzed C−H bond amination and aziridination
reactions.[6,7]
A general scheme of the nitrene-based C−H bond amination and aziridination reactions
catalyzed by copper is presented in Scheme 4.1; in these reactions, a nitrene source in the form of
an organic azide, an iminoiodinane or chloramine-T is required and copper is employed as a catalyst
in a wide variety of forms: metallic copper, simple copper salts or copper complexes,[7] the
copper(I) complexes being the most effective catalysts for these processes.
Scheme 4.1: General copper-catalyzed amination and aziridination reactions.
Since the very first report of copper-catalyzed nitrene-based C−H bond functionalization, it
has been suggested that the active species in these reactions is a terminal copper-nitrene species.
The first experiment performed to reveal the intermediacy of such species was done by Jacobsen et
al. in 1995. They used a chiral diamine ligand (L1) together with CuPF6 and a nitrene source to
aziridinate styrene and obtained an identical enantiomeric excess (ee) despite the nitrene source
employed (Scheme 4.2 a), which showed the presence of an identical terminal copper-nitrene
intermediate in both reactions; however, this species could not be isolated.[8] The next indirect
Amination Aziridination
R1 H
R2 R3 Nitrene source
Copper catalyst R1 NHR
R2 R3
R1
R2 Nitrene source
Copper catalyst R1
R2
R3R3
N
R
Nitrene sources:
Organic azide
R N3
SN
ClO O
Na
Chloramine-TIminoiodinane
(PhINTs)
SN
O OI
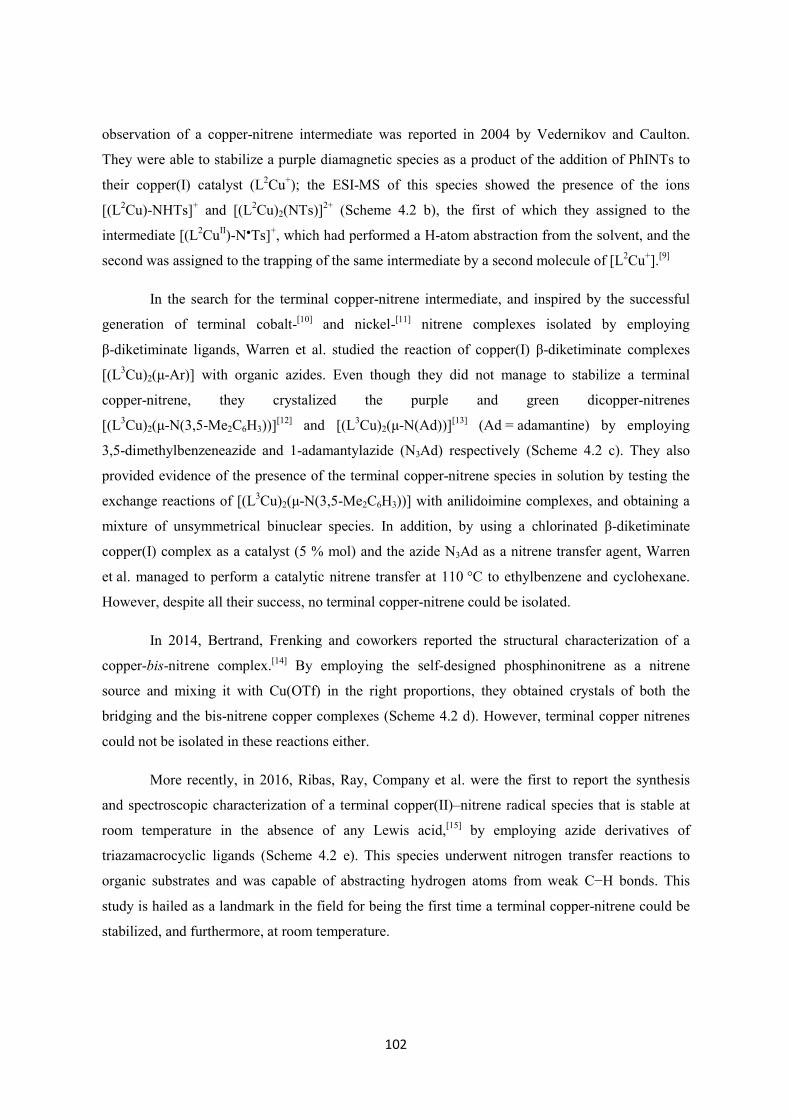
102
observation of a copper-nitrene intermediate was reported in 2004 by Vedernikov and Caulton.
They were able to stabilize a purple diamagnetic species as a product of the addition of PhINTs to
their copper(I) catalyst (L2Cu+); the ESI-MS of this species showed the presence of the ions
[(L2Cu)-NHTs]+ and [(L2Cu)2(NTs)]2+ (Scheme 4.2 b), the first of which they assigned to the
intermediate [(L2CuII)-N●Ts]+, which had performed a H-atom abstraction from the solvent, and the
second was assigned to the trapping of the same intermediate by a second molecule of [L2Cu+].[9]
In the search for the terminal copper-nitrene intermediate, and inspired by the successful
generation of terminal cobalt-[10] and nickel-[11] nitrene complexes isolated by employing
β-diketiminate ligands, Warren et al. studied the reaction of copper(I) β-diketiminate complexes
[(L3Cu)2(μ-Ar)] with organic azides. Even though they did not manage to stabilize a terminal
copper-nitrene, they crystalized the purple and green dicopper-nitrenes
[(L3Cu)2(μ-N(3,5-Me2C6H3))][12] and [(L3Cu)2(μ-N(Ad))][13] (Ad = adamantine) by employing
3,5-dimethylbenzeneazide and 1-adamantylazide (N3Ad) respectively (Scheme 4.2 c). They also
provided evidence of the presence of the terminal copper-nitrene species in solution by testing the
exchange reactions of [(L3Cu)2(μ-N(3,5-Me2C6H3))] with anilidoimine complexes, and obtaining a
mixture of unsymmetrical binuclear species. In addition, by using a chlorinated β-diketiminate
copper(I) complex as a catalyst (5 % mol) and the azide N3Ad as a nitrene transfer agent, Warren
et al. managed to perform a catalytic nitrene transfer at 110 °C to ethylbenzene and cyclohexane.
However, despite all their success, no terminal copper-nitrene could be isolated.
In 2014, Bertrand, Frenking and coworkers reported the structural characterization of a
copper-bis-nitrene complex.[14] By employing the self-designed phosphinonitrene as a nitrene
source and mixing it with Cu(OTf) in the right proportions, they obtained crystals of both the
bridging and the bis-nitrene copper complexes (Scheme 4.2 d). However, terminal copper nitrenes
could not be isolated in these reactions either.
More recently, in 2016, Ribas, Ray, Company et al. were the first to report the synthesis
and spectroscopic characterization of a terminal copper(II)–nitrene radical species that is stable at
room temperature in the absence of any Lewis acid,[15] by employing azide derivatives of
triazamacrocyclic ligands (Scheme 4.2 e). This species underwent nitrogen transfer reactions to
organic substrates and was capable of abstracting hydrogen atoms from weak C−H bonds. This
study is hailed as a landmark in the field for being the first time a terminal copper-nitrene could be
stabilized, and furthermore, at room temperature.

103
Ph NNCl
Cl Cl
Cl
TsN3 +
hn
PhINTs
CuPF6 / L1
CuPF6 / L1
Ph
N
Ts
41 %
ee
L1 =a)
b)
N
N NCu+ + PhINTs
[BArF4]
[L2Cu]
[[L2Cu]2(NTs)]2+
ESI-MS
[L2Cu-NHTs]+
+
c)
[L3Cu]2(m-toluene) N
CuN
Cu
N
N
RRN
R R
Ar
R = mesityl
N
CuN
R
R
[L3Cu]=
R= mesityl
N3-Ar
Purple species: Ar =
3,5-Me2C6H3
Green species: Ar = Adamantane
NP
N
NDipp
Dipp Dipp
Dipp
N-R
Cu(OTf)
RN
Cu+
N
R
orN
R
Cu Cu
d)OTfTfO
[L2CuII(N Ts)]
+
[L2Cu]
H
-(OTf)
N
N
NN3 N
N
NN
e)
[Cu(CH3CN)4](OTf)
CH3CN, 25°CCu
+
Scheme 4.2: Advances towards the comprehension of terminal copper-nitrene intermediates.
The full characterization and reactivity testing of terminal copper-nitrene species is
essential for improving the design of further catalysts and processes as well as for obtaining a better
understanding of the reaction mechanisms associated with the copper-catalyzed amination and
aziridination reactions. Previously, in the absence of isolated examples of the proposed active
species, quantum chemical calculations have been performed to elucidate the mechanisms of the
copper-nitrene-mediated aziridination and amination reactions.[16–21]

104
Two alternative valence-bond structures for the terminal copper-nitrene have been
characterized in these high-level calculations, namely a copper(III)-imido [CuIII(NR)]+ and a
copper(II)-imidyl radical [CuII(NR●)]+, alongside their three possible spin states: closed-shell singlet
[CuIII(NR)]+ (S = 0), open-shell singlet [CuII(NR●)]+ (S = 0) and open-shell triplet [CuII(NR●)]+
(S = 1) (Figure 4.1). Several theoretical studies on the mechanisms of aziridination and amination
reactions concerning these three possible electronic states suggest that concerted aziridination
reactions are favored on the closed-shell singlet surface,[16,18] while amination reactions proceed via
a stepwise H-atom abstraction/radical rebound pathway, preferably on the open-shell triplet state.[20]
In other studies, a mechanism involving both singlet and triplet states lying close in energy has been
proposed for both amination[20] and aziridination[21] reactions. However, these theoretically
predicted reactivity patterns lack the necessary experimental information such as the proper
isolation and characterization of the active species, which would allow full electronic
characterization and reactivity testing.
Cu3+ NR
Cu2+ NR
[CuIII(NR)]closed-shell
singlet[CuII(NR
)]
open-shell singlet
Cu2+ NR
[CuII(NR )]
open-shell triplet
Figure 4.1: Three possible electronic configurations of copper-nitrenes.
In 2012, our group reported the trapping and characterization of the scandium adduct of a
terminal copper-tosylnitrene species [(AN)CuII(NTs●)Sc(OTf)3]+ (Cu-1-Sc) (Ts = tosyl) formed by
the addition of the soluble substituted iminoiodinane sPhINTs (2-(tert-butylsulfonyl)(p-
toluensulfonylimidoiodo)benzene) to the copper(I) complex [(AN)Cu][BF4] (AN = 3,3’-
iminobis(N,N-dimethylpropylamine)) in the presence of an external Lewis acid such as Sc(OTf)3 at
−90 °C (Scheme 4.3).[22] This was the first time that a terminal copper-nitrene could be observed
and spectroscopically characterized and its reactivity was researched in detail, albeit in the form of
its scandium adduct.
The electronic structure of Cu-1-Sc was described as a Cu(II) core that is
antiferromagnetically coupled to a nitrene radical [CuII(NTs●)]+ and its ground state was found to be
an open-shell singlet. Reactivity studies were also performed and Cu-1-Sc was found to be capable
of aminating sp3 C−H bonds of substrates like toluene and cyclohexane by employing a hydrogen
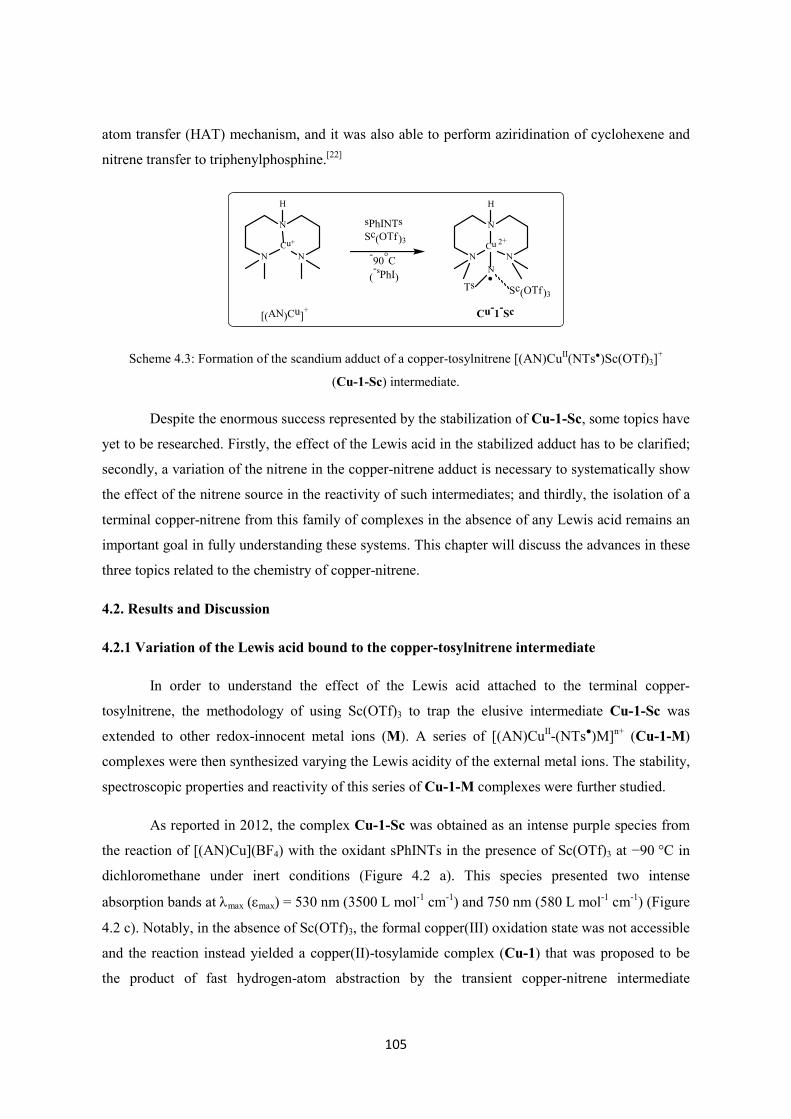
105
atom transfer (HAT) mechanism, and it was also able to perform aziridination of cyclohexene and
nitrene transfer to triphenylphosphine.[22]
NCu+
N
N
H
sPhINTsSc(OTf)3
NCu
N
N
H
N
Sc(OTf)3
2+
[(AN)Cu]+
-90°C(-sPhI)
Ts
Cu-1-Sc
Scheme 4.3: Formation of the scandium adduct of a copper-tosylnitrene [(AN)CuII(NTs●)Sc(OTf)3]+
(Cu-1-Sc) intermediate.
Despite the enormous success represented by the stabilization of Cu-1-Sc, some topics have
yet to be researched. Firstly, the effect of the Lewis acid in the stabilized adduct has to be clarified;
secondly, a variation of the nitrene in the copper-nitrene adduct is necessary to systematically show
the effect of the nitrene source in the reactivity of such intermediates; and thirdly, the isolation of a
terminal copper-nitrene from this family of complexes in the absence of any Lewis acid remains an
important goal in fully understanding these systems. This chapter will discuss the advances in these
three topics related to the chemistry of copper-nitrene.
4.2. Results and Discussion
4.2.1 Variation of the Lewis acid bound to the copper-tosylnitrene intermediate
In order to understand the effect of the Lewis acid attached to the terminal copper-
tosylnitrene, the methodology of using Sc(OTf)3 to trap the elusive intermediate Cu-1-Sc was
extended to other redox-innocent metal ions (M). A series of [(AN)CuII-(NTs●)M]n+ (Cu-1-M)
complexes were then synthesized varying the Lewis acidity of the external metal ions. The stability,
spectroscopic properties and reactivity of this series of Cu-1-M complexes were further studied.
As reported in 2012, the complex Cu-1-Sc was obtained as an intense purple species from
the reaction of [(AN)Cu](BF4) with the oxidant sPhINTs in the presence of Sc(OTf)3 at −90 °C in
dichloromethane under inert conditions (Figure 4.2 a). This species presented two intense
absorption bands at λmax (εmax) = 530 nm (3500 L mol-1 cm-1) and 750 nm (580 L mol-1 cm-1) (Figure
4.2 c). Notably, in the absence of Sc(OTf)3, the formal copper(III) oxidation state was not accessible
and the reaction instead yielded a copper(II)-tosylamide complex (Cu-1) that was proposed to be
the product of fast hydrogen-atom abstraction by the transient copper-nitrene intermediate

106
(Figure 4.2 a). The EPR spectra of species Cu-1 and Cu-1-Sc were contrasting: while Cu-1-Sc was
EPR-silent, complex Cu-1 showed a slightly rhombic signal in X-band EPR with g-values (gx =
2.09, gy = 2.07 and gz = 2.27) and hyperfine constants (Ax = 54 x 10-4 cm-1; Ay = 15 x 10-4 cm-1;
Az = 128 x 10-4 cm-1) consistent with a dx2-y2 ground state of the central copper(II) ions
(Figure 4.2 b).[22]
NCu+
N
N
H
sPhINTs
NCu
N
N
H
N
Sc(OTf)3
2+
[(AN)Cu]+
-90°C(-sPhI)
Ts
Cu-1-Sc
NCu
N
N
H
N
2+
Ts
NCu3+
N
N
H
N
Ts
NCu
N
N
H
NH
2+
TsCu-1
H
SN
O OI
SO O
sPhINTs
Sc(OTf)3
a)
Figure 4.2: a) Scheme depicting the formation of Cu-1 and Cu-1-Sc. b) Experimental (black line) and
simulation (grey line) X-band EPR spectrum of Cu-1 in CH2Cl2 (Temp. 10 K; Frequency 9.4347; Power 0.05
mW) c) Absorption spectra of the starting complex [(AN)Cu](BF4) (black line) and Cu-1-Sc (dotted line) at
−90 °C in CH2Cl2.
With the aim of understanding the role of the Lewis acid in the trapping of the copper-
nitrene intermediate, different redox-innocent metal ions (M) were employed in substitution of
scandium. The reactions between [(AN)Cu](BF4) and sPhINTs at −90 °C in dry dichloromethane in
the presence of the triflate salts of yttrium (Y(III)), europium (Eu(III)), cerium (Ce(III)), zinc

107
(Zn(II)) and calcium (Ca(II)) were then monitored. The formation of Cu-1-M was confirmed on the
basis of the characteristic absorption features at 530 and 750 nm (Figure 4.3) and the presence of
the decay product Cu-1 was also tested by EPR spectroscopy for each solution.
Figure 4.3: Absorption spectra of Cu-1-M obtained from an initial 0.5 mM [(AN)Cu](BF4) solution in CH2Cl2
at −90 °C after addition of the M(OTf)n salt and sPhINTS where M = Sc(III) (black solid line), Y(III) (dashed
line), Eu(III) (dotted line), Ce(III) (dash-dot line), Zn(II) (dash-dot-dot line), and Ca(II) (gray solid line).
It is interesting to observe that the position of the bands at 530 and 750 nm proved to be
independent of the nature of the Lewis acid employed. This indicated that the redox-innocent metal
ions do not affect the electronic transitions associated with the copper-nitrene unit in Cu-1-M.
However, it is also evident that the maximum absorbance of the bands differed significantly from
one M to another. This could have two possible explanations: it could mean that the molar
extinction coefficient (ε) is different for each Cu-1-M, or that the yield of the formed Cu-1-M
depends on the Lewis acid employed. In order to distinguish between these two cases, the yields of
formation of Cu-1-M were evaluated.
The yield of Cu-1-M was determined from the chemical reduction of this species in the
presence of a one-electron reductant like ferrocene (Fc). Cu-1-M performed a two-electron
reduction process with Fc at −90 °C, generating a copper(I) species and two ferrocenium cations
(Fc+) with a characteristic UV-vis absorption (ε = 505 M-1 cm-1 at 620 nm in CH2Cl2). The reaction
monitored by UV-vis showed the decay of the Cu-1-M species and the simultaneous formation of
Fc+ in solution, which was quantified and its yield was used to determine the amount of formal
copper(III) present in solution. On the other hand, the yields of Cu-1 were obtained by spin
quantification of the copper(II) EPR signal corresponding to Cu-1. The obtained yields for Cu-1-M
and Cu-1 are presented in Table 4.1.

108
Table 4.1: Yields of Cu-1-M and Cu-1 in the presence of different Lewis acids (1.5 equivalents)
independently determined on the base of UV-vis (Cu-1-M) and EPR (Cu-1).
M Cu-1-M yield (%) Cu-1 yield (%)
Sc(OTf)3 > 90 5
Y(OTf)3 70 23
Eu(OTf)3 65 33
Ce(OTf)3 58 45
Zn(OTf)2 28 70
Ca(OTf)2 0 95
The differences in the maximum absorption observed when employing different Ms
(Figure 4.3) are clearly due to different yields of the copper-nitrene adduct Cu-1-M (Table 4.1).
This, in turn, is inversely correlated to the yield of Cu-1 obtained in each case. The reaction, thus,
yields a mixture of the two species: the formal copper(III) purple intermediate Cu-1-M and the
decay product copper(II)-tosylamide Cu-1. The proportions of each species are dependent on the M
employed. While the Sc(OTf)3 allowed an almost complete conversion to the Cu-1-Sc adduct, the
Ca(OTf)2 could not stabilize the intermediate and only led to the decay product Cu-1. From this
analysis it is clear that, while the Lewis acidic metal ions do not alter the electronic transitions of
the copper nitrene, they do play a vital role on the stability of the Cu-1-M adducts.
The increasing yield of the purple species Cu-1-M and the decreasing yield of the
corresponding decay product Cu-1 followed the order: Sc3+ > Y3+ > Eu3+ > Ce3+ > Zn2+ > Ca2+,
which is in agreement with the order of Lewis acidity for these cations reported by Fukuzumi et al.
in 2002.[23] This means that the stronger the Lewis acidity of the cation M, the higher its ability to
stabilize the copper-nitrene by preventing rapid decay to Cu-1.
To further investigate the effect of the Lewis acid on the structure of the intermediate,
resonance Raman (rRaman) studies were performed on the species Cu-1-Y to compare it with the
previously reported Cu-1-Sc. [24] The rRaman spectrum of Cu-1-Y (Figure 4.4) was obtained using
514 nm laser excitation in resonance with the 530 nm electronic transition for both Cu-1-Y-14N and
its labeled counterpart Cu-1-Y-15N, in which the nitrene 14N-nitrogen had been replaced with its
isotope 15N. Three bands sensitive to isotope labeling could be observed at 568, 658 and 883 cm-1
that shifted downfield by 2, 3 and 21 cm-1 respectively. It is notable that the sensitive bands

109
observed for Cu-1-Y are only slightly shifted in comparison with the corresponding bands reported
previously for Cu-1-Sc, which appeared at 570, 660, and 887 cm-1.[22] The Raman in both cases
showed that the absorption band at 530 nm in Cu-1-M has predominantly a nitrene-to-copper
charge transfer, given that it selectively enhances vibrational modes involving the copper-nitrene
core.
Figure 4.4: rRaman of Cu-1-Y-14N (black solid line) and Cu-1-Y-15N (dotted line) spectra [laser excitation:
514 nm; solvent: CH2Cl2/acetone (20:1); temp.: −90 °C]. Bands originating from the solvents are marked by
asterisks.
X-ray absorption spectroscopy (XAS) studies were also performed, this time on the
Cu-1-Eu species, to further compare it with the previously reported Cu-1-Sc complex. The
normalized Cu K-edge spectrum of Cu-1-Eu is presented in Figure 4.5 a, alongside those
previously reported for [(AN)Cu](BF4) and Cu-1-Sc. The spectra are similar for both Cu-1-M
complexes. The edge features of both are clearly shifted in energy relative to the Cu(I) precursor,
proving that both samples are in a higher oxidation state. Both samples show a pre-edge feature at
ca. 8977.5 eV, as can be determined from the analysis of the 1st derivative of the spectra (Figure
4.5 b). The position of the pre-edge band indicates that the copper center in both species is in a
Cu(II) oxidation state, and therefore both are [CuII(NR●)]+ in nature. There is a clear difference in
the pre-edge feature shape of both Cu-1-M species: while in the Cu-1-Sc the pre-edge appears
broadened, in Cu-1-Eu the signal is sharper. The difference in the pre-edge shape is due to the
beamline resolution used to measure each sample. The Cu-1-Sc data was measured at NSLS X3B
using a Si(111) monochromator that was sagittally-focusing, while the Cu-1-Eu data was measured
at SSRL 7-3 using a Si(220) monochromator. Si(220) has a somewhat higher resolution than
Si(111) and the sagittal focusing of the X3B monochromator also degrades resolution further (see
Chapter 6 for detailed descriptions of the setups). However, the areas of both signals are not

110
different, which proves that there is no appreciable difference in the copper-nitrene core that can be
determined by X-ray absorption near-edge spectroscopy (XANES).
Figure 4.5: a) Normalized Cu K-edge X-ray absorption spectra of [(AN)Cu](BF4) (dotted line), Cu-1-Sc
(dashed line) and Cu-1-Eu (solid line) in acetone: dichloromethane (1:6). Inset: expansion of the pre-edge
region. b) 1st derivative of the normalized absorption of the pre-edge region of Cu-1-Sc (dashed line) and Cu-
1-Eu (solid line).
DFT calculations were performed with the purpose of studying the molecular structures and
UV-vis spectra of the Cu-1-M complexes in detail. Unlike than the previous report[22] where the Sc-
triflate moiety was approximated by a ScF3 ligand, for this study the full structure of the scandium
triflate moiety [Sc(OTf)3] was used. A number of different conformations for both the tosyl moiety
and each of the triflate groups were sampled, leading to two major conformers A and B
(Figure 4.6). In conformer A the aromatic group of the tosyl moiety coordinates through stacking
interactions with the copper-amine ligand (Fig. 4.6, left), in conformer B, on the other hand, the
tosyl group interacts with one of the triflate anions (Fig. 4.6, right). Previous DFT calculations on
Cu-1-Sc[22] suggested that conformer B was lower in energy; however, new studies suggest a clear
preference for conformer A, which is lower in energy by ca. 14.2 kcal mol-1; this energy difference
was found to be unaffected by the choice of the density functional or basis employed.
Table 4.2 presents some selected coordination distances in both conformers A and B of
Cu-1-Sc. The ligand environment around the copper center is slightly different in each conformer.
While in B one of the tosyl group’s oxygen atoms has a weak coordination towards copper (Cu-O
distance of 2.41 Å), this weak coordination is absent in A (Cu-O distance of 3.24 Å). Moreover, the
distance between the copper and the nitrogen group of the nitrene is shorter in conformer A than in
B (1.89 vs 1.92 Å respectively). The ligand environment around the scandium, on the other hand,
changes substantially between both conformers. In B the three triflate groups bind in a mono-

111
dentate fashion to scandium and the Sc-N(nitrene) distance is relatively short (2.06 Å). In contrast,
in A, one of the triflate ions binds in a bidentate fashion to the scandium while the other two triflate
ions bind in a monodentate fashion, and the Sc-N(nitrene) distance is greater (2.17 Å). The
discussed distances indicate that in conformer B the nitrene and tosyl groups seem to be more
strongly bound to scandium, while in conformer A the trend is reversed and the nitrene group seems
to be more strongly coordinated to the copper center.
Figure 4.6: Molecular structures of the two possible conformers describing Cu-1-Sc: A (left) and B (right).
Color code: C-dark gray, N-blue, O-red, S-yellow, F-light green, Cu-orange, Sc- light gray and H-white.
Table 4.2: Relevant coordination distances (Å) in the copper nitrenes Cu-1-M stabilized by different Lewis-
acids (M) in the conformers A and B, obtained from DFT calculations.
M Sc(OTf)3 Sc(OTf)3 [Y(OTf)3] [Y(OTf)3] [Ca(OTf)2] [Zn(OTf)2]
conf. A conf. B conf. A conf. B conf. A conf. A
Cu-N(tosyl) 1.888 1.924 1.893 1.917 1.882 1.897
Cu-N1(AN) 2.048 2.061 2.041 2.064 2.041 2.065
Cu-N2(AN) 2.035 2.014 2.040 2.014 2.045 2.011
Cu-N3(AN) 2.056 2.071 2.042 2.060 2.041 2.063
Cu-S(tosyl) 2.844 2.691 2.835 2.681 2.798 2.730
Cu-O(tosyl) 3.236 2.409 3.185 2.428 3.096 2.610
M-N(tosyl) 2.170 2.060 2.363 2.249 2.399 1.901
M-O(tosyl) 2.202 3.777 2.385 3.905 2.389 3.094
M-O1(OTfA) 2.035 1.981 2.395 2.159 2.374 2.118
M-O2(OTfA) - - 2.408 - 2.420 2.188
M-O1(OTfB) 2.047 1.996 2.249 2.175 2.275 1.954
M-O1(OTfC) 2.205 1.994 2.355 2.162

112
The UV-vis spectra of both conformers were calculated and are presented in Figure 4.7.
Conformer A’s calculated spectrum shows a single band at 520 nm, while that of conformer B
shows two bands at 860 nm and 575 nm with a shoulder at 520 nm. Experimentally, a single band is
observed in the visible region around ca. 525 nm and no near-IR band is present. This corroborates
the preference for conformer A, whose calculated spectra fits the experimental results well.
Therefore, both the DFT stabilization energies and the UV-vis spectra simulation indicate that
conformer A is the most stable for Cu-1-Sc.
Figure 4.7: Simulated UV-vis spectra for conformers A (red) and B (blue) of Cu-1-Sc.
In order to study the effect that the Lewis acid M has on the structure of the Cu-1-M
complexes, the DFT studies were expanded to include the copper-nitrene species with other selected
Lewis acids. In a similar way to Cu-1-Sc, Cu-1-Y was found in the same two conformers A and B,
but in this case conformer A was even more stabilized (22 kcal mol-1) than conformer B. The same
was found even for divalent M’s, like calcium and zinc. In conformer A of Cu-1-M (M = Sc(III),
Y(III), Zn(II), Ca(II)), both the coordination around the copper center and the relative orientation of
the tosyl group towards it were found to be hardly affected by the change of the metal M (Figure
4.8 and Table 4.2). These findings prove that the copper-nitrene structure is not affected by the
change of M and could explain the fact that all the Cu-1-M species have the same UV-vis
absorption spectra. In order to prove this, the UV-vis spectra were calculated for each Cu-1-M
species in both conformations A and B. The spectra obtained show the same characteristics as
Cu-1-Sc: conformer A has one peak at ca. 520 − 530 nm while conformer B presents peaks at
500 nm (with shoulder at ca. 600 nm) and around 900 nm. In all cases, therefore, only conformer A
correctly reproduces the experimental UV-vis absorption spectra observed for the Cu-1-M species,
which support A being the most stable conformer.

113
Figure 4.8: Overlay of the Lewis acid-stabilized copper nitrenes Cu-1-M in conformation A, where
M = Sc(III), Y(III), Ca(II), Zn(II). Color code: C-dark gray, N-blue, O-red, S-yellow, F-light green, Cu-
orange, M- green and H-white.
The molecular orbitals of Cu-1-Sc (conformer A) involved in the UV-vis absorption band
at 527 nm were also computed and are presented in Figure 4.9. The band at 527 nm results from
two main transitions, namely 224α → 232α (36%) and 228α → 232α (37%). As can be observed
from Figure 4.9, the occupied orbitals 224α and 228α are mainly located in the nitrene-tosyl group
and the copper-AN system, while the virtual 232α orbital is located mainly on the nitrene-copper-
AN system. Hence, the molecular orbitals involved in the transition responsible for the 527 nm
band do not contain any major contribution from the Lewis acid moiety. This may explain the lack
of change in the UV-vis spectra when using different M ions, since the nature of M does not affect
the main transitions responsible for the UV-vis 527 nm band.
Orbital 224α Orbital 228α Orbital 232α
Figure 4.9: Main molecular orbitals involved in the UV-vis absorption band at 527 nm for Cu-1-Sc
(conformer A).
The DFT calculations, together with the rRaman data and the absorption features of the
Cu-1-M complexes, showed that the spectral features of Cu-1-M arise from transitions
predominantly involving the copper-tosylnitrene core and are independent of the Lewis acidity of

114
the M employed for their stabilization. However, the yields and stabilities of the trapped Cu-1-M
do depend on the Lewis acidity of the redox-innocent metal ions employed. It is therefore natural to
wonder if the Lewis acidity of M has any effects on the reactivity of the Cu-1-M complexes.
The reactivity of the Lewis-acid adducts Cu-1-M with M = Sc(OTf)3, Y(OTf)3, Eu(OTf)3
and Ce(OTf)3, was therefore evaluated in the nitrene transfer reaction (NT) with PPh3 as a substrate.
Kinetic studies were performed by adding appropriate amounts of PPh3 to 0.3 mM solutions of Cu-
1-M in CH2Cl2 under completely anaerobic conditions. The decrease of the absorption band at 530
nm was monitored by UV-vis spectroscopy by recording a spectrum every 0.5 seconds. Rate
constants, kobs, were determined by pseudo-first-order fitting in the initial 0-150 s of the decay of
this absorption band (Figure 4.10). Deviation from pseudo-first-order behavior could be observed in
the latter phases of the reactions but reasonable fits were obtained for the initial phases in all cases.
A product analysis of the reaction solution showed the formation of N-(p-
toluenesulfonyl)iminotriphenylphosphorane (Ph3P = NTs) as a product in each case.
Figure 4.10: Changes in the absorption spectra of Cu-1-Eu associated with its reaction with 20 equivalents of
PPh3 obtained from an initial 0.5 mM solution in CH2Cl2 at −90 °C. Inset: Time trace of the pseudo-first-order
decay of the absorption band at 530 nm in this reaction as a function of time.
Second-order rate constants (k2) were determined from the dependence of the pseudo-first-
order rate constants (k2) on PPh3 concentrations for each Cu-1-M complex (Figure 4.11). It is
noteworthy that the rate constant values for the Cu-1-M complexes are independent of the nature of
the metal ions M (Figure 4.9), so despite the fact that the different Lewis acids affect the
yields/stability of the trapped intermediates Cu-1-M, they have no influence on their reactivity.

115
Figure 4.11: Linear dependence of kobs on the concentration of PPh3 for each Cu-1-M complex.
NCu
N
N
H
N
2+
Ts
NCu
N
N
H
N
M
2+
Ts
Cu-1-M
+ M-PPh3PPh3
PPh3 TsN=PPh3
NCu
N
N
H
N
M
2+
Ts
Tautomer I
NCu
N
N
M
N
H
2+
Ts
Tautomer II
a) b)
Scheme 4.4: a) Proposed generation of the metal-free copper-nitrene as the active intermediate in the
reactions of Cu-1-M with an excess of PPh3 b) Tautomeric forms of the Cu-1-M intermediates, where
tautomer II could act as the active species in the reactions performed by Cu-1-M.
The independence of the reactivity of the Cu-1-M complexes on the Lewis acid M may
indicate the presence of a common reactive intermediate in the reactions of Cu-1-M complexes
with PPh3. A plausible candidate for such a reactive species is the free [(AN)Cu(NTs)]+ species
participating in an equilibrium in solution with its corresponding Lewis acid adduct. The occurrence
of such a species could be explained if the presence of an excess of PPh3 displaces the equilibrium
due to the strong binding of PPh3 to M (Scheme 4.4 a). Alternatively, the metal-independent
spectroscopic properties of the Cu-1-M complexes may point to a different binding mode for M
than that originally proposed.[22] A tautomeric structure of Cu-1-M can be visualized (Scheme
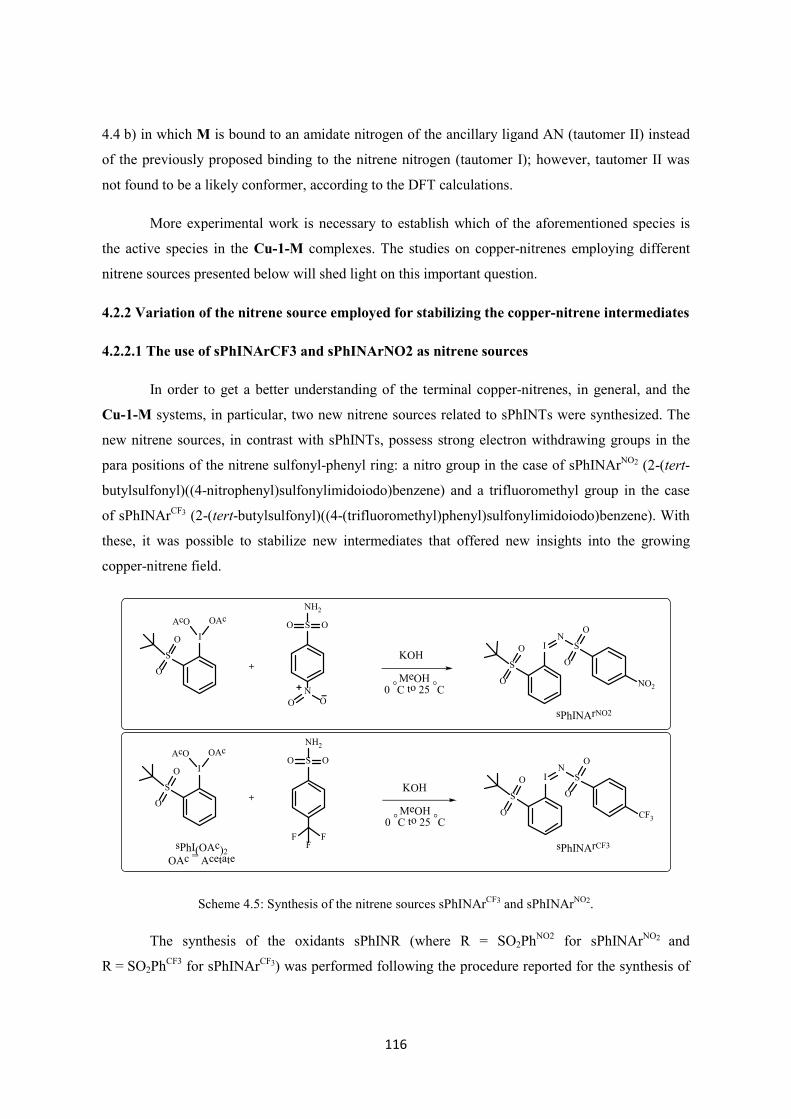
116
4.4 b) in which M is bound to an amidate nitrogen of the ancillary ligand AN (tautomer II) instead
of the previously proposed binding to the nitrene nitrogen (tautomer I); however, tautomer II was
not found to be a likely conformer, according to the DFT calculations.
More experimental work is necessary to establish which of the aforementioned species is
the active species in the Cu-1-M complexes. The studies on copper-nitrenes employing different
nitrene sources presented below will shed light on this important question.
4.2.2 Variation of the nitrene source employed for stabilizing the copper-nitrene intermediates
4.2.2.1 The use of sPhINArCF3 and sPhINArNO2 as nitrene sources
In order to get a better understanding of the terminal copper-nitrenes, in general, and the
Cu-1-M systems, in particular, two new nitrene sources related to sPhINTs were synthesized. The
new nitrene sources, in contrast with sPhINTs, possess strong electron withdrawing groups in the
para positions of the nitrene sulfonyl-phenyl ring: a nitro group in the case of sPhINArNO2 (2-(tert-
butylsulfonyl)((4-nitrophenyl)sulfonylimidoiodo)benzene) and a trifluoromethyl group in the case
of sPhINArCF3 (2-(tert-butylsulfonyl)((4-(trifluoromethyl)phenyl)sulfonylimidoiodo)benzene). With
these, it was possible to stabilize new intermediates that offered new insights into the growing
copper-nitrene field.
IN
S
O
O NO2
S
O
O
IN
S
O
O CF3
S
O
OI
S
O
O
AcO OAc
sPhI(OAc)2OAc =
Acetate
I
S
O
O
AcO OAcS
N
OO
NH2
S
F FF
OO
NH2
O O
KOH
KOH
MeOH0 °C
to 25
°C
MeOH0 °C
to 25
°C
+
+
sPhINArCF3
sPhINArNO2
Scheme 4.5: Synthesis of the nitrene sources sPhINArCF3 and sPhINArNO2.
The synthesis of the oxidants sPhINR (where R = SO2PhNO2 for sPhINArNO2 and
R = SO2PhCF3 for sPhINArCF3) was performed following the procedure reported for the synthesis of

117
sPhINTs with slight modifications; 4-nitrobenzenesulfonamide and 4-(trifluoromethyl)-benzene-
sulfonamide were employed respectively for the reaction with sPhI(OAc)2 in dry methanol to
generate sPhINArNO2 and sPhINArCF3 (Scheme 4.5). The new nitrene sources presented the
advantage of having internal electron-withdrawing groups while retaining the positive features of
sPhINTs such as good solubility in dichloromethane and ease of handling and storage.
The reaction of the complex [(AN)Cu](BF4) with 1.5 equivalents of the oxidants sPhINR in
the presence of 1.25 equivalents of Sc(OTf)3 in dry dichloromethane at −90 °C resulted in the
formation of two new purple intermediates: Cu-2-Sc when using sPhINArCF3 and Cu-3-Sc in the
case of sPhINArNO2 (Scheme 4.6). The absorption spectra of both intermediates (Figure 4.12)
displayed an intense band at 525 nm (εmax = 2150 M-1 cm-1 for Cu-2-Sc and εmax = 2000 M-1 cm-1 for
Cu-3-Sc) and a broad, less intense band at around 750 nm (εmax = 600 M-1 cm-1 for Cu-2-Sc and
εmax = 550 M-1 cm-1 for Cu-3-Sc). These spectra are remarkably similar to the one obtained for
Cu-1-Sc, which showed two bands at 530 nm (εmax = 3500 M-1 cm-1) and 750 nm (εmax = 580 M-1
cm-1). What is notably different is the observed stability for the three different adducts in
dichloromethane at −90 °C; while the half-life of Cu-1-Sc is reported to be 1600 s,[22] the half-life
measured for Cu-2-Sc is 2250 s, and for Cu-3-Sc it is 3000 s. This change in stability can be
attributed to the increasing electron-withdrawing capability of the substituent group in the p-
position of the phenyl ring in the order –CH3 < -CF3 < -NO2.
Most notable is the effect of the electron-withdrawing groups on the stability of the free
Cu-nitrene species in the absence of any externally-added Lewis acid. As discussed before, in the
reaction for the complex [(AN)Cu](BF4) with the oxidant sPhINTs in the absence of an external
Lewis acid, the stabilization of the formal copper(III) species was not attainable and the reaction
instead yielded a copper(II)-tosylamide complex Cu-1. However, the complex [(AN)Cu](BF4)
reacted in dry dichloromethane at −90 °C with the oxidants sPhINArCF3 and sPhINArNO2
(Scheme 4.6) to yield two new bright green intermediates: Cu-2 and Cu-3, respectively, with
characteristic absorption bands at 425 nm (εmax = 1200 M-1 cm-1 for Cu-2 and εmax = 1300 M-1 cm-1
for Cu-3) and 700 nm (εmax = 600 M-1 cm-1 for Cu-2 and εmax = 700 M-1 cm-1 for Cu-3) (Figure
4.12). Both species, Cu-2 and Cu-3, decay in solution at −90 °C with half-lives of 1200 s and 1400
s respectively. Again, a trend of increasing stability could be observed when increasing the electron-
withdrawing capabilities of the group in the p-position of the phenyl nitrene substituent; while the
terminal copper nitrene with sPhINTs cannot be stabilized in the absence of a Lewis acid, under the
same conditions Cu-2 can be observed but is, in turn, shorter-lived than Cu-3.

118
NCu+
N
N
H
NCu
N
N
H
N
Sc(OTf)3
2+
[(AN)Cu]+
-90 °C
R
Cu-2-Sc: R = -SO2
-PhCF3
Cu-3-Sc: R = -SO2
-PhNO2
NCu
N
N
H
N
2+
R
NCu3+
N
N
H
N
R
Sc(OTf)3
Cu-2: R = -SO2
-PhCF3
Cu-3: R = -SO2
-PhNO2
sPhINR
IN
S
O
O NO2
S
O
OI
N
S
O
O CF3
S
O
O
sPhINArCF3sPhINArNO2
sPhINR =
Scheme 4.6: Generation of the intermediates Cu-2, Cu-3, Cu-2-Sc and Cu-3-Sc.
Figure 4.12: Absorption spectra of the intermediates Cu-2 (dashed line in a)), Cu-3 (dashed line in b)), Cu-2-
Sc (dotted line in a)) and Cu-3-Sc (dotted line in b)) in CH2Cl2 at −90 °C. The initial [(AN)Cu](BF4)
absorption spectra is shown in black solid line.
In order to study the influence of the Lewis acid (M) on the formation of the new
intermediates, different Lewis acids were used to generate Cu-3-M in the same manner as was done
for Cu-1-M, this time employing Sc(OTf)3, Y(OTf)3 and Eu(OTf)3 (Figure 4.13). The position of
the main band at 525 nm proved to be independent of the nature of the M employed; however, the
maximum absorbance differed significantly depending on the M used. As observed in the analogous
Cu-1-M complexes, this trend is a reflection of the Lewis acidity of the metal ion M and is related
to the decreasing yield of the Lewis-acid adduct generated in each case.

119
Figure 4.13: Absorption spectra of Cu-3-M obtained when M = Sc(III) (black solid line, Y(III) (dashed line)
and Eu(III) (dotted line). All spectra were obtained from an initial 1 mM solution of [(AN)Cu](BF4) after
addition of M(OTf)3 and sPhINArNO2 in CH2Cl2 at −90 °C.
Since this is the first time that Lewis acid-free copper-nitrene intermediates have been
detected from the reaction of [(AN)Cu](BF4) with iminoiodinane derivatives, more thorough
research is needed to characterize them. To find out the stoichiometry of Cu-2 and Cu-3, a titration
was performed in which different amounts of sPhINR were added to a 1 mM solution of
[Cu(AN)](BF4) and the maximum absorbance at 425 nm was recorded in each case. The plot of
mmol of sPhINArNO2 added versus the maximum absorbance obtained is presented in Figure 4.14.
Close after the addition of 1 equivalent of sPhINR, the maximum absorbance remained constant.
This indicates that the copper and the nitrene sources react in a 1:1 stoichiometry to yield Cu-2 and
Cu-3, thus showing that these species are terminal copper nitrenes.
To determine the formal oxidation state of the copper in the complexes Cu-2, Cu-3, Cu-
2-Sc and Cu-3-Sc, their reactivity towards one-electron reductants was tested. Cu-2-Sc and Cu-3-
Sc underwent a two-electron reduction process with ferrocene (Fc; Eox vs SCE = 0.37 V) at −90 °C
with the corresponding formation of copper(I) and ferrocenium cations (Fc+; 150-160%; Figure
4.15) in yields slightly lower than those reported for Cu-1-Sc (Fc+; 180%). This confirmed that
Cu-2-Sc and Cu-3-Sc are two oxidation levels higher [(AN)Cu](BF4). On the other hand, it was not
possible to reduce Cu-2 and Cu-3 using Fc. Previous studies on reactive intermediates like iron-
oxos and copper-nitrenes have shown that the presence of scandium(III) is necessary for the two-
electron reduction with Fc to take place.[22,25] This phenomenon has been explained by adducing that
the stronger binding of the scandium(III) to the oxo- or nitrene- group facilitates the reduction of the
metal to its fully reduced form.[25] In this case, Cu-2 and Cu-3, having no scandium bound could

120
not be reduced by ferrocene; in contrast, Cu-2-Sc and Cu-3-Sc have scandium and were able to
undergo the two-electron reduction.
Figure 4.14: Maximum absorbance observed at 425 nm from the reaction of [(AN)Cu](BF4) with different
amounts of sPhINArNO2 in CH2Cl2 at −90 °C.
Figure 4.15: Absorption spectra of Cu-2-Sc and Cu-3-Sc (1 mM) and the product of their reaction with
ferrocene (Fc) (30 equivalents) in CH2Cl2 at −90 °C.
The use of a stronger one-electron reductant such as decamethylferrocene (Me10Fc) (Eox vs
SCE = −0.08 V) allowed complexes Cu-2-Sc, Cu-3-Sc, and also Cu-2 and Cu-3 to undergo a two-
electron process with the corresponding formation of a copper(I) species and the
decamethylferrocenium cation (Me10Fc+) with yields between 187 and 193 % (Figure 4.16). This
confirmed that all the intermediates Cu-2, Cu-3, Cu-2-Sc and Cu-3-Sc are two oxidation states
above copper(I), meaning that the copper in them is in a formal oxidation state of +3. It also showed
that the intermediates are formed in a yield of at least 90 %.

121
Figure 4.16: Absorption spectra of 1mM solutions of a) Cu-2-Sc (dotted line), b) Cu-2 (dashed line), c) Cu-
3-Sc (dotted line), d) Cu-3 (dashed line) and the product of their reaction with decamethylferrocene (Me10Fc)
(30 equivalents) (black line in all) in CH2Cl2 at −90 °C.
This is the first time that we have access to terminal copper nitrenes both as free species,
Cu-2 and Cu-3, and as their scandium adducts, Cu-2-Sc and Cu-3-Sc, under the same conditions,
which offers a great opportunity to perform comparative spectroscopic and reactivity studies to get
a better understanding of the behavior of these important reactive intermediates.
The resonance Raman (rR) spectra of Cu-2-Sc and Cu-3-Sc were measured at 77 K using
532 nm laser excitation in resonance with the 525 nm transition of the intermediates (Figure 4.17).
In both cases, three bands were observed that can be attributed to the CuIII-NTs/CuII-N●Ts core on
the basis of 15N isotope labeling. Cu-2-Sc displayed a shoulder band at around 907 cm-1 that
showed a downshift of 33 cm-1 when labeled, and two other bands at 609 cm-1 and at 557.5 cm-1
with lower sensitivity to labeling, which shifted by 2 and 1.5 cm-1 respectively. Similarly, Cu-3-Sc
displayed a shoulder band at around 910 cm-1 that showed a downshift of 30 cm-1 when labeled, and
another two bands at 609 cm-1 and at 562 cm-1 that shifted by 4 and 2 cm-1 respectively. The rR

122
spectra obtained for Cu-2-Sc and Cu-3-Sc are in close agreement with the one obtained for
Cu-1-Sc using 514 nm laser excitation, where three isotope-sensitive bands were reported in the
same regions as the ones observed here. Despite our best efforts, it was not possible to obtain the rR
spectra of Cu-2 and Cu-3, possibly due to decomposition or decay of the sample under the laser
irradiation.
Figure 4.17: rRaman spectra of a) Cu-2-Sc-14N (black solid line) and Cu-2-Sc-15N (gray solid line) and b)
Cu-3-Sc-14N (black solid line) and Cu-3-Sc-15N (gray solid line) [laser excitation: 532 nm; solvent:
CH2Cl2/acetone (20:1); temp.: −90 °C].
The formal Cu(III) species in Cu-2, Cu-3, Cu-2-M and Cu-3-M may exist in two possible
electronic structures, namely a copper(III)-imido [CuIII(NR)]+ and a copper(II)-imidyl radical
[CuII(NR●)]+ (Figure 4.1). Shifts in the XANES features can be useful in determining the actual
oxidation state of the copper center in the complexes. Figure 4.18 shows a comparison of the Cu
K-edge XANES spectrum of [(AN)Cu)](BF4), Cu-3 and Cu-3-Y. It is interesting to notice that the
Cu-3 and Cu-3-Y spectra are practically identical, and therefore both complexes present the same
electronic structure, which is independent of the presence of an external Lewis acid M in their
structure.
The edge features of Cu-3 and Cu-3-Y are shifted to higher energy relative to the Cu(I)
precursor. However, the edge energy is not a suitable indicator for distinguishing between
copper(III) and copper(II) in a complex since the Cu edge includes 1s→4p transitions that are
strongly influenced by geometry and the ligand environment, and therefore its features are not only
functions of the oxidation state of the metal.[26] The only feature that can be used unambiguously to
distinguish the copper oxidation state in the sample is the pre-edge. A pre-edge is a weak 1s→3d
electric-dipole-forbidden transition (∆l ≠ ±1) that is visible when there is 3d-4p orbital mixing

123
(since 1s→4p transitions are allowed). For copper(II) compounds this transition takes place at
8978.8 ± 0.4 eV, while for copper(III) it occurs at 8981 ± 0.5 eV.[26] The pre-edge energy observed
for Cu-3 and Cu-3-Y appears at ca. 8978 eV, this strongly suggests that both species contain a
Cu(II) center bound to a nitrene radical, consistent with a [CuII−NR•]+ formulation, as observed
before for Cu-1-M.[22]
Figure 4.18: Normalized Cu K-edge spectra for [(AN)Cu](BF4) (dotted line), Cu-3 (solid line) and Cu-3-Y
(dashed line) in dichloromethane. The inset shows an expansion of the pre-edge region.
The four new intermediates were also computationally investigated using the same tools
employed for the study of Cu-1-M species. The structure of the Cu-2-Sc and Cu-3-Sc complexes
was determined to be that of conformer A previously described for Cu-1-Sc. The geometry of the
Lewis acid-free complexes Cu-2 and Cu-3, on the other hand, remained to be studied. A number of
possible conformations could be envisioned; the three most important ones are presented in
Figure 4.19 and their relevant coordination distances are presented in Table 4.3 for Cu-3. The
simplest one is that determined for Cu-1-Sc (conformer A) after the removal of the Sc(OTf)3 moiety
(conformer A’). Another possibility is that one of the side arms of the AN ligand drifts away and
the tosyl group gets protonated, instead of the middle amine group (conformer B’, diamine
conformation). Finally, the third conformation (conformer C’) is found to be the lowest in energy. It
is similar to the diamine conformation B’, but in this conformation, during the geometry
optimization, the faraway amine group deprotonates the CH2 group next to the middle amine group,
thereby generating an imine in the middle and an ammonium cation on the side. Conformer C’ is
ca. 32 kcal mol-1 more stable than conformer A’.
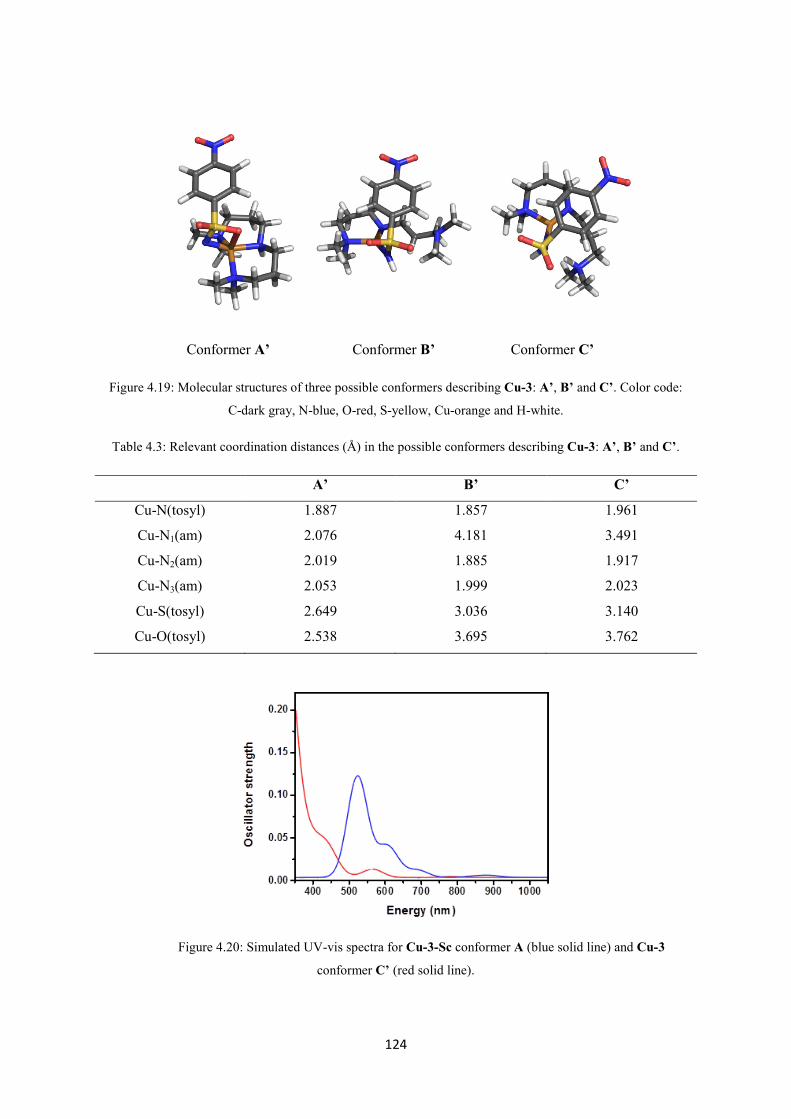
124
Conformer A’ Conformer B’ Conformer C’
Figure 4.19: Molecular structures of three possible conformers describing Cu-3: A’, B’ and C’. Color code:
C-dark gray, N-blue, O-red, S-yellow, Cu-orange and H-white.
Table 4.3: Relevant coordination distances (Å) in the possible conformers describing Cu-3: A’, B’ and C’.
A’ B’ C’
Cu-N(tosyl) 1.887 1.857 1.961
Cu-N1(am) 2.076 4.181 3.491
Cu-N2(am) 2.019 1.885 1.917
Cu-N3(am) 2.053 1.999 2.023
Cu-S(tosyl) 2.649 3.036 3.140
Cu-O(tosyl) 2.538 3.695 3.762
Figure 4.20: Simulated UV-vis spectra for Cu-3-Sc conformer A (blue solid line) and Cu-3
conformer C’ (red solid line).

125
The UV-vis spectra of conformer A for Cu-3-Sc and conformer C’ for Cu-3 were further
computed. The simulated spectra are shown in Figure 4.20. Both are a perfect match with those
obtained experimentally (Figure 4.12 b). The spectrum of conformer A’ for Cu-3 was also
calculated and two broad bands at 510 and 630 nm were observed, which does not fit with the
experimentally observed results. This is a further confirmation of the validity of assigning Cu-3 and
Cu-2 to C’-type structural conformations.
Figure 4.21: Changes in the absorption spectra associated with the reaction of a) Cu-2, b) Cu-2-Sc, c) Cu-3
and d) Cu-3-Sc with toluene obtained from an initial 1 mM solution of the intermediate at −90 °C in CH2Cl2.
Inset: Time trace of the pseudo-first-order decay of the absorption band that characterizes each intermediate,
as a function of time and pseudo-first-order fitting (gray solid line).
The reactivity of the trapped intermediates Cu-2, Cu-3, Cu-2-Sc and Cu-3-Sc was
examined in the oxidation of toluene, which has a C−H bond dissociation energy (BDE) of 88.6
kcal mol-1.[27] The kinetics of the reactions were followed by UV-vis spectroscopy when different
concentrations of toluene were added to the formed intermediates in dichloromethane at −90 °C.
The decay of the characteristic absorption band was followed and fitted to pseudo-first-order decay

126
Figure 4.22: Linear dependence of kobs on the concentration of the substrate for the reactions of a) Cu-2, b)
Cu-2-Sc, c) Cu-3 and d) Cu-3-Sc with toluene at −90 °C in CH2Cl2.
Table 4.4: Second-order rate constants (k2) for Cu-1-Sc,[22] Cu-2, Cu-2-Sc, Cu-3 and Cu-3-Sc determined for
different substrates in HAA and NT reactions in dichloromethane at −90 °C.
BDE
Cu-1-Sc Cu-2 Cu-2-Sc Cu-3 Cu-3-Sc
k2 L mol-1 s-1 k2 L mol-1 s-1 k2 L mol-1 s-1 k2 L mol-1 s-1 k2 L mol-1 s-1
HAA
Xanthene 74 0.311 0.106 0.104
CHD 76.9 0.155 0.061 0.060
Toluene 88.6 5.1 x 10⁻³ 3.23 x 10⁻³ 3.15 x 10⁻³ 2.67 x 10⁻³ 2.57 x 10⁻³
NT
Thioanisole No reaction 0.110 0.112

127
(Figure 4.21). Second-order rate constants (k2) for Cu-2, Cu-3, Cu-2-Sc and Cu-3-Sc were
determined from the dependence of the pseudo-first-order rate constants on toluene concentrations
(Figure 4.22, Table 4.4). As for Cu-1-M intermediates, only the initial 500 seconds were taken for
the pseudo-first-order fitting since deviations from this behavior are observed in the latter phases of
the reaction.
Different trends can be analyzed from the k2 values obtained. First, we can compare the rate
constants obtained for the oxidation of toluene with the three different scandium adducts; the
observed trend for the reaction rates is the following: k2 Cu-1-Sc > k2 Cu-2-Sc > k2 Cu-3-Sc.
Notably, the reaction rate trend is opposite to that obtained for the stability of the intermediates.
This is a clear display of the inverse behaviors between reactivity and stability.
Secondly, it is very interesting to compare the second-order rate constants obtained for the
free species and the scandium adduct that contain the same oxidant. When comparing the reaction
rates between Cu-2 and Cu-2-Sc on the one hand, and Cu-3 and Cu-3-Sc on the other, near-
identical rate constants are found for the free- and the scandium adduct species (Table 4.4), whose
differences can be located within the limits of experimental error. To provide further proof of this
trend, other substrates were tested using the intermediates formed with the oxidant sPhINArNO2: Cu-
3 and Cu-3-Sc.
The oxidation of the substrates xanthene and 1,4-cyclohexadiene (CHD) by Cu-3 and
Cu-3-Sc was followed by UV-vis spectroscopy using the same methodology as before; the linear
fittings of kobs vs substrate concentration of xanthene are shown in Figure 4.24 and the k2 values
obtained are presented in Table 4.4. The k2 values for these substrates’ oxidation with Cu-3 and
Cu-3-Sc show the same conduct as was observed for toluene: the free species and the scandium
adduct have the same behavior toward substrates in oxidation reactions. Additionally, Cu-3 and
Cu-3-Sc were also tested in nitrene transfer reaction (NT) to thioanisole at −90 °C, showing nearly
identical rates consistent with the behavior observed for HAA reactions (Table 4.4).
This finding backs up the independency of the oxidation rates with the external Lewis acid
employed, as observed in the Cu-1-M series. The near-identical reactivity of Cu-2 compared to
Cu-2-Sc and Cu-3 compared to Cu-3-Sc, supports the hypothesis that a Lewis acid free species is
responsible for the reactivity in this family of copper nitrenes. In that hypothesis the Lewis acid free
species is present in solution in very low concentrations due to an equilibrium occurring between
the scandium adduct of the terminal copper nitrene and its free species. In the presence of a
substrate, this equilibrium is displaced as the terminal species is consumed (Scheme 4.4 a). To

128
further corroborate the existence of this equilibrium, experiments were performed in which a fixed
amount of [(AN)Cu](BF4) and the oxidant sPhINArNO2 were reacted in the presence of increasing
amounts of scandium and the intermediate thus formed was set to react with CHD. The trend of the
reaction rates (k2) for the oxidation reaction of CHD at −90 °C with 3-Sc obtained with different
amounts of scandium present in solution is shown in Figure 4.23 (black squares and black solid
line).
Figure 4.23: Decrease in the reaction rate (k2) of Cu-3-M with CHD at −90 °C in CH2Cl2 in the presence of
increasing equivalents of M present in solution when M=Sc(III) black squares and black solid connecting line
and M=Y(III) gray circles and gray solid connecting line.
In Figure 4.23 it can be seen that the reaction rates unequivocally fall as the concentration
of scandium increases. This corroborates the existence of an equilibrium in solution; the more
scandium present, the more shifted the equilibrium is towards the scandium adduct and the less the
free species is present in solution, which slows down the reaction. To further study this
phenomenon, the behavior of the intermediate Cu-3-Y, generated with different amounts of
Y(OTf)3, was also tested against CHD (Figure 4.23 gray circles and gray solid line). Again, it can
be seen that the k2 values decrease as the amount of Y(III) present in solution increases, as expected
in an equilibrium. It is worth noticing that the rate at which the k2 values decrease is dependent on
the M employed. When large equivalents of Y(OTf)3 were employed, the reaction with CHD was
faster than the same reaction with the same number of equivalents of Sc(OTf)3. This could be a
reflection of how strongly M is bound to the copper-nitrene core, while Sc(III) is more Lewis acidic
and binds more strongly to the copper-nitrene core and the equilibrium between the scandium
adduct and the free species is slower than the same equilibrium with the less strongly-bound
yttrium. The differences are nonetheless quite small and only start to be evident when larger
amounts of M are employed (more than 2 equivalents); unfortunately, given the poor solubility of

129
the M(OTf)3 salts in the solvents at −90 °C, it is not possible to evaluate the effect of a much larger
excess. However, these results do point towards the equilibrium suggested in Scheme 4.4 a.
Finally, a third analysis of the kinetic data can be made. Both Cu-3 and Cu-3-Sc show an
increase in the rates of the reactions, which can be correlated with a decrease in the BDEs of the
substrates employed[27] (Table 4.4), reveling a rate-determining H-atom abstraction process.
Furthermore, a deuterium kinetic isotope effect (KIE) of 4.24 was obtained for Cu-3-Sc, and 4.31
for Cu-3, when d2-xanthene was used as a substrate at −90 °C (Figure 4.24). Such a KIE value
corroborates the proposed hydrogen atom abstraction radical rebound (HAA/RR) mechanism and is
consistent with the values obtained for other reported metal nitrenes.[7]
Figure 4.24: Linear dependence of kobs on the concentration of the substrate for the reactions of a) Cu-3, b)
Cu-3-Sc, with xanthene and d2-xanthene at −90 °C in CH2Cl2.
The possibility of stabilizing the free species: Cu-2 and Cu-3, as well as the scandium
adducts: Cu-2-Sc and Cu-3-Sc, of terminal copper nitrenes achieved via nitrene source design,
provided us with a unique opportunity for studying and understanding the behavior of copper
nitrenes in solution. However, the studies carried out so far were performed in a family of copper-
nitrenes obtained from iminoiodinane derivatives by introducing electron-withdrawing groups in the
phenyl ring. To get a full image of the effect that changing the nitrene source has on the trapping of
copper-nitrene intermediates and their scandium adducts, a different nitrene source, an organic
azide with an electron-donating group, was employed.
4.2.2.2 The use of mesityl-azide as the nitrene source
A new scandium adduct Cu-4-Sc was stabilized and characterized. It was generated from
the reaction of mesityl-azide with [(AN)Cu](BF4) in the presence of Sc(OTf)3[28,29] and is
characterized by the electron-donating mesityl (Mes) group attached to the nitrene group. The effect

130
of the electron-donating group was evaluated, in contrast with the electron-withdrawing groups
employed before.
NCu+
N
N
H
NCu
N
N
H
N
Sc(OTf)3
2+
[(AN)Cu]+
-90°C(-N2)
Mes
Cu-4-Sc
NCu
N
N
H
N
2+
Mes
NCu3+
N
N
H
N
Mes
Sc(OTf)3
N3
HN
Cu2+
N
N
H
NH
Mes
Mes-N3
Mes-N3
Cu-4
Scheme 4.7: Generation of Cu-4 and the intermediate Cu-4-Sc.
Figure 4.25: Formation of the intermediate Cu-4-Sc in CH2Cl2 at −90 °C followed by UV-vis spectroscopy.
The initial [(AN)Cu](BF4) absorption spectra is shown in a black solid line and the final Cu-4-Sc spectra is
shown in a dashed line.
The reaction of [(AN)Cu](BF4) in CH2Cl2 with one equivalent of freshly prepared mesityl-
azide at −90 °C in the presence of 1.5 equivalents of Sc(OTf)3 resulted in the formation of a new
purple species Cu-4-Sc (Scheme 4.7). The formation of this species was not immediate, as occurred
with Cu-1-Sc, Cu-2-Sc and Cu-3-Sc, but took 2 hours; the resulting species was stable at −90 °C
and only showed a decay of 5% in the 2 hours after full generation. The intermediate Cu-4-Sc was
EPR-silent and showed a characteristic UV-vis spectrum with absorption maxima centered at λmax

131
(εmax) = 560 nm (2000 L mol-1 cm-1) and 670 nm (1227 L mol-1 cm-1) (Figure 4.25). Interestingly,
both the color and the absorption spectra are similar to those obtained for the copper-nitrene
scandium adducts isolated so far in our group.
When the reaction of [(AN)Cu](BF4) in CH2Cl2 with one equivalent of freshly prepared
mesityl-azide at −90 °C was performed in the absence of scandium, a new copper(II) species (Cu-4)
was formed. Cu-4 is not a transient intermediate since it did not decay in solution. It showed a
characteristic copper(II) signal in EPR. Although no further characterization of Cu-4 was
performed, based on previous studies[22] it can be assigned to the copper(II)–amidate complex
[(AN)CuII(HNMes)]+.
The consumption of the azide after the formation of Cu-4-Sc was corroborated with
infrared spectroscopy (IR). Organic azides have a very specific and intense IR band due to the
strong asymmetric vibration of the N≡N of the azido group, which appears in the range of 2170 to
2080 cm-1;[30] the mesityl-azid presented a very intense band right in the middle of this range, at
2115 cm-1. In the IR spectra of the reaction mixture after the formation of Cu-4-Sc, this band had
disappeared completely (Figure 4.26), thus confirming the full consumption of the azide in the
reaction.
Figure 4.26: IR spectra of the mesityl-azide (gray) and of the solution after the formation of Cu-4-Sc (black).
To further research the nature of Cu-4-Sc and determine the formal oxidation state of the
copper in the system, its reactivity towards one-electron reductants was tested. Unlike the copper
nitrenes containing sulfonyl groups (Cu-1-Sc, Cu-2-Sc and Cu-3-Sc), Cu-4-Sc did not react with
ferrocene at −90 °C. This might be a result of the electron-donating ability of the Mes group of the
nitrene, which prevents the reduction from taking place. The use of a stronger reductant, namely

132
Me10Fc, allowed two-electron reduction to take place in CH2Cl2 at −90 °C. This reaction resulted in
the formation of a copper(I) species and two equivalents of the cation Me10Fc+ (Figure 4.27). The
obtained yield of Me10Fc+ (183%) confirmed that Cu-4-Sc is two oxidation levels above
[(AN)Cu](BF4), so it is a formal copper(III), and its initial yield is above 90%.
Figure 4.27: Absorption spectra of Cu-4-Sc (black line) (1 mM) and the product of its reaction with
decamethylferrocene (Me10Fc) (gray line) in CH2Cl2 at −90 °C.
To get a better picture of the geometric and electronic structure of the Cu-4-Sc adduct, X-
ray absorption spectroscopy (XAS) was also performed. As discussed before, formal copper(III)
intermediates can exist in three different electronic configurations described in Figure 4.1: a singlet
copper(III)-imido [CuIII(NR)]+, a singlet copper(II)-radical imidyl [CuII(NR●)]+ or a triplet
copper(II)-radical imidyl [CuII(NR●)]+. Cu K-edge XAS can provide information about the
oxidation state of the copper in the sample, as well as other clues regarding the geometry around the
metal center.
The Cu K-edge X-ray absorption spectrum obtained for Cu-4-Sc and those of Cu-1-Sc and
[(AN)Cu](BF4) are presented in Figure 4.28. When comparing the edge features of Cu-4-Sc with
those of the precursor [Cu(AN)](BF4), it becomes evident that there is a shift in energies similar to
that observed for Cu-1-Sc. However, the edge energy is not a suitable indicator for distinguishing
between copper(III) and copper(II) in a complex. The only feature that can be used unambiguously
to distinguish the copper oxidation state in the sample is the pre-edge.[26] The pre-edge transition of
Cu-1-Sc is visible and appears at ca. 8978 eV, thus confirming its [CuII(NTs●)]+ nature, as with
Cu-3 and Cu-3-M. Unfortunately, this transition is not present in the Cu K-edge XAS spectra of
Cu-4-Sc (Figure 4.28 inset), which prevents the assignment of the oxidation state of the copper in
this species.

133
Figure 4.28: Normalized Cu K-edge spectra for [(AN)Cu](BF4) (dotted line), Cu-1-Sc (solid line) and Cu-4-
Sc (dashed line). The inset shows an expansion of the pre-edge region.
Another relevant feature that can be observed in the spectra of Cu-4-Sc is the shoulder
along the rising edge that is absent in Cu-1-Sc. This shoulder appears at 8981.5 eV, an energy value
that is typically associated with 1s→4p transitions.[26,31] The energy of this band might indicate that
the copper is in a three-coordinate trigonal planar geometry.[31,32] This is in contrast with the
geometry previously reported for copper in Cu-1-Sc, namely a distorted square pyramidal
geometry, and it would imply that the ligand AN in Cu-4-Sc is acting as a bidentate ligand with one
of the terminal nitrogen atoms remaining outside of the copper coordination sphere.
Figure 4.29: DFT energy-minimized structure for the singlet state of Cu-4-Sc. Gray-carbon, blue-nitrogen,
red-oxygen, yellow-sulfur, orange-copper, light blue-fluorine and light gray-scandium. The hydrogen atoms
are removed for clarity.
The geometry of Cu-4-Sc was optimized by DFT calculations. The optimized geometry is
shown in Figure 4.29. In this geometry, the ligand AN is only coordinated to the copper through
two of its nitrogen atom donors and the third one, one of the terminal tertiary amines, remains
outside of its coordination sphere. The three-coordinate trigonal planar geometry around the copper

134
center is in keeping with what was observed from the shoulder on the rising edge of the Cu K-edge
XAS of Cu-4-Sc. The bidentate coordination style of the ligand AN has been observed before in the
hetero-bi-metallic [CuIII(µ-O)2NiIII]2+ [33] as well as in the previously described species Cu-2 and
Cu-3.
To further understand the factors governing reactivity in copper-nitrene chemistry, and at
the same time exploit the fact that Cu-4-Sc is stable at −90 °C, reactivity studies were performed.
Cu-4-Sc was tested as an oxidant for two different kinds of reactions: hydrogen atom abstraction
(HAA) and nitrene transfer (NT) reactions. As for the other complexes, the reactivity studies of
Cu-4-Sc were performed at −90 °C under an inert atmosphere. A solution of Cu-4-Sc in CH2Cl2
was prepared in situ and a solution with a determined amount of substrate in the same solvent was
injected. The decay of the 560 nm band was then monitored and fitted to a pseudo-first-order decay
which yielded the rate constant (kobs) for each concentration of the substrate employed (Figure
4.30). kobs was found to increase linearly with the increase in the substrate concentration and the
slope of this linear increase provided the second-order rate constants (k2, Figure 4.31).
Figure 4.30: Changes in the absorption spectra of Cu-4-Sc associated with its reaction with 20
equivalents of CHD obtained from an initial 1 mM solution at −90 °C in CH2Cl2. Inset: Time trace of the
pseudo-first-order decay of the absorption band at 560 nm in this reaction as a function of time and fitting to a
pseudo-first-order decay (gray line).
Nitrene-transfer reactivity of Cu-4-Sc was tested against two substrates: triphenylphosphine
and thioanisole. The plots of kobs vs. substrate concentration are shown in Figure 4.31a, and the rate
constants obtained are presented in Table 4.5. The products from the reaction of Cu-4-Sc with PPh3
were analyzed and the formation of N-(mesityl)-iminotriphenyl-phosphorane was confirmed. The

135
resulting solution was EPR-silent, which might indicate the formation of a copper(I) species after
the reaction.
Figure 4.31: Linear dependence of kobs on the concentration of the substrate for a) nitrene transfer (NT) and b)
hydrogen atom abstraction (HAA) reactions with Cu-4-Sc at −90 °C in CH2Cl2.
On the other hand, the ability of Cu-4-Sc to perform HAA reactions was also evaluated,
this time against three substrates: xanthene, 1,4-cyclohexadiene (CHD) and toluene. The plots of
kobs vs. substrate concentration are shown in Figure 4.31 b, and the rate constants obtained are
presented in Table 4.5. Cu-4-Sc reacted with substrates with low bond dissociation energies
(BDE)[27] such as xanthene (BDE = 74 kcal mol-1) and CHD (BDE = 76.9 kcal mol-1) but was not
able to oxidize hydrocarbons with higher BDEs like toluene (BDE = 88.6 kcal mol-1). An analysis
of the reaction mixture for CHD showed the formation of benzene in near-quantitative yields.
The rate constants obtained for the scandium adducts of copper nitrenes studied so far,
namely Cu-1-Sc, Cu-2-Sc, Cu-3-Sc and Cu-4-Sc, are all presented together in Table 4.5. A
contrasting reactivity pattern can be appreciated, in which the complex Cu-4-Sc is a better oxidant
in nitrene transfer reactions (with rates 4-14 times faster), while it performs worse at hydrogen atom

136
abstraction reactions (with rates 1.2- 5 times slower) than the sulfonated copper nitrenes (Cu-X-Sc,
where X=1,2,3).
Table 4.5: Second-order rate constants (k2) of Cu-1-Sc,[22] Cu-2-Sc, Cu-3-Sc and Cu-4-Sc determined for
different substrates in HAA and NT reactions in dichloromethane at −90 °C.
Cu-4-Sc Cu-1-Sc Cu-2-Sc Cu-3-Sc
k2 (L mol-1 s-1) k2 (L mol-1 s-1) k2 (L mol-1 s-1) k2 (L mol-1 s-1)
HAA
Xanthene 0.084 0.3135 0.104
CHD 0.030 0.1554 0.060
Toluene No reaction 0.0051 0.0032 0.0026
NT
PPh3 2.89 0.196
Thioanisole 0.5 No reaction 0.112
From the analysis of Table 4.5, it is clear that the introduction of an electron-donating
group attached to the nitrene does has a strong effect on the reactivity of the copper-nitrene
complexes. The observed reactivity trend of Cu-4-Sc is the inverse of that obtained for the species
where the nitrene is attached to an electron-withdrawing group such as the sulfonyl group
(Cu-X-Sc, X=1,2,3). The explanation for the observed reactivity patterns, however, is not
straightforward. A deeper study of the electronic states and reaction mechanisms of this set of
complexes is necessary to obtain a better insight into the role of copper nitrenes and their scandium
adducts as reactive intermediates.
4.3 Conclusions
Terminal copper nitrenes and their Lewis acid adducts were studied using the system
Cu-1-Sc[22] as a reference. The effects of changing the Lewis acid M were studied. It was found that
in the stabilization of the copper-tosylnitrene intermediate via its interaction with an external redox
non-innocent metal ion, the nature of M affected the yield of the formal Cu(III) species formed; a
higher yield is obtained when a stronger Lewis acid is used. This behavior is consistent with the
proposed model in which the binding of the external Lewis acids helps to reduce the hydrogen atom
abstraction ability of the transient copper-nitrene intermediate, thereby preventing its spontaneous

137
decay to the copper(II)-amide species. Interestingly, however, the electronic structures of the
Cu-1-M complexes were found to be independent of the nature of the Lewis-acidic metal ions.
Similarly, the metal ions proved to have no influence on the reactivity of the Cu-1-M complexes
since near-identical rates were obtained for PPh3 when different Lewis acids were employed. This
indicated the presence of a common reactive intermediate in the reactions of Cu-1-M complexes
with PPh3.
The use of different nitrene sources in the form of iminoiodinane-derivatives with internal
electron-withdrawing groups allowed us to trap four new intermediates: Cu-2-Sc, Cu-3-Sc, Cu-2
and Cu-3. For the first time, we had access to terminal copper nitrenes isolated both as free species,
Cu-2 and Cu-3, and as their scandium adducts, Cu-2-Sc and Cu-3-Sc, in the same conditions. The
reactivity of the intermediates revealed the occurrence of an equilibrium in solution between the
Lewis acid adducts and the free species, the latter being responsible for reactivity, thus proving the
existence of a common reactive intermediate as proposed with the series of Cu-1-M complexes.
Finally, the use of mesityl azide as the nitrene source allowed the trapping and
characterization of another terminal copper-nitrene scandium adduct Cu-4-Sc. It was observed that
the introduction of an electron-withdrawing group attached to the nitrene has an effect on the
reactivity of this class of complexes. A contrasting reactivity pattern was observed when comparing
the reaction rates obtained for the Cu-4-Sc complex with those of the related Cu-X-Sc (X=1,2,3),
where the former is more reactive in NT reactions while the latter are more reactive in HAA
reactions. More studies are necessary to properly explain this trend.
4.4 References
[1] R. Hili, A. K. Yudin, Nat. Chem. Biol. 2006, 2, 284–287.
[2] A. Ricci, Amino Group Chemistry: From Synthesis to the Life Sciences, 1st Ed., Wiley-VCH Verlag GmbH & Co. KGaA, 2007.
[3] K. Shin, H. Kim, S. Chang, Acc. Chem. Res. 2015, 48, 1040–1052.
[4] J. W. W. Chang, T. M. U. Ton, P. W. H. Chan, Chem. Rec. 2011, 11, 331–357.
[5] D. N. Zalatan, J. Du Bois, Top. Curr. Chem. 2010, 292, 347–378.
[6] H. Kwart, A. A. Kahn, J. Am. Chem. Soc. 1967, 89, 1950–1951.
[7] R. T. Gephart, T. H. Warren, Organometallics 2012, 31, 7728–7752.
[8] Z. Li, R. W. Quan, E. N. Jacobsen, J. Am. Chem. Soc. 1995, 117, 5889–5890.
[9] A. N. Vedernikov, K. G. Caulton, Chem. Commun. 2004, 162–163.
138
[10] X. Dai, P. Kapoor, T. H. Warren, J. Am. Chem. Soc. 2004, 126, 4798–4799.
[11] E. Kogut, H. L. Wiencko, L. Zhang, D. E. Cordeau, T. H. Warren, J. Am. Chem. Soc. 2005, 127, 11248–11249.
[12] Y. M. Badiei, A. Krishnaswamy, M. M. Melzer, T. H. Warren, J. Am. Chem. Soc. 2006, 128, 15056–15057.
[13] Y. M. Badiei, A. Dinescu, X. Dai, R. M. Palomino, F. W. Heinemann, T. R. Cundari, T. H. Warren, Angew. Chem. Int. Ed. 2008, 47, 9961–9964.
[14] F. Dielmann, D. M. Andrada, G. Frenking, G. Bertrand, J. Am. Chem. Soc. 2014, 136, 3800–3802.
[15] T. Corona, L. Ribas, M. Rovira, E. R. Farquhar, X. Ribas, K. Ray, A. Company, Angew. Chem. Int. ed. 2016, 128, 14211–14214.
[16] P. Brandt, M. J. So, P. G. Andersson, P.-O. Norrby, J. Am. Chem. Soc. 2000, 122, 8013–8020.
[17] T. R. Cundari, A. Dinescu, A. B. Kazi, Inorg. Chem. 2008, 47, 10067–72.
[18] P. Comba, C. Lang, C. L. De Laorden, A. Muruganantham, G. Rajaraman, H. Wadepohl, M. Zajaczkowski, Chem. - A Eur. J. 2008, 14, 5313–5328.
[19] S. M. Tekarli, T. G. Williams, T. R. Cundari, J. Chem. Theory Comput. 2009, 5, 2959–2966.
[20] D. N. Barman, P. Liu, K. N. Houk, K. M. Nicholas, Organometallics 2010, 29, 3404–3412.
[21] L. Maestre, W. M. C. Sameera, M. M. Díaz-Requejo, F. Maseras, P. J. Pérez, J. Am. Chem. Soc. 2013, 135, 1338–1348.
[22] S. Kundu, E. Miceli, E. Farquhar, F. F. Pfaff, U. Kuhlmann, P. Hildebrandt, B. Braun, C. Greco, K. Ray, J. Am. Chem. Soc. 2012, 134, 14710–14713.
[23] S. Fukuzumi, K. Ohkubo, J. Am. Chem. Soc. 2002, 124, 10270–1.
[24] S. Kundu, PhD Thesis: Synthesis, Spectroscopic Characterization and Reactivity of the High-Valent Metal-Oxo/Imido Cores of the Late Transition Metals, Humboldt-Universität Zu Berlin, Berlin, 2013.
[25] S. Fukuzumi, Y. Morimoto, H. Kotani, P. Naumov, Y.-M. Lee, W. Nam, Nat. Chem. 2010, 2, 756–759.
[26] J. L. Dubois, P. Mukherjee, T. D. P. Stack, B. Hedman, E. I. Solomon, K. O. Hodgson, S. U. V, S. Radiation, R. V August, J. Am. Chem. Soc. 2000, 122, 5775–5787.
[27] Y.-R. Luo, Comprehensive Handbook of Chemical Bond Energies, CRC Press, Boca Raton, Florida, 2007.
[28] S.-L. Abram, Diplomarbeit: Stabilizierung von Kupfer-Nitreneinheiten Zur C-H-Bindungsaktivierung, Berlin, 2013.
[29] S.-L. Abram, I. Monte-Pérez, F. F. Pfaff, E. R. Farquhar, K. Ray, Chem. Commun. 2014, 50, 9852–4.

139
[30] E. Lieber, C. N. R. Rao, T. S. Chao, C. W. W. Hoffman, Anal. Chem. 1957, 29, 916–918.
[31] L. Kau, D. J. Spira-Solomon, J. E. Penner-Hahn, K. O. Hodgson, E. I. Solomon, J. Am. Chem. Soc. 1987, 109, 6433–6442.
[32] N. P. Mankad, W. E. Antholine, R. K. Szilagyi, J. C. Peters, J. Am. Chem. Soc. 2009, 131, 3878–80.
[33] S. Kundu, F. F. Pfaff, E. Miceli, I. Zaharieva, C. Herwig, S. Yao, E. R. Farquhar, U. Kuhlmann, E. Bill, P. Hildebrandt, H. Dau, M. Driess, C. Limberg, K. Ray, Angew. Chem. Int. Ed. 2013, 52, 5622–5626.

140

Chapter 5:
Conclusions and outlook

142
High-valent metal-oxo, -peroxo and -nitrene cores of middle to late transition metals like
iron, cobalt, nickel and copper have been proposed as vital intermediates in a number of
fundamental biological and technologically attractive transformations like C−H bond oxidation,
aziridination, epoxidation and dioxygen reduction. The isolation and characterization of these
intermediates can provide a lot of information about the reaction mechanisms and is therefore
helpful in designing new and improved catalysts. This Thesis has explored the chemistry of high-
valent intermediates ranging from oxoiron(IV) complexes and bridging µ-peroxo dicobalt(III)
systems to copper-nitrene cores. Detailed spectroscopic, theoretical and reactivity studies have been
performed to reveal the correlations between the electronic structure and reactivity patterns of these
highly relevant intermediates. The principal outcomes and outlook of this work are discussed
below.
Chapter 2
The chemistry of a new oxoiron(IV) intermediate, Fe-2, was investigated with the aim of
evaluating the effect of weaker ligand-field environments in oxoiron(IV) systems. Fe-2 is supported
in the TMCO ligand, which is analogous to the known TMC one, but in this ligand one of the
nitrogen donors has been replaced by an oxygen one. The TMCO ligand was employed to generate
a high-spin Fe(II) complex Fe-1 that reacted with sPhIO at −90 °C in dichloromethane to generate
Fe-2. The iron center in Fe-2 is in a Fe(IV) oxidation state, as proved by Möβbauer and XAS
studies, and has an S = 1 ground state, determined from magnetic Möβbauer studies.
Fe-2 proved to be highly reactive in C−H bond activation and group transfer reactions, in
contrast with Fe-TMC, which shows poor oxidative reactivity. Four factors were detected that
might account for the higher reactivity of Fe-2 in comparison with Fe-TMC:
1. Fe-2 has a smaller gap than Fe-TMC between the triplet and quintet electronic state, as was
proved by magnetic Möβbauer studies. The quintet state is known to be the most active
electronic state in oxoiron(IV) complexes.
2. Fe-2 might have a more exposed Fe=O core through the site occupied by the oxygen donor
of the ligand, which would facilitate the approach of the substrate.
3. The oxygen donor of the TMCO ligand in Fe-2 might be able to de-coordinate from the
iron center in solution, thus leaving more space for the substrate to approach the active
center.
4. The asymmetry of the TMCO ligand might have a role in the increase in reactivity in Fe-2.
This was revealed by comparing the reactivity of the Fe-TMC and Fe-4d complexes, which
143
have identical backbone structures but one nitrogen donor in the former has been replaced
by an oxygen one in the latter.
The results obtained here prove that exchanging one nitrogen donor for an oxygen one does
have an important impact on the reactivity of the oxoiron(IV) complexes, making them more
reactive. This could be a starting point for further studies on oxoiron complexes with ligand systems
analogous to TMCO but with two, three, or four oxygen donors.
Chapter 3
The previously reported hexanuclear cobalt complex Co-L6 was further studied in this
Thesis with the aim of deepening our knowledge of the reactivity of multinuclear systems, and
particularly, to be able to compare it with the best known Fe-L6 complex. The cobalt(II) centers in
Co-L6 are in an S = 3/2 ground state with no interaction between them. Each cobalt center is in a
trigonal bipyramidal geometry with two triflate ions coordinated to it.
Co-L6 was found to be capable of catalytically reducing O2. Interestingly, the mechanism of
the O2 reduction reaction catalyzed by Co-L6 is temperature-dependent. At 25 °C the two-electron
reduction to H2O2 takes place, while at −50 °C the four-electron reduction to H2O occurs. Co-L6 is a
better catalyst for the four-electron reduction of O2, showing a turnover number TON2000s of 64,
four times larger than the TON2000s for the two-electron process with the same catalyst. The four-
electron reduction of O2 to H2O proceeds through a rate-determining PCET step while the rate-
determining step of the two-electron O2 reduction involves the four reacting species. The details of
the reduction mechanisms are, however, still open to discussion.
The intermediate Co-1, generated at 25 °C from the reaction of Co-L6 with O2, is active
both in nucleophilic as well as in electrophilic transformations. The nucleophilic and electrophilic
natures of Co-1 were originally attributed to the bridging µ-peroxo-dicobalt(III) (spectroscopically
characterized) and the oxocobalt(IV) complex (suggested to be formed in solution from the O−O
bond homolysis of the peroxo intermediate) respectively. However, from the obtained KIE and the
results in H218O exchange experiments, it was determined that the electrophilic nature of Co-1 is
also attributable to the peroxo complex. This is an exciting result since peroxo-complexes active in
electrophilic transformations have not typically been detected in model chemistry although they
have been proposed in biological systems.
The observed reactivity of the complex Co-L6 is in sharp contrast with that reported for
Fe-L6. While Fe-L6 was capable of performing the O−O bond formation reaction, Co-L6 catalyzed
144
the O−O bond breaking reaction in the four-electron O2 reduction to H2O. This proves that varying
the metal center in the same ligand structure can lead to different reactivity patterns. The results
obtained here also prove that multinuclear systems have great potential as catalysts and show
interesting and exceptional reactivity trends. Further studies involving other metals such as copper,
in similar ligand environments, would be of great interest, since copper complexes are known to be
good catalysts in the O2 reduction reaction and have potential applications in devices such as fuel
cells where the O−O bond formation and cleavage reactions are of great importance. Other types of
multinuclear ligands could also lead to interesting results in catalytic transformations and their
applications, particularly ligands that do not contain tin in their structures since this element
complicates the characterization of the ligand, complexes and intermediates due to its large atomic
weight.
Chapter 4
As a continuation of the studies on the scandium adduct of the copper(II)-tosylimidyl
radical Cu-1-Sc, the first isolated copper-nitrene complex, we have expanded our knowledge of this
family of compounds by studying the effect of the Lewis acid (M) and the nitrene source in the
generation, structure and reactivity of terminal copper nitrenes and their Lewis acid adducts.
Three different effects were found in the stabilization of the copper-tosylnitrene intermediate
via its interaction with external redox non-innocent metal ions (M):
1. The nature of M affects the yield of the formal Cu(III) species formed, as a higher yield is
obtained when a stronger Lewis acid is used.
2. The electronic structures of the Cu-1-M complexes are independent of the nature of the
Lewis-acidic metal ions employed. In all cases they can be described as copper(II) imidyl
radicals [CuII(NTs●)]+.
3. The reactivity of the Cu-1-M complexes is unaffected by M.
It is proposed that the role of the external Lewis acid M in the stabilization of Cu-1-M
complexes is the reduction of the strong electronic repulsion between the electron-rich nitrogen and
copper atoms. In this manner, M reduces the hydrogen atom abstraction ability of the
[(AN)CuII(NTs●)]+ core, preventing its spontaneous decay to the copper(II)-amide species.
However, M has been proven to have no significant effect on the copper-nitrene [(AN)CuII(NTs●)]+
structure. On the other hand, the independence of the reactivity of Cu-1-M with the M employed

145
suggested the presence of a common reactive intermediate in the reactions of Cu-1-M complexes
with substrates.
The effect of changing the nitrene source was also studied. Four new intermediates
Cu-2-M, Cu-3-M, Cu-2 and Cu-3 were isolated by using different nitrene sources in the form of
iminoiodinane-derivatives with internal electron-withdrawing groups. For the first time, we have
access to two terminal copper-nitrenes both isolated as free species, Cu-2 and Cu-3, and as their
Lewis acid adducts, Cu-2-M and Cu-3-M. All the studied species both with and without M are two
oxidation states above Cu(I) and can be described as copper(II) imidyl radicals [CuII(NR●)]+. The
reactivity of the intermediates revealed the occurrence of an equilibrium in solution between the
Lewis acid adducts and the free species, with the latter being responsible for reactivity, thus proving
the existence of a common reactive intermediate as proposed with the series of Cu-1-M complexes.
Finally, the use of mesityl azide as the nitrene source allowed the trapping and
characterization of another terminal copper-nitrene scandium adduct Cu-4-Sc, this time with an
electron-donating group (mesityl), in contrast to the previously discussed complexes. The complex
Cu-4-Sc is also two oxidation states above Cu(I) but its structure could not be determined by XAS.
A contrasting reactivity pattern was observed when comparing the reaction rates obtained for the
Cu-4-Sc complex with those of the related Cu-X-Sc (X=1,2,3) complexes, as the former is more
reactive in NT reactions while the latter are more reactive in HAA reactions. However, more
mechanistic studies are necessary to explain this interesting trend.
There is a lot yet to be explored in the field of copper nitrenes. This is a young field of
research and more studies are necessary, with different nitrene sources, Lewis acids and ligand
systems to generate a larger database and elucidate general trends in copper-nitrene chemistry and
reactivity. Besides the interest that copper-nitrenes have per se, understanding the reactivity patterns
of this species can also provide detailed insights into the chemical properties of the as yet non-
isolated copper-oxo [CuO]+ core, which is isoelectronic to copper nitrenes.

146

Chapter 6:
Equipment and experimental work

148
6.1 General techniques and chemicals employed
All studies and measurements were performed in the Institut für Chemie at the Humboldt
Universität zu Berlin, unless otherwise stated. All the chemicals employed were purchased from the
companies: SIGMA-ALDRICH, ABCR, ACROS and TCI and used without further purification unless
required. Anhydrous solvents were purchased from CARL-ROTH GMBH under the tradename
ROTIDRY (> 99.5%, < 50 ppm H2O) and degassed before use. Deuterated solvents were purchased
from EURISO-TOP.
Compounds sensitive to air or water were prepared and handled under inert atmosphere
using either Schleck techniques or a glovebox OMNI-LAB 2 from the company VACATMOSPHERES
filled with N2, with concentration of O2 and moisture of less than 1 ppm. Gases (N2 and Ar) of
quality 5.0 were used for this purpose and were purchased from AIR LIQUIDE.
Before use, the glassware was set in the oven and then treated with a heat-gun under
vacuum. The glassware employed was cleaned in a KOH/isopropanol bath and then treated in an
HCl bath for neutralization.
6.2 Analytical techniques
Every analytical sample of air- or water-sensitive compounds was prepared in the glove box
under inert atmosphere.
6.2.1. Elemental analysis
All elemental analyses were performed by the analytical service of the Institut für Chemie
of the Humboldt Universität zu Berlin. The percentages of Carbon, Hydrogen, Nitrogen and
Sulphur were determined using a EURO EA 3000 analyzer from the firma HEKATECH. The reported
values are the result of an average of two independent measurements except for sample containing
Fluorine, when only one measurement was performed.
6.2.2. Nuclear magnetic resonance spectroscopy (NMR)
The NMR measurements were performed at 27 °C using a spectrometer AV 400 or a
spectrometer DPX 300 from the company BRUKER unless otherwise stated. Samples were measured
in NMR tubes with 5 mm of diameter. The chemical shifts (δ) are reported in ppm relative to
tetramethylsilane and the residual proton signal of the deuterated solvents was employed as an
internal standard [for 1H-NMR: δ (ppm): CDCl3 7.26; CD2Cl2 5.30; (CD3)2CO 2.10; CD3CN 1.94].

149
For low temperature measurements, a BRUKER CRYOSTAT was employed to fix the temperature.
The multiplicity of the signals is indicated in the following way: s = singlet, d = doublet, t = triplet,
m = multiplet.
6.2.3. Mass spectrometry
A 6210 TOF mass spectrometer form the company AGILENT was employed for recording
electrospray ionization- time of flight- mass spectra (ESI-TOF-MS) of organic molecules and
inorganic complexes in solution; acetonitrile was used as an eluent. For thermally unstable
complexes, direct injections of the freshly thawed solution were made. The software MASSHUNTER
QUALITATIVE ANALYSIS version B.02.00 from the company AGILENT was employed for the
visualization and handling of the spectra. Expected mass spectra (m/z values and isotopic
distribution patterns) were calculated with the program MOLECULAR WEIGHT CALCULATOR version
6.48.0.1 from the author MATTHEW MONROE.
6.2.4. Infrared spectroscopy (IR)
IR spectra were measured on a FTIR 8400S Fourier-transform infrared spectrometer from
the company SHIMADZU in the range from 4000 to 400 cm-1 with a resolution of 2 cm-1. For these
measurements, a KBr pellet of the powder sample was prepared. Attenuated total reflectance
infrared spectroscopy (ATR-IR) was also employed, using a BRUKER-ALPHA FT-IR
spectrophotometer. For these measurements, the sample was placed in the ATR unit under inert
atmosphere either as a solid or in a solution, in which case, the solvent was let to evaporate to
measure the desired IR spectra. The intensities of the obtained vibrational bands here reported are
abbreviated in the following way: s = strong, m = medium, w = weak, br = broad.
6.2.5. UV-vis absorption spectroscopy
The UV-vis absorption spectra were obtained with an AGILENT 8453 diode array
spectrometer. The measurements were performed using 10 mm and 5 mm precision cuvettes from
SUPRASIL® quartz. The temperature for the measurements was set with a cryostat USP-203-A from
the company UNISOCU SCIENTIFIC INTSRUMENTS. The software UV-VISIBLE CHEMSTATION from
the company AGILENT was employed for the recording and workup of the spectra and kinetic data.
In a typical UV-vis experiment, a stock solution with a known concentration of the complex
was prepared inside the glovebox using anhydrous solvents; 2 mL of this stock solution were placed
in a quartz cuvette that was later closed with a septum inside the glovebox. The cuvette was then

150
placed in the cryostat connected to the UV-vis spectrometer, which was set beforehand at the
desired temperature. Once thermal equilibrium was achieved between the cryostat and the cuvette,
the solution of the next reactant (i.e. oxidant/substrate) in a minimum amount of anhydrous solvent
was injected into the cuvette trough the septum and the reaction was monitored following the
UV-vis spectral changes.
The molar-extinction coefficient (εmax) corresponding to a particular absorption maxima
(λmax) here reported, are the result of several individual measurements. The half-life (t1/2) of a given
species was determined form the time traces of the decay of its characteristic UV-vis band at a fixed
temperature. The kinetics of the reaction of a given species with a substrate were also determined
from the fitting of time traces of the decay of its characteristic band. The values thus obtained were
employed for the determination of the system’s rate constants.
6.2.6. Gas chromatography coupled to mass spectrometry (GC-MS)
After substrate oxidation, the reaction mixtures were analyzed in a VARIAN 3800 gas
chromatograph with a flame ionization detector and a VARIAN 4000 mass detector, all from the
company AGILENT. An auto-sampler VARIAN CP-8400 and an injector VARIAN 1079 were
employed for the injection of the sample to the instrument. Before the analysis, the reaction mixture
was passed through silica gel and eluted with ethyl acetate to remove the metal complex. The
resulting ethyl-acetate solutions were then analyzed with GC-MS. The products of the reactivity
studies were identified by comparing the obtained retention times with the retention times of the
pure compounds.
6.2.7. X-Ray diffraction crystallography (XRD)
The crystal structure of the complex Fe-1 was determined in collaboration with Dr. Fabian
Schax. Data collection was performed at 100 K on a STOE IPDS 2T diffractometer by using Mo-Kα
radiation (λ = 0.71073 Å). The radiation source was a sealed tube generator with graphite
monochromator. Multi-scan (PLATON) absorption corrections were applied. The structure was
solved by direct methods (SHELXS-97) and refined by full matrix least-squares procedures based
on F2 with all measured reflections (SHELXL-97). All non-hydrogen atoms were refined
anisotropically. Hydrogen atoms were introduced in their idealized positions and refined as riding
model.
151
6.2.8. Electron paramagnetic resonance spectroscopy (EPR)
For recording X-Band EPR derivative spectra, the samples were placed in quartz tubes with 3
mm internal diameter. The spectra were simulated with the program GIFT (from the author Dr.
Eckhard Bill). The measurements were performed using different instruments in the following
locations:
a) Max-Planck-Institut für Chemische Energiekonversion (MPI CEC)
In cooperation with Dr. Eckhard Bill, X‐Band EPR derivative spectra were recorded on an
ELEXSYS E500 spectrometer from the company BRUKER, equipped with the dual mode cavity
(ER4116DM from BRUKER) and a Helium flow cryostat (ESR 910 from OXFORD INSTRUMENTS).
Microwave frequencies were calibrated with a frequency counter (HP5352B) from HEWLETT-
PACKARD, and field control was calibrated with a NMR probe (ER035M) from BRUKER.
b) Helmholtz-Zentrum Berlin für Materialien und Energie GmbH
In cooperation with Dr. Alexander Schnegg from the Institut für Silizium-Photovoltaik, X-Band
EPR spectra were recorded in an ESP 300 spectrometer from the company BRUKER, equipped with
a TE011 SUPER HIGH Q microwave resonator. In this set-up, the samples were cooled down to 77 K
with a dewar for liquid nitrogen.
c) University of Michigan
In cooperation with Prof. Dr. Nicolai Lehnert from the University of Michigan, X-Band spectra
were recorded on a BRUKER X-BAND EMX spectrometer equipped with OXFORD INSTRUMENTS
liquid nitrogen and helium cryostats. EPR spectra were obtained on frozen solutions using ~20 mW
microwave power and 100 kHz field modulation with the amplitude set to 1 G.
6.2.9. Resonance Raman (rR) spectroscopy
For performing rR measurements the sample was placed in NMR tubes with an internal
diameter of 5 mm. rRaman spectra were obtained in cooperation with the group of Prof. Dr. Peter
Hildebrandt from the Technische Universität Berlin using a LABRAM HR 800 confocal Raman
spectrometer from the company HORIBA JOBIN-YVON with a detector SYMPHONY II CCD from the
company HOROIBA. Kr+ or Ar + lasers INNOVA 400 from the company COHERENT in different
wavelengths were employed. A cryostat R 495 from BRUKER was employed to cool down the
samples.

152
6.2.10. Möβbauer spectroscopy
Möβbauer spectra of Fe-1 and Fe-2 in the absence of magnetic field were recorded on a
SEECO MS6 spectrometer that comprises the following instruments: a JANIS CCS-850 cryostat,
including a CTI-CRYOGENICS closed cycle 10 K refrigerator, and a CTI-CRYOGENICS 8200 helium
compressor. The cold head and sample mount are equipped with calibrated DT-670-Cu-1.4L silicon
diode temperature probes and heaters. Temperature is controlled by a LAKESHORE 335 temperature
controller. Spectra are recorded using a LND-45431 Kr gas proportional counter with beryllium
window connected to the SEECO W204 γ-ray spectrometer that includes a high voltage supply, a 10
bit and 5 µs ADC and two single channel analyzers. Motor control and recording of spectra is taken
care of by the W304 resonant γ-ray spectrometer. For the reported spectra a RIVERTEC MCO7.114
source (57Co in Rh matrix) with an activity of about 1 GBq was used.
The spectrum of Fe-1 was recorded in a plastic sample holder with about 50 mg of the solid
sample at 12 K and data was accumulated for about 24 hours. The spectrum of Fe-2, on the other
hand, was recorded from a propionitrile solution with 12% dichloromethane of the 57Fe enriched 57Fe-2 generated in-situ at -90 °C (see Chapter 2). A plastic sample holder was employed and the
measurement was performed at 13 K with data accumulation of about 24 hours. Mößbauer data was
processed and simulated using the WMOSS4 program (www.wmoss.org). Isomeric shifts are
referenced to α-iron at room temperature.
Magnetic Möβbauer spectra of Fe-2 were recorded in collaboration with Dr. Eckhard Bill
(MPI CEC) on a conventional spectrometer with alternating constant acceleration of the γ-source.
The minimum experimental line width was 0.24 mm/s (full width at half-height). The sample
temperature was maintained constant in an OXFORD INSTRUMENTS VARIOX or in an OXFORD
INSTRUMENTS MÖβBAUER-SPECTROMAG. The latter is a split-pair super-conducting magnet system
for applied fields up to 8 T where the temperature of the sample can be varied in the range 1.5 K to
250 K. The field at the sample is perpendicular to the γ-beam. The 57Co/Rh source (1.8 GBq) was
positioned at room temperature inside the gap of the magnet system at a zero-field position, by
using a re-entrant bore. Isomer shifts are quoted relative to iron metal at 300 K. Magnetic Möβbauer
spectra were simulated with the program MX (by Eckhard Bill) by diagonalization of the spin
Hamiltonian for S = 2:
Ĥ = gβS·B + D[Sz2-S(S+1)/3] + E/D[Sx
2-Sy2]
153
where g is the average electronic g value, and D and E/D are the axial zero-field splitting and
rhombicity. The hyperfine interaction for 57Fe was calculated by using the usual nuclear
Hamiltonian.[1]
6.2.11. X-ray absorption spectroscopy (XAS)
X-ray absorption spectroscopy was performed in collaboration with Dr. Erik R. Farquhar. The
measurements were performed in the following facilities:
a) Stanford Synchrotron Radiation Lightsource
X-Ray absorption spectroscopy of Fe-1, Fe-2, Cu-1-Eu, Cu-3 and Cu-3-Y was carried out on
the Stanford Synchrotron Radiation Lightsource (SSRL, Menlo Park, California) beamline (BL) 7-
3 with SPEAR3 operating at 3 GeV and 500 mA in top-off mode throughout data collection. The
BL 7-3 was equipped with a Rh coated collimating mirror followed by a cryogenically cooled
Si(220) double crystal monochromator. The collimating mirror angle was set to 9 and 12 keV
cutoffs for Fe and Cu K-edge measurements, respectively. Consequently, the monochromator was
operated in the fully tuned configuration. Samples were kept at 10-15 K using an OXFORD LHE
cryostat. XAS spectra were obtained with a “28” element solid-state germanium fluorescence
detector (~20 working elements). A photodiode placed before I0 and connected to I2 was used to
obtain a metal foil reference via scattering (reference is therefore I0/I2); copper and iron foils were
used as appropriate.
Data was generally obtained on 0.95mm x 4-6mm (vertical x horizontal) spots. Scans were
monitored for evidence of photoreduction, and new spots with fresh sample were exposed as
needed. A 3μ Z-1 filter and Soller slits were used to eliminate scatter, and ICR values typically
ranged from 10 – 50 kcps. Data were collected with 10 eV steps before the edge (1 s integration
time), 0.3 eV steps in pre-edge and edge regions (2 s integration time), and in 0.05k steps over k =
1.62 Å-1 to 14 or 15 Å-1 (integration time increased in k2-weighted fashion from 2 to 9 sec over
range of scan). Some scans were performed with XANES parameters, using a similar k-range but
reducing integration times to 2-3 seconds in the EXAFS region.
b) National Synchrotron Lightsource
X-ray absorption spectroscopy of Cu-1-Sc and Cu-4-Sc was carried out on beamline X3B of
the National Synchrotron Lightsource (Brookhaven National Laboratory, Upton, NY, USA). A
sagitally focusing Si(111) monochromator was used for energy selection, while a cylindrically-bent
154
nickel-coated mirror located downstream of the monochromator provided vertical focusing and
harmonic rejection. Sample temperatures were maintained at approximately 20 K using a He
DISPLEX cryostat. A Cu metal foil was used for internal energy calibration, with the first inflection
point of the reference foil edge set to 8979.0 eV. XAS data were collected as fluorescence spectra
using a 31 element solid state germanium detector (Canberra), over an energy range of 8779 – 9540
eV. A Ni filter of 3 absorption lengths was used to reduce scatter and maintain detector linearity.
Samples were monitored for photoreduction during data collection (based upon red-shifts in the
absorption edge), and typically only 2 scans were collected at a given position on the sample.
Tandem Möβbauer/XAS cups with a sample window of 6 mm x 10 mm were used to provide at
least 5 independent beam spots on each sample. Averaging and normalization of the XAS data was
performed using Athena, a graphical implementation of the IFEFFIT[2] package. Reference spectra
for individual scans were carefully aligned to ensure that the energy scale was identical for all
spectra. Sets of scans at each spot were examined for photoreduction effects.
6.2.12. Magnetic Circular Dichroism (MCD)
MCD measurements on Co-L6 were performed in collaboration with the group of Prof. Dr.
Nicolai Lehnert in the University of Michigan. The MCD setup employs an OXFORD SM4000
cryostat and a JASCO J-815 CD spectrometer. The SM4000 cryostat consists of a liquid helium-
cooled superconducting magnet providing horizontal magnetic fields of 0-7 Tesla. The J-815
spectrometer uses a gaseous nitrogen-cooled xenon lamp and a detector system consisting of two
interchangeable photomultiplier tubes in the UV-vis and NIR range. The samples were loaded into a
1.5-300 K variable temperature insert (VTI), which offers optical access to the sample via four
optical windows made from Suprasil B quartz. Complete spectra were recorded at different
temperatures (2, 5, 10, and 20 K) and magnetic fields (0-7 T).
6.2.13. Superconducting quantum interference device (SQUID) susceptibility measurements
SQUID susceptibility measurements on Co-L6 were performed in collaboration with the
group of Prof. Dr. Nicolai Lehnert in the University of Michigan. The measurements were
conducted on a QUANTUM DESIGN MPMS-XL7 equipped with an EVERCOOL Dewar. Samples were
prepared as mixtures with either eicosane or silicon oil in a polycarbonate capsule. In a typical
experiment, 5 mg of sample were used. Raw magnetic data were worked up using the program julX
(designed by Dr. Eckhard Bill).
155
6.2.14. Density Functional Theory (DFT) calculations
a) DFT calculations on Fe-2, Fe-TMC, Fe-4, Cu-1-M, Cu-3 and Cu-3-Sc
The DFT calculations on Fe-2, Fe-TMC, Fe-4, Cu-1-M, Cu-3 and Cu-3-Sc were performed in
collaboration with Prof. Dr. Marcel Swart from the Universitat de Girona. All DFT calculations
were performed with the Amsterdam Density Functional (ADF) suite of program.[3,4] MOs were
expanded in an uncontracted set of Slater type orbitals[5] (STOs) of triple-ζ quality containing
diffuse functions and two sets of polarization functions (TZ2P), or a mixture of triple-ζ quality on
the metal (TZP) and double-ζ quality (DZP) on all other atoms, in both cases with one set of
polarization functions, which we dub here TDZP[5]. Core electrons (1s for 2nd period, 1s2s2p for
3rd-4th period) were not treated explicitly during the geometry optimizations (frozen core
approximation), as it was shown to have a negligible effect on the obtained geometries.[6] An
auxiliary set of s, p, d, f, and g STOs was used to fit the molecular density and to represent the
Coulomb and exchange potentials accurately for each SCF cycle.
Geometries were optimized with the QUILD program[7] which uses superior optimization
routines based on adapted delocalized coordinates[8] until the maximum gradient component was
less than 10-4 a.u. This computational setup was shown to work well for transition-metal
complexes.[9] The starting point for geometry optimizations were structures obtained from X-ray
diffraction analysis. Energies and gradients were calculated using the BP86 functional[10,11] and the
TDZP basis set with inclusion of Grimme’s dispersion (D3) correction.[12] Subsequent single point
calculations for obtaining spin-state splittings have been performed on all optimized geometries,
with the S12g functional[13] and the all-electron electron TZ2P basis set. The UV-Vis spectra were
obtained in separate single-point calculations using the SAOP[14] model potential with the all-
electron TZ2P basis set.
In all cases the COSMO[15–17] dielectric continuum model has been included for implicit
treatment of the environment (using dichloromethane as a solvent),[18,19] and scalar relativistic
corrections have been included self-consistently by using the zeroth-order regular approximation
(ZORA).[20–22]
b) DFT calculations on Co-L6
The DFT calculations on Co-L6 were performed in collaboration with Dr. Nicolai Lehnert and
Casey van Stappen from the University of Michigan. The initial geometry of the complex Co-L6 in
the conformation A was generated using the optimized complementing Fe(II) model generated by
156
Kundu and co-workers,[23] which derives from an annotation of the crystallographically determined
structure of the hexanuclear iron stannoxane complex utilizing the 4-(1,3-bis(pyridin-2-
ylmethyl)imidazolidin-2-yl)benzoic acid (L6) ligand. This model involves the complexation of
Co(II) with one arm of the stannoxane core. Additionally, the model complexes B and C were
generated by the direct coordination of one and two molecules of triflate to the first coordination
sphere of Co(II) respectively. The molecular structures of the model complexes A, B, and C were
optimized using Becke’s three-parameter hybrid exchange functional[24] with the Lee-Yang-Parr
non-local correlation functional[25] (B3LYP) using an unrestricted formalism. A multi-basis set
approach[26] was taken , utilizing Alrich’s triple-ζ valence polarized (TZVP)[27] basis for treatment
of Co, while a 6-311G(d) basis set[28] was used for all C, N, and O atoms, and H was treated with
the smaller 6-31G basis[29] in both DFT and TDDFT calculations. Optimizations were performed
using the Polarization Continuum Model (PCM) with toluene as solvent. Frequency calculations
were performed to confirm optimized geometries. Optimization, frequency, and single point energy
calculations of all complexes were carried out on the Linux version of the Gaussian09 program.[30]
Additionally, single point energy and TDDFT calculations were performed using the Linux version
of ORCA 3.0.2,[31] which utilizes the libint2 library for two electron integral calculations.[32] The
first 50 vertical excitation energies were calculated by TDDFT for model complexes A, B, and C.
c) DFT calculations on Cu-4-Sc
The DFT calculations on Cu-4-Sc were performed in collaboration with Dr. Florian Pfaff using
the ORCA[33] package. The structure was optimized using the BP86 exchange functional[11,10] and
Default-Basis-2,3,4[34-37] increasing stepwise for the optimization process. The Default-Basis set 2
and higher include the Ahlrichs polarization functions, which were obtained from the TURBOMOLE
BASIS set library under ftp.chemie.uni-karlsruhe.de/pub/basen. All calculations include the COSMO
solvation model with the built-in parameters for dichloromethane and empirical dispersion
correction using the Becke-Johnson damping.[12,38]
6.3. Syntheses of compounds and generation of intermediates
6.3.1. Synthesis of the ligands TMCO and TMCO-d
The TMCO and TMCO-d ligands were synthesized making small modifications on
previously reported synthetic pathways.[39–41]

157
Synthesis of N,N’,N’’-tritosylbis(3-aminopropyl)amine
This synthesis was performed with small modifications on a previously reported
procedure.[40] 3,3’-diaminodipropylamine (3.28 g, 25 mmol) and NaOH (3.6 g, 90 mmol) were
dissolved in 20 mL H2O inside a three-necked round bottom flask placed in a water bath. The
reaction mixture was stirred for some minutes until the NaOH was completely dissolved. A solution
of p-toluensulfonyl chloride (14.6 g, 76 mmol) in CH2Cl2 was then added dropwise with vigorous
stirring over 1 hour. The resultant reaction mixture was stirred at room temperature for 2 more
hours and left standing over night when two layers were formed. The CH2Cl2 layer was separated
from the aqueous one, washed with H2O (3 x 20 mL) and dried over MgSO4. The solvent was
removed and the resulting solid was dried under vacuum. N,N’,N’’-tritosylbis(3-aminopropyl)amine
was collected as a colorless glassy solid. Yield: 13.12 g (22.5 mmol, 90%).
1H NMR (CDCl3, 400 MHz): δ [ppm] = 7.71-7.59 (m, 6H, Ar-H), 7.28-7.26 (m, 6H, Ar-H), 3.07 (t,
4H, N-CH2), 2.92 (m, 4H, N-CH2), 2.39 (s, 9H, CH3), 1.68 (m, 4H, CH2-CH2-CH2).
ESI-MS (+): m/z = 616.159 [C27H35N3O6S3+Na]+ (calculated= 616.160).
Synthesis of 4,8,12-Tritosyl-1-oxa-4,8,12-triazacyclotetradecane
This synthesis was performed making small modifications on a previously reported
procedure.[41] In a N2 atmosphere, N,N’,N’’-tritosylbis(3-aminopropyl)-amine (2.37 g, 4 mmol) and
Cs2CO3 (3.26 g, 10 mmol) were mixed in 60 mL of dimethylformamide (DMF). A white suspension
was formed and it was stirred for an hour. A solution of diethyleneglycol-ditosylate (1.66 g,
4 mmol) in 20 mL of DMF was then added dropwise over 5 hours. The cloudy white solution was
stirred for 3 days in an inert atmosphere. After this time, the reaction mixture was opened to air, and
ice (around 50 mL) was added slowly while stirring. Once the ice was almost fully melted, the
reaction mixture was left in the fridge overnight. The white precipitate thus formed, was filtered and
dried under vacuum. The protected macrocycle, 4,8,12-tritosyl-1-oxa-4,8,12-triazacyclotetradecane,
was obtained as a white solid. Yield: 2.44 g (3.7 mmol, 92%).
1H NMR (CDCl3, 400 MHz): δ [ppm] = 7.65-7.63 (d, 6H, H-Ar), 7.29-7.27 (d, 6H, H-Ar), 3.61-
3.58 (t, 4H, O-CH2), 3.22 -2.89 (m, 12H, CH2), 2.39 (s, 9H, CH3), 2.01 (q, 4H, CH2-CH2-CH2).
ESI-MS: (+): m/z = 664.220 [C31H41N3O7S3+H]+ (calculated= 664.218)

158
Synthesis of 1-oxa-4,8,12-triazacyclotetradecane
This synthesis was performed making small modifications on a previously reported
procedure.[41] 4,8,12-tritosyl-1-oxa-4,8,12-triazacyclotetradecane (2.44 g, 3.7 mmol) and HBr 30%
in acetic acid (70 mL) were refluxed under inert conditions for 48 hrs. After this time, a white
precipitate was formed. It was filtered with a small pore frit, washed with cold acetone and dried
under vacuum. The HBr salt of 1-oxa-4,8,12-triazacyclotetradecane was obtained as a white
powder. Yield: 1.00 g (2.3 mmol, 63 %).
1H NMR (D2O, 400 MHz): δ [ppm] = 1.71 (q, 4H, CH2-CH2-CH2), 2.68 (t, 8H, CH2-CH2-CH2),
2.75 (t, 4H, N-CH2-CH2), 3.65 (t, 4H, CH2-CH2-O).
Synthesis of 4,8,12-trimethyl-1-oxa-4,8,12-triazacyclotetradecane (TMCO)
This synthesis was performed making small modifications on a previously reported
procedure.[39] The HBr salt of 1-oxa-4,8,12-triazacyclotetradecane (0.95 g, 4.5 mmol) was refluxed
with formic acid (4.8 mL), formaldehyde (4 mL) and water (0.5 mL) for 24 hrs. After this time, the
clear solution was transferred to a beaker, put in an ice bath, and treated with NaOH (7.5 M) until
pH > 12.0. The reaction mixture was then extracted with chloroform (5 x 10 mL). The organic
phase was dried with Na2SO4 and the solvent was removed. The TMCO ligand was obtained as a
yellow oil. Yield: 530 mg (2.2 mmol, 50%).
1H NMR (CDCl3, 400 MHz): δ [ppm] = 1.6 (q, 4H, CH2-CH2-CH2), 2.18 (s, 3H, N-CH3), 2.24 (s,
6H, N-CH3), 2.39 (t, 4H, N-CH2-CH2-O), 2.53-2.59 (m, 8H, CH2-CH2-CH2), 3.55 (t, 4H, O-CH2-
CH2-N).
ESI-MS (+): m/z = 244.242 [C13H29N3O+H]+ (calculated= 244.239).
Synthesis of the Ligand TMCO-d
For the synthesis of the deuterated version of the ligand TMCO, the HBr salt of 1-oxa-
4,8,12-triazacyclotetradecane (0.95 g, 4.5 mmol) was refluxed with formic acid-d2 (4.8 mL),
formaldehyde-d2 (4 mL) and D2O (0.5 mL) for 24 hours. After this time, the clear solution was
transferred to a beaker, put in an ice bath, and treated with NaOH (7.5 M) until pH > 12.0. The
reaction mixture was then extracted with chloroform (5 x 10 mL). The organic phase was dried with
Na2SO4 and the solvent was removed. The ligand TMCO-d was obtained as a yellow oil. Yield:
580 mg (2.4 mmol, 55%).
159
ESI-MS (+): m/z = 275.279 [C13H20D9N3O+Na]+ (calculated= 275.276).
6.3.2. Synthesis of the complexes Fe-1, Fe-1d and 57Fe-1
Synthesis of the complex Fe-1
In an inert atmosphere, a solution of the TMCO ligand (100 mg, 0.4 mmol) in 2mL of dry
acetonitrile (MeCN) was added to a solution of Fe(OTf)2(MeCN)2 (174 mg, 0.4 mmol) in 2 mL of
dry MeCN. The resulting brown solution was left stirring in a N2 atmosphere for 3 days. After this
time, 10 mL of dry diethyl ether (Et2O) were added and the reaction mixture was left standing at
−20°C for one hour. After this time, a brown oil was formed in the bottom of the vial. The clear
colorless solution was carefully decanted, placed in a larger flask and more Et2O (50 mL) was
added to it. The solution was left at -40°C and overnight crystals were formed. The complex Fe-1
was obtained pure as colorless needle-like crystals (white when dry). Yield: 183 mg (0.29 mmol,
72%).
ESI-MS (+): m/z = 448.121 [C14H29F3FeN3O4S]+ = [(TMCO)Fe(OTf)]+ (calculated= 448.118).
Elemental analysis: C17H32N4O7S2F6Fe Calculated (%): C, 31.98; H, 5.05; N, 8.78. Found (%) C,
32.19; H, 5.22; N, 8.87.
EPR: silent
19F-NMR (CD2Cl2): δ [ppm] = -79 (s).
1H-NMR (CD2Cl2): paramagnetic; signals distributed in the range of 500 to -100 ppm.
Möβbauer (solid sample): High-spin Fe(II) center with isomer shift (δ’) = 1.17 mm/s and
quadrupole splitting (∆EQ) = 3.31 mm/s.
Fe K-edge XANES (CH2Cl2, 4 mM): pre-edge at 7112 eV, edge inflection point at 7123 eV.
Synthesis of the complex Fe-1d
The exact procedure for the synthesis of Fe-1 was followed, this time employing the ligand
TMCO-d instead of the ligand TMCO. The complex Fe-1d was obtained as colorless needle-like
crystals (white when dry).
ESI-MS (+): m/z = 455.181 [C14H20D9F3FeN3O4S]+ (calculated = 455.178)

160
Synthesis of the complex 57Fe-1
A 57Fe-enriched 57Fe-1 complex was necessary for performing Möβbauer studies in
solution. In order to synthesize 57Fe-1, the compound 57Fe(OTf)2(MeCN)2 was generated first. In an
inert atmosphere, metallic 57Fe (42 mg, 0.74 mmol) and a degassed HCl concentrated solution
(4 mL) were stirred at 65°C for one night until all the iron was dissolved. The solvent was then
removed with vacuum and the resultant white residue was suspended in dry MeCN (4 mL).
(CH3)3Si(OTf) (820 mg, 3.69 mmol) in dry MeCN (2 mL) was added dropwise over 2 minutes. The
solution obtained was kept stirring overnight and then solvent was removed by vacuum. The
remaining solid was re-dissolved in dry MeCN (minimum amount) and an excess of dry Et2O was
added. The mixture was left overnight at -20°C and white crystals were formed. The crystals were
filtered, washed with dry Et2O and dried. 57Fe(OTf)2(MeCN)2 was obtained as a white solid. Yield:
175mg (0.4 mmol, 55%).
This product was directly employed in the synthesis of 57Fe-1 without further analysis given
the high cost of the starting 57Fe. The procedure described for the synthesis of Fe-1 was followed,
this time using 57Fe(OTf)2(MeCN)2 instead of Fe(OTf)2(MeCN)2. 57Fe-1 was obtained as colorless
needle-like crystals (white when dry).
6.3.3. Synthesis of the oxidants sPhIO and sPhI18O
For the synthesis of this oxidant, the precursor compound 2-(tert-butylsulfonyl)-
(diacetoxyiodo)benzene (sPhI(OAc)2) was prepared in the group,[42] following a previously reported
procedure.[43]
Synthesis of the oxidant sPhIO
The synthesis of sPhIO was performed following the previously reported procedure.[43]
sPhI(OAc)2 (0.9 g, 2.0 mmol) was placed in a round bottom flask with three stirring bars. Under
vigorous stirring, NaOH (3 M in H2O) was added to the solid in 0.5 mL portions until the pH of the
resulting mixture was kept constant for 5 minutes. The obtained yellow solid was filtered (H2O was
used for transferring the solid to the frit funnel) and washed with H2O and Et2O. sPhIO was
obtained as a yellow fine powder. Yield: 450 mg (1.3 mmol, 66%).
ESI-MS (+): m/z = 340.986 [C10H13IO3S+H]+ = [sPhIO+H]+ (calculated= 340.963).
AT-IR: (solid) 𝑣𝑣� [cm‐1] = 1567 (s), 1457 (m), 1420 (m), 1277 (m), 1133 (s), 1109 (s), 1079 (s), 823
(w), 765 (s), 735 (s), 682 (s), 645 (s), 568 (s), 518 (s), 459 (s).

161
Synthesis of the oxidant sPhI18O
For generating the 18O-containing sPhI18O oxidant, Na18OH was prepared in-situ from the
reaction of NaH (38 mg, 1 mmol) and H218O (1 g) under inert conditions. To this solution,
sPhI(OAc)2 (300 mg, 0.7 mmol) was added and the reaction mixture was stirred for 30 min. After
this time, the reaction mixture was filtrated using specially made teflon-tube-funnels. The solid was
washed with 0.5 mL H218O fractions until neutral pH, then it was washed two times with dry Et2O
and finally it was dried under vacuum. sPhI18O was obtained as a yellow fine powder. Yield:
185 mg (0.56 mmol, 80 %).
ESI-MS (+): m/z = 342.974 [C10H13IO218OS+H]+ = [sPhI18O+H]+ (calculated= 342.963).
AT-IR: (solid) 𝑣𝑣� [cm‐1] = 1567 (s), 1457 (m), 1420 (m), 1277 (m), 1133 (s), 1109 (s), 1079 (s), 787
(w, shoulder), 765 (s), 735 (s), 654 (shoulder), 640 (s), 568 (s), 518 (s), 459 (s).
6.3.4. Generation of the intermediates Fe-2, Fe-2d, Fe-2-18O and 57Fe-2
Generation of Fe-2
In a typical experiment, a colorless solution of the complex Fe-1 in dry CH2Cl2 (1 mM,
2 mL) was cooled down to -90°C under inert conditions. Then 1.5 equivalents of sPhIO in dry
CH2Cl2 (0.1 mL) were added. The formation of a light green intermediate was monitored following
the growth of the 585 nm band in the UV‐vis spectrum.
Larger concentrations were used for preparing samples for spectroscopic techniques
different than UV-vis, the characteristics of those samples are indicated in the text.
UV-vis (CH2Cl2, -90°C): λmax (εmax, M-1cm-1) 385 (shoulder), 585 (200), 848 (150).
EPR: silent
ESI-MS (+): m/z = 464.1 [C14H29F3FeN3O5S]+ (calculated= 464.11).
Fe K-edge XANES (CH2Cl2, 4 mM): pre-edge at 7113.8 eV, edge inflection point at 7124.3 eV.
Generation of Fe-2d
The exact procedure for the generation of Fe-2 was followed, this time employing the
complex Fe-1d instead of Fe-1. The formation of a light green intermediate was monitored
following the growth of the 585 nm band in the UV‐vis spectrum.

162
UV-vis (CH2Cl2, -90°C): λmax (εmax, M-1cm-1) 385 (shoulder), 585 (200), 848 (150).
2H-NMR (CH2Cl2): δ [ppm] = -22 (s), -83 (s)
Generation of Fe-2-18O for ESI-MS
The procedure for the generation of Fe-2 was followed but the oxidant sPhi18O was
employed instead of sPhIO. The formation of a light green intermediate was monitored following
the growth of the 585 nm band in the UV‐vis spectrum.
UV-vis (CH2Cl2, -90°C): λmax (εmax, M-1cm-1) 385 (shoulder), 585 (200), 848 (150).
ESI-MS (+): m/z = 466.1 [C14H29F3FeN3O418OS]+
Generation of 57Fe-2 for Möβbauer studies
A colorless solution of the complex 57Fe-1 30 mM in 0.2 mL dry CH2Cl2 was cooled down
to ─90 °C under inert conditions. Then, 1.5 equivalents of sPhIO in 0.1 mL of dry CH2Cl2 cooled to
─90 °C were added. Finally, 2 mL of propionitrile cooled down to ─90 °C were added to get a 3
mM solution of 57Fe-2 in propionitrile with 12% dichloromethane.
UV-vis (CH2Cl2, -90°C): λmax (εmax, M-1cm-1) 385 (shoulder), 585 (200), 848 (150).
Möβbauer (propionitrile with 12% dichloromethane, 3 mM): main species low-spin Fe(IV) center
with isomer shift (δ’) = 0.213 mm/s and quadrupole splitting (∆EQ) = 1.578 mm/s.
6.3.5. Synthesis of the ligand TMCN and TMCN-d
The TMCN and TMCN-d ligands were synthesized making modifications on previously
reported synthetic pathways.[39–41]
Synthesis of 1,4,7,11-tetratosyl-1,4,7,11-tetraazacyclotetradecane
This synthesis was performed making small modifications from a previously reported
procedure.[41] In a N2 atmosphere, N,N’,N’’-tritosylbis(3-aminopropyl)amine (2.37 g, 4 mmol) and
Cs2CO3 (3.26 g, 10 mmol) were mixed in 60 mL dimethylformamide (DMF). A white suspension
was formed and it was stirred for an hour. A solution of N,O,O′-tritosyldiethanolamine (2.27 g,
4 mmol) in 20 mL DMF was then added dropwise over 5 hours. The cloudy white solution was
stirred for 2 days in an inert atmosphere. After this time, the reaction mixture was opened to air and
ice (around 50 mL) was added slowly while stirring. When all the ice was almost melted, the

163
reaction mixture was left in the fridge overnight. The white precipitate thus formed, was filtered and
dried under vacuum. The protected macrocycle, 1,4,7,11-tetratosyl-1,4,7,11-
tetraazacyclotetradecane, was obtained as a white solid. Yield: 2.7 g (3.3 mmol, 83%).
1H NMR (CDCl3, 400 MHz): δ [ppm] = 7.74-7.62 (m, 8H, H-Ar), 7.34-7.31 (d, 8H, H-Ar), 3.37-
2.88 (m, 16H, CH2-CH2-CH2, N-CH2-CH2), 2.44 (m, 12H, CH3), 1.91 (q, 4H, CH2-CH2-CH2).
Synthesis of 1,4,7,11-tetraazacyclotetradecane
For this synthesis some modifications on a previously reported procedure were
performed.[41] The protected macrocycle, 1,4,7,11-tetratosyl-1,4,7,11-tetraazacyclotetradecane
(2.7 g, 3.6 mmol) and H2SO4 80% (20 mL) were stirred at 250 °C under inert conditions for 1 hr.
After this time, the brown reaction mixture was allowed to cool down and 50 mL of a mixture
MeOH:Et2O (1:1) were added. A white precipitate was formed, filtered, washed with Et2O and re-
dissolved in a NaOH solution. The aqueous solution was extracted three times with CH2Cl2. The
resulting organic fractions were dried under Na2SO4 and the solvent was removed with vacuum.
The product 1,4,7,11-tetraazacyclotetradecane was obtained as a white powder in modest yields.
Yield: 390 mg (1.9 mmol, 53%)
1H NMR (D2O, 400 MHz): δ [ppm] = 1.83 (q, 4H, CH2-CH2-CH2), 2.75-2.82 (m, 16H, CH2-CH2-
CH2, N-CH2-CH2), 3.13 (m, 4H, NH).
Synthesis of the ligand TMCN
Small modifications on a previously reported procedure[39] were performed for this
synthesis. The previously obtained 1,4,7,11-tetraazacyclotetradecane (0.39 g, 1.9 mmol) was
refluxed with formic acid (4.8 mL), formaldehyde (4 mL) and water (0.5 mL) for 24 hrs. After this
time, the clear solution was transferred to a beaker, put in an ice bath, and treated with NaOH
(7.5 M) until pH > 12.0. The reaction mixture was then extracted with chloroform (5 x 10 mL). The
organic phase was dried with Na2SO4 and the solvent was removed. The TMCN ligand was
obtained as an oil. Yield: 360 mg (1.4 mmol, 74%).
1H NMR (CDCl3, 300 MHz): δ [ppm] = 1.67 (q, 4H, CH2-CH2-CH2), 2.25 (s, 12H, CH3), 2.49-2.62
(m, 16H, CH2-CH2, CH2-CH2-CH2).

164
Synthesis of the Ligand TMCN-d
For the synthesis of the deuterated version of the ligand TMCN-d, the 1,4,7,11-
tetraazacyclotetradecane (0.4 g, 2 mmol) was refluxed with formic acid-d2 (4.8 mL), formaldehyde-
d2 (4 mL) and D2O (0.5 mL) for 24 hours. After this time, the clear solution was transferred to a
beaker, put in an ice bath, and treated with NaOH (7.5 M) until pH > 12.0. The reaction mixture
was then extracted with chloroform (5 x 10 mL). The organic phase was dried with Na2SO4 and the
solvent was removed. The TMCN-d ligand was obtained as an oil. Yield: 378 mg (1.4 mmol, 70%).
1H NMR (CDCl3, 300 MHz): δ [ppm] = 1.67 (q, 4H, CH2-CH2-CH2), 2.49-2.62 (m, 16H, CH2-CH2,
CH2-CH2-CH2).
6.3.6. Synthesis of the complexes Fe-3 and Fe-3d
Synthesis of the complex Fe-3
In an inert atmosphere, a solution of the TMCN ligand (100 mg, 0.38 mmol) in dry MeCN
(2 mL) was added to a solution of Fe(OTf)2(MeCN)2 (165 mg, 0.38 mmol) in MeCN (2 mL). The
resulting brown solution was left stirring in a N2 atmosphere for 24 hours. After this time, 10 mL of
dry Et2O were added and the reaction mixture was left standing at -20°C for one hour. A brown oil
was formed in the bottom of the vial. The clear colorless solution was carefully decanted, placed in
a larger flask and more Et2O (50 mL) was added to it. The solution was left at -40°C and overnight
crystals were formed. The complex Fe-3 was obtained pure as colorless needle-like crystals (white
when dry). Yield: 175 mg (0.28 mmol, 75 %).
ESI-MS (+): m/z = 461.161 [C15H32F3FeN4O3S]+ (calculated = 461.154).
19F-NMR (CD2Cl2): δ [ppm] = -79 (s).
1H-NMR (CD2Cl2): paramagnetic; signals distributed in the range of 500 to -100 ppm.
Synthesis of the complex Fe-3d
The exact procedure for the synthesis of Fe-3 was followed, this time employing the ligand
TMCN-d instead of the ligand TMCN. The complex Fe-3d was obtained as colorless needle-like
crystals (white when dry).
ESI-MS (+): m/z = 473.230 [C15H20D12F3FeN4O3S]+ (calculated = 473.228)
19F-NMR (CD2Cl2): δ [ppm] = -76 (s).

165
6.3.7. Generation of the intermediates Fe-4 and Fe-4d
Generation of the intermediate Fe-4
A colorless solution of the complex Fe-3 in dry MeCN (1 mM, 2 mL) was cooled down to
─40 °C under inert conditions. 1.5 equivalents of sPhIO in dry MeCN (0.1 mL) were added. The
formation of the transient intermediate could be detected with UV-vis spectroscopy; however, its
self-decay is too fast to stabilize such species.
UV-vis (CH2Cl2, -90°C): λmax 400 (shoulder), 820; the εmax could not be determined.
Generation of the intermediate Fe-4d
In a typical experiment, a colorless solution of the complex Fe-3d in dry MeCN (1 mM,
2 mL) was cooled down to 10 °C under inert conditions. Then 1.5 equivalents of sPhIO in dry
MeCN were added. The formation of a light greenish-brown intermediate was monitored following
the growth of the 820 nm band in the UV‐vis spectrum.
UV-vis (CH2Cl2, -90°C): λmax (εmax, M-1cm-1) 400 (shoulder), 820 (125).
19F-NMR (CD2Cl2): δ [ppm] = -77 (s).
2H-NMR (CD2Cl2): δ [ppm] = -26 (s), -40 (s), -58 (s), -77(s).
6.3.8. Synthesis of the ligand L6
The ligand L6 was synthesized following a previously reported procedure.[23] To a
suspension of 4-(1,3-bis(2-pyridylmethyl)-2-imidazolidinyl)benzoic acid (1.03 g, 2.74 mmol) in
anhydrous toluene (100 mL) was added n-butylstannoic acid (0.57 g, 2.74 mmol). The reaction
mixture was refluxed at 120 °C for 5 hours with continuous removal of H2O by using a dean-Stark
apparatus. After this time, the reaction mixture was allowed to cool down to room temperature and
then filtered. The solvent from the filtrate was removed under reduced pressure. L6 was obtained as
a yellow solid. Yield: 1.24 g (0.36 mmol, 80%).
1H NMR (CDCl3, 400 MHz): δ [ppm] = 0.85 (t, 36H, CH3), 1.01-1.77 (m, 72H, CH2), 2.88-3.51 (m,
24H, CH2-N), 3.95 (d, 12H, CH2-py), 4.25 (s, 6H, CH), 6.90-7.09 (m, 12H, H-Ar), 7.30-7.58 (m,
48H, H-Ar), 7.85-8.02 (m, 12H, H-Ar), 8.16 (m, 12H, H-Ar), 8.35 (m, 12H, H-Ar).
119Sn NMR (CDCl3, 150 MHz): δ [ppm] = -482.47 (s).

166
IR: (KBr pellet) 𝑣𝑣� [cm‐1] = 3447 (br), 3061 (w), 2953 (m), 2927 (m), 1703 (w), 1604 (s), 1590 (s),
1561 (m), 1529 (s), 1445 (m), 1413 (s), 1292 (m), 1148 (m), 1018 (m), 865 (m), 779 (m), 751 (w),
622 (s), 507 (m).
6.3.9. Synthesis of the complex Co-L6
Co-L6 was synthesized following a previous report.[44] A solution of L6 (0.40 g, 0.12 mmol)
in anhydrous dichloromethane (2mL) was added to a suspension of Co(OTf)2 (0.49 g, 1.3 mmol) in
anhydrous dichloromethane (2 mL). The orange-pink reaction mixture was stirred in anhydrous
conditions at room temperature for 24 hours. The solution was then filtered. After the addition of
50 mL of anhydrous n-hexane to the filtrate, Co-L6 precipitated as a light-orange powder. The
remaining solvent was removed by decantation and Co-L6 was dried in vacuum overnight.
Elemental analysis: C168H180N24F36O54S12Sn6Co6 Calculated (%): C, 36.42; H, 3.38; N, 6.07. Found
(%): C, 35.51; H, 3.64; N, 5.52.
EPR (CH2Cl2, 10 K): g┴ ≈ 4.2 and g║ ≈ 2.1.
Further characterization of this complex is discussed in Chapter 3.
6.3.10. Generation of the intermediate Co-1
Co-1 was generated following a previous report.[44] Under inert conditions, a pale orange
solution of the complex Co-L6 in anhydrous dichloromethane or acetone (1 mM, 2 mL) was kept at
25 °C. Anhydrous O2 was then bubbled into the solution. The formation of a deep orange
intermediate was monitored following the growth of the 470 nm band in the UV‐vis spectrum.
UV-vis (CH2Cl2, -90°C): λmax (εmax, M-1cm-1) 470 nm (11600).
EPR: silent.
Further characterization of this intermediate is discussed in Chapter 3 and in previous reports.[44]
6.3.11. Synthesis of the Complex [(AN)Cu]BF4
The complex [(AN)Cu]BF4 was prepared following a previously reported procedure.[45] A
solution of the ligand 3,3’‐iminobis-N,N,‐dimethylpropylamine (AN; 0.345 g, 1.84 mmol) in dry
CH2Cl2 (5 mL) was added to the solid [Cu(MeCN)4][BF4] (0.579 g, 1.84 mmol). The resultant
solution was stirred under inert atmosphere for 30 minutes. After this time, 25 mL of n‐Hexane
were added to the colorless, clear solution to produce a cloudy solution that was kept at ‐35 °C for

167
2 hours. After that, the solvent was decanted and the resultant white solid was dried in vacuo to
obtain the compound in pure form. Yield: 0.509 g (1.51 mmol, 82%).
Elemental analysis: C10H25N3BCuF4 Calculated (%): C, 35.57; H, 7.46; N, 12.44. Found (%): C,
35.81; H, 7.53; N, 12.30.
IR: (KBr pellet) 𝑣𝑣� [cm‐1] = 3289 (s), 2924 (s), 2844 (s), 2794 (s), 1480 (s), 1466 (s), 1429 (s), 1387
(m), 1345 (m), 1324 (m), 1293 (m), 1263 (m), 1239 (m), 1203 (m), 1139 (s), 1107 (s), 1054 (s), 978
(s), 950 (m), 919 (w), 899 (m), 859 (s), 851 (s), 771 (s), 756 (w), 523 (m), 492 (w), 458 (w).
EPR: silent.
6.3.12. Synthesis of the oxidants sPhINTs and sPhI15NTs
For the synthesis of these oxidants, the precursor compound sPhI(OAc)2 (2-(tert-
butylsulfonyl)(diacetoxyiodo)benzene) was prepared in the group,[42] following a previously
reported procedure.[43]
Synthesis of the oxidant sPhINTs
p-Toluenesulfonamide (0.4 g, 2.3 mmol) and KOH (0.32 g, 5.6 mmol) were dissolved in
40 mL of MeOH. The resultant solution was stirred in an ice bath at 0 °C for 15 minutes. After this
time, the compound sPhI(OAc)2 (1.0 g, 2.3 mmol) was slowly added. The reaction mixture was kept
stirring for 1 hour at 0°C and then for 2 hours at room temperature. The white suspension thus
obtained, was poured to crashed ice and this mixture was filtrated before the ice was completely
melted. The white residue was washed with water until neutral pH and then with Et2O, finally, it
was dried in vacuum overnight. The oxidant sPhINTs was obtained as white solid. Yield: 0.870 g,
(1.75 mmol, 76%).
1H NMR (CDCl3, 300 MHz): δ [ppm] = 8.33 (d, 1H, H-Ar), 7.93-7.80 (m, 4H, H-Ar), 7.73-7.66 (m,
1H, H-Ar), 7.23 (m, 2H, H-Ar), 2.31 (s, 3H, CH3), 1.37-1.35 (s, 9H, C-(CH3)3).
ESI-MS (+): m/z= 494.10 [C17H21INO4S2]+ (calculated= 493.99).
AT-IR: (solid) 𝑣𝑣� [cm‐1] = 1272 (s), 1195 (w), 1133 (s), 1105 (s), 1079 (s), 1028 (m), 849 (s), 809
(s), 793 (m), 766 (s), 735 (s), 695 (s), 667 (s), 641 (s), 615 (m), 570 (s), 555 (s), 546 (s), 516 (m),
463 (m).

168
Synthesis of the oxidant sPhI15NTs
For the preparation of the labeled sPhI15NTs the same procedure as for sPhINTs was
followed but 15N-p-toluensulfonamide was used (bought with 98+ atom % 15N from ISOTECH-
SIGMA ALDRICH).
ESI-MS (+): m/z= 495.10 [C17H21I15NO4S2]+ (calculated= 494.99).
AT-IR: (solid) 𝑣𝑣� [cm‐1] = 1272 (s), 1195 (w), 1133 (s), 1105 (s), 1079 (s), 1028 (m), 832 (s), 806
(s), 793 (m), 766 (s), 735 (s), 695 (s), 660 (s), 641 (s), 602 (m), 570 (s), 555 (s), 546 (s), 516 (m),
463 (m).
6.3.13. Generation of the intermediates Cu-1-M and Cu-1-Y-15N
Generation of Cu-1-M intermediates
Cu-1-M intermediates were generated following a procedure previously reported for
Cu-1-Sc.[45] Under inert conditions, a solution of [(AN)Cu](BF4) in CH2Cl2 (1 mM, 2 mL) was
cooled down to -90°C. 1.5 equivalents of Lewis Acid (M) [Sc(OTf)3, Y(OTf)3, Eu(OTf)3,
Ce(OTF)3, Zn(OTf)2] and 1.5 equivalents of the oxidant sPhINTs were added in that order. The
formation of the purple intermediate was monitored by UV-vis spectroscopy by following the
increasing absorbance at 530 nm.
Larger concentrations were used for preparing samples for spectroscopic techniques
different than UV-vis, the characteristics of those samples are indicated in the text.
UV-vis (CH2Cl2, -90°C): λmax 530, 750 (the intensity of the signal varies with the M employed, thus
no εmax is reported). For [(AN)Cu(NTs)(Sc3+)] λmax (εmax, M-1cm-1) 530 (2500), 750 (580).
Cu K-edge XANES (acetone with 15% dichloromethane, 8 mM): pre-edge feature at 8977.5 eV,
edge inflection point at 8988 eV.
Generation of the intermediate Cu-1-Y-15N for rRaman
In strict inert conditions, a colorless solution of the complex [(AN)Cu][BF4] in anhydrous
CH2Cl2 (4 mM, 2 mL) was cooled down to ‐90 °C. Then, 1.5 equivalents of Sc(OTf)3 in anhydrous
acetone (0.1 mL) and 1.5 equivalents of sPhI15NTs in anhydrous CH2Cl2 (0.1 mL) were added, in
that order, to yield a deep purple intermediate. The formation of this species was monitored
following the growth of the 530 nm band in the UV‐vis spectrum.

169
UV-vis (CH2Cl2, -90°C): λmax (εmax, M-1cm-1) 530 (2500), 750 (580).
rRaman (CH2Cl2, laser excitation: 514 nm): shift upon labeling (14N→15N) in cm-1 = 568→566,
658→655, 883→862.
6.3.14. Synthesis of the oxidants sPhINArCF3 and sPhI15NArCF3
For the synthesis of these oxidants, the precursor compound sPhI(OAc)2 (2-(tert-
butylsulfonyl)(diacetoxyiodo)benzene) was prepared in the group,[42] following a previously
reported procedure.[43]
Synthesis of the oxidant sPhINArCF3
4-(trifluoromethyl)benzenesulfonamide (0.15 g, 0.68 mmol)) and KOH (0.10 g, 1.70 mmol)
were dissolved in 5 mL of MeOH. The resultant solution was stirred in an ice bath at 0°C for
15 minutes. After this time, the compound sPhI(OAc)2 (0.30 g, 0.68 mmol) was slowly added. The
reaction mixture was kept stirring for 1 hour at 0°C and then for 2 hours at room temperature. The
white suspension thus obtained, was poured to crashed ice and this mixture was filtrated before the
ice was completely melted. The white residue was washed with water until neutral pH and then with
Et2O. It was finally dried in vacuum overnight. The oxidant sPhINRCF3 was obtained as white solid.
Yield: 0.214 g, (0.39 mmol, 58%).
1H NMR (CD2Cl2, 300 MHz): δ [ppm] = 8.11 (d, 1H, H-Ar), 8.01 (d, 2H, H-Ar), 7.92 (d, 1H, H-
Ar), 7.81 (t, 1H, H-Ar), 7.73 (d, 1H, H-Ar), 7.68 (d, 3H, H-Ar), 1.42 (s, 9H, C-(CH3)3).
13C{1H}-NMR (CD2Cl2, 101 MHz) δ [ppm] = 149.0 (C-SO2N), 137.5 (CH-Ar), 135.2 (CH-Ar),
133.4 (CSO2tBu), 132.5 (CH-Ar), 129.3 (CH-Ar), 128.5 (CH-Ar), 127.3 (q, J = 3.6 Hz, CF3), 116.1
(C-I), 65.0 (C(CH3)3),24.5 (CH3).
ESI-MS (+): m/z = 569.950 [C17H17F3INO4S2+Na]+ (calculated= 569.949).
Synthesis of the oxidant sPhI15NArCF3
For the preparation of the labeled sPhI15NRCF3 the same procedure as for sPhINRCF3 was
performed but 15N-4-(trifluoromethyl)benzenesulfonamide was used.
ESI-MS (+): m/z = 570.952 [C17H17F3I15NO4S2+Na]+

170
6.3.15. Synthesis of the oxidants sPhINArNO2 and sPhI15NArNO2
For the synthesis of these oxidants, the precursor compound sPhI(OAc)2 (2-(tert-
butylsulfonyl)(diacetoxyiodo)benzene) was prepared in the group,[42] following a previously
reported procedure.[43]
Synthesis of the oxidant sPhINArNO2
4-nitrobenzenesulfonamide (0.14 g, 0.68 mmol)) and KOH (0.10 g, 1.70 mmol) were
dissolved in 4 mL of MeOH. The resultant solution was stirred in an ice bath at 0°C for 15 minutes.
After this time, the compound sPhI(OAc)2 (0.30 g, 0.68 mmol) was slowly added. The reaction
mixture was kept stirring for 1 hour at 0°C and then for 2 hours at room temperature. The white
suspension thus obtained, was poured to crashed ice and this mixture was filtrated before the ice
was completely melted. The white residue was washed with water until neutral pH and then with
Et2O. Finally, it was dried in vacuum overnight. The oxidant sPhINRNO2 was obtained as white
solid. Yield: 0.284 g, (0.23 mmol, 80%).
1H NMR (CD2Cl2, 300 MHz): δ [ppm] = 8.26 (d, 1H, H-Ar), 8.19 (d, 1H, H-Ar), 8.06 (d, 1H, H-
Ar), 7.94 (dd, 1H, H-Ar), 7.87 (td, 1H, H-Ar), 7.75 (td, 2H, H-Ar), 1.44 (s, 9H, C(CH3)3).
ESI-MS (+): m/z = 546.946 [C16H17IN2O6S2+Na]+ (calculated= 546.947)
AT-IR: (solid) 𝑣𝑣� [cm‐1] = 1518 (s), 1474 (m), 1443 (m), 1425 (m), 1346 (s), 1290 (s), 1263 (s), 1166
(m), 1146 (w), 1137 (w), 1124 (s), 1108 (m), 1077 (s), 1010 (m), 1001 (m), 877 (s), 851 (s), 779
(m), 733 (s), 698 (w), 687 (m), 650 (s), 569 (s), 549 (s), 516 (m), 464 (s)
Synthesis of the oxidant sPhI15NArNO2
For the preparation of the labeled sPhI15NRNO2 the same procedure as for sPhINRNO2 was
performed but 15N-4-nitrobenzenesulfonamide was used.
ESI-MS (+): m/z = 547.950 [C16H17IN15NO6S2+Na]+
AT-IR: (solid) 𝑣𝑣� [cm‐1] = 1518 (s), 1474 (m), 1443 (m), 1425 (m), 1346 (s), 1290 (s), 1263 (s), 1166
(m), 1146 (w), 1137 (w), 1124 (s), 1108 (m), 1077 (s), 1010 (m), 1001 (m), 865 (s), 845 (s), 779
(m), 733 (s), 698 (w), 687 (m), 642 (s), 569 (s), 549 (s), 516 (m), 464 (s)

171
6.3.16. Generation of the intermediate Cu-2
In strict inert conditions, a colorless solution of the complex [(AN)Cu][BF4] in anhydrous
CH2Cl2 (1 mM, 2 mL) was cooled down to ‐90 °C. Then 1.5 equivalents of sPhINRCF3 in anhydrous
CH2Cl2 (0.1 mL) were added with extreme precaution to avoid any oxygen or water getting in
contact with the solution. The formation of a deep green intermediate was monitored following the
growth of the 425 nm band in the UV‐vis spectrum.
Larger concentrations were used for preparing samples for spectroscopic techniques
different than UV-vis, the characteristics of those samples are indicated in the text.
UV-vis (CH2Cl2, -90°C): λmax (εmax, M-1cm-1) 425 nm (1200), 700 nm (600).
6.3.17. Generation of the intermediates Cu-2-Sc and Cu-2-Sc-15N
Generation of the intermediate Cu-2-Sc
Under inert conditions, a colorless solution of the complex [(AN)Cu][BF4] in anhydrous
CH2Cl2 (1 mM, 2 mL) was cooled down to ‐90 °C. Then, 1.5 equivalents of Sc(OTf)3 in anhydrous
acetone (0.1 mL) and 1.5 equivalents of sPhINRCF3 in anhydrous CH2Cl2 (0.1 mL) were added in
that order to yield a deep purple intermediate. The formation of this species was monitored
following the growth of the 525 nm band in the UV‐vis spectrum.
Larger concentrations were used for preparing samples for spectroscopic techniques
different than UV-vis, the characteristics of those samples are indicated in the text.
UV-vis (CH2Cl2, -90°C): λmax (εmax, M-1cm-1) 525 (2150), 750 (600).
Generation of the intermediate Cu-2-Sc-15N for rRaman
Under inert conditions, a colorless solution of the complex [(AN)Cu][BF4] in anhydrous
CH2Cl2 (4 mM, 2 mL) was cooled down to ‐90 °C. Then, 1.5 equivalents of Sc(OTf)3 in anhydrous
acetone (0.1 mL) and 1.5 equivalents of sPhI15NRCF3 in anhydrous CH2Cl2 (0.1 mL) were added in
that order to yield a deep purple intermediate. The formation of this species was monitored
following the growth of the 525 nm band in the UV‐vis spectrum.
UV-vis (CH2Cl2, -90°C): λmax (εmax, M-1cm-1) 525 (2150), 750 (600).

172
rRaman (CH2Cl2 with 5% acetone, laser excitation: 532 nm): shift upon labeling (14N→15N) in cm-1
= 907→874, 609→607, 557.5→556.
6.3.18. Generation of the intermediate Cu-3
Under strict inert conditions, a colorless solution of the complex [(AN)Cu][BF4] in
anhydrous CH2Cl2 (1 mM, 2 mL) was cooled down to ‐90 °C. Then 1.5 equivalents of sPhINRNO2 in
anhydrous CH2Cl2 (0.1 mL) were added with extreme precaution to avoid any oxygen or water
getting in contact with the solution. The formation of a deep green intermediate was monitored
following the growth of the 425 nm band in the UV‐vis spectrum.
Larger concentrations were used for preparing samples for spectroscopic techniques
different than UV-vis, the characteristics of those samples are indicated in the text.
UV-vis (CH2Cl2, -90°C): λmax (εmax, M-1cm-1) 425 nm (1300), 700 nm (700).
Cu K-edge XANES (dichloromethane, 3.5 mM): pre-edge feature at 8977.5 eV, edge inflection
point at 8987.5 eV.
6.3.19. Generation of the intermediates Cu-3-M and Cu-3-15N
Generation of the intermediate Cu-3-M
Under inert conditions, a colorless solution of the complex [(AN)Cu][BF4] in anhydrous
CH2Cl2 (1 mM, 2 mL) was cooled down to ‐90 °C. Then, 1.5 equivalents of Sc(OTf)3 in anhydrous
acetone (0.1 mL) and 1.5 equivalents of sPhINRNO2 in anhydrous CH2Cl2 (0.1 mL) were added in
that order to yield a deep purple intermediate. The formation of this species was monitored
following the growth of the 525 nm band in the UV‐vis spectrum.
Larger concentrations were used for preparing samples for spectroscopic techniques
different than UV-vis, the characteristics of those samples are indicated in the text.
UV-vis (CH2Cl2, -90°C): λmax (εmax, M-1cm-1) 525 (2000), 750 (550).
Cu K-edge XANES (for Cu-3-Y in dichloromethane with 5% acetone, 3.5 mM): pre-edge feature at
8977.5 eV, edge inflection point at 8987.5 eV.
173
Generation of the intermediate Cu-3-Sc-15N for rRaman
Under inert conditions, a colorless solution of the complex [(AN)Cu][BF4] in anhydrous
CH2Cl2 (4 mM, 2 mL) was cooled down to ‐90 °C. Then, 1.5 equivalents of Sc(OTf)3 in anhydrous
acetone (0.1 mL) and 1.5 equivalents of sPhI15NRNO2 in anhydrous CH2Cl2 (0.1 mL) were added in
that order to yield a deep purple intermediate. The formation of this species was monitored
following the growth of the 525 nm band in the UV‐vis spectrum.
UV-vis (CH2Cl2, -90°C): λmax (εmax, M-1cm-1) 525 (2070), 740 (470).
rRaman (CH2Cl2 with 5% acetone, laser excitation: 532 nm): shift upon labeling (14N→15N) in cm-1
= 910→880, 609→605, 562→560.
6.3.20. Synthesis of the oxidant Mes-N3
2,4,6‐trimethylaniline (1,01 g, 7.5 mmol) was added to a mixture of concentrated HCl (10
mL) and H2O (10 mL) at 0 °C. In small portions, sodium nitrite (0.62 g, 9.0 mmol) was slowly
added too. The reaction mixture was stirred for 2 hours keeping the temperature constant at 0 °C. A
solution of sodium acetate (12.3 g, 150 mmol) in H2O (33 mL) was then added, followed by the
addition of sodium azide (0.97 g, 15 mmol) in small portions. The reaction mixture was stirred for
30 min at room temperature, and then extracted with n‐pentane (50 mL x 3 times). The organic
phase was washed with a concentrated NaCl solution and dried with MgSO4. After vacuum removal
of the solvent, a red oil was obtained that was further purified with a chromatographic column using
n‐hexane as eluent to get mesityl-azide as a yellow oil. Yield: 1.00 g (6.2 mmol, 83%).
1H NMR (CDCl3, 400 MHz): δ [ppm] = 6.83 (s, 2H, CH), 2.32 (s, 6H, o-CH3), 2.25 (s, 3H, p-CH3).
13C NMR (CDCl3, 400 MHz): δ [ppm] = 135.5 (1C, p-CH3-C), 134.5 (1C, C-N), 132.0 (2C, o-CH3-
C), 129.6 (2C, CH), 20.8 (1C, p-CH3), 18.2 (2C, o-CH3).
IR: (KBr pellet) 𝑣𝑣� [cm‐1] = 2920 (vw), 2115 (vs), 2089 (m), 2058 (w), 1479 (w), 1316 (w), 1279
(m), 853 (m).
6.3.21. Generation of the intermediate Cu-4-Sc
Under inert conditions, a colorless solution of the [(AN)Cu][BF4] complex in anhydrous
CH2Cl2 (1 mM, 2 mL) was cooled down to ‐90 °C. Then, 1.5 equivalents of Sc(OTf)3 in anhydrous
acetone (0.1 mL) and 1.5 equivalents of Mesitylazide in anhydrous CH2Cl2 (0.1 mL) were added in

174
that order to yield a deep purple intermediate. The generation of this species was monitored
following the growth of the 560 nm band in the UV‐vis spectrum.
Larger concentrations were used for preparing samples for spectroscopic techniques
different than UV-vis, the characteristics of those samples are indicated in the text.
UV-vis (CH2Cl2, -90°C): λmax (εmax, M-1cm-1) 560 (2000), 670 (1360).
Cu K-edge XANES (for Cu-3-Y in dichloromethane with 5% acetone, 3.5 mM): shoulder at edge
inflection point at 8981.5 eV.
6.4. References
[1] P. Gütlich, E. Bill, A. X. Trautwein, Möβbauer Spectroscopy and Transition Metal
Chemistry, Springer, Berlin, 2011.
[2] B. Ravel, M. Newville, J. Synchrotron Radiat. 2005, 12, 537–541.
[3] E. J. Baerends, T. Ziegler, J. Autschbach, D. Bashford, A. Bérces, F. M. Bickelhaupt, C. Bo,
P. M. Boerrigter, L. Cavallo, D. P. Chong, et al., ADF2013, SCM, Theoretical Chemistry,
Vrije Universiteit, Amsterdam, The Netherlands, 2013.
[4] G. te Velde, F. M. Bickelhaupt, E. J. Baerends, C. Fonseca Guerra, S. J. a. van Gisbergen, J.
G. Snijders, T. Ziegler, G. T. E. Velde, C. F. Guerra, S. J. Gisbergen, J. Comput. Chem.
2001, 22, 931–967.
[5] E. van Lenthe, E. J. Baerends, A. T. Chemie, V. Universiteit, D. Boelelaan, J. Comput.
Chem. 2003, 24, 1142–1156.
[6] M. Swart, J. G. Snijders, Theor. Chem. Acc. 2003, 110, 34–41.
[7] M. Swart, F. M. Bickelhaupt, J. Comput. Chem. 2008, 29, 724–734.
[8] M. Swart, F. M. Bickelhaupt, Int. J. Quantum Chem. 2006, 106, 2536–2544.
[9] M. Swart, Chem. Commun. 2013, 49, 6650–6652.
[10] J. P. Perdew, Phys. Rev. B 1986, 33, 8822–8824.
[11] A. D. Becke, Phys. Rev. A 1988, 38, 3098–3100.
[12] S. Grimme, J. Antony, S. Ehrlich, H. Krieg, S. Grimme, J. Antony, S. Ehrlich, H. Krieg, J.

175
Chem. Phys. 2010, 132, 154104.
[13] M. Swart, Chem. Phys. Lett. 2013, 580, 166–171.
[14] P. R. T. Schipper, O. V Gritsenko, S. J. A. van Gisbergen, E. J. Baerends, J. Chem. Phys.
2000, 112, 1344.
[15] A Klamt, G. Schuurmann, J. Chem. Soc. Perkin Trans. 2 1993, 799–805.
[16] A. Klamt, J. Phys. Chem. 1995, 99, 2224–2235.
[17] A. Klamt, V. Jonas, J. Chem. Phys. 1996, 105, 9972–9981.
[18] M. Swart, E. Rösler, F. M. Bickelhaupt, Eur. J. Inorg. Chem. 2007, 3646–3654.
[19] C. C. Pye, T. Ziegler, Theor. Chem. Acc. 1999, 101, 396–408.
[20] E. van Lenthe, A. Ehlers, E.-J. Baerends, J. Chem. Phys. 1999, 110, 8943.
[21] E. van Lenthe, E. J. Baerends, J. G. Snijders, J. Chem. Phys. 1994, 101, 9783.
[22] E. van Lenthe, E. J. Baerends, J. G. Snijders, J. Chem. Phys. 1993, 99, 4597.
[23] S. Kundu, E. Matito, S. Walleck, F. F. Pfaff, F. Heims, B. Rábay, J. M. Luis, A. Company,
B. Braun, T. Glaser, K. Ray, Chem. a Eur. J. 2012, 18, 2787–91.
[24] A. D. Becke, J. Chem. Phys. 1993, 98, 5648–5652.
[25] C. Lee, W. Yang, R. G. Parr, Phys. Rev. B 1988, 37, 785–789.
[26] Basis sets were obtained from Extensible Comput. Chem. Environ. Basis Set Database,
Version 4/22/01, Dev. Distrib. by Mol. Sci. Comput. Facil. Environ. Mol. Sci. Lab. Pacific
Northwest
[27] A. Schaefer, C. Huber, R. Alrichs, J. Chem. Phys. 1994, 100, 5829–5835.
[28] J. P. Perdew, K. Burke, Y. Wang, Phys. Rev. B 1996, 54, 16533–16539.
[29] R. Ditchfield, W. J. Hehre, J. A. Pople, J. Chem. Phys. 1971, 54, 724.
[30] M. J. Frisch; G. W. Trucks; H. B. Schlegel; G. E. Scuseria; M. A. Robb; J. R. Cheeseman;
G. Scalmani; V. Barone; B. Mennucci; G. A. Petersson; H. Nakatsuji; M. Caricato; X. Li; H.
P. Hratchian; A. F. Izmaylov; J. Bloino; G. Zheng; J. L. Sonnenberg; M. Hada; M. Ehara; K.

176
Toyota; R. Fukuda; J. Hasegawa; M. Ishida; T. Nakajima; Y. Honda; O. Kitao; H. Nakai; T.
Vreven; J. A. Montgomery; J. E. Peralta; F. Ogliaro; M. Bearpark; J. J. Heyd; E. Brothers;
K. N. Kudin; V. N. Staroverov; R. Kobayashi; J. Normand; K. Raghavachari; A. Rendell; J.
C. Burant; S. S. Iyengar; J. Tomasi; M. Cossi; N. Rega; J. M. Millam; M. Klene; J. E. Knox;
J. B. Cross; V. Bakken; C. Adamo; J. Jaramillo; R. Gomperts; R. E. Stratmann; O. Yazyev;
A. J. Austin; R. Cammi; C. Pomelli; J. W. Ochterski; R. L. Martin; K. Morokuma; V. G.
Zakrzewski; G. A. Voth; P. Salvador; J. J. Dannenberg; S. Dapprich; A. D. Daniels; O.
Farkas; J. B. Foresman; J. V. Ortiz; J. Cioslowski; D. J. Fox, Gaussian 09; Gaussian, Inc.,
Wallingford CT, 2009.
[31] F. Neese, U. Becker, D. Ganyushin, A. Hansen, D. Liakos, R. Izsak, C. Kollmar, S.
Kossmann, T. Petrenko, C. Reimann, R. Christoph, R. Michael; Riplinger; Cristoph; B.
Sandhoefer; I. Schapiro; K. Sivalingam; B. Wezisla; F. Wennmohs, Program Version 3.0.2;
79 ORCA, Max Planck Institute for Bioinorganic Chemistry. Muelheim/Ruhr, Germany.
[32] E. F. Valeev, J. T. Fermann, libint2, Copyright ©, 1996–2012.
[33] F. Neese, Wiley Interdiscip. Rev. Comput. Mol. Sci. 2012, 2, 73–78.
[34] A. Schäfer, H. Horn, R. Ahlrichs, J. Chem. Phys. 1992, 97, 2571.
[35] F. Weigend, R. Ahlrichs, Phys. Chem. Chem. Phys. 2005, 7, 3297–305.
[36] K. Eichkorn, O. Treutler, H. Ohm, H. Marco, R. Ahlrichs, Chem. Phys. Lett. 1995, 240,
283–290.
[37] K. Eichkorn, F. Weigend, O. Treutler, R. Ahlrichs, Theor. Chem. Acc. 1997, 97, 119–124.
[38] C. Steffen, K. Thomas, U. Huniar, A. Hellweg, O. Rubner, A. Schroer, J. Comput. Chem.
2010, 31, 2967–2970.
[39] M. T. S. Amorim, S. Chaves, R. Delgado, J. J. R. Fraústo da Silva, J. Chem. Soc. Dalt.
Trans. 1991, 938, 3065–3072.
[40] T. W. Bell, H. J. Choi, W. Harte, M. G. B. Drew, J. Am. Chem. Soc. 2003, 125, 12196–
12210.
[41] C. S. Rossiter, R. A. Mathews, J. R. Morrow, Inorg. Chem. 2005, 44, 9397–9404.
[42] F. F. Pfaff, PhD Thesis: Synthese, Charakterisierung und Reaktivitätsstudien zu

177
Hochvalenten Metalloxidoverbindungen, Humboldt Universität Zu Berlin, Berlin, Germany,
2015.
[43] D. Macikenas, E. Skrzypczak-jankun, J. D. Protasiewicz, J. Am. Chem. Soc. 1999, 121,
7164–7165.
[44] S. Kundu, PhD Thesis: Synthesis, Spectroscopic Characterization and Reactivity of the
High-Valent Metal-Oxo/Imido Cores of the Late Transition Metals, Humboldt-Universität
Zu Berlin, Berlin, 2013.
[45] S. Kundu, E. Miceli, E. Farquhar, F. F. Pfaff, U. Kuhlmann, P. Hildebrandt, B. Braun, C.
Greco, K. Ray, J. Am. Chem. Soc. 2012, 134, 14710–14713.

Appendices
A1 Crystallographic data
A2 Lists of abbreviations
A3 Declaration
A4 Publications and presentations

180
A1. Crystallographic data
Fe-1
Empirical formula C17H30F6FeN4O7S2 Formula mass 636.42
Crystal habit, color Colorless needles Crystal dim. (mm) 0.08x0.25x0.1
Space group P21/n a [Å] 14.691(3) b [Å] 19.067(3) c [Å] 18.222(4) α [°] 90 β [°] 90.354(15) γ [°] 90
V [Å3] 5104.1(17) Z 8
T [K] 100 D [g cm-1] 1.656
F000 2624.0 µ [mm-1] 0.8444 Τ range 0.817-0.920
Refl. Collected 14061 Rint 0.0527
Parameters refined 675 wR2 0.0963

181
A2. Lists of abbreviations
Techniques and technical terms
Asp Aspartic acid
ATP Adenosine triphosphate
B Magnetic field
BDE Bond disociation energy
Calc. Calculated
CT Charge transfer
Cys Cysteine
DFT Density functional theory
e- Electron
EA Elemental analysis
EPR Electron paramagnetic resonance
eqv. Equivalents
ESI Electrospray ionization
EXAFS Extended X-ray absorption fine structure
Exp. Experimental
GC Gas chromatography
Glu Glutamic acid
HAA Hydrogen atom abstraction
HAT Hydrogen atom transfer
His Histidine
kobs Pseudo-first order rate constant
k2 Second order rate constant
KIE Kinetic isotope effect
MS Mass spectroscopy
m/z Mass per charge
[M]+ Molecular ion peak
NMR Nuclear magnetic resonance
PCET Proton coupled electron transfer
rR Resonance Raman
S Electron spin
SCE Saturated Calomel Electrode

182
Sim. Simulated
SQUID Superconducting quantum interference device
Tyr Tyrosine
UV-vis Ultraviolet-visible
XAS X-ray absorption spectroscopy
XANES X-ray absorption near edge spectroscopy
Units
Å Angstrom (10-10 m)
Cm Centimeter
°C Degree Celsius
G Gauss
Hz Hertz
K Kelvin
Kcal Kilo calories
Mg Milligram (10-3 g)
Min Minute
mL Milliliter (10-3 L)
mM Millimolar (10-3 M)
Mm Millimiter (10-9 m)
S Second
T Tesla
W Watt
Latin expressions
ca. Around
et al. and coworkers
in situ In the original place
per-se In itself, intrinsically
tert- Tertiary
via By means of
vs. Versus, against

183
Symbols
δ Chemical shift (ppm)
δ’ Isomer shift (mm/s)
∆EQ Quadrupole splitting (mm/s)
ε Extinction coefficient (M-1cm-1)
λ Wavelength (nm)
ν Wavenumber (cm-1)
Chemicals
AcO- Acetate
AN 3,3’-iminobis(N,N-dimethylpropylamine)
BNAH 1-benzyl-1,4-dihydronicotinamide
CHD Cyclohexadiene
DHA Dihydroanthracene
Fc Ferrocene
Fc+ Ferrocenium
Me10Fe Decamethylferrocene
Me10Fc+ Decamethylferrocenium
Mes Mesityl -OTf Triflate (trifluoromethane sulfonate)
sPhIO 2-(tert-butylsulfonyl)-iodosylbenzene
sPhINTs 2-(tert-butylsulfonyl)(p-toluensulfonylimidoiodo)benzene
sPhINArNO2 2-(tert-butylsulfonyl)((4-nitrophenyl)sulfonylimidoiodo)benzene
sPhINArCF3 2-(tert-butylsulfonyl)((4-(trifluoromethyl)phenyl)sulfonylimidoiodo)benzene
TFA Trifluoroacetic acid
Ts Tosyl (p-tolysulfonyl)

184

185
A3. Declaration
Selbstständigkeitserklärung
Hiermit versichere ich, Inés Monte Pérez, dass ich die vorliegende Arbeit selbstständig und
nur unter Einsatz der angegebenen Hilfsmittel und Quellen am Institut für Chemie der Humboldt-
Universität zu Berlin angefertigt habe.
Inés Monte Pérez Berlin, den

186

187
A4. Publications and presentations
Publications:
- Evidence of two-state reactivity in alkane hydroxylation by Lewis-acid bound copper–
nitrene complexes, S.-L. Abram, I. Monte-Pérez, F. F. Pfaff, E. R. Farquhar, K. Ray, Chemical
Communications, 2014, 50, 9852-9854.
- An Open-Shell Spin Singlet Copper-Nitrene Intermediate Binding Redox-innocent Metal
Ions: Influence of the Lewis Acidity of the Metal Ions on Spectroscopic and Reactivity Properties
I. Monte-Pérez, S. Kundu, K. Ray, Z. Anorg. Allg. Chem., 2015, 641, 78-82.
- Oxidation Reactions with Bioinspired Mononuclear Non-Heme Metal-Oxo Complexes, X.
Engelmann, I. Monte-Pérez, K. Ray, Angew. Chem. Int. Ed., 2016, 55, 7632-7649.
Presentations:
- 2nd FUSION conference on activation of small molecules in Cancun, Mexico, 2016
Poster presentation: “Isolation, characterization and reactivity evaluation of a series of copper-
nitrene intermediates active in C-H bond activation”
- ICIQ – UniCat summer school in Berlin, Germany, 2015
Poster presentation: “A new reactive iron(IV)-oxo species: importance of subtle electronic changes
in the reactivity of biologically relevant intermediates”
- COST (European cooperation in science and technology) Meeting, Belgrade, Serbia, 2015
Oral presentation: “Study of Reactive Intermediates of Late-Transition-Metal Compounds with
Oxidizing Agents in C-H Bond Activation”
- Koordinationschemie-Treffen in Paderborn, Germany, 2015
Oral presentation: “Study of Reactive Intermediates of Late-Transition-Metal Compounds with
Oxidizing Agents in C-H Bond Activation”
- Niedersächsisches Katalyse Symposium (NiKaS) in Göttingen, Germany 2014
Poster presentation: “A hexanuclear cobalt complex and its reactivity”