bioinformatics & biostatistics tools for monogenic and multifactorial disease investigation in...
TRANSCRIPT

Bioinformatics & biostatistics tools for monogenic and multifactorial
disease investigation in consanguineous populations
Mourad SAHBATOU Fondation Jean DAUSSET - CEPH, Paris
Cours international Pasteur - Tunis – Octobre 2016

Outline
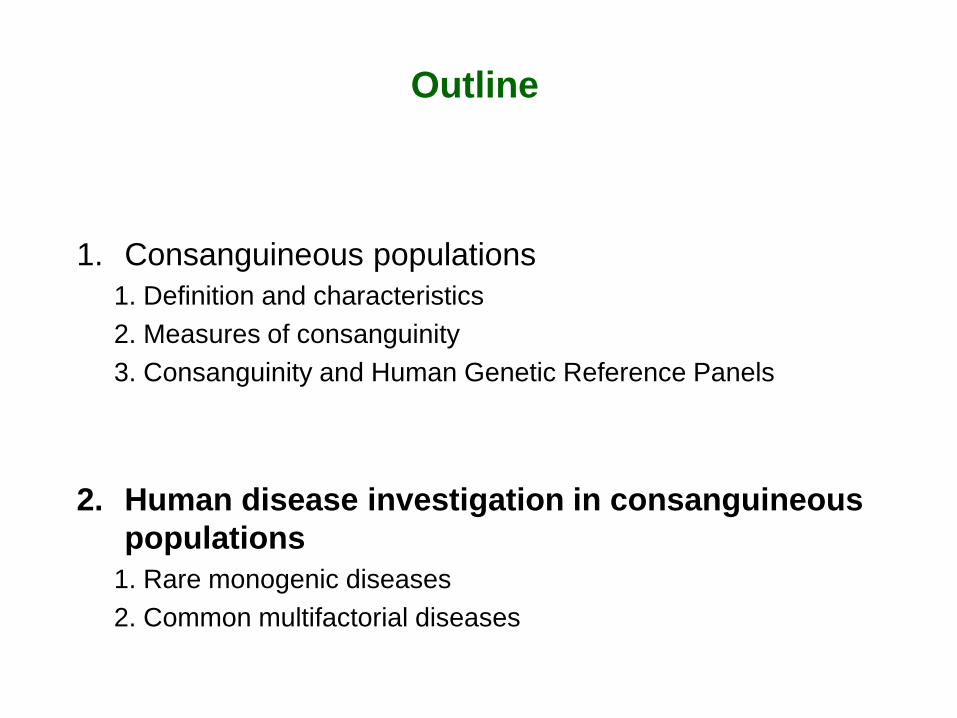
1. Consanguineous populations
1. Definition and characteristics 2. Measures of consanguinity 3. Consanguinity and Human Genetic Reference Panels
2. Human disease investigation in consanguineous populations
1. Rare monogenic diseases 2. Common multifactorial diseases
Consanguineous populations
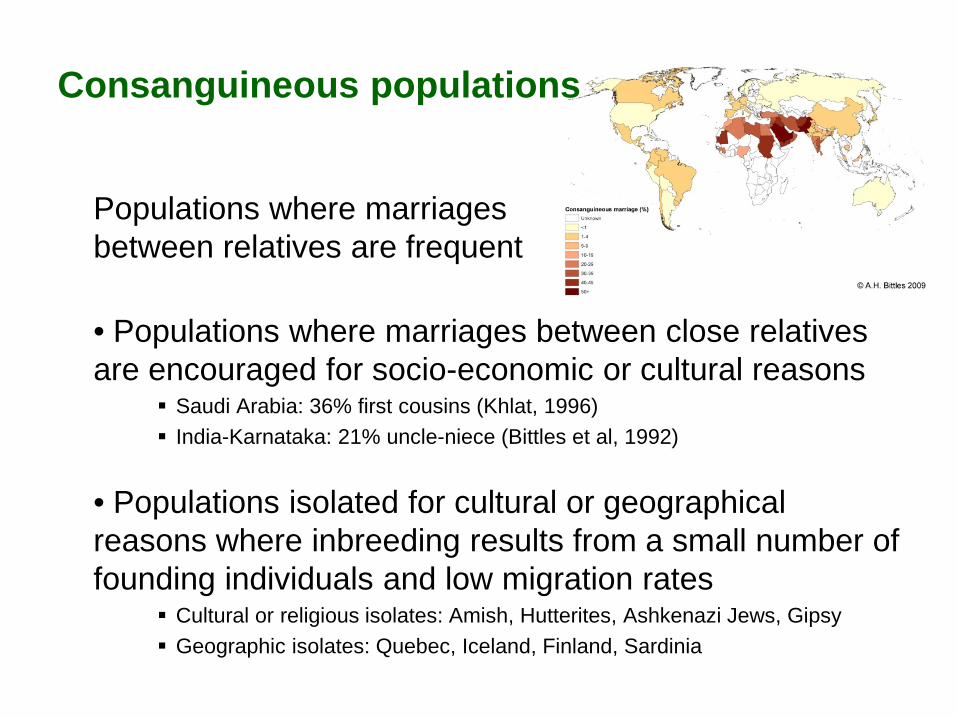
Populations where marriages between relatives are frequent • Populations where marriages between close relatives are encouraged for socio-economic or cultural reasons
Saudi Arabia: 36% first cousins (Khlat, 1996) India-Karnataka: 21% uncle-niece (Bittles et al, 1992)
• Populations isolated for cultural or geographical reasons where inbreeding results from a small number of founding individuals and low migration rates
Cultural or religious isolates: Amish, Hutterites, Ashkenazi Jews, Gipsy Geographic isolates: Quebec, Iceland, Finland, Sardinia
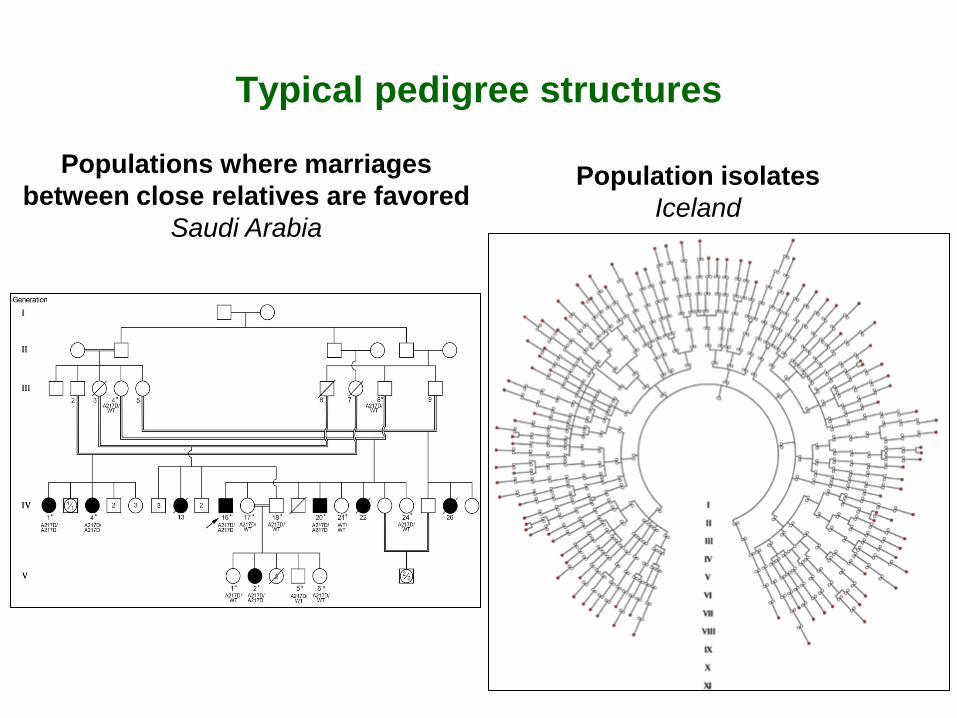
Typical pedigree structures
Population isolates Iceland
Populations where marriages between close relatives are favored
Saudi Arabia
Genetic consequences
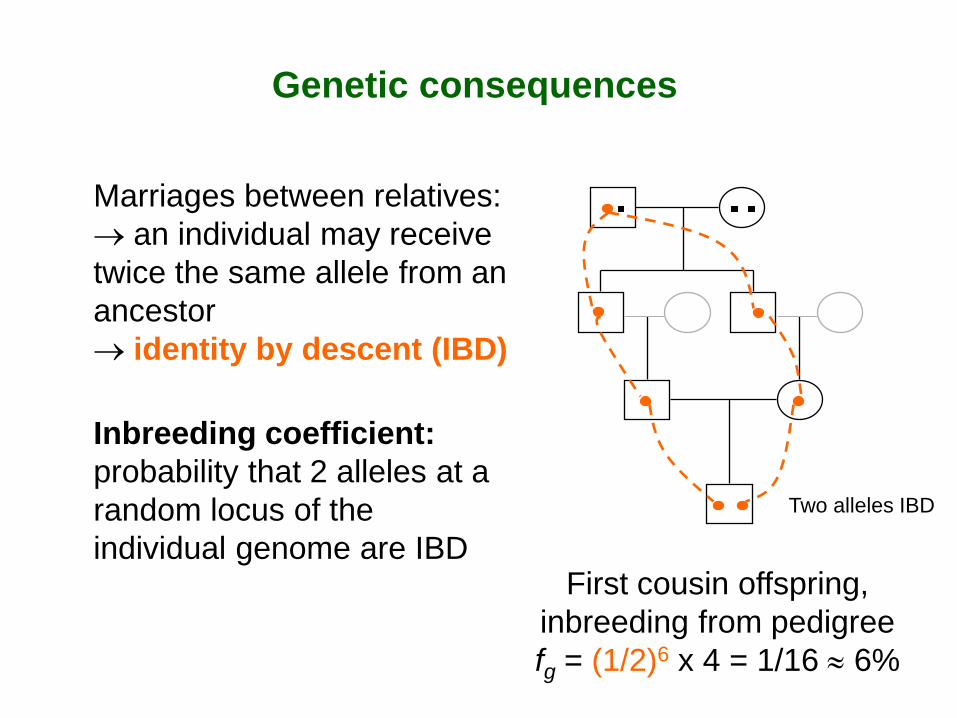
Marriages between relatives: → an individual may receive twice the same allele from an ancestor → identity by descent (IBD) Inbreeding coefficient: probability that 2 alleles at a random locus of the individual genome are IBD
First cousin offspring, inbreeding from pedigree fg = (1/2)6 x 4 = 1/16 ≈ 6%
Two alleles IBD

Within and between individual IBD
• In population isolates »several links between two individuals
• Identity by descent
»of the two alleles in one individual : IBD within individual, inbreeding coefficient »of the alleles of two different individuals: IBD between individuals, kinship coefficient
Measuring IBD: pedigree or genome ?
• Pedigree information is often incomplete, cannot go back more than a few generations »In consanguineous populations, pedigrees (if known) are large and complex
• In recent years, production of large amounts of information from the genome (millions of SNPs)
interest in estimating inbreeding and kinship from the genome, as the proportion of genome IBD
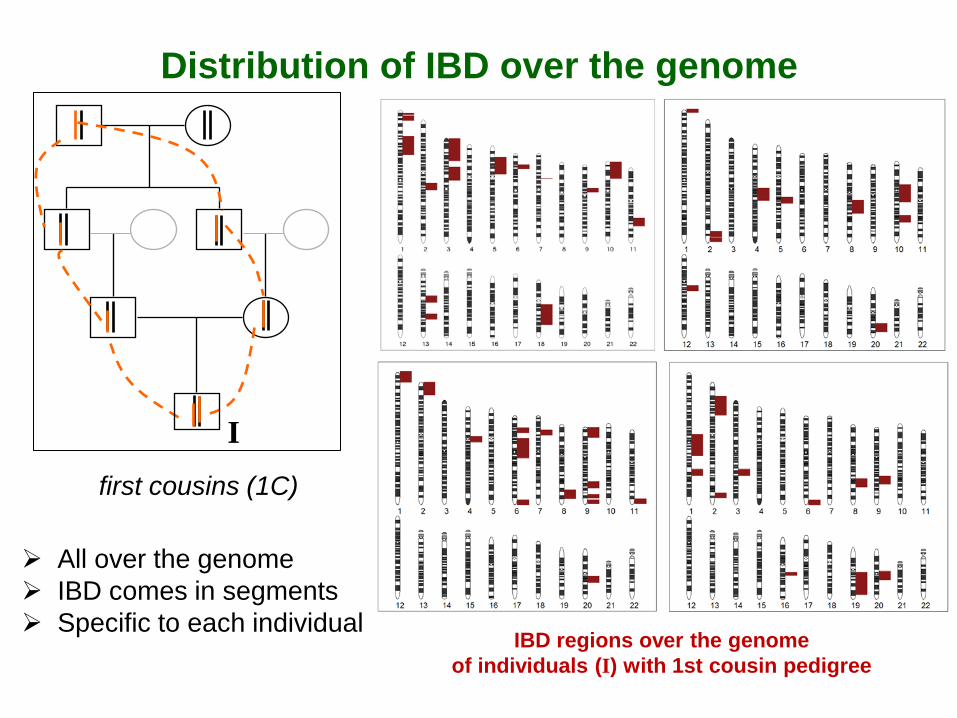
Distribution of IBD over the genome
IBD regions over the genome of individuals (I) with 1st cousin pedigree
I first cousins (1C)
All over the genome IBD comes in segments Specific to each individual
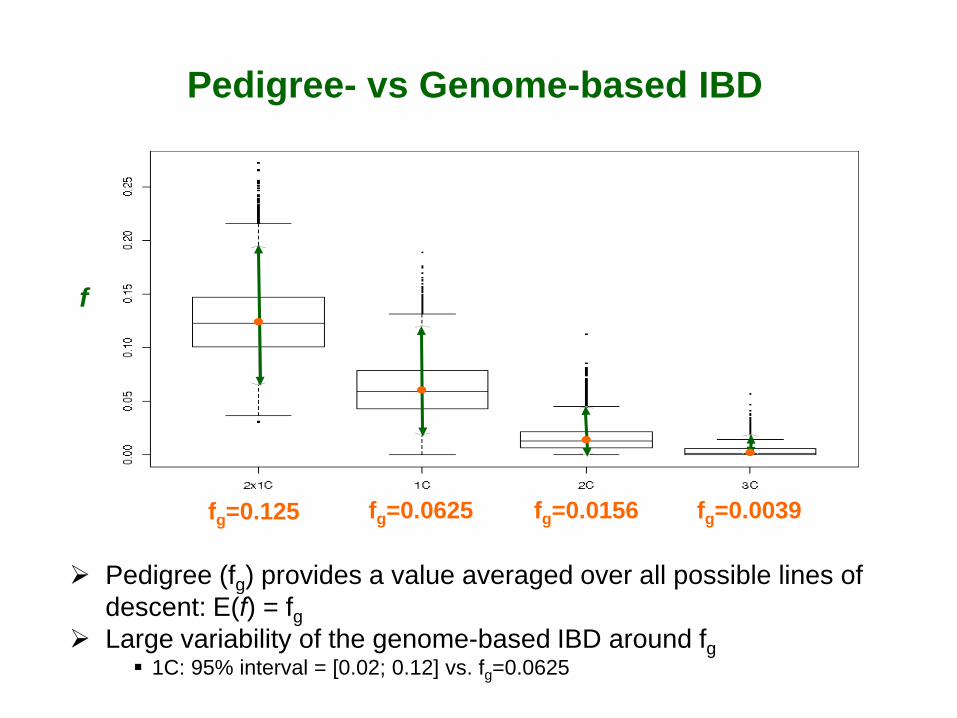
Pedigree (fg) provides a value averaged over all possible lines of descent: E(f) = fg
Large variability of the genome-based IBD around fg 1C: 95% interval = [0.02; 0.12] vs. fg=0.0625
fg=0.125 fg=0.0625 fg=0.0156 fg=0.0039
f
Pedigree- vs Genome-based IBD

As pedigree relatedness becomes more remote, IBD over the genome might not exist anymore No IBD segments in 29% of individuals for 3C
Given that there is IBD on the genome (f>0), IBD segments are long regardless of relatedness but they become rarer as relatedness becomes more remote (3C, 4C)
fg Prob. of no IBD segments
Average size of IBD segment
# of IBD segments (f > 0)
1C 0.0625 <10-4 15.28 cM 14.75 2C 0.0156 0.01 11.70 cM 4.94 3C 0.0039 0.29 9.52 cM 2.06 4C 0.0010 0.67 7.41 cM 1.36
Pedigree- vs Genome-based IBD

IBD estimation from marker genotypes
⇒ need models to infer IBD from genotypes at markers over the genome
If markers were fully informative, then identical alleles = identical by descent, IBD But markers have a limited number of alleles (SNPs only 2), so alleles may be identical (by state, IBS) without being IBD

Models for IBD inference
To decide between IBD and identity by state (IBS): • Rely on allele frequency at each marker independently
» rare alleles are more likely to be IBD than frequent alleles » Purcell et al (AJHG, 2007) (PLINK --het) → Inbreeding coefficient » Yang et al (AJHG, 2011) (GCTA) → Inbreeding & kinship coefficients
Models for IBD inference
To decide between IBD and identity by state (IBS): • Rely on allele frequency at each marker independently
» rare alleles are more likely to be IBD than frequent alleles • Rely on the segmental nature of IBD
» stretches of markers with shared alleles are more likely to be IBD than isolated ones
Need to define a minimum length threshold In humans usually around 1Mb, but still under debate (Pemberton et al, AJHG, 2012)
» alleles shared within individuals (runs of homozygosity, ROH) McQuillan et al (AJHG, 2008) (PLINK --homozyg) » alleles shared between individuals Gusev et al (Genom Res, 2009) (Germline)
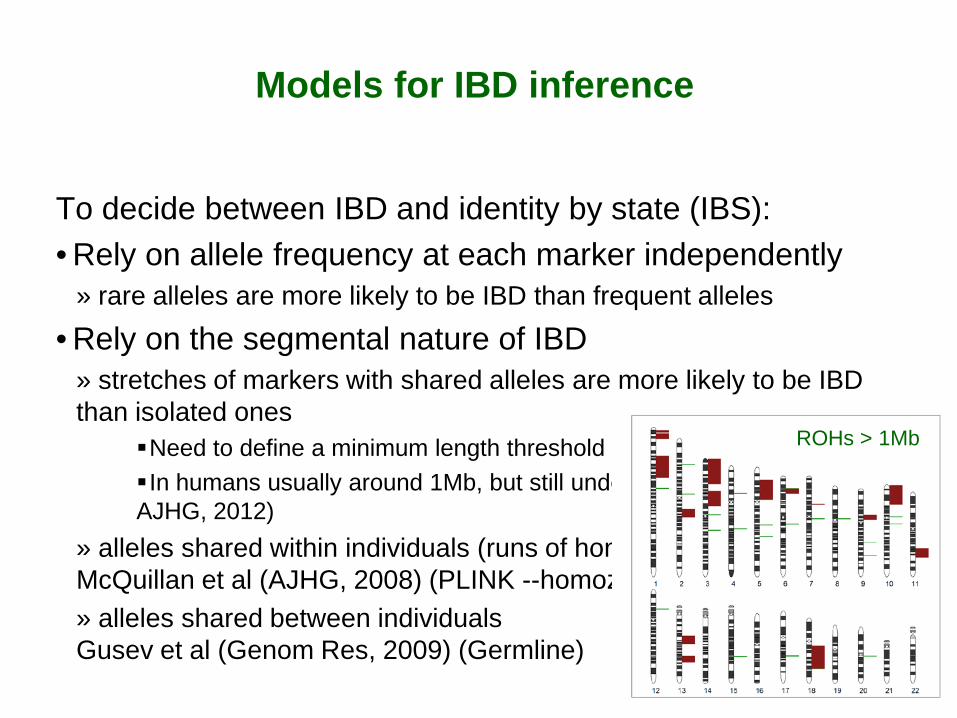
ROHs > 1Mb
Models for IBD inference
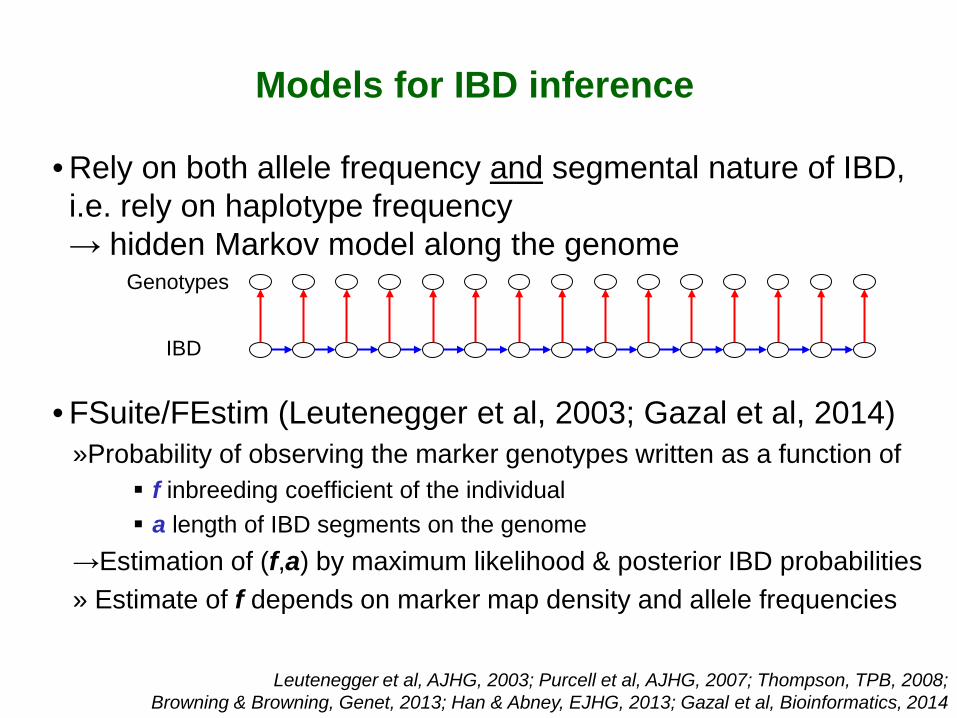
• Rely on both allele frequency and segmental nature of IBD, i.e. rely on haplotype frequency → hidden Markov model along the genome
• FSuite/FEstim (Leutenegger et al, 2003; Gazal et al, 2014) »Probability of observing the marker genotypes written as a function of
f inbreeding coefficient of the individual a length of IBD segments on the genome
→Estimation of (f,a) by maximum likelihood & posterior IBD probabilities » Estimate of f depends on marker map density and allele frequencies
Leutenegger et al, AJHG, 2003; Purcell et al, AJHG, 2007; Thompson, TPB, 2008; Browning & Browning, Genet, 2013; Han & Abney, EJHG, 2013; Gazal et al, Bioinformatics, 2014
Genotypes
IBD
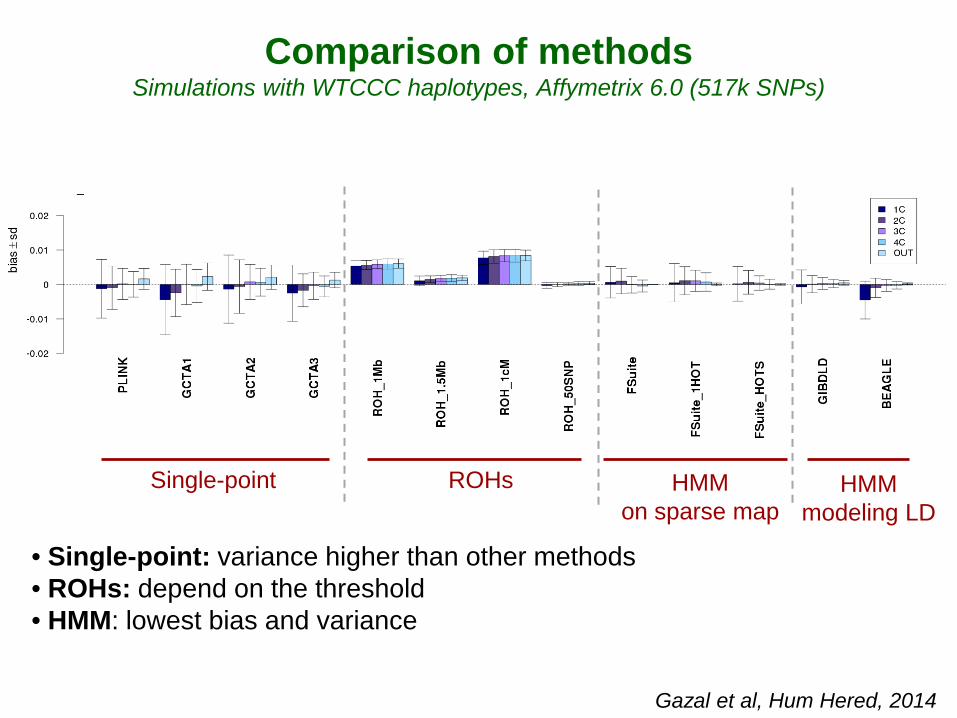
• Single-point: variance higher than other methods • ROHs: depend on the threshold • HMM: lowest bias and variance
Comparison of methods Simulations with WTCCC haplotypes, Affymetrix 6.0 (517k SNPs)
Gazal et al, Hum Hered, 2014
Single-point ROHs HMM on sparse map
HMM modeling LD

FSuite
Sans connaitre la généalogie:
- Détecter et estimer f par individu
- Inférer le type d’apparentement
entre les parents d’un individu
1C; 2C; 2x1C; AV.
- Estimer la proportion de ce type de mariage dans une population
1C: cousins germains;
2C: cousins de 2nd degré
2x1C: double cousins germains;
AV: oncle/nièce;

Final Phase African (AFR,7) 661 African Caribbean in Barbados (ACB) 96 African Ancestry in Southwest United States (ASW) 61
Esan in Nigeria (ESN) 99 Gambian in Western Division, The Gambia (GWD) 113 Luhya in Webuye, Kenya (LWK) 99 Mende in Sierra Leone (MSL) 85 Yoruba in Ibadan, Nigeria (YRI) 108
European (EUR,5) 503 Utah residents with European ancestry (CEU) 99 Finnish in Finland (FIN) 99 British in England and Scotland (GBR) 91 Iberian populations in Spain (IBS) 107 Toscani in Italy (TSI) 107
East Asian (EAS,5) 504 Chinese Dai in Xishuangbanna, China (CDX) 93 Han Chinese in Bejing, China (CHB) 103 Southern Han Chinese, China (CHS) 105 Japanese in Tokyo, Japan (JPT) 104 Kinh in Ho Chi Minh City, Vietnam (KHV) 99
South Asian (SAS,5) 489 Bengali in Bangladesh (BEB) 86 Gujarati Indian in Houston,Texas (GIH) 103 Indian Telugu in the United Kingdom (ITU) 102 Punjabi in Lahore, Pakistan (PJL) 96 Sri Lankan Tamil in the United Kingdom (STU) 102
Admixed American (ADM,4) 347 Colombian in Medellin, Colombia (CLM) 94 Mexican Ancestry in Los Angeles, California (MXL) 64 Peruvian in Lima, Peru (PEL) 85 Puerto Rican in Puerto Rico (PUR) 104
TOTAL 2,504
• 2 504 individus de 26 populations (5 régions)
• Présence de populations métissées
• FSuite est utilisé sur chaque population
• Calcul des fréquences alléliques par population (Freq. SAMPLE)
• Filtrage sur les polymorphismes fréquents (MAF>5%) : 81M -> 3M Variants
Application au panel 1000 Génomes
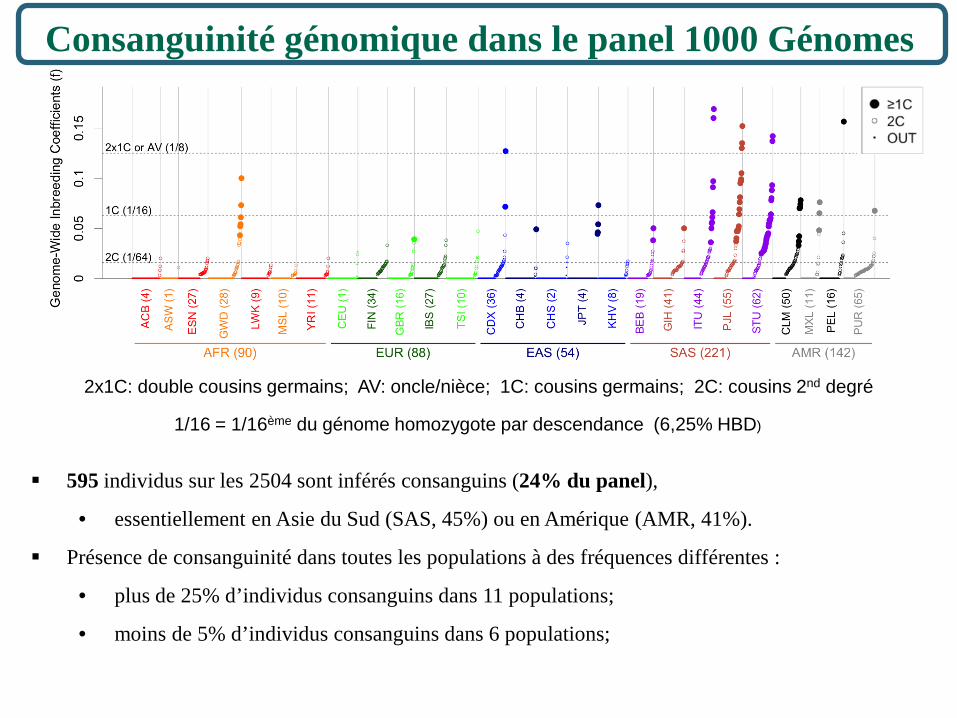
Consanguinité génomique dans le panel 1000 Génomes
595 individus sur les 2504 sont inférés consanguins (24% du panel),
• essentiellement en Asie du Sud (SAS, 45%) ou en Amérique (AMR, 41%).
Présence de consanguinité dans toutes les populations à des fréquences différentes :
• plus de 25% d’individus consanguins dans 11 populations;
• moins de 5% d’individus consanguins dans 6 populations;
1/16 = 1/16ème du génome homozygote par descendance (6,25% HBD)
2x1C: double cousins germains; AV: oncle/nièce; 1C: cousins germains; 2C: cousins 2nd degré

Deux-tiers de ces individus consanguins (64/94) proviennent de 3 populations d’Asie du Sud : ITU (10), PJL (22), STU (32).
Consanguinité génomique dans le panel 1000 Génomes
2x1C: double cousins germains; AV: oncle/nièce; 1C: cousins germains; 2C: cousins 2nd degré
Consanguinité éloignée : 501 individus inférés comme issus de couples de
cousins au 2nd degré (2C) La population finlandaise (FIN), a un tiers des individus détectés consanguins (34%, tous 2C). Ceci est en accord avec l'histoire de la population finlandaise : un petit nombre de fondateurs et très peu d’immigration.
Consanguinité proche: 94 individus inférés comme issus de couples de
cousins germains (1C) ou plus proche

TGP2457 Panel sans apparentement, ni consanguinité très proche (1er et 2nd degrés)
TGP2261 Panel sans apparentement, ni consanguinité proche (1er, 2nd et 3ème degrés)
supplément Table S4
(liste des 2504 individus)
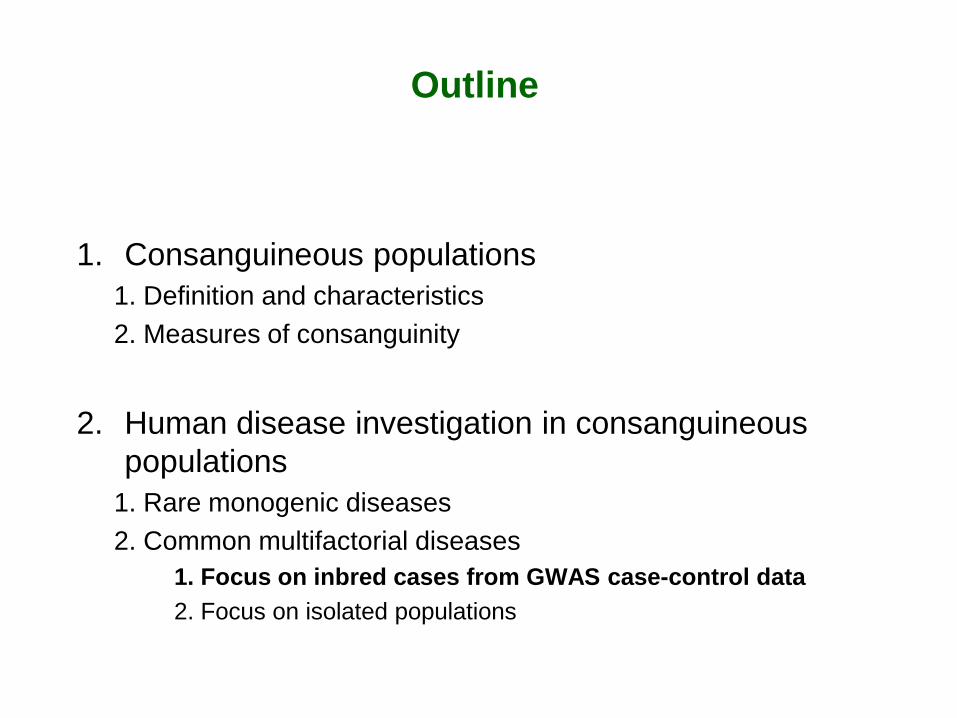
Outline
1. Consanguineous populations
1. Definition and characteristics 2. Measures of consanguinity 3. Consanguinity and Human Genetic Reference Panels
2. Human disease investigation in consanguineous populations
1. Rare monogenic diseases 2. Common multifactorial diseases
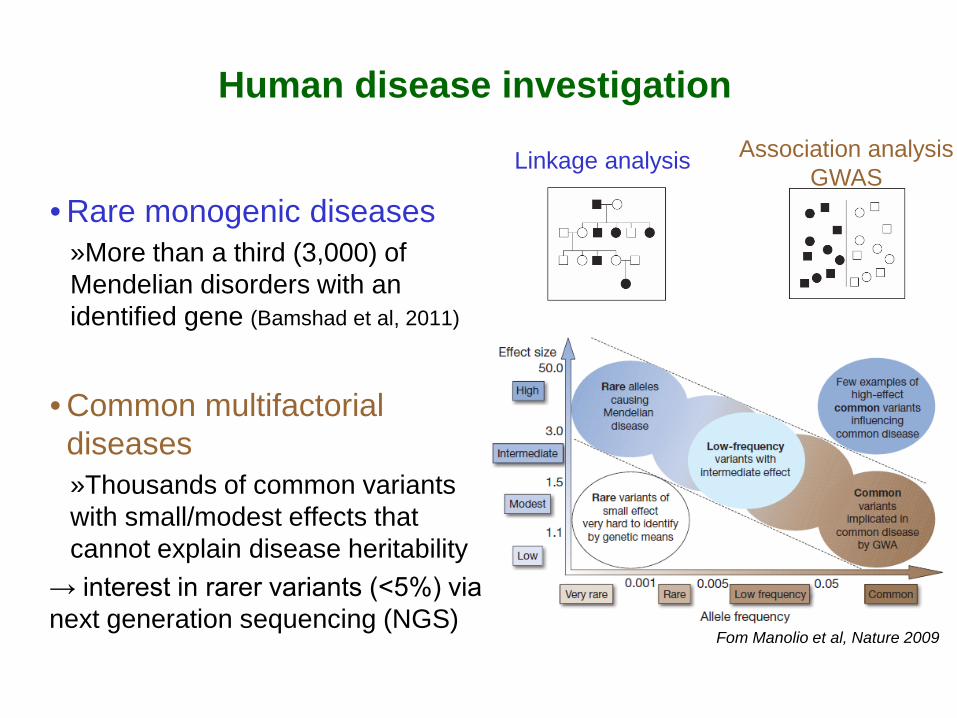
Fom Manolio et al, Nature 2009
Human disease investigation
• Rare monogenic diseases »More than a third (3,000) of Mendelian disorders with an identified gene (Bamshad et al, 2011)
• Common multifactorial diseases »Thousands of common variants with small/modest effects that cannot explain disease heritability
→ interest in rarer variants (<5%) via next generation sequencing (NGS)
Linkage analysis Association analysis GWAS

Interesting characteristics in consanguineous populations for disease investigation
• Identification of mutations involved in rare monogenic diseases » Within IBD recessive diseases (homozygosity mapping) » Between IBD in population isolates dominant diseases
• Identification of variants involved in common multifactorial diseases » Within IBD variants with recessive effects » Population isolates
Few founding individuals, within/between IBD reduced genetic complexity Shared environment reduced environmental heterogeneity
Outline
1. Consanguineous populations
1. Definition and characteristics 2. Measures of consanguinity 3. Consanguinity and Human Genetic Reference Panels
2. Human disease investigation in consanguineous populations
1. Rare monogenic diseases → recessive diseases 2. Common multifactorial diseases

Homozygosity mapping Lander and Botstein, Science, 1987
• Method to localize genes involved in rare recessive diseases
• An inbred affected is likely to receive two disease alleles IBD »IBD region around the disease locus
• Search the genome for a region where independent inbred affecteds are IBD
• Measure the evidence for linkage in the region with a LOD score
patient 1 patient 2 patient 3 patient 4
shared IBD region among patients

Powerful approach
• Even a single patient is informative for disease gene location (linkage), not true in outbred population
• A patient, offspring of first cousins, is as informative as an outbred nuclear family with 3 affected siblings
• Very interesting as multiple affected siblings are unlikely for recessive diseases (1 out 4 expected) But it requires knowing the pedigree of the patients
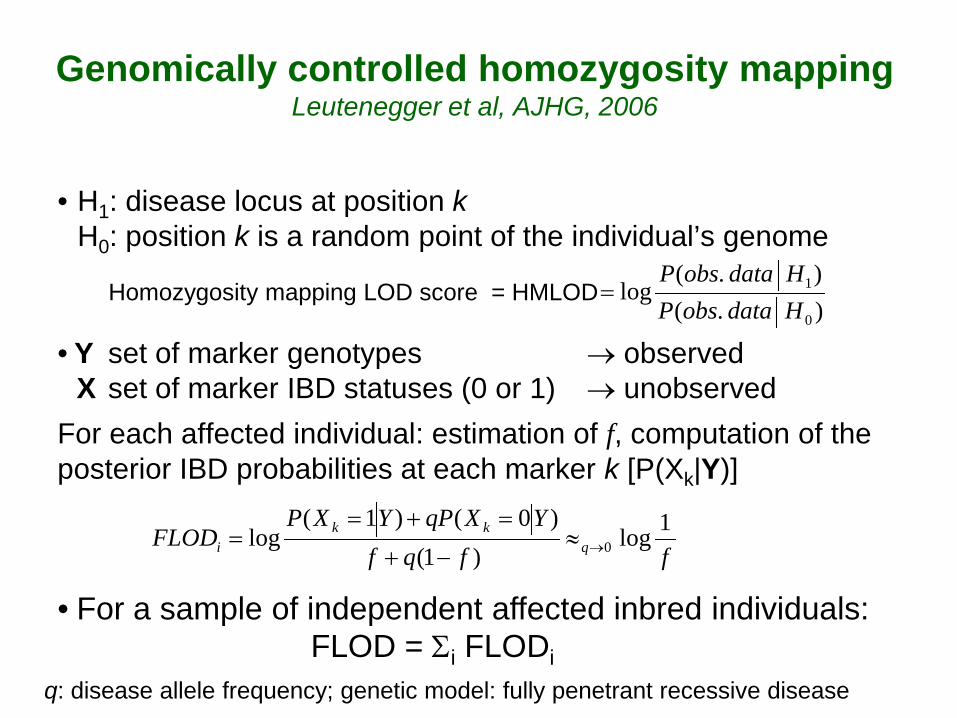
Genomically controlled homozygosity mapping Leutenegger et al, AJHG, 2006
• H1: disease locus at position k H0: position k is a random point of the individual’s genome
• Y set of marker genotypes → observed X set of marker IBD statuses (0 or 1) → unobserved
For each affected individual: estimation of f, computation of the posterior IBD probabilities at each marker k [P(Xk|Y)]
q: disease allele frequency; genetic model: fully penetrant recessive disease
• For a sample of independent affected inbred individuals: FLOD = Σi FLODi
ffqfYXqPYXP
FLOD qkk
i1log
)1()0()1(
log 0→≈−+
=+==
).().(
log0
1
HdataobsPHdataobsP
=Homozygosity mapping LOD score = HMLOD
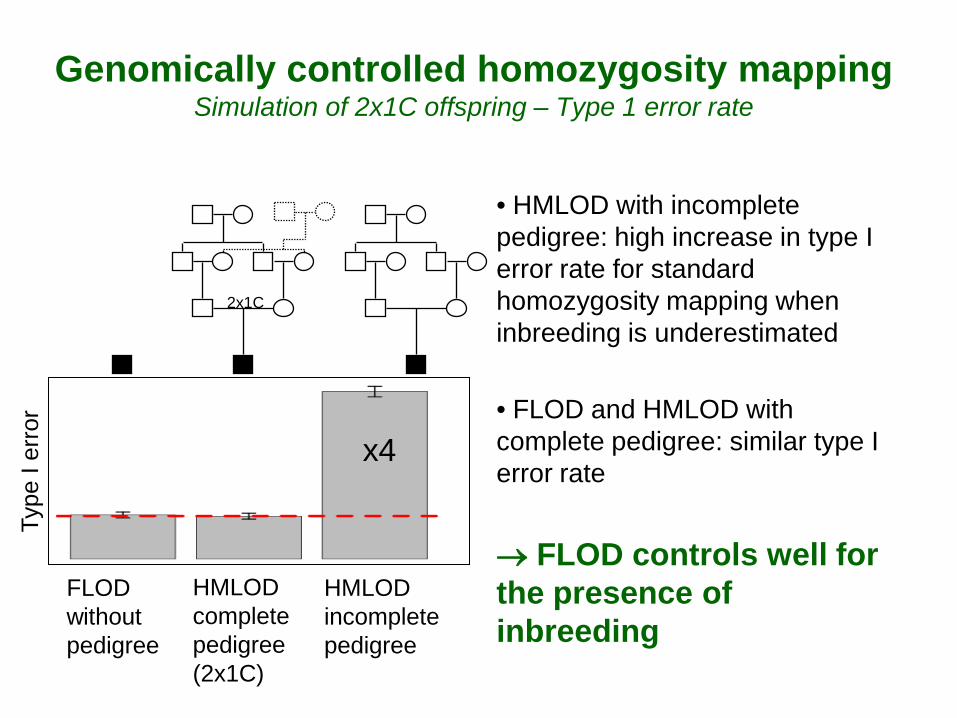
Genomically controlled homozygosity mapping Simulation of 2x1C offspring – Type 1 error rate
• HMLOD with incomplete pedigree: high increase in type I error rate for standard homozygosity mapping when inbreeding is underestimated
• FLOD and HMLOD with complete pedigree: similar type I error rate → FLOD controls well for the presence of inbreeding
x4
HMLOD complete pedigree (2x1C)
FLOD without pedigree
HMLOD incomplete pedigree
Type
I er
ror
2x1C

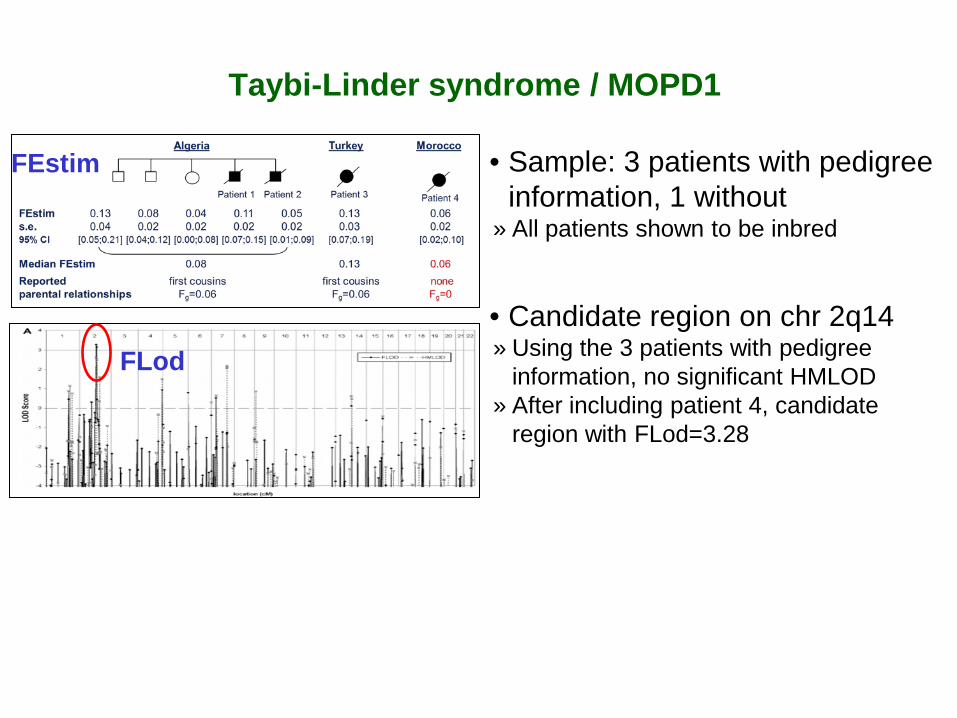
Taybi-Linder syndrome / MOPD1
• Sample: 3 patients with pedigree information, 1 without
» All patients shown to be inbred
FEstim
• Sample: 3 patients with pedigree information, 1 without
» All patients shown to be inbred
• Candidate region on chr 2q14 » Using the 3 patients with pedigree
information, no significant HMLOD » After including patient 4, candidate
region with FLod=3.28
FEstim
FLod
Taybi-Linder syndrome / MOPD1
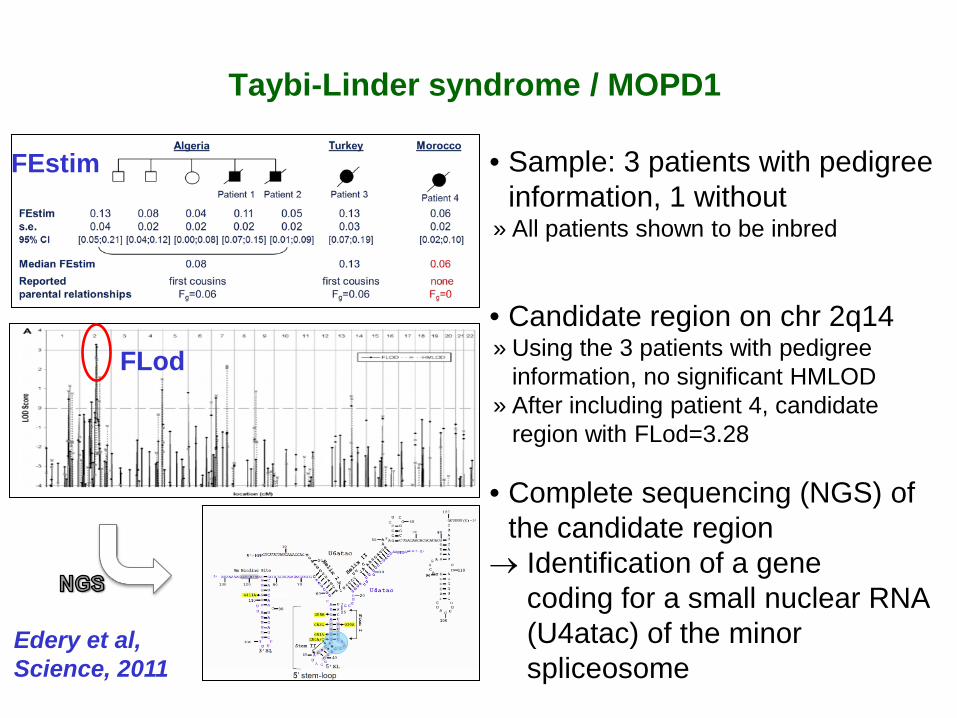
• Sample: 3 patients with pedigree information, 1 without
» All patients shown to be inbred
• Candidate region on chr 2q14 » Using the 3 patients with pedigree
information, no significant HMLOD » After including patient 4, candidate
region with FLod=3.28
• Complete sequencing (NGS) of the candidate region
→ Identification of a gene coding for a small nuclear RNA (U4atac) of the minor spliceosome
FEstim
FLod
Edery et al, Science, 2011
This would not have been found by exome sequencing. The first step of homozygosity mapping was essential.
Taybi-Linder syndrome / MOPD1
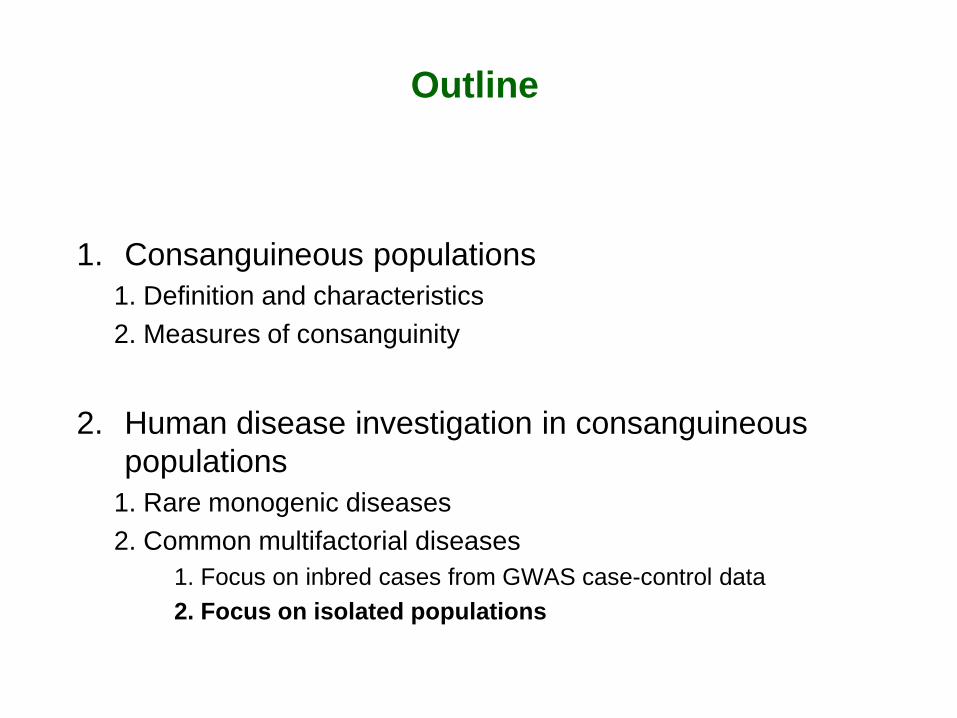
Outline
1. Consanguineous populations
1. Definition and characteristics 2. Measures of consanguinity
2. Human disease investigation in consanguineous populations
1. Rare monogenic diseases 2. Common multifactorial diseases
1. Focus on inbred cases from GWAS case-control data 2. Focus on isolated populations

• Genome-wide case-control association studies (GWAS) have identified many common variants over the past 10 yrs »Single marker tests, additive genetic models
• GWAS were not designed to detect rare variants or variants with recessive effects
• Can focusing on inbred cases identified in GWAS data help identify such variants? →HBD-GWAS strategy (Genin et al, Hum Hered, 2012)
»Detect inbred cases in GWAS case-control data »Perform genomically-controlled homozygosity mapping
Focusing on inbred cases in GWAS

WTCCC Type 2 Diabetes
•1,924 cases / 2,938 controls »Affymetrix 500k SNPs
•17 cases found to be inbred with f>0.01
•5 cases shared an IBD segment on chr 1, no controls »Only one gene (NEGR1), previously found associated with obesity
FLOD≥1
Outline
1. Consanguineous populations
1. Definition and characteristics 2. Measures of consanguinity
2. Human disease investigation in consanguineous populations
1. Rare monogenic diseases 2. Common multifactorial diseases
1. Focus on inbred cases from GWAS case-control data 2. Focus on isolated populations

Focusing on isolated populations
… To study complex traits : Reduced genetic, phenotypic and environmental heterogeneity
… To study rare variants : Each population isolate is a random draw from the general population → some rare variants will become more frequent in the isolated population → more power to identify them

Next-generation association study in isolated populations
Cost efficient strategy originally proposed in the Icelandic population
»SNP genotyping on the whole population (scaffold) »Focus on a subset of the population for sequencing »Impute back the detected variants in the whole population »Perform association analysis
Zeggini, Nat Genet, 2011 Holm et al, Nat Genet, 2011

Next-generation association study in isolated populations
Zeggini, Nat Genet, 2011 Holm et al, Nat Genet, 2011
Cost efficient strategy originally proposed in the Icelandic population
»SNP genotyping on the whole population (scaffold) »Focus on a subset of the population for sequencing »Impute back the detected variants in the whole population »Perform association analysis

How to select the subset to be sequenced ?
Need to select “representative” individuals
Each selected individuals should be • Representative of many other individuals • Not representative of another selected individuals Representative = sharing genome IBD

Measure of representativeness for selection
• Kinship coefficient between individuals = proportion of genome shared IBD → a measure at the genome-level Abecasis et al, 2010 (ExomePicks); Urrichio et al, Genet Epi, 2012
• Use the shared IBD segments between individuals to
measure the portion of the population genome that each selected individual provides (utility) Gusev et al, 2009 (Germline); Gusev et al, Genet, 2012 (INFOSTIP)
Select
individual A
IBD segments
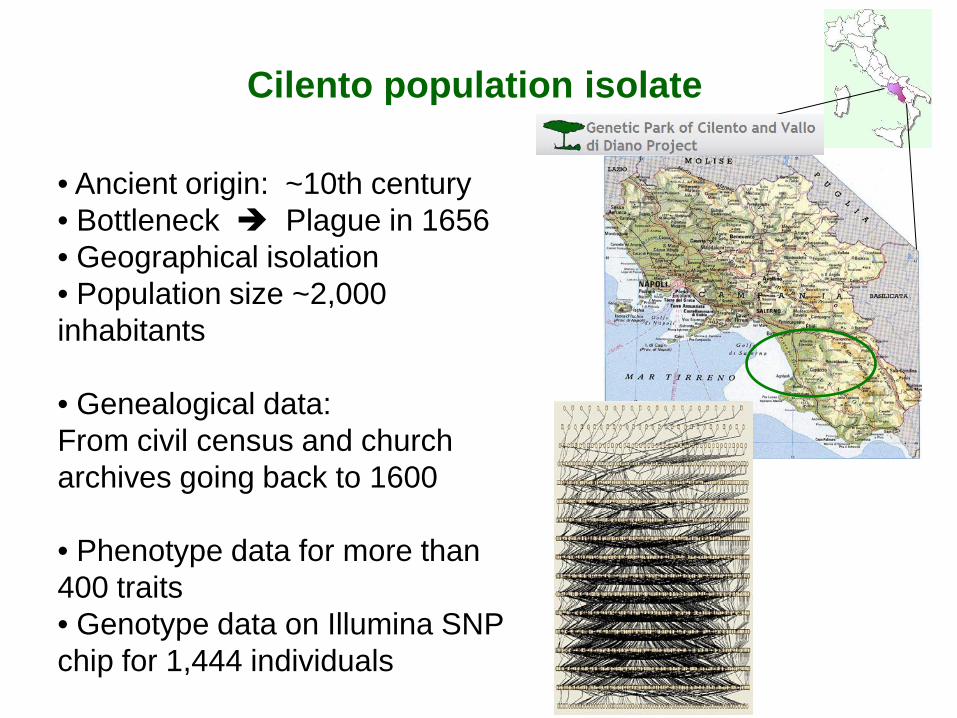
Cilento population isolate
• Ancient origin: ~10th century • Bottleneck Plague in 1656 • Geographical isolation • Population size ~2,000 inhabitants
• Genealogical data: From civil census and church archives going back to 1600
• Phenotype data for more than 400 traits • Genotype data on Illumina SNP chip for 1,444 individuals
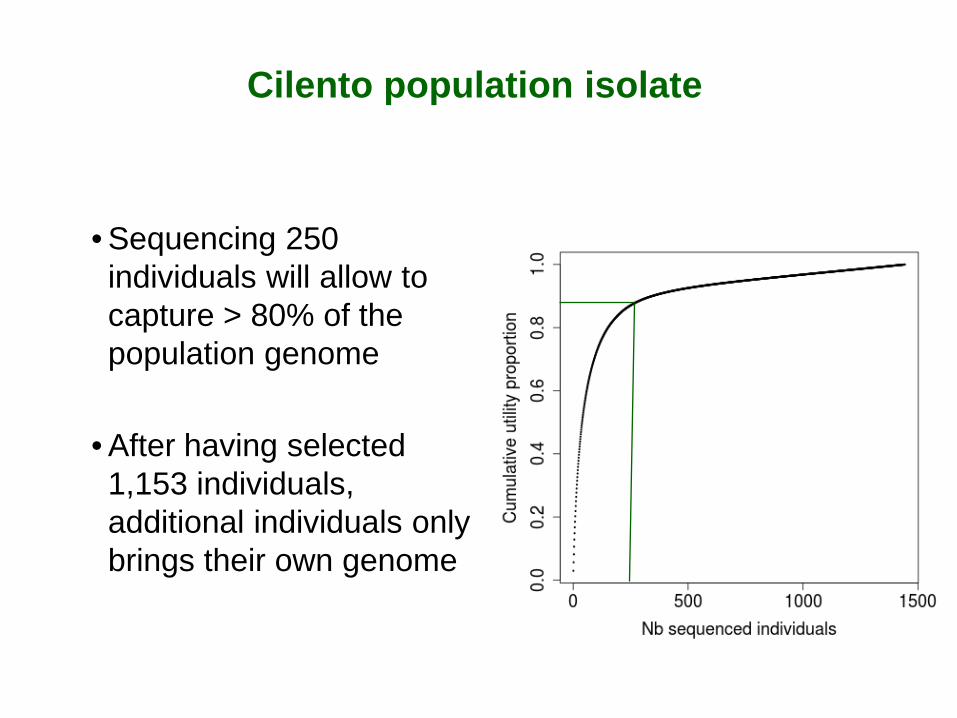
Cilento population isolate
• Sequencing 250 individuals will allow to capture > 80% of the population genome
• After having selected 1,153 individuals, additional individuals only brings their own genome

Conclusion
• Consanguineous populations have interesting characteristics for human disease investigation: IBD within (consanguinity) and between (kinship) individuals » rare monogenic diseases » common multifactorial diseases
• Population isolates and rare variants involved in common multifactorial diseases
• Need to keep developing methods for accurate IBD estimation from the genome

Acknowledgements
Inserm, France Anne-Louise Leutenegger Steven Gazal Marie-Claude Babron Céline Bellenguez Hervé Perdry Emmanuelle Génin Françoise Clerget-Darpoux
TALS study Patrick Edery, CHU Lyon
IGB-CNR, Naples Teresa Nutile Marina Ciullo
CEPH, Paris
Jean François Deleuze