biogas production from food waste and vegetable...
TRANSCRIPT

K. Hussaro, J. Intanin, and S. Teekasap / GMSARN International Journal 11 (2017) 82 - 89
82
Abstract— The experimental co-digestion of biogas production of typical food waste with vegetable waste and chicken dung from the Sakaew Temple Community, Angthong Provice, Thailand, in order to identify the optimization condition that determine the amount of biogas and methane content. The process in this research were consisted of 4 methods, which were the survey of food waste to the community, design and set up biogas production system, fermentation experiment to find the optimum condition, and technology transfer to the community. Biogas production was operated in 200 L of digester for 40 days. During this research process, the materials for biogas process were mixed in the 5 different ratios of food waste with vegetable waste : chicken dung as follows; 1 : 1 (Digester D3), 2 : 1 (Digester D4) , 3 : 1 (Digester D5), 1:0 (Digester D1), and 0 : 1 (Digester D2). From this result, it was found that the ratio of food waste to the chicken dung, 1:1 (Digester D3) was provided the highest amount of biogas, which was 18.83 kg and the highest content methane gas were 72 %. The carbon to nitrogen ratio, temperature digester, and pH at the digester D3 were 18.83, 29.8 ºC, and 6.87, respectively. After calculating the economic internal rate of return, it was found that the payback period was 16.4 days for the digester D3. The results of the satisfaction evaluation for the technology transfer to the Sakaew Temple Community, Angthong Province shown that the participants were mostly satisfied. Keywords— Food waste, chicken dung, renewable energy, biogas production, Sakaew temple community.
1. INTRODUCTION
Nowadays, the energy and environmental issues are considered as the very important issues, both in Thailand and many countries around the world. The final energy consumption was about 74,214 tons of oil equivalents in Thailand in 2013, which increasing about 2.6 % from that of in 2012. The energy consumption was 1,793 billion baht. The proportion of 81.4 % of the final energy consumption was used to the consumption energy, which remaining 7.9 % of renewable energy and 10.7 of traditional renewable energy. Therefore, 61,236 tons of oil equivalent has used to commercial energy consumption by 2013. There was increased about 1.5 % from 2012, which consist of (i) Oil has been used 35,948 tons of oil equivalent, there were increased about 3.1%, (ii) Electricity has been used 14,002 tons of oil equivalent, there were increased about 1.6 %, (iii) Coal and lignite were using 5,947 tons of oil equivalent, which were decreased about 9.6 %, and (iv) Natural gas has been used 5,339 tons of oil equivalent with increasing about 4.8 %. For renewable energy (Solar energy, coal, firewood, rice husks, bagasse, agricultural waste, waste
K. Hussaro (corresponding author) is with the Faculty of
Hospitality and Tourism Industry, Rajamangala University Technology Rattanakosin, Salaya, Phutthamonthon, Nakhon Pathom 73170, Thailand. Phone: +66-84-757-7653; Fax: +66-2-441-6008; E-mail: [email protected] or [email protected].
J. Intanin is with the Rattanakosin College for Sustainable Energy and Environment, Rajamangala University Technology Rattanakosin, Salaya, Phutthamonthon, Nakhon Pathom 73170, Thailand. E-mail: [email protected] or [email protected].
S. Teekasap was with Department of Mechanical Engineering, Faculty of Engineering, Eastern Asia University,Thayaburi, Pathum Thani, 12110, Thailand. E-mail: [email protected].
residues, and biogas), 5,902 tons of oil equivalent has been used, there was increased about 4.7 %. Finally, Renewable energy (Charcoal, firewood and agricultural residues) has traditionally used 8,076 tons of oil equivalent, which an increasing about 10 % from 2012 [1].
Ministry of Energy has forecast the country's future energy used which needs to demand for 99,838 tons of oil equivalent in Thailand. Therefore, there are implemented a plan to develop renewable and alternative energy about 25 % in 10 years (between 2012-2021). Biogas production target was 3,600 MW for 2021 (600 MW from industrial waste and manure and 3,000 MW from Napier grass). There are widely encouraging community participation in the biogas production and use of renewable energy by encouraging the production of biogas at the household level. Especially, rural communities have receiving the benefit and support for the development of gas pipeline networks for biogas in the community.
Anaerobic digestion (AD) refers to a process where organic matter is synergistically decomposed by a microbial consortium in an oxygen free environment. AD can be used to convert organic matter into biogas for energy recovery and achieve waste stabilization and odors reduction [2]. AD can be operated under liquid (wet), semi-solid, or solid-state (dry) conditions, when the total solids (TS) of substrate are < 10%, 10-15 %, or >15 %, respectively. Largely, liquid AD is frequently applied in the full-scale operations, owing to reasons such as easy operation and maintenance, and increasing methane yield [3]. Biogas mainly composed of 50-70 % of methane, CH4 (valorized in electricity and heating) and 50-30 % of carbon dioxide, CO2 with traces of other impurities, such as hydrogen sulfide (H2S), ammonia
K. Hussaro, J. Intanin, and S. Teekasap
Biogas Production from Food Waste and Vegetable Waste for
the Sakaew Temple Community Angthong Province Thailand
K. Hussaro, J. Intanin, and S. Teekasap / GMSARN International Journal 11 (2017) 82 - 89
83
(NH3), and water vapor [4]. Co-digestion of mixed substrates offers many
advantages, including ecological, technological, and economic benefits as compared to a single substrate digestion. However, the combination of two or more different types of feedstock requires the careful selection to improve the efficiency of anaerobic digestion. The aim of the co-digestion is to balance nutrients (C/N ratio and macro- and micronutrients) and dilute inhibitors/toxic compounds to enhance methane production [5]. Namely, it could be improved the buffer capacity and reduced ammonia inhibition of the liquid mixture due to the better carbon and nutrient balance [6, 7]. The optimal carbon to nitrogen (C/N) ratio of 15-30 is preferred for anaerobic digestion and hence external supplementation of carbon has to be regularly performed to dilute (Total Kjeldahl Nitrogen: TKN) concentration, in order to achieve a stable and efficient process. It should be noted that the dilution can done by adding water [3].
There were many factors would influence on anaerobic co-digestion such as temperature, pH, organic loading rate, and hydraulic retention time. The pH value was the crucial importance, it could affect the activities of specific acidogenic and methanogenic bacteria, then affecting to the biogas production. The optimal pH range of anaerobic co-digestion for biogas generation was between 6 and 8 [8]. Normally, anaerobic bacteria can grow at psychrophilic (10-30 °C), mesophilic (30-40 °C), and thermophilic (50-60°C) conditions. The performance of AD was increased with an increase in temperature, stressing the advantages of the thermophilic operation with its higher metabolic rates, higher specific growth rates, and higher rates of the detruction of pathogens along with higher biogas production. However, many advantages were observed under thermophilic condition, some disadvantages are worth considering since the thermophilic process is more sensitive to environmental changes than the mesophilic process [9].
As Thailand is an agricultural country, it has enormous sources of biomass that can be used for the production of renewable energy such as agricultural residues and animal manure. Sakaew Temple Community Angthong Province has a large population of food waste, which it has become a big environmental problem. Generating large amounts of surplus animal manure can be used in biogas production to produce renewable energy. Food waste has already been considered as a very attractive feedstock for anaerobic digestion due to its high methane potential [10]. Food waste is a desirable material to co-digestion with animal manure because of its high biodegrability [11].
The aims of this study were to evaluate the potential of anaerobic co-digestion of food waste with vegetable waste and chicken dung along with the effect of mixing ratios of food waste with vegetable waste and chicken dung on amount of biogas and methane content. Another objective was to calculate an economic analysis via payback period value from optimizing digester of mixture of food waste with vegetable waste and chicken dung.
2. MATERIALS AND METHODS
2.1 Collection and Preparation of Substrates
Chicken dung was collected from a dairy farm near Sakaew Temple Community Angthong Province, Thailand during April 2016. The samples were scraped off the feed lanes and collected in 200-L buckets. The samples were transported immediately to the Sakaew Temple Community (Sakaew Temple School). Food waste with vegetable waste was collected, during April 2016, from Sakaew Temple Community Angthong Province (Sakaew Temple School) processing of average 105.28 kg/day of food waste with vegetable waste, by screening and grinding, as a feedstock for an anaerobic co-digester. 2.2 Anaerobic Co-digestion 2.2.1 Experimental design and set-up
The anaerobic co-digestion experiments were carried out on varying mixtures of food waste with vegetable waste and chicken dung in order to determine the best combination of substrates ratios for biogas production. The experiments were conducted in five identical 200 L digester reactors with 150 L working volume using water displacement. The digesters’ reactors were labeled D1 (food waste with vegetable waste : chicken dung, 1:0), D2 (food waste with vegetable waste : chicken dung, 0:1), D3 (food waste with vegetable waste: chicken dung, 1:1), D4 (food waste with vegetable waste : chicken dung, 2:1), and D5 (food waste with vegetable waste : chicken dung, 1:2). The Schematic diagram for anaerobic co-digestion device is presented in Fig. 1. These mixture ratios were specified according to the amount of food waste with vegetable waste and chicken dung that could be delivered to existing Sakaew Temple School and dairy farm in Sakaew Temple Community Angthong Province where the co-digestion practice is intended. It was intended to co-digest this amount of chicken dung with either 30 and 30 kg/day of food waste with vegetable waste. These quantities of food waste can be delivered by two or three buckets respectively. The initial volume of chicken dung for the digestion of chicken dung and water were 30 kg and 70 liter, respectively. Aftter the chicken dung was mixed with the water in the ractors, food waste with vegetable waste was added to fill the volumes up to effective volumes of the follow five ratios of substrates. All the reactors were carried out in duplicate using 200-L anaerobic reactors at mesophilic temperature for 40 days.
2.2.2 Analytical Methods
Total solids (TS), volatile solids (VS), ammonia nitrogen, TKN, volatile suspended solids, suspended solids, total phosphorus (P), total nitrogen (N), chemical oxygen demand (COD), COD:N:P, carbon content, nitrogen content, and carbon to nitrogen ratio (C/N ratio) were measured in accordance with the standard methods (APHA, 1999) [12]. The pH and temperature of the substrated mixture in the digesters was measured every
day by pH meter and data logger (Amron, ZR-RX25), respectively. Biogas was colleted by water displacement method. The biogas volume was calculated daily and

K. Hussaro, J. Intanin, and S. Teekasap / GMSARN International Journal 11 (2017) 82 - 89
84
transformed into the volume at STP condition. Biogas samples were examined by Geotech, BIOGAS 5000 to determine the CH4 and CO2 content.
Fig. 1. The Schematic Diagram for Anaerobic Co-Digestion Device.
3. RESULTS AND DISCUSSION
The dialy record of food waste from Watsrakaew school, Angthong province for March-April 2016 is shown in Table 1. Watsrakaew School, Angthong Province, produced average and accumulates about 105.28 kg/day and 5,484.75 kg for 53 days of the food waste with vegetable waste, respectively. On the other hand, food waste is a potential organic substrate for biogas production through anaerobic digestion (AD), which 1 kg of food waste can be produced biogas 41 L [13]. Therefore, the feasibility 105.28 kg/day of food waste can be produced 4,324.27 L/day of biogas.
3.1 Characteristics of Substrates
The chemical characteristics of food waste with vegetable waste and chicken dung are shown in Table 2. It was found that, food waste contain 28,000 mg/l of chemical oxygen demand (COD), and 100:1.46:1.59 of
COD/N/P ratio, which there was COD/N/P ratio more than the theory and literature reported [14]. For the decomposition of organic matter by fermentation using anaerobic conditions, independent of the biogas process. From this research shows that the food wastes had nutrients (nitrogen and phosphorus) sufficient for the growth of microorganisms.
The C/N ratio of food waste and chicken dung was 26.76 and 8.9 respectively. Food waste and chicken dung were considerably suitable for anaerobic digestion, which is consistent with other research and theory [15]. The carbon-to-nitrogen ratios for each digester that were affect the production of biogas as shown in Table 3. The results found that the ratio of carbon to nitrogen is sufficient and suitable for the production of biogas between 8.9 to 26.76.
3.2 Biogas Production from Food Waste with Vegetable Waste and Chicken Dung
Fig. 2 represents typical biogas production curves for D1 (food waste: chicken dung = 1:0), D2 (food waste: chicken dung = 0:1), D3 (food waste: chicken dung = 1:1), D4 (food waste: chicken dung = 2:1), and D5 (food waste: chicken dung = 3:1). From this figure, it can be suggested that co-digestion was easily and completely biodegradable by the population of a digester 3 to digester 5 within 9 days. While, mono digestion had a long time completely biodegradable by the population of a digester 1 to digester 2 within 14 days. The cumulative biogas production of D3, D4, D5, D1, and D2 were 2,104.7, 1,855.21, 1,607.39, 1,152.45, and 704.76 L, respectively. The addition D3 was significantly highest biogas production, indicating that the maximum metabolic capacity for the microbial population was exceeded. The carbon to nitrogen (C/N) ratio of D3 was 18.83, indicating that the maximal biogas production capacity of the population was reached, which is in agreement with the findings of the other research [16].
The optimum C/N ratio for anaerobic co-digestion to obtain higher biogas production may depend on the type of waste used as co-substrate for C/N ratio adjustment. As in the present research, highly biodegradable chicken dung with high nitrogen content (Table 2) was mixed with food waste, vegetable waste, which has comparatively low nitrogen and biodegradability.
Fig.2. Comparison of Biogas Production from All Digesters; D1 (food waste: chicken dung = 1:0), D2 (food waste: chicken dung = 0:1), D3 (food waste : chicken dung = 1:1), D4 (food waste : chicken dung = 2:1), and D5 (food waste : chicken dung = 3:1).

K. Hussaro, J. Intanin, and S. Teekasap / GMSARN International Journal 11 (2017) 82 - 89
85
Table 1. Amount of Food Waste with Vegetable from Sakaew Temple Community, Angthong
Day/Month/
year
Amount of food waste
(kg)
Height of water
(h, cm)
Volume of wet food
waste
( L )
hDV 2
10004
=
π
8/3/2559 103 56 28.21
9/3/2559 114 57 28.71
10/3/2559 125 59.5 29.97
11/3/2559 117.75 59.5 29.97
12/3/2559 110.5 56 28.21
13/3/2559 109.5 57 28.71
14/3/2559 108.5 59 29.72
15/3/2559 104.75 56.5 28.46
16/3/2559 101 58 29.21
17/3/2559 96.75 59.5 29.97
18/3/2559 92.5 57 28.71
19/3/2559 102 55.5 27.95
20/3/2559 113 58 29.21
21/3/2559 97 56 28.21
22/3/2559 106 60 30.22
23/3/2559 111 57.5 28.96
24/3/2559 99 55 27.70
25/3/2559 112 58 29.21
26/3/2559 98 56.5 28.46
27/3/2559 109 59 29.72
28/3/2559 115 60.5 30.47
29/3/2559 103 53 26.69
30/3/2559 101 58 29.21
1/4/2559 110 57.5 28.96
2/4/2559 99 59.5 29.97
3/4/2559 97 58 29.21
4/4/2559 106 60.5 30.47
6/4/2559 114 61 30.72
7/4/2559 107 59.5 29.97
8/4/2559 109 55.5 27.95
9/4/2559 97 58 29.21
10/4/2559 99 56.5 28.46
11/4/2559 103 57 28.71
12/4/2559 106 59 29.72
13/4/2559 105 57.5 28.96
Table 1. Amount of Food Waste with Vegetable from Sakaew Temple Community, Angthong (Con’t)
Day/Month/
year
Amount of food waste
(kg)
Height of water
(h, cm)
Volume of wet food
waste
( L )
hDV 2
10004
=
π
14/4/2559 98 55.5 27.95
15/4/2559 99.5 58.5 29.46
16/4/2559 114 59.5 29.97
17/4/2559 111 60.5 30.47
18/4/2559 109 56 28.21
19/4/2559 97 56.5 28.46
20/4/2559 103 58 29.21
21/4/2559 99 57 28.71
22/4/2559 111 57.5 28.96
23/4/2559 98 55.5 27.95
24/4/2559 112 59 29.72
25/4/2559 106 53 26.69
26/4/2559 115 61 30.72
27/4/2559 97 53.5 26.95
28/4/2559 105 59.5 29.97
29/4/2559 108 59 29.72
30/4/2559 98 57.5 28.96
31/4/2559 106 55 27.70
Total value 5,484.75 2,997.5 1,509.74
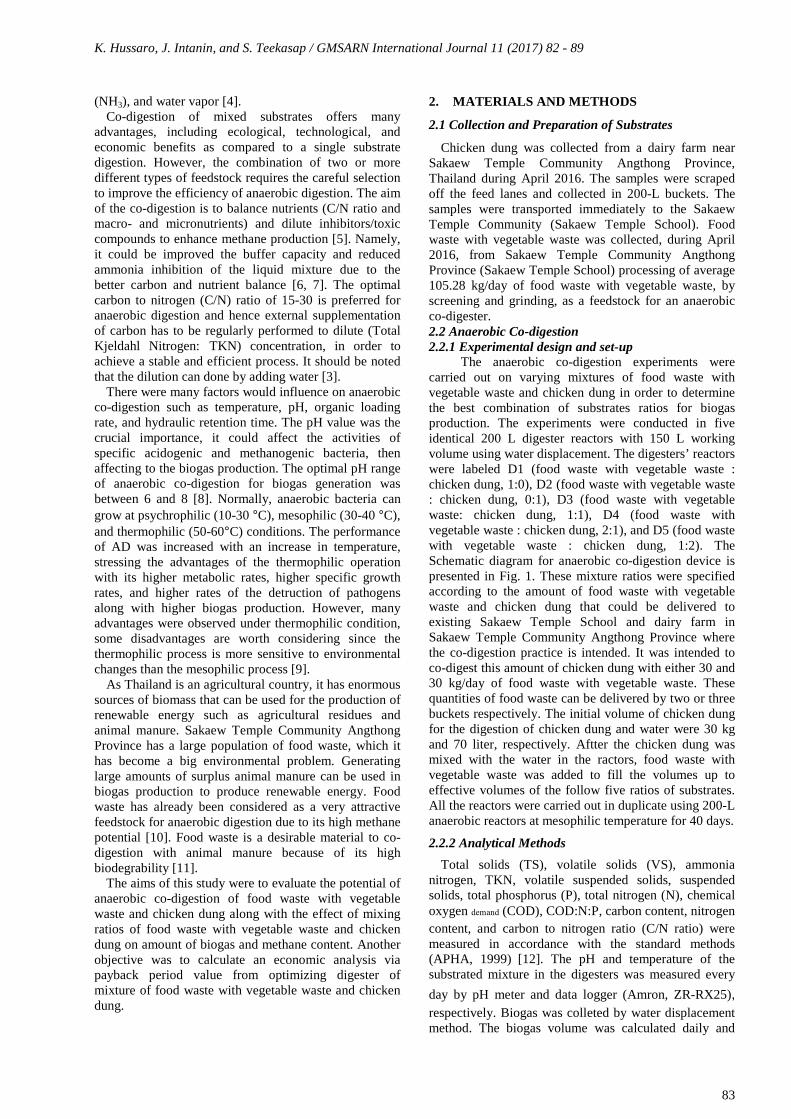
Analysis of variance for biogas production from all digesters is reported in Fig. 3. The analysis revealed that the food waste with vegetable waste ratio and chicken dung is significantly positively correlated with biogas production, p-value = 0.001. Since, p-value is lesser than 0.05, which is concluded that the correlation coefficients are statistically significant at 99% confidence level. The calculate means value for biogas production from all digesters are presented in Fig. 3, it was found that the highest mean data from all digesters was obtained in D3 including to normal probability plot had linear.
3.3 Methane Content from Food Waste with Vegetable Waste and Chicken Dung
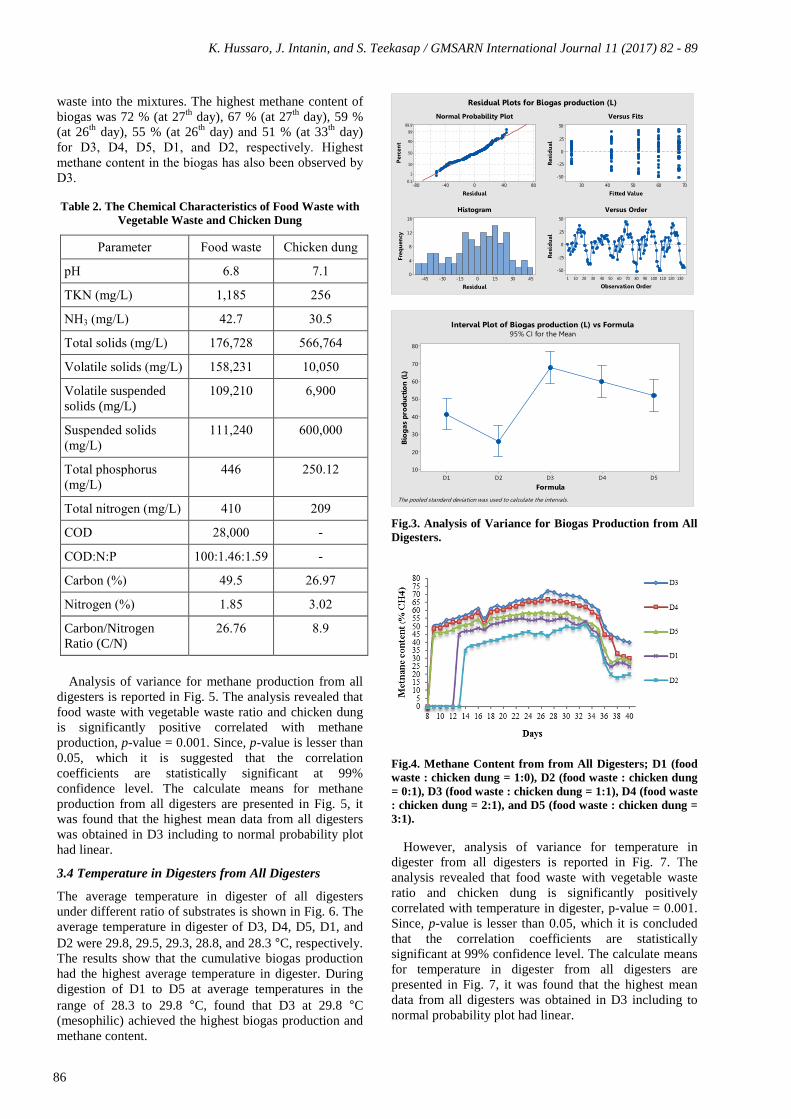
All the successful digesters showed the similar trends in daily methane contents, which is shown in Fig.4. It was found that the same methane production as for co-digestion (D3 to D5) was obtained in 9 days of digestion. However, methane production as for mono digestion (D1 and D2) went on at almost the same as that of 14 days. Furthermore, the quality of the generated biogas was also improved with the addition food waste with vegetable
K. Hussaro, J. Intanin, and S. Teekasap / GMSARN International Journal 11 (2017) 82 - 89
86
waste into the mixtures. The highest methane content of biogas was 72 % (at 27th day), 67 % (at 27th day), 59 % (at 26th day), 55 % (at 26th day) and 51 % (at 33th day) for D3, D4, D5, D1, and D2, respectively. Highest
methane content in the biogas has also been observed by
D3. Table 2. The Chemical Characteristics of Food Waste with
Vegetable Waste and Chicken Dung
Analysis of variance for methane production from all digesters is reported in Fig. 5. The analysis revealed that food waste with vegetable waste ratio and chicken dung is significantly positive correlated with methane production, p-value = 0.001. Since, p-value is lesser than 0.05, which it is suggested that the correlation coefficients are statistically significant at 99% confidence level. The calculate means for methane production from all digesters are presented in Fig. 5, it was found that the highest mean data from all digesters was obtained in D3 including to normal probability plot had linear.
3.4 Temperature in Digesters from All Digesters
The average temperature in digester of all digesters under different ratio of substrates is shown in Fig. 6. The average temperature in digester of D3, D4, D5, D1, and D2 were 29.8, 29.5, 29.3, 28.8, and 28.3 °C, respectively. The results show that the cumulative biogas production had the highest average temperature in digester. During digestion of D1 to D5 at average temperatures in the range of 28.3 to 29.8 °C, found that D3 at 29.8 °C (mesophilic) achieved the highest biogas production and methane content.
Fig.3. Analysis of Variance for Biogas Production from All Digesters.
Fig.4. Methane Content from from All Digesters; D1 (food waste : chicken dung = 1:0), D2 (food waste : chicken dung = 0:1), D3 (food waste : chicken dung = 1:1), D4 (food waste : chicken dung = 2:1), and D5 (food waste : chicken dung = 3:1).
However, analysis of variance for temperature in
digester from all digesters is reported in Fig. 7. The analysis revealed that food waste with vegetable waste ratio and chicken dung is significantly positively correlated with temperature in digester, p-value = 0.001. Since, p-value is lesser than 0.05, which it is concluded that the correlation coefficients are statistically significant at 99% confidence level. The calculate means for temperature in digester from all digesters are presented in Fig. 7, it was found that the highest mean data from all digesters was obtained in D3 including to normal probability plot had linear.
80400-40-80
99.9
99
90
50
10
1
0.1
Residual
Perc
en
t
7060504030
50
25
0
-25
-50
Fitted Value
Re
sid
ua
l
4530150-15-30-45
16
12
8
4
0
Residual
Fre
qu
en
cy
1301201101009080706050403020101
50
25
0
-25
-50
Observation Order
Re
sid
ual
Normal Probability Plot Versus Fits
Histogram Versus Order
Residual Plots for Biogas production (L)
D5D4D3D2D1
80
70
60
50
40
30
20
10
Formula
Bio
ga
s p
rod
ucti
on
(L)
Interval Plot of Biogas production (L) vs Formula95% CI for the Mean
The pooled standard deviation was used to calculate the intervals.
Parameter Food waste Chicken dung
pH 6.8 7.1
TKN (mg/L) 1,185 256
NH3 (mg/L) 42.7 30.5
Total solids (mg/L) 176,728 566,764
Volatile solids (mg/L) 158,231 10,050
Volatile suspended solids (mg/L)
109,210 6,900
Suspended solids
(mg/L) 111,240 600,000
Total phosphorus
(mg/L) 446 250.12
Total nitrogen (mg/L) 410 209
COD 28,000 -
COD:N:P 100:1.46:1.59 -
Carbon (%) 49.5 26.97
Nitrogen (%) 1.85 3.02
Carbon/Nitrogen Ratio (C/N)
26.76 8.9

K. Hussaro, J. Intanin, and S. Teekasap / GMSARN International Journal 11 (2017) 82 - 89
87
Fig.5. Analysis of Variance for Methane Production from All Digesters.
Fig.6. Temperature in Digester from All Digesters; D1 (food waste: chicken dung = 1:0), D2 (food waste: chicken dung = 0:1), D3 (food waste: chicken dung = 1:1), D4 (food waste: chicken dung = 2:1), and D5 (food waste: chicken dung = 3:1).
3.5 pH Value from All Digesters
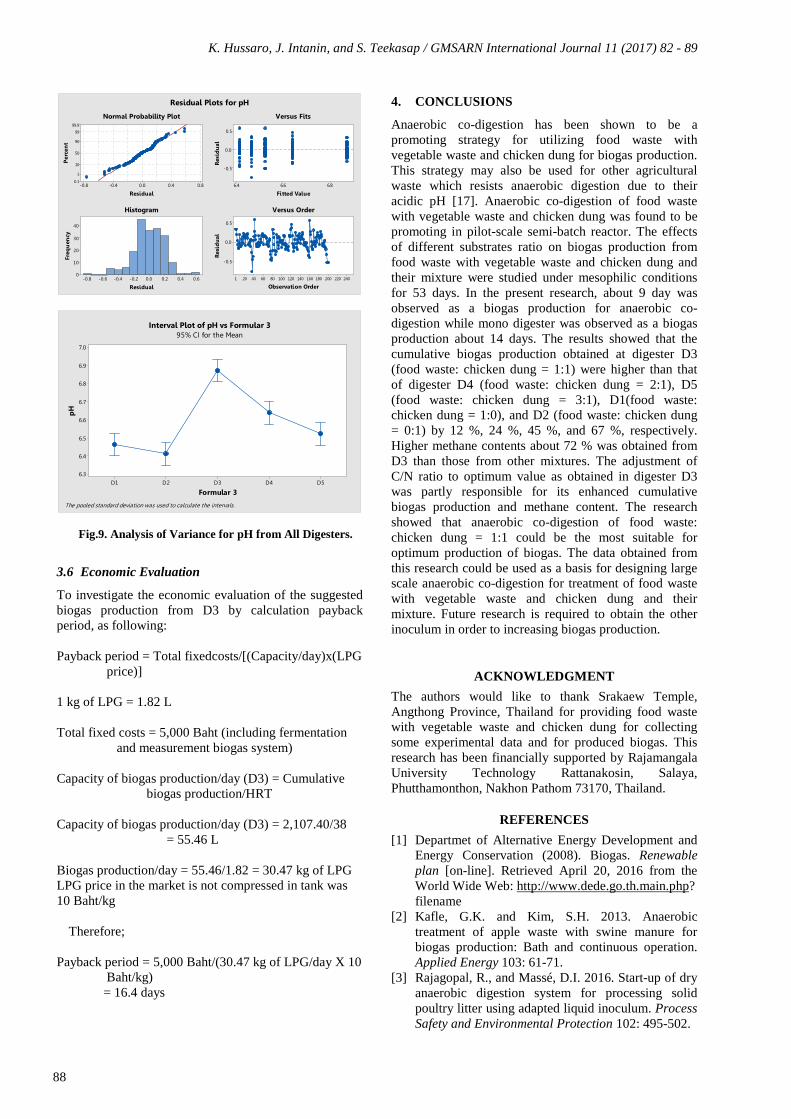
The pH profiles of all digesters in this research are shown in Fig. 8. It was found that the pH value from D3, D4, D5, D1, and D2 was obtained and average of 6.87, 6.64, 6.52, 6.42, and 6.36, respectively. The pH value of D3 to D5 was well near 7.0 throughout the investigation. The pH value which was suitable for anaerobic digestion
is range 6.5 to 8.0. If the pH value of the substrate is either lower than 6.0 or greater than 8.0, methanogens will be inhibited and volatile fatty acids will be accumulated. However, analysis of variance for pH value from all digesters is reported in Fig. 9. The analysis revealed that food waste with vegetable waste ratio and chicken dung is significantly positively correlated with pH value, p-value = 0.001. Since, p-value is lesser than 0.05, which is concluded that the correlation coefficients are statistically significant at 99% confidence level. The calculate means for pH value from all digesters are presented in Fig. 9, it was found that the highest mean data from all digesters was obtained in D3 including to normal probability plot had linear.
Fig.7. Analysis of Variance for Temperature in Digester from All Digester.
Fig.8. pH Value from All Digesters; D1 (food waste: chicken dung = 1:0), D2 (food waste: chicken dung = 0:1), D3 (food waste: chicken dung = 1:1), D4 (food waste: chicken dung = 2:1), and D5 (food waste: chicken dung = 3:1).
30150-15-30
99.9
99
90
50
10
1
0.1
Residual
Perc
en
t
6055504540
20
10
0
-10
-20
Fitted Value
Resi
du
al
15.07.50.0-7.5-15.0-22.5
30
20
10
0
Residual
Fre
qu
en
cy
150
140
130
120
110
1009080706050403020101
20
10
0
-10
-20
Observation Order
Resi
du
al
Normal Probability Plot Versus Fits
Histogram Versus Order
Residual Plots for % CH4
D5D4D3D2D1
65
60
55
50
45
40
Formula_1
% C
H4
Interval Plot of % CH4 vs Formula_195% CI for the Mean
The pooled standard deviation was used to calculate the intervals.
420-2-4
99.9
99
90
50
10
1
0.1
Residual
Pe
rce
nt
30.029.529.028.5
3.0
1.5
0.0
-1.5
-3.0
Fitted Value
Re
sid
ua
l
2.251.500.750.00-0.75-1.50-2.25
30
20
10
0
Residual
Fre
qu
en
cy
240220200180160140120100806040201
3.0
1.5
0.0
-1.5
-3.0
Observation Order
Re
sid
ua
l
Normal Probability Plot Versus Fits
Histogram Versus Order
Residual Plots for Temp
D5D4D3D2D1
30.5
30.0
29.5
29.0
28.5
28.0
Formula 2
Te
mp
Interval Plot of Temp vs Formula 295% CI for the Mean
The pooled standard deviation was used to calculate the intervals.
K. Hussaro, J. Intanin, and S. Teekasap / GMSARN International Journal 11 (2017) 82 - 89
88
Fig.9. Analysis of Variance for pH from All Digesters.
3.6 Economic Evaluation
To investigate the economic evaluation of the suggested biogas production from D3 by calculation payback period, as following:
Payback period = Total fixedcosts/[(Capacity/day)x(LPG price)] 1 kg of LPG = 1.82 L Total fixed costs = 5,000 Baht (including fermentation and measurement biogas system) Capacity of biogas production/day (D3) = Cumulative biogas production/HRT Capacity of biogas production/day (D3) = 2,107.40/38 = 55.46 L Biogas production/day = 55.46/1.82 = 30.47 kg of LPG LPG price in the market is not compressed in tank was 10 Baht/kg
Therefore; Payback period = 5,000 Baht/(30.47 kg of LPG/day X 10 Baht/kg) = 16.4 days
4. CONCLUSIONS
Anaerobic co-digestion has been shown to be a promoting strategy for utilizing food waste with vegetable waste and chicken dung for biogas production. This strategy may also be used for other agricultural waste which resists anaerobic digestion due to their acidic pH [17]. Anaerobic co-digestion of food waste with vegetable waste and chicken dung was found to be promoting in pilot-scale semi-batch reactor. The effects of different substrates ratio on biogas production from food waste with vegetable waste and chicken dung and their mixture were studied under mesophilic conditions for 53 days. In the present research, about 9 day was observed as a biogas production for anaerobic co-digestion while mono digester was observed as a biogas production about 14 days. The results showed that the cumulative biogas production obtained at digester D3 (food waste: chicken dung = 1:1) were higher than that of digester D4 (food waste: chicken dung = 2:1), D5 (food waste: chicken dung = 3:1), D1(food waste: chicken dung = 1:0), and D2 (food waste: chicken dung = 0:1) by 12 %, 24 %, 45 %, and 67 %, respectively. Higher methane contents about 72 % was obtained from D3 than those from other mixtures. The adjustment of C/N ratio to optimum value as obtained in digester D3 was partly responsible for its enhanced cumulative biogas production and methane content. The research showed that anaerobic co-digestion of food waste: chicken dung = 1:1 could be the most suitable for optimum production of biogas. The data obtained from this research could be used as a basis for designing large scale anaerobic co-digestion for treatment of food waste with vegetable waste and chicken dung and their mixture. Future research is required to obtain the other inoculum in order to increasing biogas production.
ACKNOWLEDGMENT
The authors would like to thank Srakaew Temple, Angthong Province, Thailand for providing food waste with vegetable waste and chicken dung for collecting some experimental data and for produced biogas. This research has been financially supported by Rajamangala University Technology Rattanakosin, Salaya, Phutthamonthon, Nakhon Pathom 73170, Thailand.
REFERENCES
[1] Departmet of Alternative Energy Development and Energy Conservation (2008). Biogas. Renewable plan [on-line]. Retrieved April 20, 2016 from the World Wide Web: http://www.dede.go.th.main.php? filename
[2] Kafle, G.K. and Kim, S.H. 2013. Anaerobic treatment of apple waste with swine manure for biogas production: Bath and continuous operation. Applied Energy 103: 61-71.
[3] Rajagopal, R., and Massé, D.I. 2016. Start-up of dry anaerobic digestion system for processing solid poultry litter using adapted liquid inoculum. Process Safety and Environmental Protection 102: 495-502.
0.80.40.0-0.4-0.8
99.9
99
90
50
10
1
0.1
Residual
Pe
rce
nt
6.86.66.4
0.5
0.0
-0.5
Fitted Value
Resi
du
al
0.60.40.20.0-0.2-0.4-0.6-0.8
40
30
20
10
0
Residual
Fre
qu
en
cy
240220200180160140120100806040201
0.5
0.0
-0.5
Observation Order
Re
sid
ua
l
Normal Probability Plot Versus Fits
Histogram Versus Order
Residual Plots for pH
D5D4D3D2D1
7.0
6.9
6.8
6.7
6.6
6.5
6.4
6.3
Formular 3
pH
Interval Plot of pH vs Formular 395% CI for the Mean
The pooled standard deviation was used to calculate the intervals.

K. Hussaro, J. Intanin, and S. Teekasap / GMSARN International Journal 11 (2017) 82 - 89
89
[4] Ge, X., Xu, F. and Li, Y. 2016. Solid-state anaerobic digestion of lignocellulosic biomass: Recent progress and perspectives. Bioresource Technology 205: 239-249.
[5] Brown, D. and Li, Y. 2013. Solid state anaerobic co-digestion of yard waste and food waste for biogas production. Bioresource Technology 127: 275-280.
[6] Ming, W., Xianli, S., Pengfei, L., Lili, Y., Dan, L., Yingwei, Z., Wenzhe, L., and Guoxiang, Z. 2014. A novel alternate feeding mode for semi-continuous anaerobic co-digestion of food waste with chicken manure. Bioresource Technology 164: 309-314.
[7] Hussaro, K., Saitawee, L., Keanoi, N. and Teekasap, S. 2015. Optimizing experimental condition of biogas production from elephant manure and rice straw with chicken dung as inouulum in a mesophilic lab-scale. In Proceedings of GMSARN Inf. Conf. On Smart Energy, Environment, and Community Development in GMS. Phnom Penh, Cambodia, 16-18 December.
[8] Yang, L., Huang, Y., Zhao, M., Huang, Z., Miao, H., Xu, Z. and Ruan, W. 2015. Enhancing biogas generation performance from food wastes by high-solids thermophilic anaerobic digestion: Effect of pH adjustment. International Biodeterioration & Biodegradation 105: 153-159.
[9] Zhang, C., Su, H., Baeyens, J. and Tan, T. 2014. Reviewing the anaerobic digestion of food waste for
biogas production. Renewable Technology 129: 170-176.
[10] Zhang, C., Xiao, G., Peng, L., Su, H. and Tan, T. 2013. The anaerobic co-digestion of food waste and cattle manure. Bioresource Technology 129: 170-176.
[11] El-Mashad, H.M. and Zhang, R. 2010. Biogas production from co-digestion of dairy manure and food waste. Bioresource Technology 101: 4021-4028.
[12] American Public Health Association. 1999, American Water Works Association, Water Environment Federation.
[13] Maneechot, P., Yodwinyuwong. S., Ponlawat, P. and Tanongsak, K. 2015. A comparison of the biogas from manure and foodcraps. In Proceedings of 2nd national conference, Research KPRU, Kamphaeng Phet Rajabhat University, Thailand, 22 Demcember.
[14] Panyapeng, J. and Intanoo, P. 2016. Biogas production from food waste by using continuous stirred tank reactor (CSTR) system. In Proceedings RSU National Research Conference. Rangsit University, Thailand, 29 April.
[15] Saitawee, L., Hussaro, K., Teekasap, S. and Cheamsawat, C. 2014. Design biogas production from mixed napier pak chong I/food waste at thermophilic temperature by anaerobic digestion in cow dung and chicken dung. Journal of Energy and Power Engimeering 8: 890-895.
[16] Zhang, C., Xiao, G., Peng, L., Su, H. and Tianwei. 2013. The anaerobic co-digestion of food waste and cattle manure. Bioresource Technology 129: 170-176.
[17] Panyadee, S., Petiraksakul, A. and Phalakornkule, C. 2013. Biogas production from co-digestion of phyllanthus emblica residues and food waste. Energy for Sustainable Development 17: 515-520.